
International Research Journal of Engineering and Technology (IRJET) e-ISSN: 2395-0056
Volume: 13 Issue: 04 | Apr 2026 www.irjet.net p-ISSN: 2395-0072

International Research Journal of Engineering and Technology (IRJET) e-ISSN: 2395-0056
Volume: 13 Issue: 04 | Apr 2026 www.irjet.net p-ISSN: 2395-0072
Harsh Hemantkumar Patel
Abstract Recent advances in generative adversarial networks (GANs) have unlocked new frontiers in unsupervised visual content synthesis. In this work, we introduce ”Adversarial Rendering,” a groundbreaking framework that integrates multi- scale feature extraction with adaptive loss functions to generate high-fidelity, semantically coherent images across diverse visual domains. By incorporating novel architectural innovations and self-supervised training strategies, our approach effectively captures intricate textures and complex structures without relying on paired datasets. Extensive evaluations on benchmark image synthesis and style transfer tasks demonstrate that our method surpasses state-of-the-art models in both visual realism and quantitative performance metrics. Beyond image generation, we illustrate the framework’s versatility in applications such as data augmentation and cross-domain translation, highlighting its potential to drive advancements in multimedia content creation and computer vision research.
Accurate and high-resolution climate data at local scalesiscrucialforsupportingsociety’sadaptationstrategiestorapidly changingclimateconditions.WhileEarthSystemModels(ESMs)providesomeofthemostadvancedclimateprojectionsona globalscale,theirspatialresolutionisoftentoocoarseforregionalorlocaldecision-makingneeds.Thiscreatesademandfor downscaling techniques, which transform the large-scale, low-resolution outputs of global climate mod ells into finer-scale climate information that is more relevant for local applications. High-resolution climate data across both space and time is essential fora widerangeofpractical uses,includingdetailedmodelingof extreme weather eventslikefloods, wildfires,and storms, as well as for guiding infrastructure true development and ecological management decisions such as selecting appropriate tree species in changing environments. However, creating accurate downscaled datasets is often challenged by limited computational resources, which constrain the complexity and resolution achievable in practice. To be most useful, downscaling methods should balance computational efficiency, adaptabilityacrossdiverseclimaticregions,andthe ability to represent extreme events effectively. This last point emphasizes the importance of generating multiple downscaled climate realizations orensembles thatcapturethefullvariabilityofweatherandclimatescenarios.
Downscaling methodsforconvertingcoarse-resolution cli- matemodel outputstofiner regional scalestypically fall intotwo broad categories: dynamical downscaling and statistical downscaling Dynamical downscaling involves running a highresolution regional climate model that physically simulates atmospheric processes over a limited area, using boundary conditions derived from the larger-scale, low-resolution Earth System Model output. This approach explicitly resolves local meteorological dynamics, allowing it to capture fine-scale spatial features and physical processes that global models cannot represent due to their coarse grids. In contrast, statistical downscaling relies on identifying and applying empirical relationships between large-scale climate variables and local climate features. These relationships can be derived using various statistical tools, including regression models, interpolation techniques, cluster analyses, lapse rate adjustments, and geostatisticalmethodssuchasGaussianprocessesorkriging.Eachapproachhasdistinctadvantagesandlimitationsrelatedto accuracy,computationalcost,andflexibility.
Among these two, dynamical downscaling is often re guarded as more physically robust because it directly simulates atmospheric physics and can better represent complex spatial patterns such as mountain-induced rain shadows or elevation-dependent temperature changes. Regional climate models (RCMs), which have been developed and refined over several decades, typically operate at resolutions between 20to 40 kilometers and are frequently employed to downscale ESM outputs or reanalysis data to this intermediate spatial scale. For many practical applications particularly those requiring detailed local climate information it is desirable to move to even higher resolutions. Convection-permitting models (CPMs), which operate at resolutions between 1 to 4kilometers, offertheability toexplicitly simulateconvective weather phenomena like thunderstorms, providing much more realistic weather representations. However, the very high computationaldemandsofCPMslimittheirusein extensiveclimatechangeprojectionsoroperationalforecasting,especially
International Research Journal of Engineering and Technology (IRJET) e-ISSN: 2395-0056
Volume: 13 Issue: 04 | Apr 2026 www.irjet.net
p-ISSN: 2395-0072
when multiple model runs are required to assess uncertainty. Statistical downscaling is generally much more computa tionally efficient than dynamical downscaling, but can have limited capacity to downscale variables with complex dependence structures. Also, traditional statistical downscaling usually requires observations to calibrate models properly. Over the past few years, deep learning has been introduced as a new statistical downscaling strategy which can potentially capitalize on the benefits of both traditional statistical and dynamical downscaling. Specifically, deep neural networks can be trained on HR output from dynamic downscaling, and the network learns to “emulate” the dynamic downscaling,givenasuiteofLRclimateinformation.Thispaperfocuses onstochasticensembledownscaling,wherethedeep learningmodel attempts to learn the conditional distribution of theHRfields,andthensamplerealisationsfromthose.In this framework, the LR climate input are then the conditioning fields, since they condition the distribution that the model attemptstolearn. Sofar,deep-learning methodshavedemonstratedpotentialforcreatingdownscalingsofsimilarqualityto dynamic methods, but with the efficiency of standard statistical methods The deeplearning downscaling we present in this paperattemptstoemulatetheresultsofconvectionpermittingmodels,downscalingtohighspatialresolutionathourlytime steps.
Mostoftherecentresearchingenerativedeep learningbaseddownscalinghasemployedconditionalGenerativeAdversarial Networks(GANs).GANs,firstintroducedby[1]andadaptedintoaconditionalversionby [2],containtwodeepconvolutional networks, the Generator and the Critic. During training, these networks compete; the Generator tries to fool the Critic by producing output similar to the training data, and the Critic tries to distinguish between real and generated samples. Theoretically,theGANwilllearntosamplefrom theconditionaldistributionoftheHRvariables,conditionedontheLRfields. [3]DevelopedaGANframeworkwhichproducedaccuratedownscalingofwindcomponents.Recentworkby[4]adaptedthis framework to befullystochastic,allowingtheGAN to samplemultiple realizations from the learnedconditionaldistribution. Their study showed that when applied to downscaling wind components, the stochastic GAN was well calibrated and was betteratpredictingextremes.Thiscurrentworkusesthebasicnetworkarchitecturedevelopedby[3] and then adapted to be fully stochastic in [4].
WhilesubstantialresearchhasinvestigatedGANdownscaling,theremultiplequestionsthatshouldstillbeaddressedpriorto use in an operational setting. First, most studies to date have focused on downscaling single variables. Many studies [5]–[7] have focused on precipitation, and while [3] and [4] employed multivariate GANs, they focused solely on downscaling wind components. However, operational down- scaling is often required to provide a suite of variables. Temperature, humidity, precipitation,andwindareessentialvariablesforabroadrangeofapplicationsincludingfireweather,hydrology,ecology,and urbanplanning.WhilethestochasticGANdevelopedin[4]producedaccuratedown-scalingofwindcomponents,itsabilityto extend to other variables has not previously been assessed. Multiple studies [5], [6] have shown that GANs can struggle to captureextremeprecipitationevents,ataskwhichiscrucialforadaptationplanning [4]foundthat theirstochasticGANwas better at capturing extremes in wind components than an equivalent deterministic model. Since many traditional statistical downscaling methods succeed for means, but struggle to capture extremes, it will be important to ascertain the extent to whichGANdownscalingcancaptureimportant extremes.
DownscalingofmultipleclimatevariablesinvitesthepossibilityofusingfullymultivariateGANs,wheremultiplevariablesare predicted from one model. Such an approach could improve dependence structures between variables, especially at small scales.Whilesomedependencebetweenvariables willbeinheritedfromtheLRconditioningfields,multivariatemodelsmay beabletocreatecorrectdependenceoffine-scalegeneratedfeatures,leadingtoimprovedconsistency.However,most studies so far have only used univariate GANs [5]– [7], and while [3] and [4] showed success with multivariate downscaling of wind components, it is uncertain what the costs and benefits of multivariate prediction might be when extended to more variables. Windcomponents areveryclosely physically linked with similar distributions and dependence structures, are are notaverychallengingmultivariatedown-scalingproblem.Fromanoperationalperspective,multivariateGANdownscalingis desirable,asitdecreasesthenumberofmodelsrequiringtraining.
Commonly, GANs used in downscaling research input all the conditioning information (i.e., covariates) at LR. While this is necessaryforvariablescomingfromLRmodels,there isoftenpertinentsurfaceinformation(suchastopography)availableat highresolution.Intuitively,providingsurfaceinformationatahigherresolutionshouldimprovetheperformanceofthemodel. However this hypothesis has not been systematically tested, and it requires adjusting the architecture of the Generator networkfromthatusingonlyLRcovariates.
International Research Journal of Engineering and Technology (IRJET) e-ISSN: 2395-0056
Volume: 13 Issue: 04 | Apr 2026 www.irjet.net p-ISSN: 2395-0072
[5]includedHRtopographyinformationbyfirstconvolving itdowntoLRandthenconcatenatingwiththeclimatevariables essentially trying to fit more information into the LR architecture.[4]Usedadifferentapproachwithtwoparallel Generator streamsforcovariatesofdifferentresolution.Itisimportanttoassesshowthesearchitecturalchangesimpacttheresults.
MoststudiesinvestigatingGANdownscalingusesmalldomainsforcomputationalreasons,andtheabilityofGANframeworks togeneralizeoverlargespatial reasonshasyettobeassessed.ApplyingGAN downscalingoverlargecontiguousareasposes manychallenges.Computationalconstraintsaside,itisunclearwhetherasingleGANframeworkcanoptimallydownscalethe idiosyncratic weather of disparate regions in a large study area, as most research to-date has developed and tested GAN frameworks in a single region. Showing that a GAN framework can generalize over space is a first step to developing modelscapableofdownscalinglargeregions.
ThiscurrentstudyaimstoaddressthesesomeofthesequestionsandinvestigatetheapplicabilityofstochasticGANs tofuture operationaldownscaling.Specifically,weapplythestochasticGANframeworkto temperature,humidity,precipitation,aswell asbothwindcomponents.Initialanalysesareconductedintheregionofcomplextopography(includeVancouverIsland, the Coast Mountains, and the Interior Plateau on the Pacific Northwest of North America) considered by [4]. We then investigate the advantages and disadvantages of univariate versus multivariate prediction. The paper then assesses the utilityofprovidingHR topographytotheGAN.Finally,wetesttheGAN framework onall fivevariablesina secondregionin NortheasternBritishColumbiaandAlberta (aregionwithrelativelyflattopography)andassessthespatialgeneralizabilityof theGANframework.
AllGenerativeAdversarialNetworks(GANs)presentedinthisstudyshareaconsistentfoundationalarchitecture.Ourtraining processutilizespaireddatasetsconsistingoflow-resolution(LR)conditioninginputs(covariates),statichighresolution(HR) surfacecharacteristics,andcorrespondinghigh-resolutiontargetfields.TheGANframeworkisdesignedtolearnafunctional mapping from the LR input covariates and surface features to the detailed HR output fields. To maintain uniformity across experiments, westandardizethespatial dimensionsandresolutions ofall data inputs andoutputs:thehigh-resolutionfields arerepresentedas128by128 pixel grids, which approximately correspond to anarea of270by450kilometers(or4◦ × 4◦ in latitudeandlongitude),whilethelow-resolutioninputsare16by16pixels,reflectinganeightfolddownscalingfactor.
AnaturaluseofGANsinadownscalingsettinginvolvestraining on paired HR regional weather model output andLRESM or reanalysis data. We follow this approach, using ERA5 reanalysis variables as the LR predictors, and a Western Canada WeatherResearchandForecasting(WRF)modeloutput [8] as the paired HR training data. The WRF modelisastateofthe artnumericalweathermodel,designedforconvection-permittingscale(3-4km)forecasts.Thisspecific WRFrunwasdriven byERA-interim,coversallofBritishColumbia,andhasa4kmgrid-sizeresolution.WeusedERA5asthepairedLRdatasinceit provided all the covariates we planned to use, whereas ERA-interim only provided a subset of them. Although there will be some differences between ERA5 and ERA-Iterim, they represent the same realization of the climate system so it is reasonable to use ERA5 as the paired LR dataset. However, it is important to note that in this downscaling scenario, where HR and LR data each come from separate models, there will be large-scale biases between the WRF output and the ERA5conditioningfields.TheWRFmodelgeneratesinternalvariability,whichwillalsocause differences between models on common scales. Thus,asuccessfulGANmustlearntobiascorrect,downscale,andaccommodateinternalvariability.
Unless otherwise noted, the GANs we consider use a suite of seven LR covariates: temperature (2m), specific humidity (2m), precipitation, wind components (10m), convective available potential energy (CAPE) and surface pressure. We also include HR topography as an invariant field. For the majority of our analyses, we consider a rectangular region in Southwestern BC, Canada (49◦ to 53◦ N, 122◦ to 126◦ W; henceforth called the Southwest region), as its high degree of topographic complexity represents a realistically challenging downscaling scenario (figure 1). [4] tested stochastic GANs for downscaling wind components in this region; we extend the analysis to downscale temperature, specific humidity, and precipitation. As is common in deep learning we standardize all variables to mean zero and unit standard deviation prior to training.
International Research Journal of Engineering and Technology (IRJET) e-ISSN: 2395-0056
Volume: 13 Issue: 04 | Apr 2026 www.irjet.net
p-ISSN: 2395-0072
To investigate the applicability of this GAN framework to different regions, we also investigate a second region in the northeast of BC and the northwest of Alberta (the Northeast region), which in contrast to the Southwest region has flat topographyandisinfluencedbydifferentweatherprocesses.Wealsoinvestigateusingalanduseindex,whichincludeswater bodiesandforesttypes,asasecondHRinvariantfield.
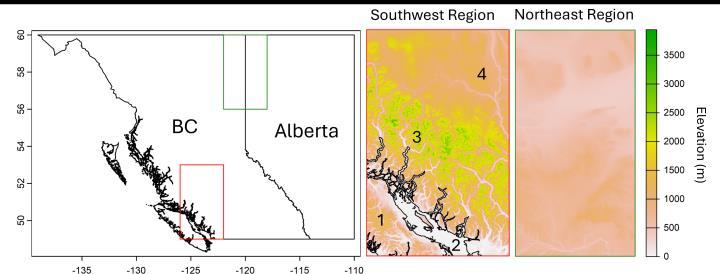
Fig.1. Mapsofstudyareas, showing(fromlefttoright) studyarea locations relativetoBritish Columbia andAlberta,and topographicreliefofboth regions.1=VancouverIsland,2=GeorgiaStraight,3=CoastMountains, and4=InteriorPlateau.
In the initial GAN formulation, the Critic network estimates the probability of a sample being from the training set; the Generatorattemptstomakeitmorechallengingtodistinguishtraining samples, while the Critic tries to improve its ability at discriminating. This approach often led to instability during training, as it requires that both networks learn at approximatelythesamerateandcanleadtovanishinggradients. [9] Addressed this challenge with the introduction ofthe Wasserstein GAN, where the Critic estimates the Wasser stein distance between the generated and training samples. Intuitively,theWassersteindistancerepresentstheamountofmassrequiredtotransformonedistributiontoanother,andis a distance metric between the distributions. In our case, the Wasserstein distance estimates the distance between the high dimensionaldistributionsofthetrainingdataandthegenerated output. During training, the Generator attempts to minimize the Wasserstein distance between the generated fields and the training data, thus increasing the distributional similarity betweenthem.Followingrecentliteratureindownscalingandcomputervision(refsxxx),weadoptthisapproach.
OneappealingaspectofGANscomparedtomorestandardConvolutionalNeuralNetworks,especiallyforclimatedownscaling, is that they do not solely rely on a pixel- wise error metric as the loss function. Downscaling is an underdetermined problem,meaningthatthereisadistributionon HR fields consistent with a single set of LR conditioningfields.Thus,while we require convergence in large-scale structure between the downscaled results and the LR conditioning fields, we should acceptslightdifferencesinfine-scalestructurebetweenthegeneratedoutputandthetrainingdata. Usingapixelwisemetric suchasmeanabsoluteerrorcanoverlyconstrainmodelsbyforcingthemtomatchthetrainingdatatooclosely,aphenomenon known as the double penalty problem. In such cases, the model will often converge on the conditional median, producing blurryoutput.Incontrast,theadversariallosscalculatedbytheGAN’sCriticnetwork(inourcase,theWassersteindistance)is notapixelwisemetric,andaimsforconvergenceindistribution,whichisadesirableproperty.However,[10]showedthatonly usingtheadversariallossintheGeneratortrainingprocedureoftenleadstounstabletrainingandpoorconvergenceoflargescale structures. They suggested adding a pixel-wise loss back in as the content-loss, torewardconvergenceinrealizationat large-scales.Wefollowthisapproach,andourGeneratorlossfunctioniscomposedofboththeadversarialloss,andapixelwise contentloss.Amoredetaileddiscussedofthisissueispresentedin[3].
ThisstudyusesthestochasticGANarchitecturedevelopedby[4],whichwasbasedonthedeterministicGANdescribedin[3]. The architecture makes extensive use of convolutional layers, which are designed to extract representative features from images[11].IntheGeneratornetwork,weuseResidualinResidualDenseBlocks(RRDB),whichcontainstackedconvolutional layers followed by leaky rectified linear units to add non-linearity. For upsampling, we use three pixel- shuffle blocks [12]. Following[4],weinjectGaussiannoisefieldsintotheconvolutionalfiltersinsideeachRRDB.WealsoincludeaHRinputstream toallowinclusionofHRcovariates,suchastopography.ThisstreamusesthesamestructureofRRDBasthatoftheLRinputs, butskipstheupsampling step.OncetheupsamplinghasoccurredontheLRstream,allinputshavethesamedimension,and
International Research Journal of Engineering and Technology (IRJET) e-ISSN: 2395-0056
Volume: 13 Issue: 04 | Apr 2026 www.irjet.net
p-ISSN: 2395-0072
areconcatenated.WealsoincludeallcovariatesasinputstotheCriticnetwork,usingaLRinputstreamfortheLRcovariates. Intuitively,includingtheconditioninginformationshouldallowtheCritictobetterestimatetheconditionaldistributions.
Unlessotherwisespecified,allmodelspresentedinthisstudyusethebestmodelfrom [4],withstochasticsamplingandCRPS as a content loss. Stochastic sampling, adapted from [5] creates multiple realizations of each training sample, and computes the content loss across these realizations. CRPS is a probabilistic measure, which aims for convergence in pixel wise distributions. As our aim is to sample from the HR conditional distributions, it is natural to use a probabilistic metric. Since stochastic sampling and the CRPS content loss are only applicable in a stochastic setting, when using a deterministic Generator,weemployedstandardtrainingwithMAEasacontentloss,asin[3].
We trained individual models for each of temperature, specific humidity, and precipitation using the framework de- scribed above. We used two years of hourly data as a trainingset(2003and2006),andoneyearasanout-of-sampletestset(2005). Initialtestsshowedthatmodelresultsdidnotimprovesubstantiallyusingmorethantwoyearsoftrainingdata,so wechose thissizeforcomputationalefficiency.Modelsweretraineduntilmetricsonthetestdatasetstabilised(≤ 250epochs).Wethen savedtheGeneratorfromthefinalepoch foranalysis.Multivariatemodelsforpredictingallvariablesweretrainedinasimilar way,withtheHRtrainingdatacreatedbystackingtheindividualvariablesasseparatechannels.Wetrainedall modelsonan NVIDIARTX4090GPU;modelstookonaverage48hourstotrain[4]foundthatthestochasticGANwasbetterabletocapture wind component extremes (i.e., the tails of the distribution) than the determinstic GAN. A common challenge with precipitationdownscaling is underestimationofhigh-precipitation events [13]. We thus created a deterministic GAN similar to thatconsideredin[4]byremovingthenoiseinjectionfromtheconvolutionallayersintheGeneratorandusingmeanabsolute errorasthecontentlossmetric.
To test the importance of including HR topography asaninputtothenetwork,wetrainedmodelsusinga)HRtopography, b)LRtopographyinterpolatedtotheHRgrid,andc)LRtopography.TheLRinterpolatedtopographyexperimentwas done as a control for network architecture we kepttheGeneratorarchitectureidentical,butfedthenetworkLRinformation.Tocreate theLRtopographymodel,weadjustedtheGeneratornetworkbyincludinganupsamplingblockinthetopographystream.We chosethisstrategytokeepthenetworkarchitectureasconsistentaspossiblebetweenexperiments.Wekeptallotherfeatures consistent.
Qualityassessmentinimagegenerationproblemsoftenposesachallenge,becausetherearemultiple,oftencompeting,metrics thatcouldbeused.Commonlyusedmetricsassesspixel wiseerrorofrealizations,andwhiletheseareuseful,theycanoverly penalise underdetermine downscaling results due to the double penalty problem. Thus, it is generally better to compare statistics between the generated fields and truth fields from the test set, instead of comparing individual realizations. Pixel wisecomparisonsofstatisticsanddistributions(e.g.,mediansandquantiles)arethesimplestexamplesofsuchcomparisons. However, these metrics on their own do not tell a complete picture. It is often important to know how well spatial structuresofdifferentscales(i.e.,textures)matchbetween the generated and truth fields. For this task, weusedaRadially AveragedSpectralPowermetric(RASP),whichcalculatesthe2Dspectralpowerateachwavenumber,averagespoweroverall anglesfromthecentreofwavenumberzero,andstandardisesthepowerateachwavenumbertothecorrespondingpowerin thetruthfield.RASPvaluesgreaterthanonethenrepresenttoomuchspatialvarianceatthegivenscale,whilevalueslessthan onerepresenttoolittle.
International Research Journal of Engineering and Technology (IRJET) e-ISSN: 2395-0056
Volume: 13 Issue: 04 | Apr 2026 www.irjet.net

p-ISSN: 2395-0072
Themetricsdescribedaboveinvestigatethequalityofthefulldistribution P (HR). Especially withastochastic GAN, itis also important to investigate the conditional distribution, P (HR|LR). These two distributions are related through hdistributionsofpixel-valuesbymonth,thePDFofgeneratedvaluescloselymatchedthedistributionofWRFvalues,forboth JanuaryandJuly,althoughshowedaslightdifferenceinJanuary. Maps of pixel-wise quantile differences show goo (1)

calibrationforthemedianand0.99quantiles,butmorebiasin0.01quantiles.Forthe0.01quantile,theGANunderestimated values in the mountains and ocean, and overestimated value.
Totestthestochasticcalibrationoftheconditionaldistributionofgeneratedfields,weusedCDFsofrankhistogramscalculated over one year of samples . As it is not usually possible to access multiple realisation of the same truth field, an ensemble of stochastic realisations have to be compared to a single truth field. For a properly calibrated model, the truth field should be indistinguishablefromanyofthegeneratedrealisations,andthusthedistributionofranksofthetruthvalueintheensemble values should be uniform. For ease of modelcomparison,weplotted CDFsoftherankhistograms,to avoid the sensitivity of histogram bin width. To investigate the stochastic calibration of individual conditonal distributions, we also present rank histogrammaps,whereeachpixelrepresenttherankofthetruthfieldoutoftheensembleofgeneratedvaluesforthatpixel.in the plateau region northeast of the coast mountains, withbiasesuptoabout3K.
Inthissection,wefirstinvestigateextensionofGANdownscalingfromwind componentstothreeotherimportantvariables: temperature,humidity,andprecipitation.Ascorrectdependencebetweenvariablesisimportant,wethenconsidertheimpact ofmultivariateandunivariatedownscaling.Wethen present a sensitivity analyses, showing the importance of includingHR topography. Finally, we test spatial generalisability of this GAN framework, by training and testing on a new region in NortheasternBC.
In this section, we assess the accuracy of downscaling for temperature, humidity, and precipitation. For each variable, we chosetwohourlytimesteps,thatrepresentthe0.1and0.9quantile,averagedoverthefield(i.e.,acoldandawarmhour).We alsoshowpixel-wisestatisticsacrossalltimesteps,andcomparePDFsofpixelvaluesforJanuaryandJuly.
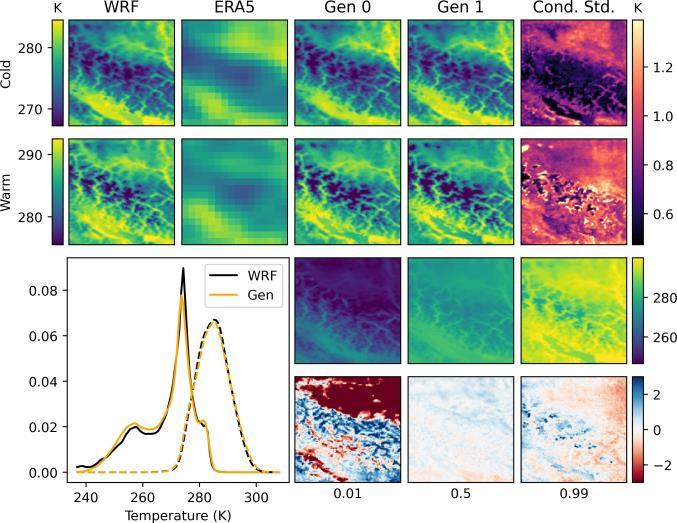
Temperature downscaling generally performed well, and succeeded in capturing HR details (figure 2). Consideration of HR realisationsfortherepresentativecoldhourshowedslightunderestimationofmostrealisationsintheStraightofGeorgiaand missed some fine-scale details in the Northeast corner. Realisations of the warm hour showed excellent agreement with the ground-truth, picking up stronger elevation gradients than the cold sample, especially in the Coast Mountains and the continental plateau in the Northeast. In these two samples, the model was successful at capturing the more stable temperatureoftheoceancomparedtothesurroundingland,aswellassharptransitionsbetweentheoceanandcontinent.Conditional standard deviation across stochastic ensemble members ranged from about 0.5 to 1.5 K, except for very low values in mountainsandtheGeorgiaStraightinthecoldsampleConsidering
International Research Journal of Engineering and Technology (IRJET) e-ISSN: 2395-0056
Volume: 13 Issue: 04 | Apr 2026 www.irjet.net
p-ISSN: 2395-0072
Fig. 2. Evaluation of univariate GAN downscaling of temperature for the Southwest study area. Top two rows show respectively an example cold andwarmsample,withtheWRFfield,LRconditioningfield(showingthe continentaloutline), twostochasticrealisations,andtheconditionalpixel wisestandarddeviationsacross100ensemblemembers.Thethirdrow shows 0.01, 0.5, and 0.9 quantiles over 3000 random samples from the generated fields, and the bottom row shows the corresponding quantile differences (truthgenerated). The left-bottom panel shows overall PDFs of pixel values for January samples(solid)andJulysamples(dashed).
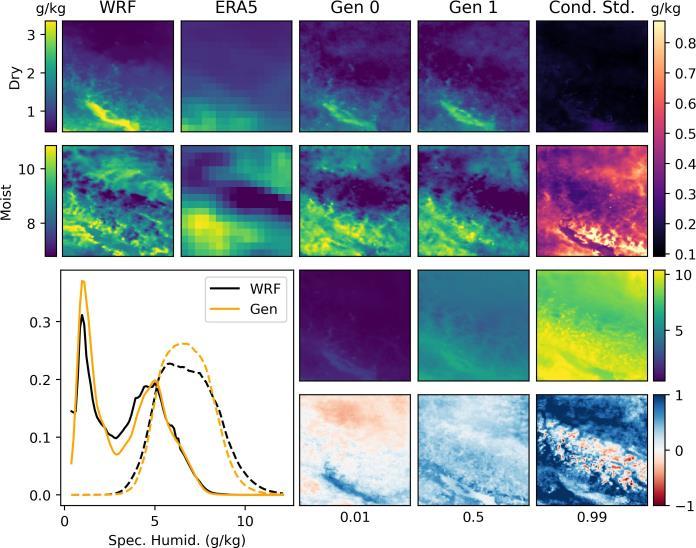
Specifichumidityprovedtobeamorechallengingvariabletoaccuratelydownscale(figure3).Inthedrysampleespecially,the modelsubstantiallyunderestimatedthehumidityovertheGeorgiaStraight,andwhileitdidpredicthigherhumidityatlower elevations(e.g.,overvalleys),thesewerenotasclearasintheWRFfields.Inthemoistsample,whilehumidityvaluesacross thefieldmatchedwellwithWRF,thespatialpatternsinthegeneratedfieldsweremoreblurredand sharpgradientswerenot as well represented. Most realizations of the moist sample showed a dry bias on the Eastern side of the field. Overall, the conditional standard deviation was much lower for the dry sample than the moist sample. The moist sample showed low deviationintheocean,butrelativelyhighvariabilityinthemountainsnearthecoast.DistributionsofpixelvaluesforJanuary andJulyshowedsubstantiallymorebiasthanwithtemperature,especiallyforJuly,wherethePDFofgeneratedvaluesshows underdispersion.
Pixelwise0.01quantilesshowthatthemodelsoverestimatedhumiditythroughmostofthefield,exceptintheStraitofGeorgia, wherehumiditywasalwaysunderestimated.Medianvaluesweresimilar,butshowedaslightunderestimationacrossthefield. For0.99quantiles(verymoist)themodelslargelyunderestimatedhumidity,exceptonthetopsofmountains.
International Research Journal of Engineering and Technology (IRJET) e-ISSN: 2395-0056
Volume: 13 Issue: 04 | Apr 2026 www.irjet.net
p-ISSN: 2395-0072
Fig. 3. Evaluation of univariate GAN downscaling of specific humidity for the Southwest study area. Top two rows show respectively an example dry and moist sample, with the WRF field, LR conditioning field (showing the continental outline), two stochastic realisations, and the conditional pixelwise standard deviations across 100 ensemble members. The third row shows 0.01, 0.5, and 0.9 quantiles over 3000 random samples from the generated fields, and the bottom row shows the corresponding quantile differences (truthgenerated). The left-bottom panel shows overall PDFs of pixel values for January samples(solid)andJulysamples(dashed).
The GAN also performed well at downscaling precipitation (figure 4). The light-rain-hour sample shows a large degree of variationbetweenrealisations,asisdesired.Theheavy rainsamplealsoshowshighconditionalstandarddeviation,although relativetothemean,notasmuchasthelightrainsample.Withprecipitationespecially,itisnoticeablethatsinglerealisations of the generated fields often show different patterns than the WRF field. However, as our goal is to sample from the distribution of possible downscalings, thisisexpected.
PixelvaluedistributionswereverysimilarinJanuaryandJuly,andwerecombined inthePDFforbettervisualinterpretation. GeneratedandWRFdistributionsmatchedwell,althoughtheGANslightly underestimatedextremeprecipitationevents.This underestimation of heavy precipitation is also apparent in the pixel wise quantile difference maps, which show good calibrationfor0.01quantilesandmedians,butpredominantlyunderestimationof0.99quantiles. We found that covariate choice was especially important for precipitation. Initial models, which only included LR precipitation, temperature, evaporation, and pressure produced fuzzy and biased downscaling. Addition of CAPE and wind componentssubstantiallyimprovedresults.
Stochastic GANs did a much better job of capturing extreme precipitation than equivalent deterministic models (figure 5). While both models slightly underestimated the probability
International Research Journal of Engineering and Technology (IRJET) e-ISSN: 2395-0056
Volume: 13 Issue: 04 | Apr 2026 www.irjet.net p-ISSN: 2395-0072
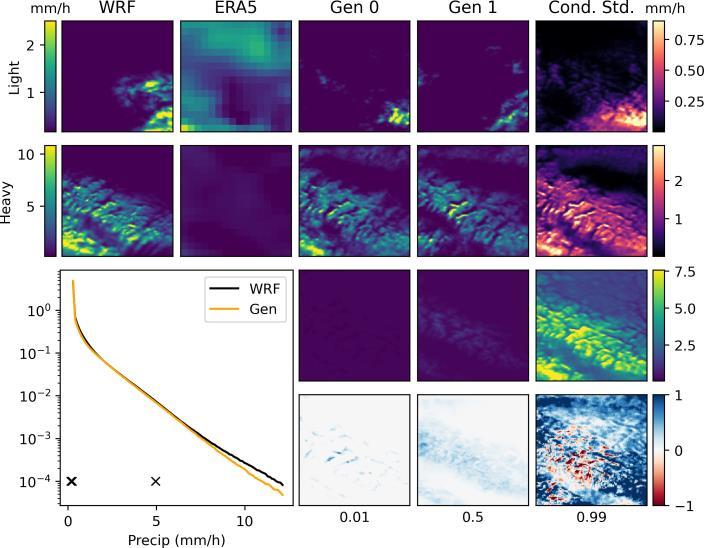
Fig. 4. Evaluation of univariate GAN downscaling of precipitation for the Southwest study area. Top two rows show respectively an example light rain and heavy rain sample, with the WRF field, LR conditioning field, two stochastic realisations,andtheconditionalpixel-wisestandarddeviations across100ensemblemembers.Thethirdrowshows0.01,0.5, and0.9 quantilesover3000randomsamplesfromthegeneratedfields,andthebottom rowshowsthecorrespondingquantile differences (truth - generated). The left- bottom panel shows overall PDFs of pixel values for months January to July combined.Crossesindicate thelocationof0.01,0.5,and 0.99quantiles.All timesteps thathadzeroprecipitationintheWRF fieldwereremovedpriorto analysis.
high precipitation compared to WRF, the stochastic model matched the distribution of the WRF data well, while the deterministicmodeldidnotpredictanyprecipitationvalues < 18mm/h.Bothmodelsshowalow-precipitationbiasforlight precipitation(< 2.5mm/h).Allthreevariablesshowedgood.
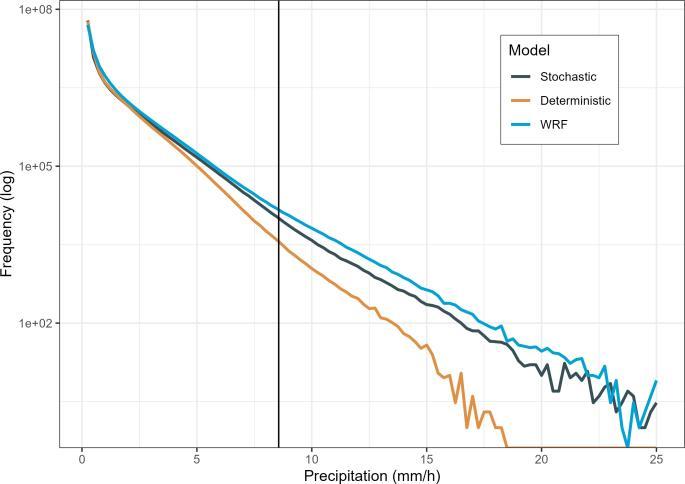
Fig. 5. Distributions of pixel values for precipitation fields, comparing WRF, deterministic generated, and stochastic generated. Distributions wereestimated from all pixels of one year of hourly samples. Note the y-axis is shown on a log scale.
International Research Journal of Engineering and Technology (IRJET)
Volume: 13 Issue: 04 | Apr 2026 www.irjet.net
e-ISSN: 2395-0056
p-ISSN: 2395-0072
stochasticcalibrationandsimilarspectralpowertoWRFfields(figure6).MedianRASPestimatesforgeneratedfieldsshowed more than 80% similarity to corresponding WRF estimates for temperature and humidity. Precipitation also showed good calibrationthroughmostofthefield,buthadahigh-powerbiasathighwavenumbers,correspondingtoan overabundanceof very fine-scale textures (figure 6). Precipitation also displayed much more variability between samples that temperature or humidity.Thisisexpected,asprecipitationfieldsvarymoreacrosssamplesthandotheothervariables.
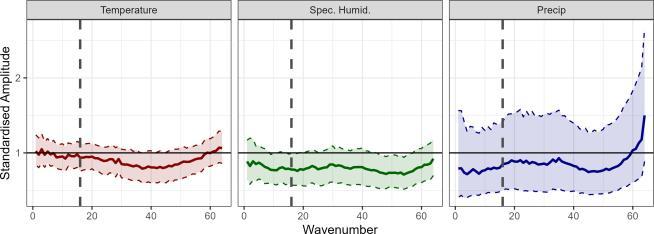
Fig.6. RASPmetricforthethreevariables.Spectralpowersarestandardised togroundtruthfields,andmetricsarecalculated across1200randomly selectedfields.Solidlinesshowmedianspectralpower,shadedregionshow inter-quartilerange.
Consideringcalibrationofconditionaldistributionsforindividualsamples,allvariablesshowedslightunder dispersion,with ranks concentrated at either end of the scale (figure 7a) instead of being uniformly distributed across possible ranks. Temperatureshowedgood calibrationforthemedianand0.99 quantilesample, butunderestimationover mostof the range for the 0.01 quantile sample. Specific humidity showed the most consistent under dispersion, especially in the 0.01 and mediansamples.Precipitationgenerallywasbettercalibrated,butshowedsomeunderestimationinhigh precipitationareas. Theseresultsalsomatchtherankhistogramacrosstimesteps;temperatureandhumiditybothshowedslightunderdispersion ofconditionaldistributions,andprecipitationshowedunder-estimationofhighvalues(figure7b).
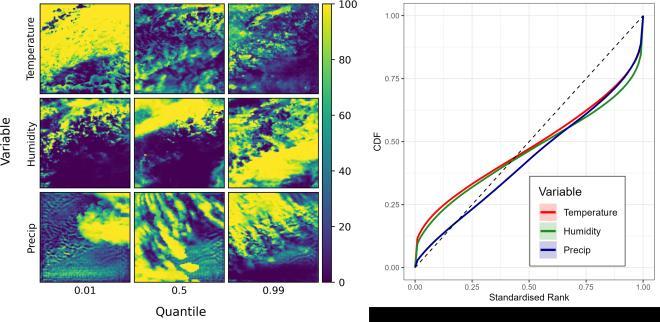
Fig. 7. a) Rank histogram maps for individual samples showing, for each pixel, the rank of the WRF pixel compared to an ensembleof100realisations.
b) CDF of rank histograms showing stochastic calibration of conditional distributions for univariate models of temperature, specifichumidity,and precipitation.Rankhistogramswerecalculatedacross100randomlyselected conditioningfields,with 100HRrealisationsofeach.Dashedlineshows referenceuniformCDF.
International Research Journal of Engineering and Technology (IRJET) e-ISSN: 2395-0056
Volume: 13 Issue: 04 | Apr 2026 www.irjet.net
p-ISSN: 2395-0072
MultivariateGANsshowedimproveddependencestructures between pairs of downscaled variables (table I). Particularly for temperature and humidity, variables from the univariate model had much lower mutual information scores than from the WRF variables, indicating less dependence between variables. Multivariate mutual information scores were mostly slightly lower but close to WRF scores. Temperature and precipitation was the only pair of variables where the multivariate model showedtoomuchdependence-i.e.,mutualinformationscoreswerehigherthanforthecorrespondingWRFvariables.
TABLE I MUTUAL INFORMATION SCORE BETWEEN PAIRS OF VARIABLES FOR MULTIVARIATE PREDICTION, UNIVARIATE PREDICTION, AND WRF. SCORES WERE CALCULATED FOR EACH OF 600 RANDOMLY SELECTED TIMESTEPS AND AVERAGED.
Variable 1 Variable2 Multivariate UnivariateWRF
Whilemeasureofdependencegenerallyimproved,marginal statistics forindividual variables were worse with the full multi variate model. For temperature, humidity, and precipitation, marginal statistics generated from the full multivariate model were blurrier thanthosefromunivariate models(figure 8).Humidity showed the most severe challenges, missing a lotof fine-scale details. Precipitation, while capturing the general patterns of the marginal statistics, did not capture the high precipitationvalueswiththemultivariatemodel.
To asses whether these challenges were due to the inclusion of precipitation, which has substantially different spatial dependence structures, we tested a multivariate model without precipitation. This model showed improved quality, but resulting downscalings were still blurrier than those from the univariate model. This was especially obvious for humidity, whichalsocontainedtracesoftheconvolutionalfilterinbothmultivariatemodels.
Power spectra of all variables showed more bias for multivariate models compared to univariate models, with the NoPrecip model in between (figure 9). Precipitation showed a substantial lowpower bias across most wavenumbers in the full multivariatemodel,oftencapturingonly25%ofexpectedpower.Humidityandtemperatureshowedlargehigh-powerbiases at high wavenumbers in both multivariate models, although toa lesserdegreeintheNo Precipmodel, corresponding to the blurrinessobservedinfigure8.Bothmultivariatemodelsalsoshowedaspikeinpoweratwavenumber32,correspondingto thesizeoftheconvolutional filters.Bothzonalandmeridionalwindcomponentsshowedlow-powerbiasesthroughoutmost wavenumbersinthefullmultivariatemodel,andhigh-powerbiasesathighwavenumbers.
TodeterminetheimportanceofincludingHRtopography as a covariate, we compared models with LR topography, inclusion of HR information.
International Research Journal of Engineering and Technology (IRJET) e-ISSN: 2395-0056
Volume: 13 Issue: 04 | Apr 2026 www.irjet.net p-ISSN: 2395-0072
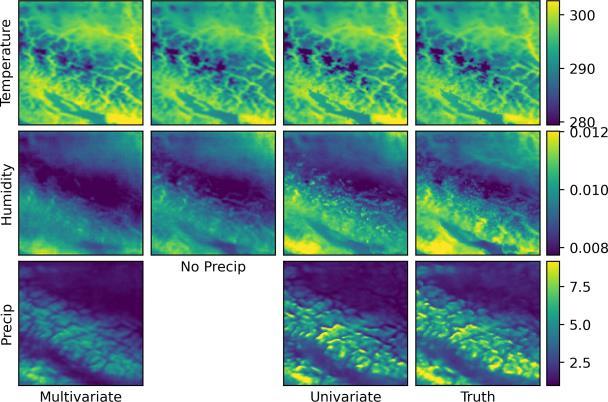
Fig.8. 0.99quantilesforgeneratedtemperature,specifichumidity,and precipitationfields,usingfullmultivariateprediction, multivariate prediction without precipitation, and univariate prediction. Quantiles were calculated using 3000 randomly selectedtimesteps.
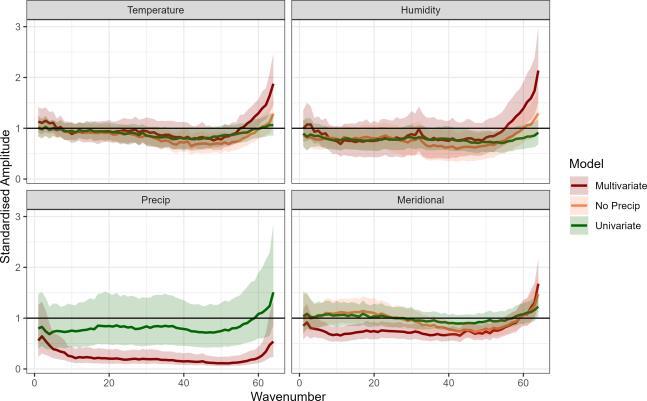
Fig.9. MedianandIQRRASPforprecipitation,specifichumidity,temperature,andmeridionalwindfields,usingmultivariate, no-precipitation,and univariatemodels.Spectral powersarestandardisedtogroundtruthfields, andmetricsarecalculated across1200randomlyselectedfields.
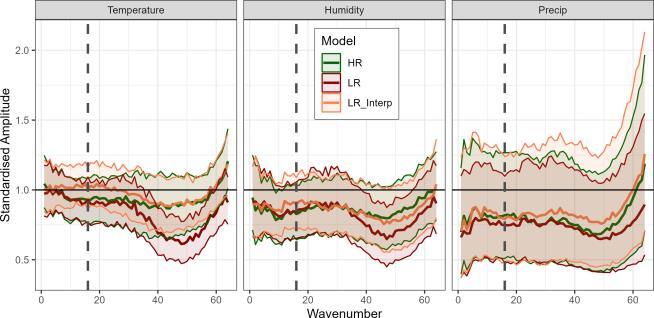
HRtopography,andLRtopographyinterpolatedtoHR.ConsideringvariabilityatspatialscalesusingaRASPfortemperature, humidityandprecipitationshowedthattheHRandtheinterpolatedtopographybothhadbettercalibrationofspectralpower than the corresponding LR topography model (figure 10). The LR topography model generally performed well a lower wavenumbers butshoweda low-power biasathigh wavenumbers, forall variables. Thislow-power biases wasmoresevere fortemperatureandhumidity;theLRmodelforprecipitationshowedafairlyconsistentlowpowerbiasacrosswavenumbers, and did not increase power at high wavenumbers as the HR models did. Interestingly, there was very little difference in spectral power between the HR model and the LR Interpolated model, suggesting that the architectural design of the network is more important than.
International Research Journal of Engineering and Technology (IRJET) e-ISSN: 2395-0056
Volume: 13 Issue: 04 | Apr 2026 www.irjet.net
p-ISSN: 2395-0072
Fig.10. MedianandIQRRASPfortemperature,humidity,andprecipitation usingHRtopography,interpolatedLRtopography, andLRtopography. Spectralpowersarestandardizedtogroundtruthfields,andmetricsarecalculatedacross1200randomly selectedfields.Dashedlineshowswavenumber correspondingtoLRgridsize.
Downscaling in the Northeast region was successful for certain variables, but showed more challenges than in the Coastal region (figure 11). Downscaling of wind components showed similar quality to the Coastal region, whereas generated temperature and humidity fields often showed sub spatial differences from WRF. This was especially apparent for humidity, where generated fields were overly smooth and lacked a lot of the fine scale details of WRF. Precipitation showedthemost challenges; generated fields often had entirely different structure than the WRF field. The fourth row in figure 11 shows a representative sample of precipitation, with the generated fields showing patchy, high intensity precipitation across the domain. Most variables showed a substantial difference in the largescale structure of the ERA5 field compared to the WRF field. This was especially apparent for precipitation; for the sample in figure 11, the WRF field shows low-intensity precipitation through much of the field, while the ERA5 field shows a concentrated areaofprecipitationnearthecenter.To determineifthismismatchbetweentheLRandHRfieldswasresponsibleforthepoordownscalingquality,wetrainedamodel where the LR precipitation field was created by coarsening the WRF field, resulting in zero bias in the large scale structure. This model produced substantially more accurate downscaling, with generated precipitation patterns closely matching the WRF field (fifth row of figure 11).Covariate choice was especially important in this region; we found that CAPE was an important covariate for all variables in this region, whereas in the coastal region, CAPE had only improved results for precipitation. Stochastic calibration of conditional distributions was worse for temperature, humidity and standard precipitationintheNortheastregionthanintheSouthwestregion(figure12).Temperatureandhumiditybothshowedunder dispersion,with
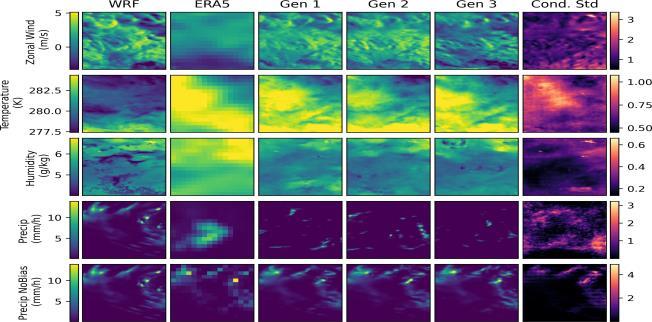
Fig. 11. Example realisations for the Northeastern region. Rows correspond to variables, and the bottom row shows a secondprecipitationmodelwithno biasbetweentheLRandHRtrainingdata.Columnsshow,fromlefttoright, WRF(i.e. groundtruth),ERA5(inputconditioningfield),threegenerated realisations,andtheconditionalstandarddeviationsacross 500realisationsmanytruesamplesfallingoutsidethegeneratedrange,andprecipitationshowedunderestimation,asmany
International Research Journal of Engineering and Technology (IRJET) e-ISSN: 2395-0056
Volume: 13 Issue: 04 | Apr 2026 www.irjet.net
p-ISSN: 2395-0072
true samples fell above the generated range. The unbiased precipitation model had much better calibration than the standard precipitation model, and was one of the best calibrated models overall. Wind components showed similar calibrationtotheCoastallocation. RASP metrics for variables in the Northeast region.
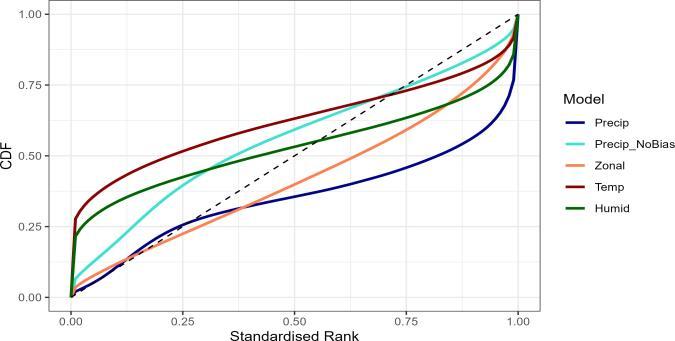
Fig.12. CDFsofrankhistogramsshowingstochasticcalibrationofmodels intheNortheasternregion.Rankhistogramswere calculated across 100 randomly selected conditioning fields, with 96 HR realisations of each. Dashed line shows reference uniformCDF.
showedsimilarmedianvaluesforhumidity,temperature,andwindcomparedtotheCoastalregion,buthadmuchlargerinterquantileranges,representingmorevariabilityintexturebiasbetweensamples(figure 13).Thestandardprecipitationmodel showed substantial low-power bias across scales, butespecially at low wavenumbers where power was less than 50% of correspondingWRFpower.Conversely,theunbiasedprecipitationmodelshowedgoodcalibrationovermostoftherange,and muchsmallerIQR.
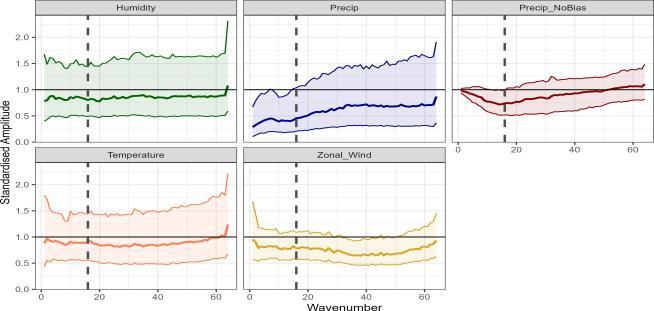
Fig. 13. RASP humidity, precipitation, temperature, and zonal wind in the Northeast region, showing median and inter quartile ranges. Spectral powers are standardized to ground truth fields, and metrics are calculated across 1200 randomly selectedfields.
IV.
ThispaperinvestigatespracticalconsiderationsofapplyingthestochasticGANframeworkfrom[4]torealisticdown-scaling applications. Specifically, we focus on extension of GANs to multiple climate variables, including the applicability of multivariate prediction, and generalizability to different locations. We show that the stochastic GAN framework can successfully downscale a suite of variables. We then find that while multivariate downscaling improves the dependence structures of downscaled variables, it tends to decrease the quality of individual down scalings. Finally, we show mixed successingeneralisingtotheNortheastregion:modelsfortemperature,humidity,andwindcomponentsproducedreasonable downscalings,butwerelessaccuratethanintheSouthwestregion.Precipitationmodelsstruggledinthisregion,likelydueto large-scalebiasesbetweentheLRandHRtrainingdata.
© 2026, IRJET | Impact Factor value: 8.315 | ISO 9001:2008 Certified Journal | Page1865
International Research Journal of Engineering and Technology (IRJET) e-ISSN: 2395-0056
Volume: 13 Issue: 04 | Apr 2026 www.irjet.net p-ISSN: 2395-0072
Overall,wefoundthatthestochasticGANsuccessfullydownscaledtemperature,specifichumidity,andprecipitation,although itwaslessaccuratewithhumiditythantheothervariables.Challengeswithdownscalinghumiditycouldbe duetoavarietyof reasons.First,WRFhumidityfieldsoftenshowedverysharp gradientsaroundvalleys,whichtheGANoften did not capture fully. It may also be that we did not include all important covariates; for example, it would be interesting to add temporalpressuregradientsasaLRcovariate.
Precipitationisanimportantvariable,andisoftenmorechallenging to downscale due to its unusual distribution. Weshow that the stochastic GAN performs well at downscaling precipitation, and is much better at capturing extreme precipitation events than a deterministic GAN. Since extremely heavy precipitation is likely to cause flooding and damage, being able to capture it is important. This result supports the finding of [4], who show that by sampling from the full HR distribution, the stochasticGANwasbetterabletoestimatewindcomponentextremes.
Multivariatepredication leadto improved dependence structure between dependant variables, but decreased the quality of predictions of individual variables. It seems reasonable that for variables with strong dependence, multivariate prediction wouldleadtobetterconsistency,asitallowsfine-scalevariabilitytobeharmonisedbetweenvariables.Fortemperatureand humidity,multivariatemodelsgeneratedfieldswithmutual information scores closer to that of the WRF variables. However, variablesgeneratedfromthefullmultivariatemodelwere noticeably more blurry, failed to capture fine scale variability, and showed artifacts. Humidity seemed especially challenging; the univariate model was the only model able to recreate the finescalefeaturesaroundtheStraitofGeorgia,andthefullmultivariatemodelcreatedpredictionsstillshowingartifactsofthe convolutionalfilters.Whenweremovedprecipitationfromthemodelandonlypredictedwindcomponents,temperature,and humidity, results were improved, but still blurry. Precipitation has a very different distribution than the other variables; it seemsthattryingtopredictvariableswithdifferentdistributionsinchallenging.Perhapssincetheconvolutionalfiltersbeing learned for each field are so different, the final result is an overall poorer compromise. However, it is interesting that even with precipitation removed, generated fields were less accurate. Using multivariate prediction means that there are fewer tunableparametersthatcanbeusedspecificallyforasinglevariable.Wehypothesizethatthismayleadtodecreasedflexibility forthemodeltoadapttoaspecificvariable.Aninterestingavenueoffutureresearchwouldinvestigatewhetheradjustingthe modelarchitecturetoimproveflexibilitycouldimprove multivariateprediction.Forexample,itmaybebeneficialtoseparate thenetworkintoseparatebranchesneartheendforeachvariablebeingprediction.Inpractice,itmaystillbeadvisabletouse multivariate prediction for highly coupled variables (e.g., temperature and humidity, wind components), and univariate predictionforlessdependantvariables(e.g.,precipitation).
Including HR topography in the Generator improved spatial structures of wind components, temperature, and humidity, particularly at high wavenumbers. However, including LR interpolated topography produced downscaling of approximately similar quality, thus suggesting that network architecture may be more important than the topography resolution itself. AddinganHRinputstreamresultsinasubstantiallylargernetwork,withmorelearnableweightsatHRscales,especiallysince our architecture applies a RRDB to the HR input stream. Thus, even if the input has the same information, difference in architecture and the increased network size at the fine scales could allow the model to better capture fine scale details. It is interesting to note that the GANs with HR topography seemed to stabilise faster during training than the model with LR interpolated topography. This suggests that, given the correct architecture, the model can learn HR details over time, but is aidedinitiallybyhavingtheHRinformation.Forprecipitationin theNortheastregion,wealsofoundthatincludinga second HRcovariate(landuseindex)improvedpredictions.However,sincethisadditionslightlyalteredthenetworkarchitecture,itis unclearwhetherthelanduseinformationitselfwasuseful.AlthoughaddingaHRstreamtotheGeneratorincreasesnetwork size, we believe that the substantial improvement in fine-scale structure makes this trade off worthwhile, and we suggest includingHRcovariateswhenpossible.
International Research Journal of Engineering and Technology (IRJET) e-ISSN: 2395-0056
Volume: 13 Issue: 04 | Apr 2026 www.irjet.net
p-ISSN: 2395-0072
Applying the stochastic GAN framework to the Northeast location showed mixed success. Wind component downscalings generallyshowedsimilarhigh-accuracyasintheSouthwestregion.Temperatureandhumiditydownscalingswerereasonable butnotasaccurate,andprecipitationmodelswereinitiallypoor,withgeneratedfieldsshowingverydifferentspatialstructure thantheWRFfields.Wehypothesisthatsomeofthechallengesinthisregion,especiallywithprecipitation,wereduetolarger biasesbetweenWRF andERA5structuresatlargescales.Itwasvisuallyapparentthatinmanysamples,theLR conditioning fieldsdidnotmatchthestructureofthecorrespondingWRFfields.Ourunbiasedprecipitationmodel,wherewecreatedtheLR conditioning fields by coarsening the WRF fields produced highly accurate downscaling, supporting our hypothesis that this mismatchisasourceofthechallenges.Unfortunately,inanoperationalsetting,itisgenerallynotpossibletohaveunbiasedLR andHRfields,astheHRfieldsdonotexist.Somestudieshavealreadyinvestigatedthechallengeoflarge-scalebiasesbetween datasets. [7] developed a GAN with two stages, the first to correct biases, and the second to downscale. However, this approachisonlyapplicableifbiasesareconsistentacrosssamples.Ifbiaseschangebetweensamples,whichwehypothesisis oftentruewithprecipitation,itbecomesamuchmorechallengingproblem.Someofthechallenges we found in this region may be improved byusingalargertrainingregion;biasesbetweenLRandHR dataarelikelymoresevereatsmallerscales, andbyusingalargerarea,theremaybemoreconsistencybetweendatasets,resultinginincreasedstabilityduringtraining. In regionswithsubstantialbias,itmayalsobepossibletotrainmodelsusingtheunbiasedcoarseneddata,andthenpredictusing thebiasLRdataset.Whilethistechniquewouldthennotperformanybiascorrection,itcouldperformbetteratdownscaling thananunstablemodel.
We noticed that covariate choice had a large effect on downscaling accuracy in the Northeast region compared to the Southwest region. Certain covariates, which had not been necessary in the Southwest region, were important for accurate downscaling in the Northeast. Convective Available Potential Energy was important for predicting precipitation, humidity, temperature, and wind components. While we included CAPE as a covariate in our final models for both regions, CAPE only improvedprecipitationdownscalingontheSouthwest region,whereasitimprovedallvariablesintheNortheastregion.Since substantialfine-scalevariabilitycanresultfromconvection,especially in regions of flatter topography, it makes sensethat CAPEisanimportantvariableinthisregion.Ingeneral,different suites of LR covariates will be needed dependingonthe downscaling region. Therefore, to obtain accurate downscaling’s over large areas, it will likely be necessary to include more covariates than required for a smaller region, as all subdomains will require the covariates important for their specific weatherpatterns.
Itisbecomingincreasingly commonforgovernments,industries,andotherorganisationstousedownscaledclimatedatafor modelling,planning,andadaptationpurposes.Mostofdownscaledproductseasilyavailabledoapoorjobatcapturingclimatic extremes, which are arguably the most important. Deep learning downscaling is a promising method for improving this challenge,asitprovidesacomputationallyefficientwayofdownscalingLRmodeloutputtoconvectionpermittingscales,thus bettercapturingextremes. Whilesubstantial research hasoccurredinthisfieldrecently,deep- learningdownscalinghasnot be been used in a large operational setting. This paper addresses some of the challenges inherent in applying GAN based downscalingoperationally.WeshowthatthestochasticGANframeworkcanbeextendedtoasuiteofimportantvariables,that includingHRcovariatesincreasesaccuracy,andthatwhiletheframeworkcanbeappliedtoadifferentregion,therearesome challenges related to large-scale bias between HR and LR fields. A final step required for operational GANs will involve overcomingthecomputationalchallengeslinkedtotrainingonlargespatialregions.Tilingmethods,whichhavebeenapplied in other deep-learning and computer vision settings, will be an important avenue of future research. Hopefully, GAN downscalingwillsoonbeanimportanttoolforclimateadaptation.
[1] I.J.Goodfellow,J.Pouget-Abadie,M.Mirza,B.Xu,D.Warde-Farley,S.Ozair,A.Courville,andY.Bengio,“Generative adversarialnetworks,”arXivpreprintarXiv:1406.2661,2014.
International Research Journal of Engineering and Technology (IRJET) e-ISSN: 2395-0056
Volume: 13 Issue: 04 | Apr 2026 www.irjet.net p-ISSN: 2395-0072
[2] M. Mirza and S. Osindero, “Conditional generative adversarial nets,”arXivpreprintarXiv:1411.1784,2014.
[3] N. J. Annau, A. J. Cannon, and A. H. Monahan, “Algorithmic hallu- cinations of near-surface winds: Statistical downscaling with generative adversarial networks to convection-permitting scales,” Artificial Intelli- gence for the EarthSystems,vol.2,no.4,p.e230015,2023.
[4] K. Daust and A. Monahan, “Capturing climatic variability: Using deep learning for stochastic downscaling,” arXiv preprintarXiv:2406.02587, 2024.
[5] L.Harris,A.T.McRae,M.Chantry,P.D.Dueben,and T.N.Palmer, “Agenerativedeeplearningapproachtostochastic downscalingof precipitationforecasts,”arXivpreprintarXiv:2204.02028,2022.
[6] J. Leinonen, D. Nerini, and A. Berne, “Stochastic super-resolution fordownscalingtime-evolvingatmosphericfields withagenerative adversarialnetwork,”IEEETransactionsonGeoscienceandRemote Sensing,vol.59,no.9,pp.7211–7223,2020.
[7] I.PriceandS.Rasp,“Increasingtheaccuracyandresolutionof precipitationforecastsusingdeepgenerativemodels,”in International ConferenceonArtificialIntelligenceandStatistics. PMLR,2022,pp. 10555–10571.
[8] Y.Li,Z.Li,Z.Zhang,L.Chen,S.Kurkute,L.Scaff,andX.Pan, “High-resolutionregionalclimatemodelingandprojection overwestern canadausingaweatherresearchforecastingmodelwithapseudo-global warming approach,” Hydrology and Earth System Sciences, vol. 23, no.11,pp.4635–4659,2019.
[9] M.Arjovsky,S.Chintala,andL.Bottou,“Wassersteingenerativead- versarialnetworks,”inInternationalconferenceon machinelearning. PMLR,2017,pp.214–223.
[10]X. Wang, K. Yu, S. Wu, J. Gu, Y. Liu, C. Dong, Y. Qiao, andC. Change Loy, “Esrgan: Enhanced super-resolution generativeadversar- ialnetworks,”inProceedingsoftheEuropeanconferenceoncomputer vision(ECCV)workshops, 2018,pp.0–0.
[11]Z. Li, F. Liu, W. Yang, S. Peng, and J. Zhou, “A survey of convo- lutional neural networks: analysis, applications, and prospects,”IEEE transactionsonneuralnetworksandlearningsystems,vol.33,no.12,pp. 6999–7019,2021.
[12]W. Shi, J. Caballero, F. Husza´r, J. Totz, A. P. Aitken, R. Bishop,D.Rueckert,andZ.Wang,“Real-timesingleimageand video super- resolution using an efficient sub-pixel convolutional neural network,” in Proceedings of the IEEE conferenceoncomputervisionandpattern recognition,2016,pp.1874–1883.
[13]B. Kumar, K. Atey, B. B. Singh, R. Chattopadhyay, N. Acharya,M. Singh, R. S. Nanjundiah, and S. A. Rao, “On the moderndeep learningapproachesforprecipitationdownscaling,”EarthScienceIn- formatics,vol.16,no.2,pp.1459–1472,2023.