In late 2025, BID Central – the working group for Business Improvement Districts – conducted a survey with its members.
This is the first time the BIDs in the Midlands have come together to create an analytical look at the BID landscape specifically in this part of the country.
The results will help BIDs in the Midlands when looking at how to tackle their challenges and take advantage of their opportunities.
This document is designed to be shared with your local stakeholders and key partners to inform them what life really looks like for BIDs in the Midlands in 2026.
Section 1 - Where is the data from?
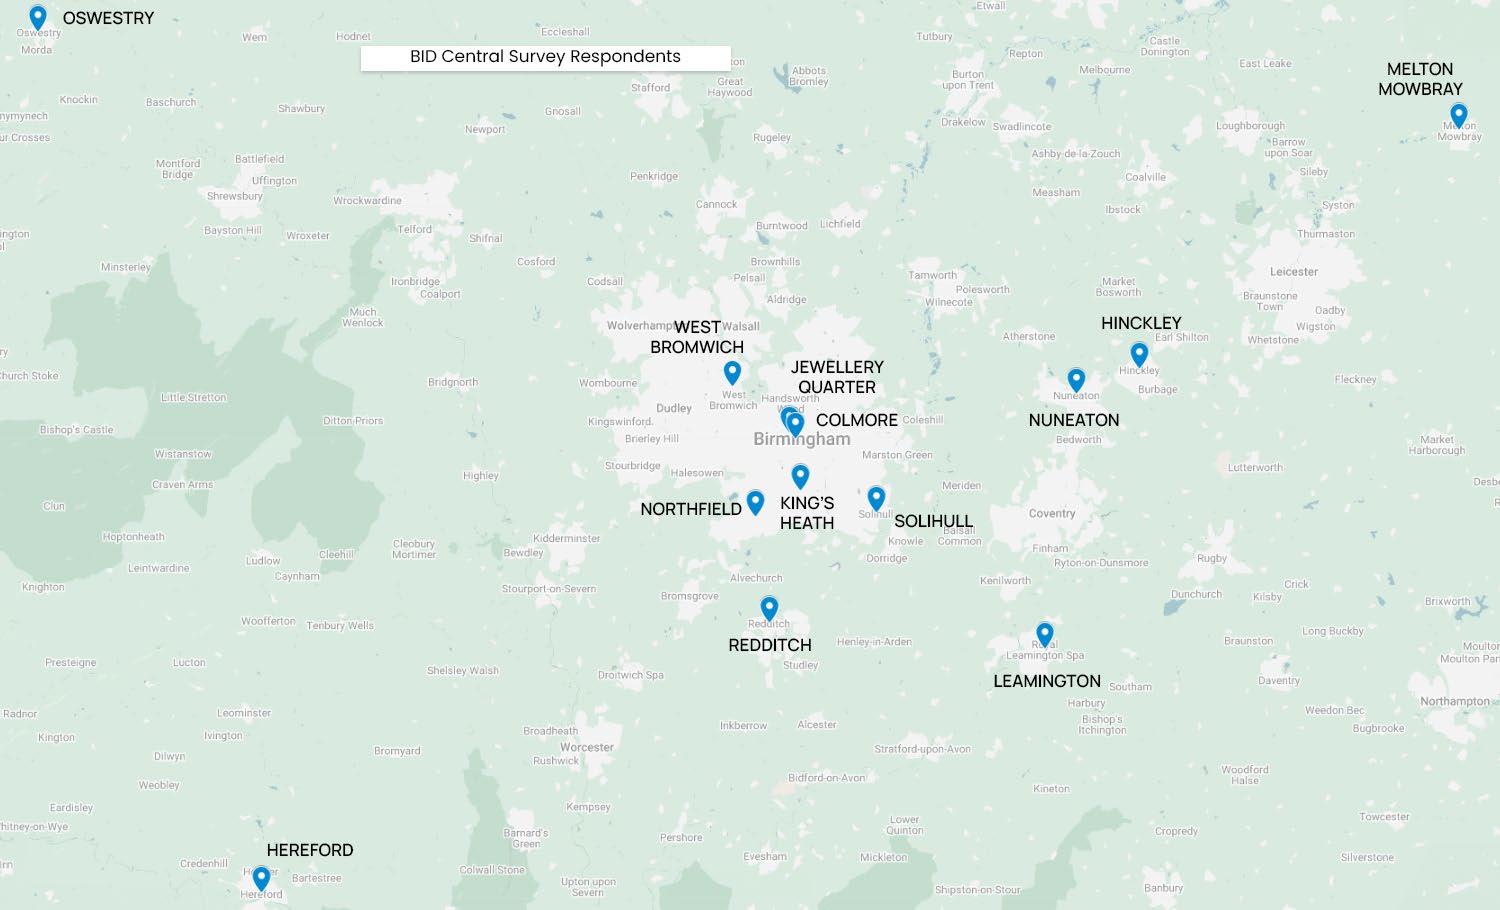
Thirteen BIDs from across the Midlands answered our detailed survey
Respondents were predominantly BID Managers or Chief Executives with one Chief Policy and Governance Oicer also completing the survey.
On average, respondents had an average job tenure of over six years with the longest serving having worked at their BID for 14 years
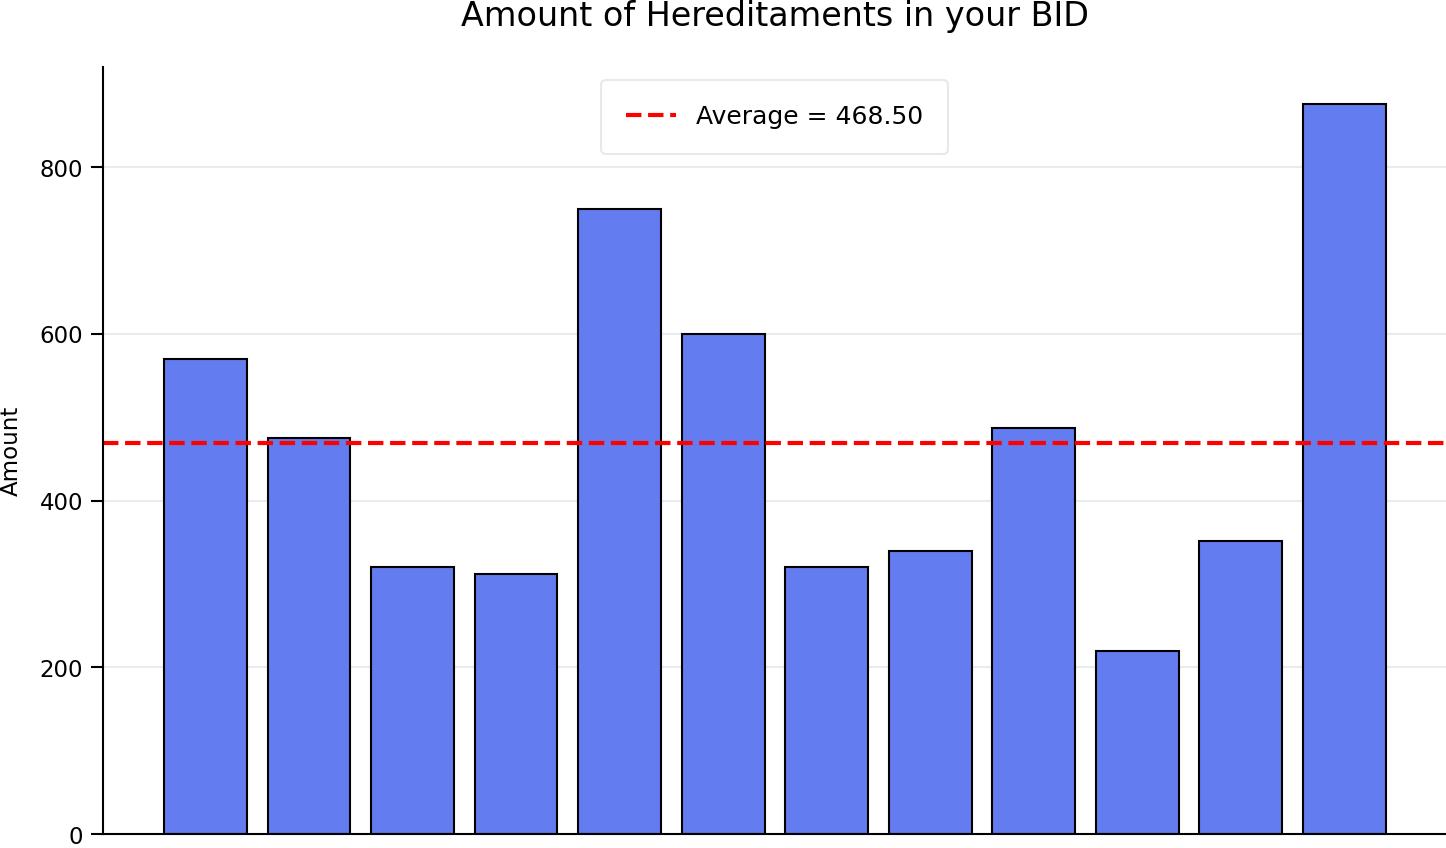
On average, the BIDs had 469 businesses within their area, ranging from 220 on one end of the scale to 876 at the other.
Most BIDs that responded are well-established with only one currently in their First Term.
The majority of respondents are in at least their Third Term with three due to have their next renewal ballot in 2026 with another two in 2027
The oldest BID that responded began operations on 1st April 2009.
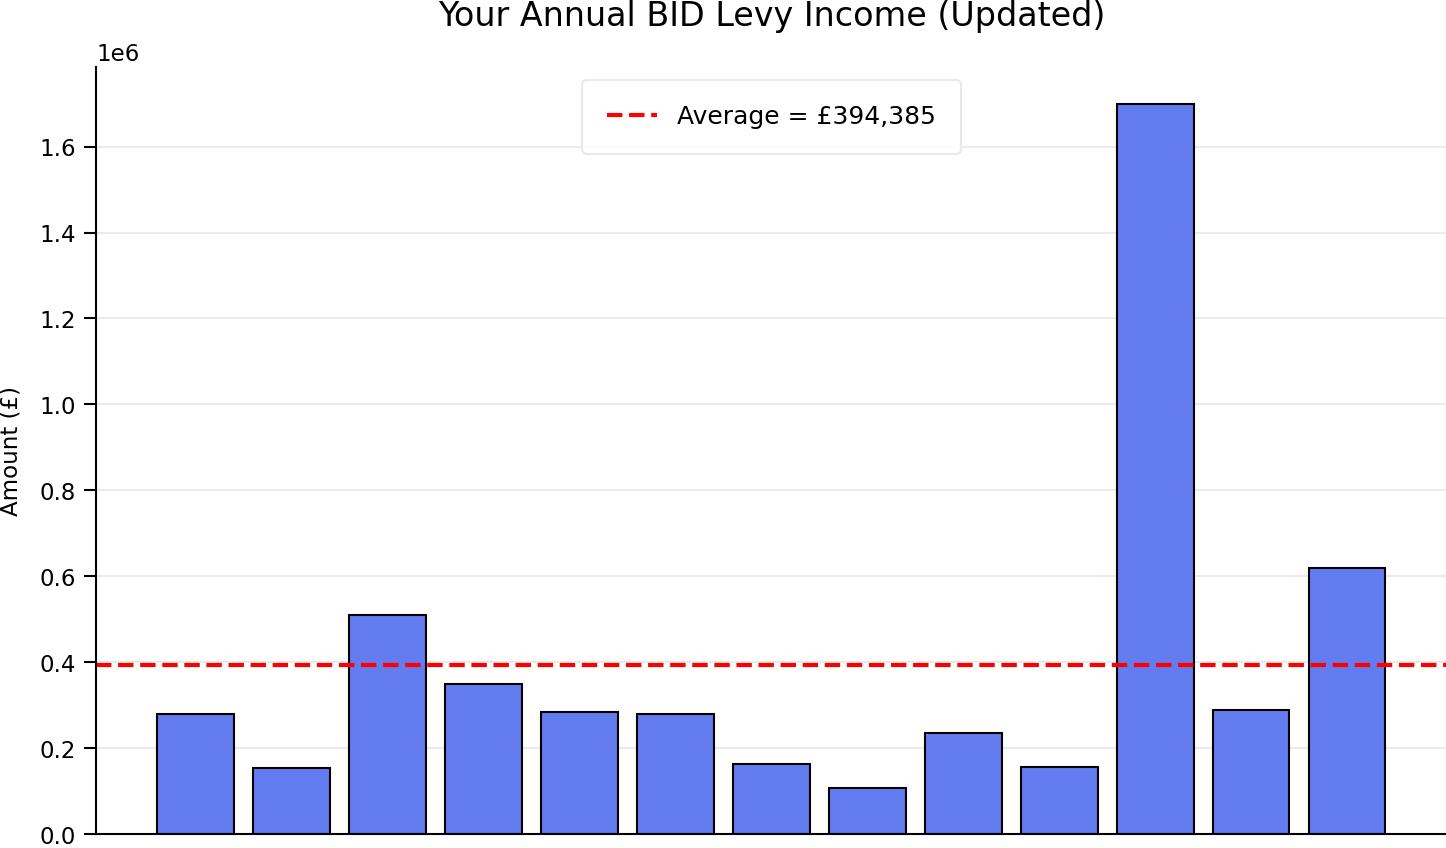
Annual BID Levy incomes ranged from £106,000 to £1,700,000 with an average of £394,385.
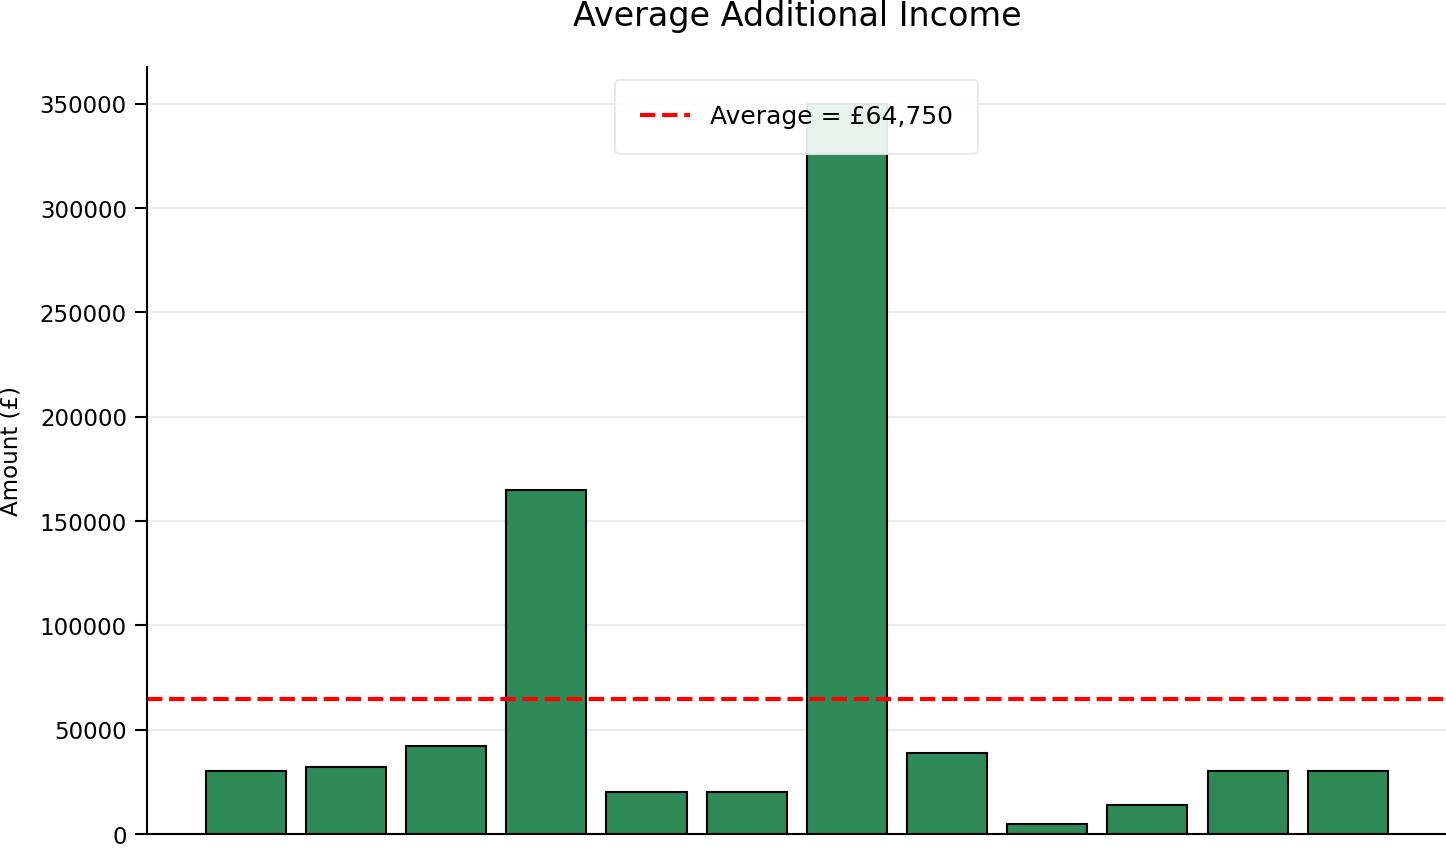
Only one respondent said they did not receive any additional income. Of those that did receive some, the average amount was £64,750. However, this was heavily skewed by two BIDs that received £350,000 and £165,000 respectively.
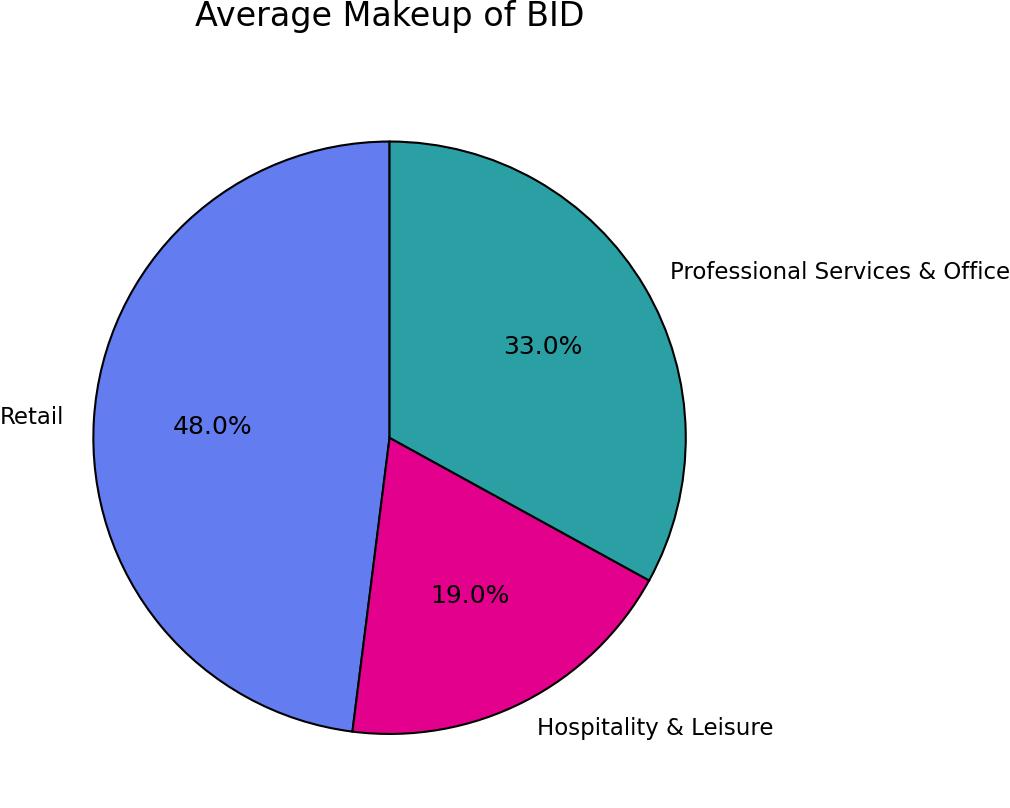
The average makeup of the BIDs that responded is shown to the right, broken into three main sectors –Retail, Hospitality & Leisure and Professional Services & Oice
In all but two of the BIDs that responded, Retail made up the largest percentage of their businesses.
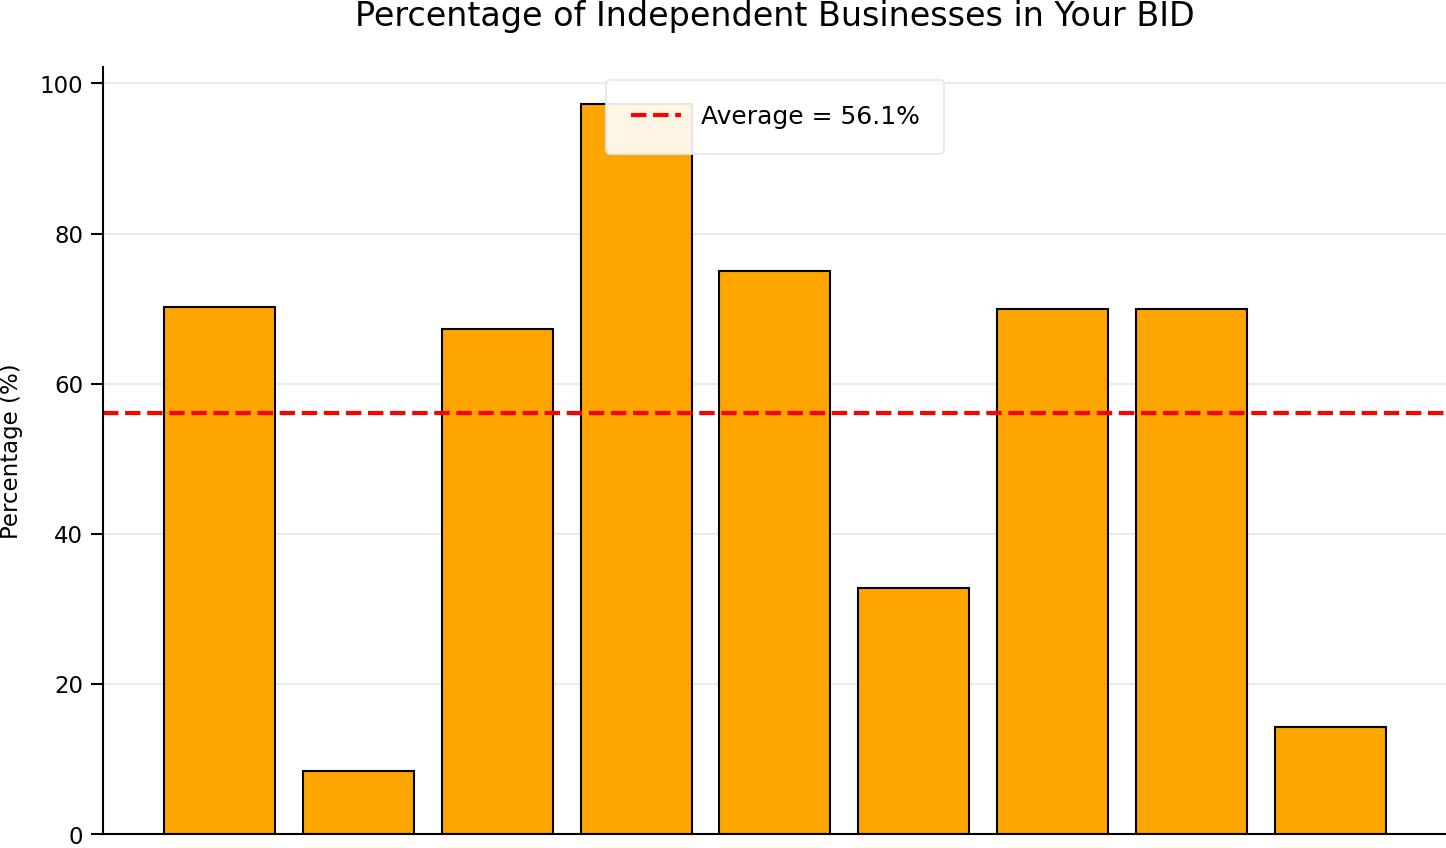
Of the respondents that knew the data, the average percentage of independent businesses in a BID was 56.1%. The totals ranged from 8.4% to 97.4%
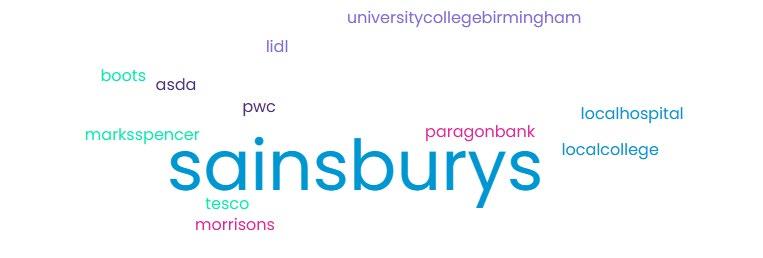
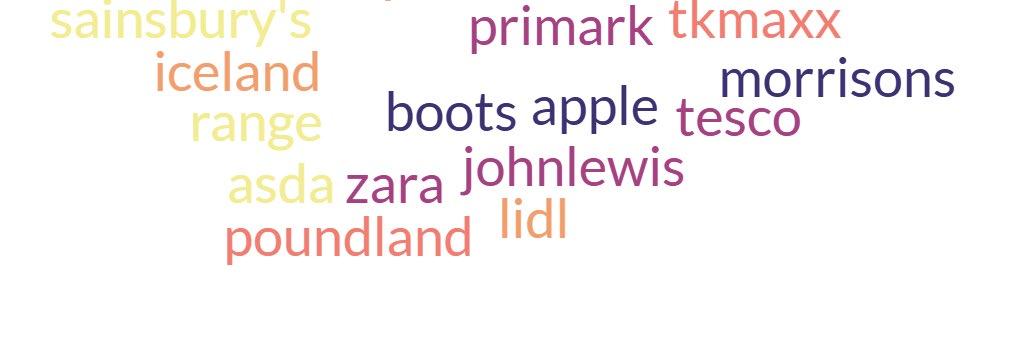
Supermarkets make up the bulk of the largest BID Levy payers. These include Sainsbury’s, Asda, Lidl, Marks & Spencer, Tesco and Morrisons.
In all but one of the respondents’ cases, the largest BID Levy payer was also the largest employer in the BID area.
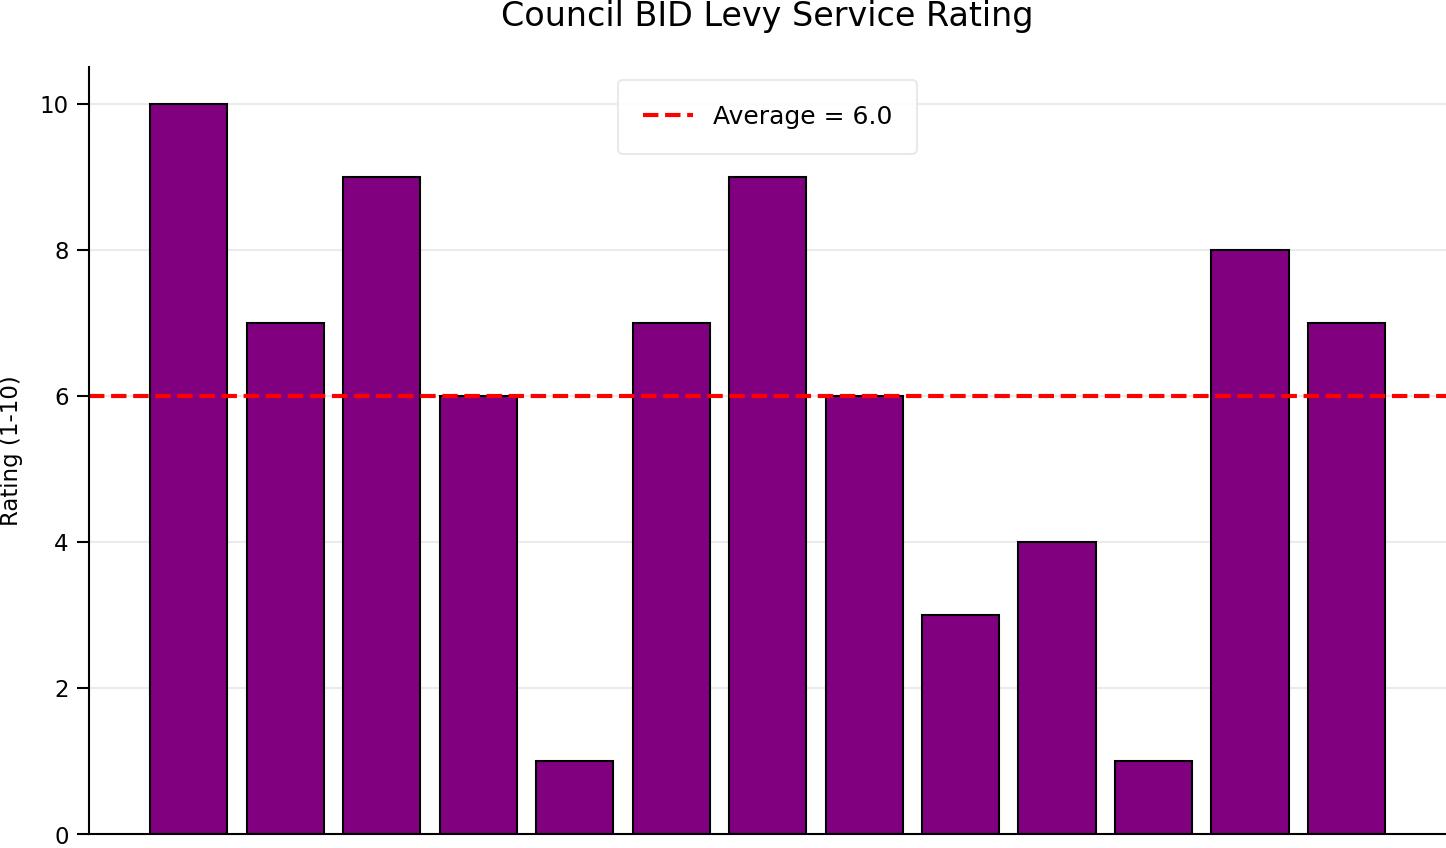
All respondents have their BID Levy collected by their local Council. When asked how they rate their Council’s collection service, with 1 being terrible and 10 being fantastic, the average score was 6.
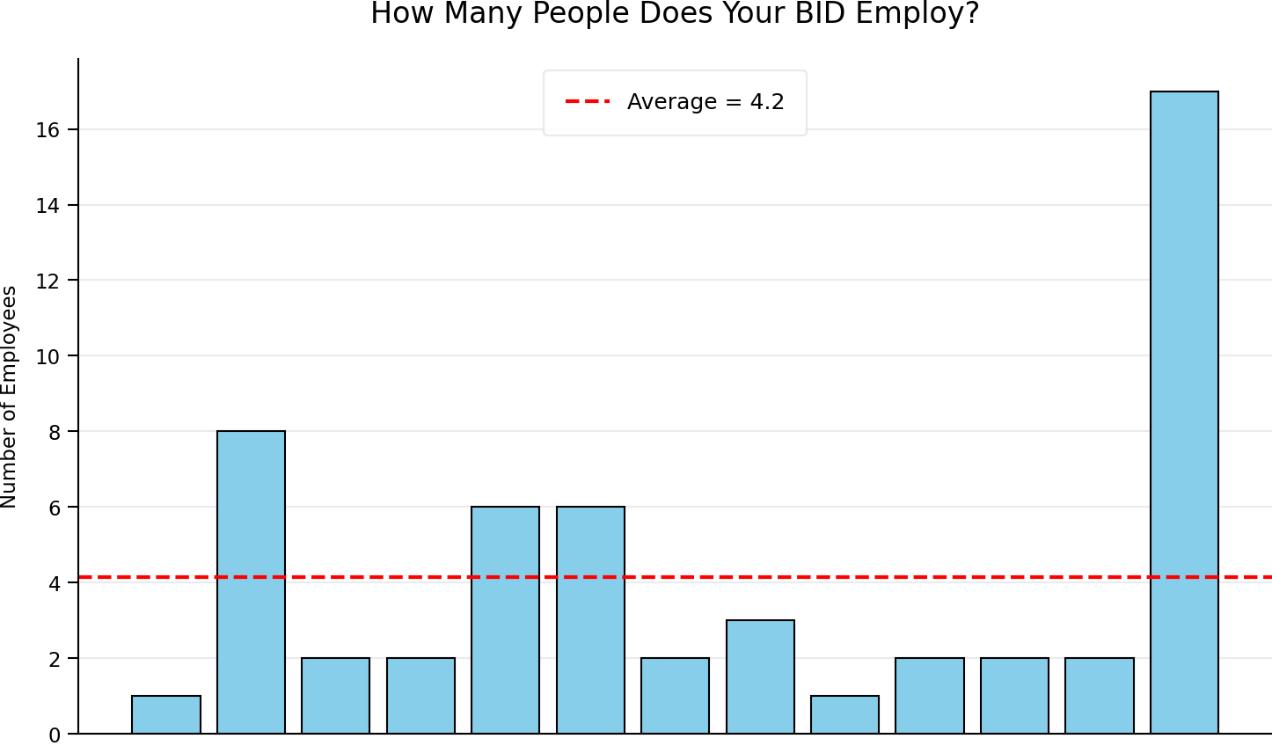
The average number of employees per BID was 4.2 but this was skewed by one BID that employs 17.5.
The overwhelming majority of respondents hire two or fewer people.
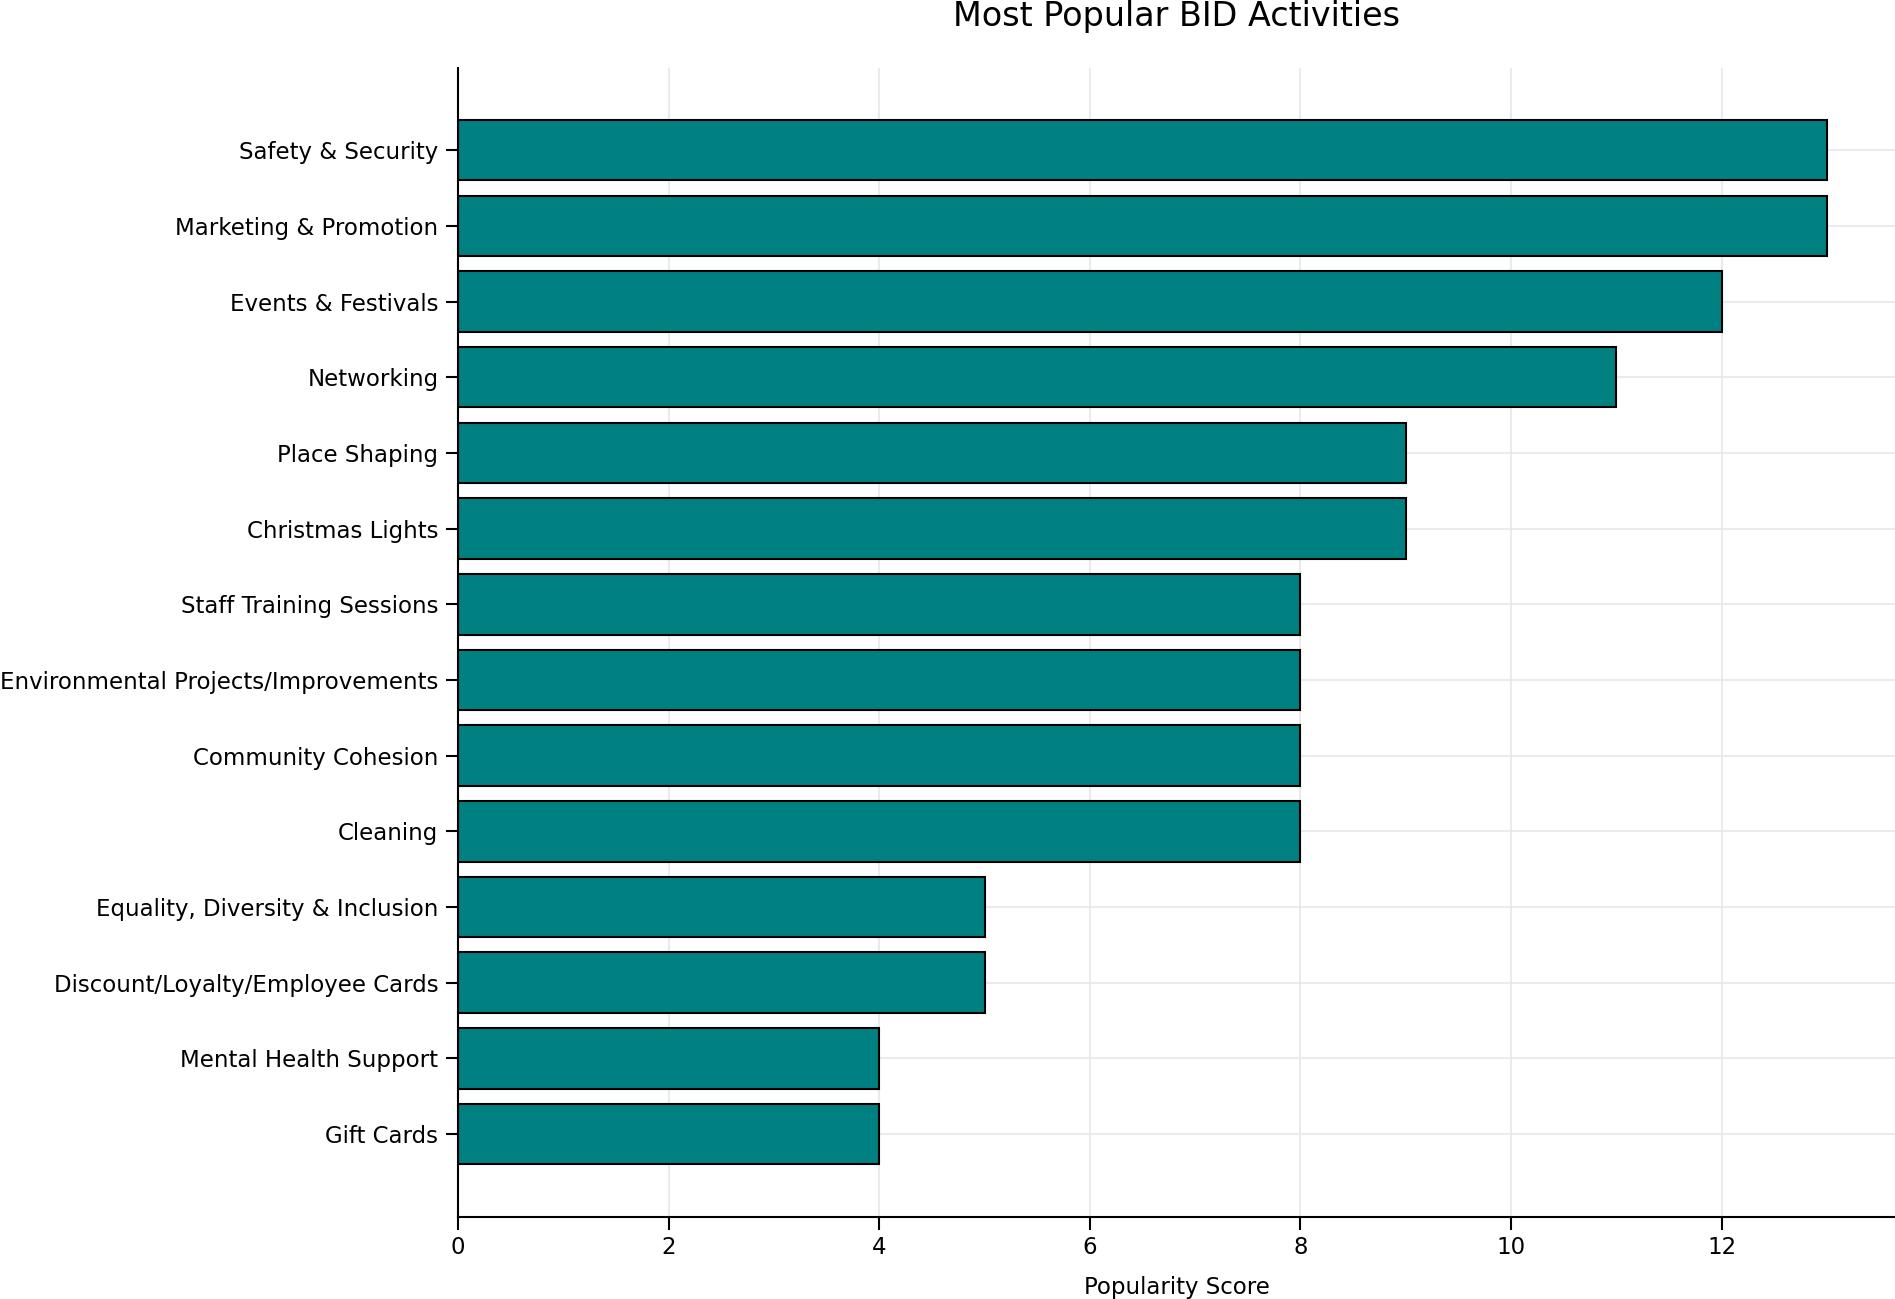
All respondents said Safety & Security as well as Marketing & Promotion were a focus for their BID. Events & Festivals and Networking were the next most popular project focuses.
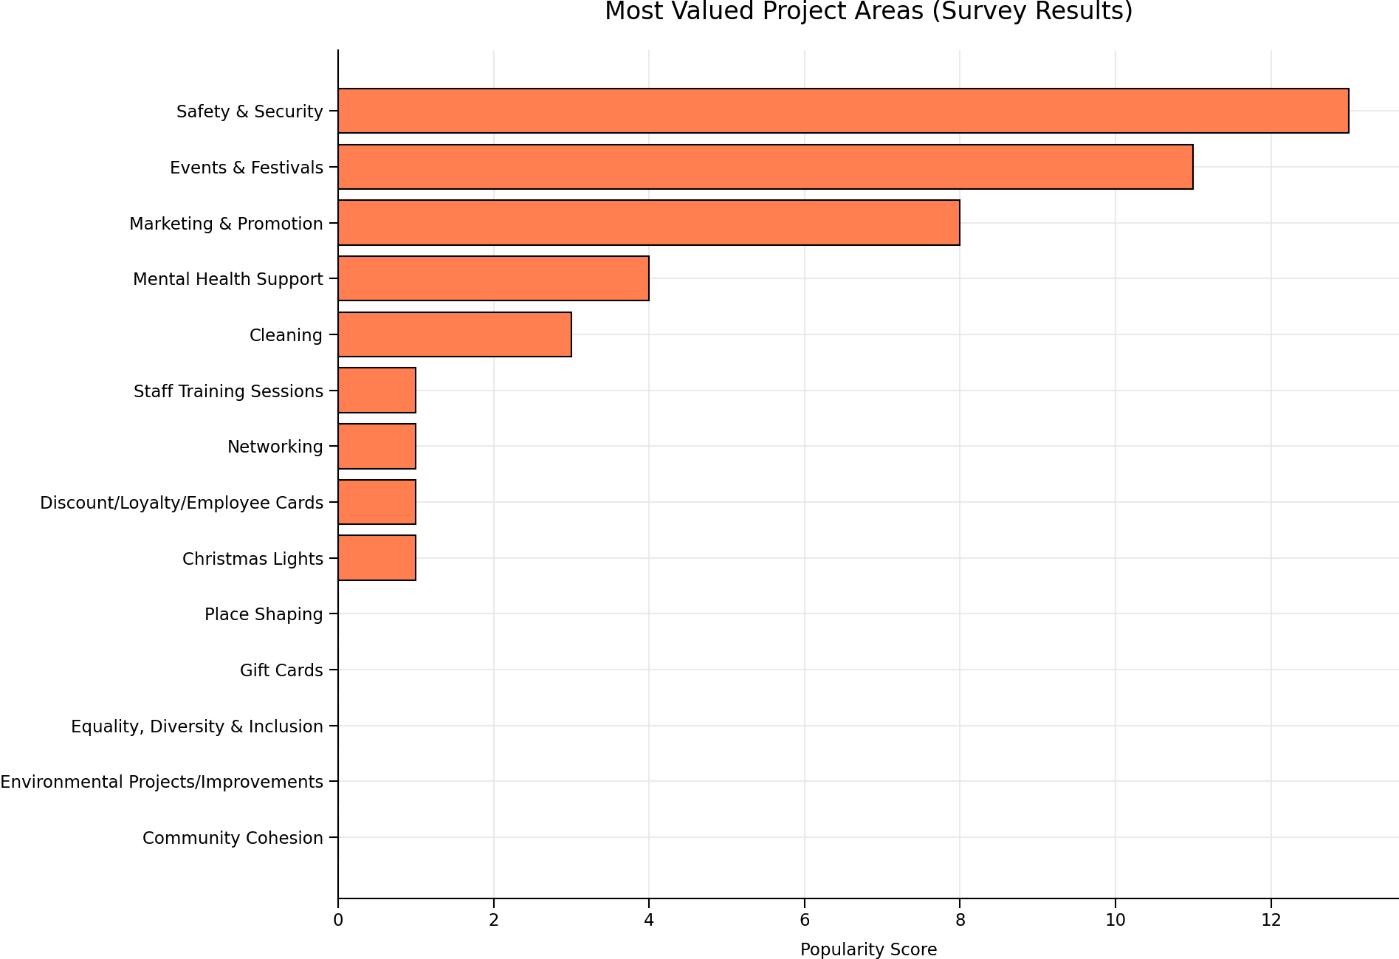
When asked what three project areas are most valued by their businesses, the results were clear. Safety & Security featured in every response with Events & Festivals and Marketing & Promotion often featuring too.
Section 2 – Safety & Security
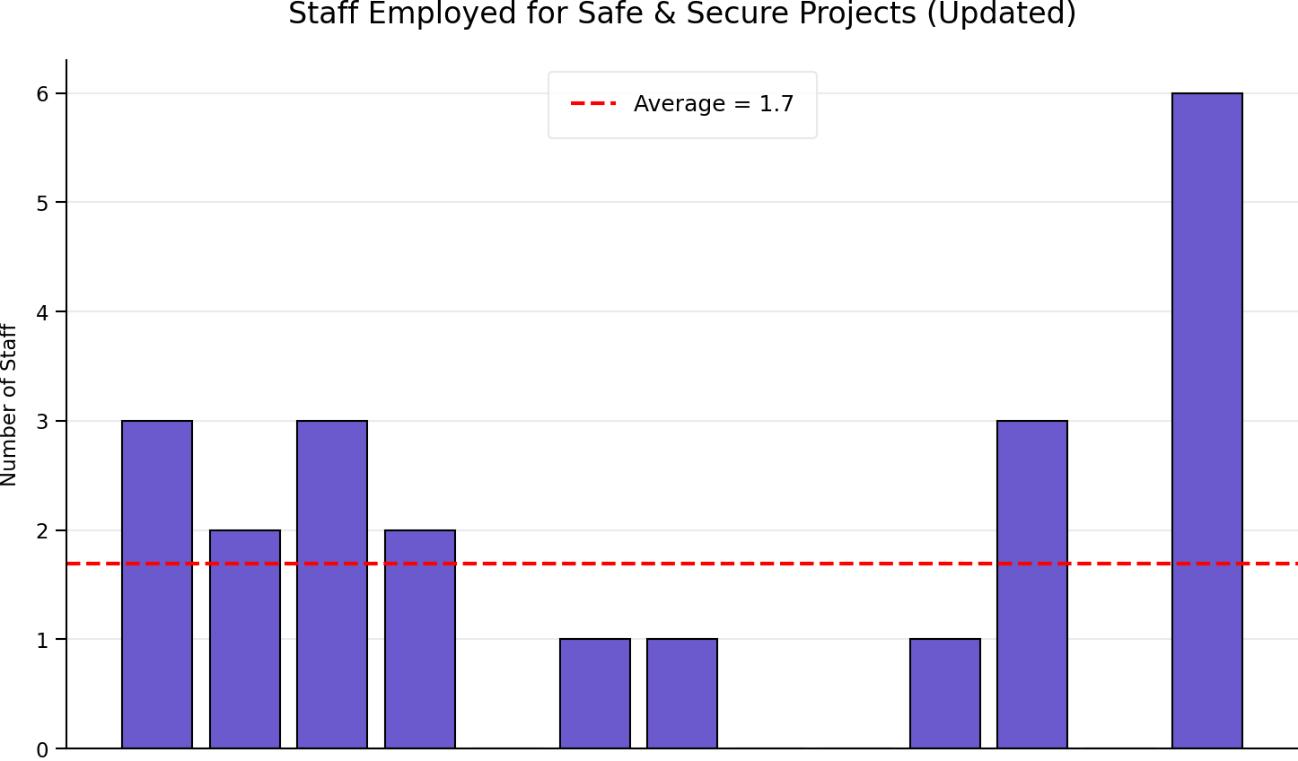
On average, respondents employ 1.7 people specifically for their Safe & Secure projects
This number increases to an average of 2.4 employed for Safety & Security projects when you take out those BIDs that don’t employ anybody.
Eight of the nine BIDs that responded said employed sta were Security Oicers/Wardens whilst two employ a Security Co-Ordinator/Operations Manager None of the respondents pay for/fund a Police oicer for their area.
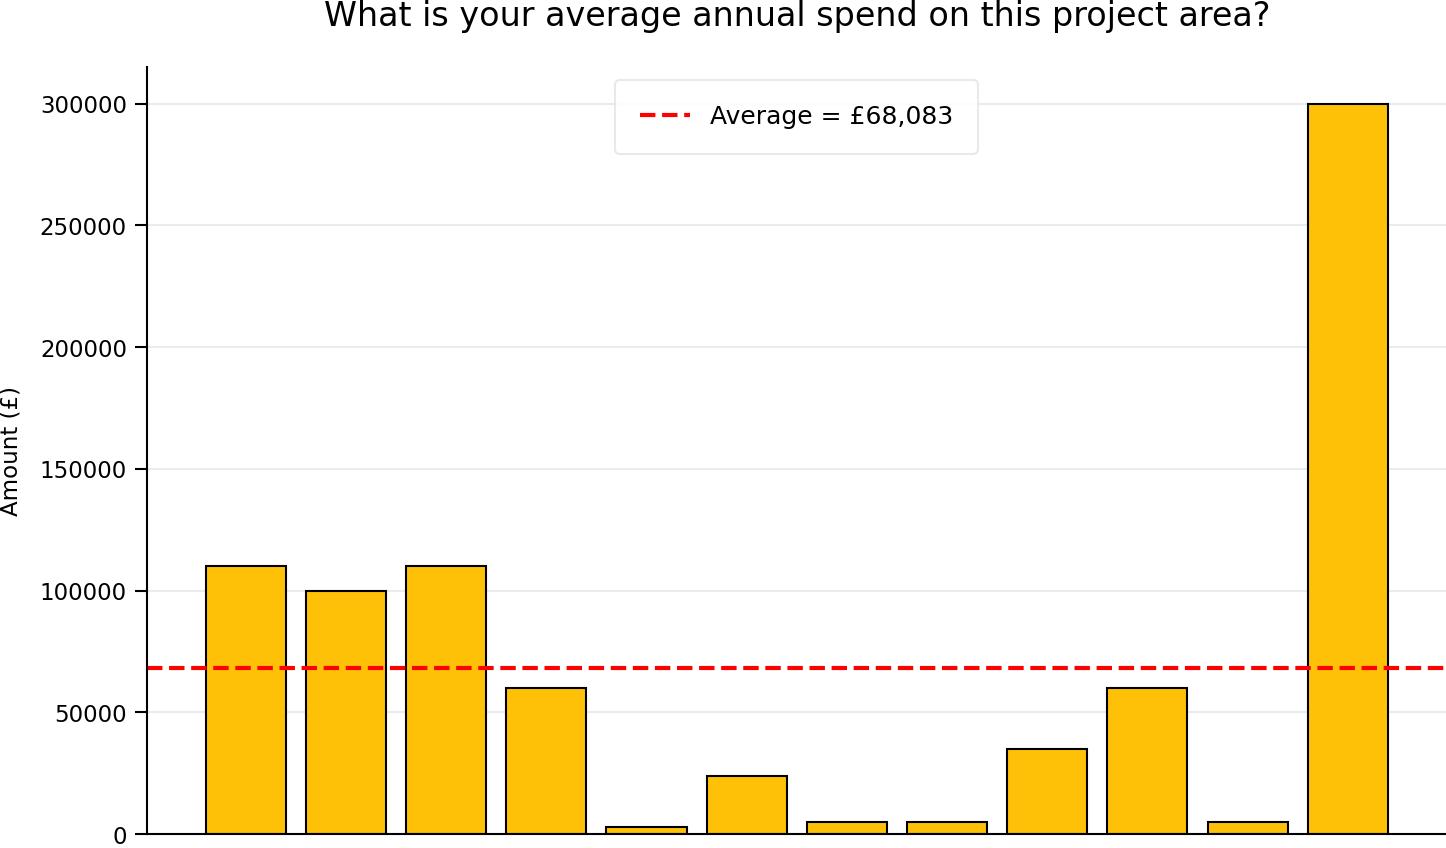
The average annual spend on Safety & Security was £68,083 per BID. The highest of those who responded was £300,000 with three other BIDs spending £100,000 or more and two others spending over £50,000.
There was an equal 50/50 split between sta employed directly by the BID and those employed via an agency.
Seven of the BIDs who responded said they used the DISC crime reporting system with, on average, 117 businesses signed up to use it. Four BIDs said their system received over 30 reports a month.
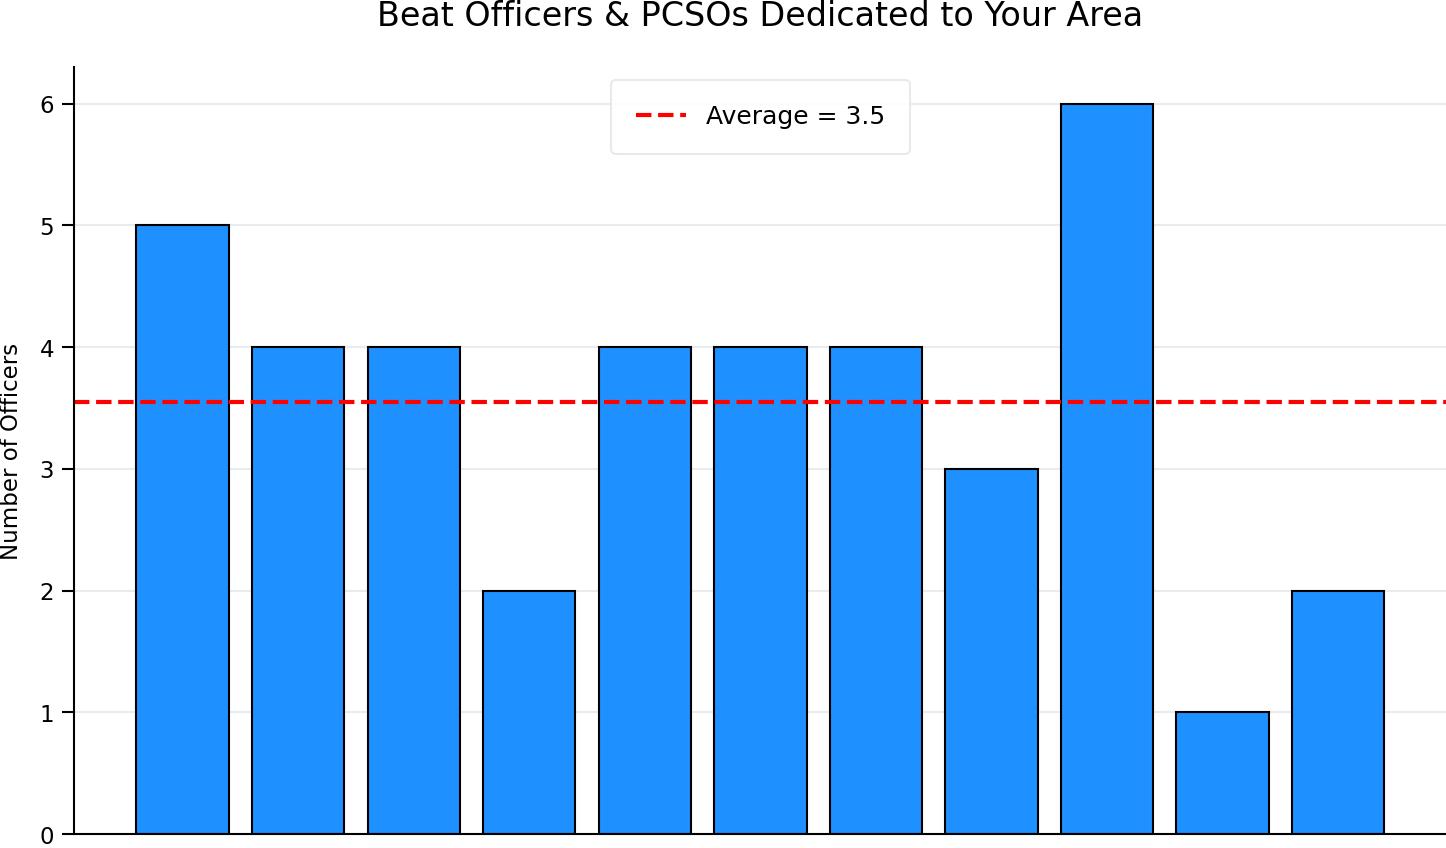
The average number of 'Beat Oicers' and PCSOs dedicated to a BID area is 3.5.
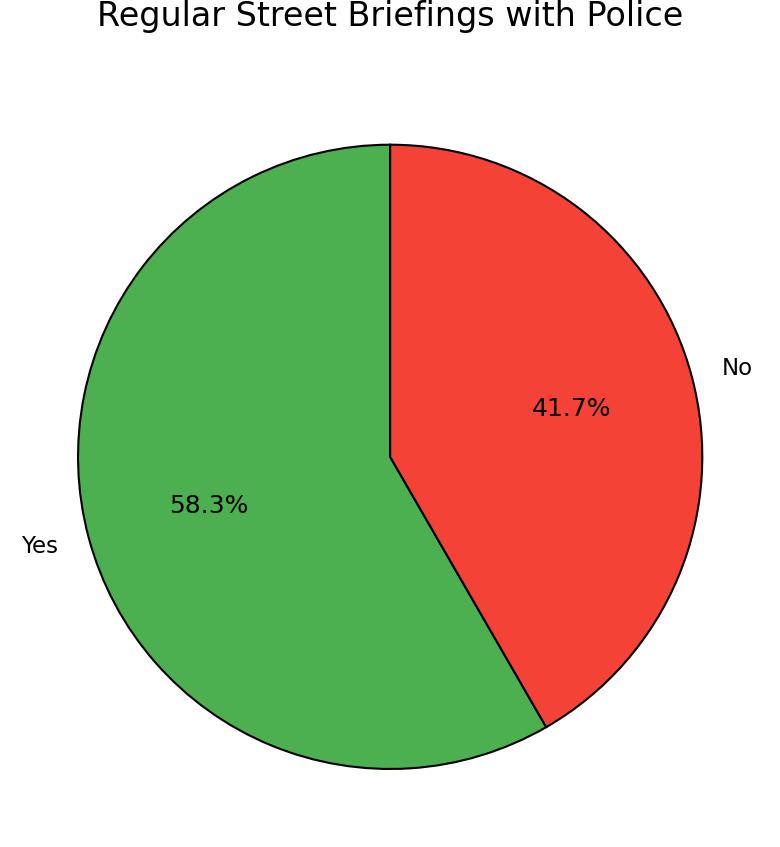
Only 58% of respondents said they had regular street briefings with their local Police team.
Just over half (54%)of the respondents said they supplied retail radios to their BID businesses, allowing them to communicate directly with their Security sta as well as Neighbourhood Police and CCTV operators.
Is violent crime an issue in your area?
Do you supply retail radios to your BID businesses?
Just under half (46%) of the respondents said they thought violent crime was an issue in their BID area.
Several respondents noted that the safety of their areas was perceived to be worse than it actually is. “Unsafe all the time according to the public.” / “The area is relatively safe (although perception is that it is more dangerous than it is).”
When asked what they would improve about their Safe & Secure project if money wasn’t an option, 84.6% said they would increase their Security coverage (Wardens/Guards/Police) to either have more of a presence throughout the week or into the evenings.
Homelessness & Begging Issue (Yes/No)
An overwhelming majority of 83% said that homeless and begging were issues in their BID area.
Of those who had issues, 50% said they had at least four incidents of rough sleeping/begging every single day.
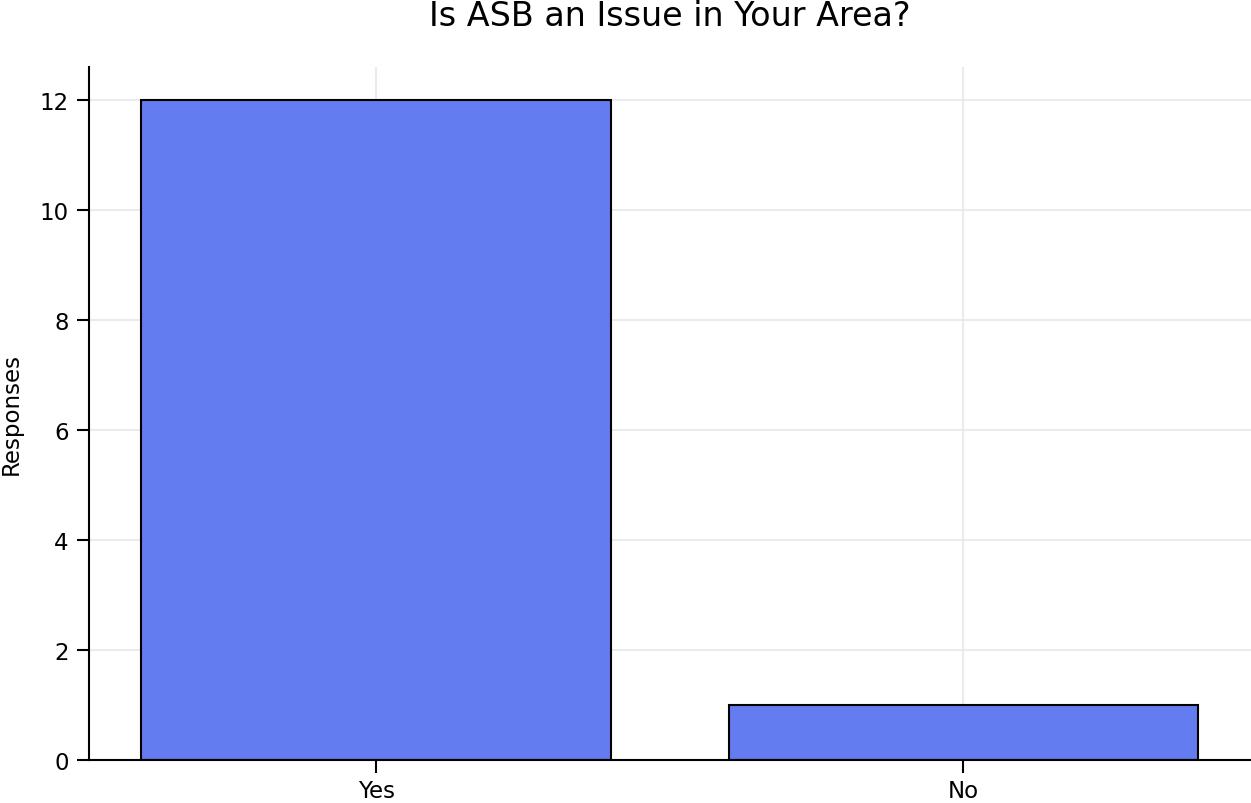
A huge 92% of respondents said their area suered with Anti-Social Behaviour. One said their ASB had increased by 30% in the last six months whilst another added that their local Police were looking at introducing a Public Spaces Protection Order (PSPO) to try and tackle the issue.
3 – Key Partners
Section
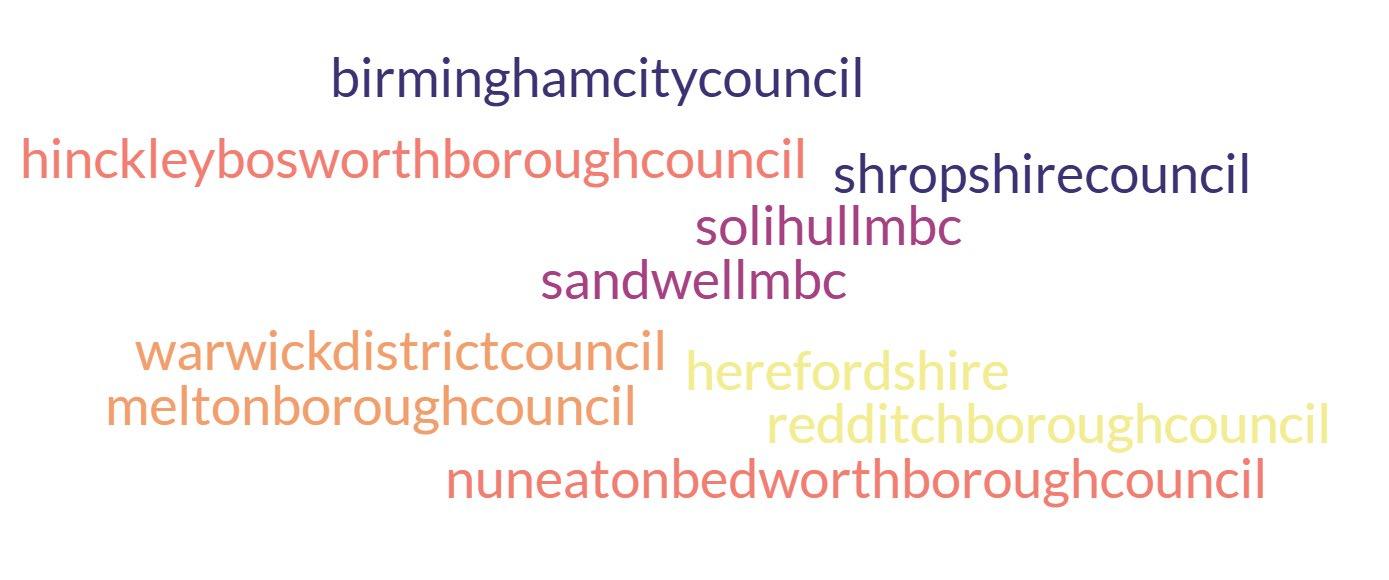
A total of ten dierent local authority areas from across the Midlands were represented in the survey.
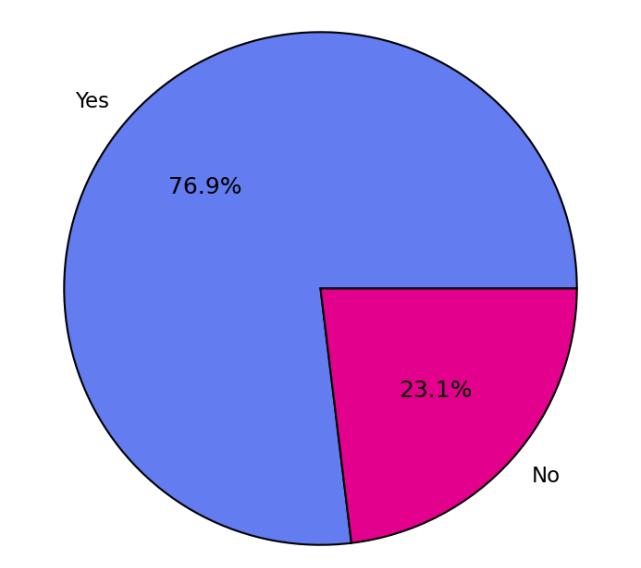
76.9% of those asked said they had a dedicated person within their local Council who is available for them to speak to when needed in regard to any queries they may have.
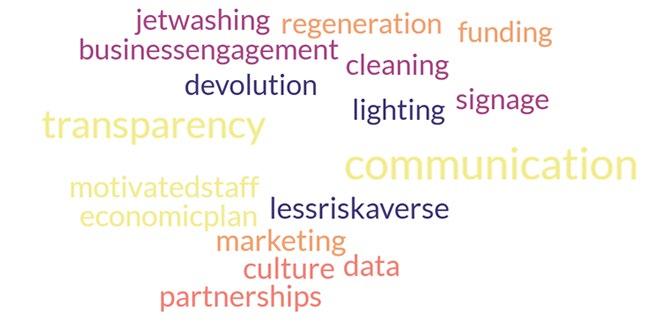
When asked what top three improvements/changes they would like to see in their local Council that would improve the local economy, we got a vast array of dierent responses. One of the common themes was an apparent lack of communication and transparency between local authorities and their BID
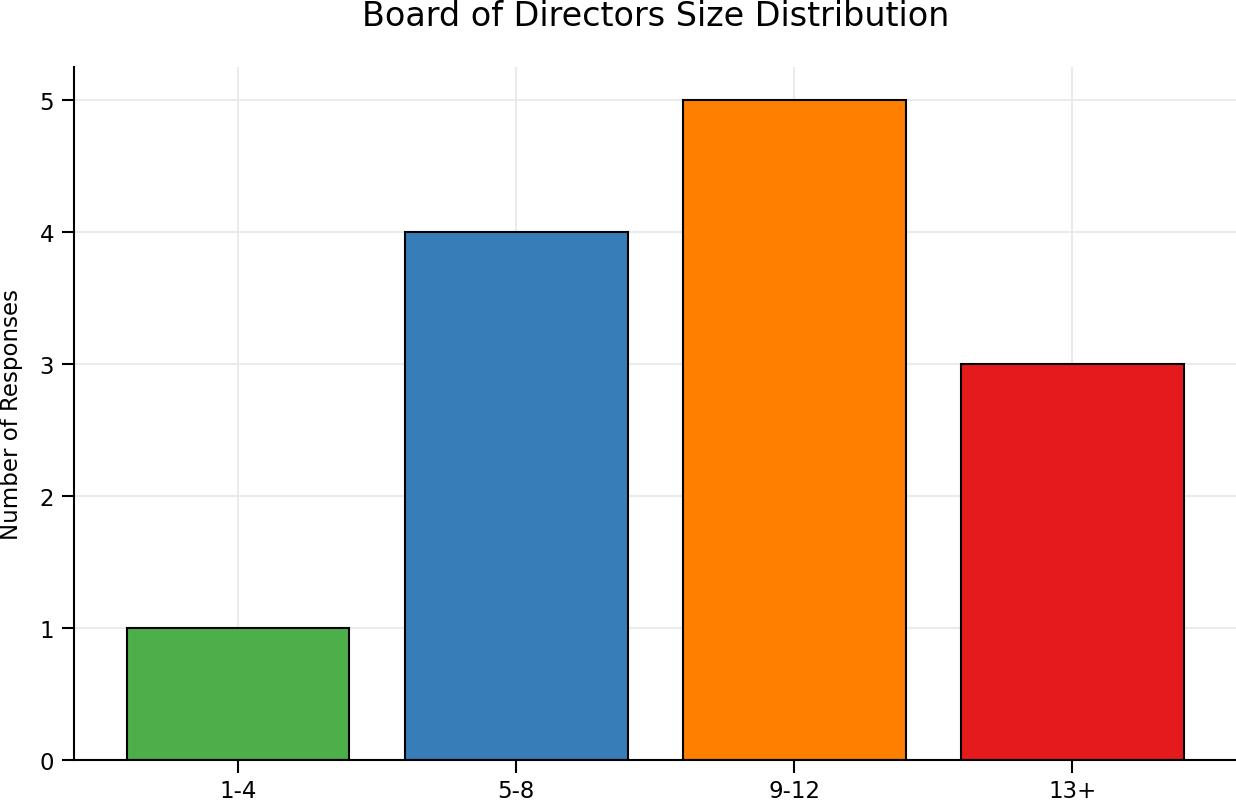
When asked how many people the BID have on their Board of Directors, the most common answer was 9-12, closely followed by 5-8.
Only one respondent said they had between 1-4 on their Board with three respondents having 13+ Board members.
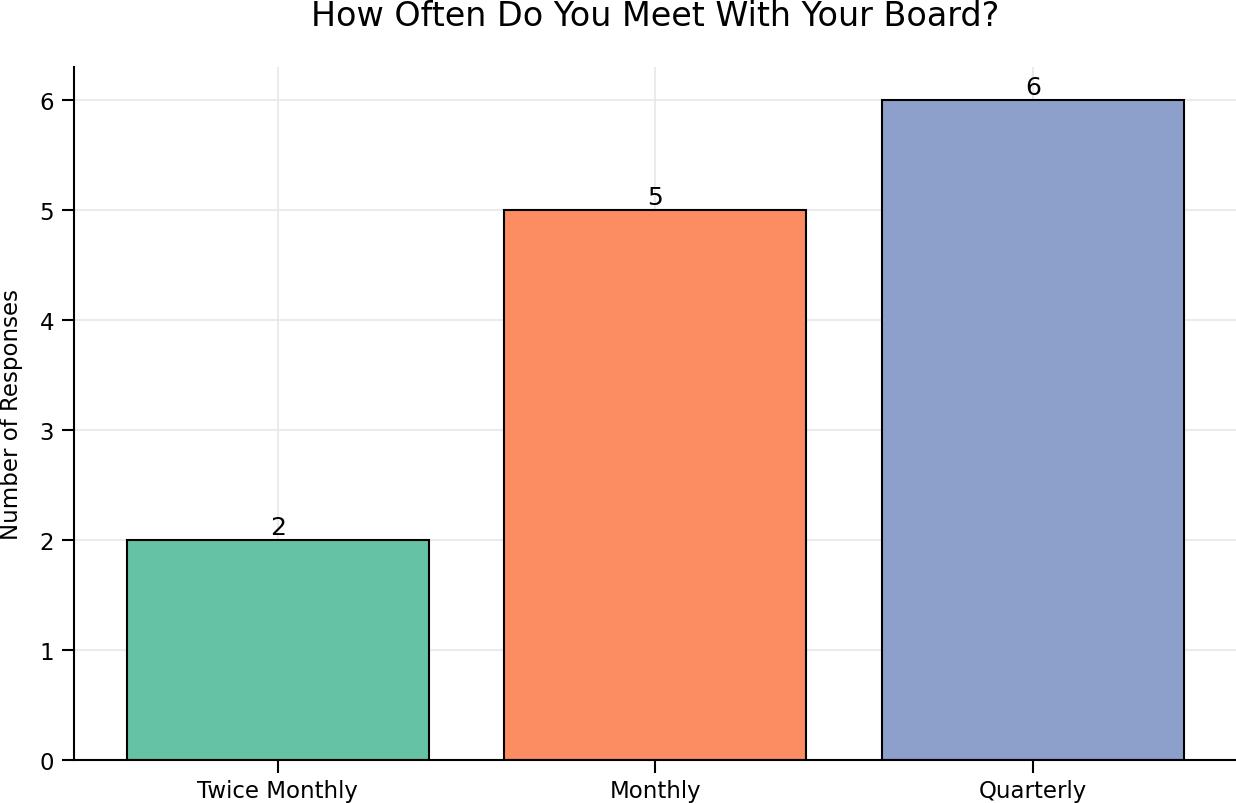
84.6% of respondents either meet with their Board of Directors on a monthly or quarterly basis with only two of the BIDs that completed the survey meeting with their Board more regularly than that.
Every BID that responded to the survey said they felt supported by their Chairman and BID Board of Directors.
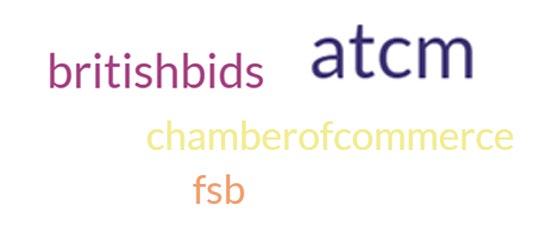
When asked which external organisations they were members of, there were four common answers:
38.5% of respondents are members of the Association of Town & City Management, the most popular answer. 30% are members of British BIDs, but only 15% were members of the Federation of Small Businesses or their local Chamber of Commerce.
One stumbling block raised in the answers was the cost of joining external organisations which made it diicult to get involved, especially for smaller BIDs.
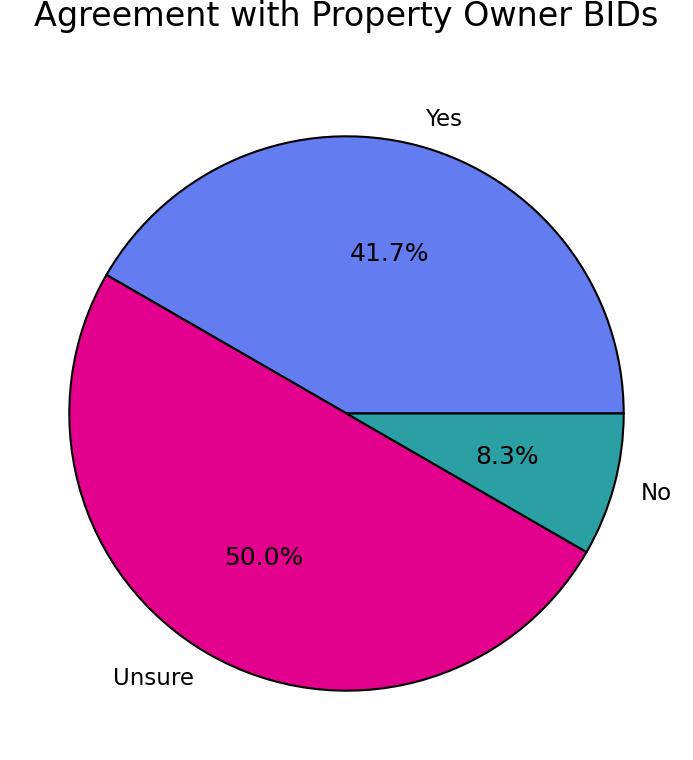
There was a mixed response when respondents were asked whether they agreed with Property Owner BIDs with the majority either in favour or still unsure.
Section 4 – Shopping Centres
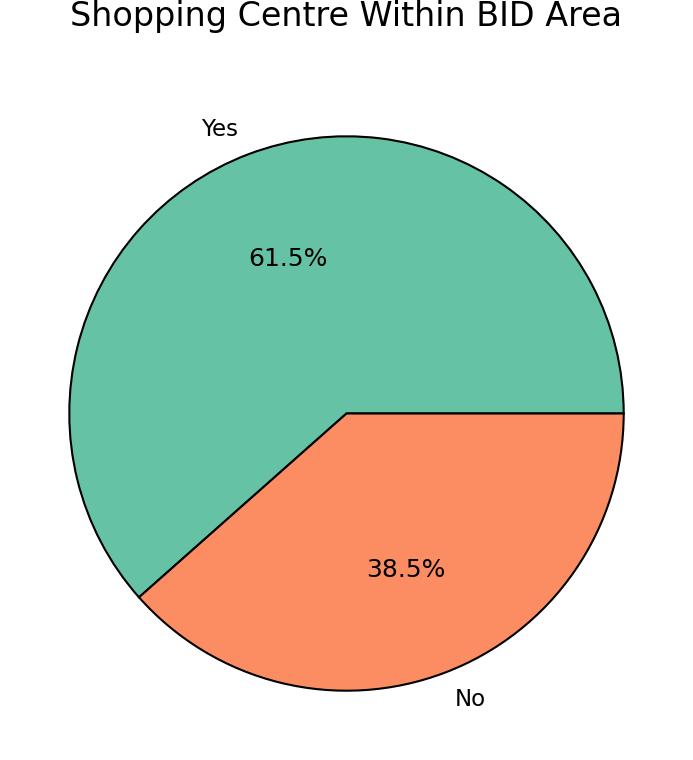
Over half of the respondents have a shopping centre located within their BID area.
Of those that do, 75% said they have either a ‘Good’ or ‘Excellent’ relationship with the Shopping Centre(s) in their area.
Vacancy rates were higher than anticipated, with an average of 27.75% within local shopping centres. This ranged from 5% at the lowest to 60% at the higher end.
The overall vacancy rates for BID areas were much lower at an average of 14.58%, just over half of the vacancy rate within shopping centres.
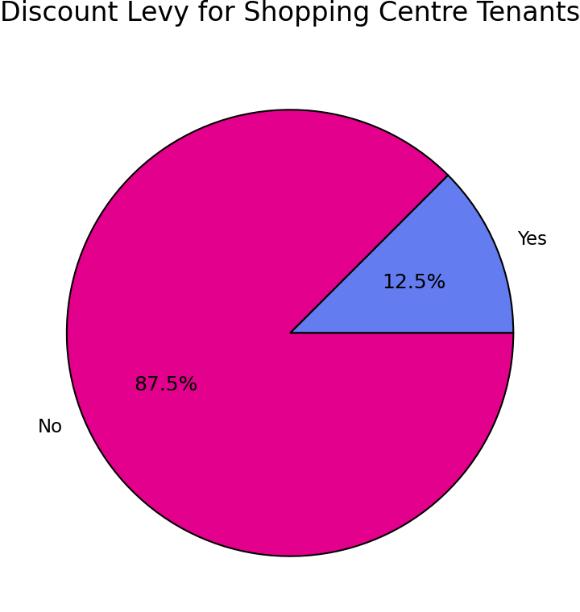
The overwhelming majority of BIDs that have shopping centres in their area do not oer a discount on the BID levy to hereditaments within the centres.
Section 5 – Car Parking & Transport
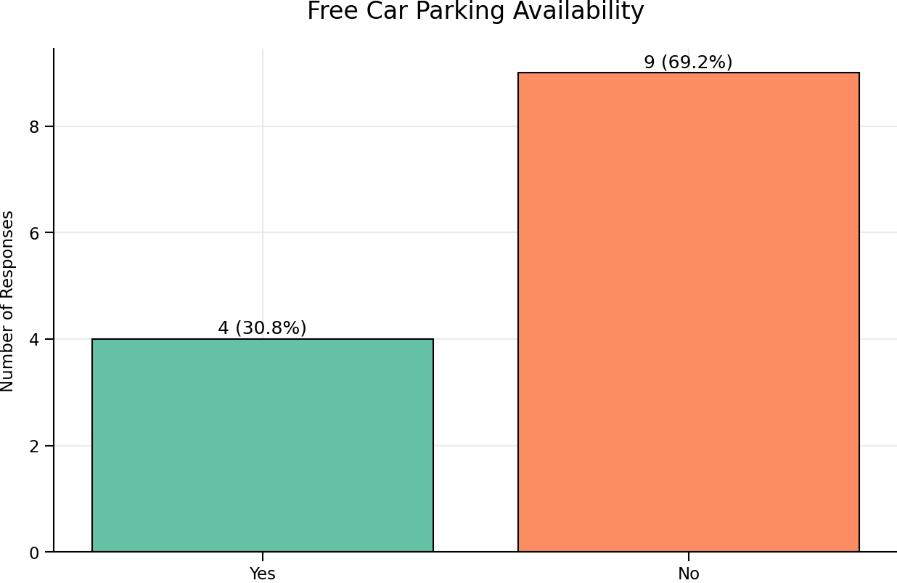
Only 30.8% of respondents said free car parking was available in their BID area, and this was either on-street parking (oered all year round) or temporary free parking provided in December on the run up to Christmas.
No BID said permanent free parking was oered in traditional Council car parks in their area.
38.5% of respondents said they oered some kind of employee discounted parking or season tickets
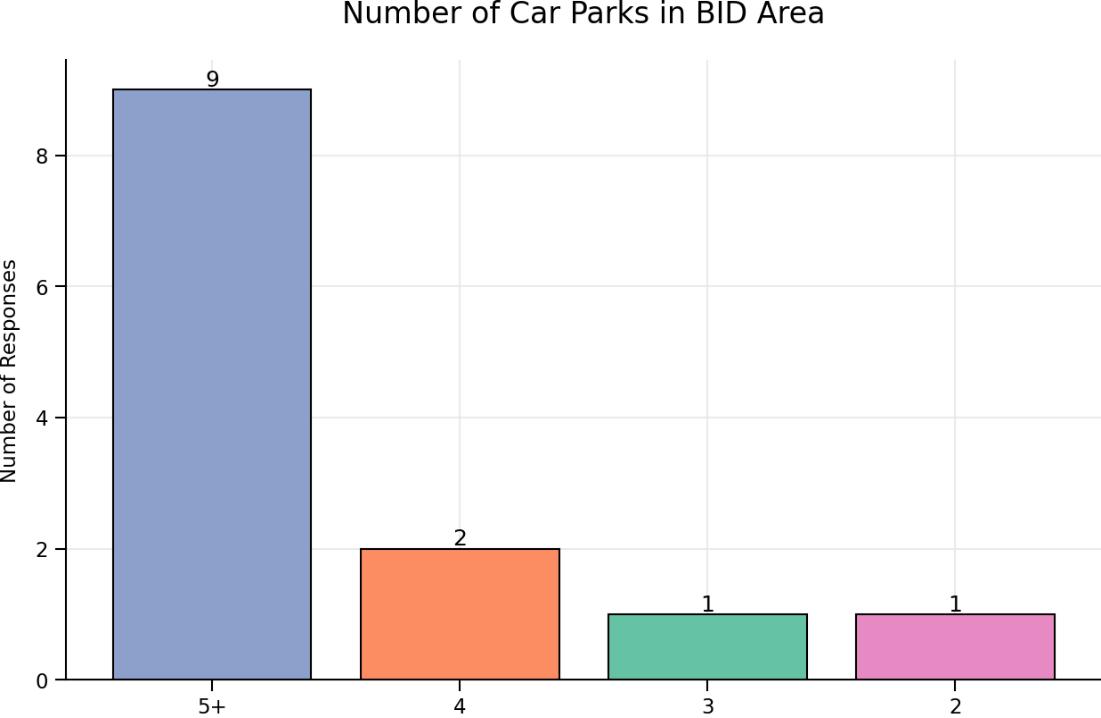
There doesn’t seem to be any shortage of parking in BID areas with most respondents having at least four car parks within their BID.
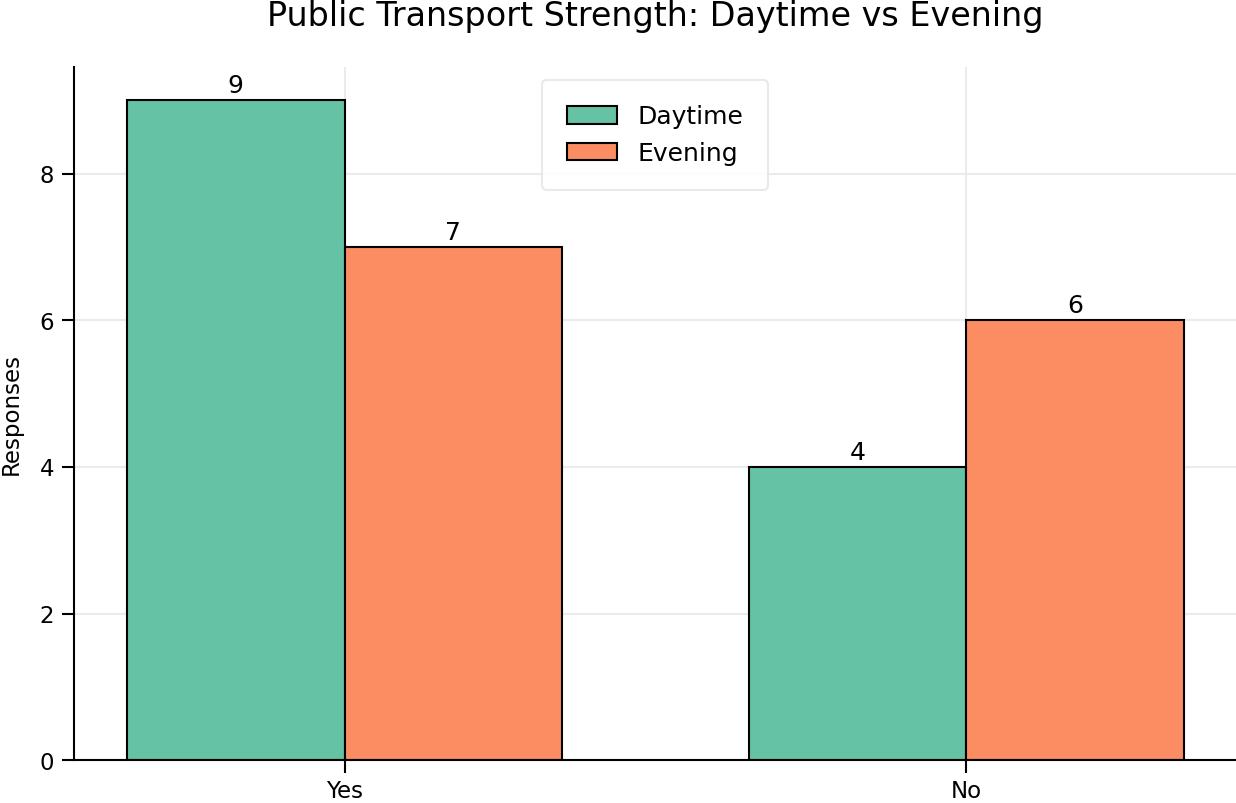
69% of respondents said they considered their daytime transport links to be strong. However, this reduced to 53% in the evening, possibly causing knock on eects for the Evening Economy.
Section 6 – Anchor Stores
There was a broad mix of anchor stores across the BID areas that completed the survey with most of the usual retail heavyweights and supermarkets cropping up.
When asked which anchor stores had left in the past three years, answers included McDonald’s, TK Maxx, Poundland, Barclays, Homebase, Costa, New Look and Claire’s. Marks & Spencer, House of Fraser, Wilko and Debenhams were common answers due to either national closures or the business closing down.
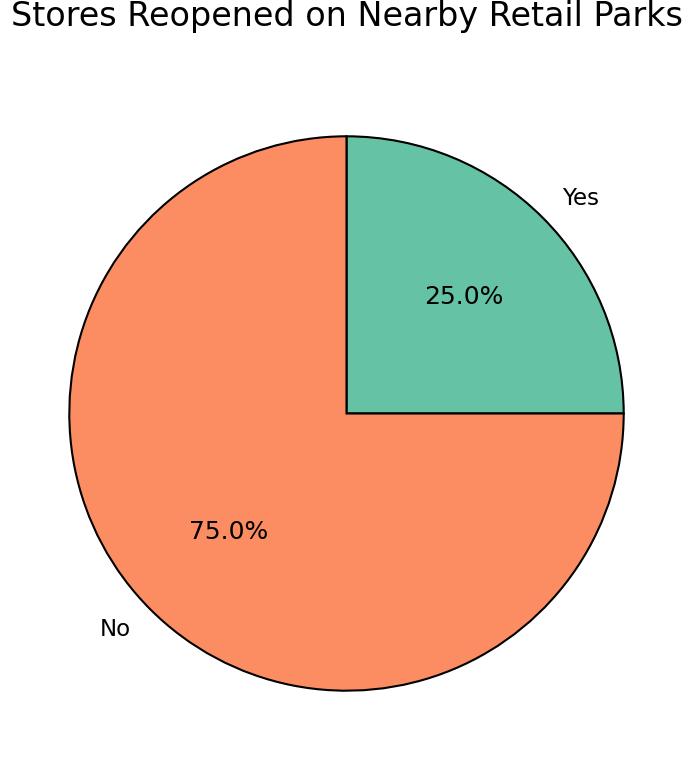
Only 25% of the anchor stores that closed in BID areas moved to nearby retail parks.
This may be largely down to a large percentage of the anchor stores closing due to the company as a whole going into administration/liquidation.
Section 7 – Evening Economy
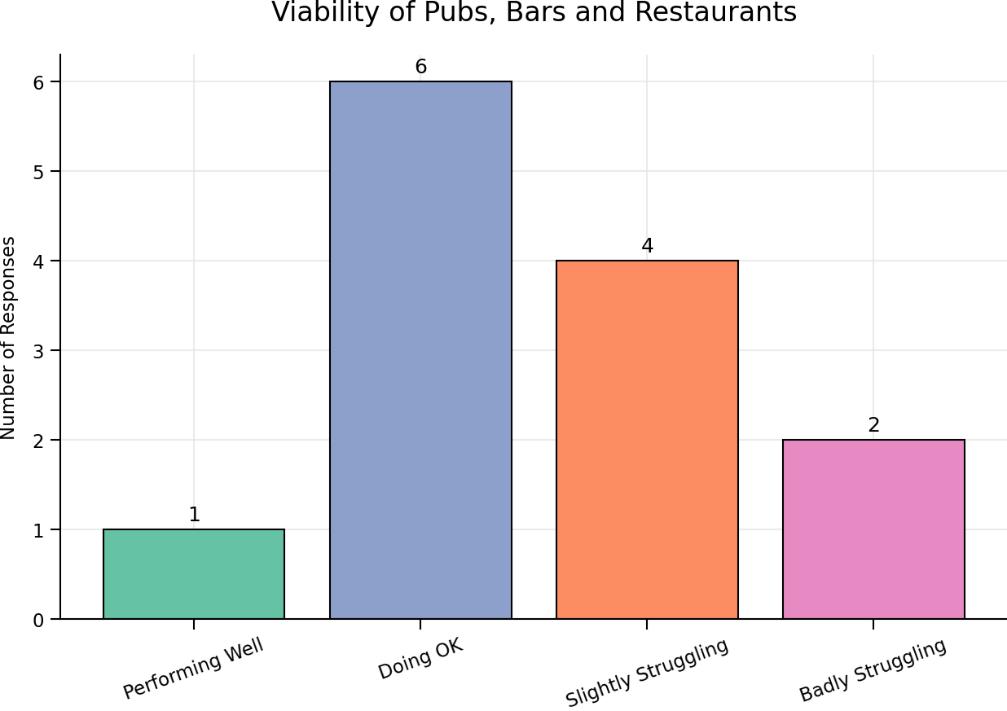
Respondents painted a mixed picture when asked how pubs, bars and restaurants in their BID areas were performing.
Only 7.7% said their businesses were performing well with 46% saying they were ‘Doing OK’ and a further 46% either slightly or badly struggling.
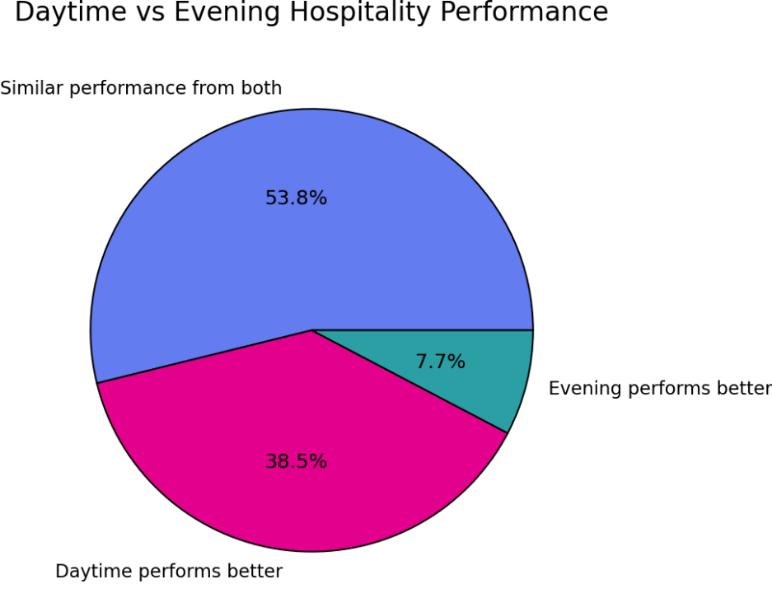
Hospitality, in general, performed either beer in the daytime or similarly in the day and evening.
Only 7.7% of respondents said their evening hospitality businesses performed beer than their daytime counterparts.
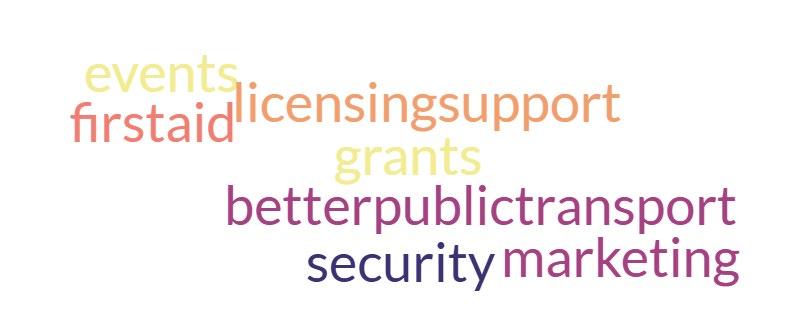
When asked what the Hospitality sector asks for help with the most from their BID, there were a few common themes with Marketing and Security being the most common answers.
Marketing, Live Music and Participating in BID events were the three main things that were pointed out as projects/services provided by the BID that most benefited Hospitality levy payers.
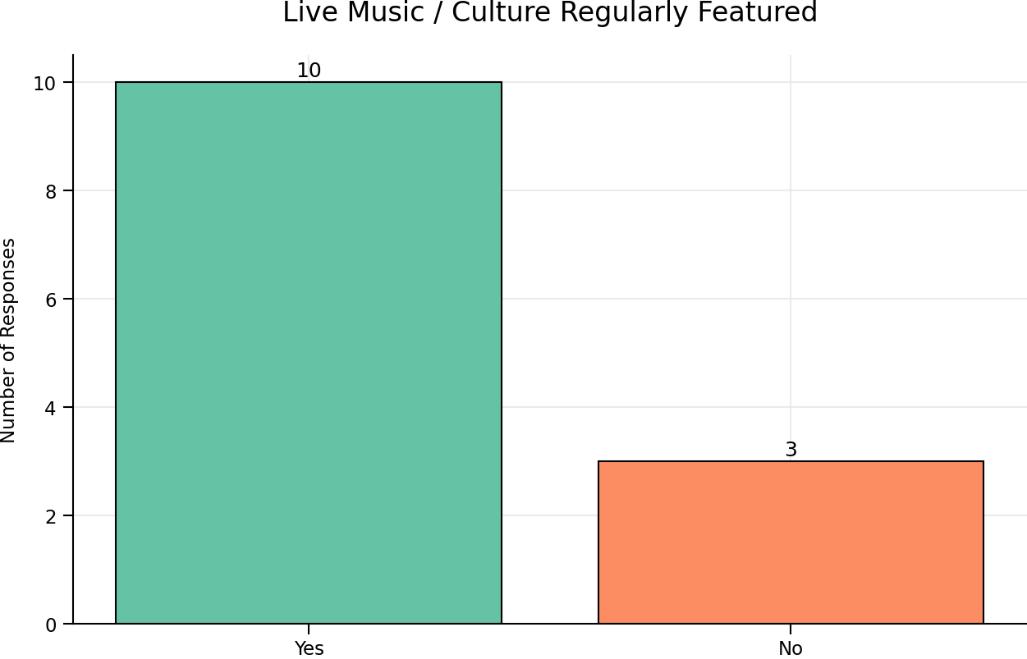
77% of respondents said their Hospitality businesses regularly featured Live Music / Performances / Cultural events.
Section 8 – Residential
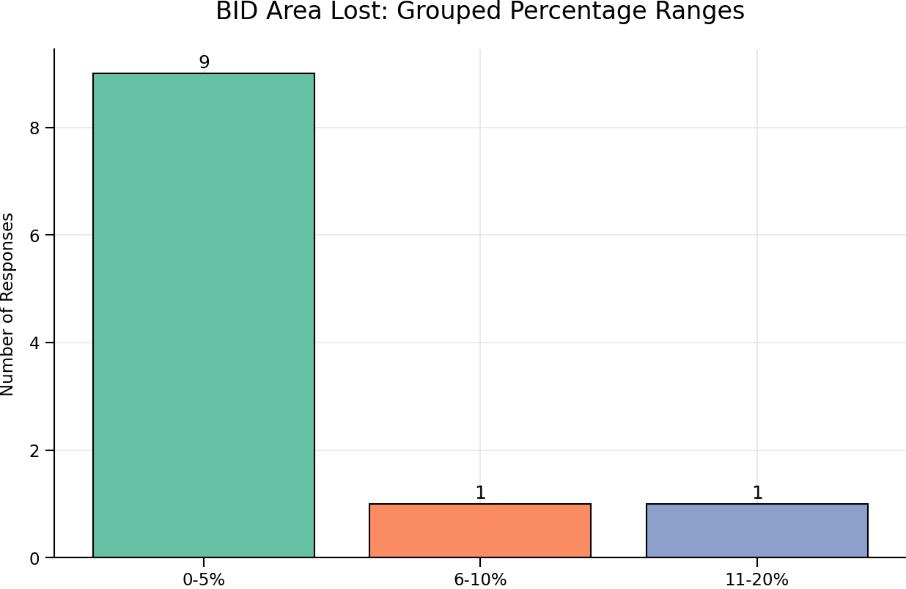
Among respondents, the average percentage of BID areas lost to residential development or planned future development was 5.67%
61.5% of BIDs think having residential areas within your BID do indeed bring in regular footfall and loyalty spend
Section 9 – Cleaning
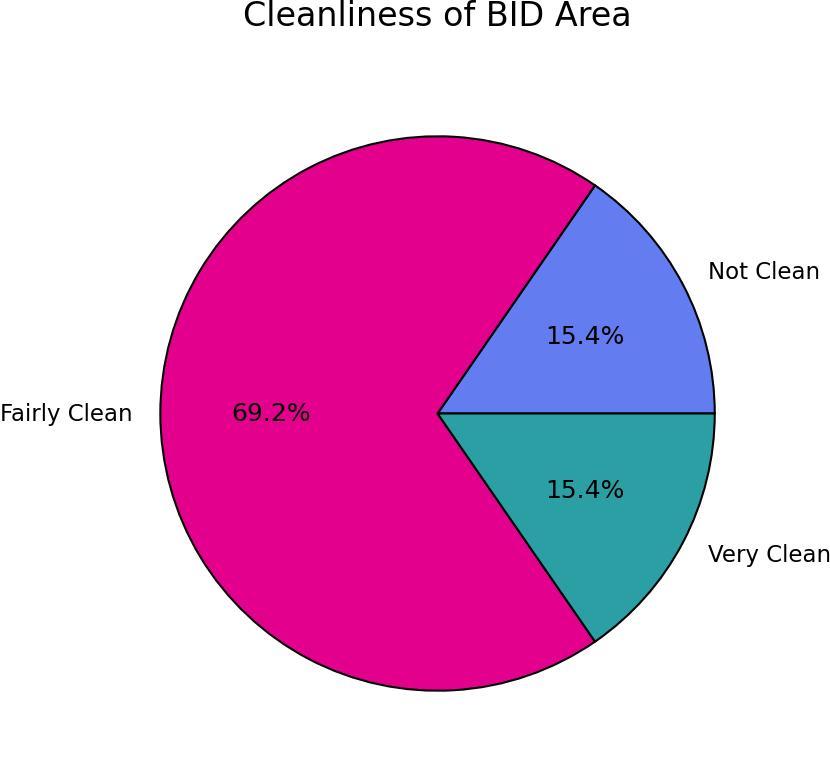
The vast majority of respondents said their BID area is either ‘Fairly Clean’ or ‘Very Clean’.
46% of BIDs said they invested in cleaning themselves with an average annual spend of £35,250.
All of the BIDs that invest in cleaning said they funded jet washing of pavements, with 83% also removing chewing gum.
Section 10 – BID Visibility
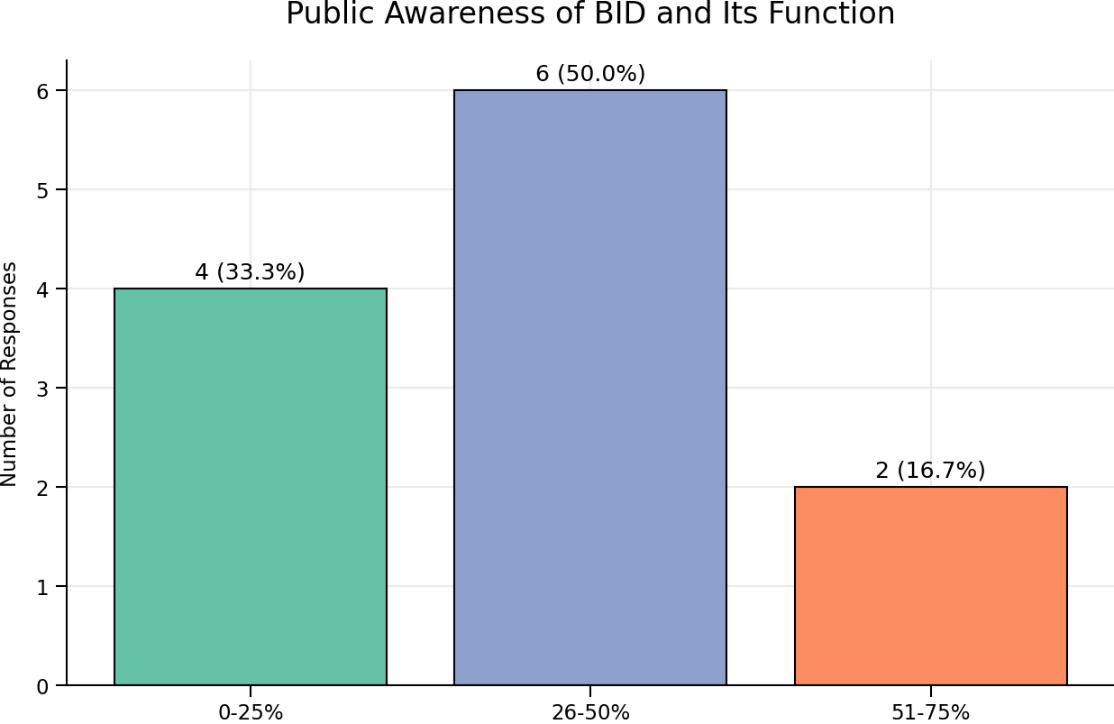
When it comes to the general public’s awareness of BIDs and their function, it looks like there is work to be done.
Only 16.7% of respondents think at least half of the local public know about the BID and what they do with 33% of BIDs thinking less than a quarter of people were aware.
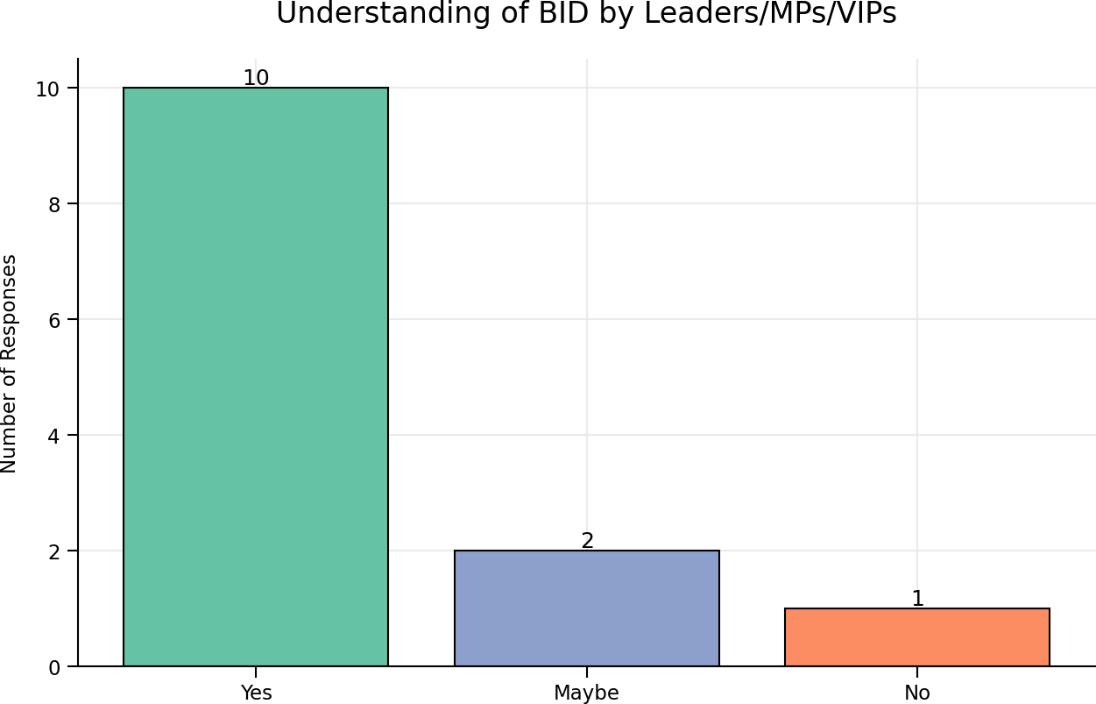
This percentage, however, greatly improves when pertaining to just understanding from the BID’s local Member of Parliament / Council Leaders / local VIPs.
54% of respondents, meanwhile, think the Government do not consider the impact of BIDs when working on town centre support and economy.
Section 11 – Oice Sector
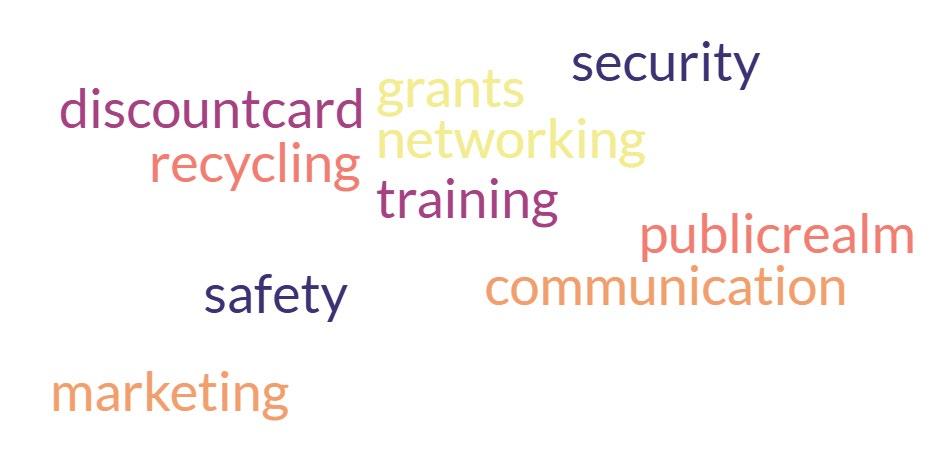
Respondents replied with a number of dierent answers when asked which services they provided to the Oice Sector were most valued. However, the most common answers were Marketing, Safety/Security and Training.
When it comes to communicating with the Oice Sector, most BIDs said they used e-mails to engage, using a mix of direct e-mail and e-newsleers. Other ways included WhatsApp, Social Media and in person visits.
Section 12 – Events & Festivals
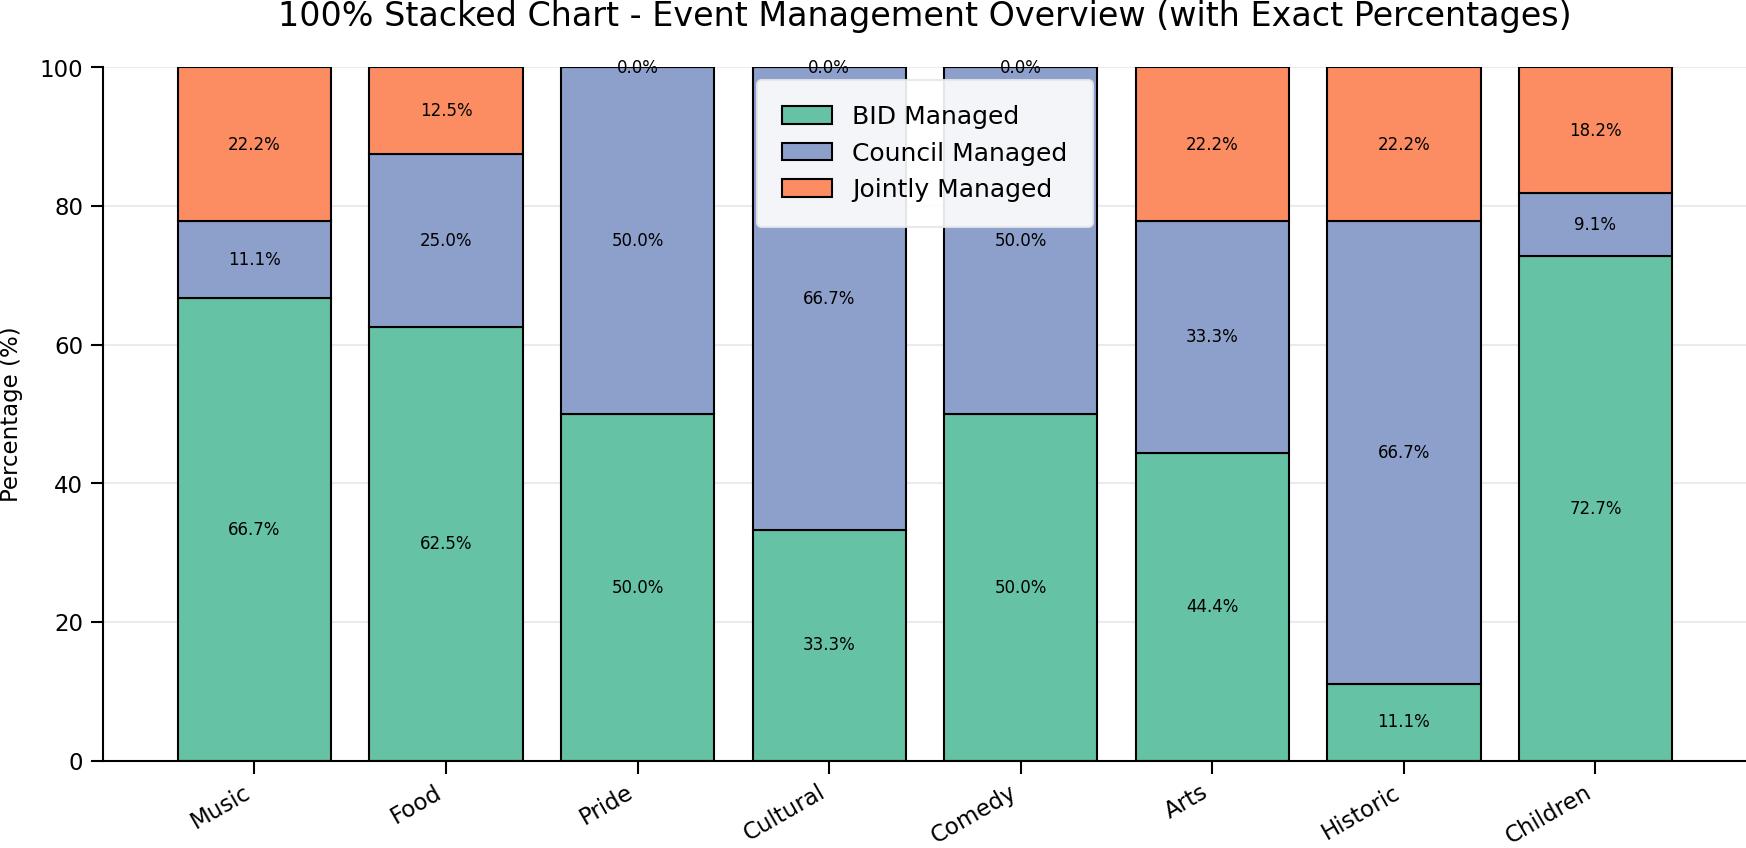
Respondents were asked about a variety of dierent popular Event & Festival types and whether these were managed by the BID or local Council.
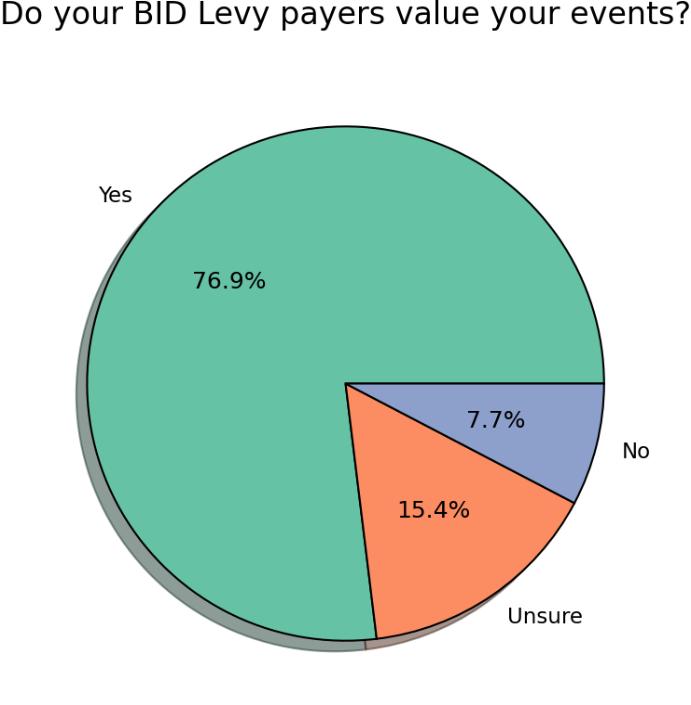
Respondents overwhelmingly answered that their BID levy payers valued the events they put on.
BIDs also outlined that their levy payers do, on the whole, get involved in the Events and Festivals through a variety of dierent ways including having stands/stalls at events, staying open later during events, themed/exclusive oers and direct sponsorship of events.
Section 13 – Place Shaping
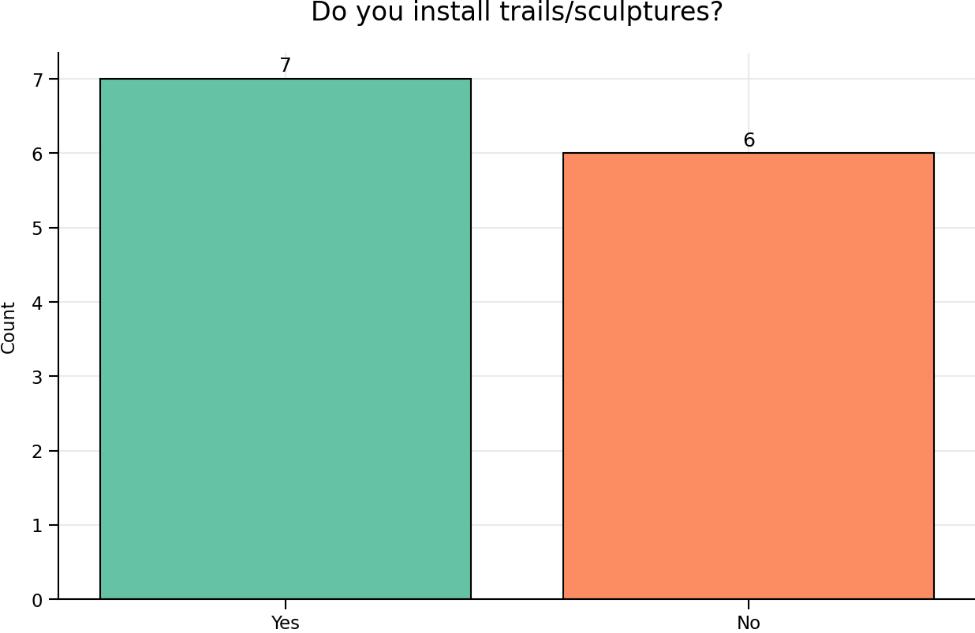
53.9% of respondents said they installed trails/sculptures into their BID Area.
Examples of trails given were Owls, Bears and Wild in Art. Success was usually measured by the amount of participants as well as social media engagement.
53.9% of BIDs surveyed said they had managed a Place Shaping project and changed the Public Realm in their area.
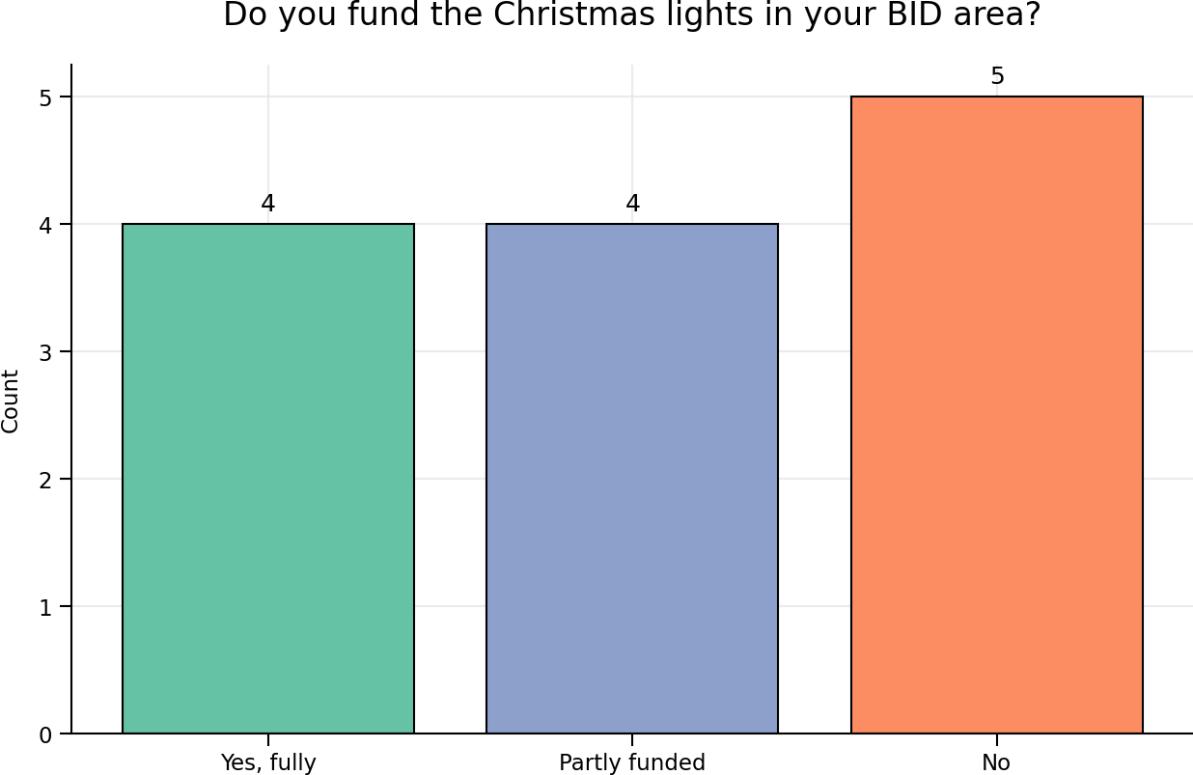
61.5% of respondents said that they either fully fund or party fund the Christmas lights in their BID area.
Of those, there was a 50/50 split between lights being owned by the BID/Council and being rented from a specialist company (those mentioned included LITE Ltd, Wyrley Mechanical, Field and Lawn, Gala Lights and Festive Lights).
The average annual spend of those BIDs that either help fund or completely fund lights was £28,000.
Section 14 – Marketing
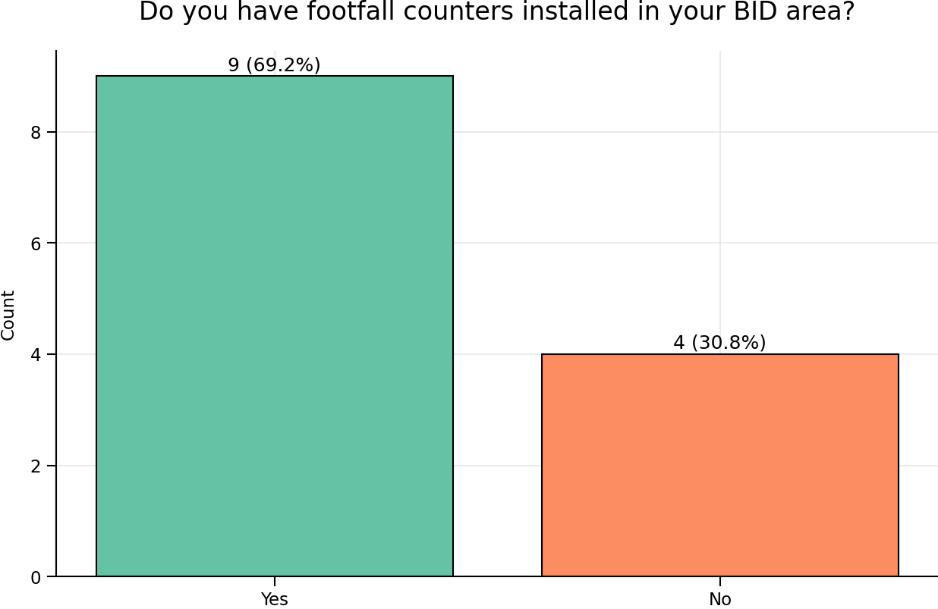
The majority of respondents, 69.2%, have footfall counters installed in their BID area.
Of those that have them, 78% were paid for by the BID.
Footfall counter suppliers used include: PFM, MRI Software, Proximity Futures and Huq.
All respondents said that they produced a newsleer for their BID levy payers with 30% of those also producing a newsleer for the general public.
However, only 23% of BIDs said they created a magazine to advertise their BID area.
69% of respondents employ somebody directly to manage their BID social media platforms.
BIDs had an average social media following of 14,926.
Social media platforms posted on (count of BIDs)
Do you employ someone to manage your social media accounts?
The Meta platforms (Instagram and Facebook) are used by every BID that completed the survey with TikTok and LinkedIn used by just under half.
When asked to rate their own BID’s social media function out of 10, the average score given was 7.46. When asked how they would rate their local Council’s social media function, this score reduced to 3.69.
85% of respondents said their BID website was regularly kept up to date.
Section 15 – Green
Only 38.46% of respondents said they had managed a Sustainability project within their BID area. These projects included Safer Travel Campaigns, Hanging Basket Installation and Recycling Schemes
61.5% of respondents said they paid for planters/hanging baskets in their BID area.
75% of those that pay for hanging baskets also have to pay for their watering.
The average annual spend in this area is £10,400.
Section 16 – Other
your team trained in First Aid? Does your BID… (Yes vs No)
69% of respondents said their BID area was considered a wheelchair friendly/accessible area while the same amount said that they were involved with volunteers in their area.
61%, meanwhile, said their BID team had been First Aid trained and that their BID had done work on improving support for mental health/disabilities.
We asked BIDs what their levy payers would say if they were asked what they associate with their local BID.
As you might expect, the most common answers were Security/Wardens and Events/Festivals.
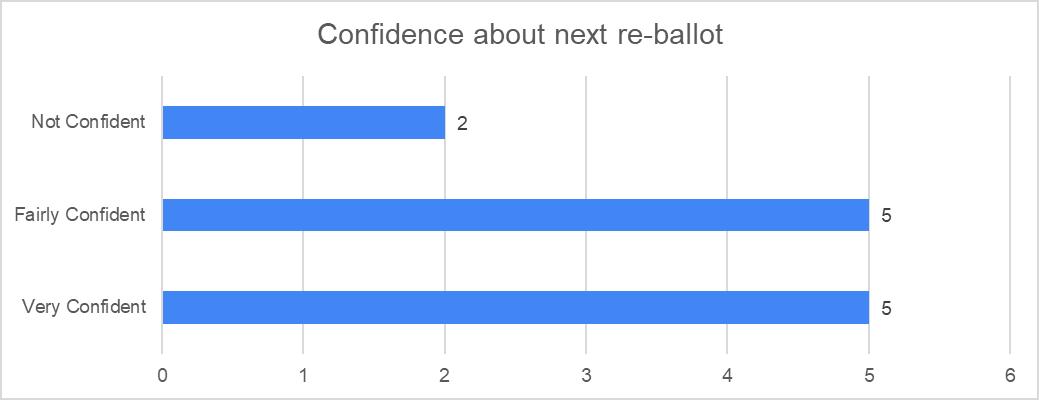
83.3% of respondents were either ‘Fairly Confident’ or ‘Very Confident’ about their next BID reballot.
The BIDs asked tended to use consultants when it comes to the re-ballot process. Those used include Julie Grail, Lisa Gibbs, Heartflood and Mosaic.