


This week the median list price for Portland, OR 97219 is $725,000 with the market action index hovering around 39. This is about the same as last month's market action index of 39 Inventory has decreased to 113
Market Action Index
This answers “How’s the Market?” by comparing rate of sales versus inventory
Real-Time Market Profile
Median List Price $725,000
Price of New Listings $525,000 Per Square Foot $335
Days on Market 110
Slight Seller's Advantage
Market Narrative
In the last few weeks the market has achieved a relative stasis point in terms of sales to inventory However, inventory is sufficiently low to keep us in the Seller’s Market zone so watch changes in the MAI If the market heats up, prices are likely to resume an upward climb
Market Segments
Slight Seller's Advantage
Each segment below represents approximately 25% of the market ordered by price
Median List Price
Again this week we see prices in this zip code remain roughly at the level they’ve been for several weeks. Since we’re significantly below the top of the market, look for a persistent up-shift in the Market Action Index before we see prices move from these levels.
Segments
In the quartile market segments, we see prices in this zip code have generally settled at a plateau, although Quartile 1 has been trending a bit downward in recent weeks. We'll need to see a persistent shift in the Market Action Index before we see prices across the board move from these levels.
Price Per Square Foot
The market plateau is seen across the price and value. The price per square foot and median list price have both been reasonably stagnant. Watch the Market Action Index for persistent changes as a leading indicator before the market moves from these levels. 7-Day
Inventory has been relatively steady around these levels in recent weeks.
Market Action Index
In the last few weeks the market has achieved a relative stasis point in terms of sales to inventory. However, inventory is sufficiently low to keep us in the Seller’s Market zone so watch changes in the MAI. If the market heats up, prices are likely to resume an upward climb.
Not surprisingly, all segments in this zip code are showing high levels of demand. Watch the quartiles for changes before the whole market changes. Often one end of the market (e.g. the highend) will weaken before the rest of the market and signal a slowdown for the whole group.
Median Days on Market (DOM)
The properties have been on the market for an average of 96 days. Half of the listings have come newly on the market in the past 57 or so days. Watch the 90-day DOM trend for signals of a changing market.
Segments
It is not uncommon for the higher priced homes in an area to take longer to sell than those in the lower quartiles.


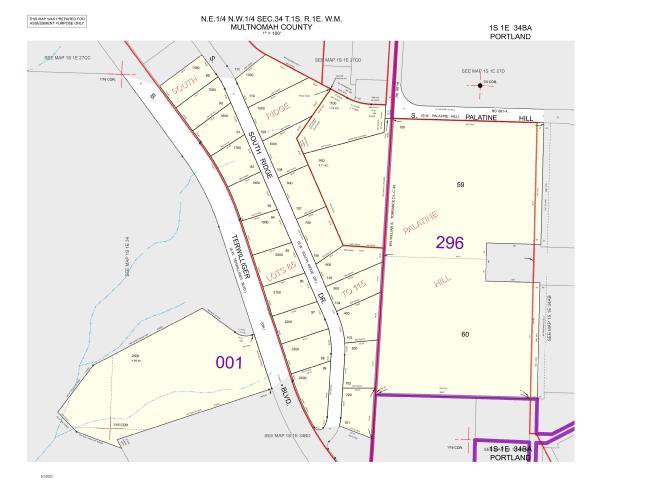
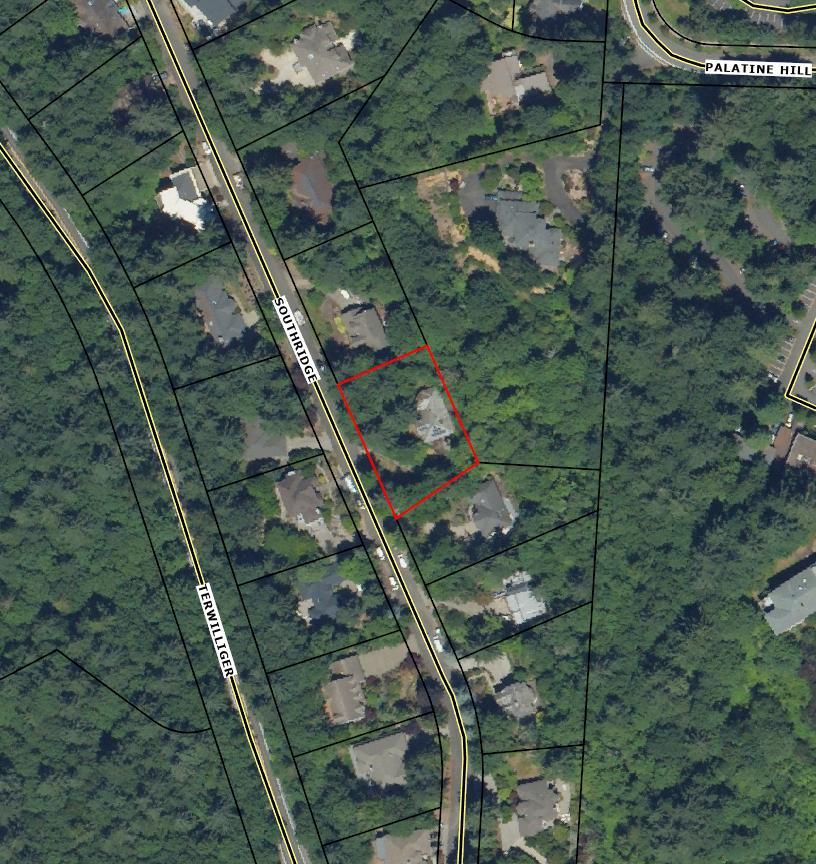
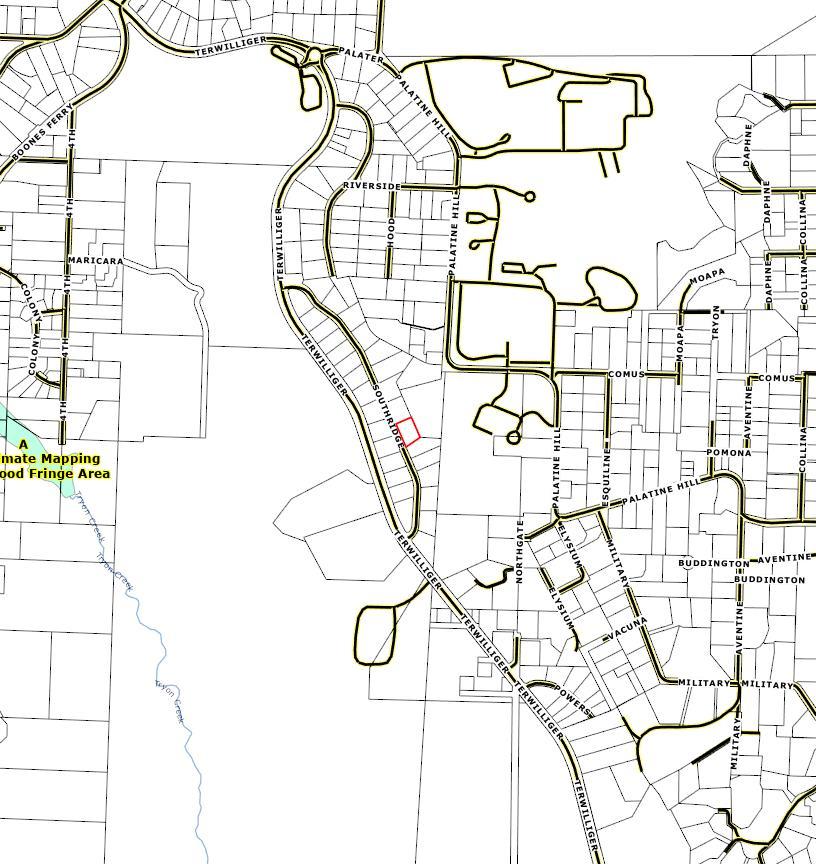
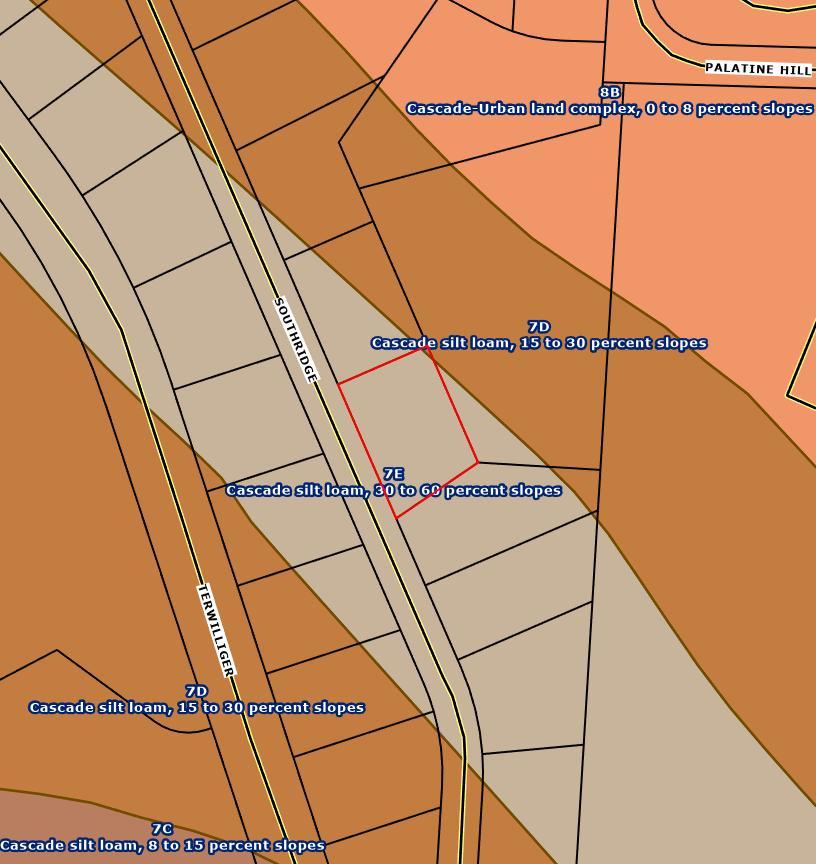
· Property Information
· Area Maps
· Neighborhood Information
· School Information
· Utilities
· Title & Escrow


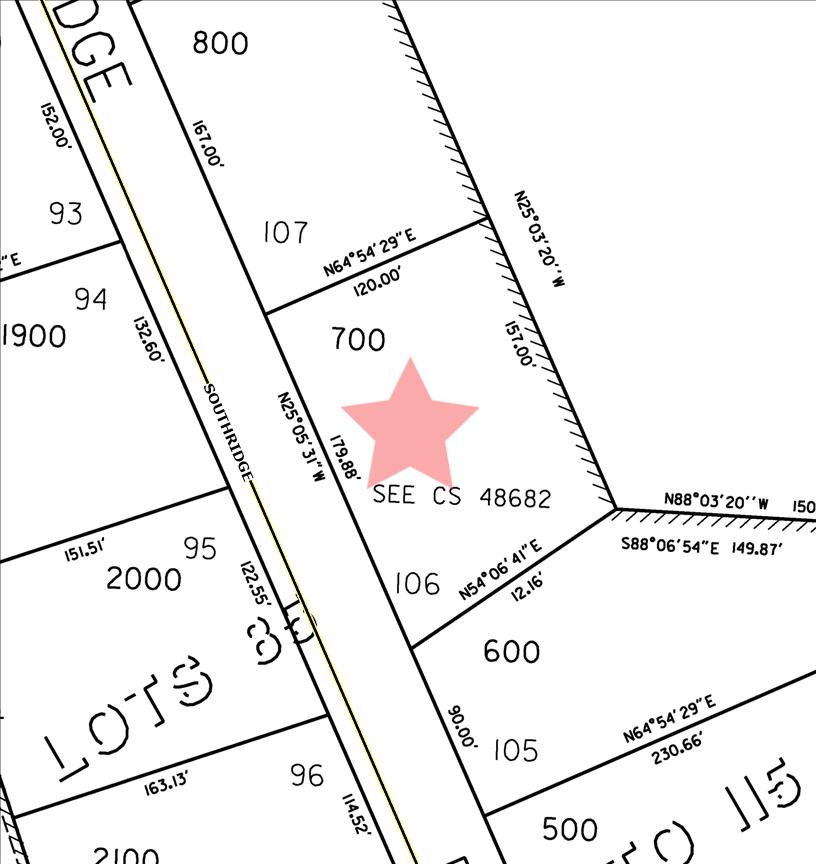
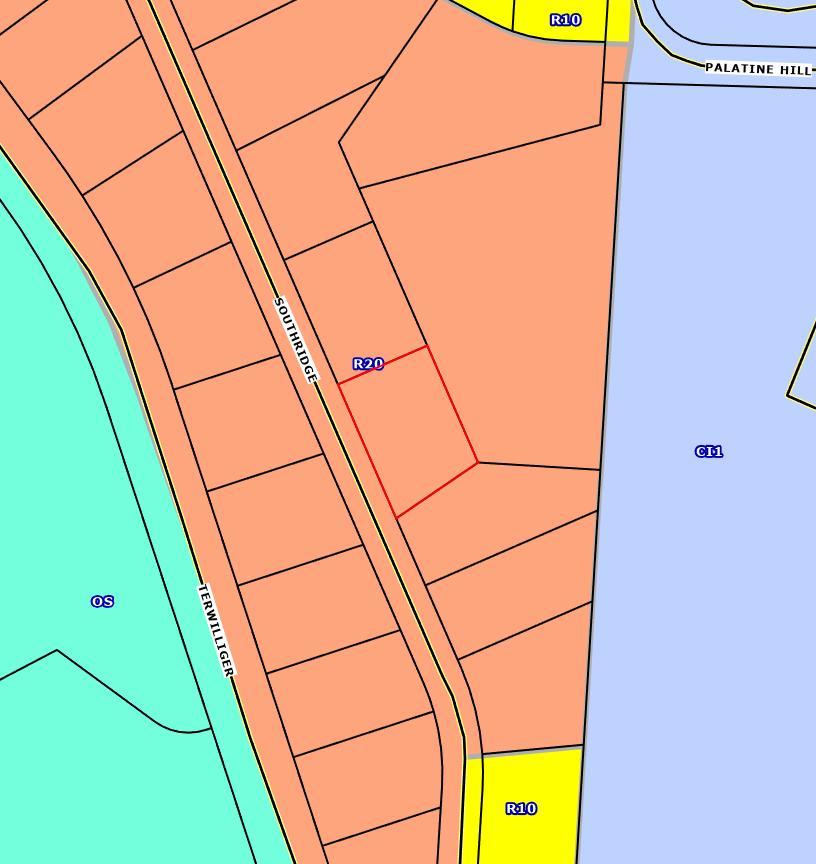
This map/plat is being furnished as an aid in locating the herein described Land in relation to adjoining streets, natural boundaries and other land, and is not a survey of the land depicted. Except to the extent a policy of title insurance is expressly modified by endorsement, if any, the Company does not insure dimensions, distances, location of easements, acreage or other matters shown thereon.