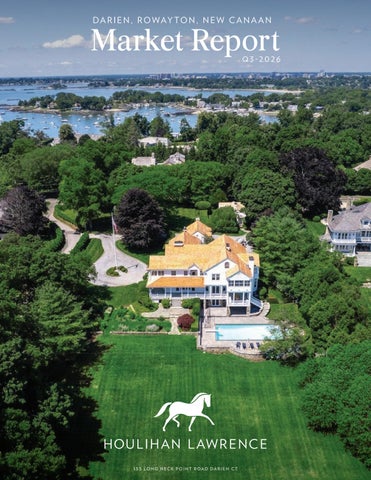
D A R I E N , R O W AY T O N , N E W C A N A A N
Market Report
Q3-2026
1 5 5 L O N G N E C K P O I N T R O A D DA R I E N C T
R E A L E S TAT E T R A N S A C T I O N S A R E B U I LT O N T R U S T. W E ’ V E B E E N B U I L D I N G R E L AT I O N S H I P S N O R T H O F N YC S I N C E 1 8 8 8 .
914.220.7000
•
H O U L I H A N L A W R E N C E .C O M
Source . OKMLS, GMLS, CGNDMLS, SMARTMLS, 1/1/25. 12/31/25, Total Volume Sold by company, Single Family, Westchester, Putnam, Dutchess, Columbia and Fairfield Counties combined.
Q3-2026 MARKET REPORT
EXECUTIVE SUMMARY
The third quarter brought continued momentum to the real estate markets across Darien, New Canaan, and Rowayton. Our communities continue to attract robust demand from buyers drawn to the area’s homes, community, and proximity to New York City. Across all three markets, home values trended higher compared with last year, while limited inventory continued to shape the competitive landscape. Although the number of homes sold in Darien declined slightly, homes continued to move quickly, with days on market declining across all three communities. New Canaan and Rowayton experienced particularly notable decreases in days on market, underscoring strong buyer interest and demand for well-positioned homes. While conditions and buyer behavior can vary from town to town, strategic pricing, thoughtful presentation, and an understanding of what today’s buyers are seeking remain essential to achieving strong results. At Houlihan Lawrence, we bring a local perspective to every market, combining deep knowledge of the communities we serve with a close understanding of the data. As conditions evolve, the value of experience and informed guidance remains constant. We are honored to be a trusted resource for our clients, helping them navigate every move with clarity and confidence.
With Warm Regards, Liz Nunan President and CEO
DARIEN
QUARTERLY MARKET OVERVIEW
HOMES SOLD
Q3 2026
Q3 2025
% CHANGE
YTD 2026
YTD 2025
% CHANGE
80
87
-8.0%
177
189
-6.3%
AVERAGE SALE PRICE
$3,477,775 $2,819,249
23.4%
$3,243,748 $2,831,500
14.6%
MEDIAN SALE PRICE
$2,937,500 $2,383,455
23.2%
$2,950,000 $2,450,000
20.4%
AVERAGE PRICE PER SQUARE FOOT
$826
$714
15.7%
$820
$737
11.3%
AVERAGE DAYS ON MARKET
27
28
-3.6%
24
25
-4.0%
% SALE PRICE TO LIST PRICE
103.4%
103.7%
-0.3%
105.4%
104.9%
0.5%
$1,929,797 $2,020,720 $2,450,673
$2,531,184
TEN-YEAR MARKET HISTORY
Average Sale Price
$1,676,743 $1,603,743
$1,537,069 $1,655,525
$2,908,015 $3,243,748 Average Sale Price
Average Price/SqFt
$476
$458
$429
$446
$505
$567
$640
$672
$748
$820
Average Price/SqFt
Days On Market
126
122
147
124
70
41
40
33
27
24
Days On Market
%Sale Price to List Price
95.5%
94.7%
94.0%
96.3%
99.4%
102.7%
99.3%
102.9%
104.1%
105.4%
* Homes sold for 2026 are annualized based on actual sales year-to-date. HOULIHANLAWRENCE.COM
%Sale Price to List Price
DARIEN SUPPLY/DEMAND ANALYSIS AS OF SEPTEMBER 30, 2026
AS OF SEPTEMBER 30, 2025
2026 vs. 2025
SUPPLY: ACTIVE LISTINGS
DEMAND: PENDING SALES
SUPPLY/ DEMAND RATIO*
SUPPLY: ACTIVE LISTINGS
DEMAND: PENDING SALES
SUPPLY/ DEMAND RATIO*
% CHANGE IN LISTINGS
% CHANGE IN PENDINGS
$0 - $499,999
0
0
Not Valid
0
0
Not Valid
0.0%
0.0%
$500,000 - $699,999
0
0
Not Valid
0
0
Not Valid
0.0%
0.0%
$700,000 - $999,999
0
0
Not Valid
3
2
2
-100.0%
-100.0%
$1,000,000 - $1,499,999
3
1
3
2
4
1
50.0%
-75.0%
$1,500,000 - $1,999,999
3
4
1
7
2
4
-57.1%
100.0%
$2,000,000 - $2,499,999
3
3
1
1
3
1
200.0%
0.0%
$2,500,000 - $2,999,999
1
1
1
4
3
1
-75.0%
-66.7%
$3,000,000 - $3,999,999
7
4
2
6
0
Not Valid
16.7%
0.0%
PRICE RANGE
$4,000,000 and up
12
1
12
11
1
11
9.1%
0.0%
Market Totals
29
14
2
34
15
2
-14.7%
-6.7%
*Supply Demand Ratio Key 1-4: High Demand 5-6: Balanced 7-9: Low Demand 10+: Very Low Demand
SOLD PROPERTIES YEAR-TO-DATE
PRICE RANGE
01/01/2026 09/30/2026
YEAR-OVER-YEAR
01/01/2025 09/30/2025
% CHANGE 2026/2025
10/01/2025 09/30/2026
$0 - $499,999
0
0
Not Valid
0
$500,000 - $699,999
0
1
-100.0%
$700,000 - $999,999
3
7
-57.1%
$1,000,000 - $1,499,999
10
22
$1,500,000 - $1,999,999
29
$2,000,000 - $2,499,999
22
$2,500,000 - $2,999,999
10/01/2024 09/30/2025
% CHANGE 2026/2025
0
Not Valid
0
1
-100.0%
6
14
-57.1%
-54.5%
17
30
-43.3%
37
-21.6%
36
45
-20.0%
32
-31.3%
26
38
-31.6%
30
23
30.4%
34
29
17.2%
$3,000,000 - $4,999,999
64
53
20.8%
73
63
15.9%
$5,000,000 and up
19
14
35.7%
22
16
37.5%
Market Totals
177
189
-6.3%
214
236
-9.3%
Source: Smart MLS, Darien, Single Family Homes, Sold
ROWAYTON
QUARTERLY MARKET OVERVIEW
HOMES SOLD
Q3 2026
Q3 2025
% CHANGE
YTD 2026
YTD 2025
% CHANGE
13
12
8.3%
37
38
-2.6%
AVERAGE SALE PRICE
$2,628,615 $2,005,416
31.1%
$2,670,100 $2,025,081
31.9%
MEDIAN SALE PRICE
$2,500,000 $1,675,000
49.3%
$2,500,000 $1,805,000
38.5%
AVERAGE PRICE PER SQUARE FOOT
$918
$675
36.0%
$970
$757
28.1%
AVERAGE DAYS ON MARKET
30
53
-43.4%
33
35
-5.7%
% SALE PRICE TO LIST PRICE
104.5%
101.2%
3.3%
106.3%
102.3%
3.9%
TEN-YEAR MARKET HISTORY
Average Sale Price
$1,376,170
$1,273,417
$1,276,696
$1,345,651
$1,774,299
$1,762,701
$1,910,960 $2,106,851
Average Price/SqFt
$454
$445
$439
$452
$548
$615
$649
$708
$762
$970
Average Price/SqFt
Days On Market
107
92
139
110
80
38
38
43
34
33
Days On Market
%Sale Price to List Price
95.1%
95.7%
95.3%
96.6%
99.3%
102.7%
103.3%
100.8%
102.5%
106.3%
* Homes sold for 2026 are annualized based on actual sales year-to-date. HOULIHANLAWRENCE.COM
$2,133,426 $2,670,100 Average Sale Price
%Sale Price to List Price
ROWAYTON SUPPLY/DEMAND ANALYSIS AS OF SEPTEMBER 30, 2026
AS OF SEPTEMBER 30, 2025
2026 vs. 2025
SUPPLY: ACTIVE LISTINGS
DEMAND: PENDING SALES
SUPPLY/ DEMAND RATIO*
SUPPLY: ACTIVE LISTINGS
DEMAND: PENDING SALES
SUPPLY/ DEMAND RATIO*
% CHANGE IN LISTINGS
% CHANGE IN PENDINGS
$0 - $499,999
0
0
Not Valid
0
0
Not Valid
0.0%
0.0%
$500,000 - $699,999
0
0
Not Valid
0
0
Not Valid
0.0%
0.0%
$700,000 - $999,999
1
0
Not Valid
0
0
Not Valid
0.0%
0.0%
$1,000,000 - $1,499,999
0
1
0
1
2
1
-100.0%
-50.0%
$1,500,000 - $1,999,999
0
0
Not Valid
1
3
1
-100.0%
-100.0%
$2,000,000 - $2,499,999
0
0
Not Valid
0
0
Not Valid
0.0%
0.0%
$2,500,000 - $2,999,999
1
1
1
2
1
2
-50.0%
0.0%
$3,000,000 - $3,999,999
0
3
0
3
2
2
-100.0%
50.0%
$4,000,000 and up
2
2
1
2
1
2
0.0%
100.0%
Market Totals
4
7
1
9
9
1
-55.6%
-22.2%
PRICE RANGE
*Supply Demand Ratio Key 1-4: High Demand 5-6: Balanced 7-9: Low Demand 10+: Very Low Demand
SOLD PROPERTIES YEAR-TO-DATE
PRICE RANGE
01/01/2026 09/30/2026
YEAR-OVER-YEAR
01/01/2025 09/30/2025
% CHANGE 2026/2025
10/01/2025 09/30/2026
10/01/2024 09/30/2025
% CHANGE 2026/2025
$0 - $499,999
0
0
Not Valid
0
0
Not Valid
$500,000 - $699,999
0
1
-100.0%
0
1
-100.0%
$700,000 - $999,999
2
5
-60.0%
3
6
-50.0%
$1,000,000 - $1,499,999
5
6
-16.7%
6
9
-33.3%
$1,500,000 - $1,999,999
5
8
-37.5%
7
13
-46.2%
$2,000,000 - $2,499,999
6
10
-40.0%
9
13
-30.8%
$2,500,000 - $2,999,999
5
2
150.0%
10
4
150.0%
$3,000,000 - $4,999,999
12
5
140.0%
15
8
87.5%
$5,000,000 and up
2
1
100.0%
2
2
0.0%
Market Totals
37
38
-2.6%
52
56
-7.1%
Source: Smart MLS, Rowayton, Single Family Homes, Sold
NEW CANAAN
QUARTERLY MARKET OVERVIEW
HOMES SOLD
Q3 2026
Q3 2025
% CHANGE
YTD 2026
YTD 2025
% CHANGE
73
70
4.3%
167
163
2.5%
AVERAGE SALE PRICE
$3,017,116 $3,080,600
-2.1%
$3,160,180 $2,956,315
6.9%
MEDIAN SALE PRICE
$2,650,000 $2,533,000
4.6%
$2,785,000 $2,550,000
9.2%
AVERAGE PRICE PER SQUARE FOOT
$635
$598
6.2%
$632
$586
7.8%
AVERAGE DAYS ON MARKET
26
35
-25.7%
49
40
22.5%
% SALE PRICE TO LIST PRICE
104.6%
101.8%
2.8%
103.7%
102.1%
1.6%
TEN-YEAR MARKET HISTORY
Average Sale Price
$1,713,201
$1,628,160
$1,426,812
$1,670,517
$1,995,193
$2,177,383
$2,240,384 $2,481,645 $3,032,342 $3,160,180 Average Sale Price
Average Price/SqFt
$355
$341
$316
$337
$400
$458
$474
$521
$591
$632
Average Price/SqFt
Days On Market
147
138
165
137
83
55
51
54
42
49
Days On Market
%Sale Price to List Price
94.0%
92.2%
92.8%
95.4%
99.1%
100.6%
99.6%
101.3%
101.2%
103.7%
* Homes sold for 2026 are annualized based on actual sales year-to-date. HOULIHANLAWRENCE.COM
%Sale Price to List Price
NEW CANAAN SUPPLY/DEMAND ANALYSIS AS OF SEPTEMBER 30, 2026
AS OF SEPTEMBER 30, 2025
2026 vs. 2025
SUPPLY: ACTIVE LISTINGS
DEMAND: PENDING SALES
SUPPLY/ DEMAND RATIO*
SUPPLY: ACTIVE LISTINGS
DEMAND: PENDING SALES
SUPPLY/ DEMAND RATIO*
% CHANGE IN LISTINGS
% CHANGE IN PENDINGS
$0 - $499,999
0
0
Not Valid
0
0
Not Valid
0.0%
0.0%
$500,000 - $699,999
0
1
0
0
1
0
0.0%
0.0%
$700,000 - $999,999
1
0
Not Valid
1
0
Not Valid
0.0%
0.0%
$1,000,000 - $1,499,999
3
3
1
2
2
1
50.0%
50.0%
$1,500,000 - $1,999,999
7
0
Not Valid
5
6
1
40.0%
-100.0%
$2,000,000 - $2,499,999
8
0
Not Valid
6
4
2
33.3%
-100.0%
$2,500,000 - $2,999,999
7
1
7
10
4
3
-30.0%
-75.0%
$3,000,000 - $3,999,999
6
3
2
9
4
2
-33.3%
-25.0%
PRICE RANGE
$4,000,000 and up
17
5
3
17
5
3
0.0%
0.0%
Market Totals
49
13
4
50
26
2
-2.0%
-50.0%
*Supply Demand Ratio Key 1-4: High Demand 5-6: Balanced 7-9: Low Demand 10+: Very Low Demand
SOLD PROPERTIES YEAR-TO-DATE
PRICE RANGE
01/01/2026 09/30/2026
YEAR-OVER-YEAR
01/01/2025 09/30/2025
% CHANGE 2026/2025
10/01/2025 09/30/2026
10/01/2024 09/30/2025
% CHANGE 2026/2025
$0 - $499,999
0
0
Not Valid
0
0
Not Valid
$500,000 - $699,999
0
0
Not Valid
0
1
-100.0%
$700,000 - $999,999
2
4
-50.0%
3
8
-62.5%
$1,000,000 - $1,499,999
10
14
-28.6%
15
19
-21.1%
$1,500,000 - $1,999,999
22
30
-26.7%
30
40
-25.0%
$2,000,000 - $2,499,999
32
27
18.5%
40
36
11.1%
$2,500,000 - $2,999,999
25
28
-10.7%
33
35
-5.7%
$3,000,000 - $4,999,999
58
45
28.9%
73
52
40.4%
$5,000,000 and up
18
15
20.0%
25
18
38.9%
Market Totals
167
163
2.5%
219
209
4.8%
Source: Smart MLS, New Canaan, Single Family Homes, Sold