
Q3-2025


Q3-2025
The real estate market in New Haven and Middlesex Counties presented a mixed picture in Q3 2025, shaped by contrasting trends in home sales, pricing, and buyer behavior. While some communities saw strong price growth and surging demand, others faced cooling momentum and shifting inventory levels, suggesting a market that is beginning to normalize after years of pandemic-fueled intensity.
Home sales were uneven across the region. In New Haven, transaction volume surged by over 40% compared to the same quarter last year, highlighting growing buyer interest and activity. However, this was not the norm across all towns. Communities like Branford, Woodbridge, and Milford experienced slight to moderate declines in sales this quarter, indicating a more measured pace and, in some cases, a response to affordability pressures or limited inventory.
Pricing trends remained positive overall, with New Haven and Woodbridge seeing particularly sharp increases in both average and median sale prices. Woodbridge recorded a nearly 29% jump in average price and a 38% increase in median price compared to Q3 2024, underscoring ongoing demand in higher-end submarkets. Even in towns where sales volume declined, such as Branford, prices remained elevated.
Buyer demand is still evident but showing signs of recalibration. In some areas such as Woodbridge, pending sales dropped. Despite this, many homes are still selling close to or above asking price, particularly in markets where listings remain tight. In New Haven, for example, the average sale-to-list ratio exceeded 105%, a clear signal of competitive bidding.
In summary, while the broader market in New Haven and Middlesex Counties remains fundamentally strong, Q3 data reflects the early signs of a balancing act. Price growth persists, but buyer activity is starting to level off in several towns. The fourth quarter will be telling, as both buyers and sellers adjust to evolving conditions and the potential for more stabilized pricing and pacing in 2026.
With Warm Regards,
Liz Nunan President and CEO

THIRD QUARTER 2025

ANSONIA BEACON FALLS BETHANY BRANFORD
CHESHIRE DERBY EAST HAVEN GUILFORD
HAMDEN MADISON MERIDEN MIDDLEBURY MILFORD NAUGATUCK NEW HAVEN NORTH BRANFORD
THIRD QUARTER 2025

DEEP RIVER DURHAM EAST HADDAM
EAST HAMPTON ESSEX HADDAM
KILLINGWORTH MIDDLEFIELD MIDDLETOWN
OLD SAYBROOK PORTLAND WESTBROOK


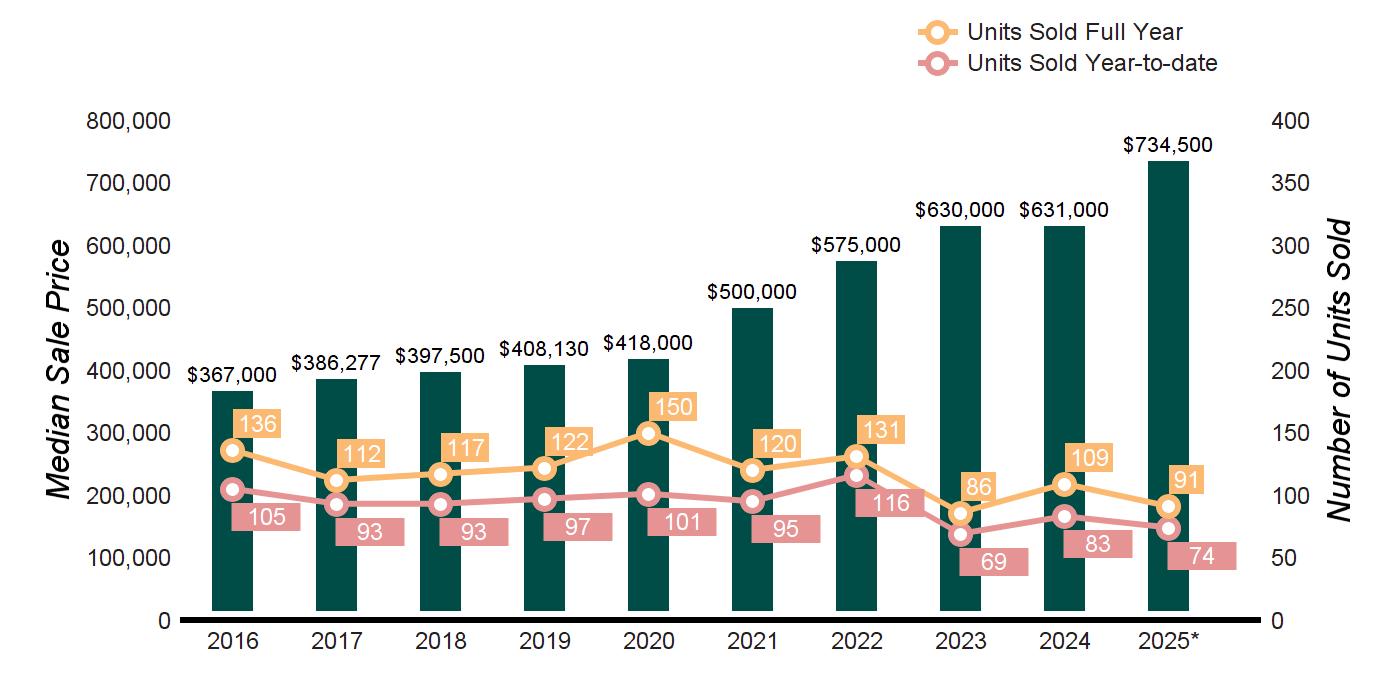
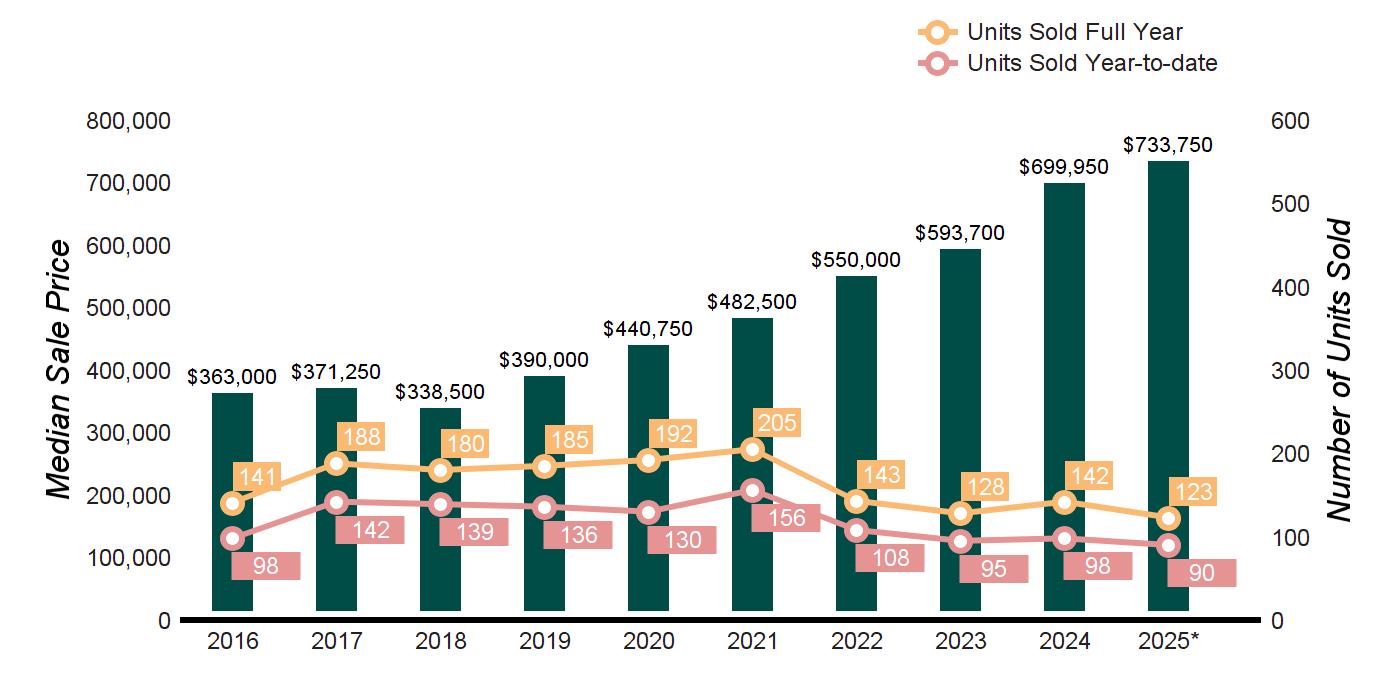
MARKET HISTORY
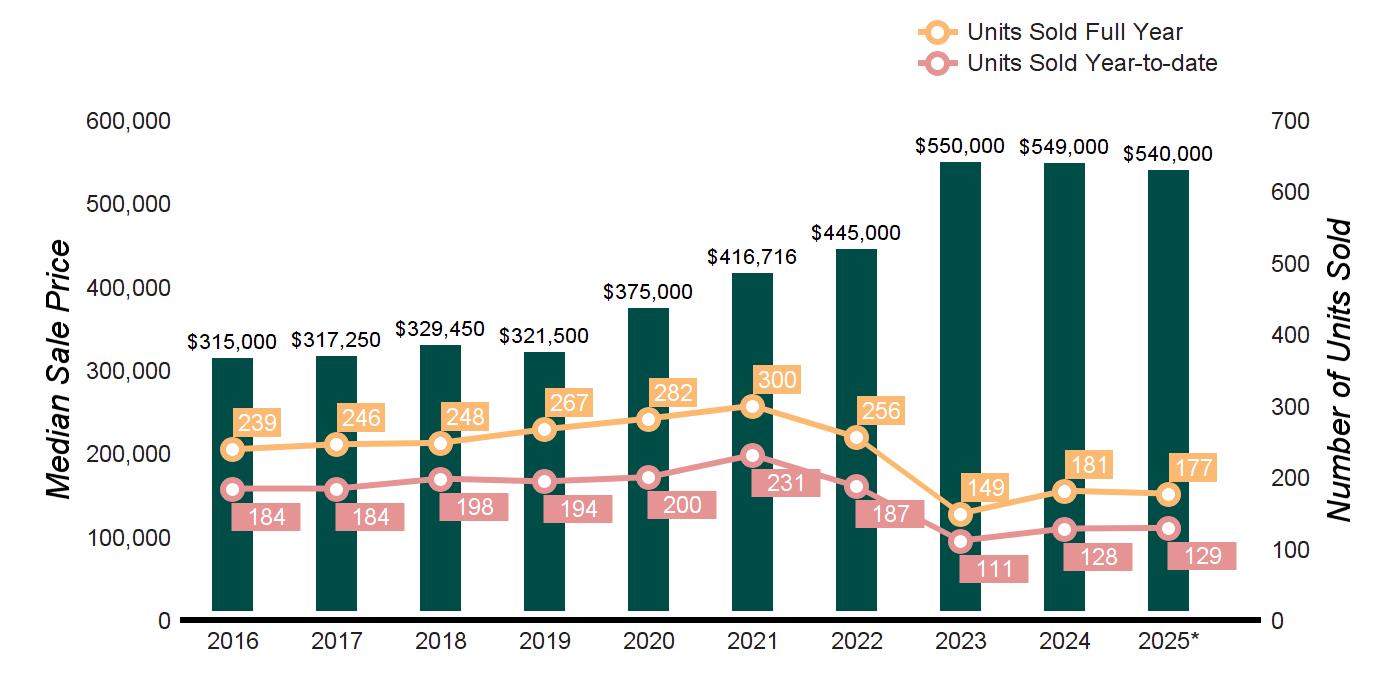

MARKET HISTORY
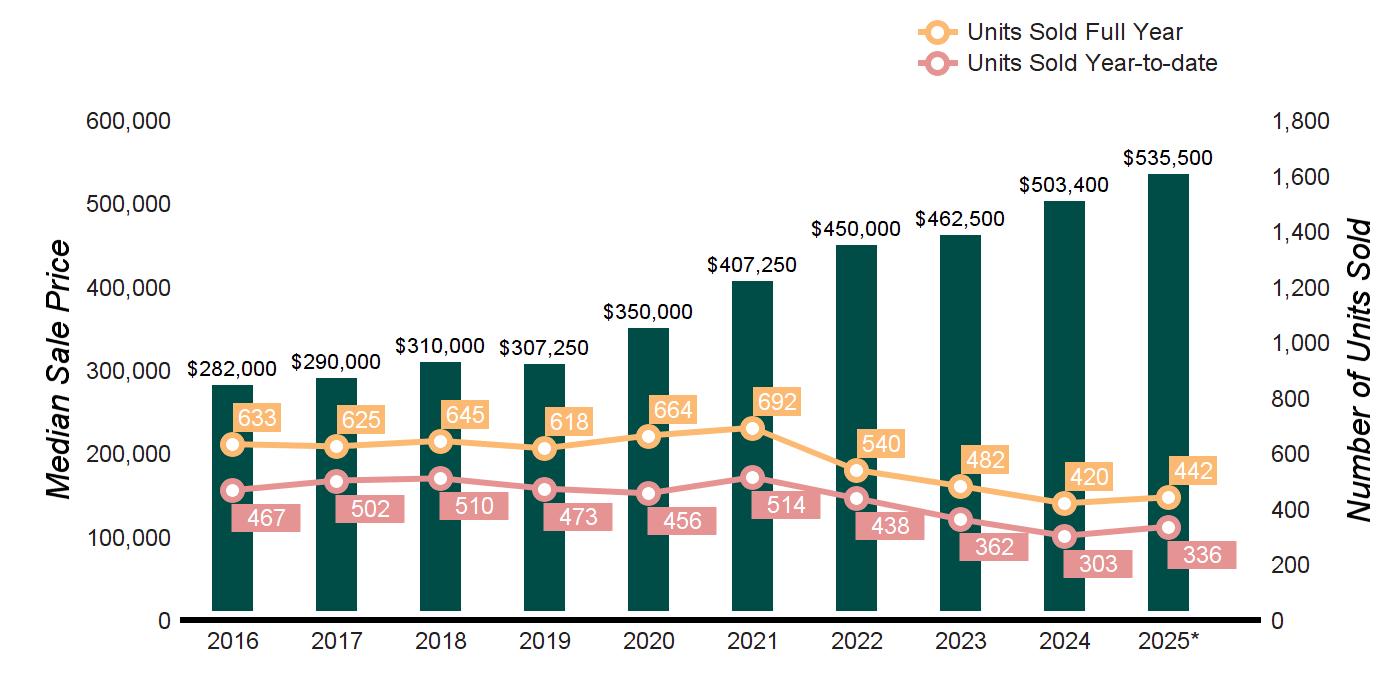

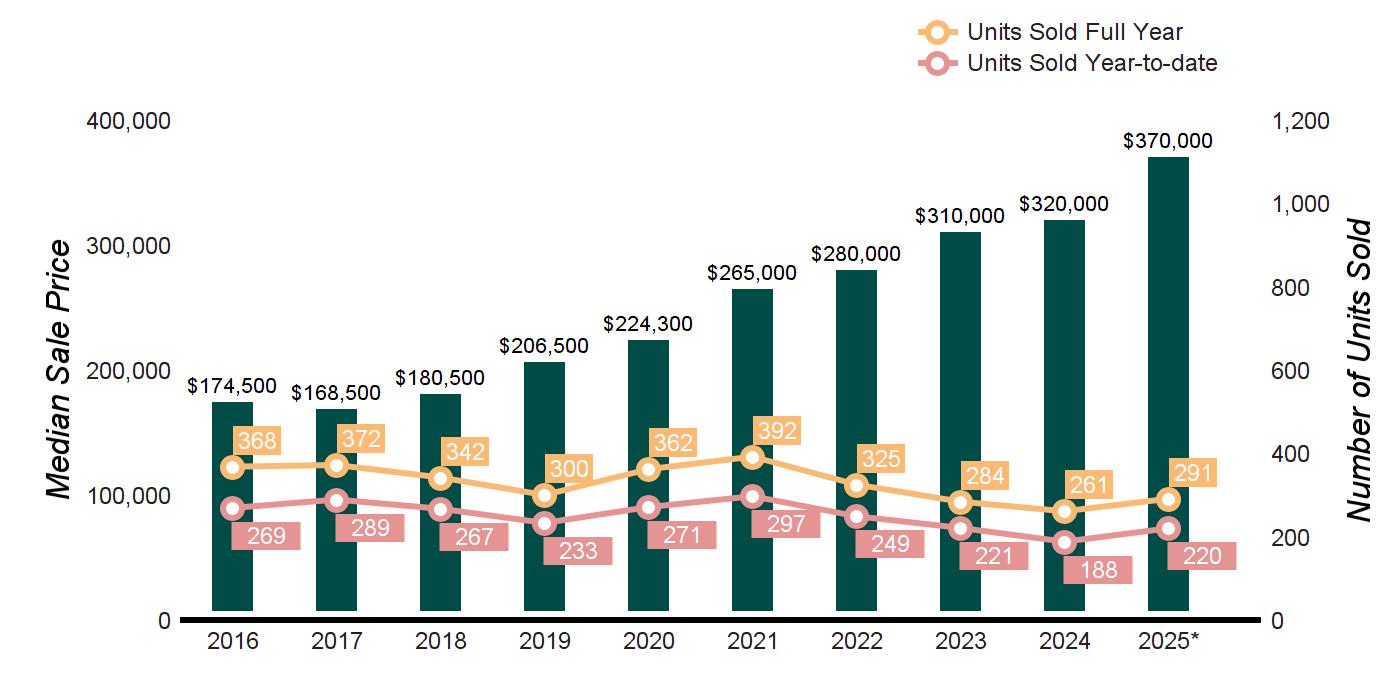

MARKET HISTORY


ACTIVE LISTINGS
Q3- 2025 vs Q3- 2024 0.0%

PENDING LISTINGS
Q3- 2025 vs Q3- 2024 -80.0%
LISTINGS Q3- 2025 vs Q3- 2024 -7.7%
QUARTERLY MARKET OVERVIEW


Q3- 2025 vs Q3- 2024
36.5%
PENDING LISTINGS
Q3- 2025 vs Q3- 2024 -23.3%
Q3- 2025 vs Q3- 2024
0.0% Source : Smart MLS, Single Family For Sale


ACTIVE LISTINGS
Q3- 2025 vs Q3- 2024 2.2%
PENDING LISTINGS
Q3- 2025 vs Q3- 2024 -15.8%
LISTINGS
Q3- 2025 vs Q3- 2024 6.9%
QUARTERLY MARKET OVERVIEW


ACTIVE LISTINGS
Q3- 2025 vs Q3- 2024 16.5%
PENDING LISTINGS
Q3- 2025 vs Q3- 2024 -18.8%
LISTINGS
Q3- 2025 vs Q3- 2024 -4.9% Source : Smart MLS, Single Family For Sale
QUARTERLY MARKET OVERVIEW


ACTIVE LISTINGS
Q3- 2025 vs Q3- 2024 16.4%
PENDING LISTINGS
Q3- 2025 vs Q3- 2024 -30.8%
Q3- 2025 vs Q3- 2024 -16.0%
QUARTERLY MARKET OVERVIEW


ACTIVE LISTINGS
Q3- 2025 vs Q3- 2024 3.2%
Source : Smart MLS, Single Family For Sale
PENDING LISTINGS
Q3- 2025 vs Q3- 2024 21.1% SOLD LISTINGS
Q3- 2025 vs Q3- 2024 2.5%
QUARTERLY MARKET OVERVIEW


ACTIVE LISTINGS
Q3- 2025 vs Q3- 2024 44.8%
PENDING LISTINGS
Q3- 2025 vs Q3- 2024 -13.3%
LISTINGS
Q3- 2025 vs Q3- 2024 -21.7%


ACTIVE LISTINGS
Q3- 2025 vs Q3- 2024 -30.8%
PENDING LISTINGS
Q3- 2025 vs Q3- 2024 0.0%
Q3- 2025 vs Q3- 2024 27.6%
QUARTERLY MARKET OVERVIEW


Q3- 2025 vs Q3- 2024
3.4%
PENDING LISTINGS
Q3- 2025 vs Q3- 2024 20.0%
Q3- 2025 vs Q3- 2024 30.0%
QUARTERLY MARKET OVERVIEW


ACTIVE LISTINGS
Q3- 2025 vs Q3- 2024 -14.0%
PENDING LISTINGS
Q3- 2025 vs Q3- 2024 -27.3%
Q3- 2025 vs Q3- 2024 -6.7%
QUARTERLY MARKET OVERVIEW


ACTIVE LISTINGS
Q3- 2025 vs Q3- 2024 -5.8%
PENDING LISTINGS
Q3- 2025 vs Q3- 2024 -6.5%
Q3- 2025 vs Q3- 2024 -22.3%

Source : Smart MLS, Single Family For Sale

TEN-YEAR MARKET HISTORY
QUARTERLY MARKET OVERVIEW


ACTIVE LISTINGS
Q3- 2025 vs Q3- 2024 16.1%
PENDING LISTINGS
Q3- 2025 vs Q3- 2024 -27.3%
LISTINGS
Q3- 2025 vs Q3- 2024 -7.1% Source : Smart MLS, Single Family For Sale
QUARTERLY MARKET OVERVIEW


ACTIVE LISTINGS
Q3- 2025 vs Q3- 2024 7.1%
PENDING LISTINGS
Q3- 2025 vs Q3- 2024 100.0%
Q3- 2025 vs Q3- 2024 -33.3%
QUARTERLY MARKET OVERVIEW


Q3- 2025 vs Q3- 2024 33.3%
PENDING LISTINGS
Q3- 2025 vs Q3- 2024 60.0%
Q3- 2025 vs Q3- 2024 28.6%
QUARTERLY MARKET OVERVIEW


Q3- 2025 vs Q3- 2024 -19.4%
PENDING LISTINGS
Q3- 2025 vs Q3- 2024 100.0%
Q3- 2025 vs Q3- 2024 -13.3%
QUARTERLY MARKET OVERVIEW


ACTIVE LISTINGS
Q3- 2025 vs Q3- 2024 92.9%
PENDING LISTINGS
Q3- 2025 vs Q3- 2024 50.0%
Q3- 2025 vs Q3- 2024 0.0%
QUARTERLY MARKET OVERVIEW


ACTIVE LISTINGS
Q3- 2025 vs Q3- 2024 -13.8%
PENDING LISTINGS
Q3- 2025 vs Q3- 2024 55.6%
LISTINGS
Q3- 2025 vs Q3- 2024 9.8%
QUARTERLY MARKET OVERVIEW


Q3- 2025 vs Q3- 2024 11.1%
PENDING LISTINGS
Q3- 2025 vs Q3- 2024 150.0%
LISTINGS
Q3- 2025 vs Q3- 2024 -5.0%