Q2-2026
Q2-2026
The New Haven and Middlesex County markets remained strong throughout the second quarter, supported by steady buyer demand and continued price appreciation despite softer sales activity in several communities.
The region continues to attract buyers seeking a classic Connecticut lifestyle characterized by historic architecture, coastal and inland settings, and convenient proximity to major urban centers. This balance of lifestyle, access, and relative value continues to define demand.
As the market moves into the second half of the year, fundamentals remain healthy. Well-prepared and strategically priced homes continue to perform well, while buyers are gaining access to gradually improving inventory and more selective opportunities across segments.
At Houlihan Lawrence, we remain committed to delivering the expertise, local insight and trusted guidance that have defined our market leadership for generations. We are grateful for the opportunity to guide buyers and sellers with confidence through every stage of their real estate journey.
With Warm Regards,
Liz Nunan President and CEO
SECOND QUARTER 2026
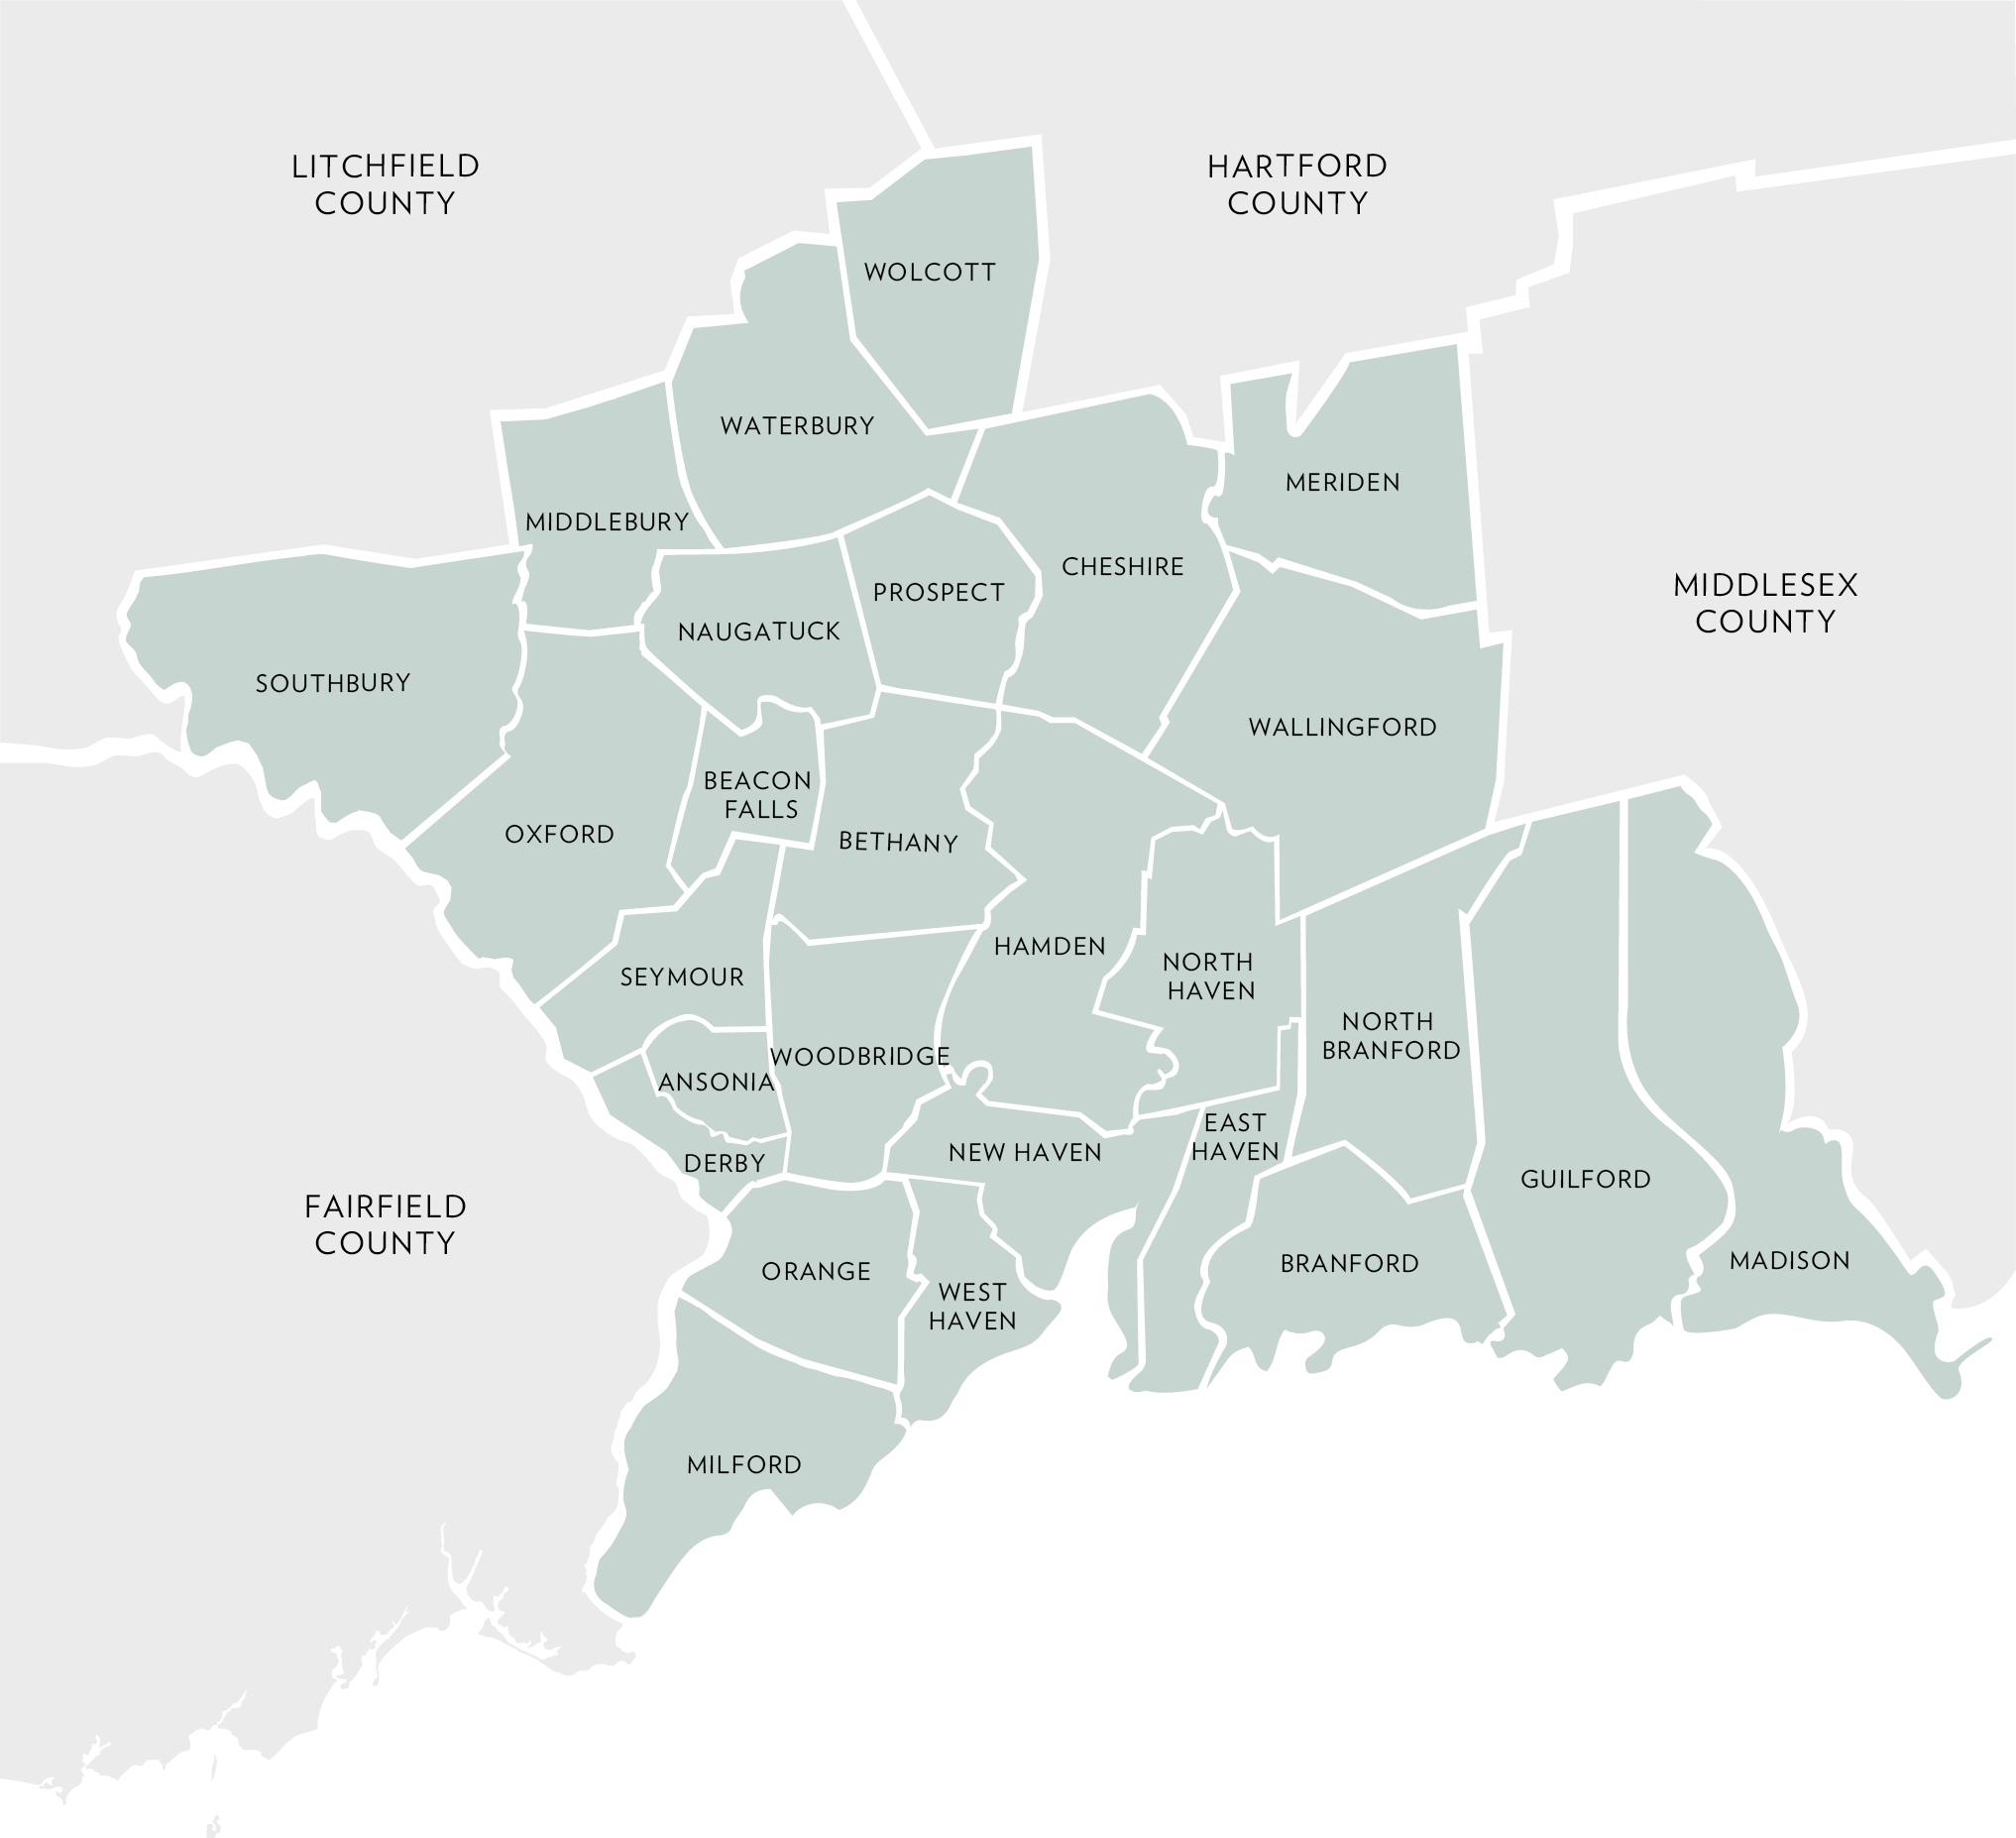
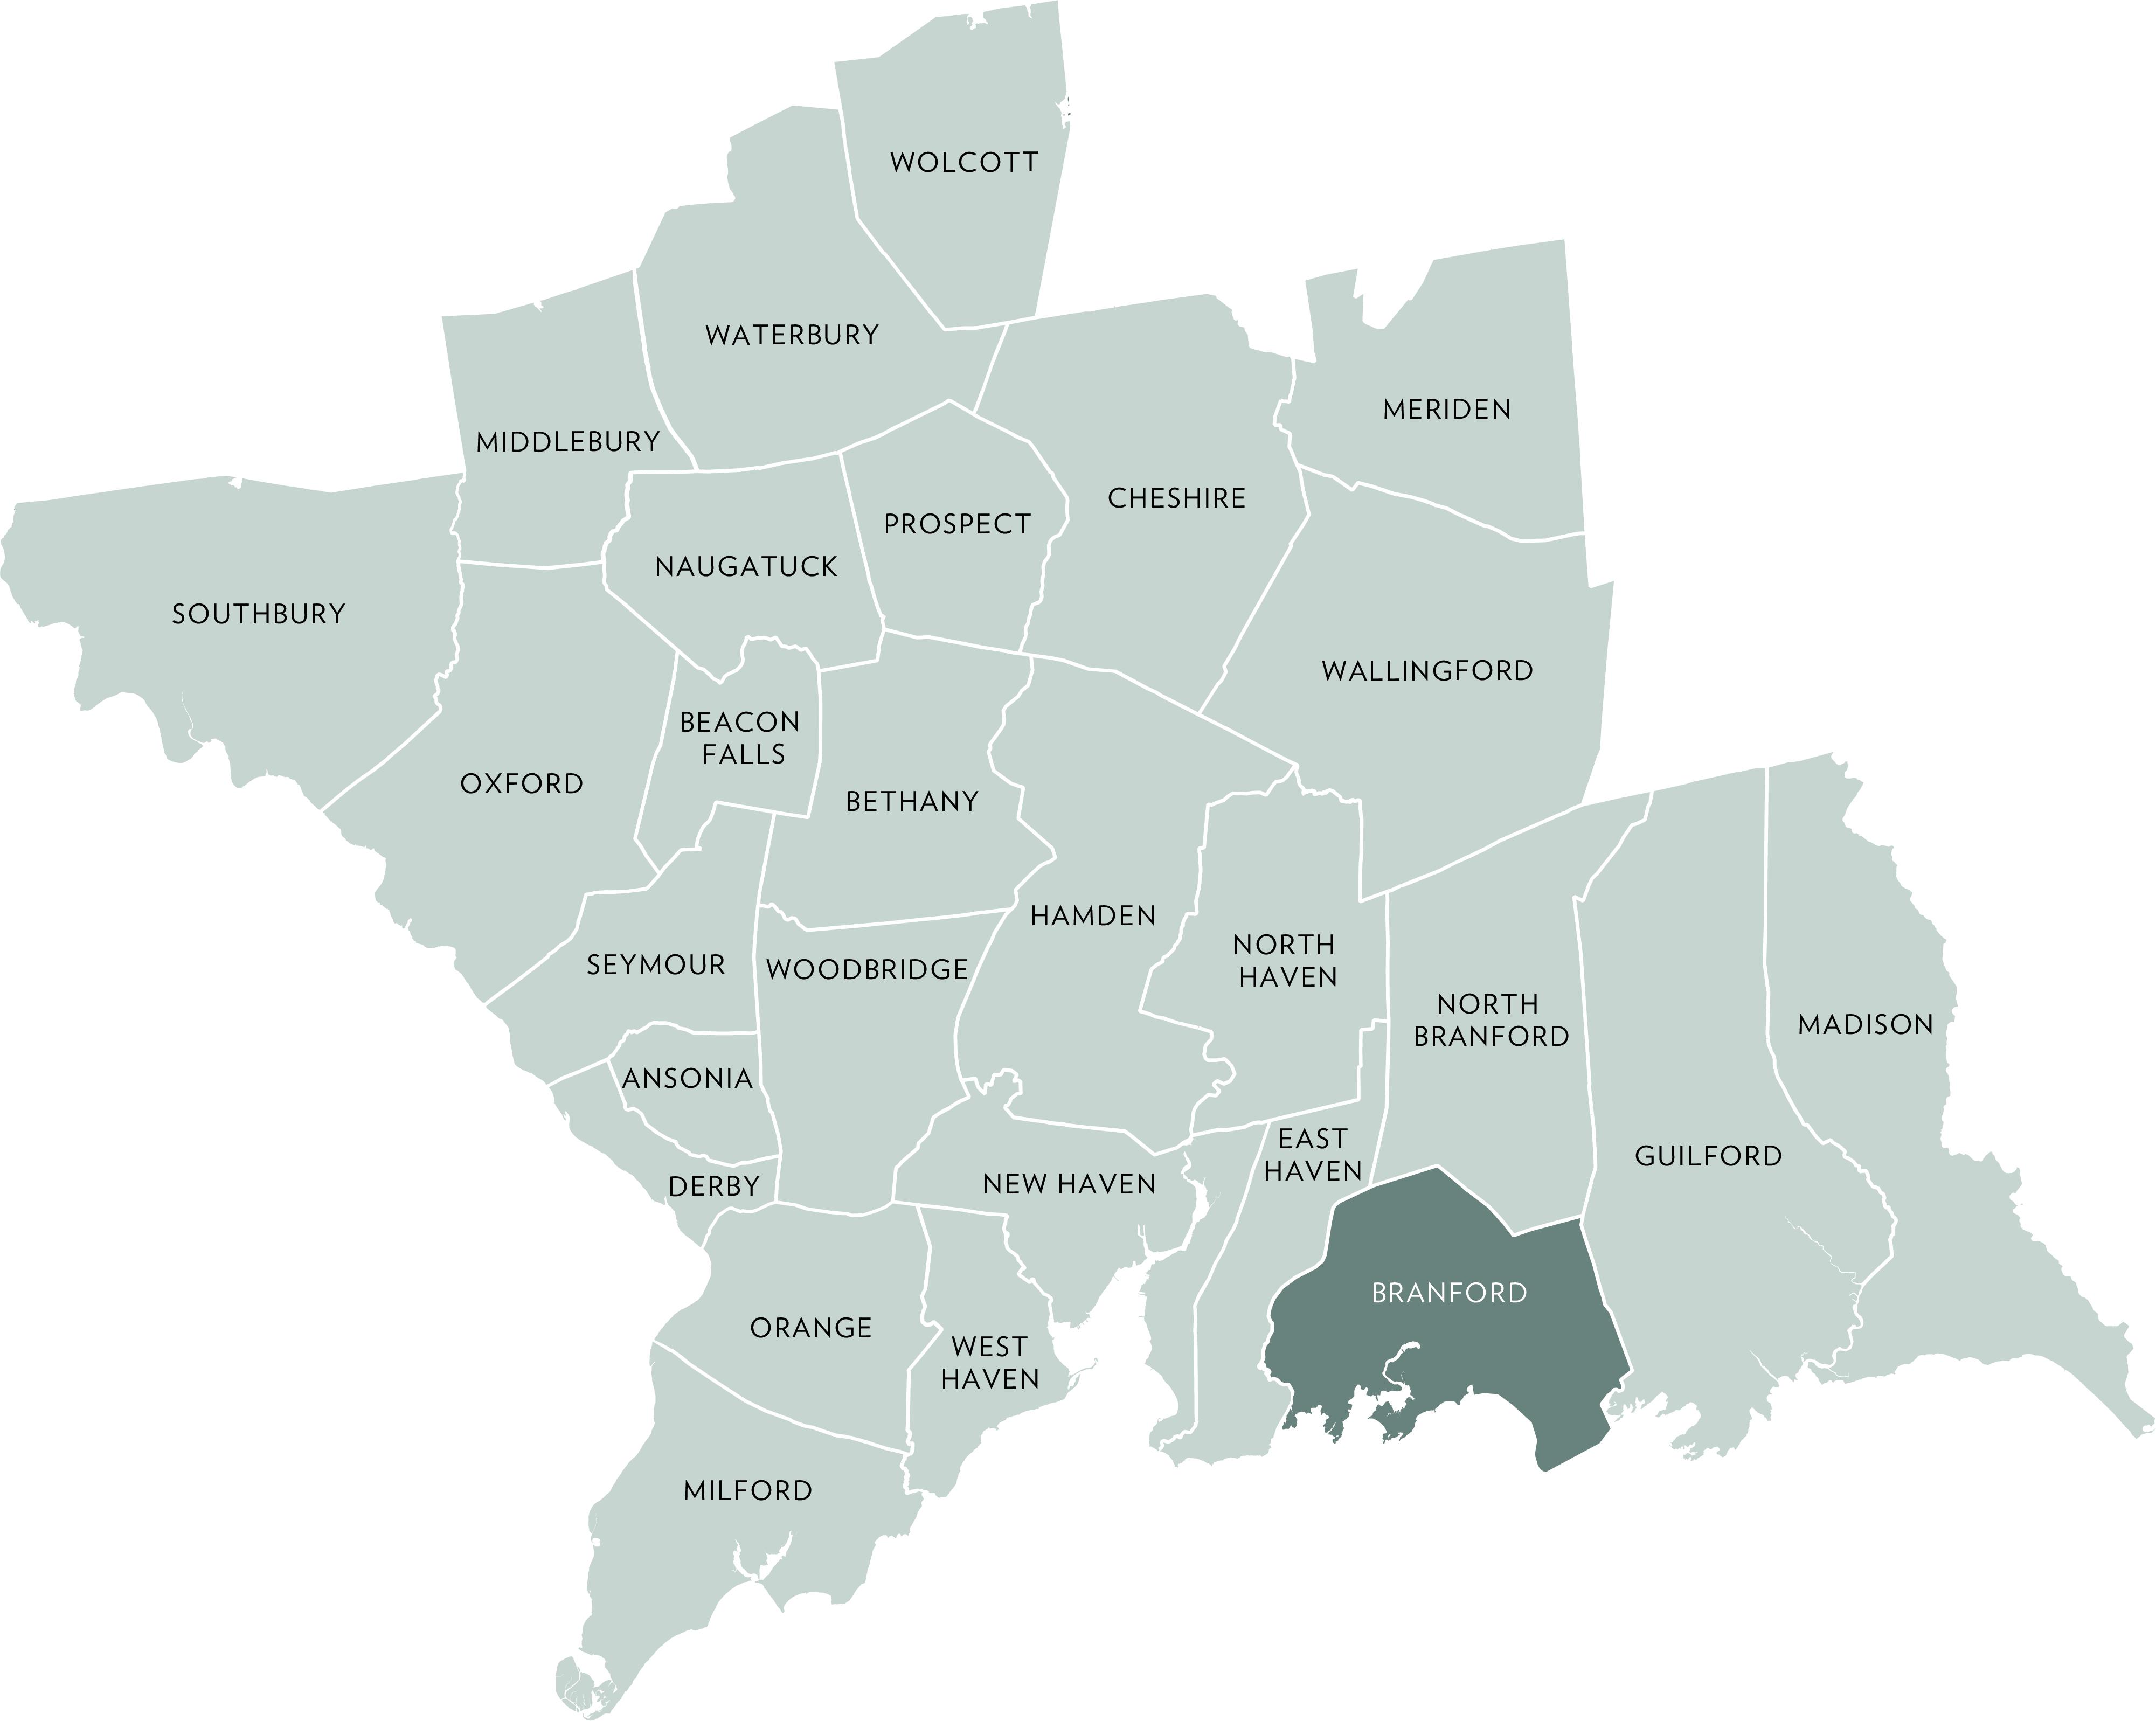
ANSONIA BEACON FALLS BETHANY BRANFORD
CHESHIRE DERBY EAST HAVEN GUILFORD
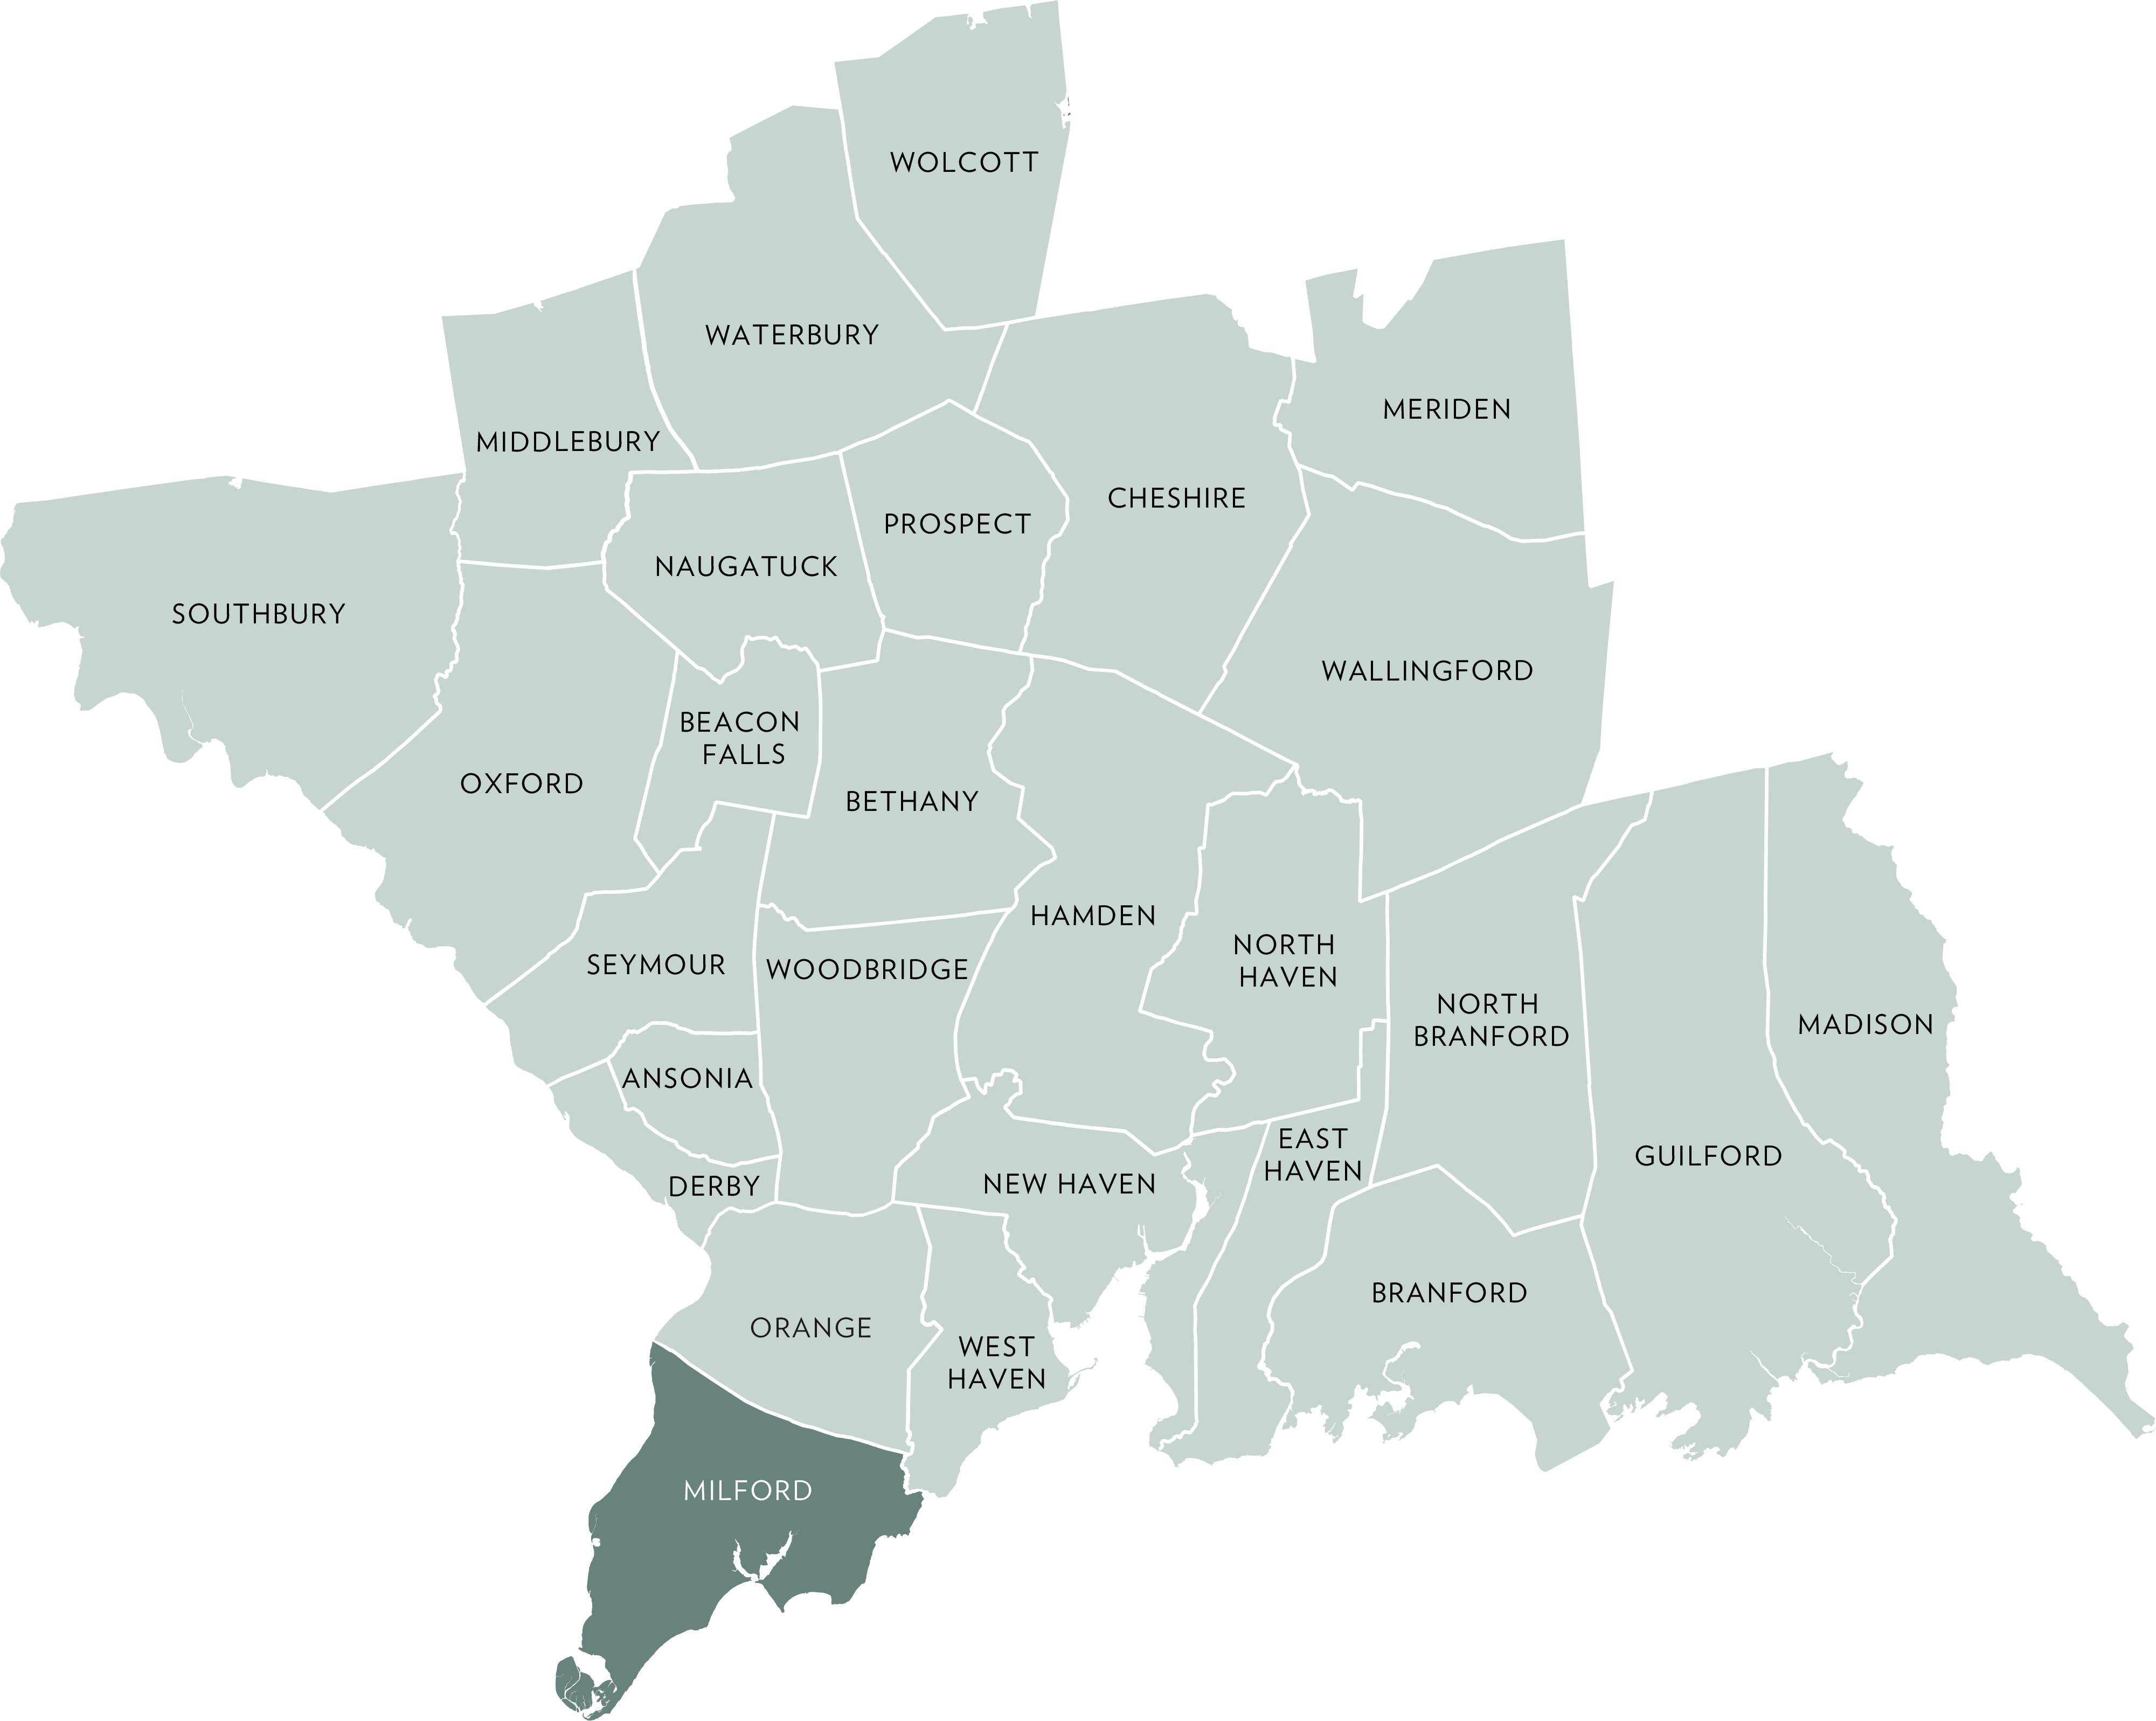
HAMDEN MADISON MERIDEN MIDDLEBURY MILFORD NAUGATUCK NEW HAVEN NORTH BRANFORD
SECOND QUARTER 2026
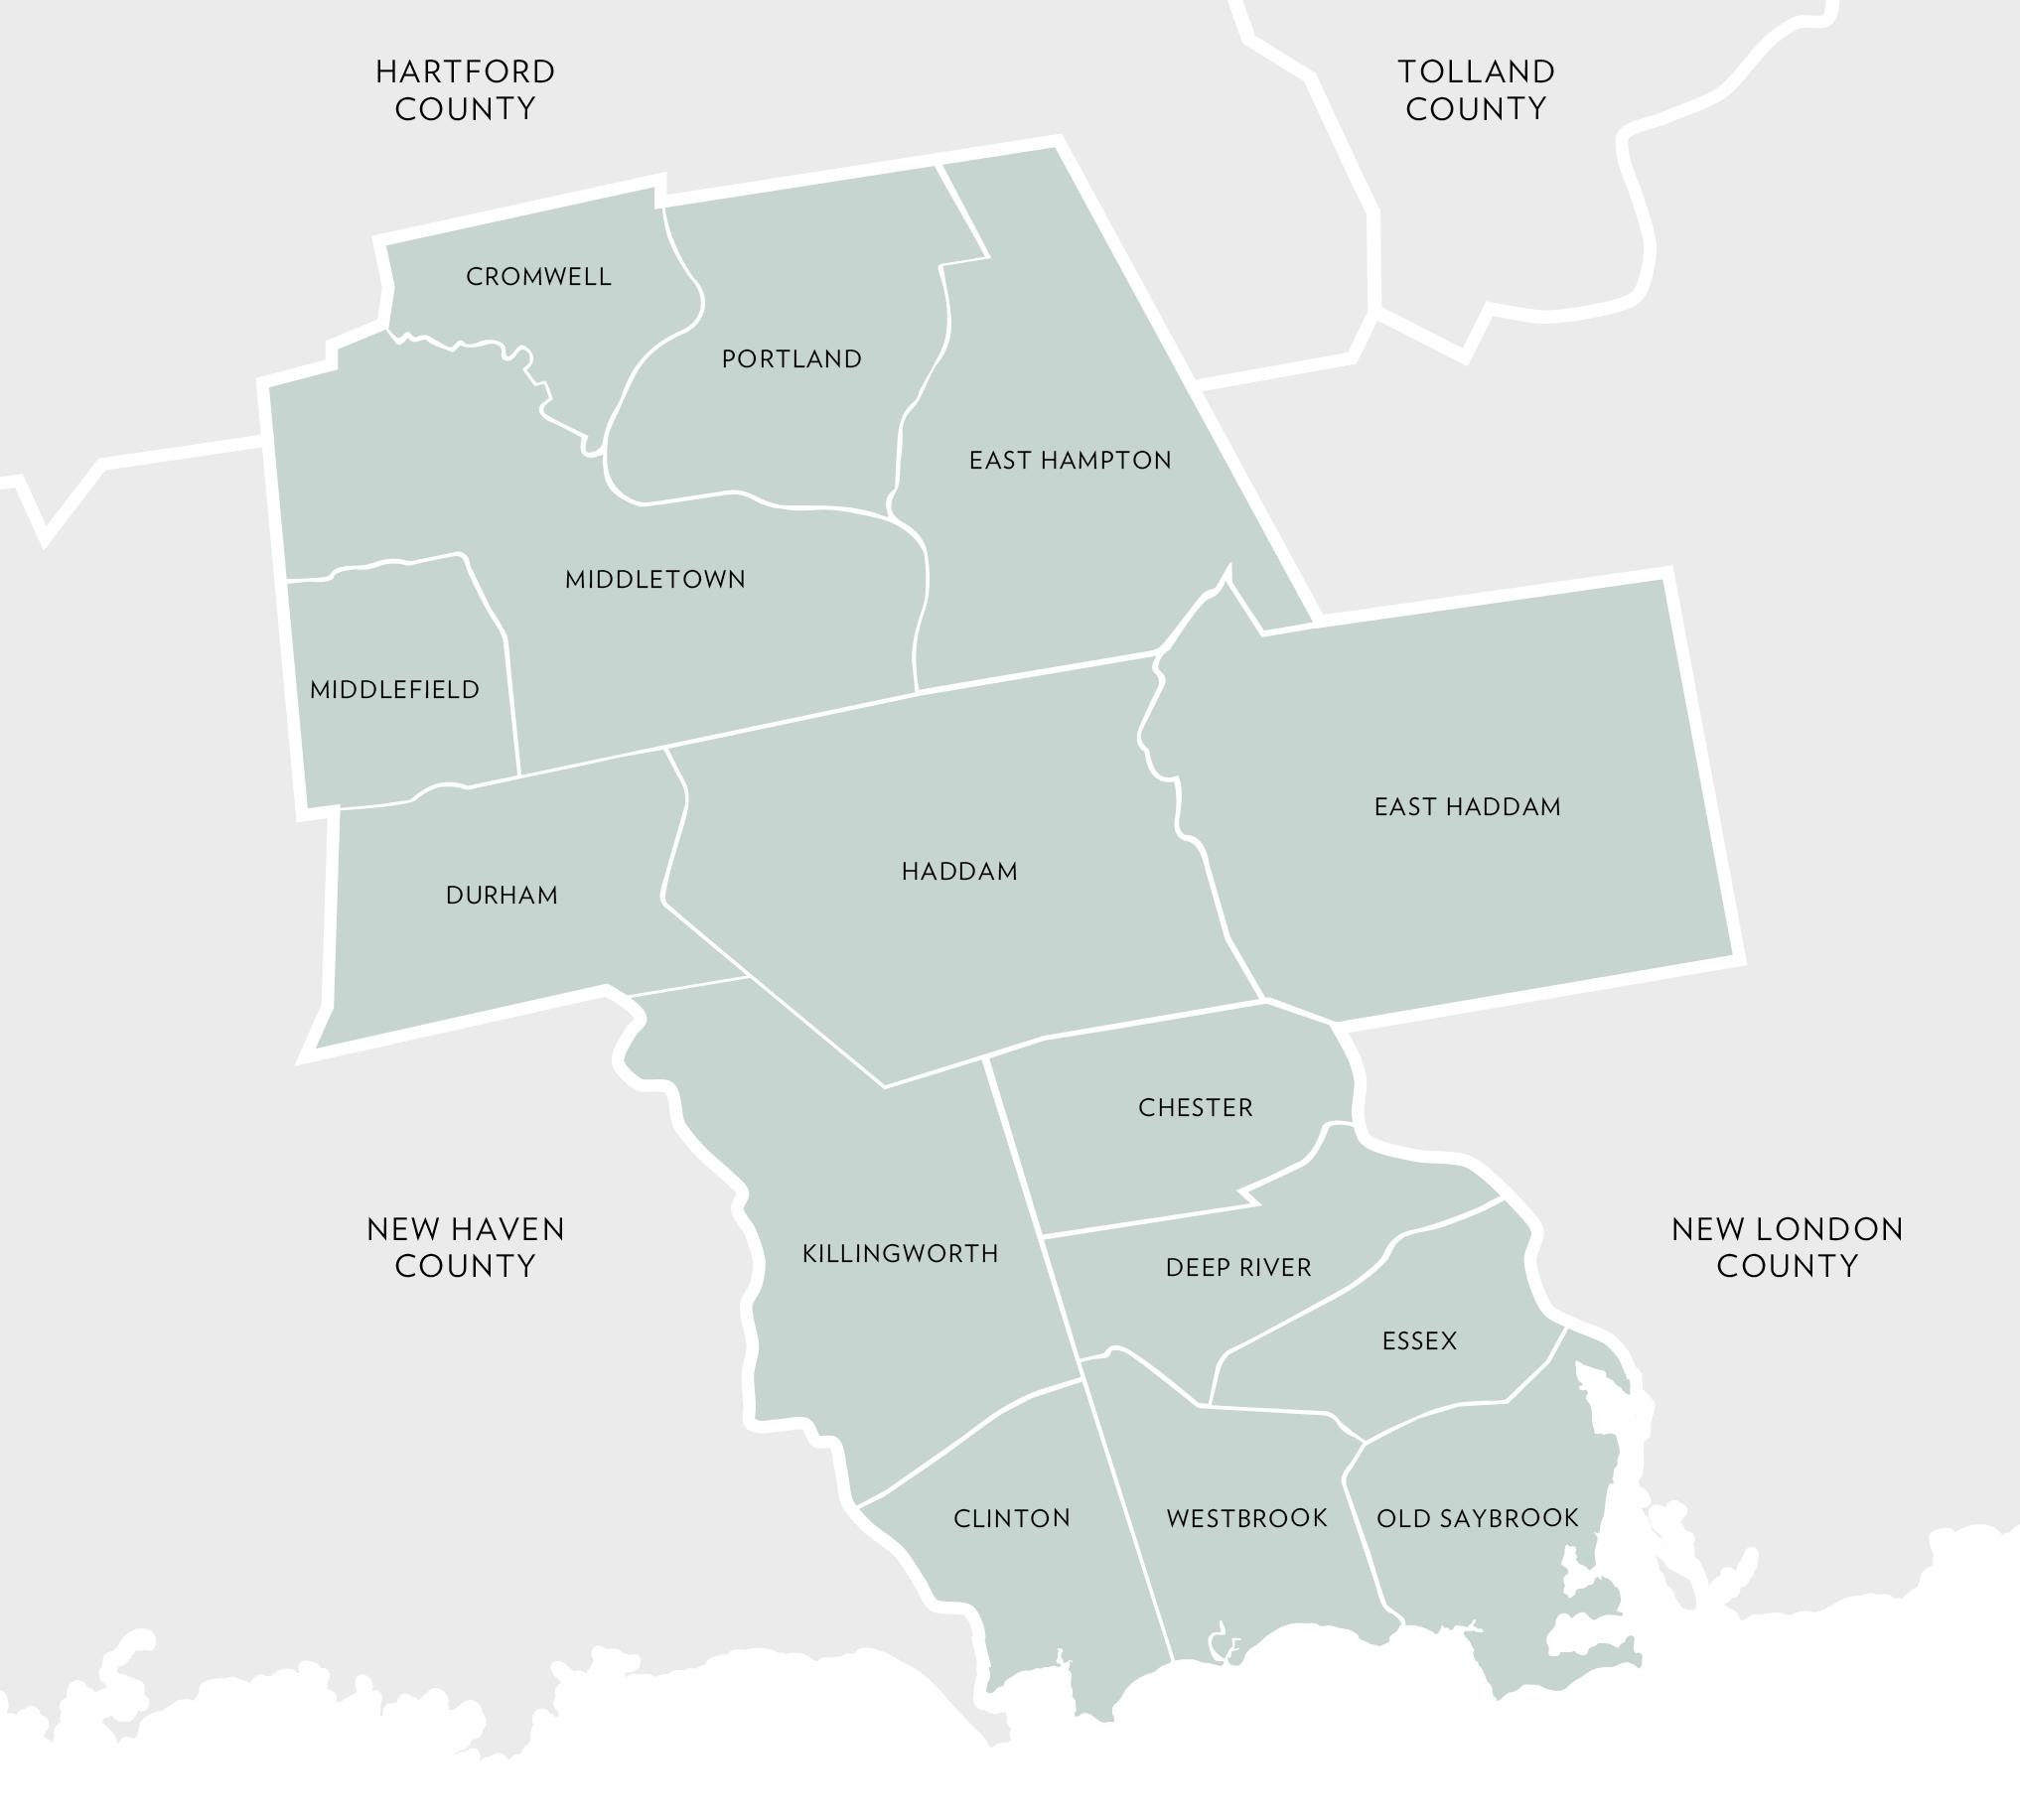
CHESTER
CLINTON CROMWELL
DEEP RIVER DURHAM EAST HADDAM
EAST HAMPTON ESSEX HADDAM
KILLINGWORTH MIDDLEFIELD MIDDLETOWN
OLD SAYBROOK PORTLAND WESTBROOK

MARKET HISTORY
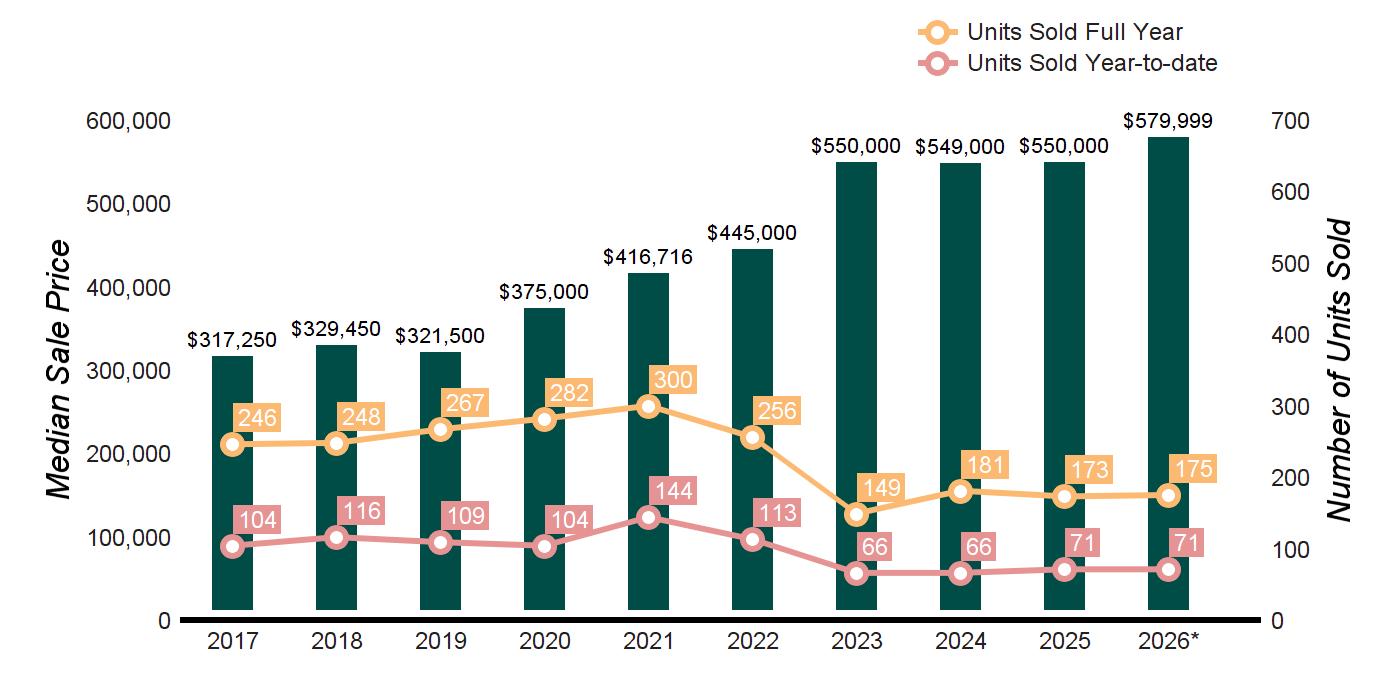

MARKET HISTORY
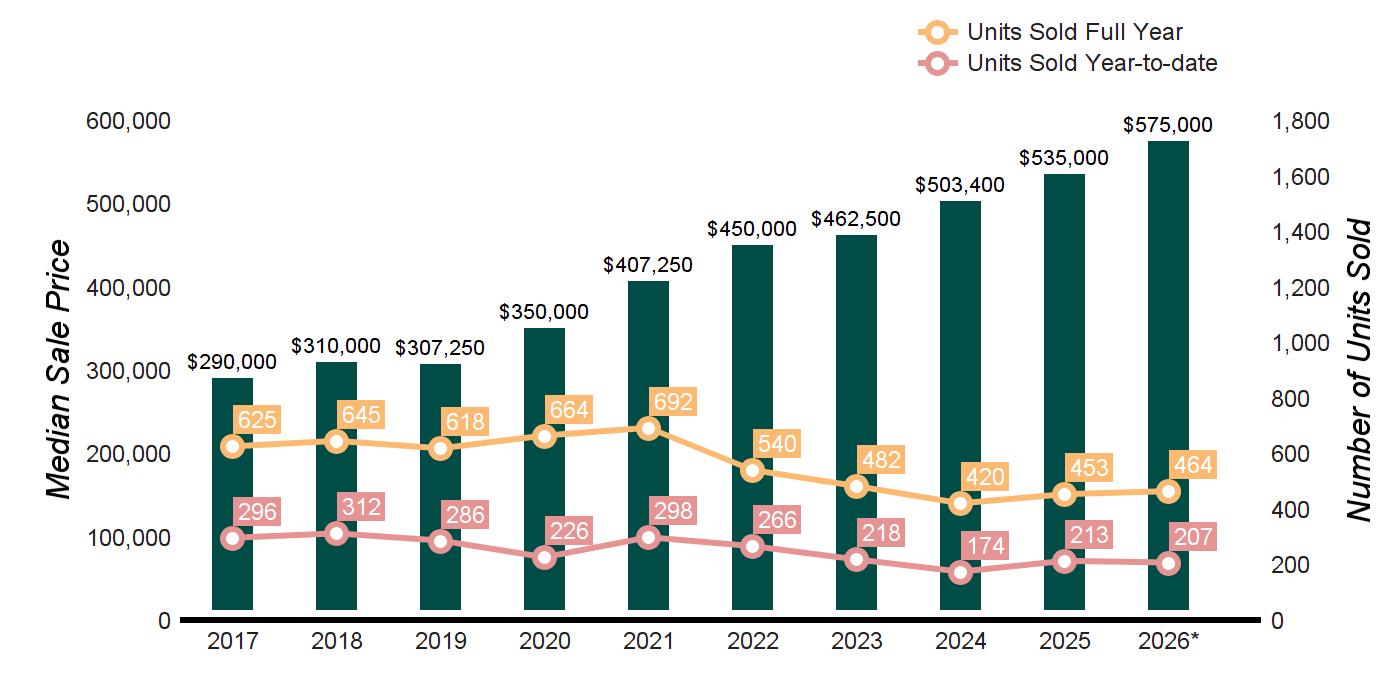
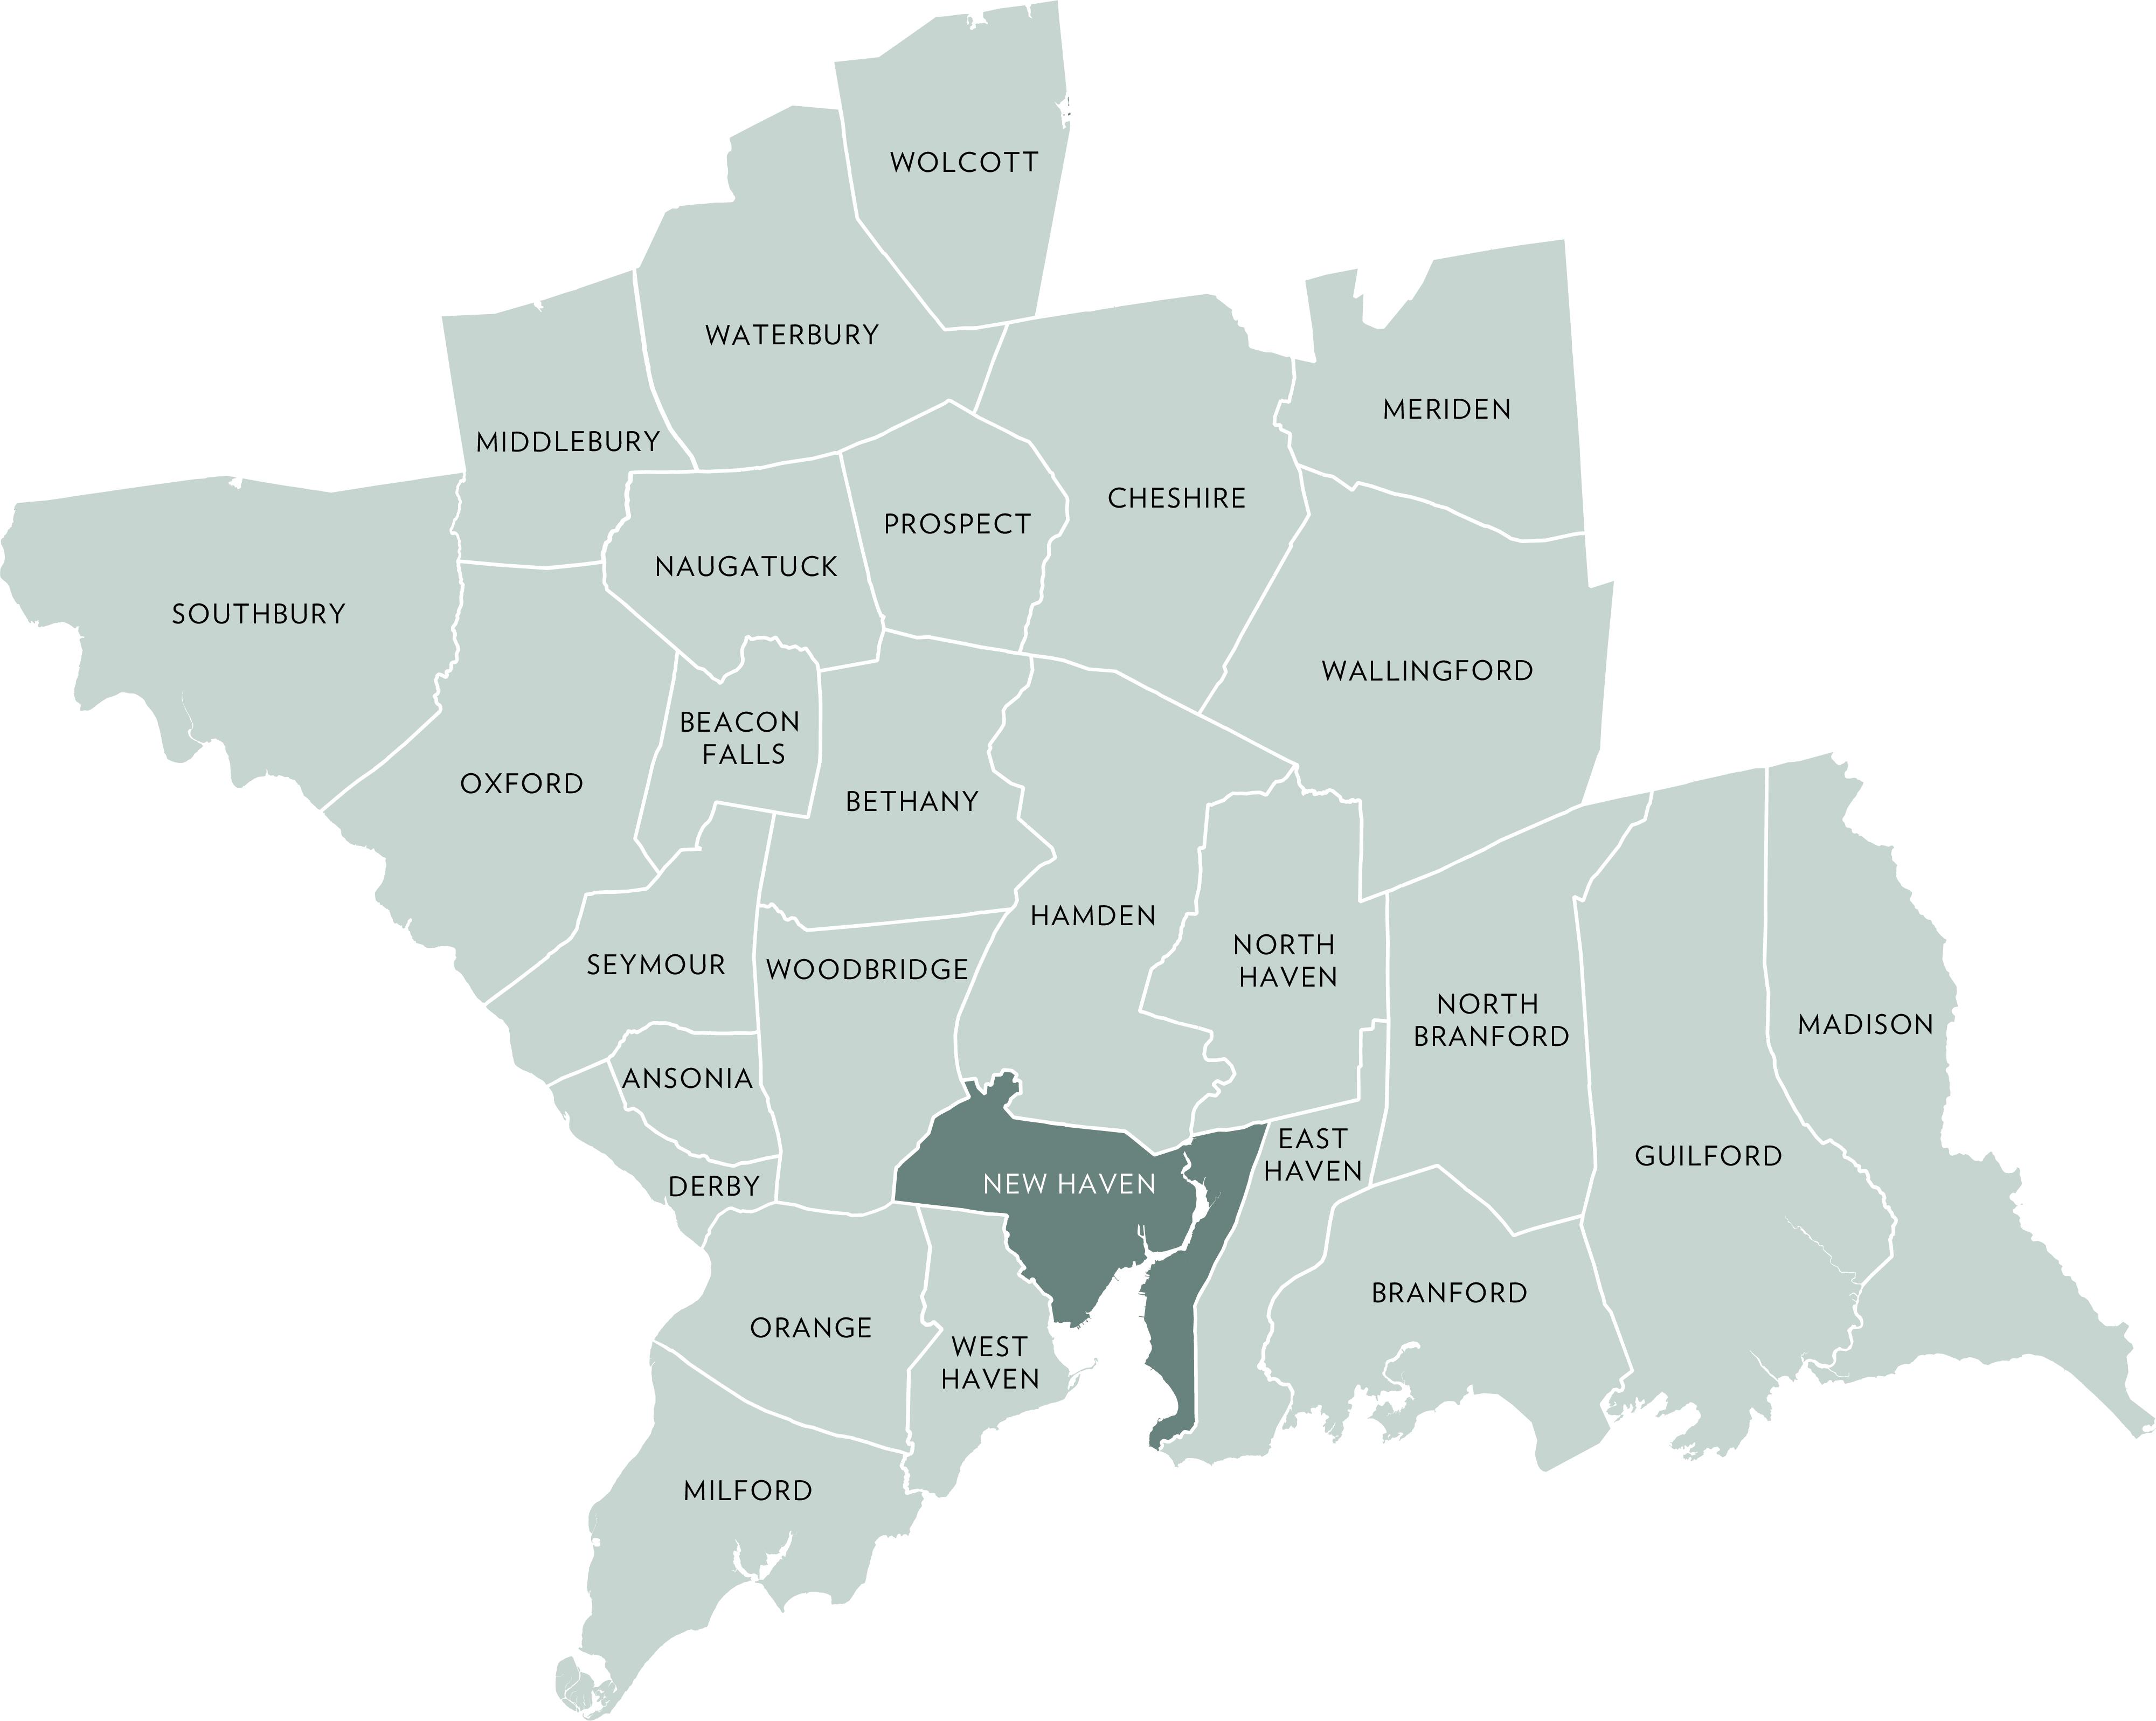
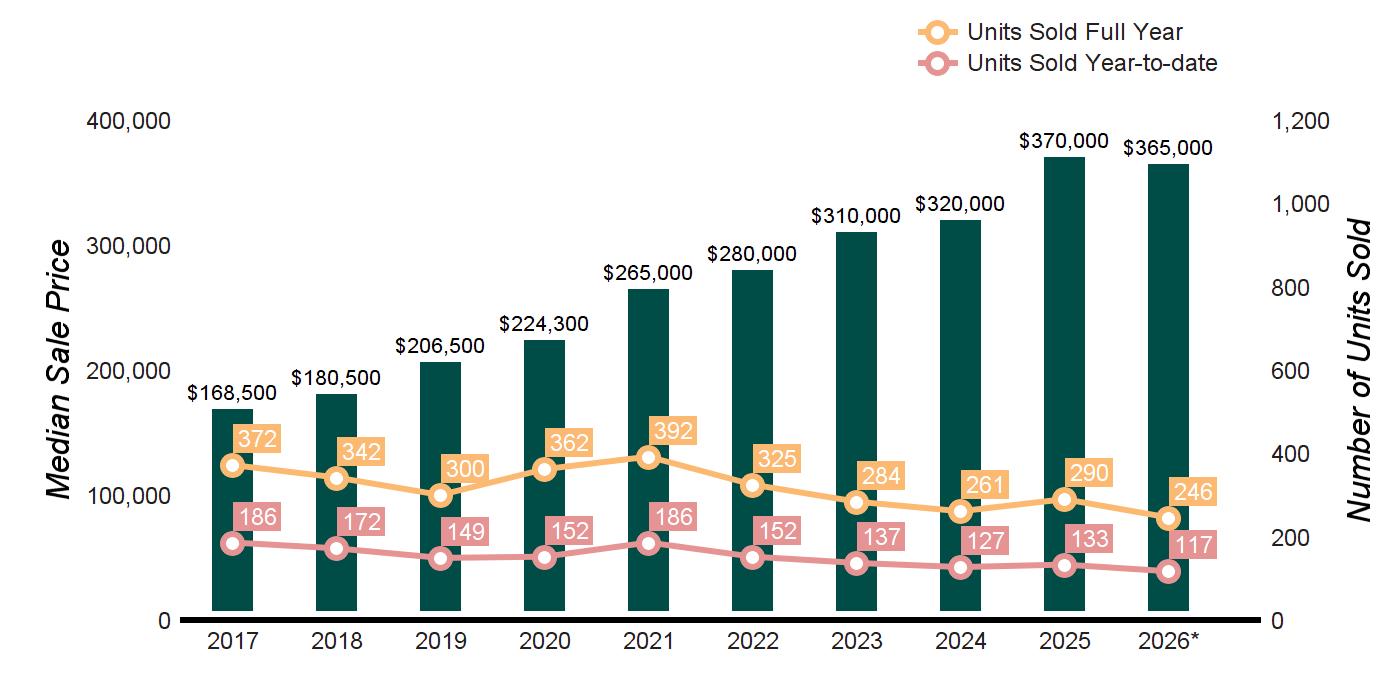
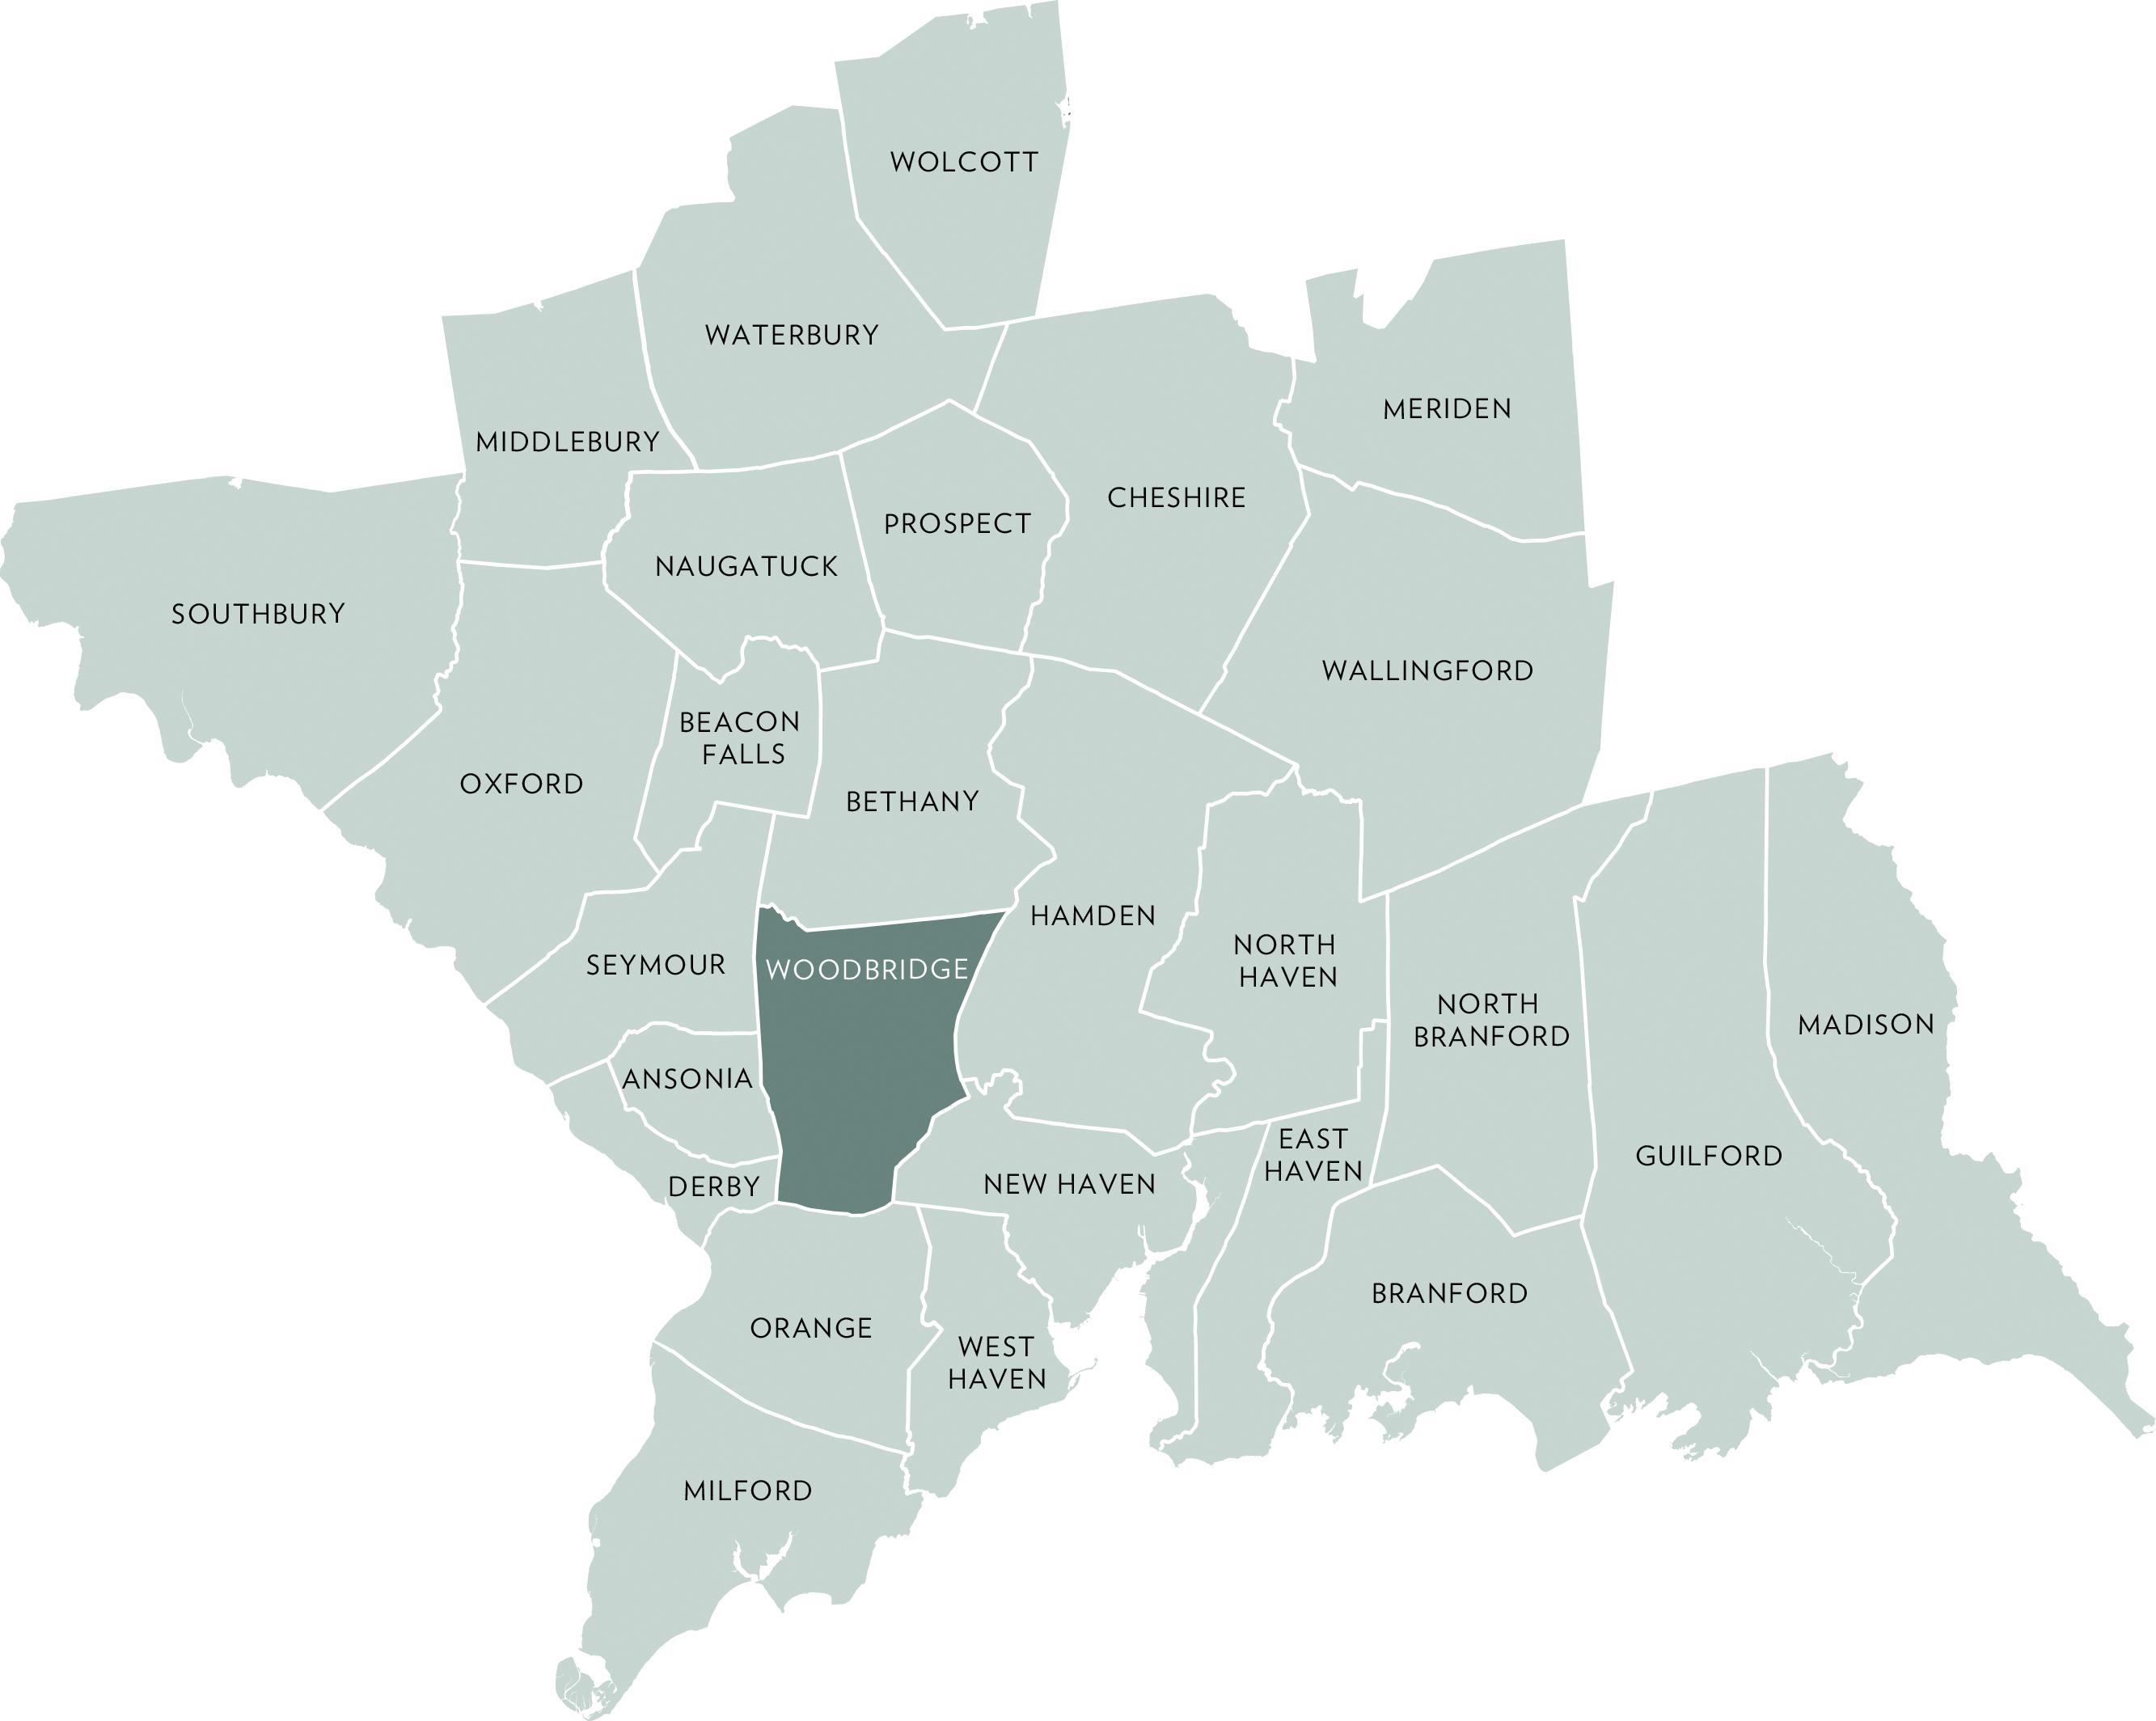
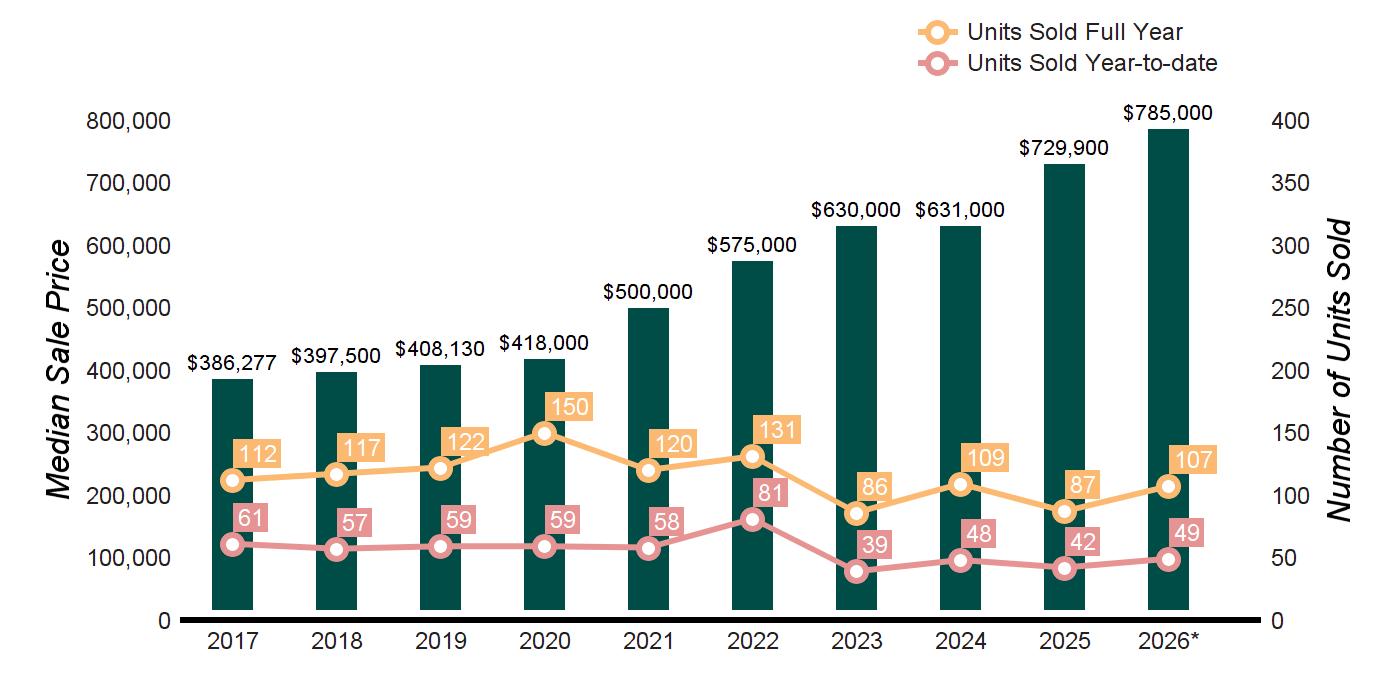
QUARTERLY MARKET OVERVIEW
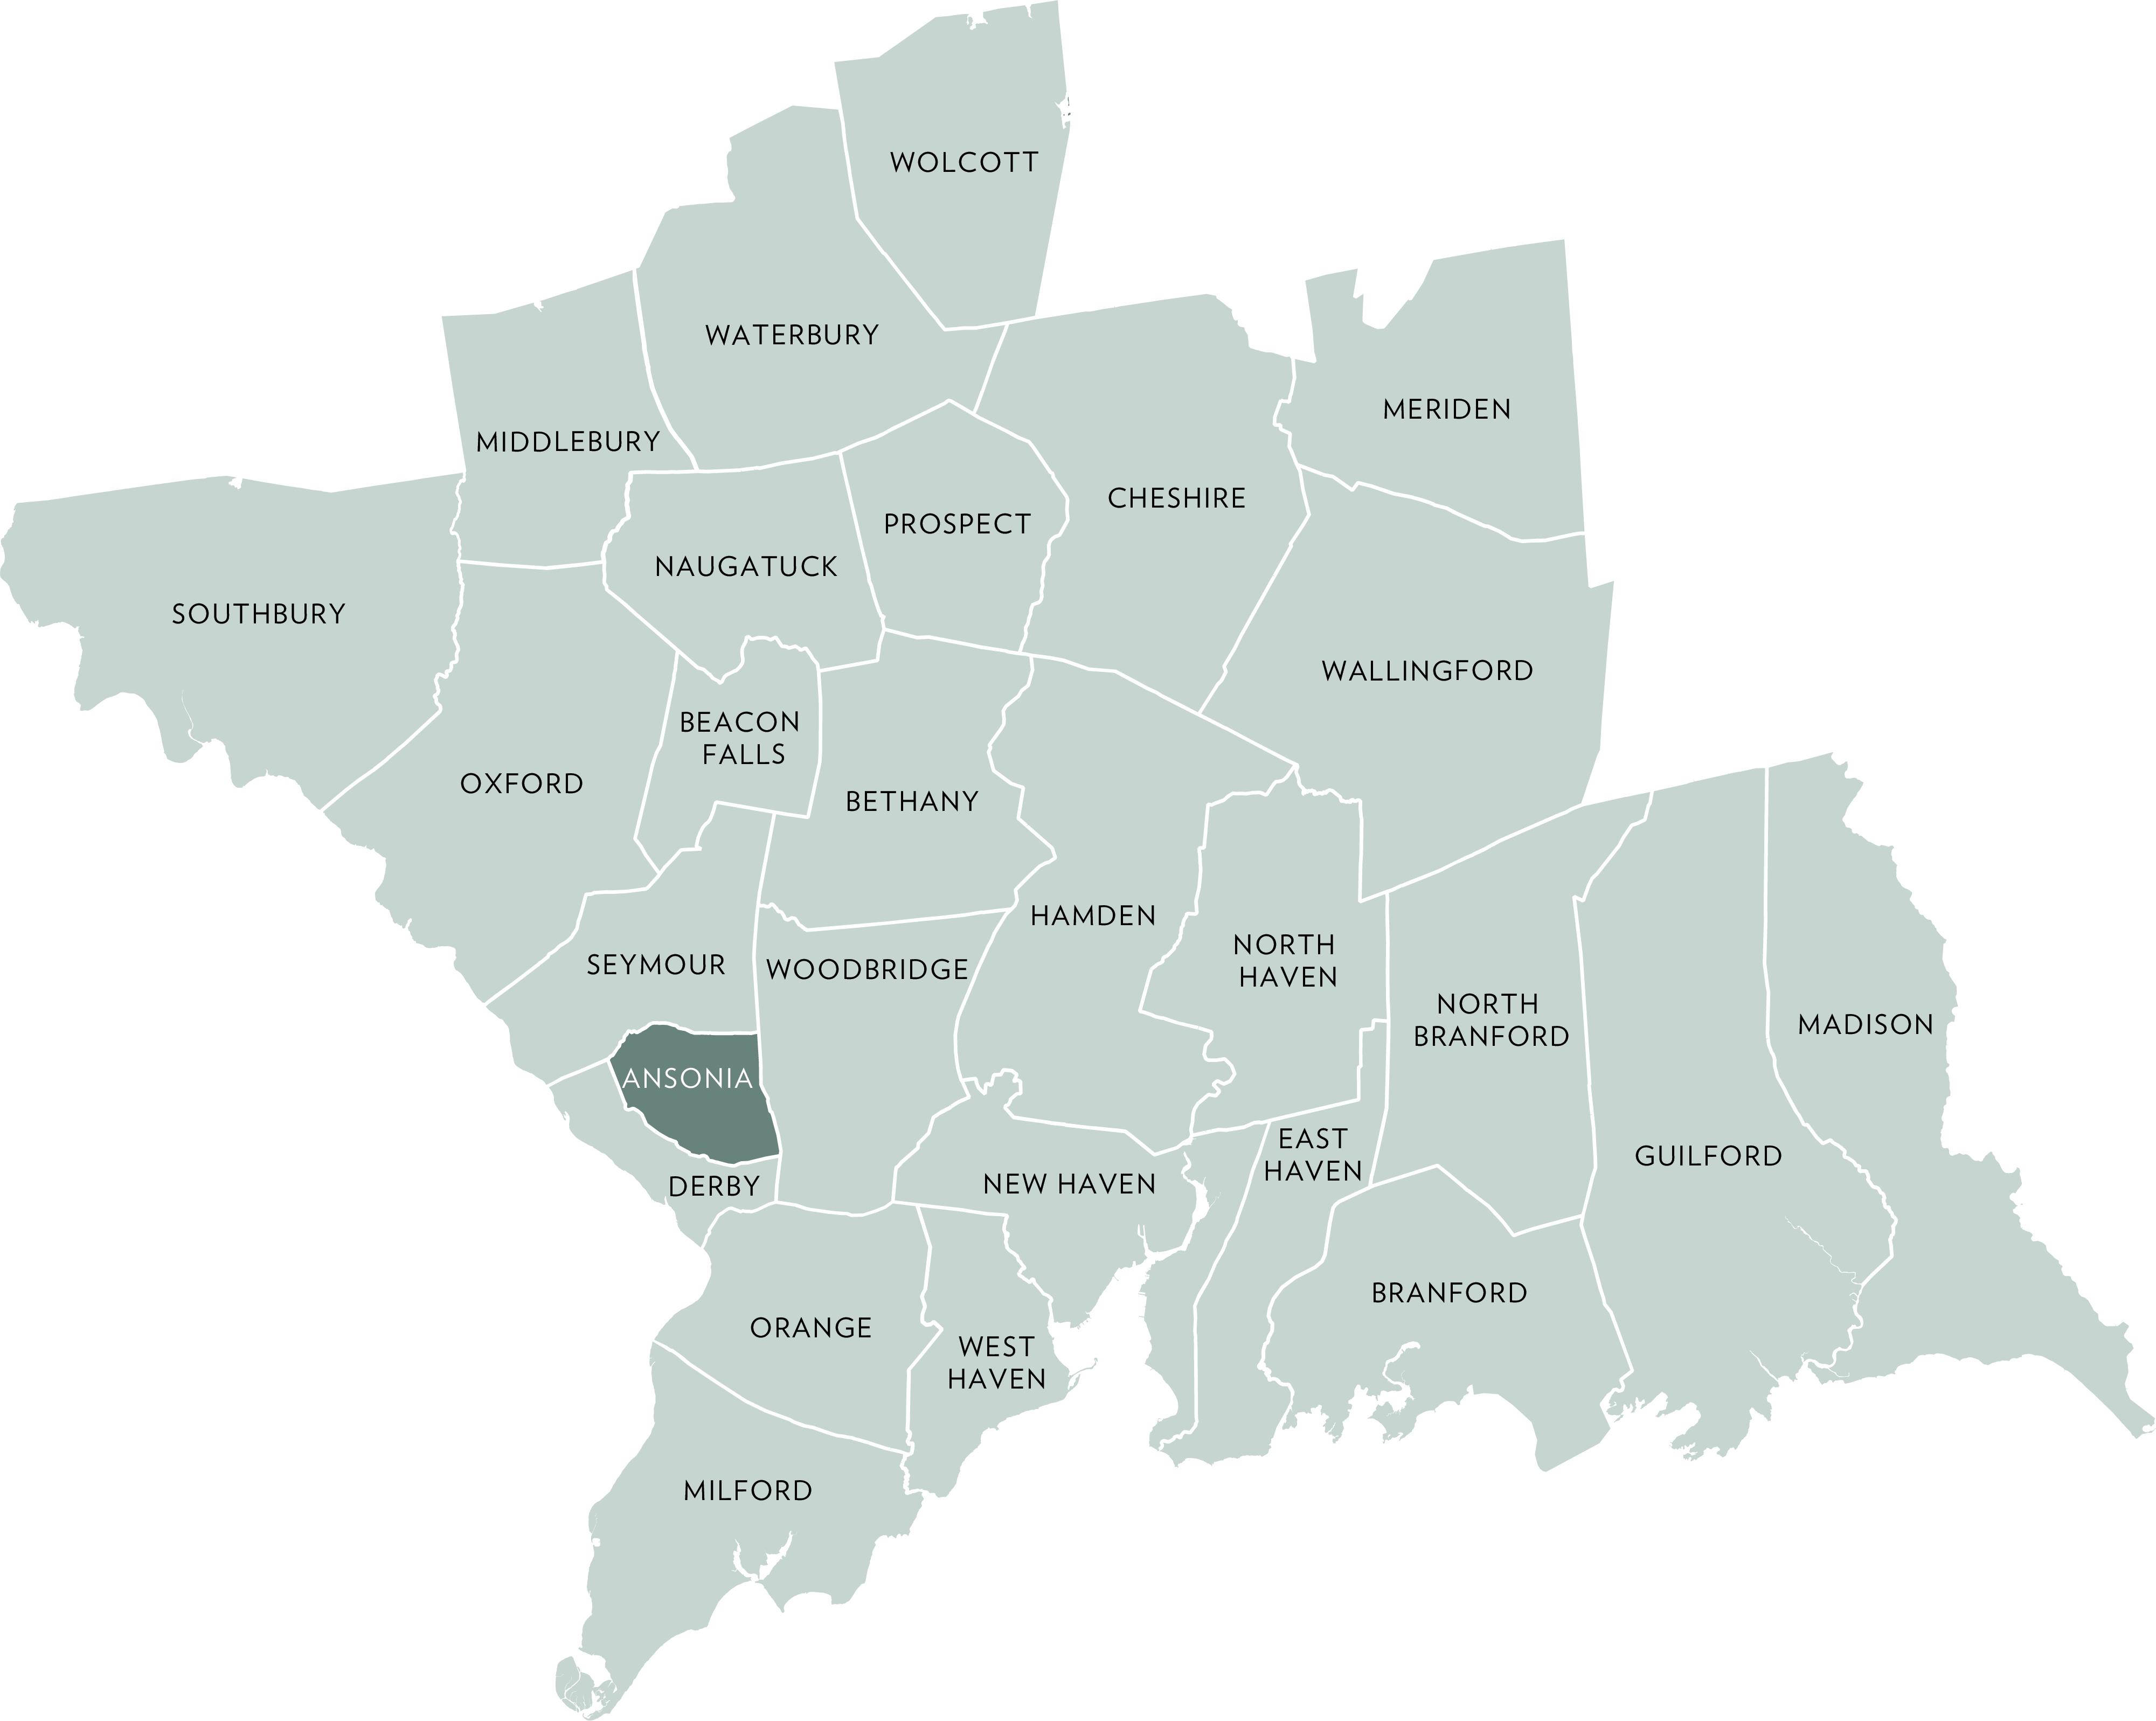
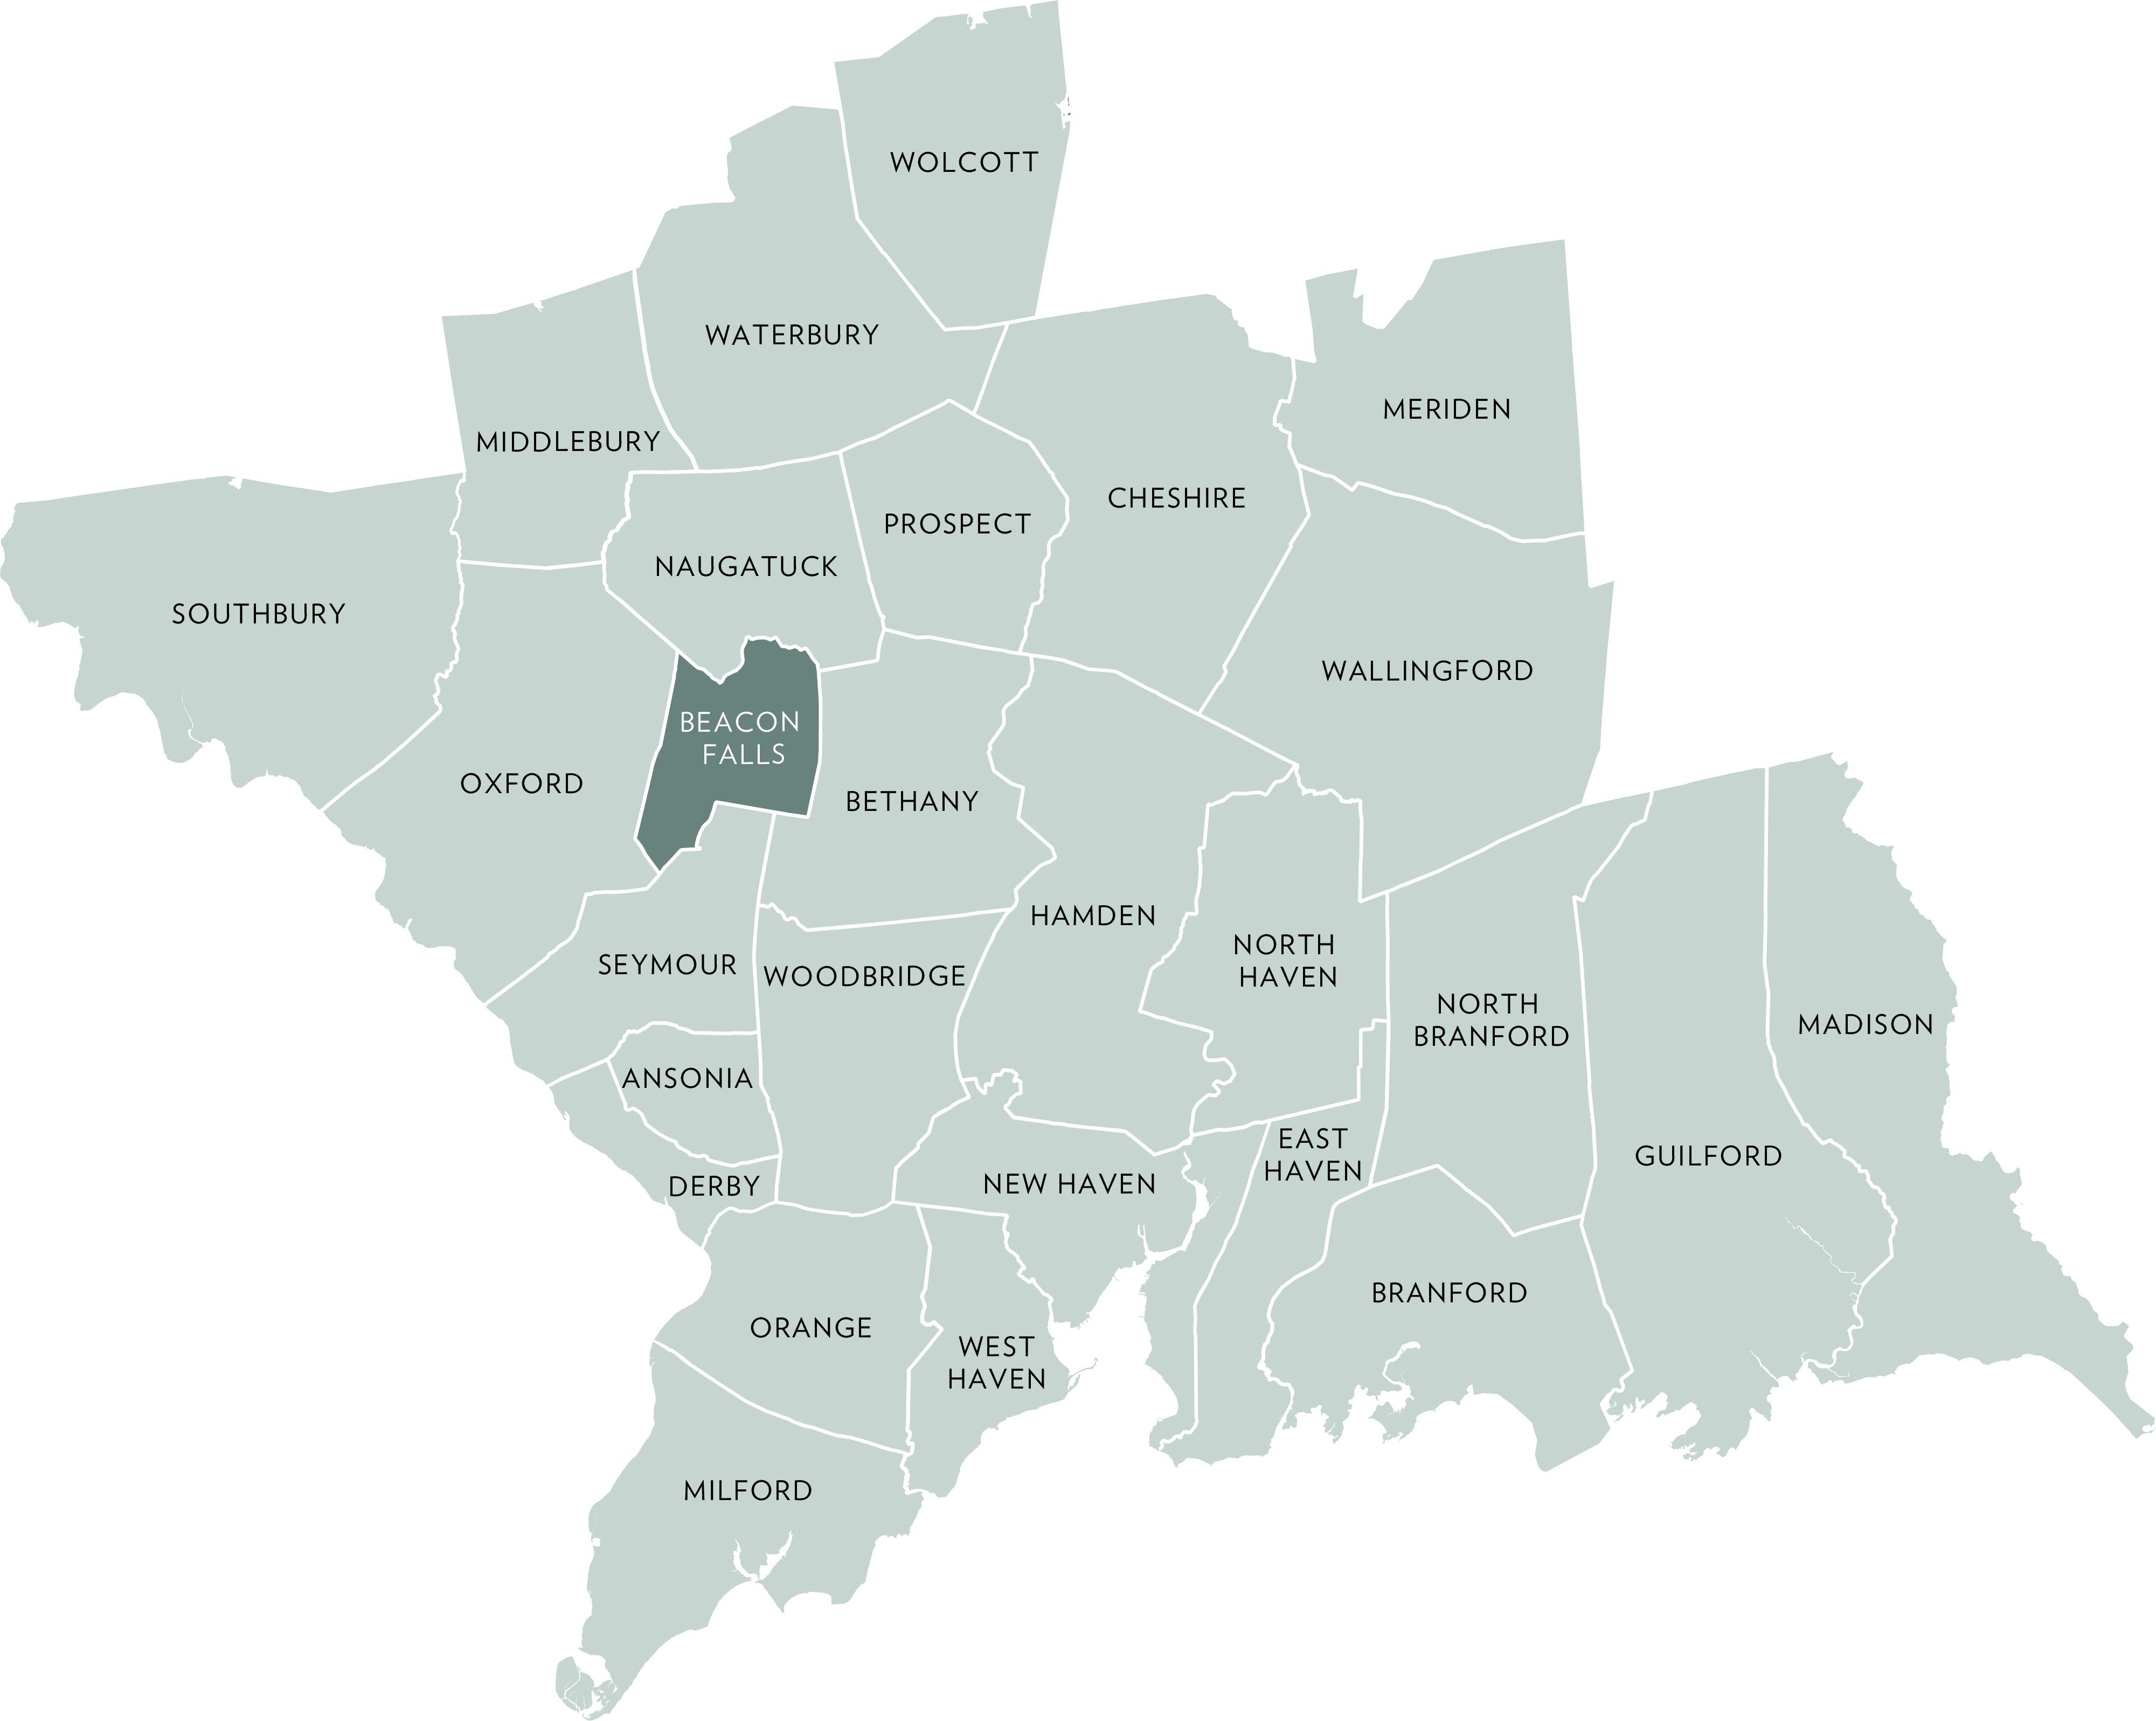
ACTIVE LISTINGS
Q2- 2026 vs Q2- 2025 85.7%
PENDING LISTINGS
Q2- 2026 vs Q2- 2025 -33.3%
Q2- 2026 vs Q2- 2025 -14.3%
QUARTERLY MARKET OVERVIEW
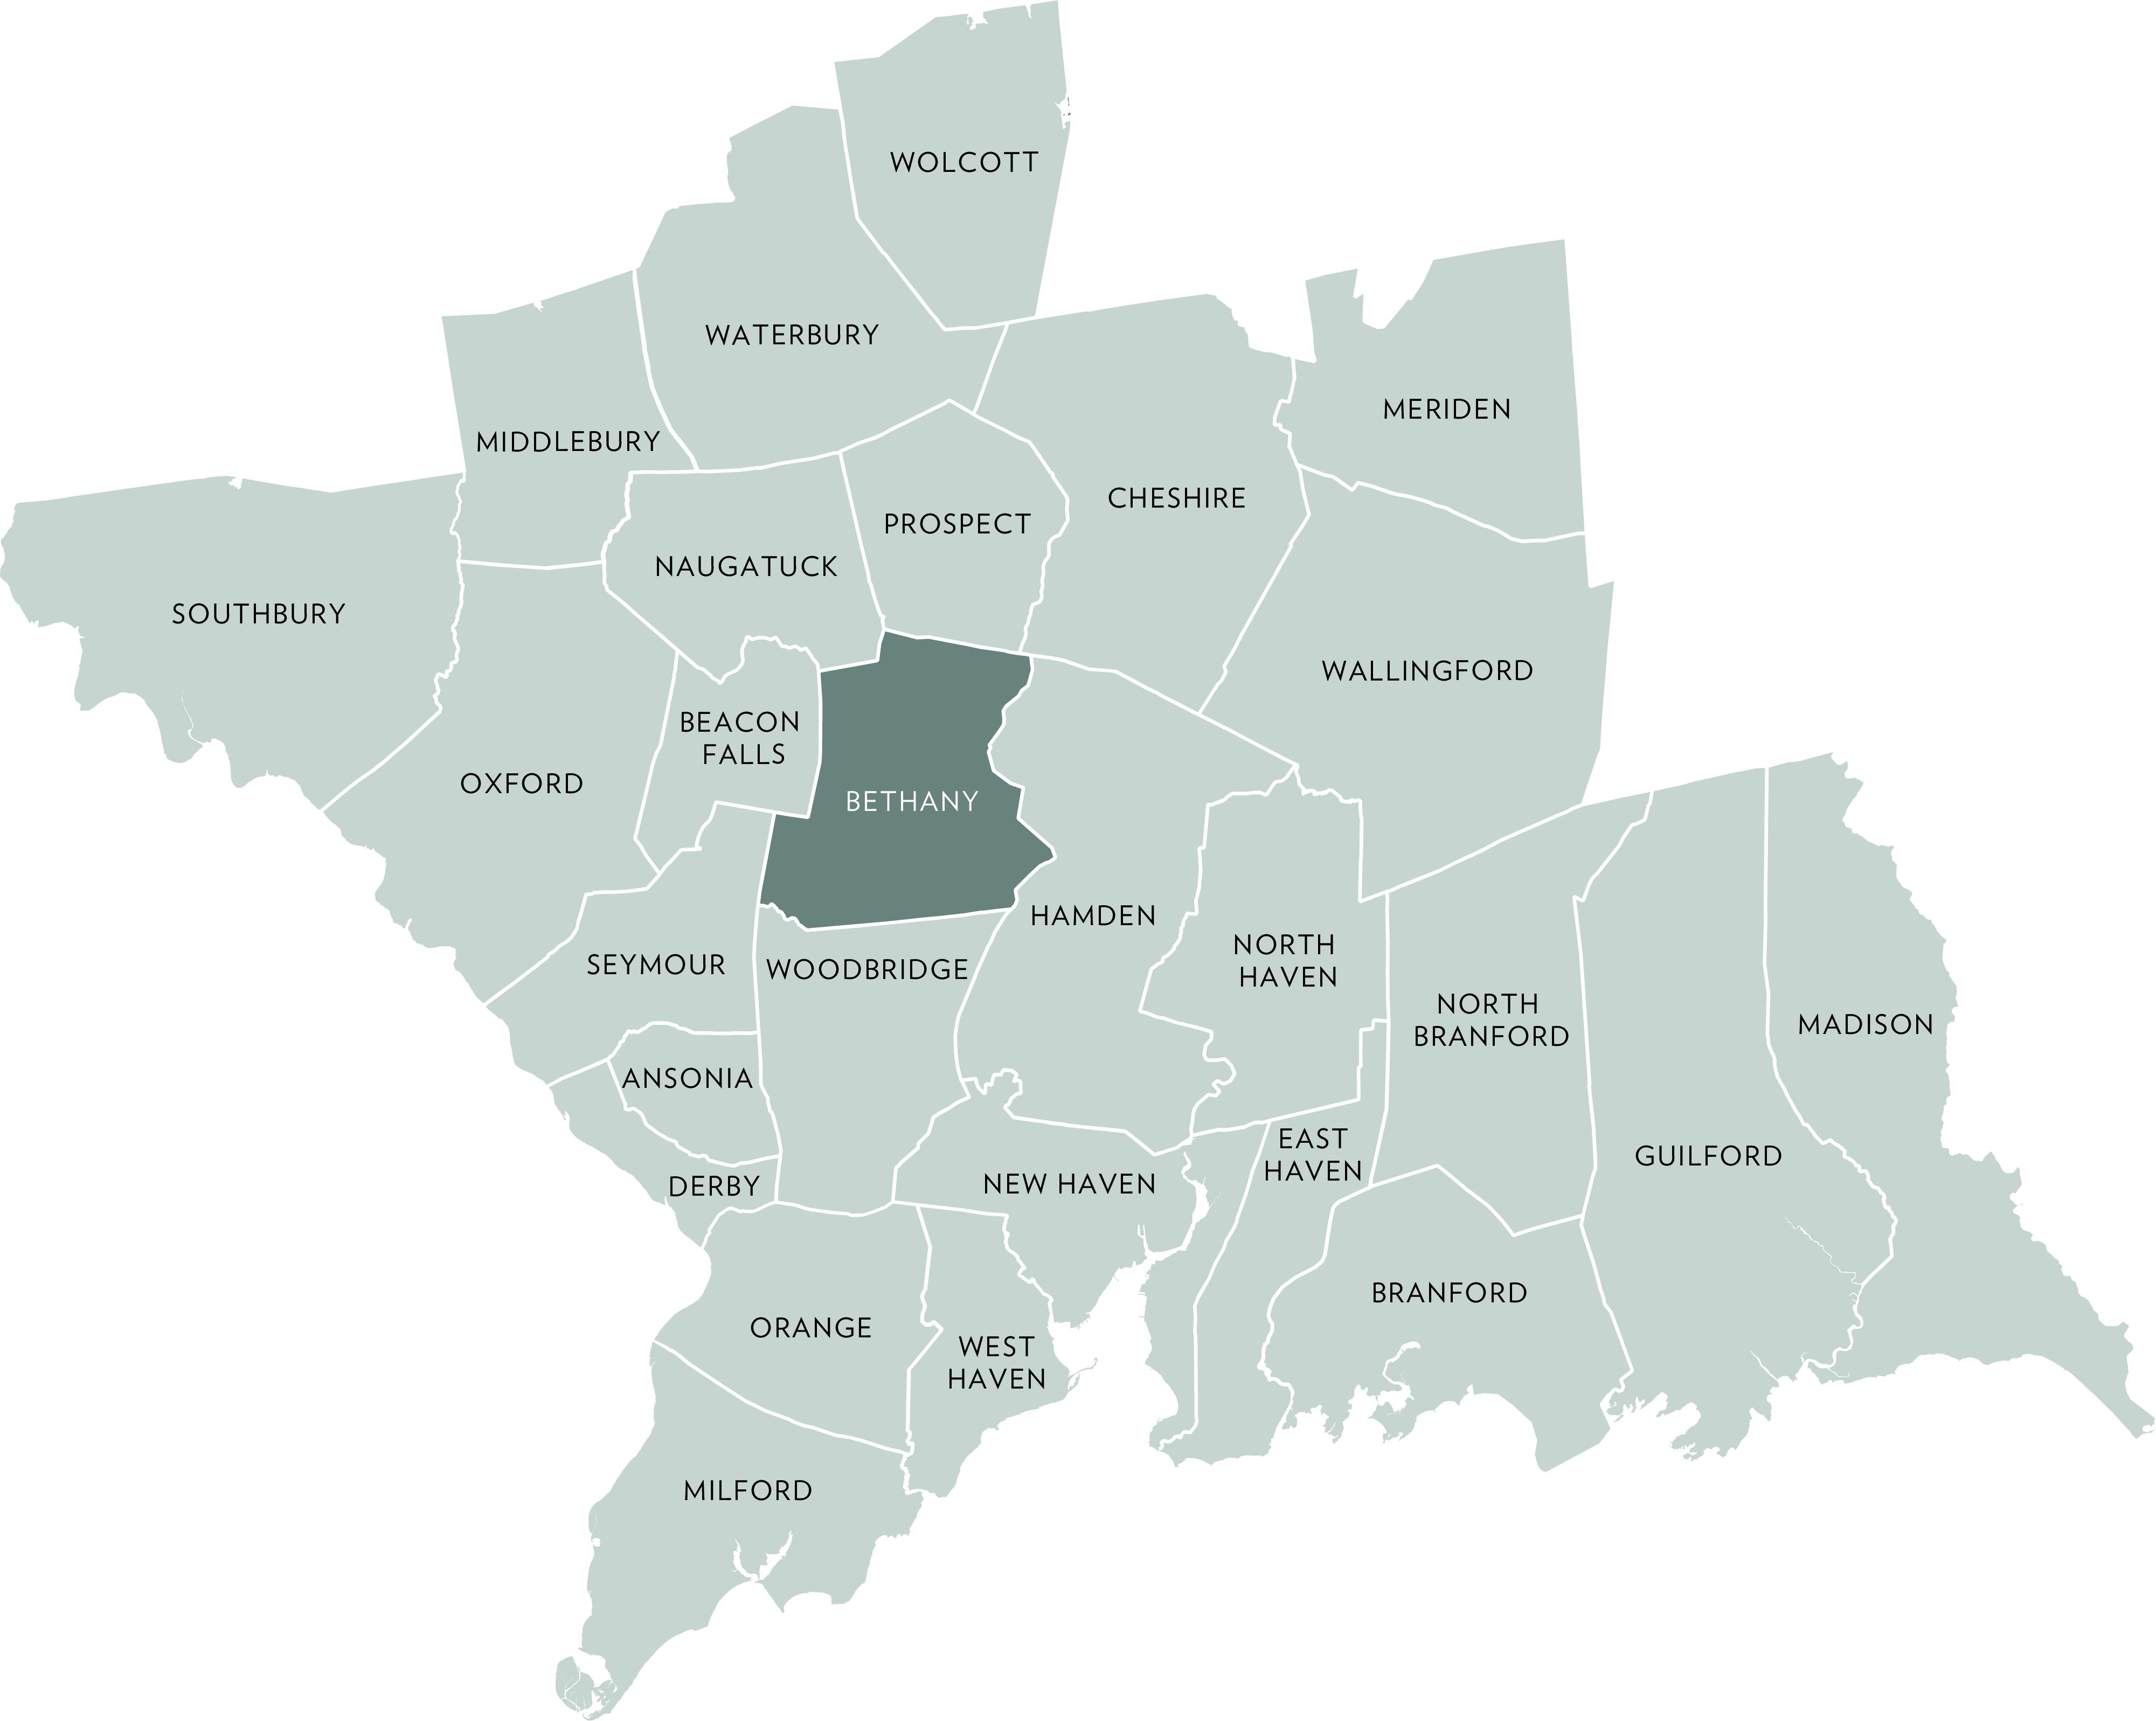
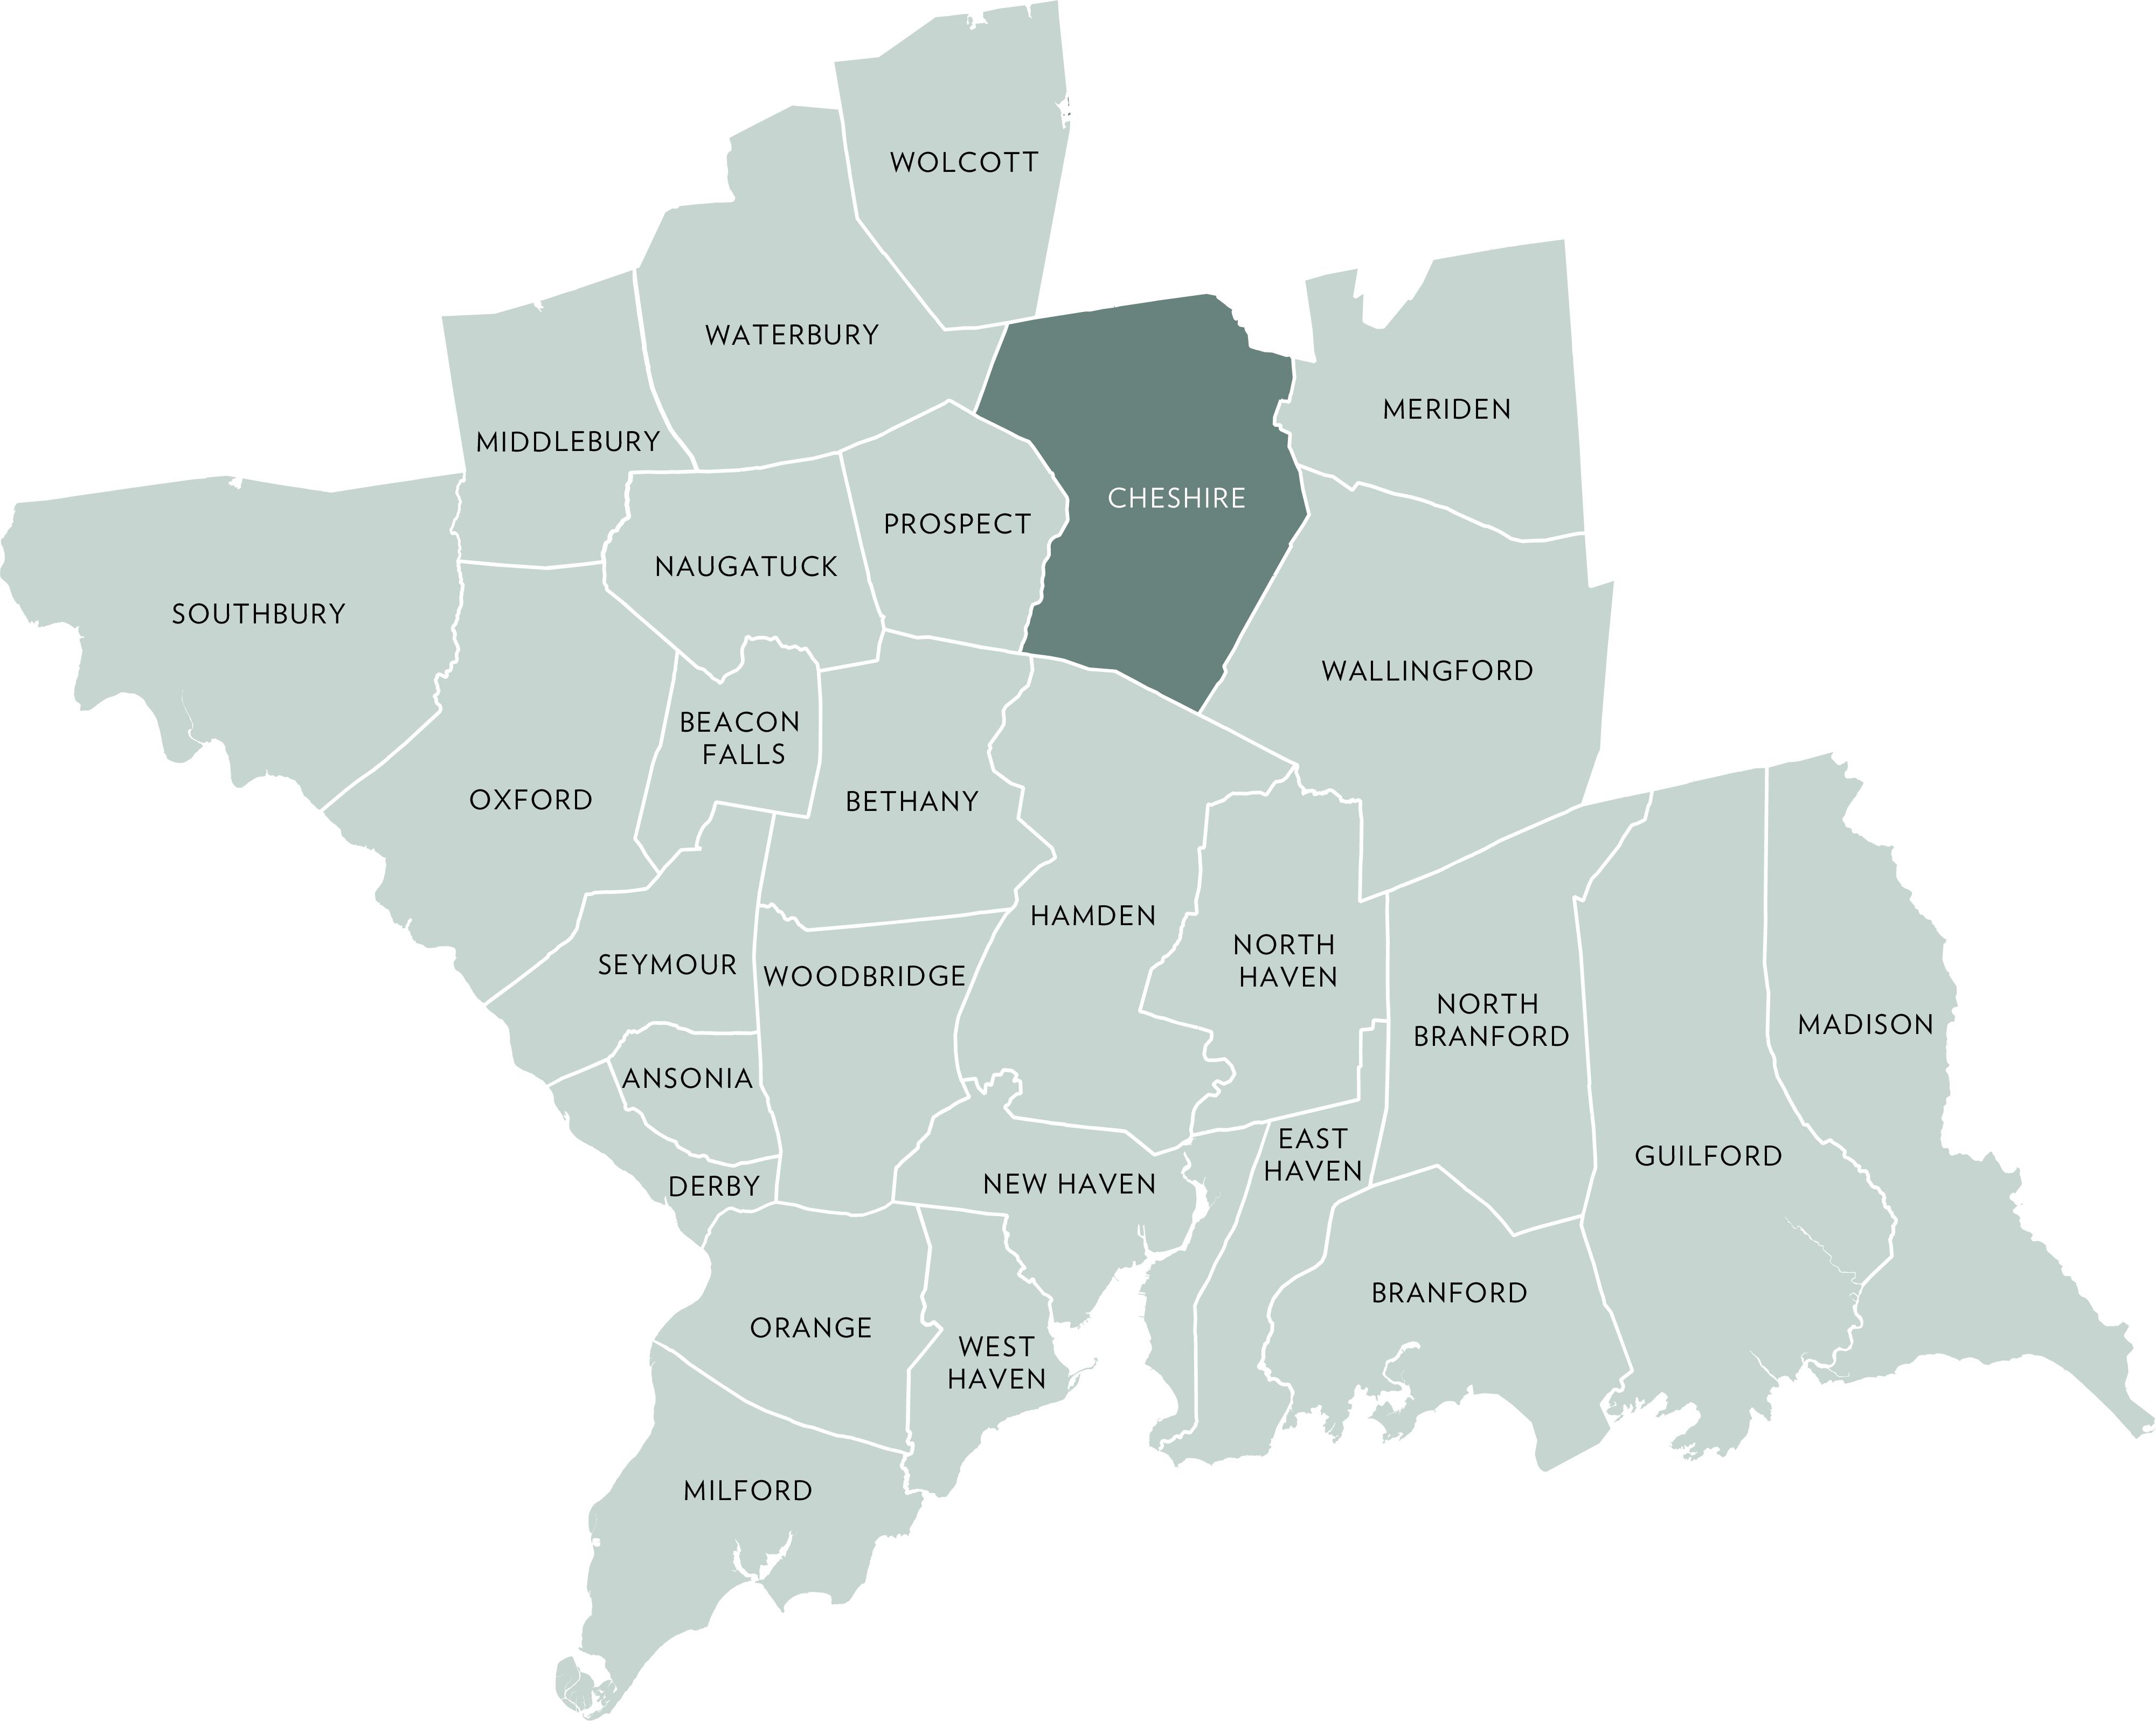
ACTIVE LISTINGS
Q2- 2026 vs Q2- 2025 -21.3%
PENDING LISTINGS
Q2- 2026 vs Q2- 2025 50.0%
Q2- 2026 vs Q2- 2025 8.2%
QUARTERLY MARKET OVERVIEW
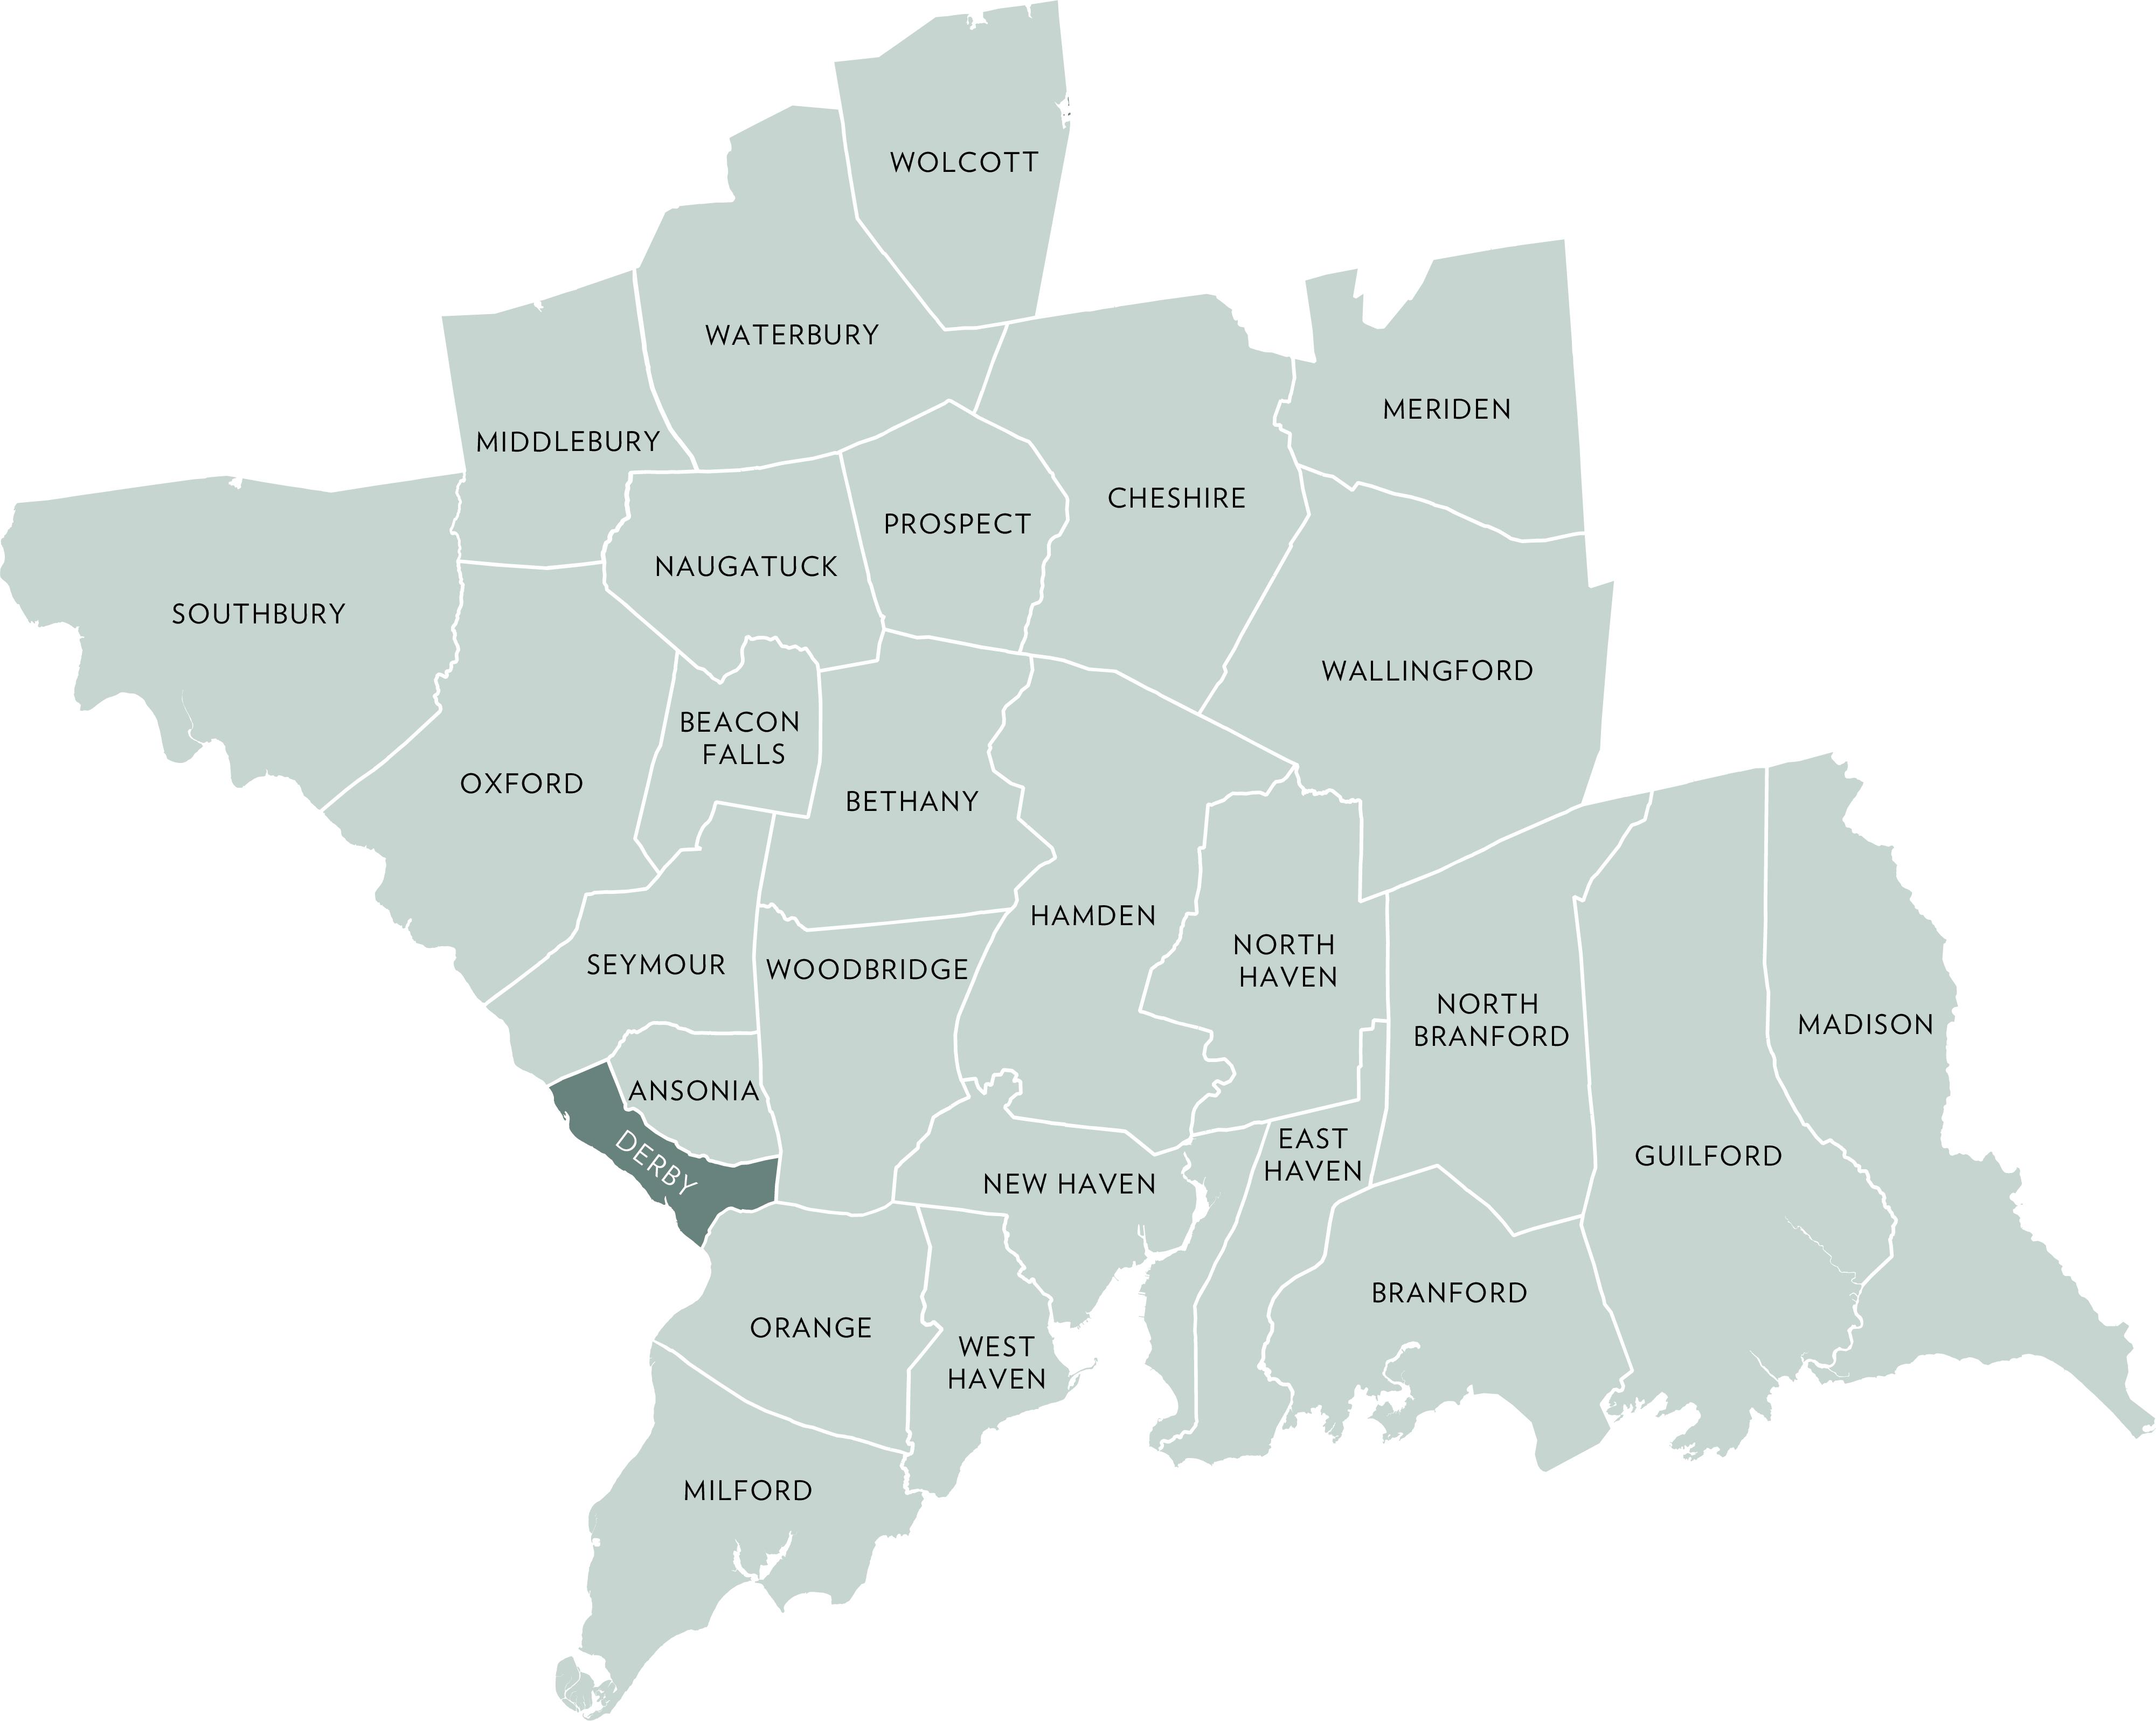
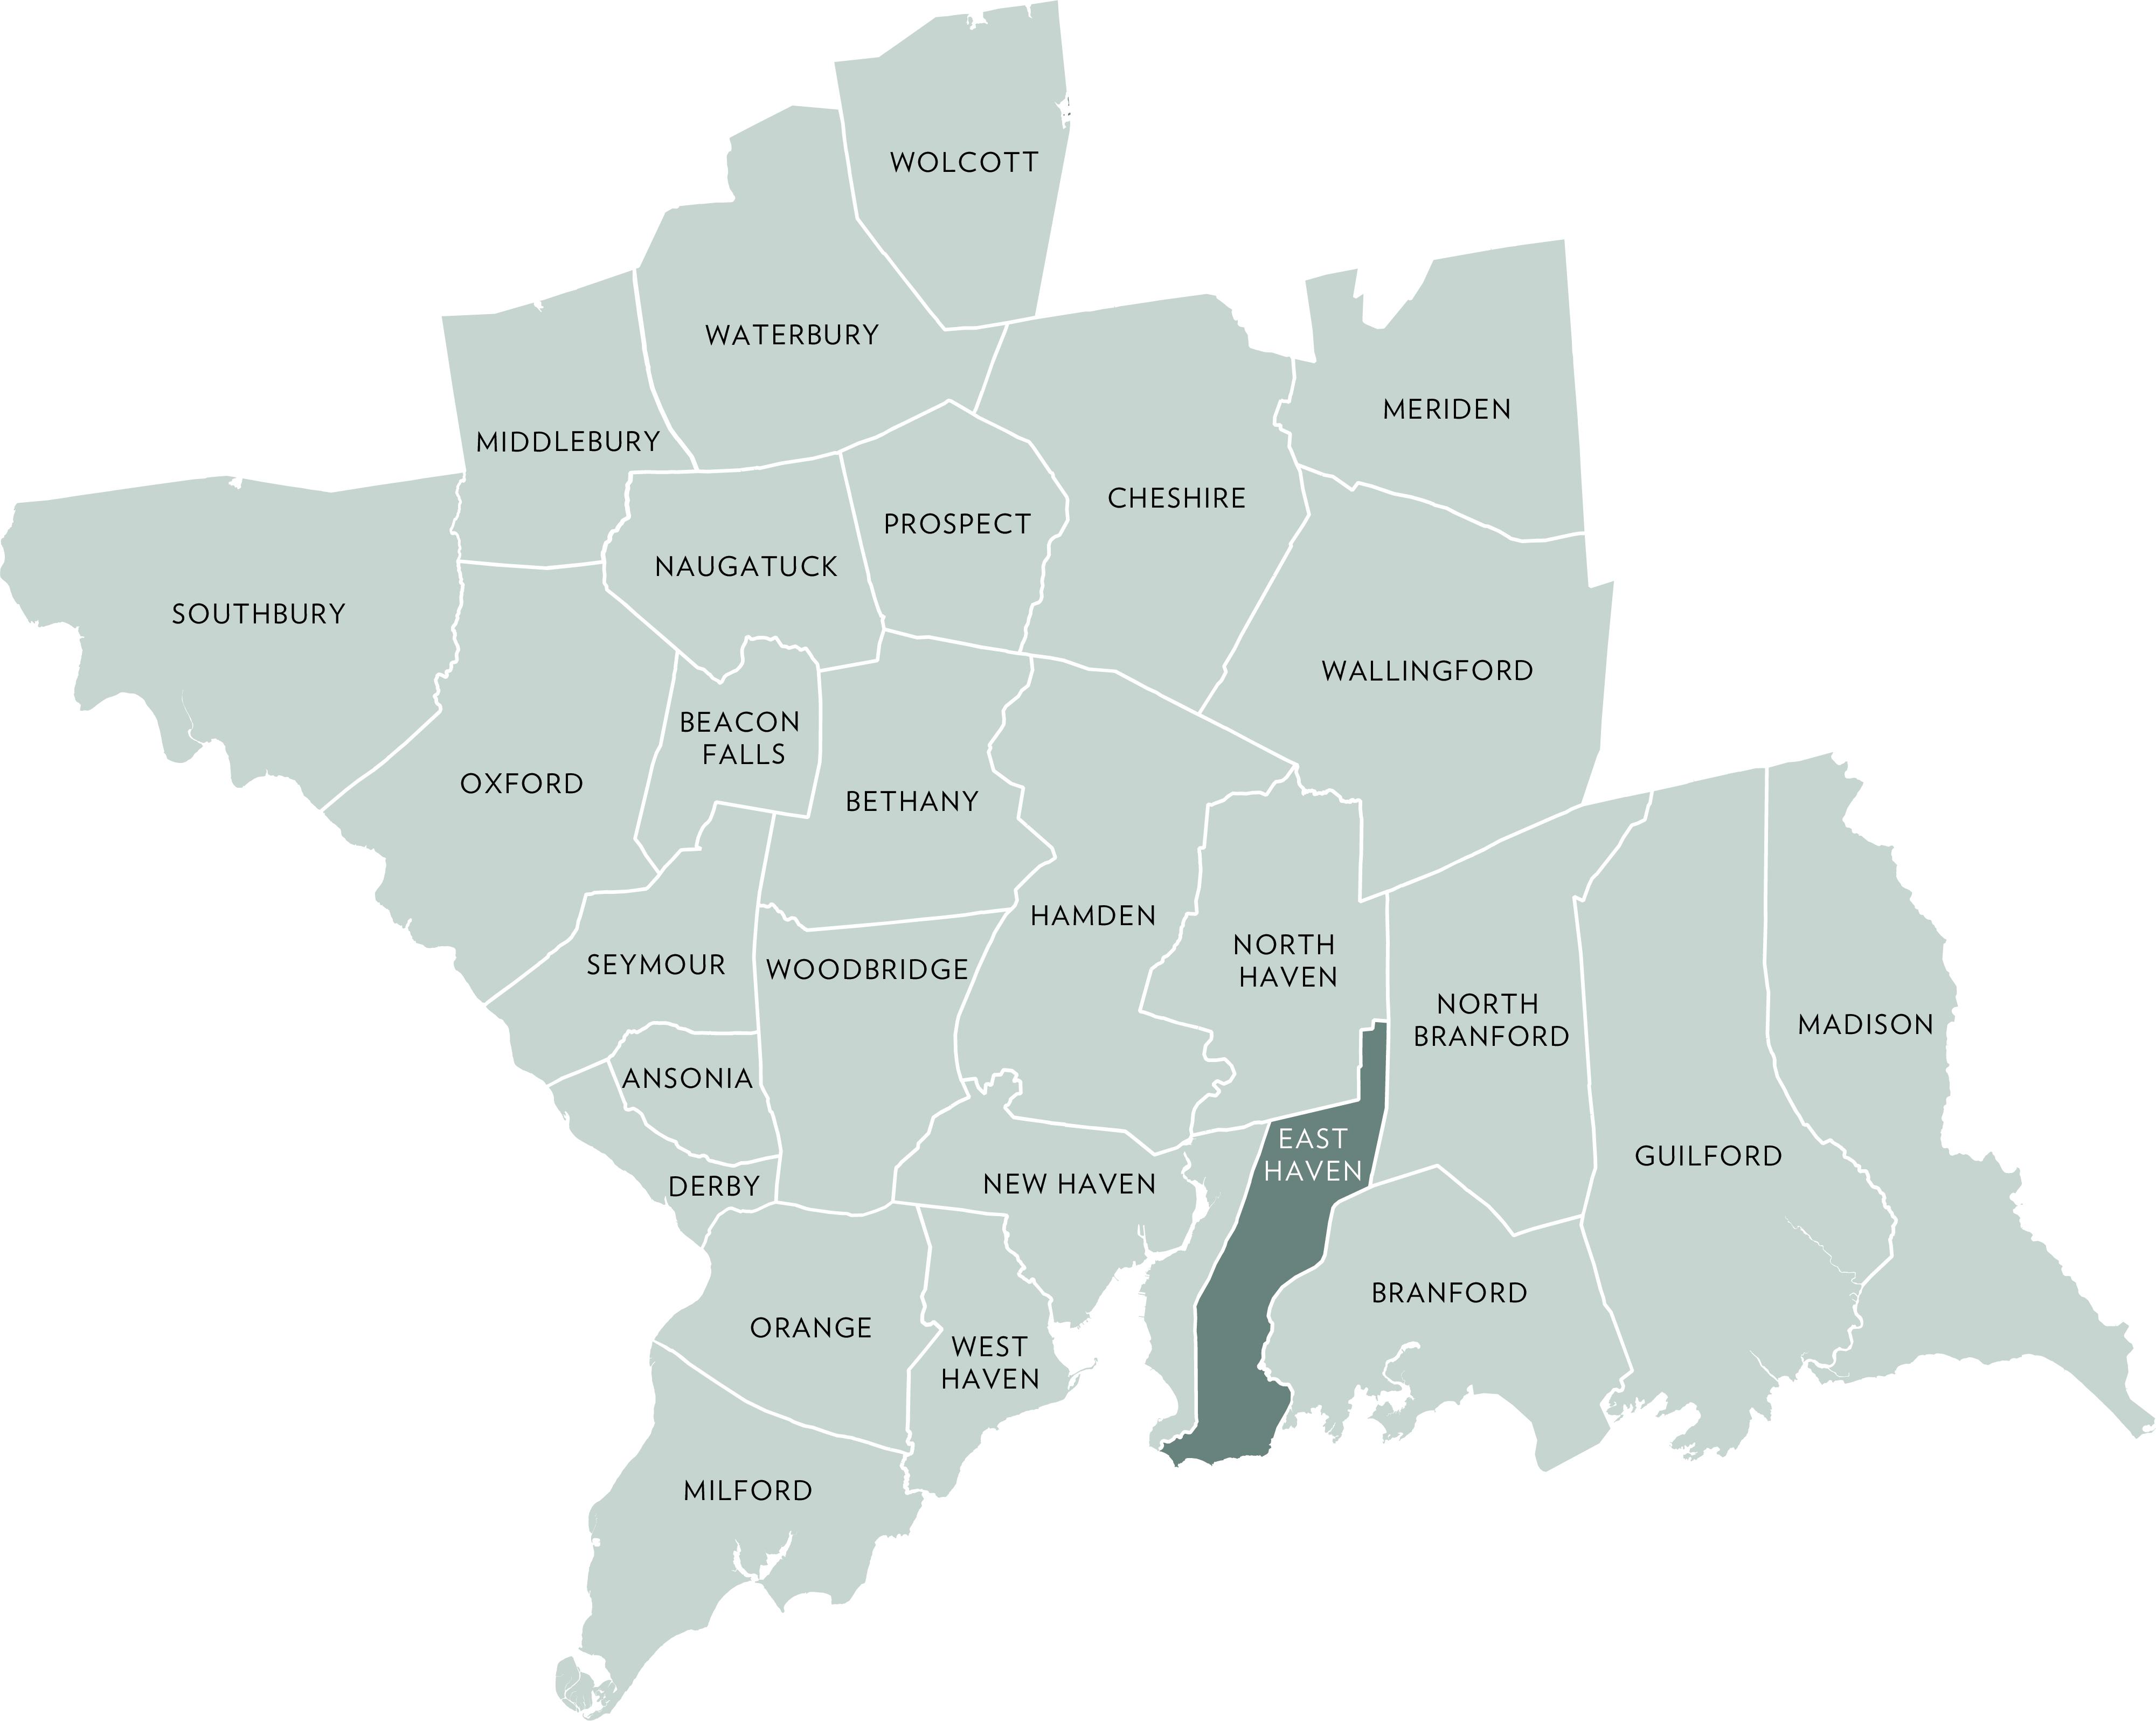
ACTIVE LISTINGS
Q2- 2026 vs Q2- 2025 -15.9%
PENDING LISTINGS
Q2- 2026 vs Q2- 2025 0.0%
Q2- 2026 vs Q2- 2025 -9.3%
QUARTERLY MARKET OVERVIEW
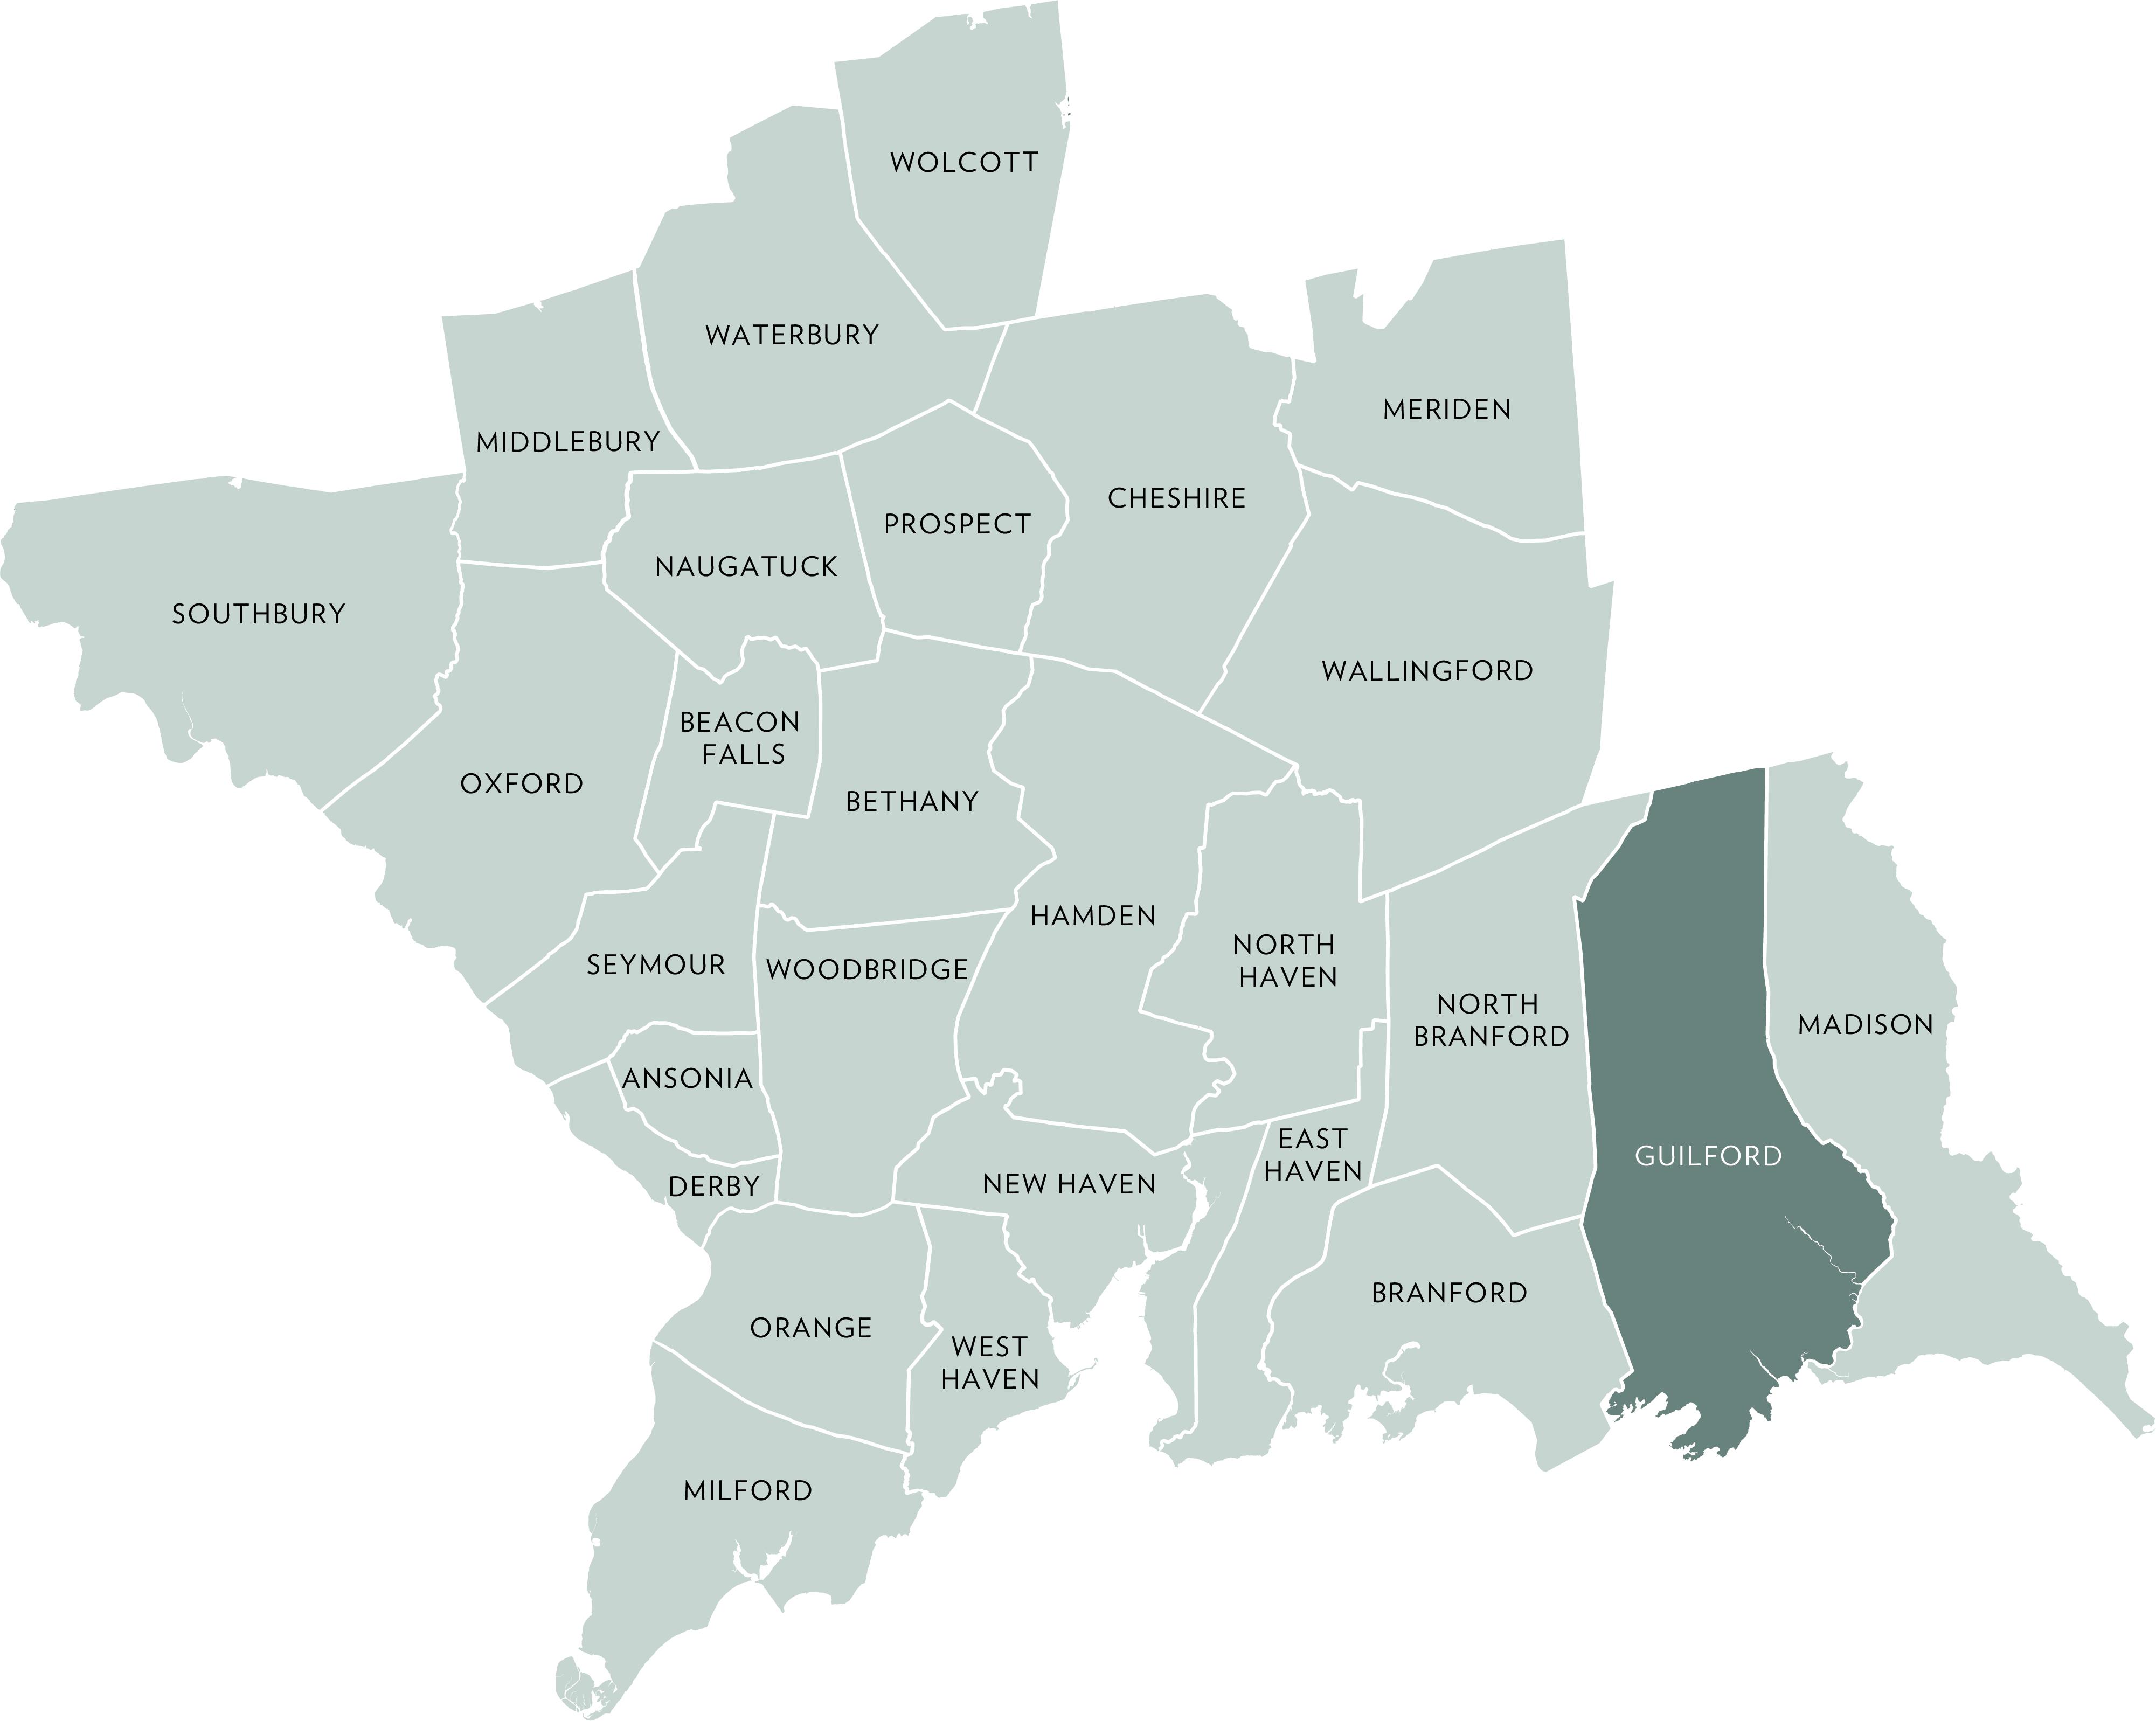
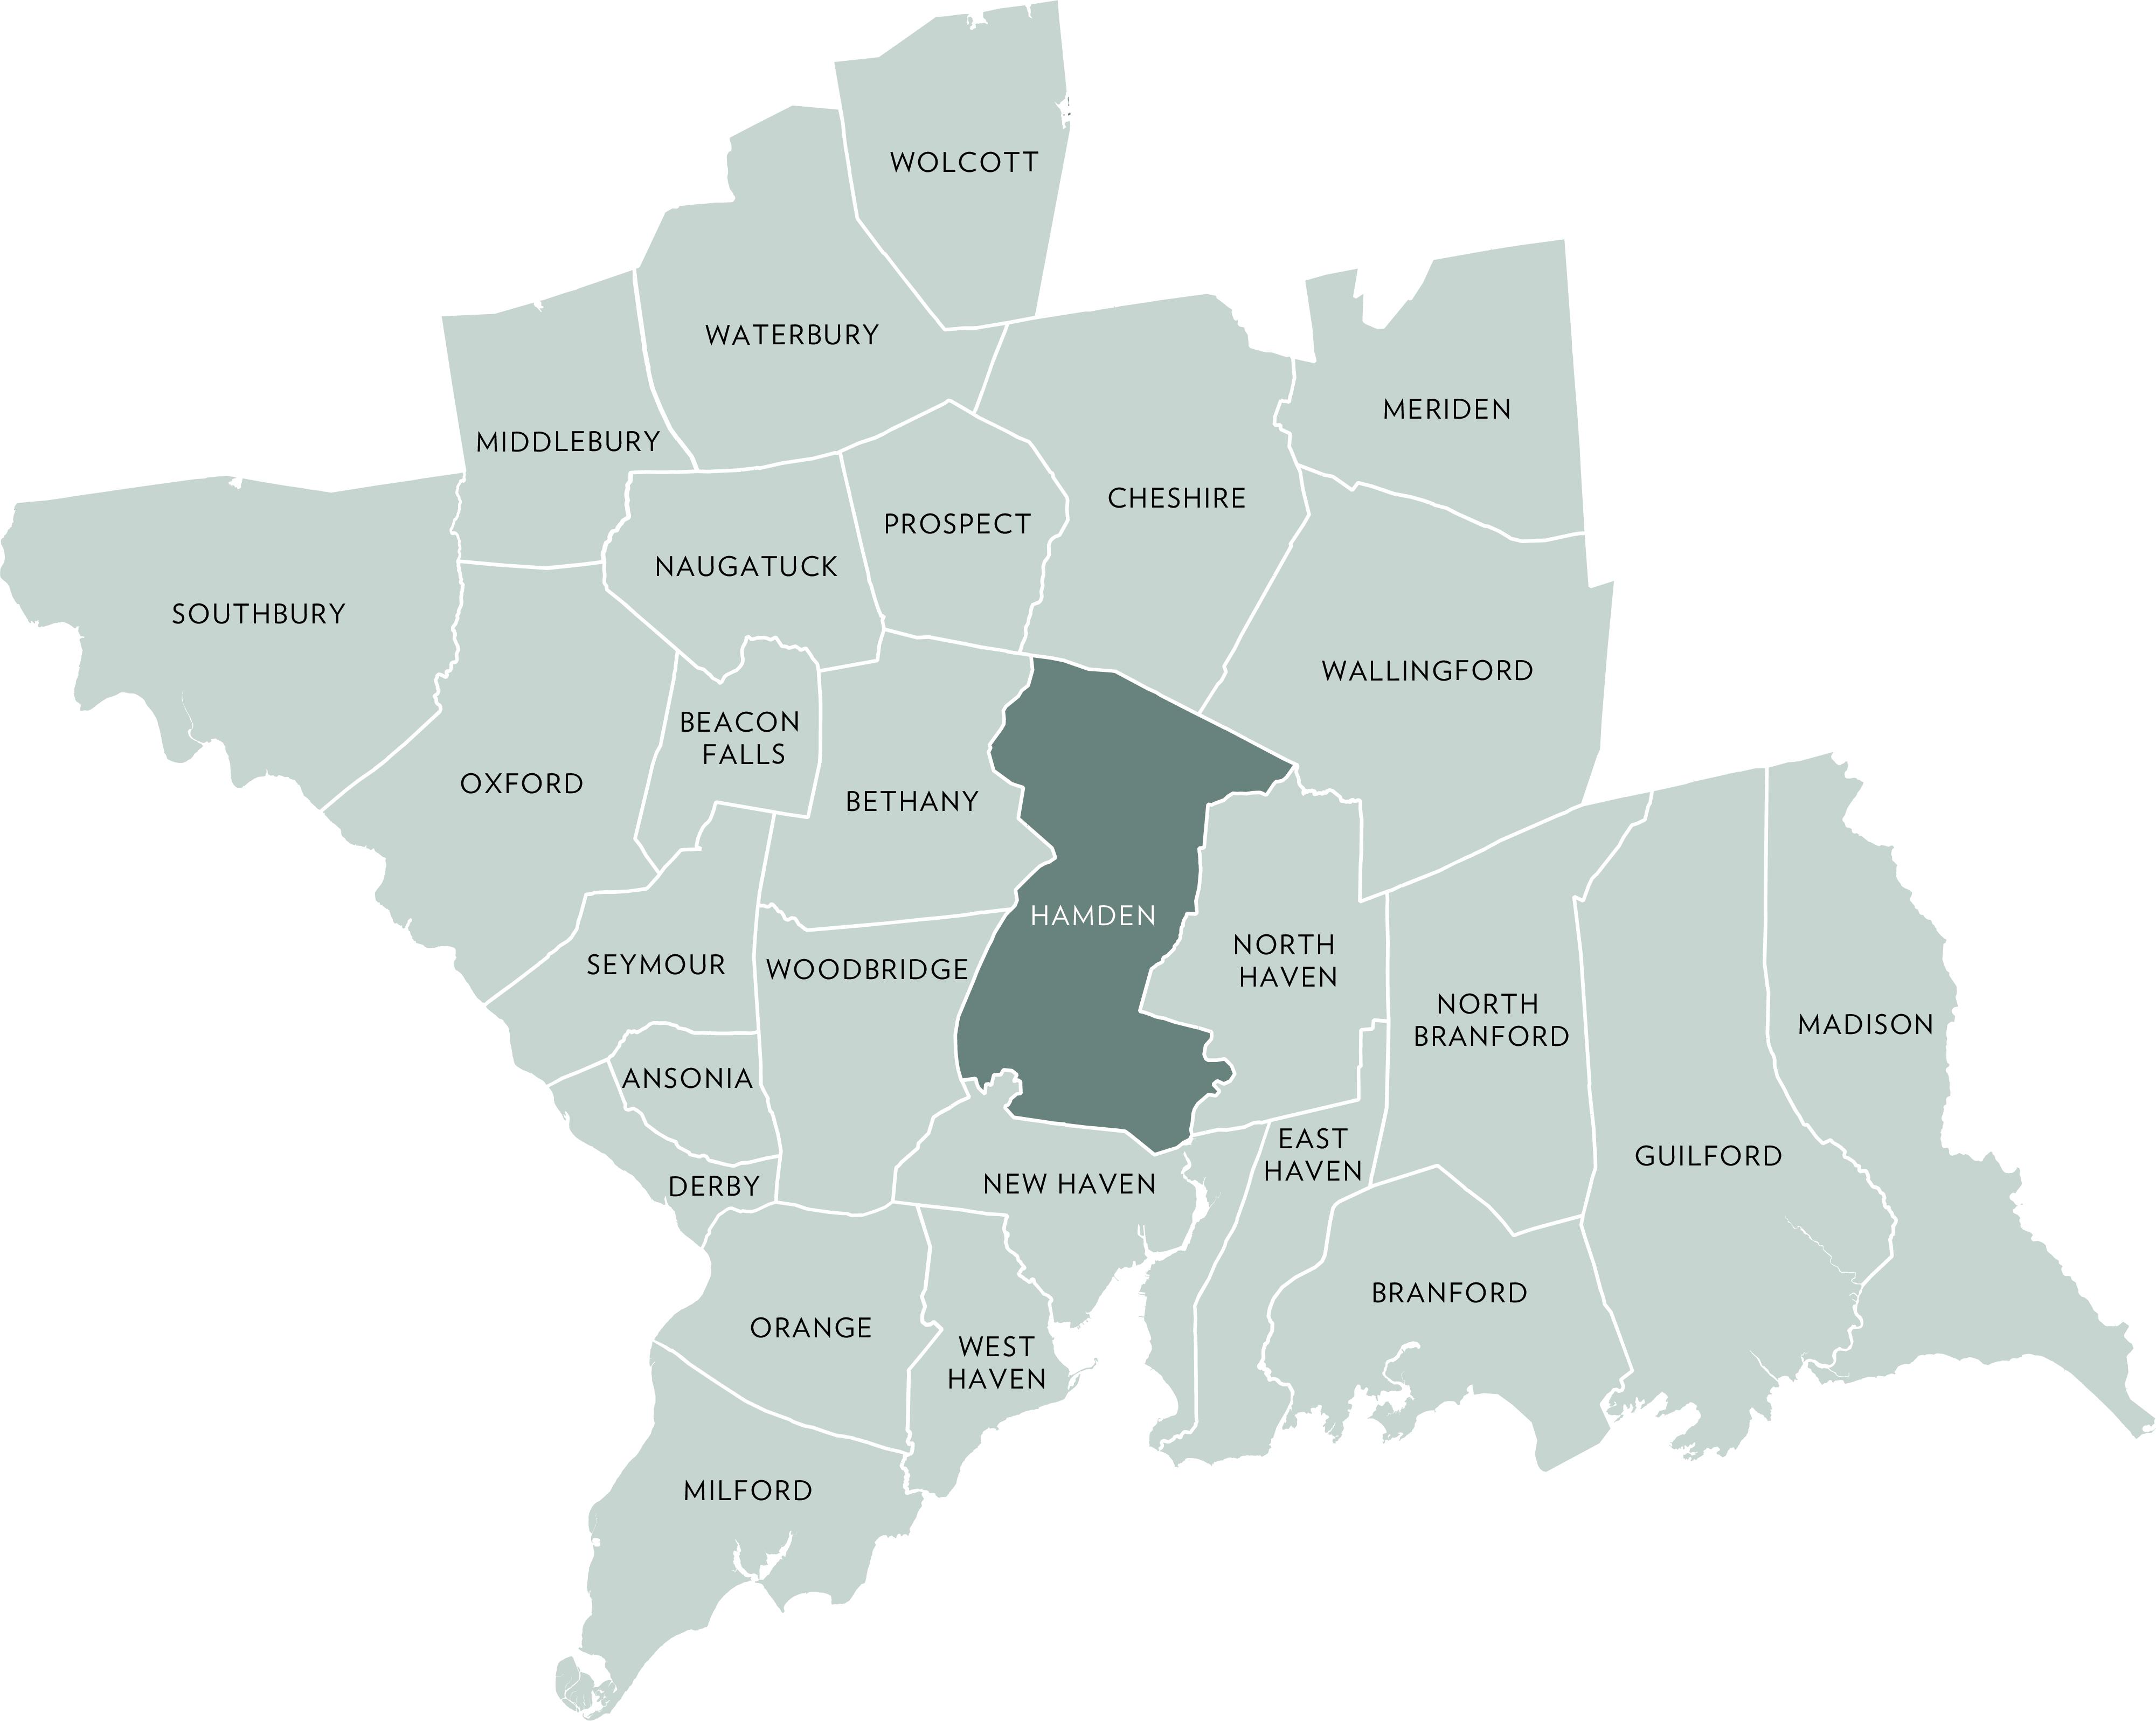
ACTIVE LISTINGS
Q2- 2026 vs Q2- 2025 76.1%
PENDING LISTINGS
Q2- 2026 vs Q2- 2025 -13.3% SOLD LISTINGS
Q2- 2026 vs Q2- 2025 3.0%
QUARTERLY MARKET OVERVIEW
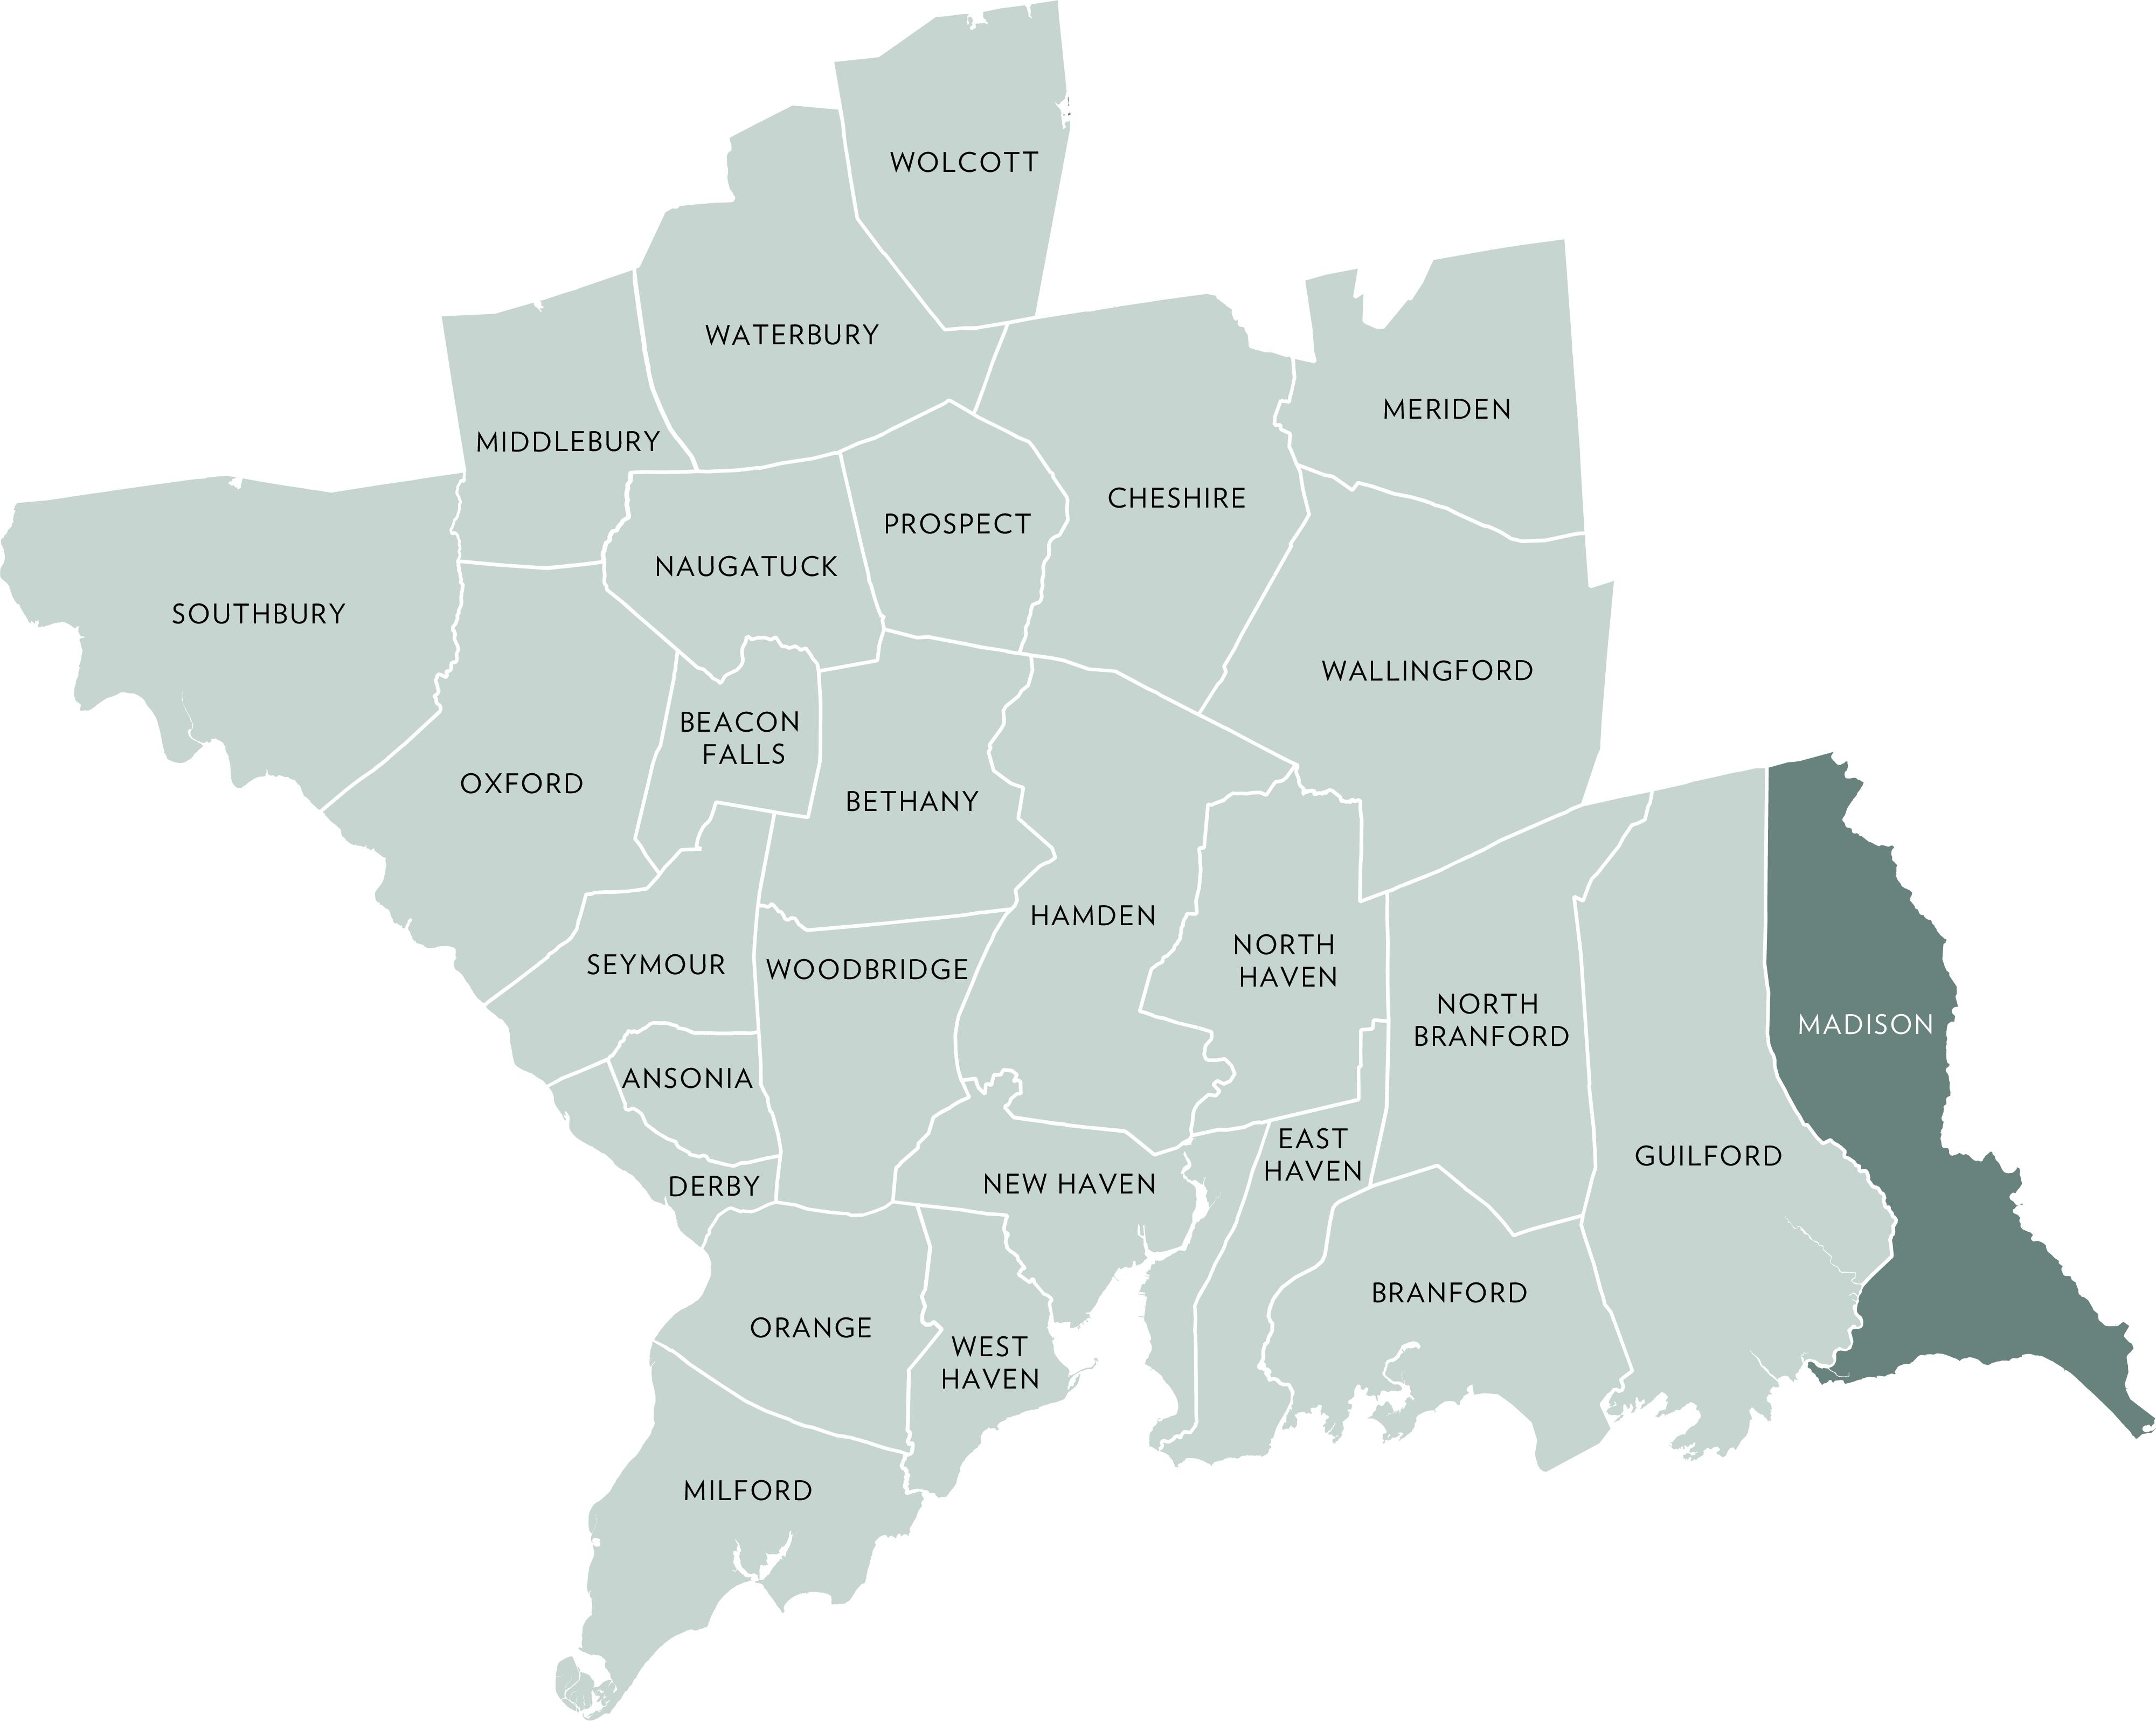
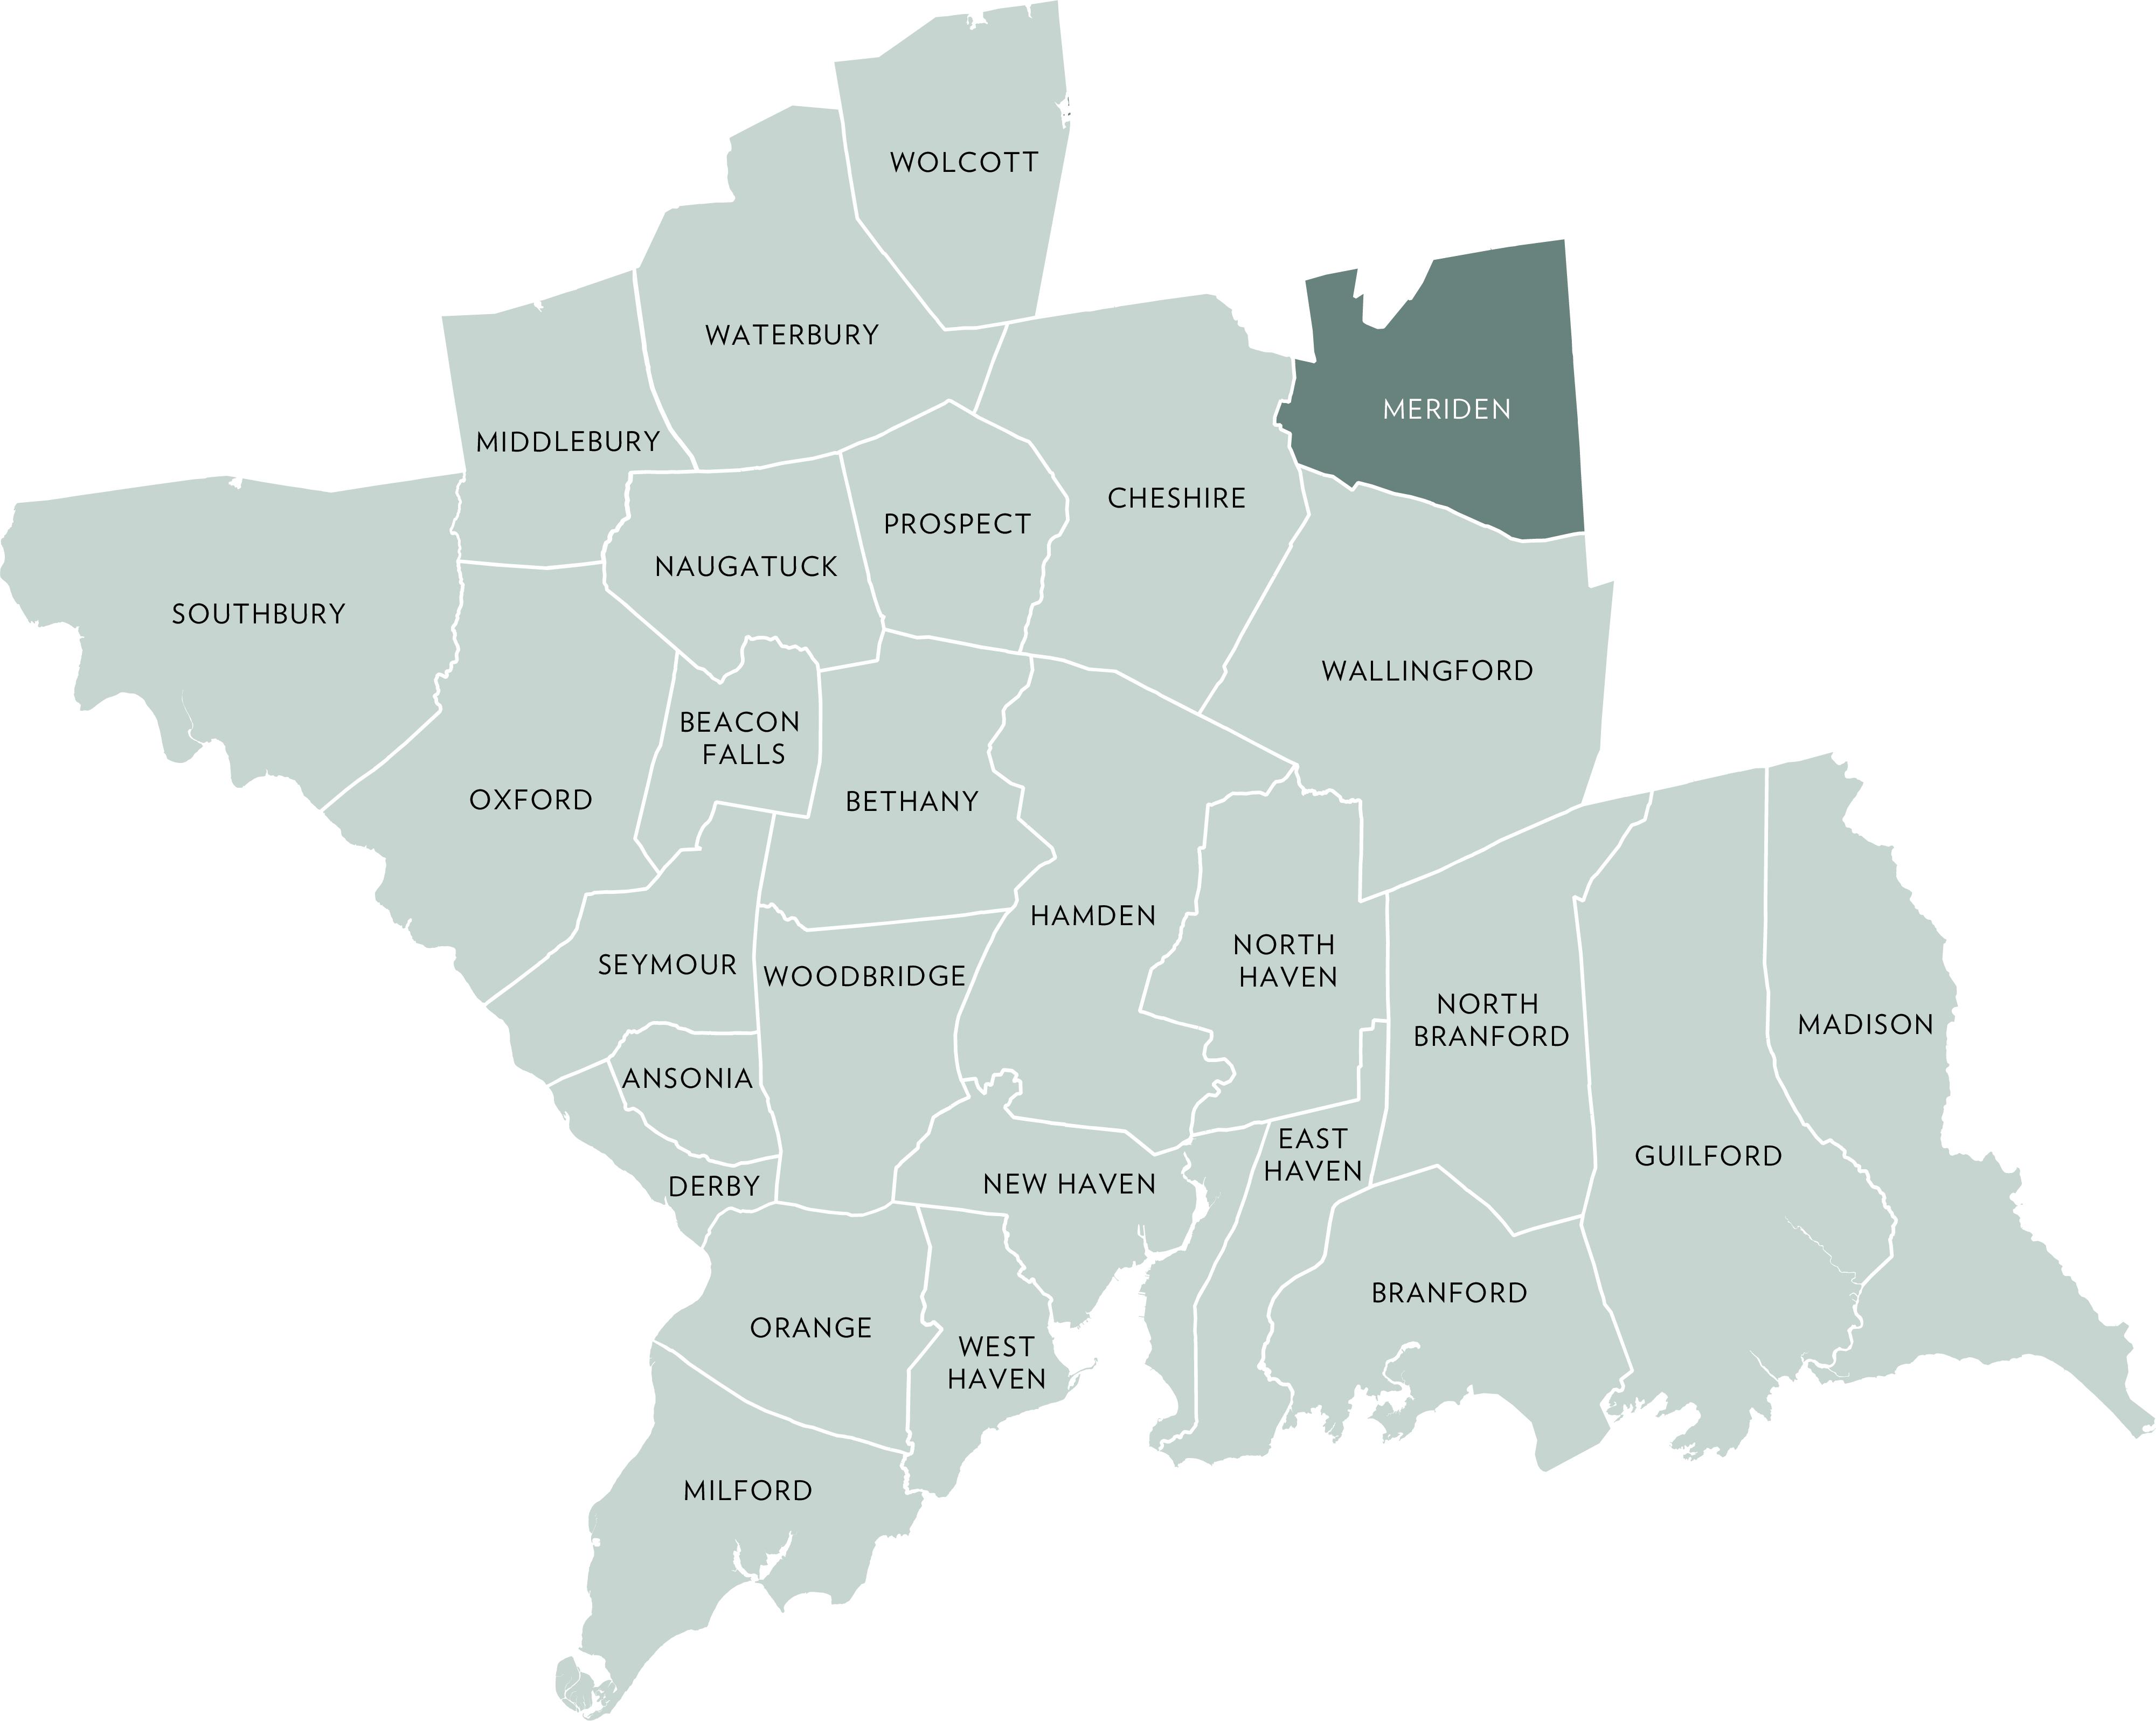
ACTIVE LISTINGS
Q2- 2026 vs Q2- 2025
27.8%
PENDING LISTINGS
Q2- 2026 vs Q2- 2025 16.7%
LISTINGS
Q2- 2026 vs Q2- 2025 -19.3% Source : Smart MLS, Single Family For Sale
QUARTERLY MARKET OVERVIEW
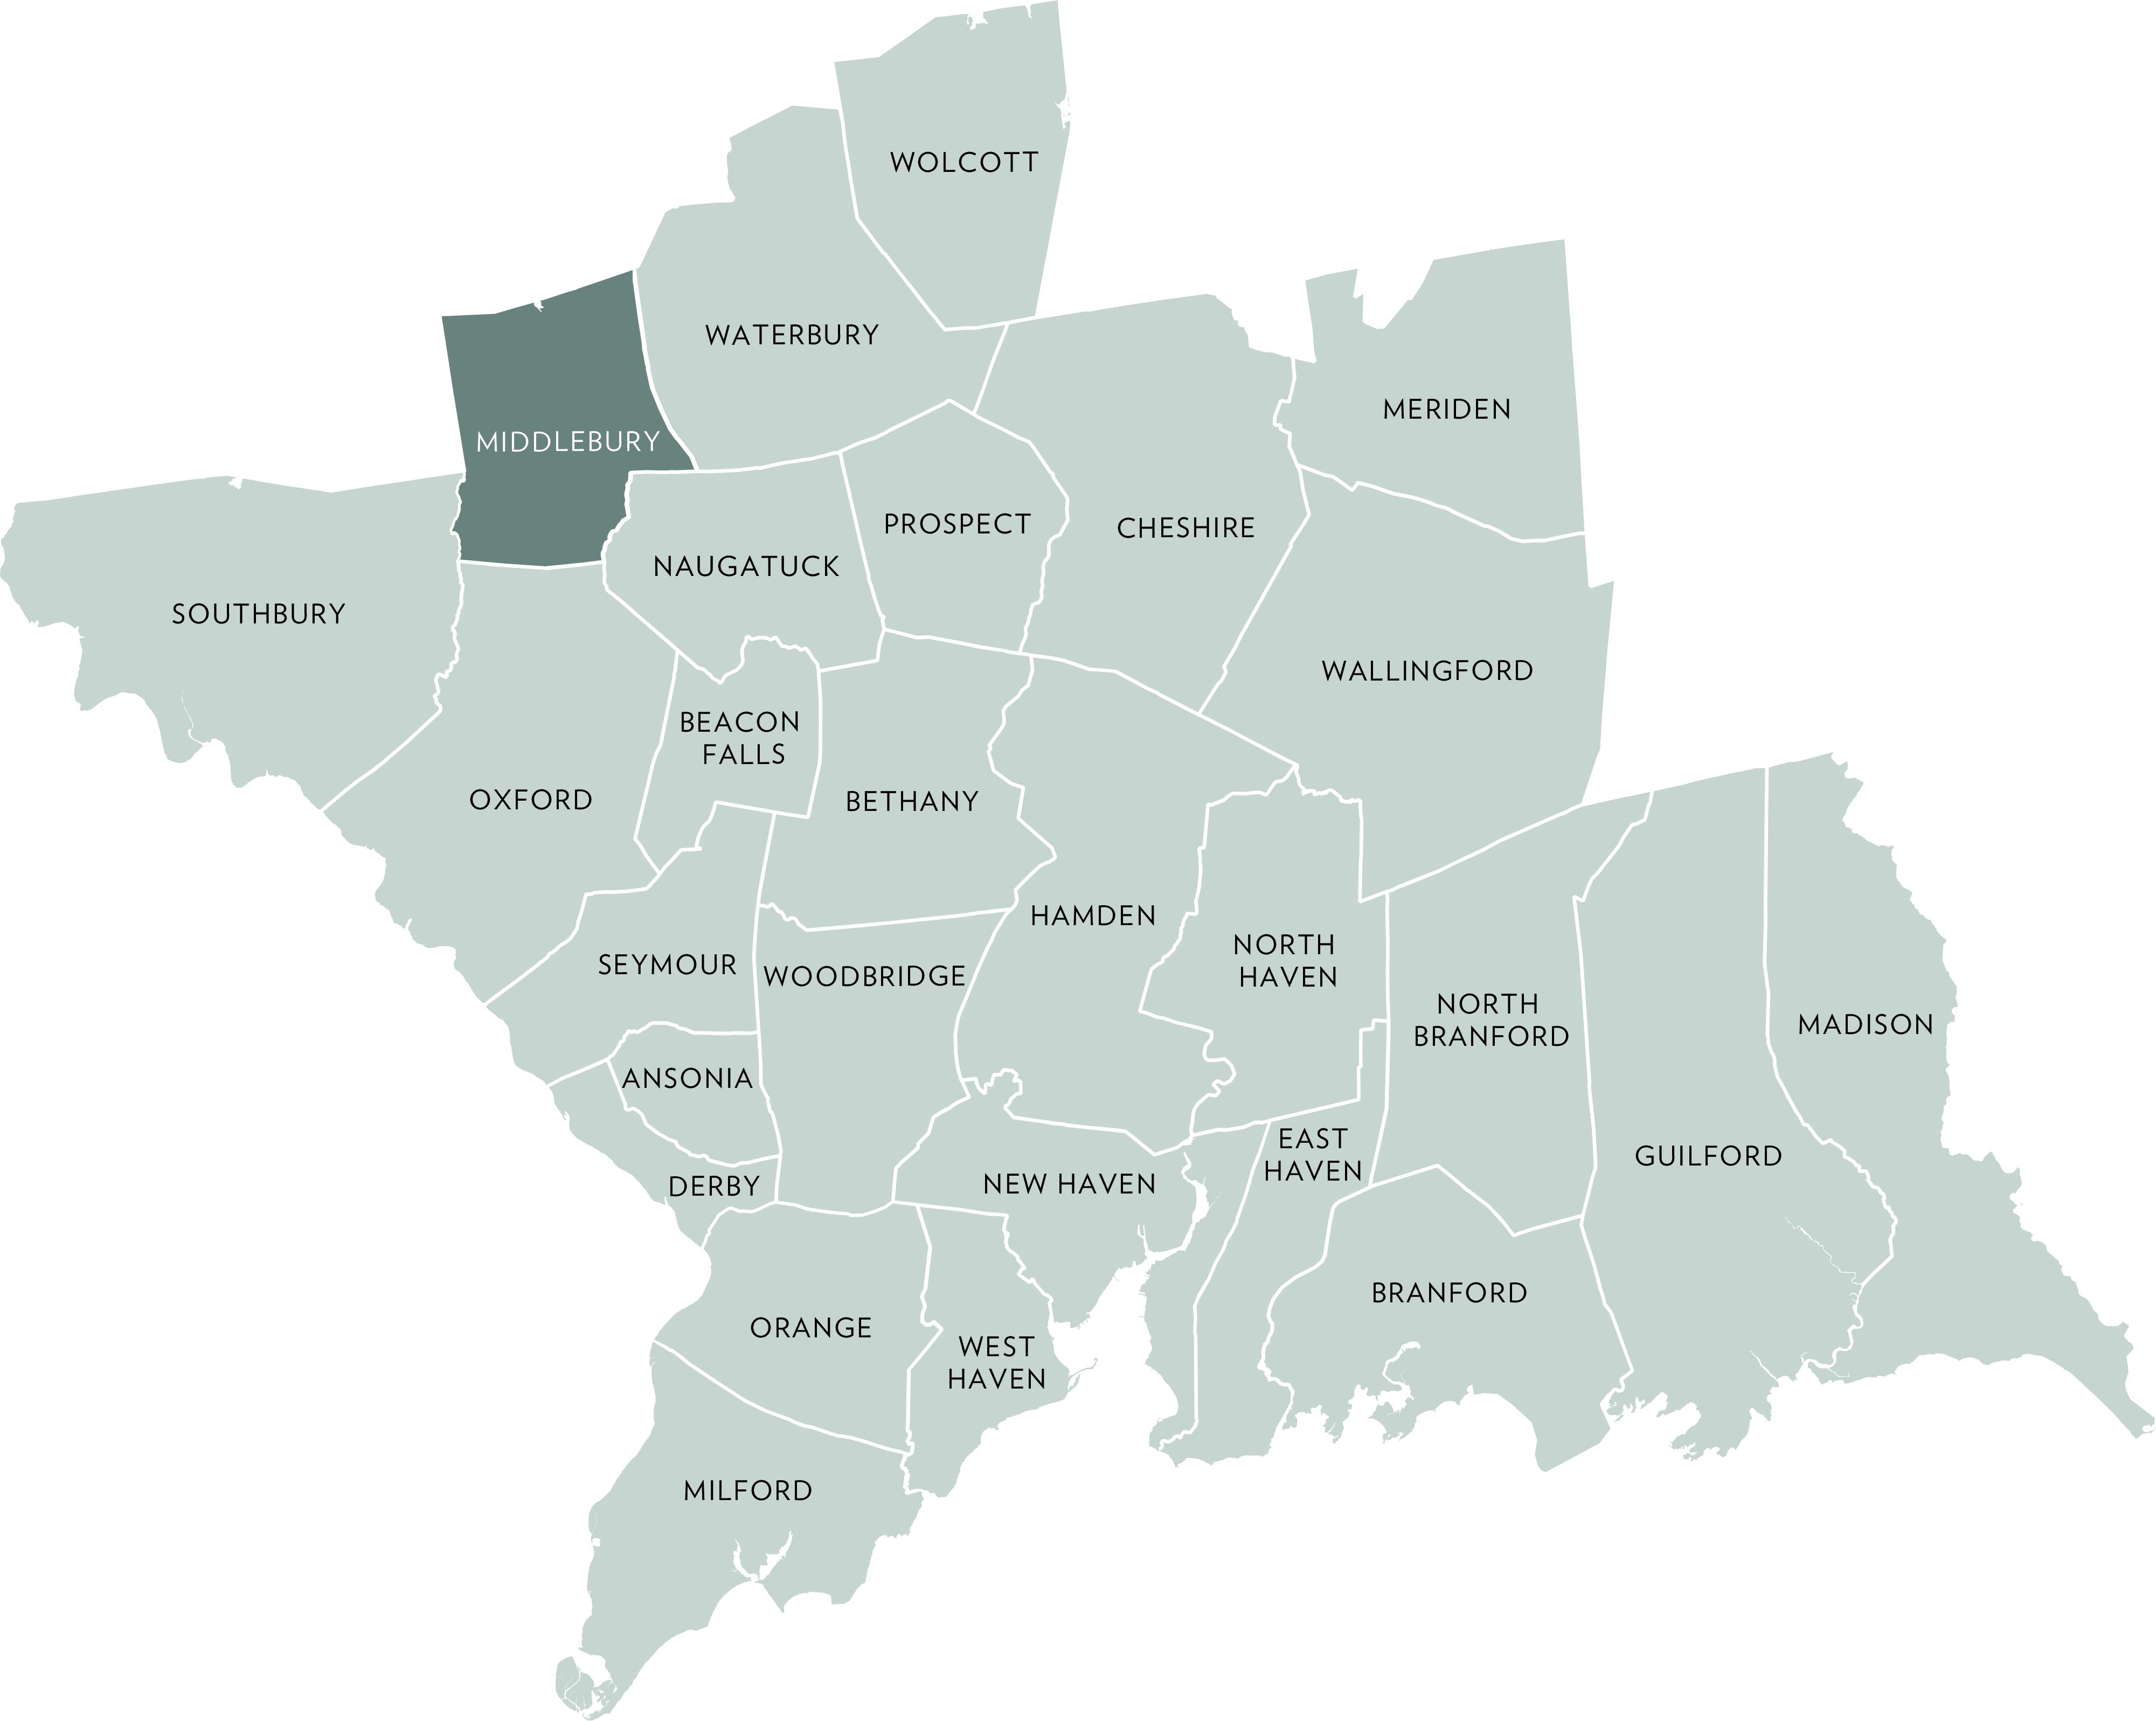
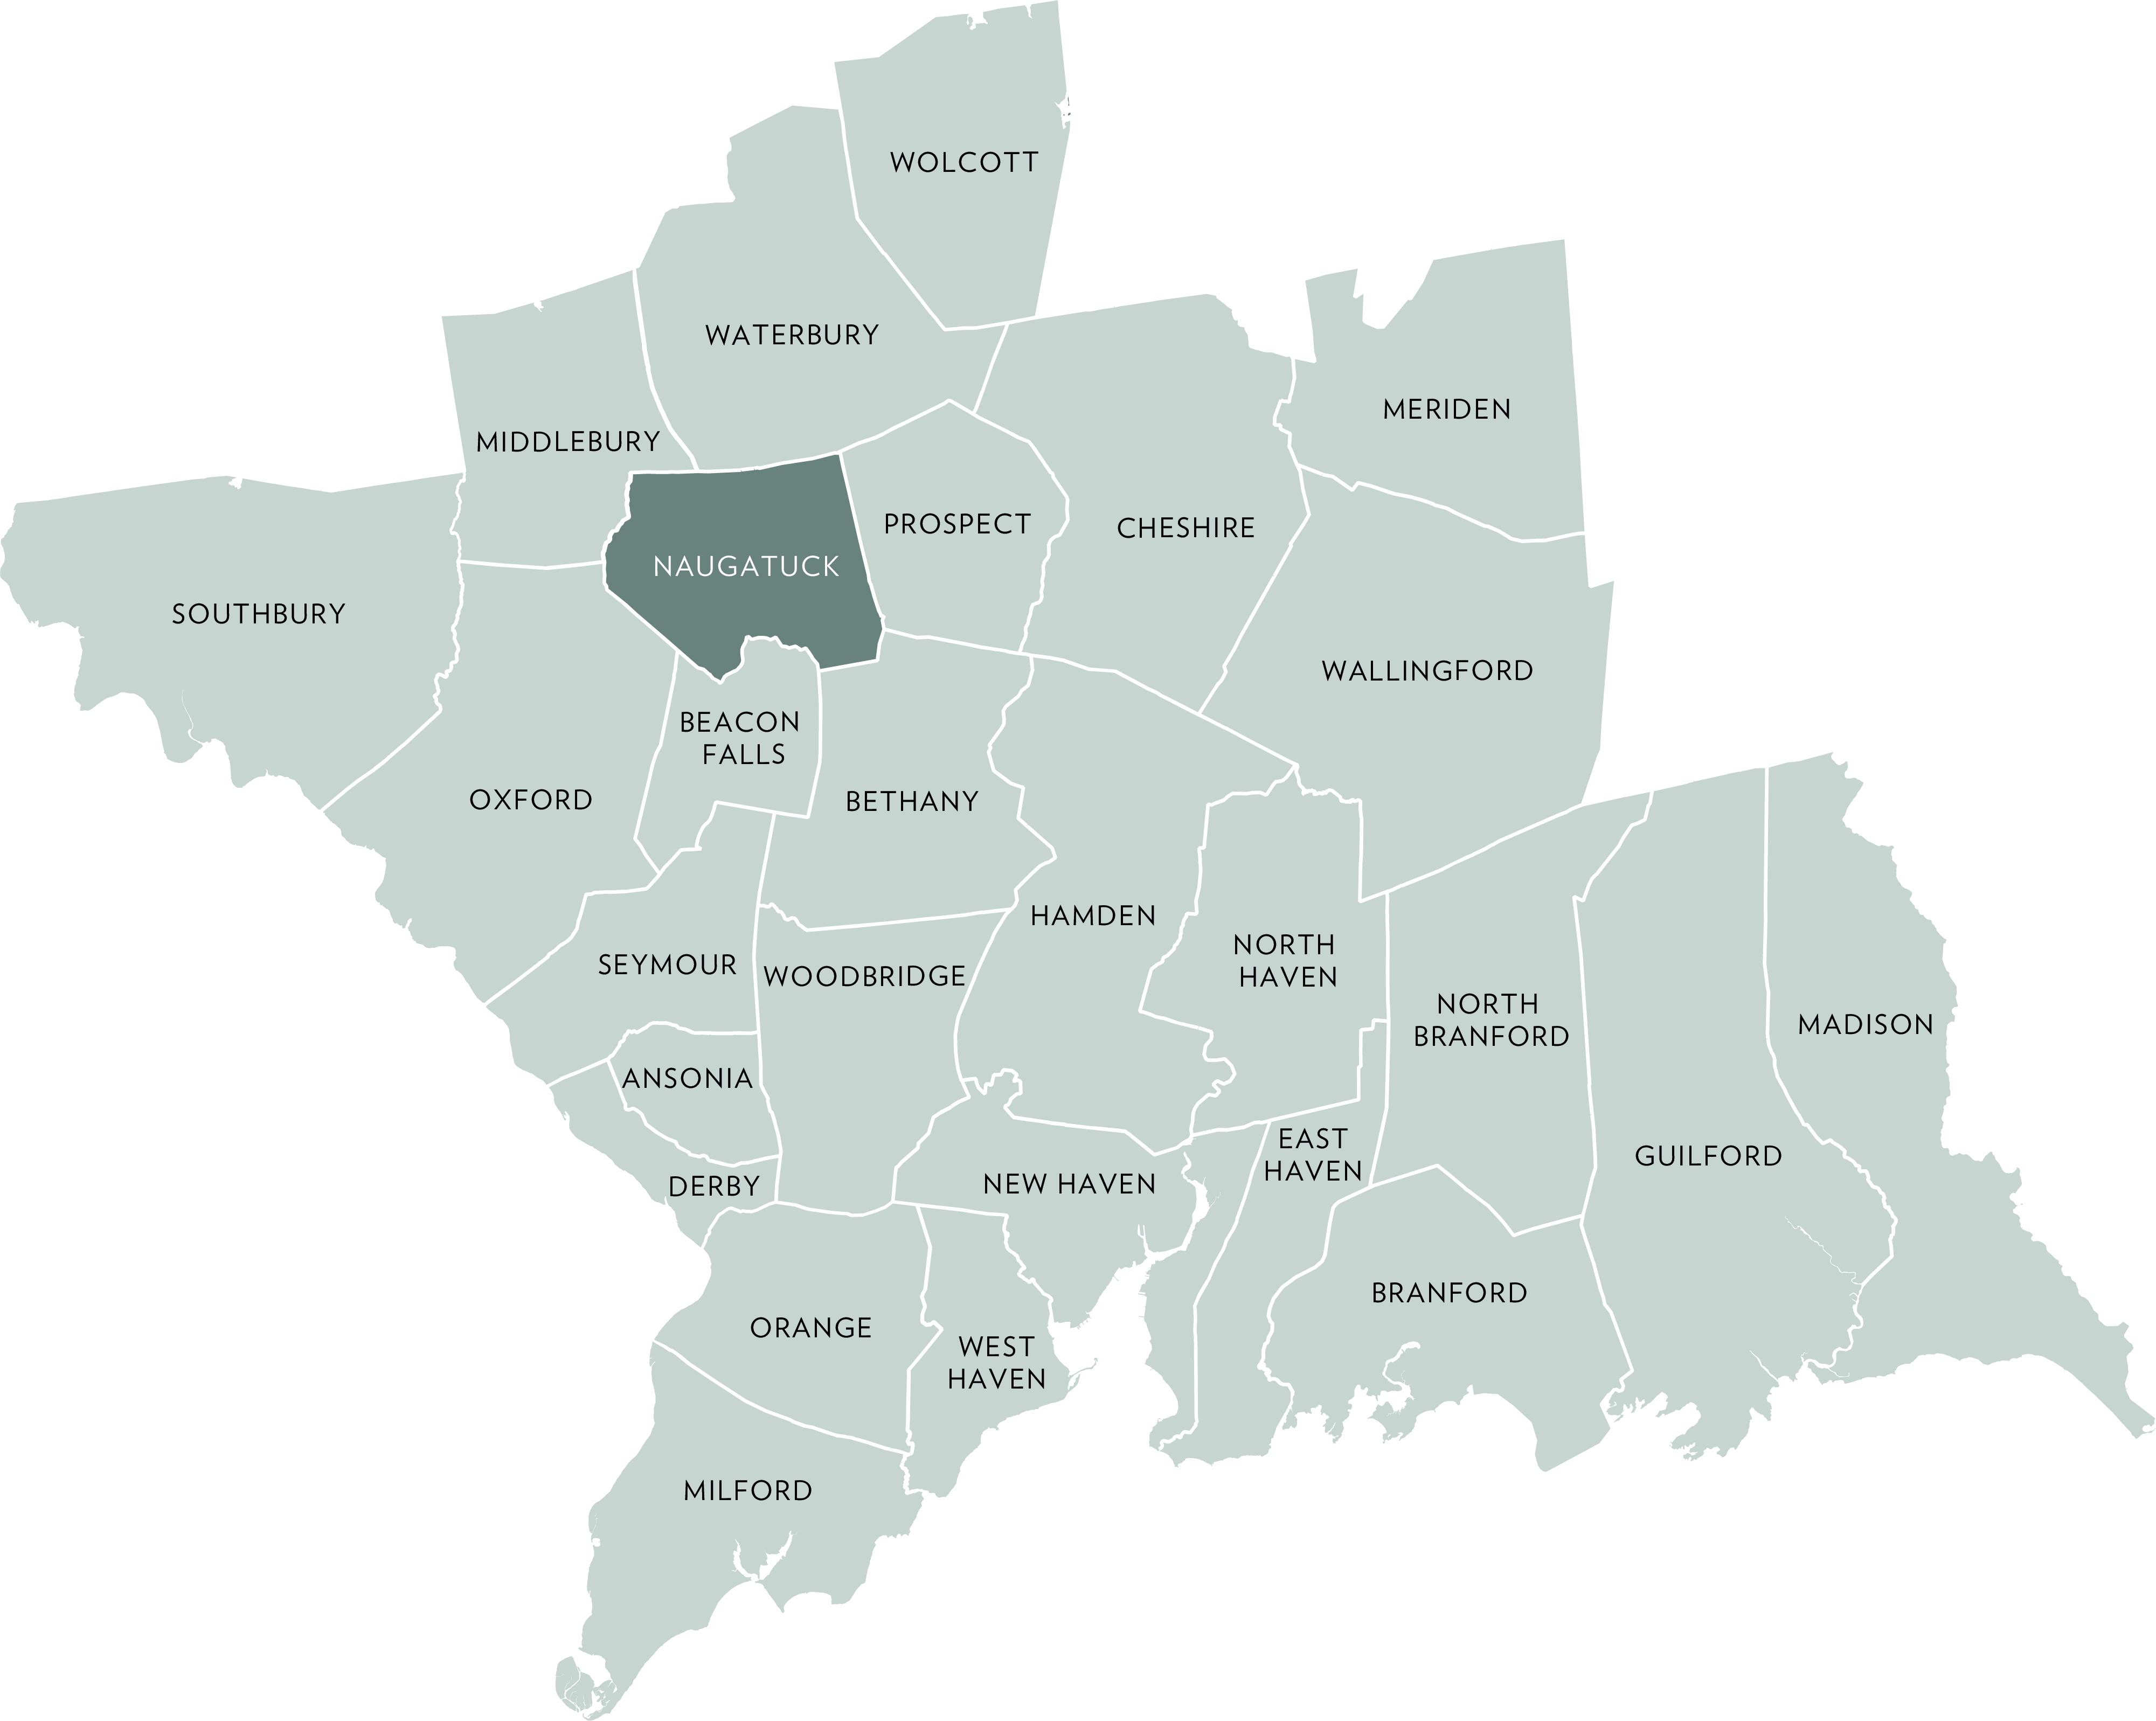
ACTIVE LISTINGS
Q2- 2026 vs Q2- 2025 -1.7%
PENDING LISTINGS
Q2- 2026 vs Q2- 2025 40.0%
Q2- 2026 vs Q2- 2025 16.1% Source : Smart MLS, Single Family For Sale
QUARTERLY MARKET OVERVIEW
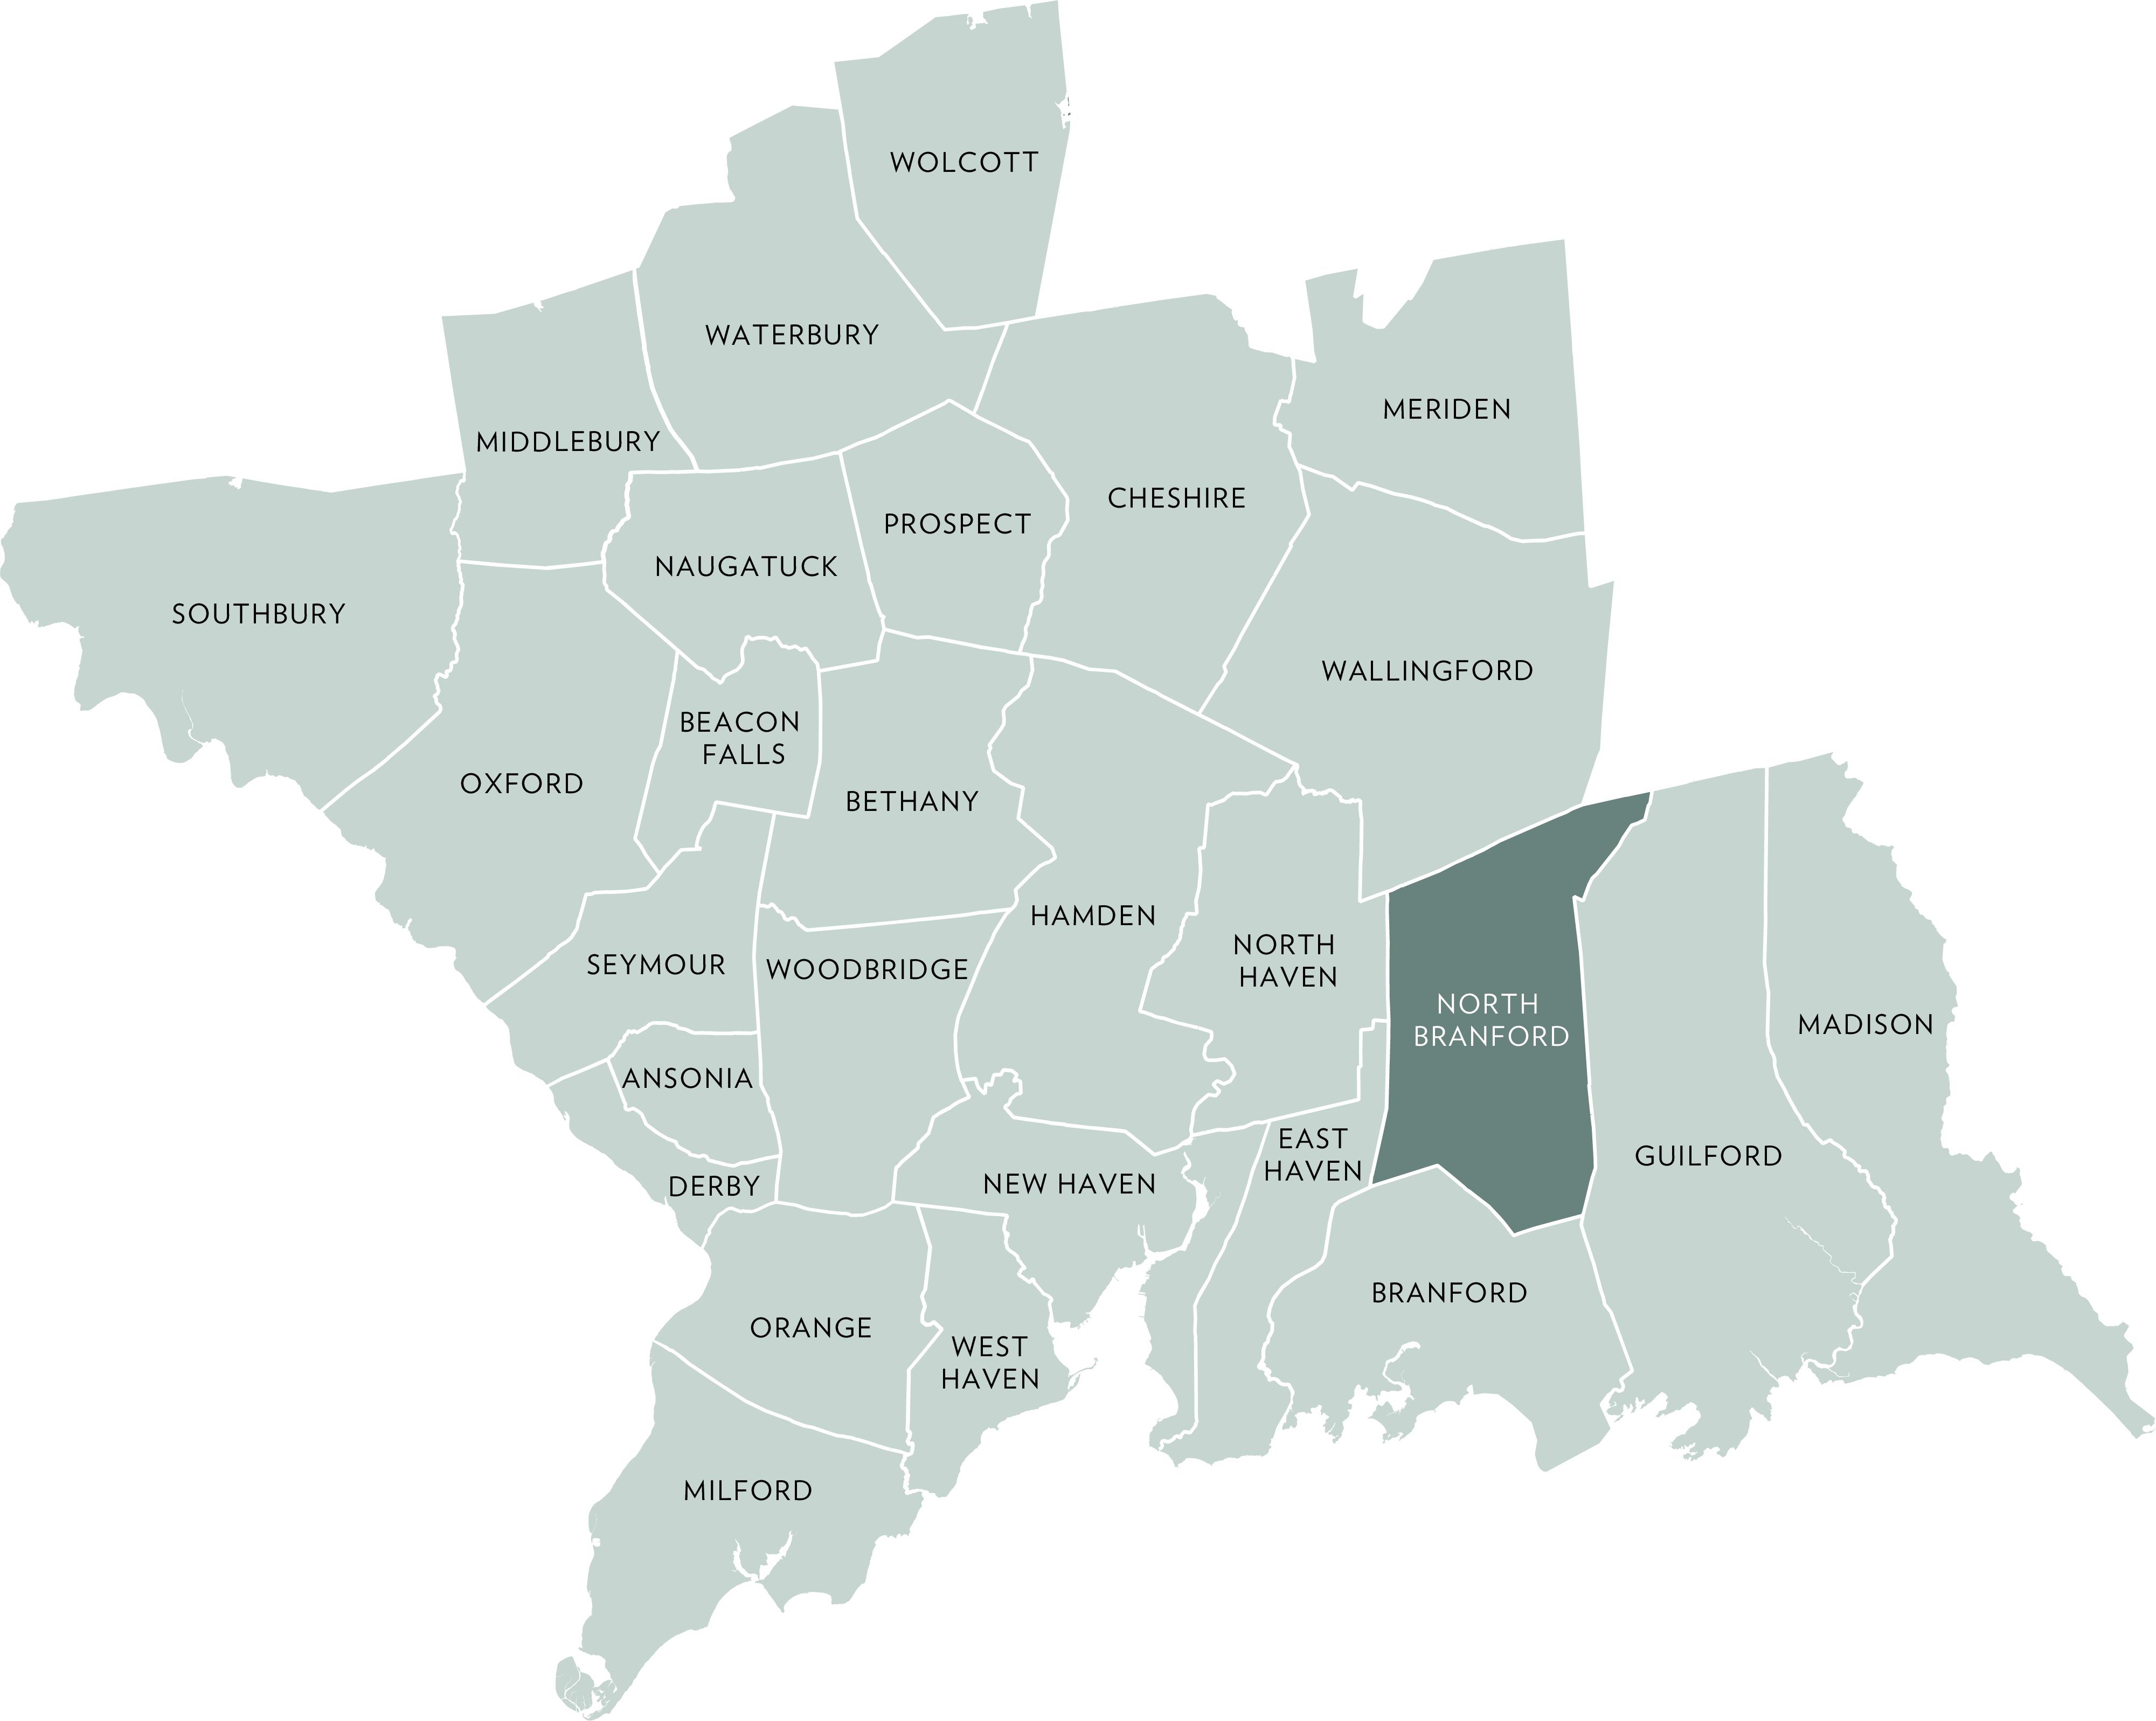
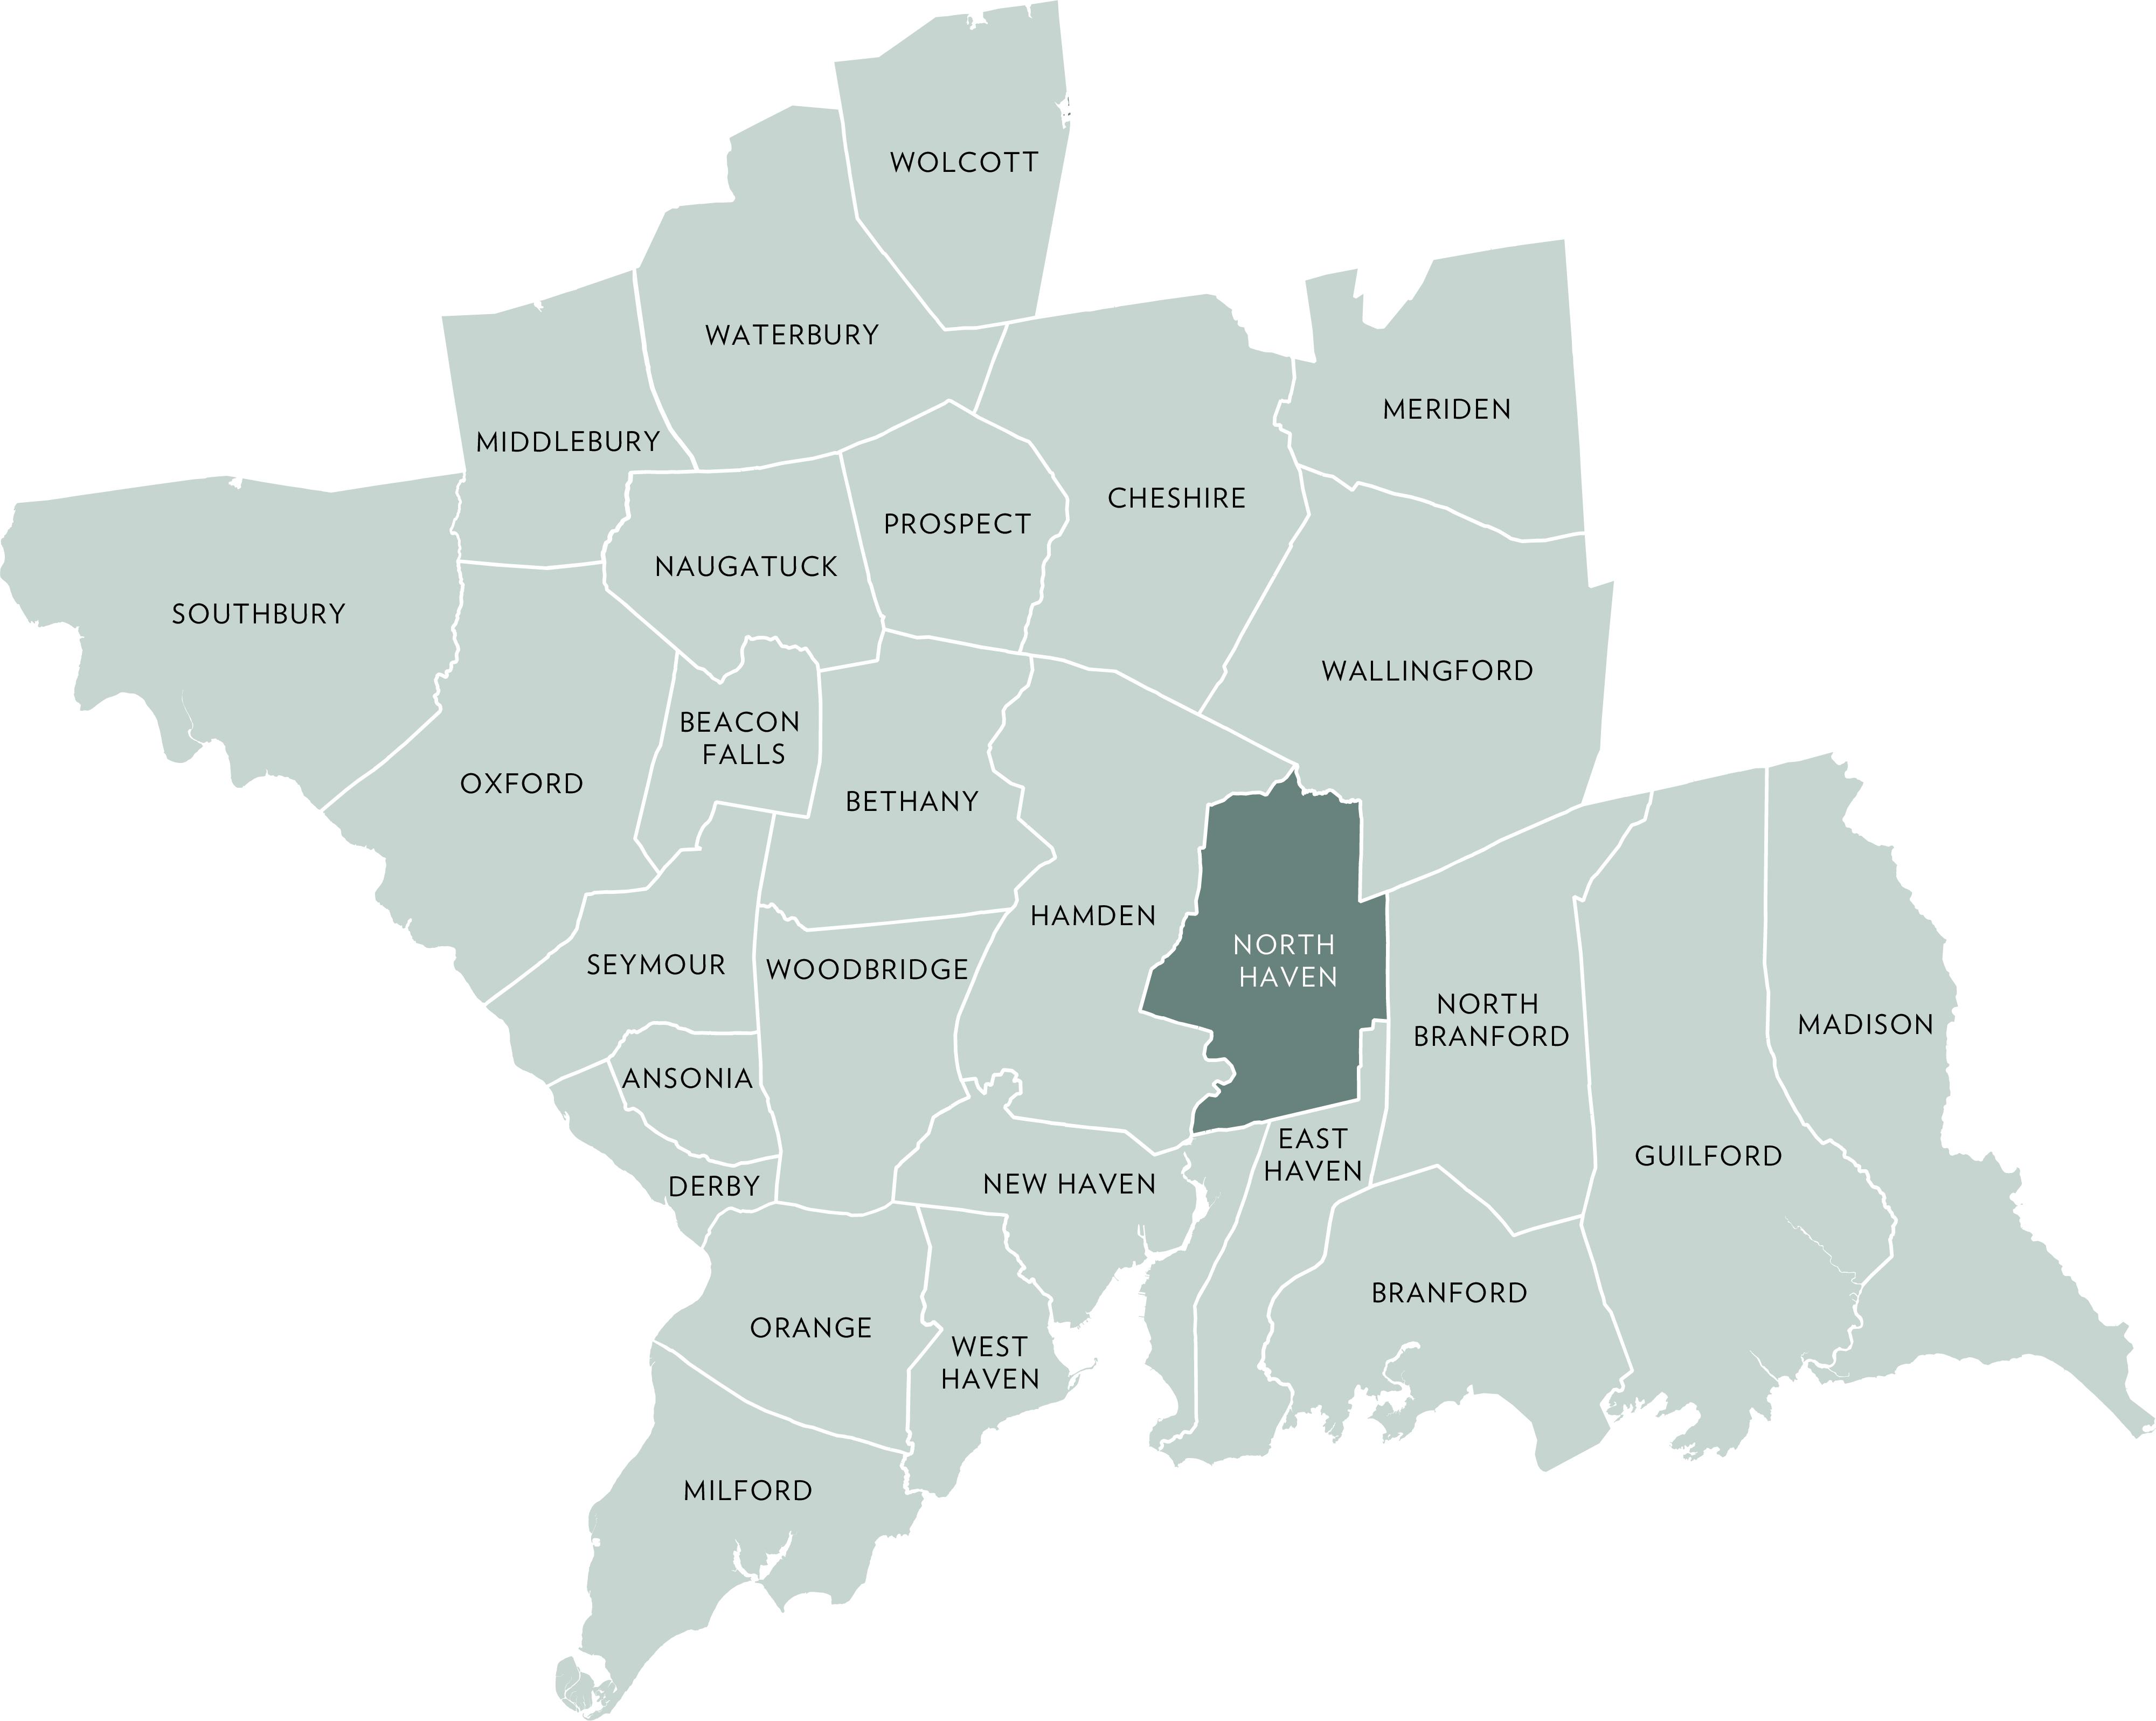
ACTIVE LISTINGS
Q2- 2026 vs Q2- 2025
27.3%
PENDING LISTINGS
Q2- 2026 vs Q2- 2025 5.3% SOLD LISTINGS
Q2- 2026 vs Q2- 2025 0.0%
QUARTERLY MARKET OVERVIEW
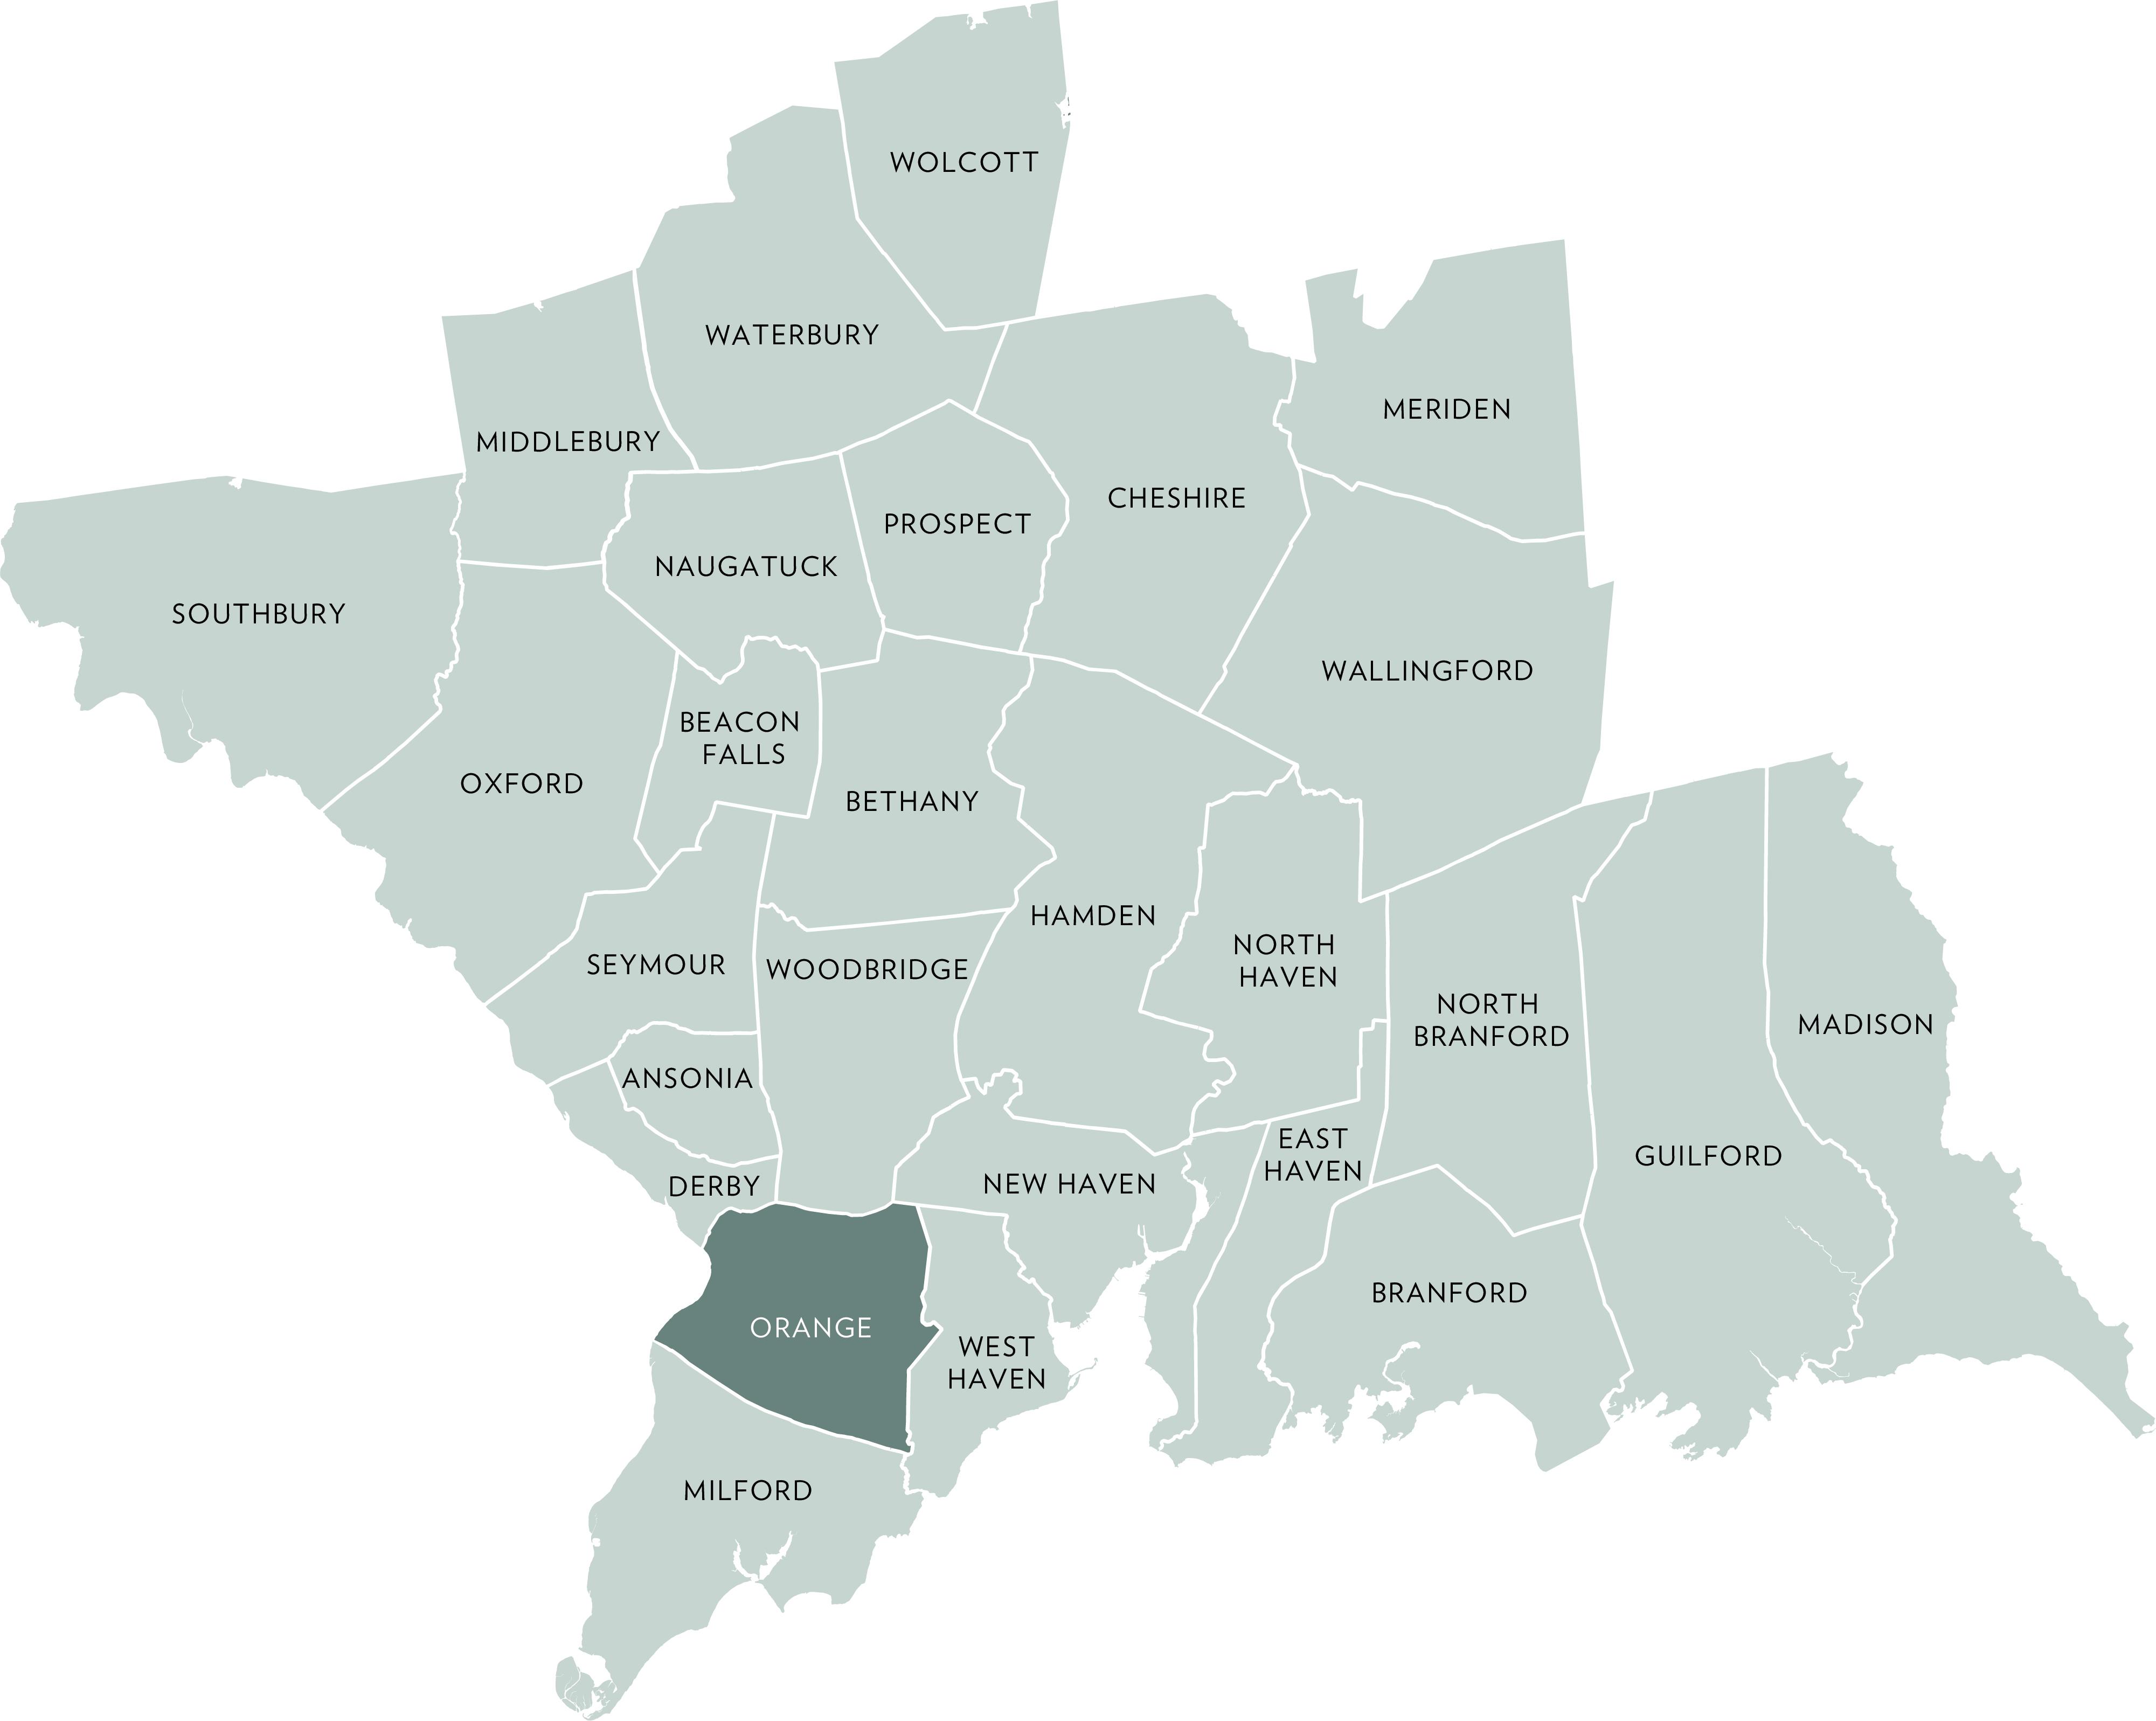
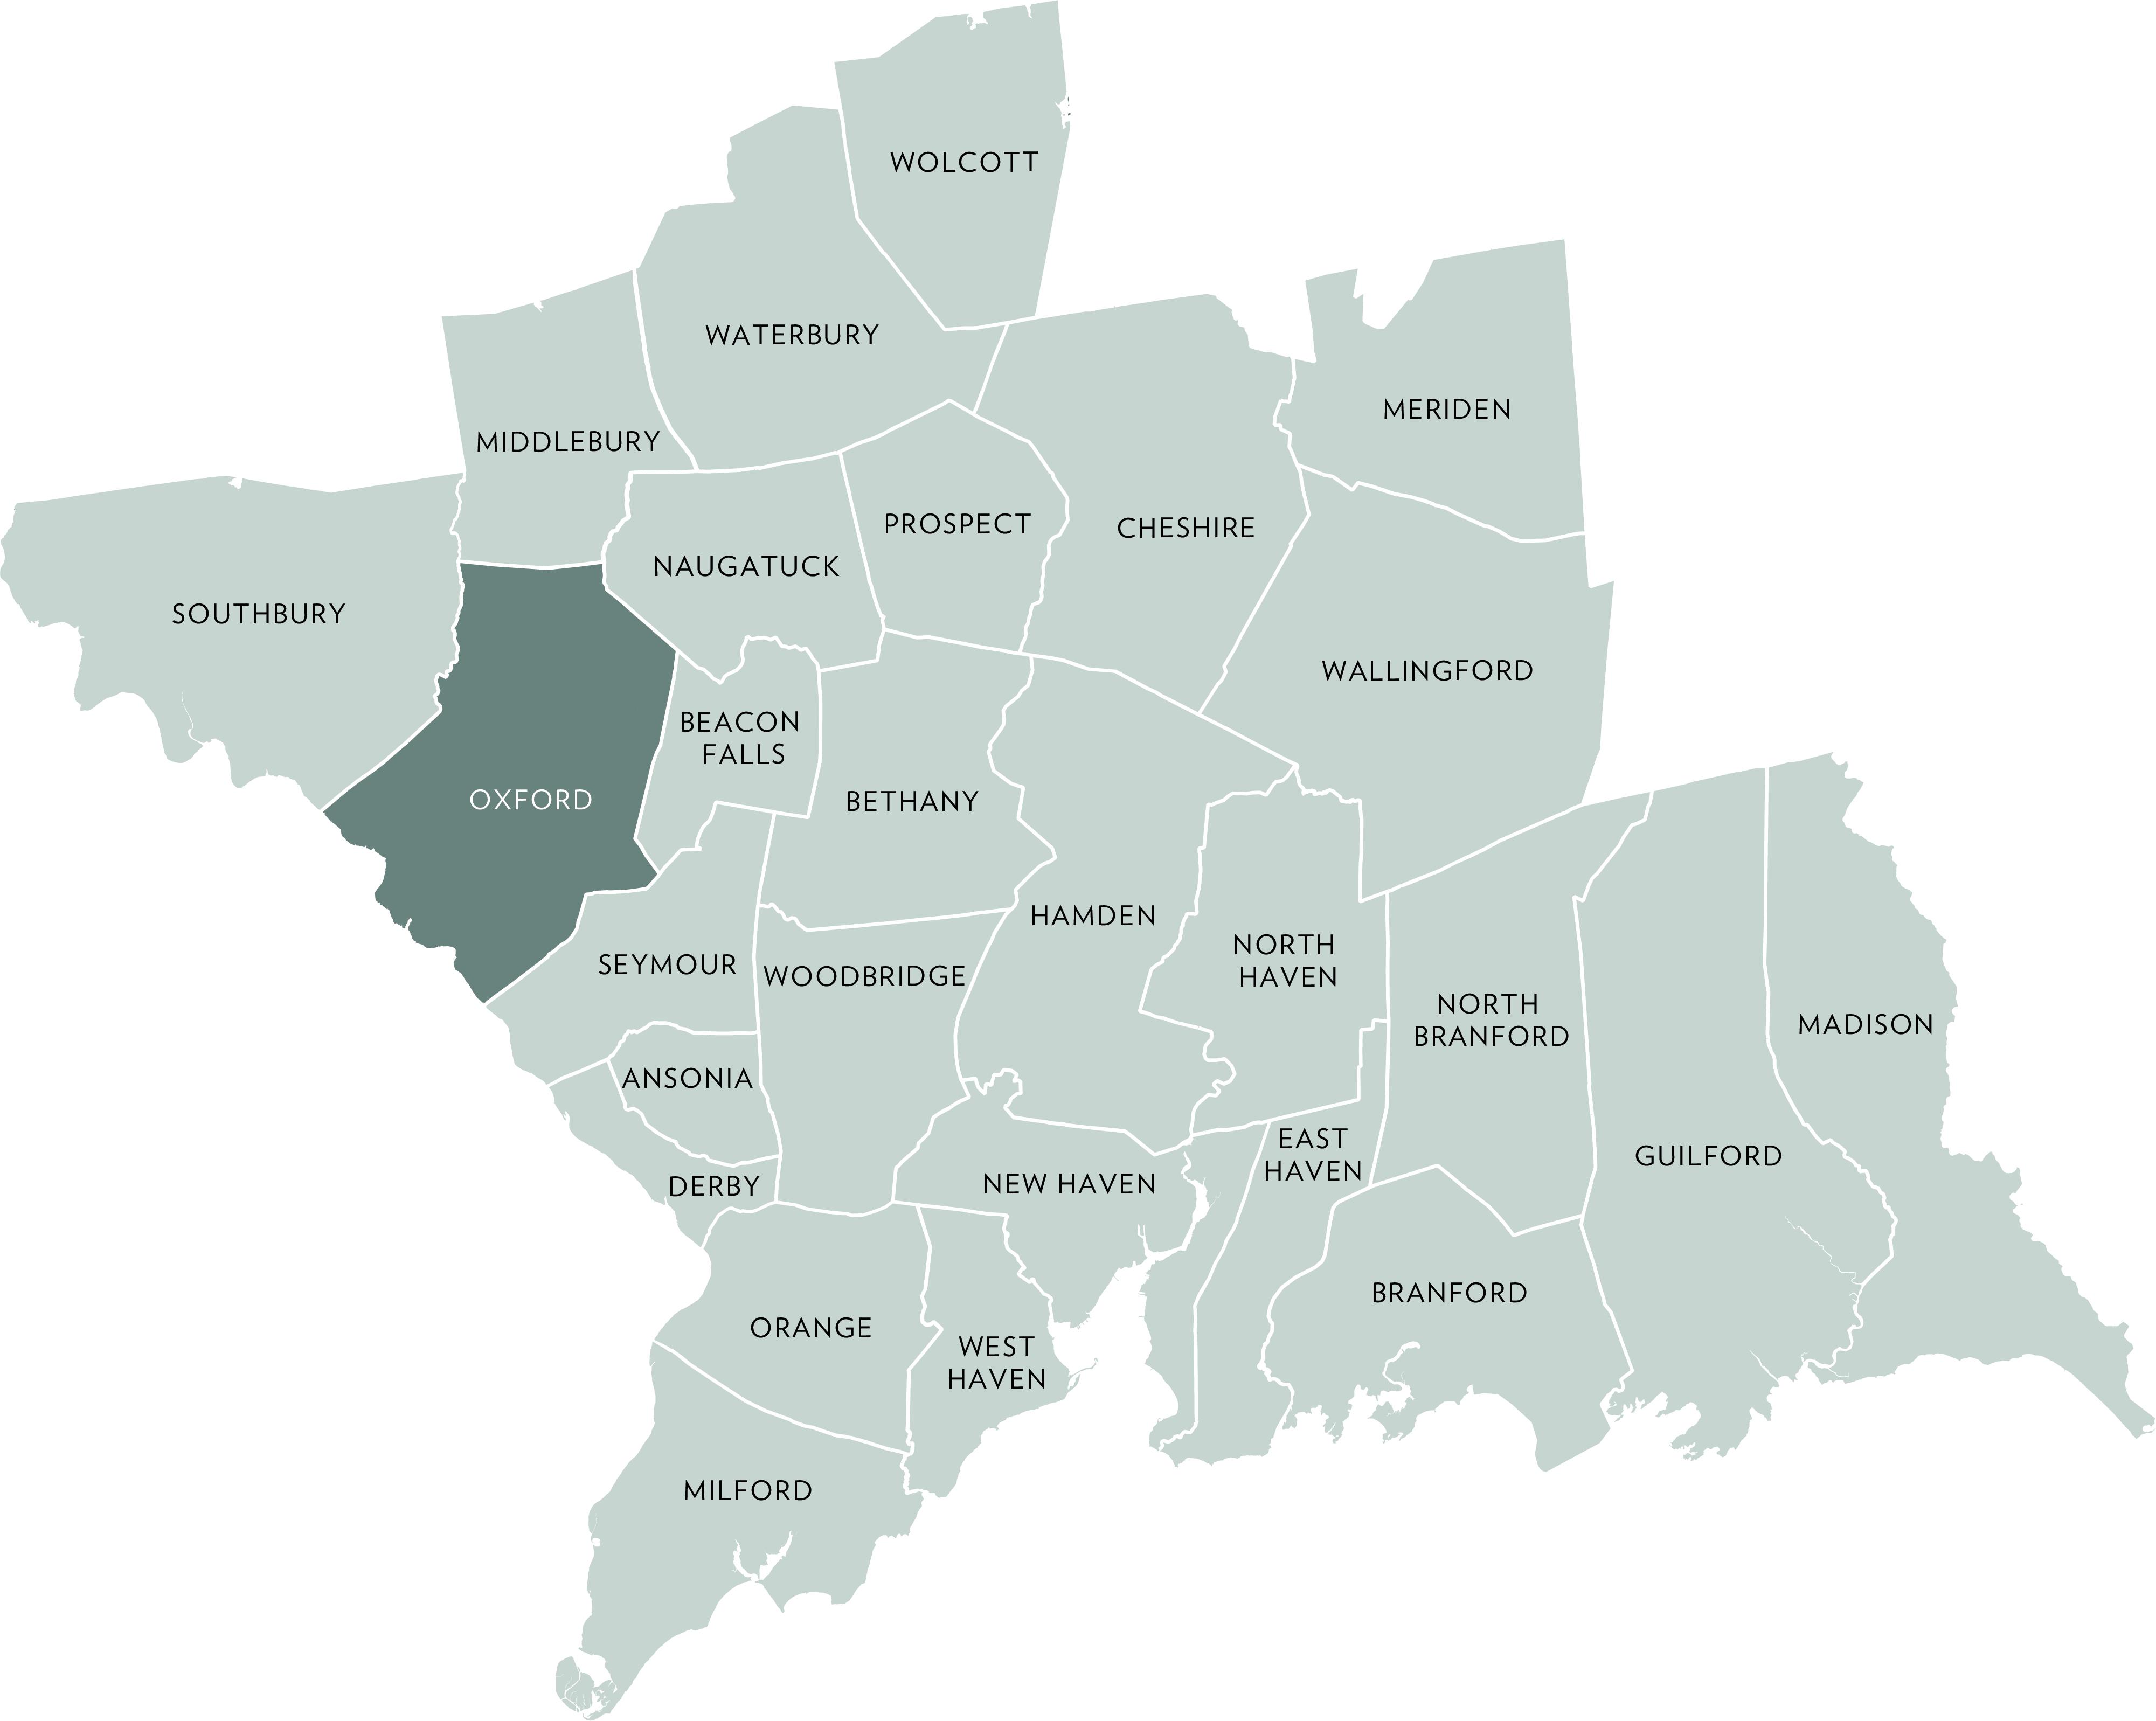
ACTIVE LISTINGS
Q2- 2026 vs Q2- 2025
50.0%
PENDING LISTINGS
Q2- 2026 vs Q2- 2025 -38.5% SOLD LISTINGS
Q2- 2026 vs Q2- 2025 0.0%
QUARTERLY MARKET OVERVIEW
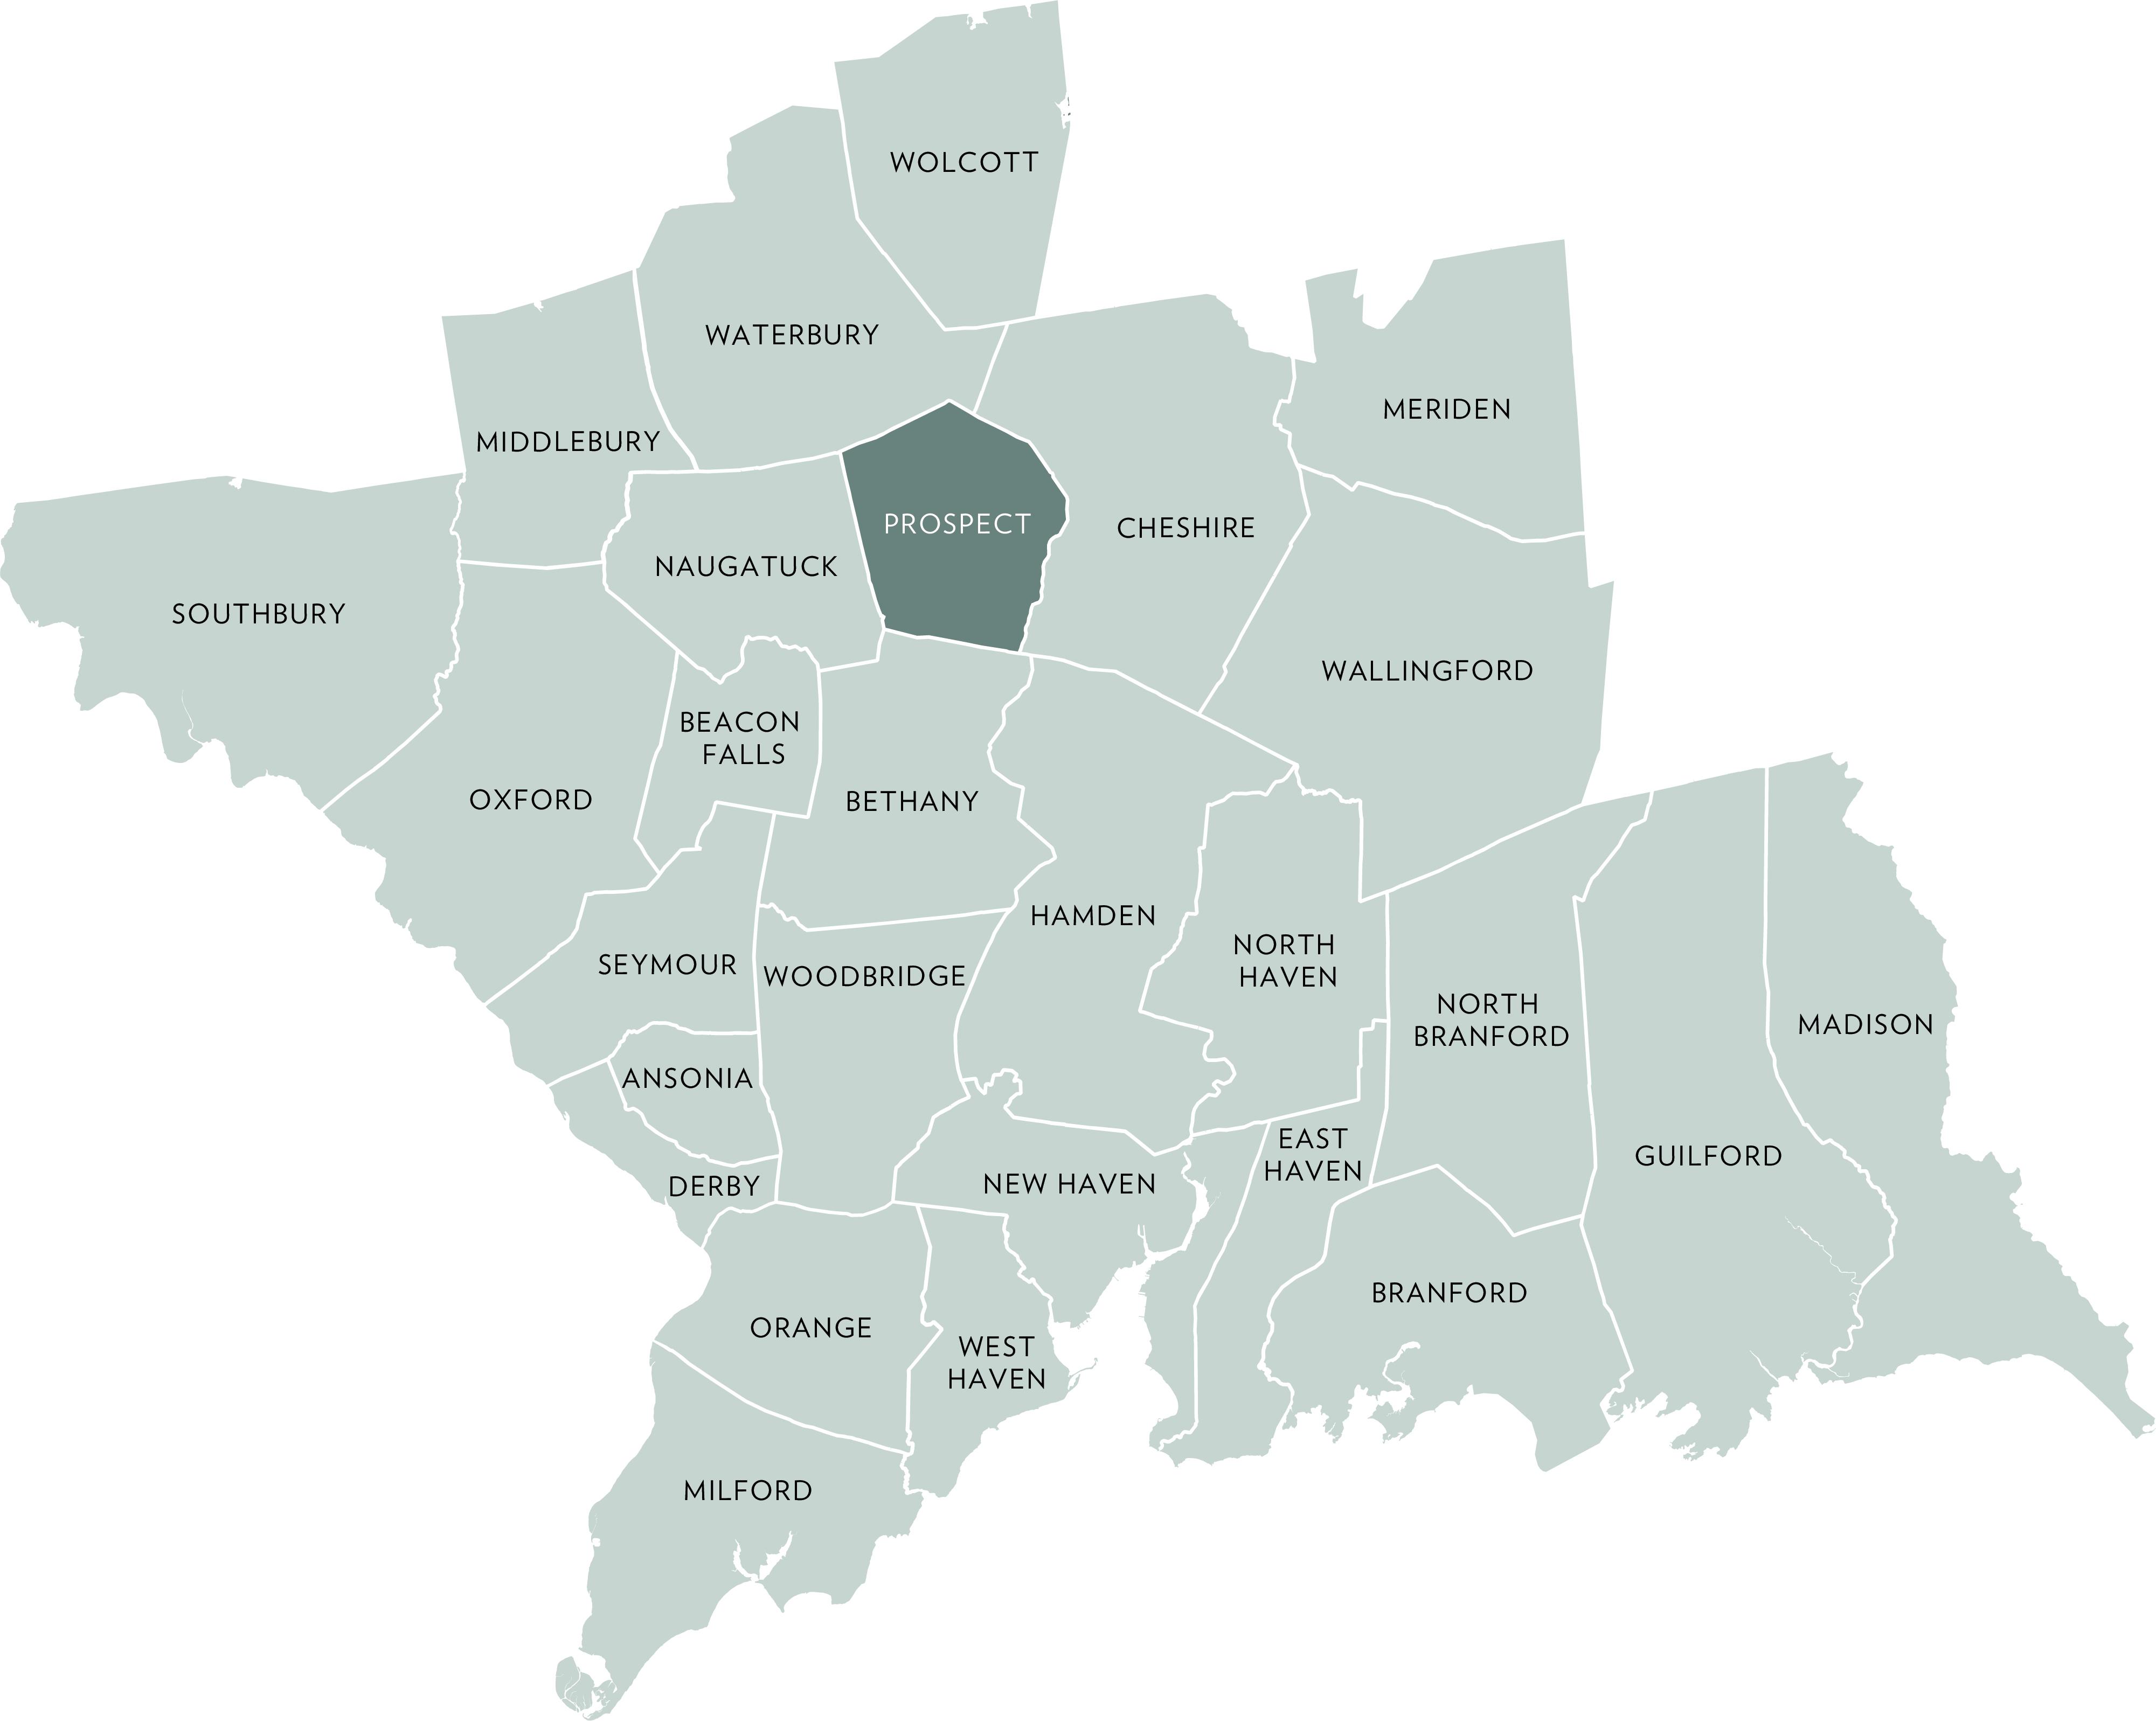
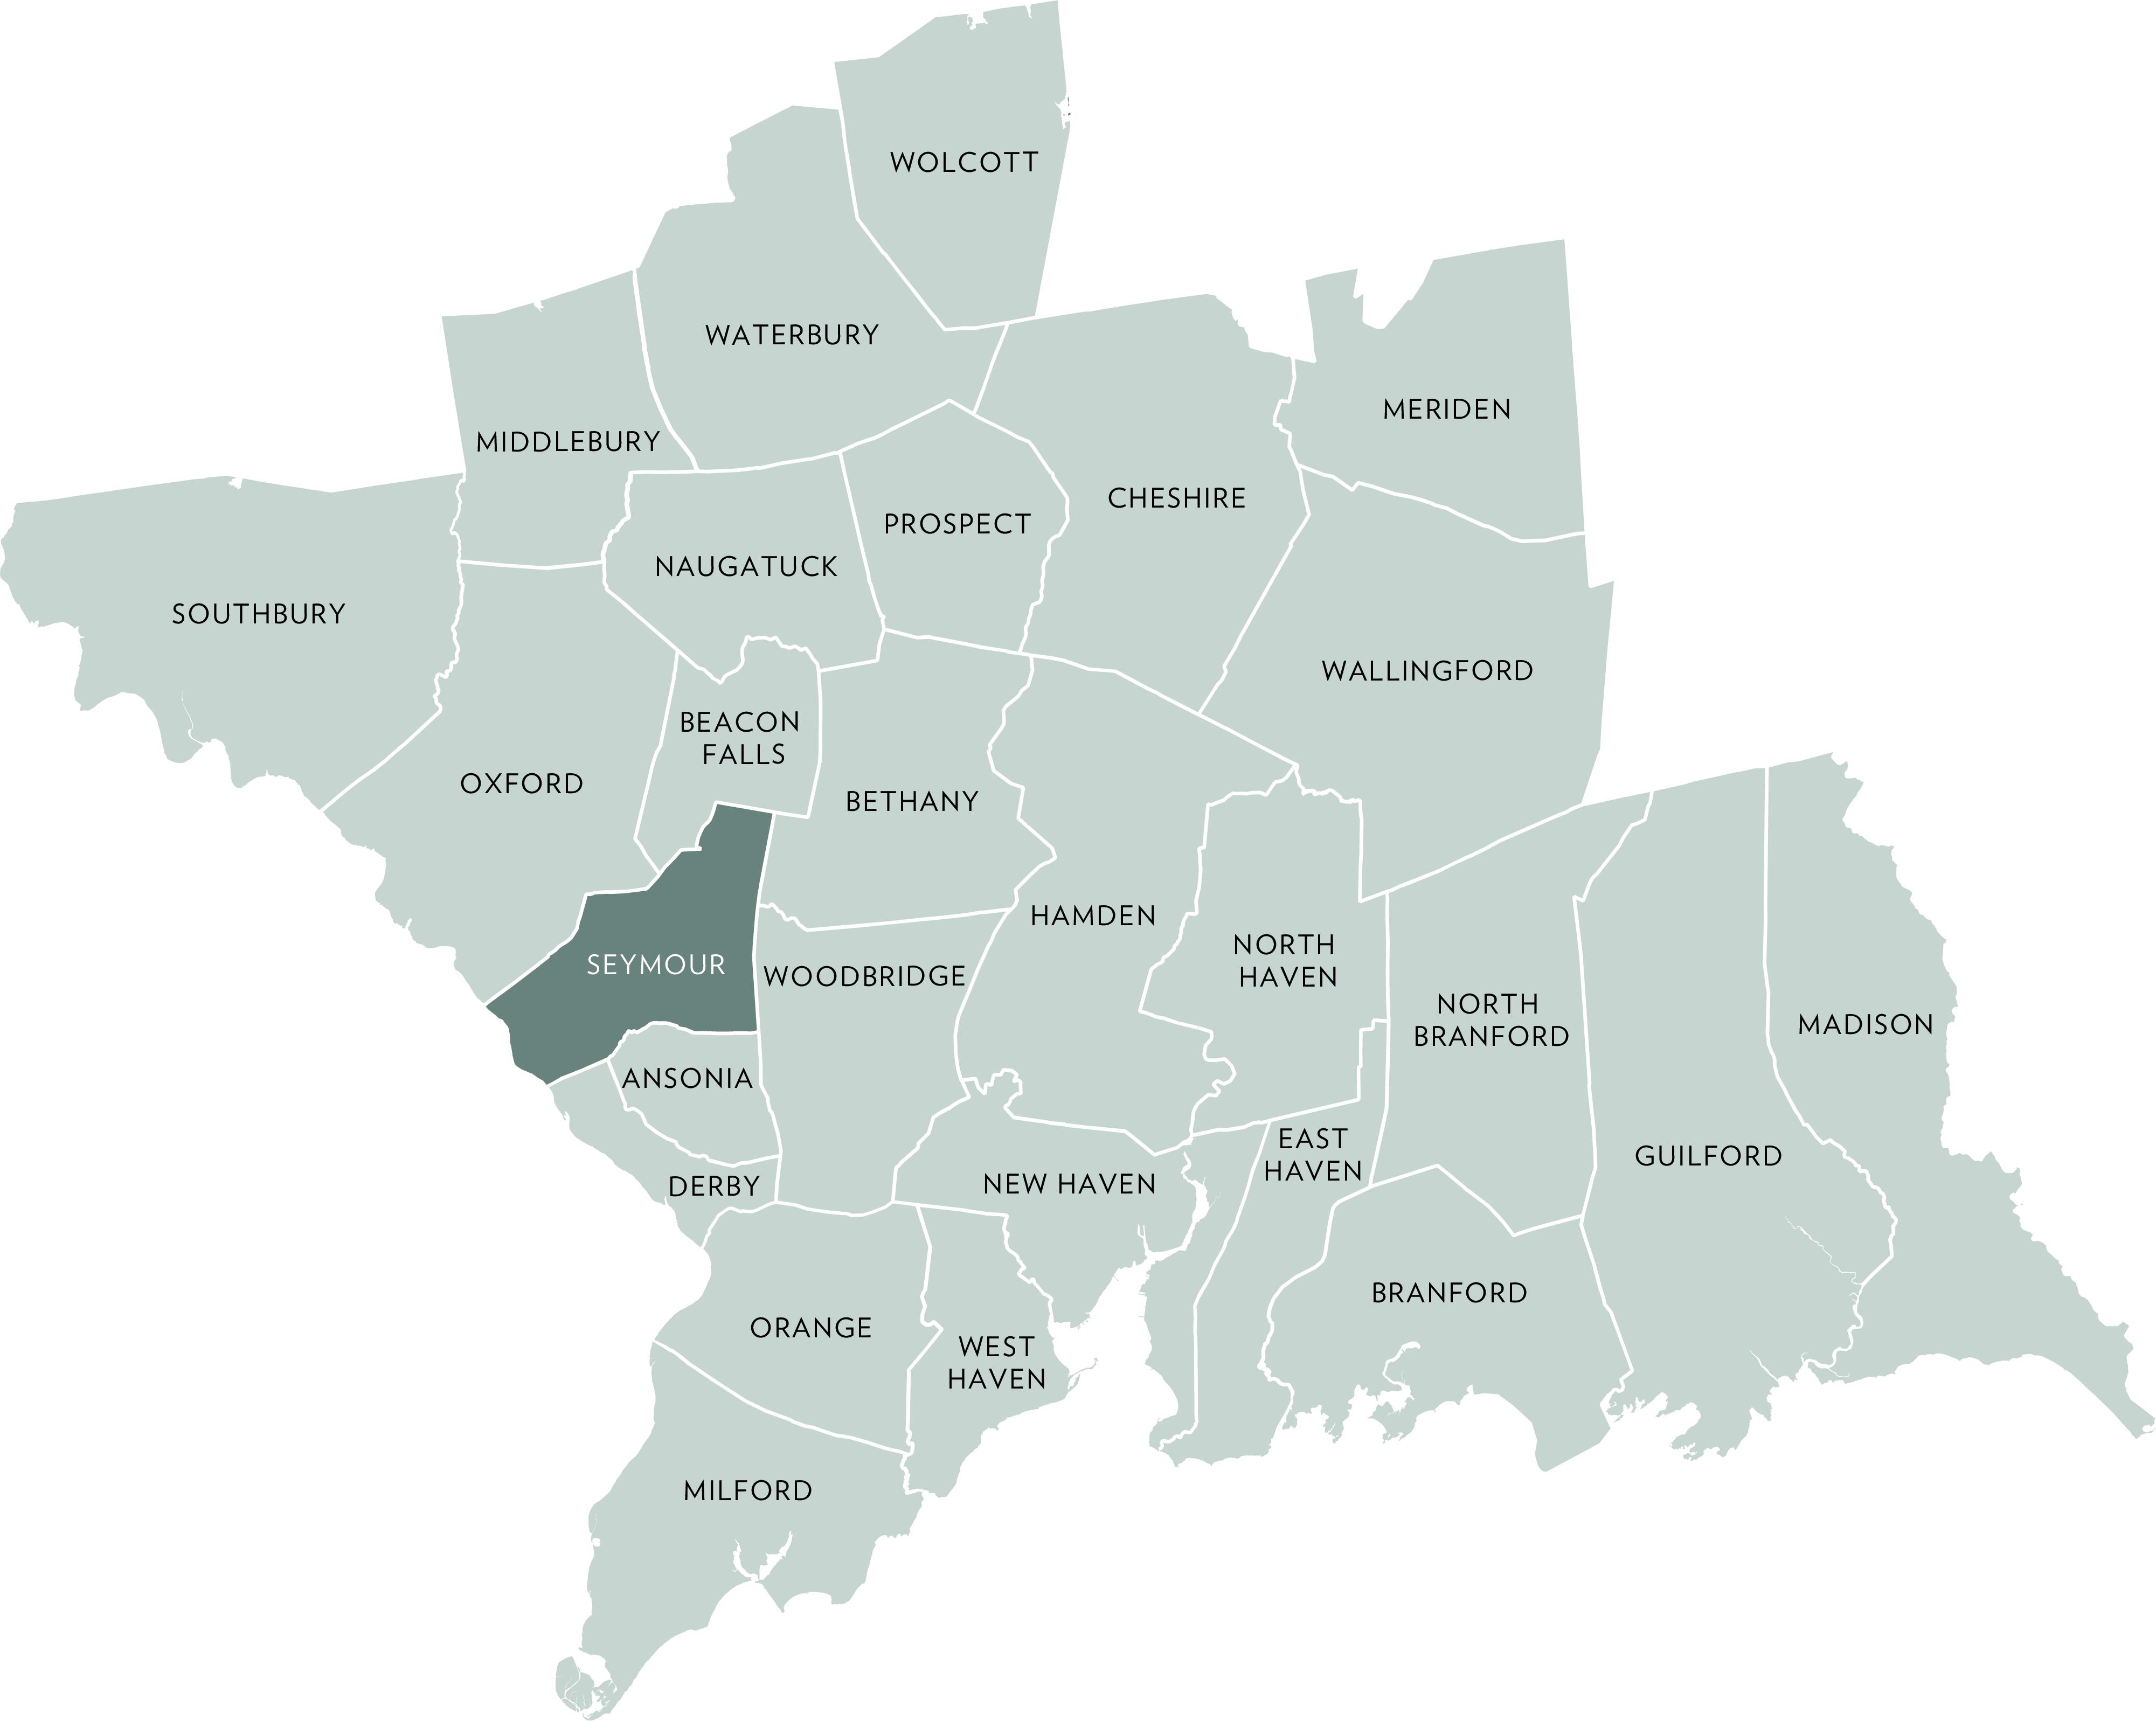
ACTIVE LISTINGS
Q2- 2026 vs Q2- 2025 -6.7%
PENDING LISTINGS
Q2- 2026 vs Q2- 2025 0.0%
Q2- 2026 vs Q2- 2025 44.0%
QUARTERLY MARKET OVERVIEW
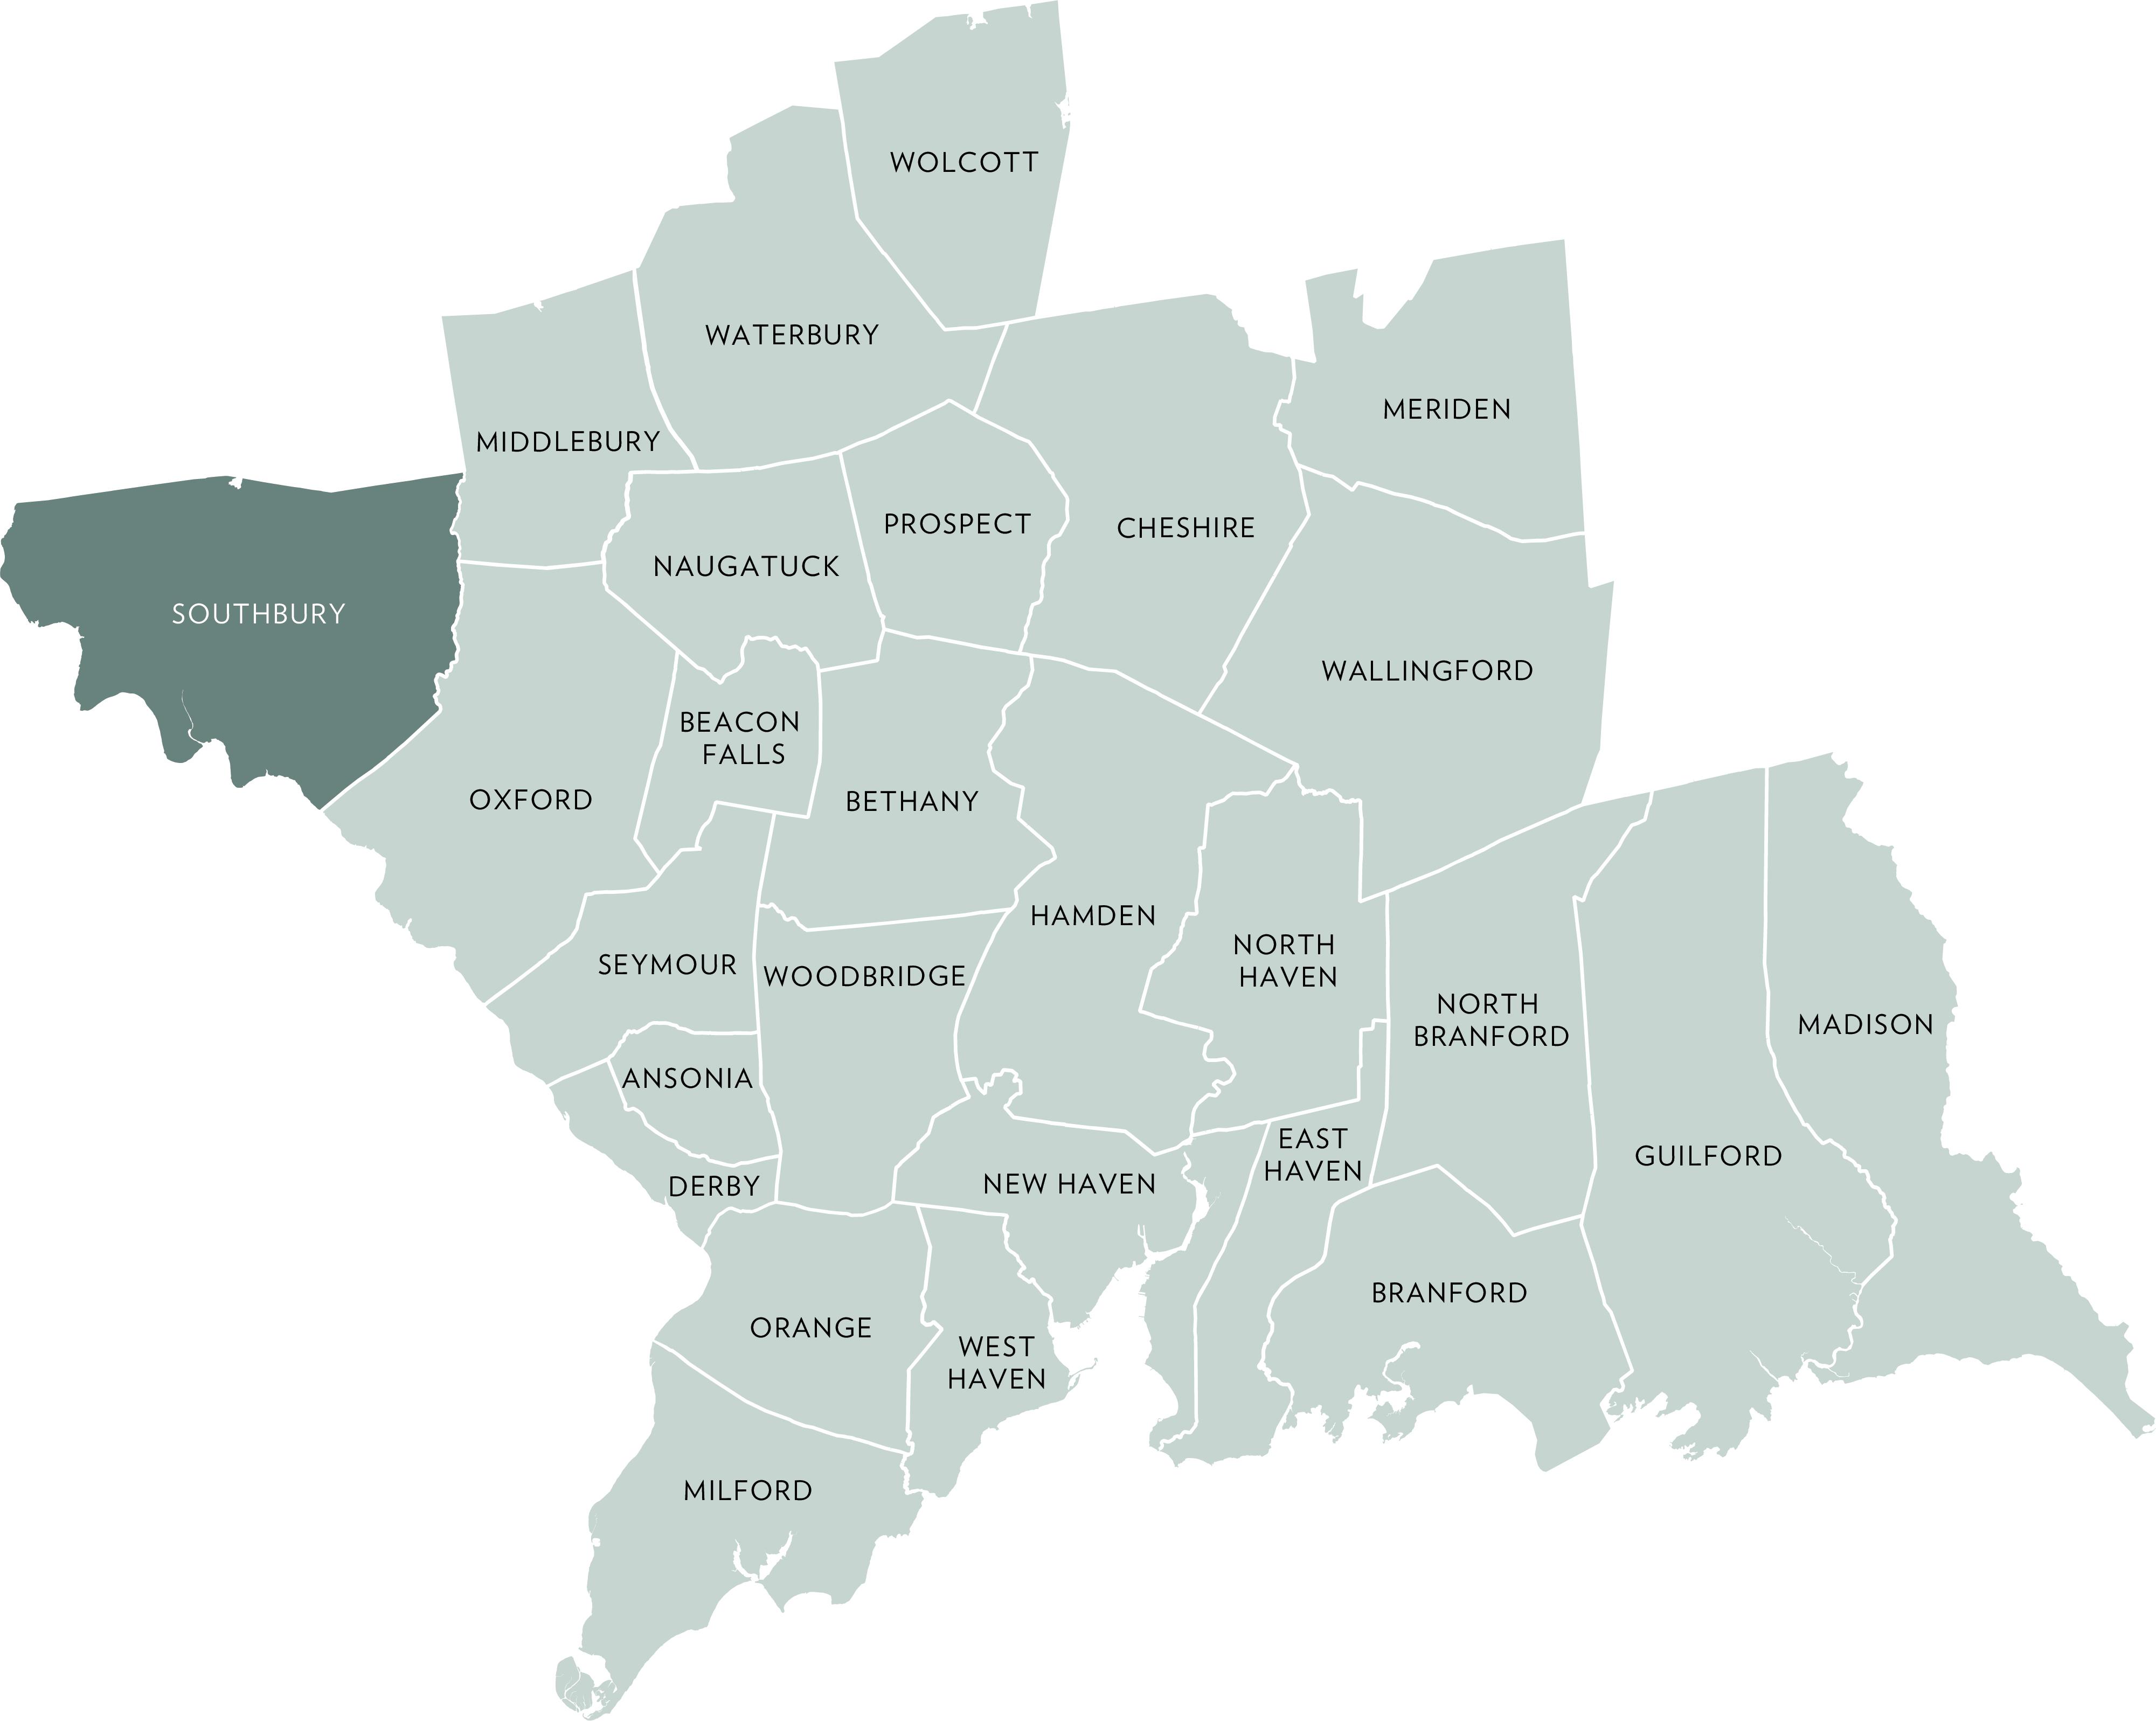
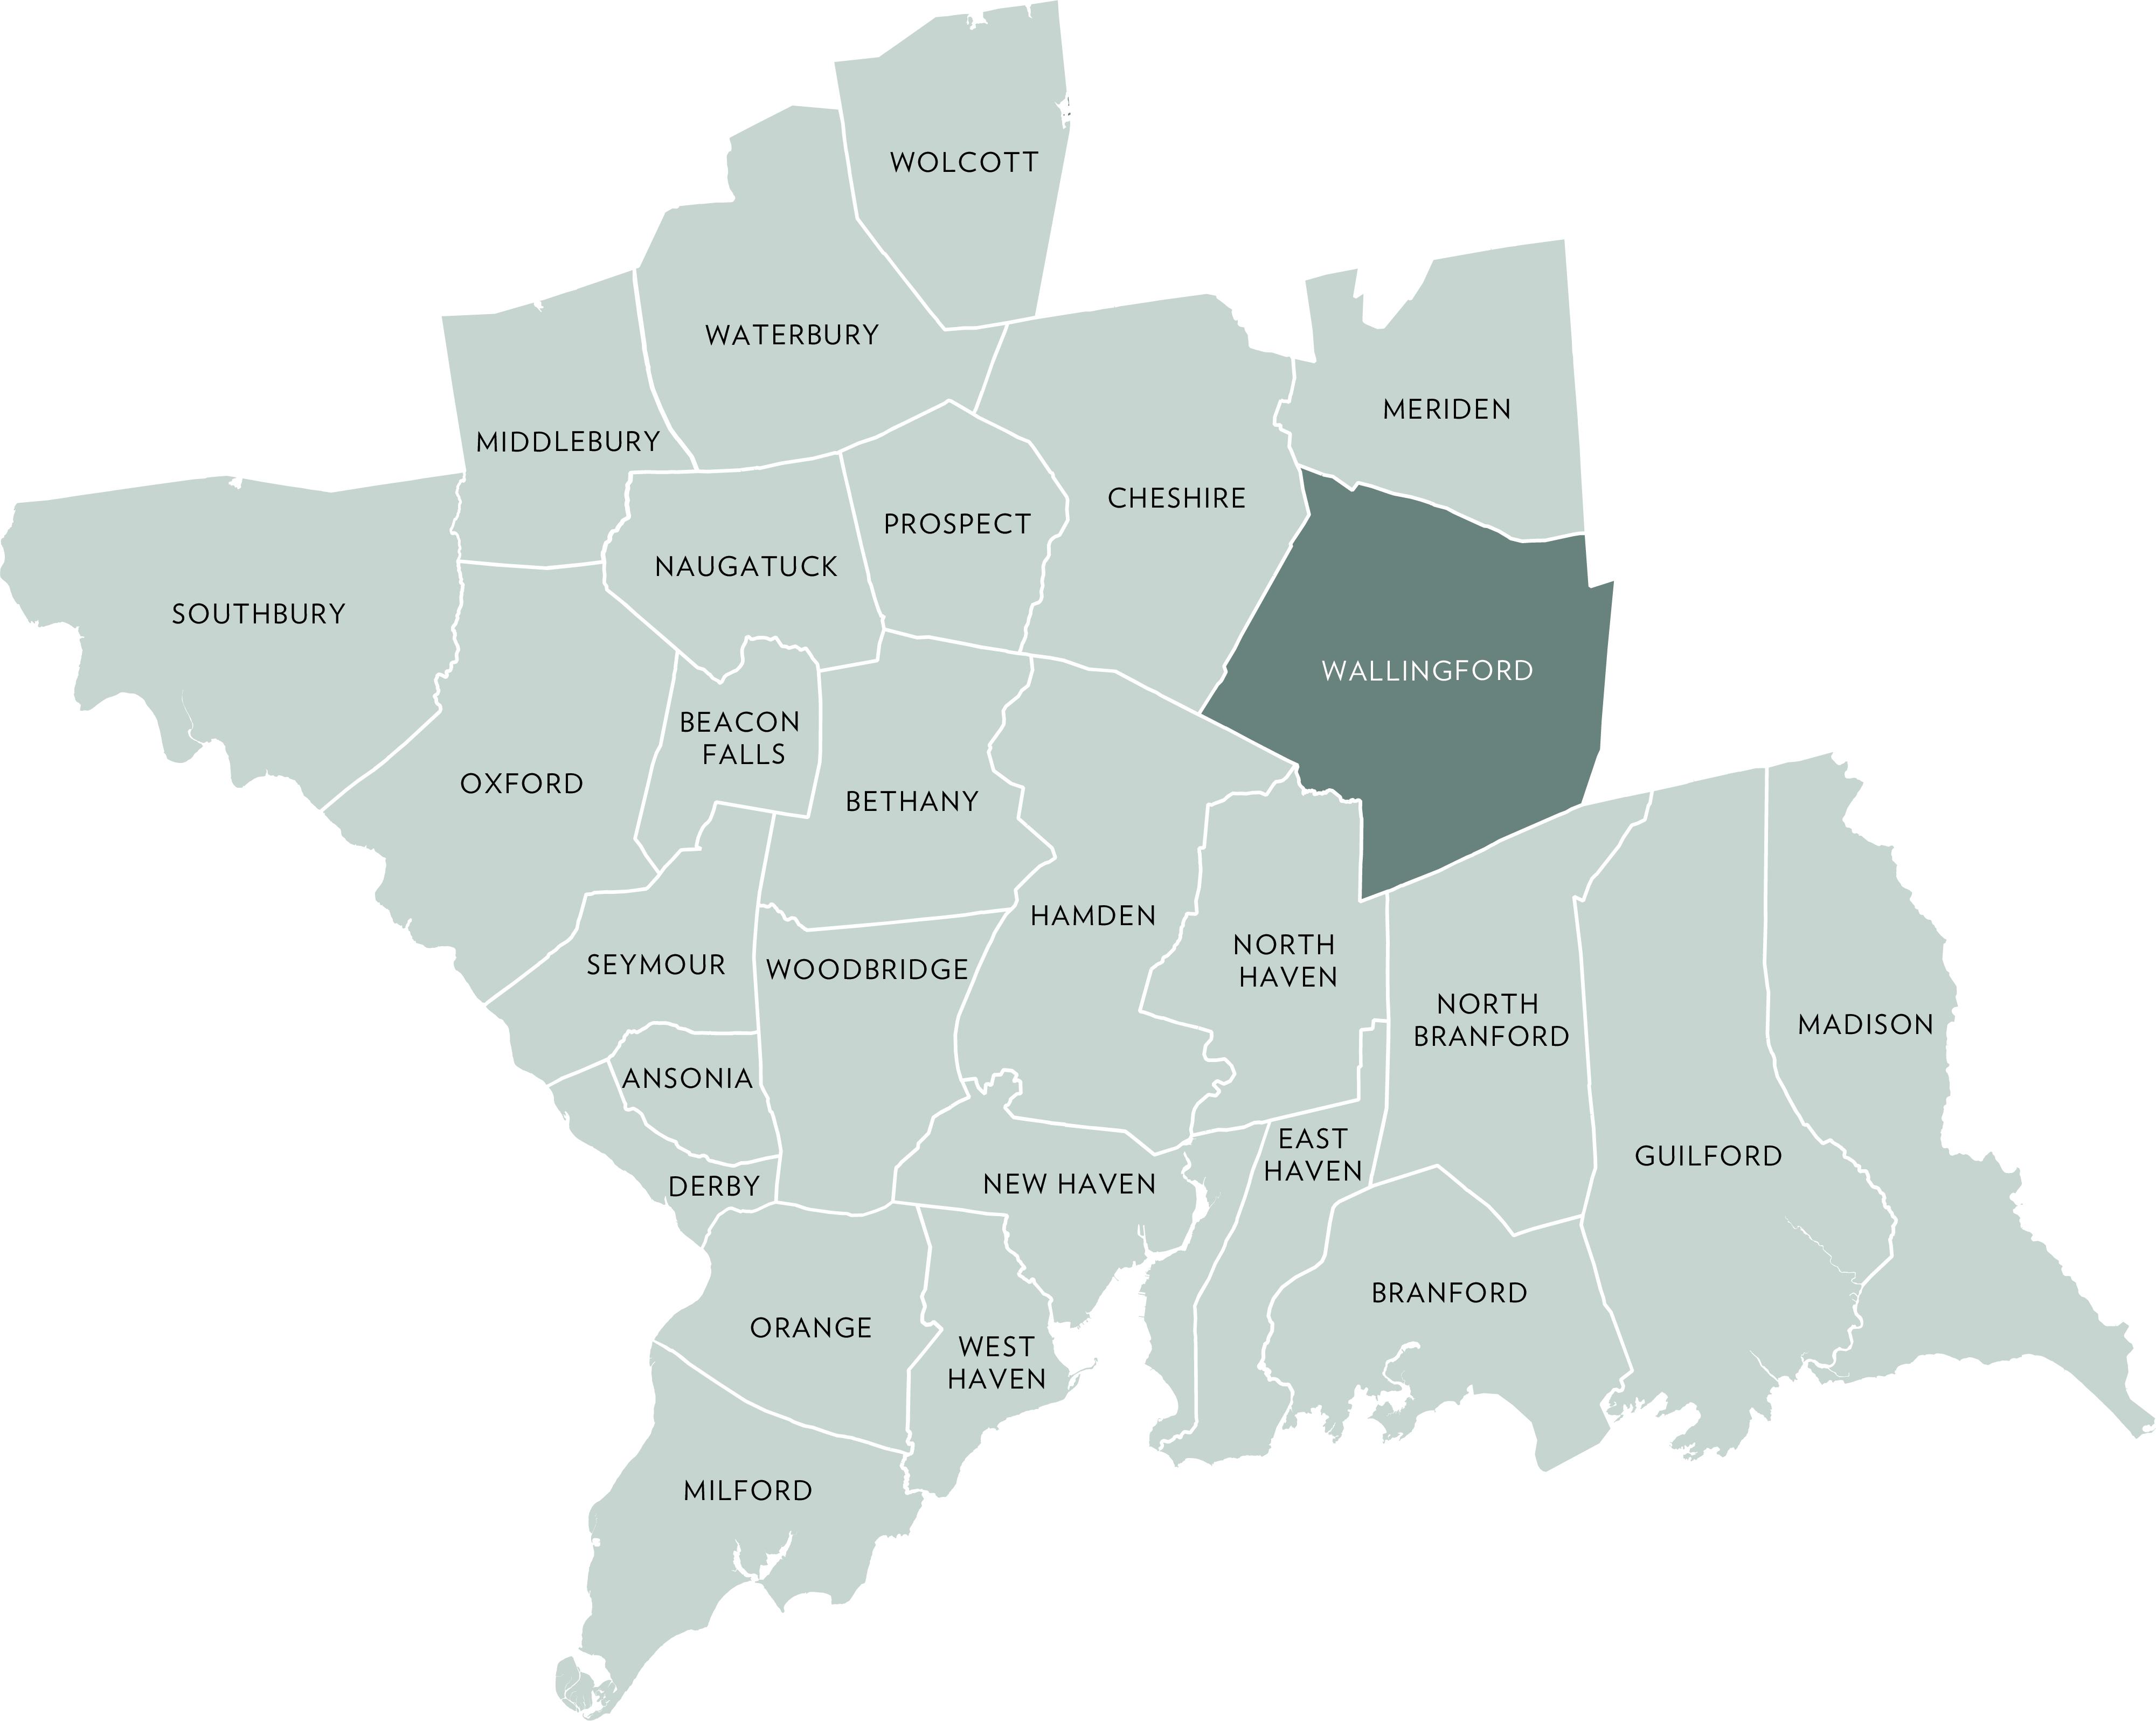
ACTIVE LISTINGS
Q2- 2026 vs Q2- 2025 5.1%
PENDING LISTINGS
Q2- 2026 vs Q2- 2025 3.7%
Q2- 2026 vs Q2- 2025 -2.7%
QUARTERLY MARKET OVERVIEW
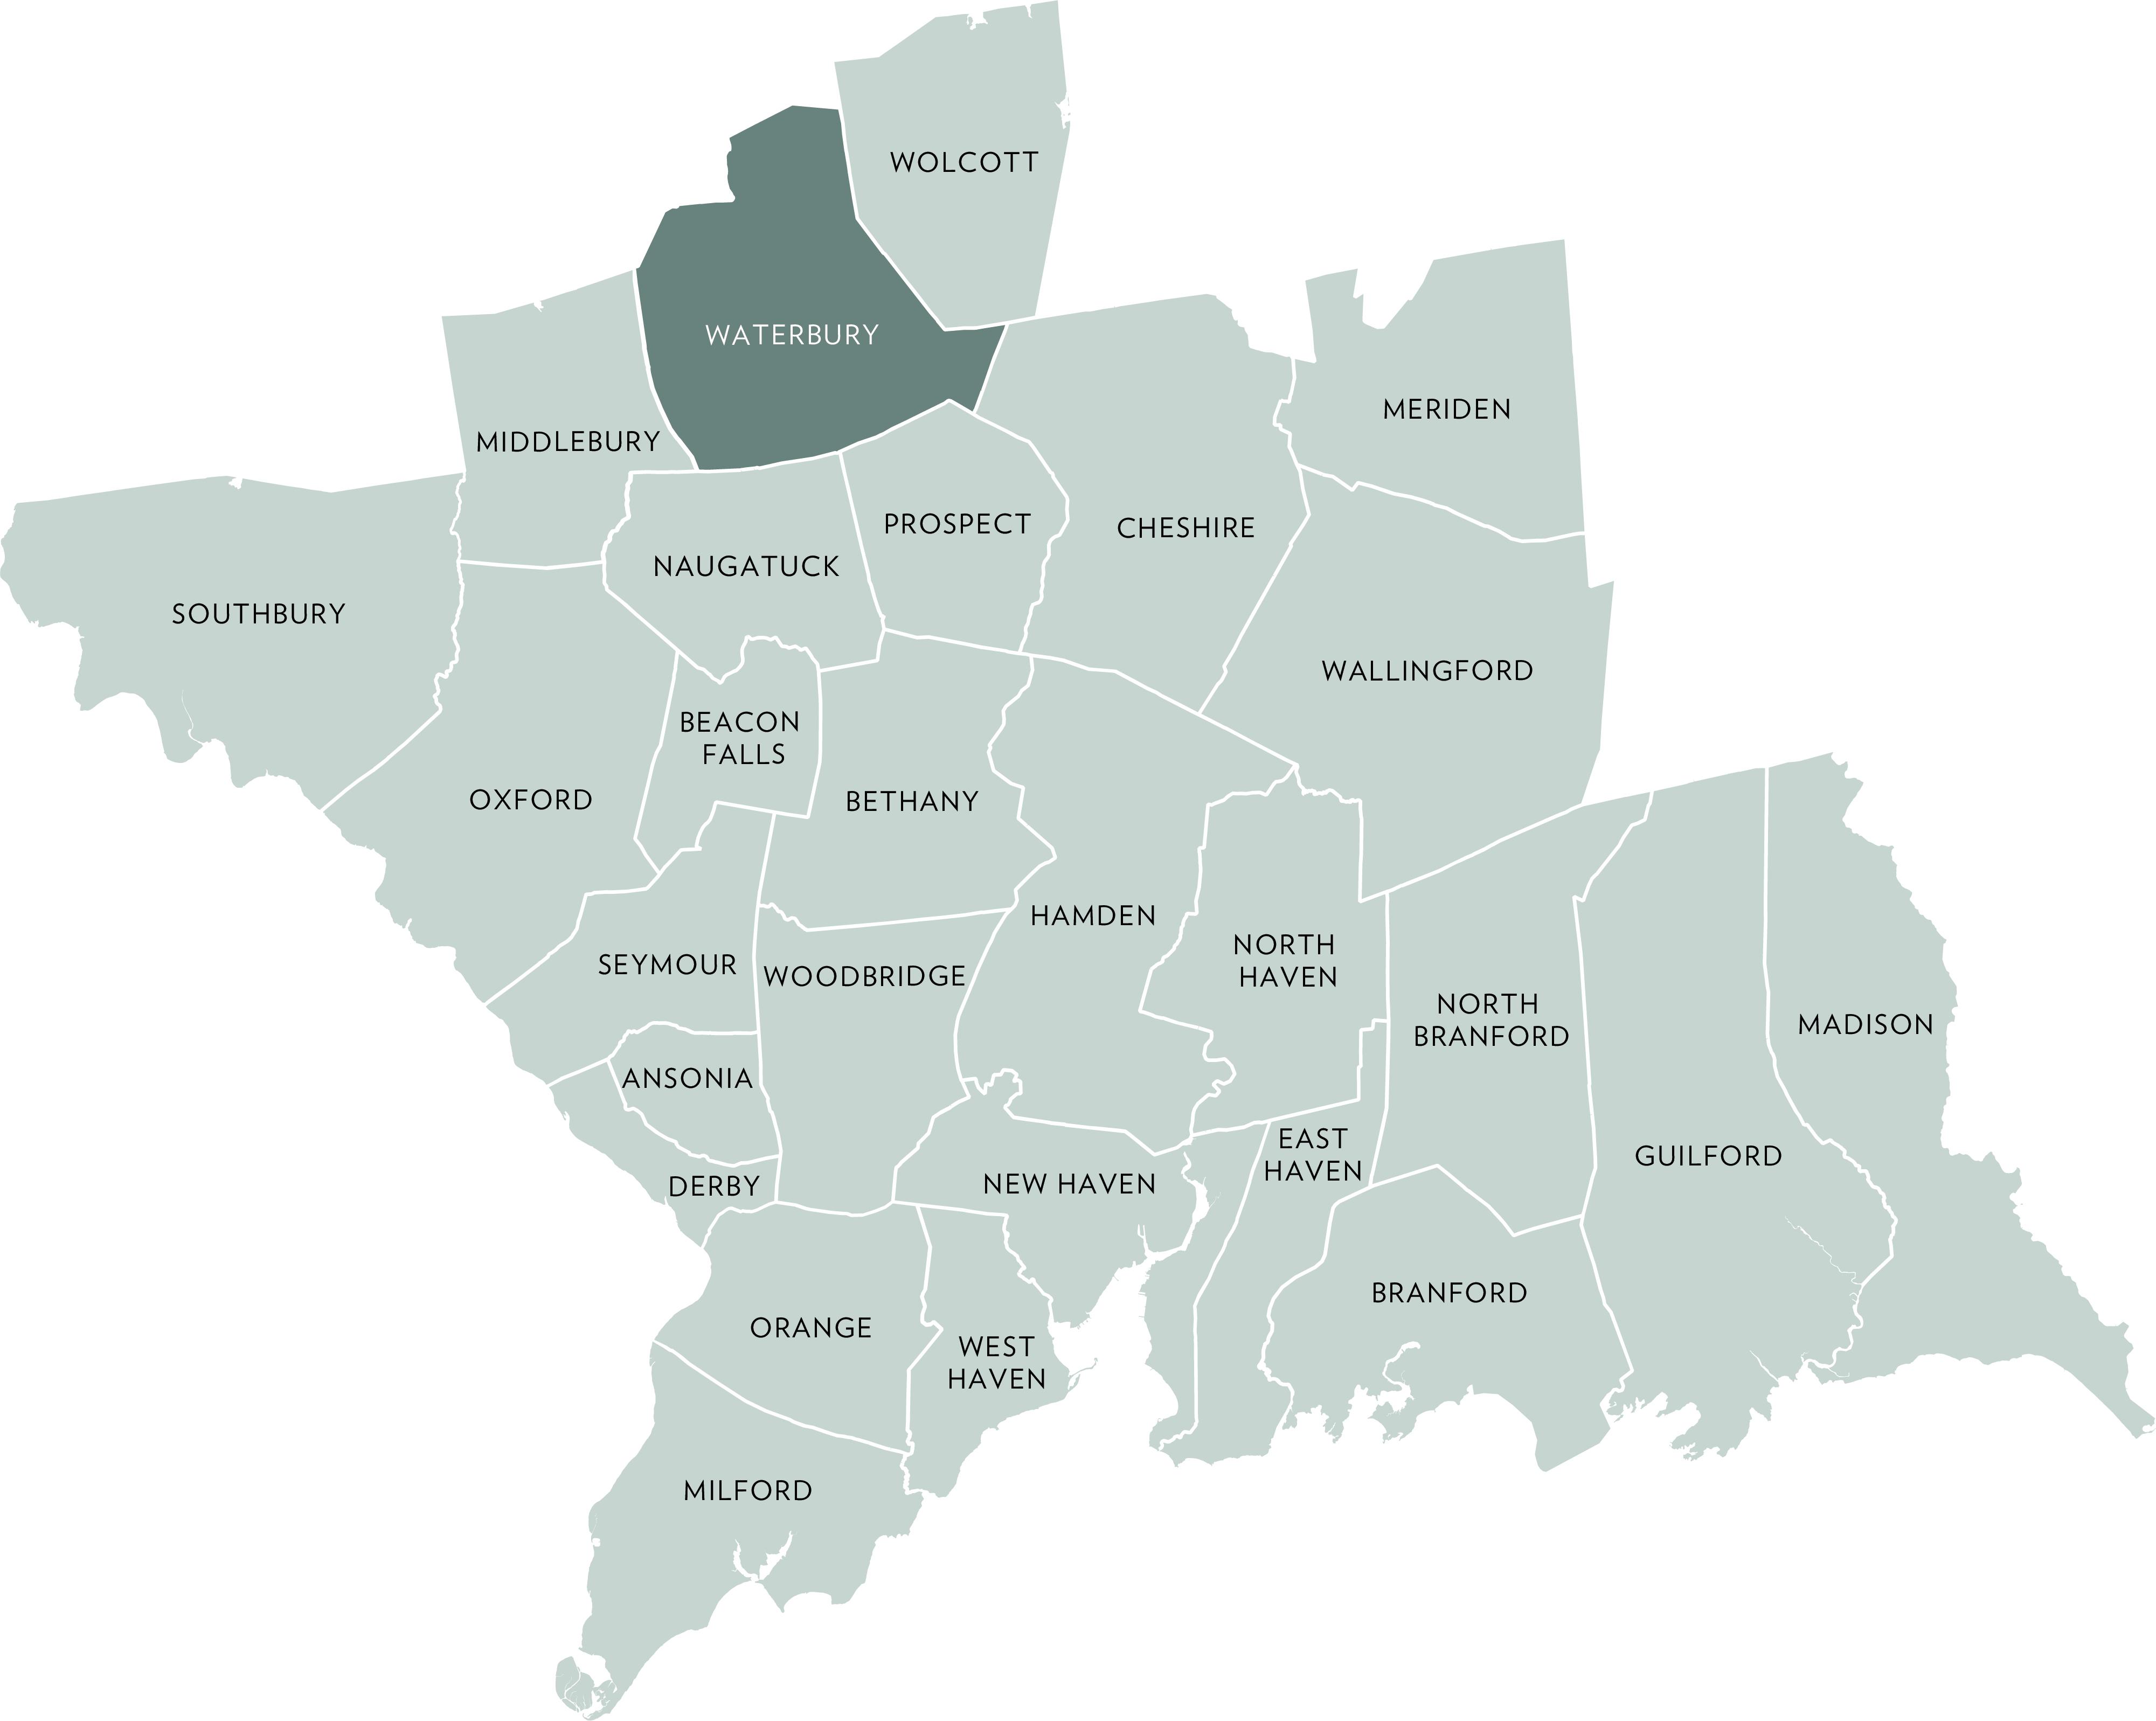
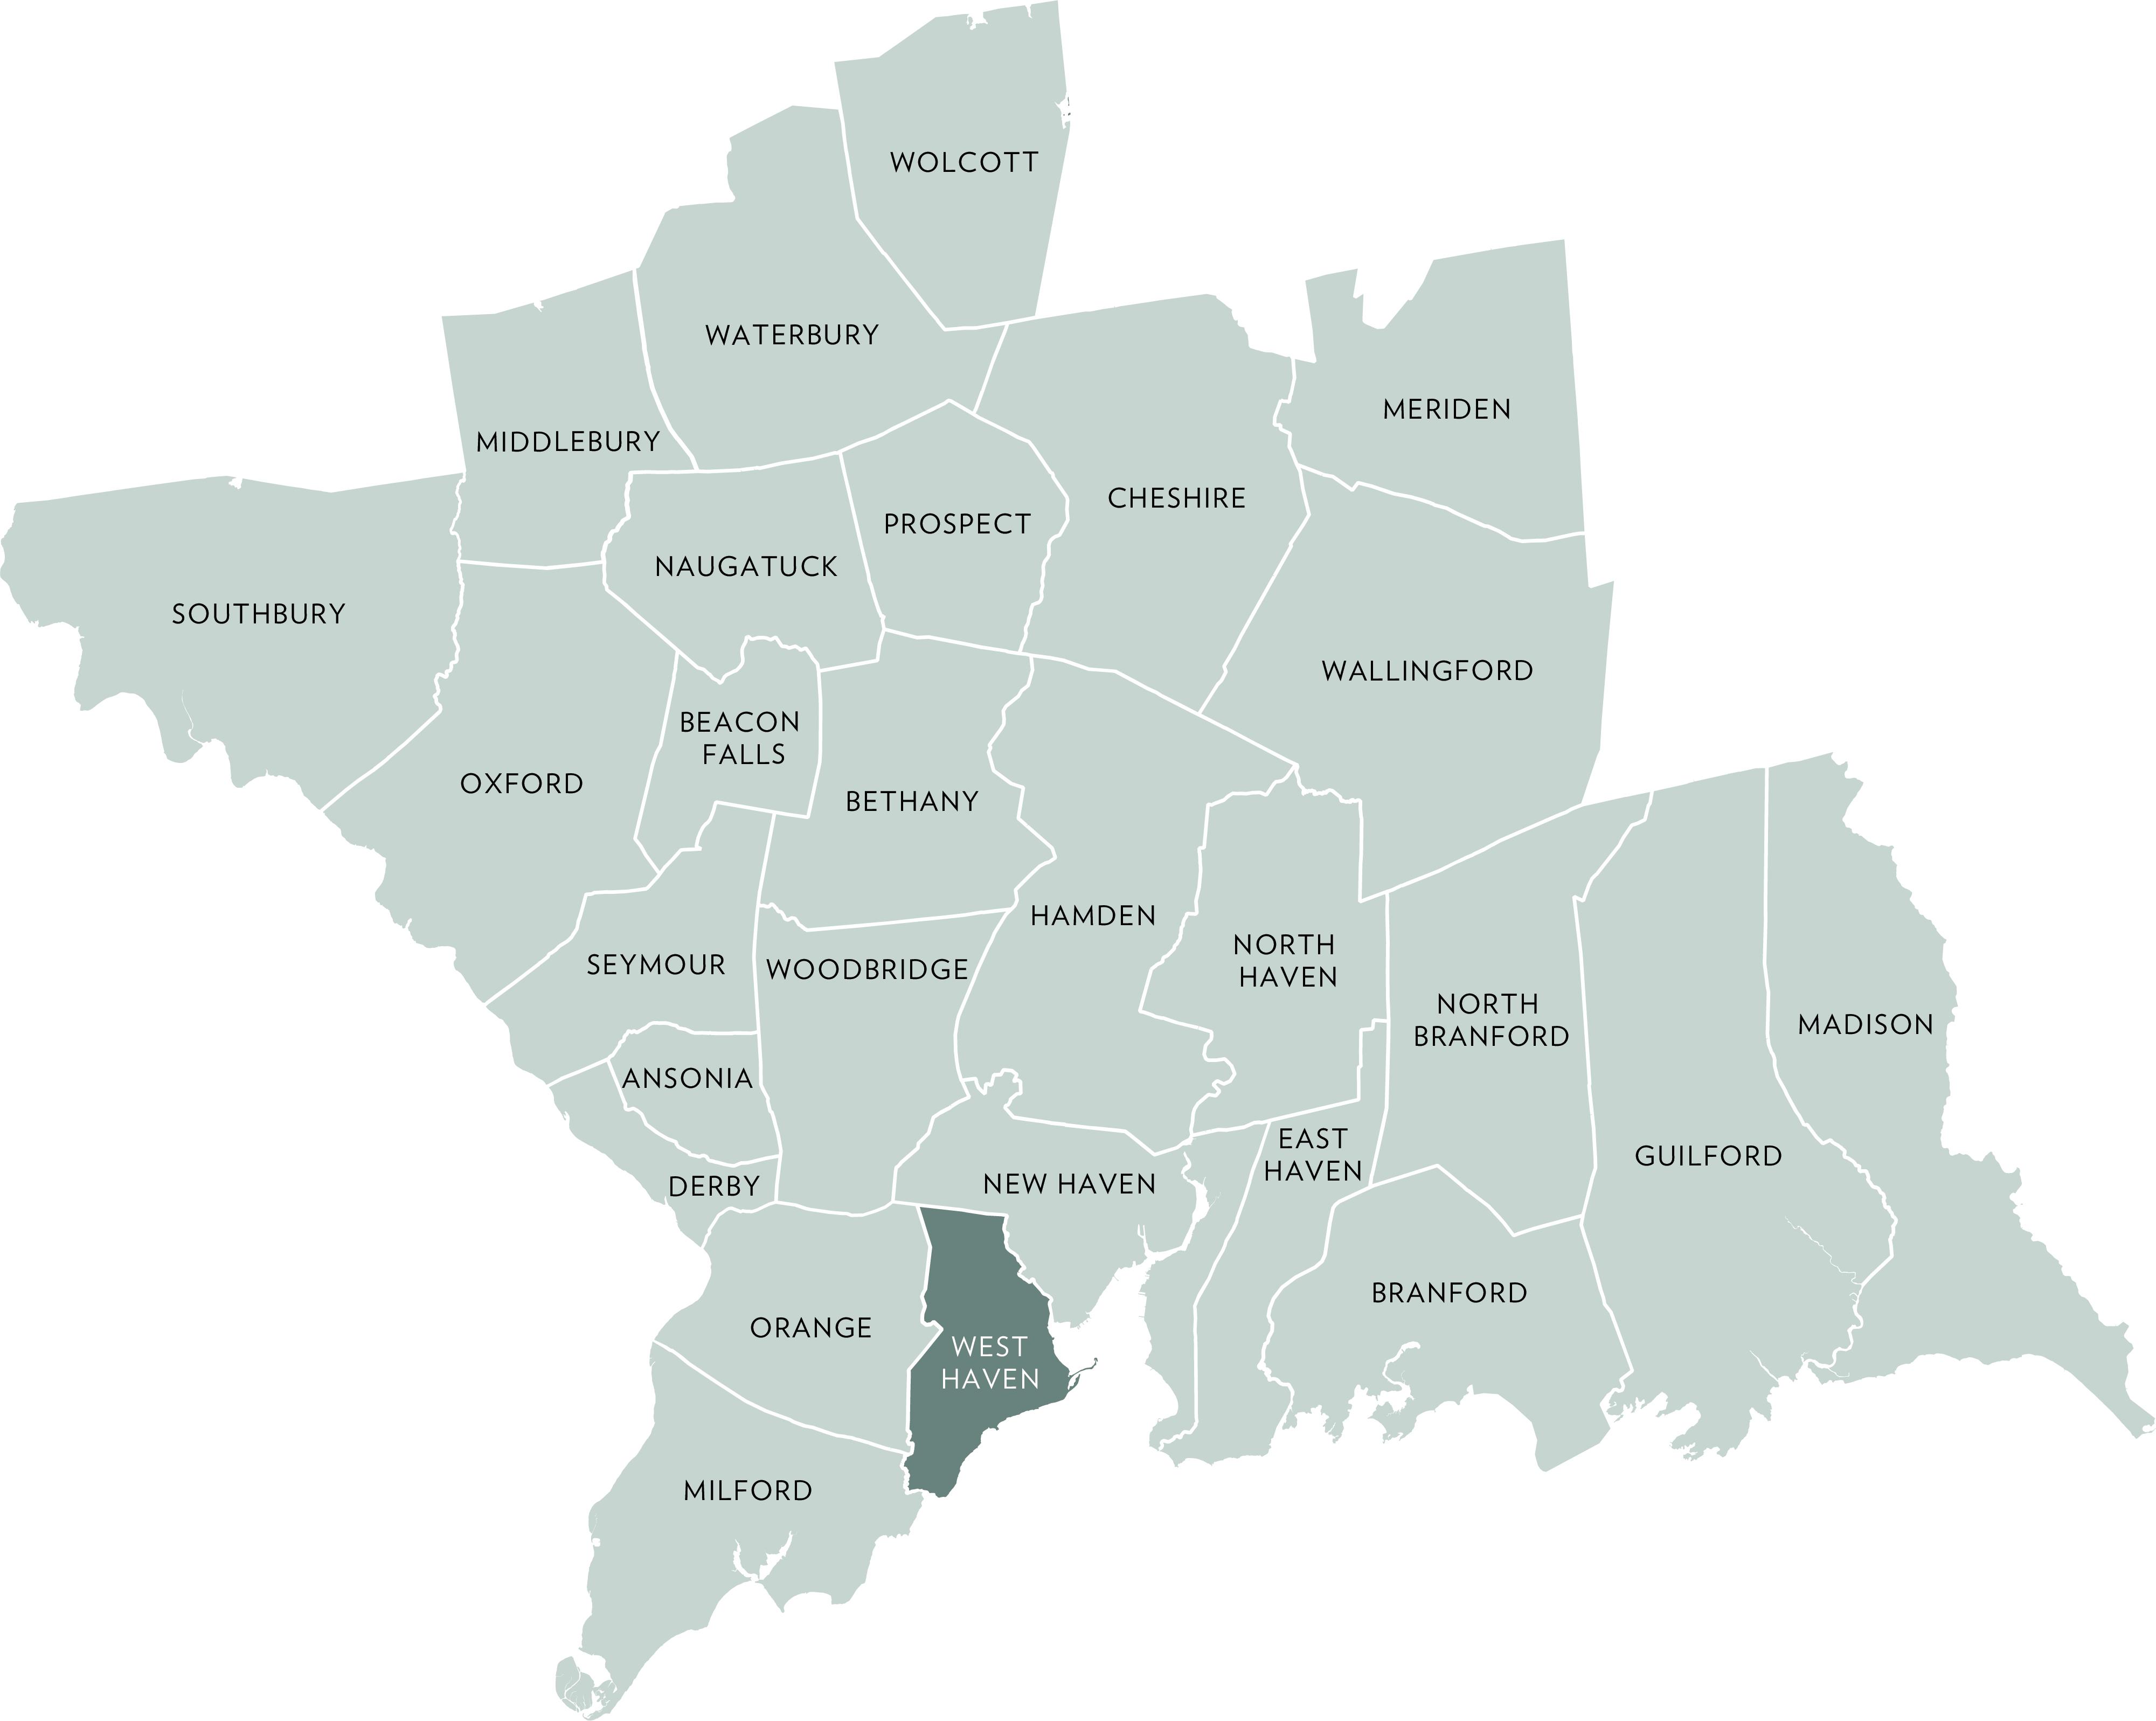
ACTIVE LISTINGS
Q2- 2026 vs Q2- 2025 -1.7%
PENDING LISTINGS
Q2- 2026 vs Q2- 2025 39.1%
Q2- 2026 vs Q2- 2025 -15.3%
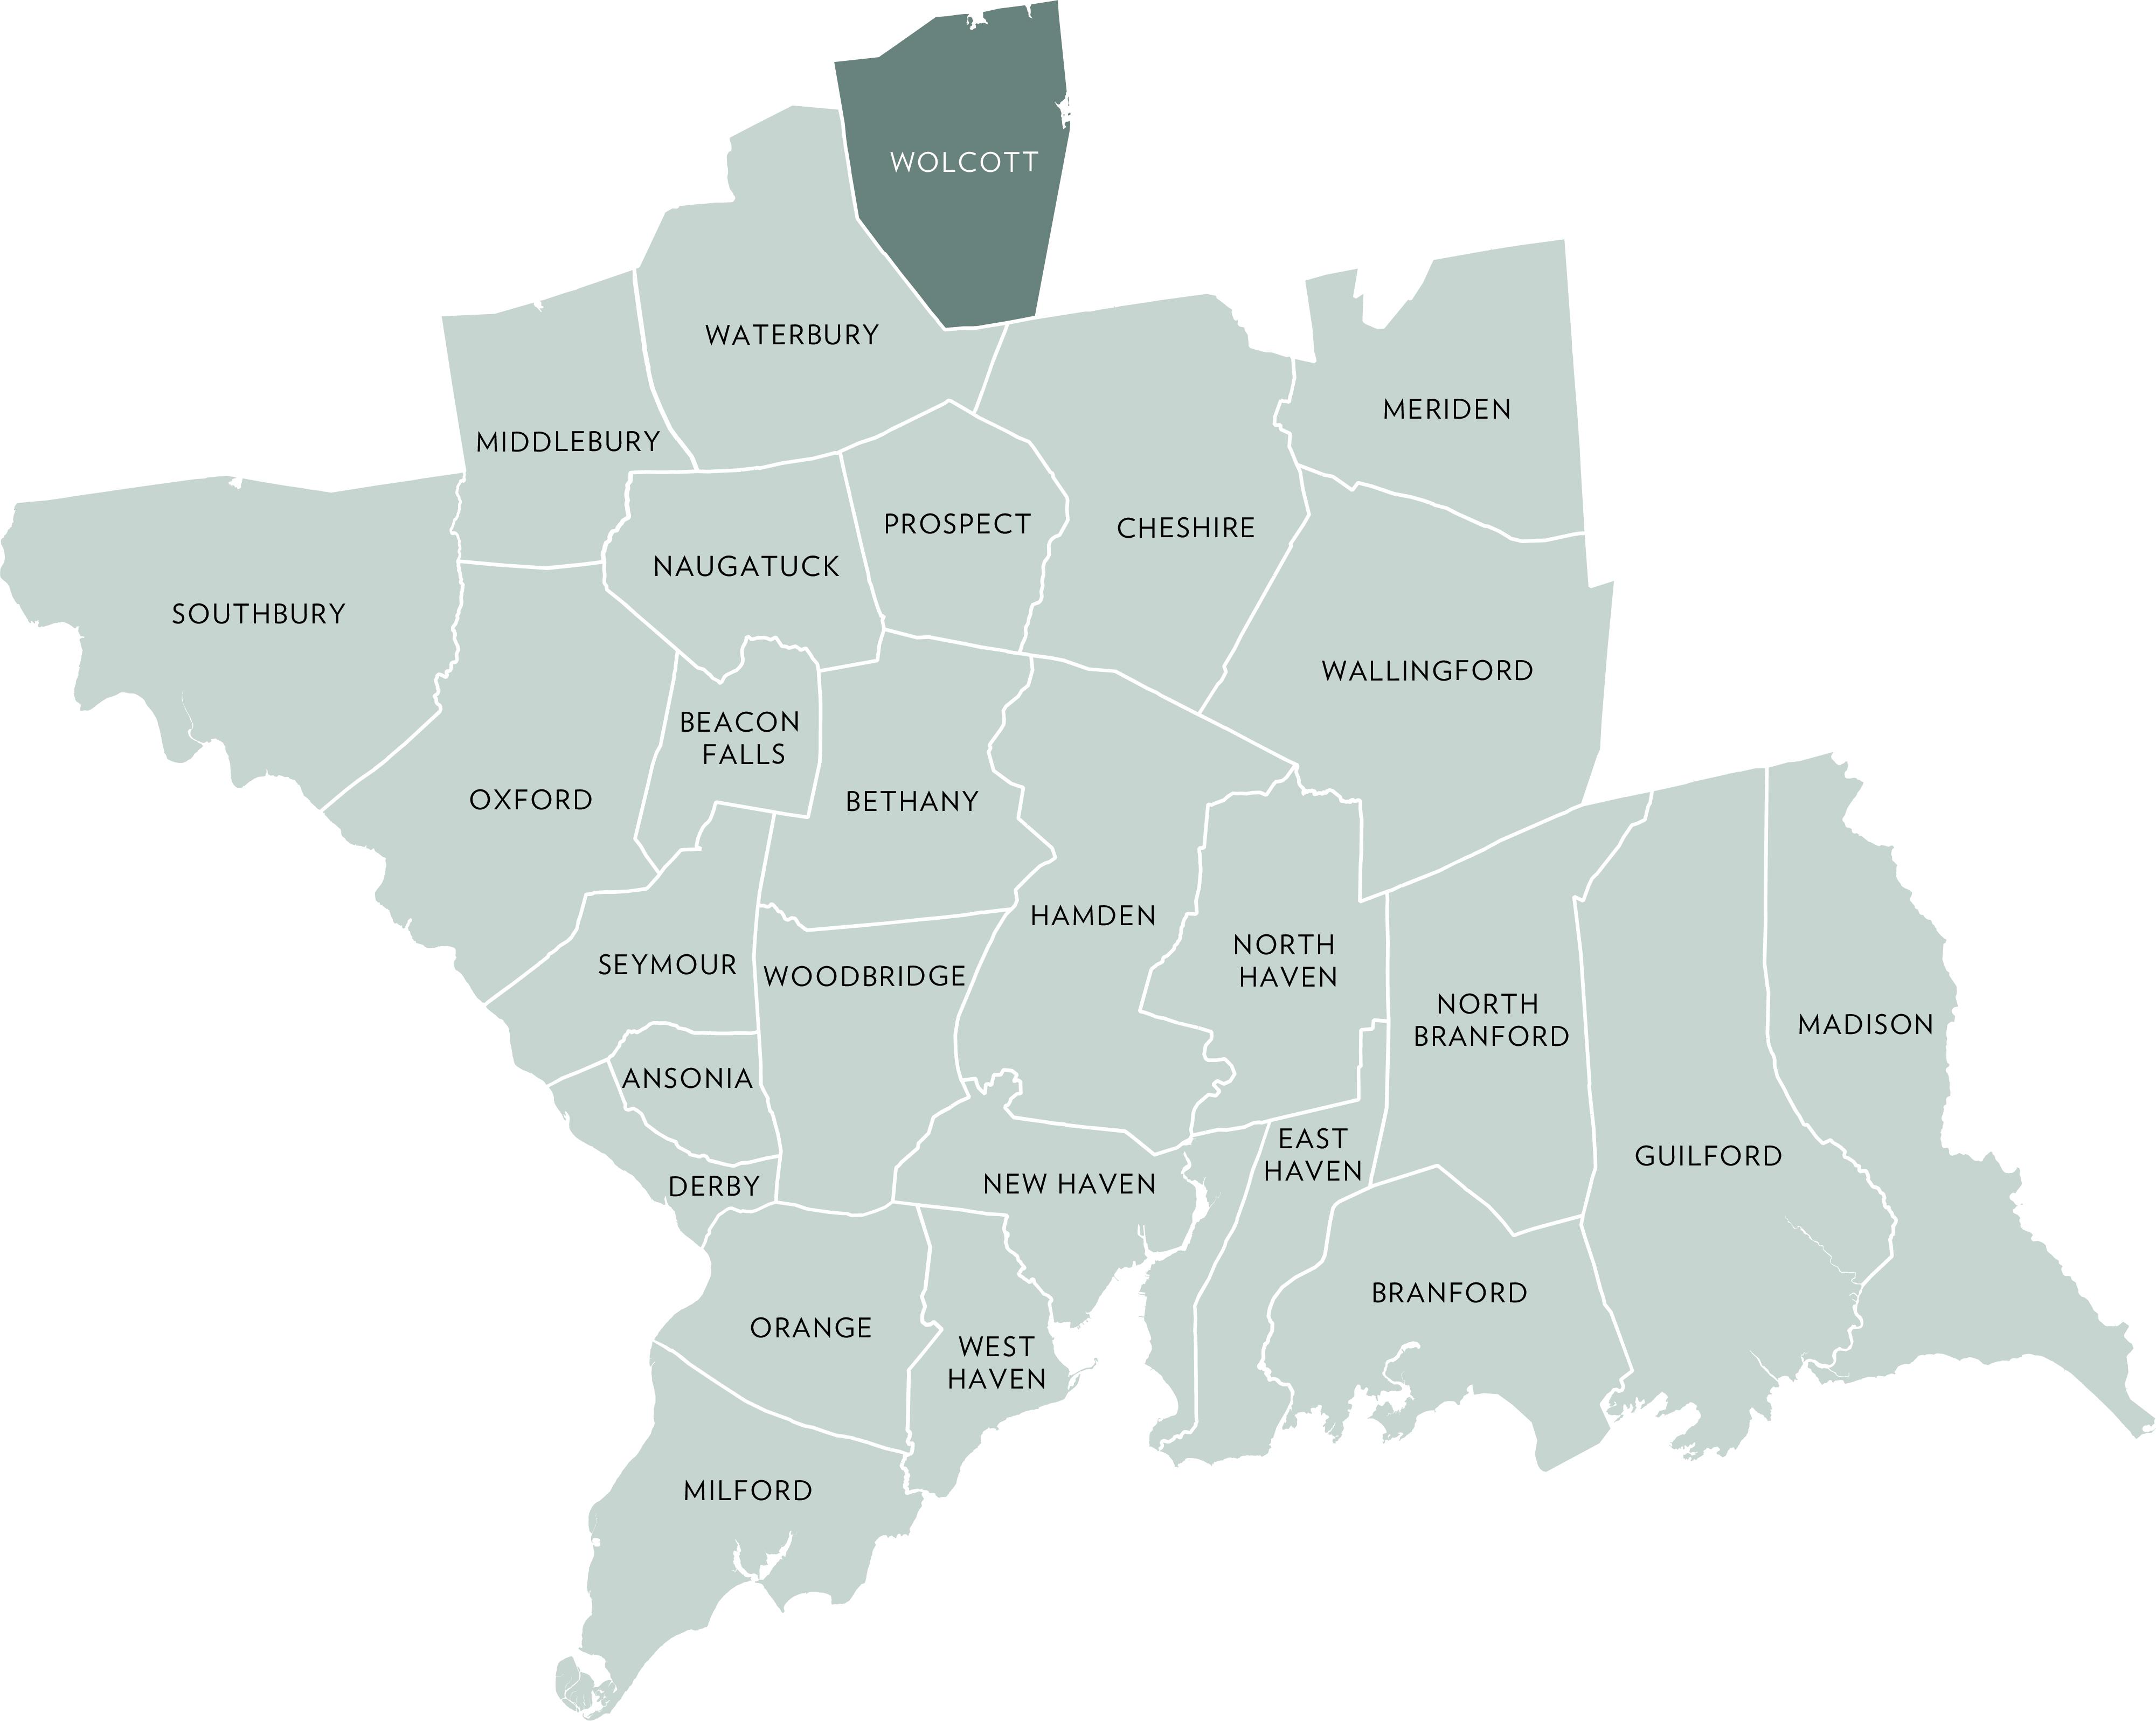
Source : Smart MLS, Single Family For Sale
QUARTERLY MARKET OVERVIEW
ACTIVE LISTINGS
Q2- 2026 vs Q2- 2025
23.3%
PENDING LISTINGS
Q2- 2026 vs Q2- 2025 25.0%
Q2- 2026 vs Q2- 2025 -34.2%
QUARTERLY MARKET OVERVIEW
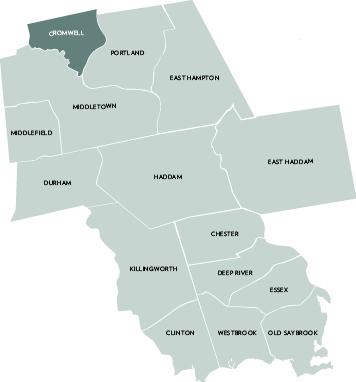
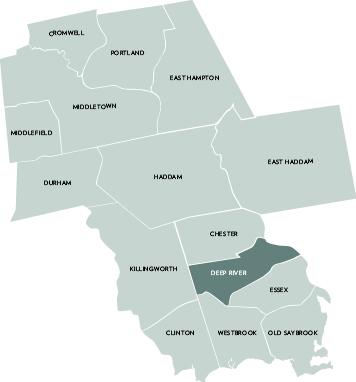
ACTIVE LISTINGS
Q2- 2026 vs Q2- 2025
85.7%
PENDING LISTINGS
Q2- 2026 vs Q2- 2025 250.0% SOLD LISTINGS
Q2- 2026 vs Q2- 2025 -8.3%
QUARTERLY MARKET OVERVIEW
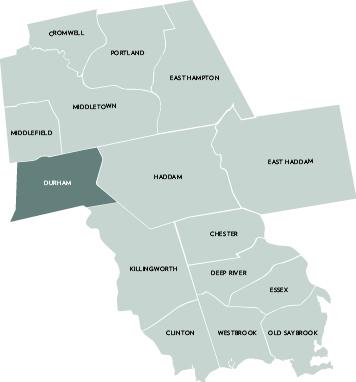
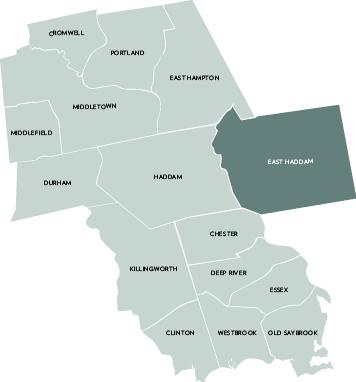
ACTIVE LISTINGS
Q2- 2026 vs Q2- 2025 -39.6%
PENDING LISTINGS
Q2- 2026 vs Q2- 2025 -26.7%
Q2- 2026 vs Q2- 2025 15.4%
QUARTERLY MARKET OVERVIEW
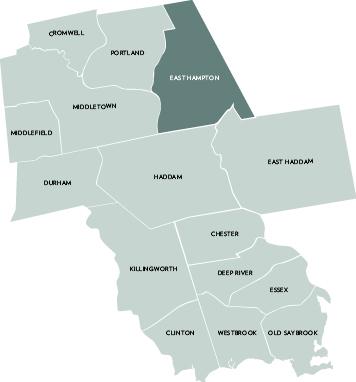
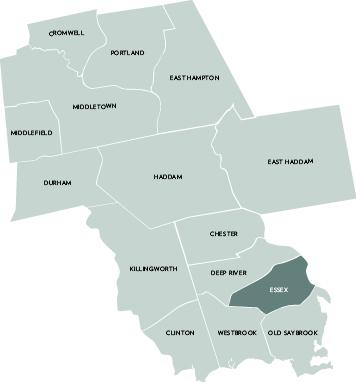
ACTIVE LISTINGS
Q2- 2026 vs Q2- 2025 52.0%
PENDING LISTINGS
Q2- 2026 vs Q2- 2025 -54.5%
Q2- 2026 vs Q2- 2025 -35.7%
QUARTERLY MARKET OVERVIEW
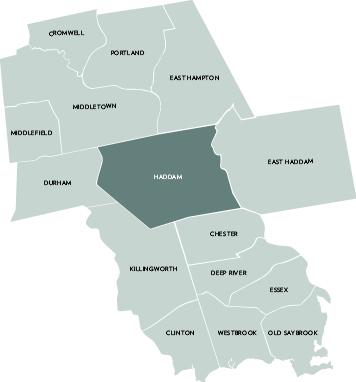
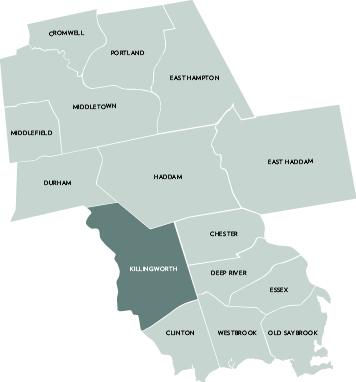
ACTIVE LISTINGS
Q2- 2026 vs Q2- 2025 7.7%
PENDING LISTINGS
Q2- 2026 vs Q2- 2025 66.7%
Q2- 2026 vs Q2- 2025 66.7%
QUARTERLY MARKET OVERVIEW
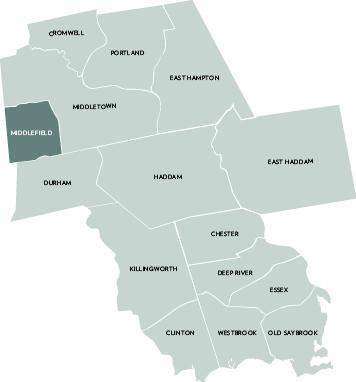
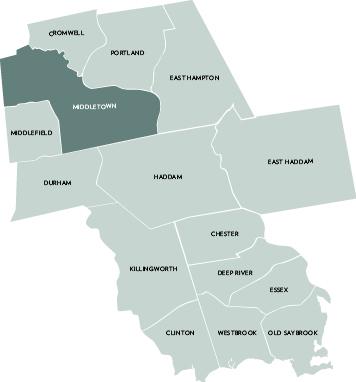
ACTIVE LISTINGS
Q2- 2026 vs Q2- 2025 6.8%
PENDING LISTINGS
Q2- 2026 vs Q2- 2025 0.0% SOLD LISTINGS
Q2- 2026 vs Q2- 2025 5.6%
QUARTERLY MARKET OVERVIEW
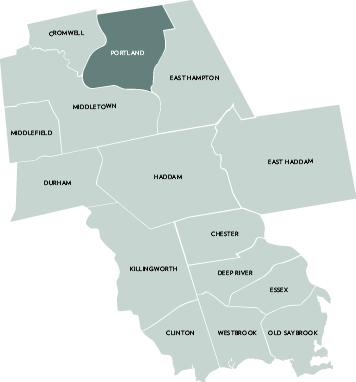
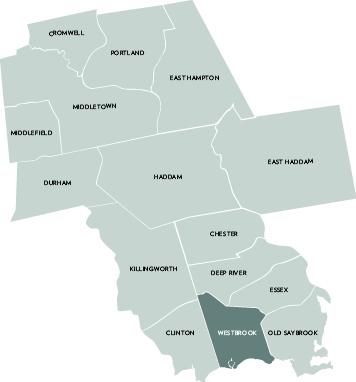
ACTIVE LISTINGS
Q2- 2026 vs Q2- 2025 -25.0%
PENDING LISTINGS
Q2- 2026 vs Q2- 2025 60.0%
Q2- 2026 vs Q2- 2025 -5.6%