
In the first quarter of 2026, the real estate markets of New Haven and Middlesex Counties demonstrated steady resilience despite varied market conditions. While sales activity experienced some moderation in certain areas, home values remained robust, supported by limited inventory and consistent buyer interest.
New Haven County continues to attract strong demand, particularly in desirable communities offering a blend of urban amenities and suburban charm. Buyers remain motivated, driving healthy competition across a wide range of price points. Middlesex County, with its blend of scenic settings and convenient access to larger metropolitan areas, has also seen sustained interest, maintaining stability in both pricing and market activity.
Inventory remains selectively available across both counties, creating an environment where well-positioned homes generate significant attention. Entry-level and mid-range properties, in particular, continue to see keen demand, highlighting ongoing buyer eagerness despite broader market fluctuations.
Looking forward, the market is expected to remain dynamic and competitive. Without a meaningful increase in supply, pricing is likely to continue its upward trajectory, particularly for sought-after properties that combine location, lifestyle, and value.
As the market leader north of New York City, Houlihan Lawrence is uniquely positioned to help buyers and sellers navigate their real estate journey with unmatched market insight, strategic guidance, and deep local expertise.
With Warm Regards,
Liz Nunan President and CEO
FIRST QUARTER 2026
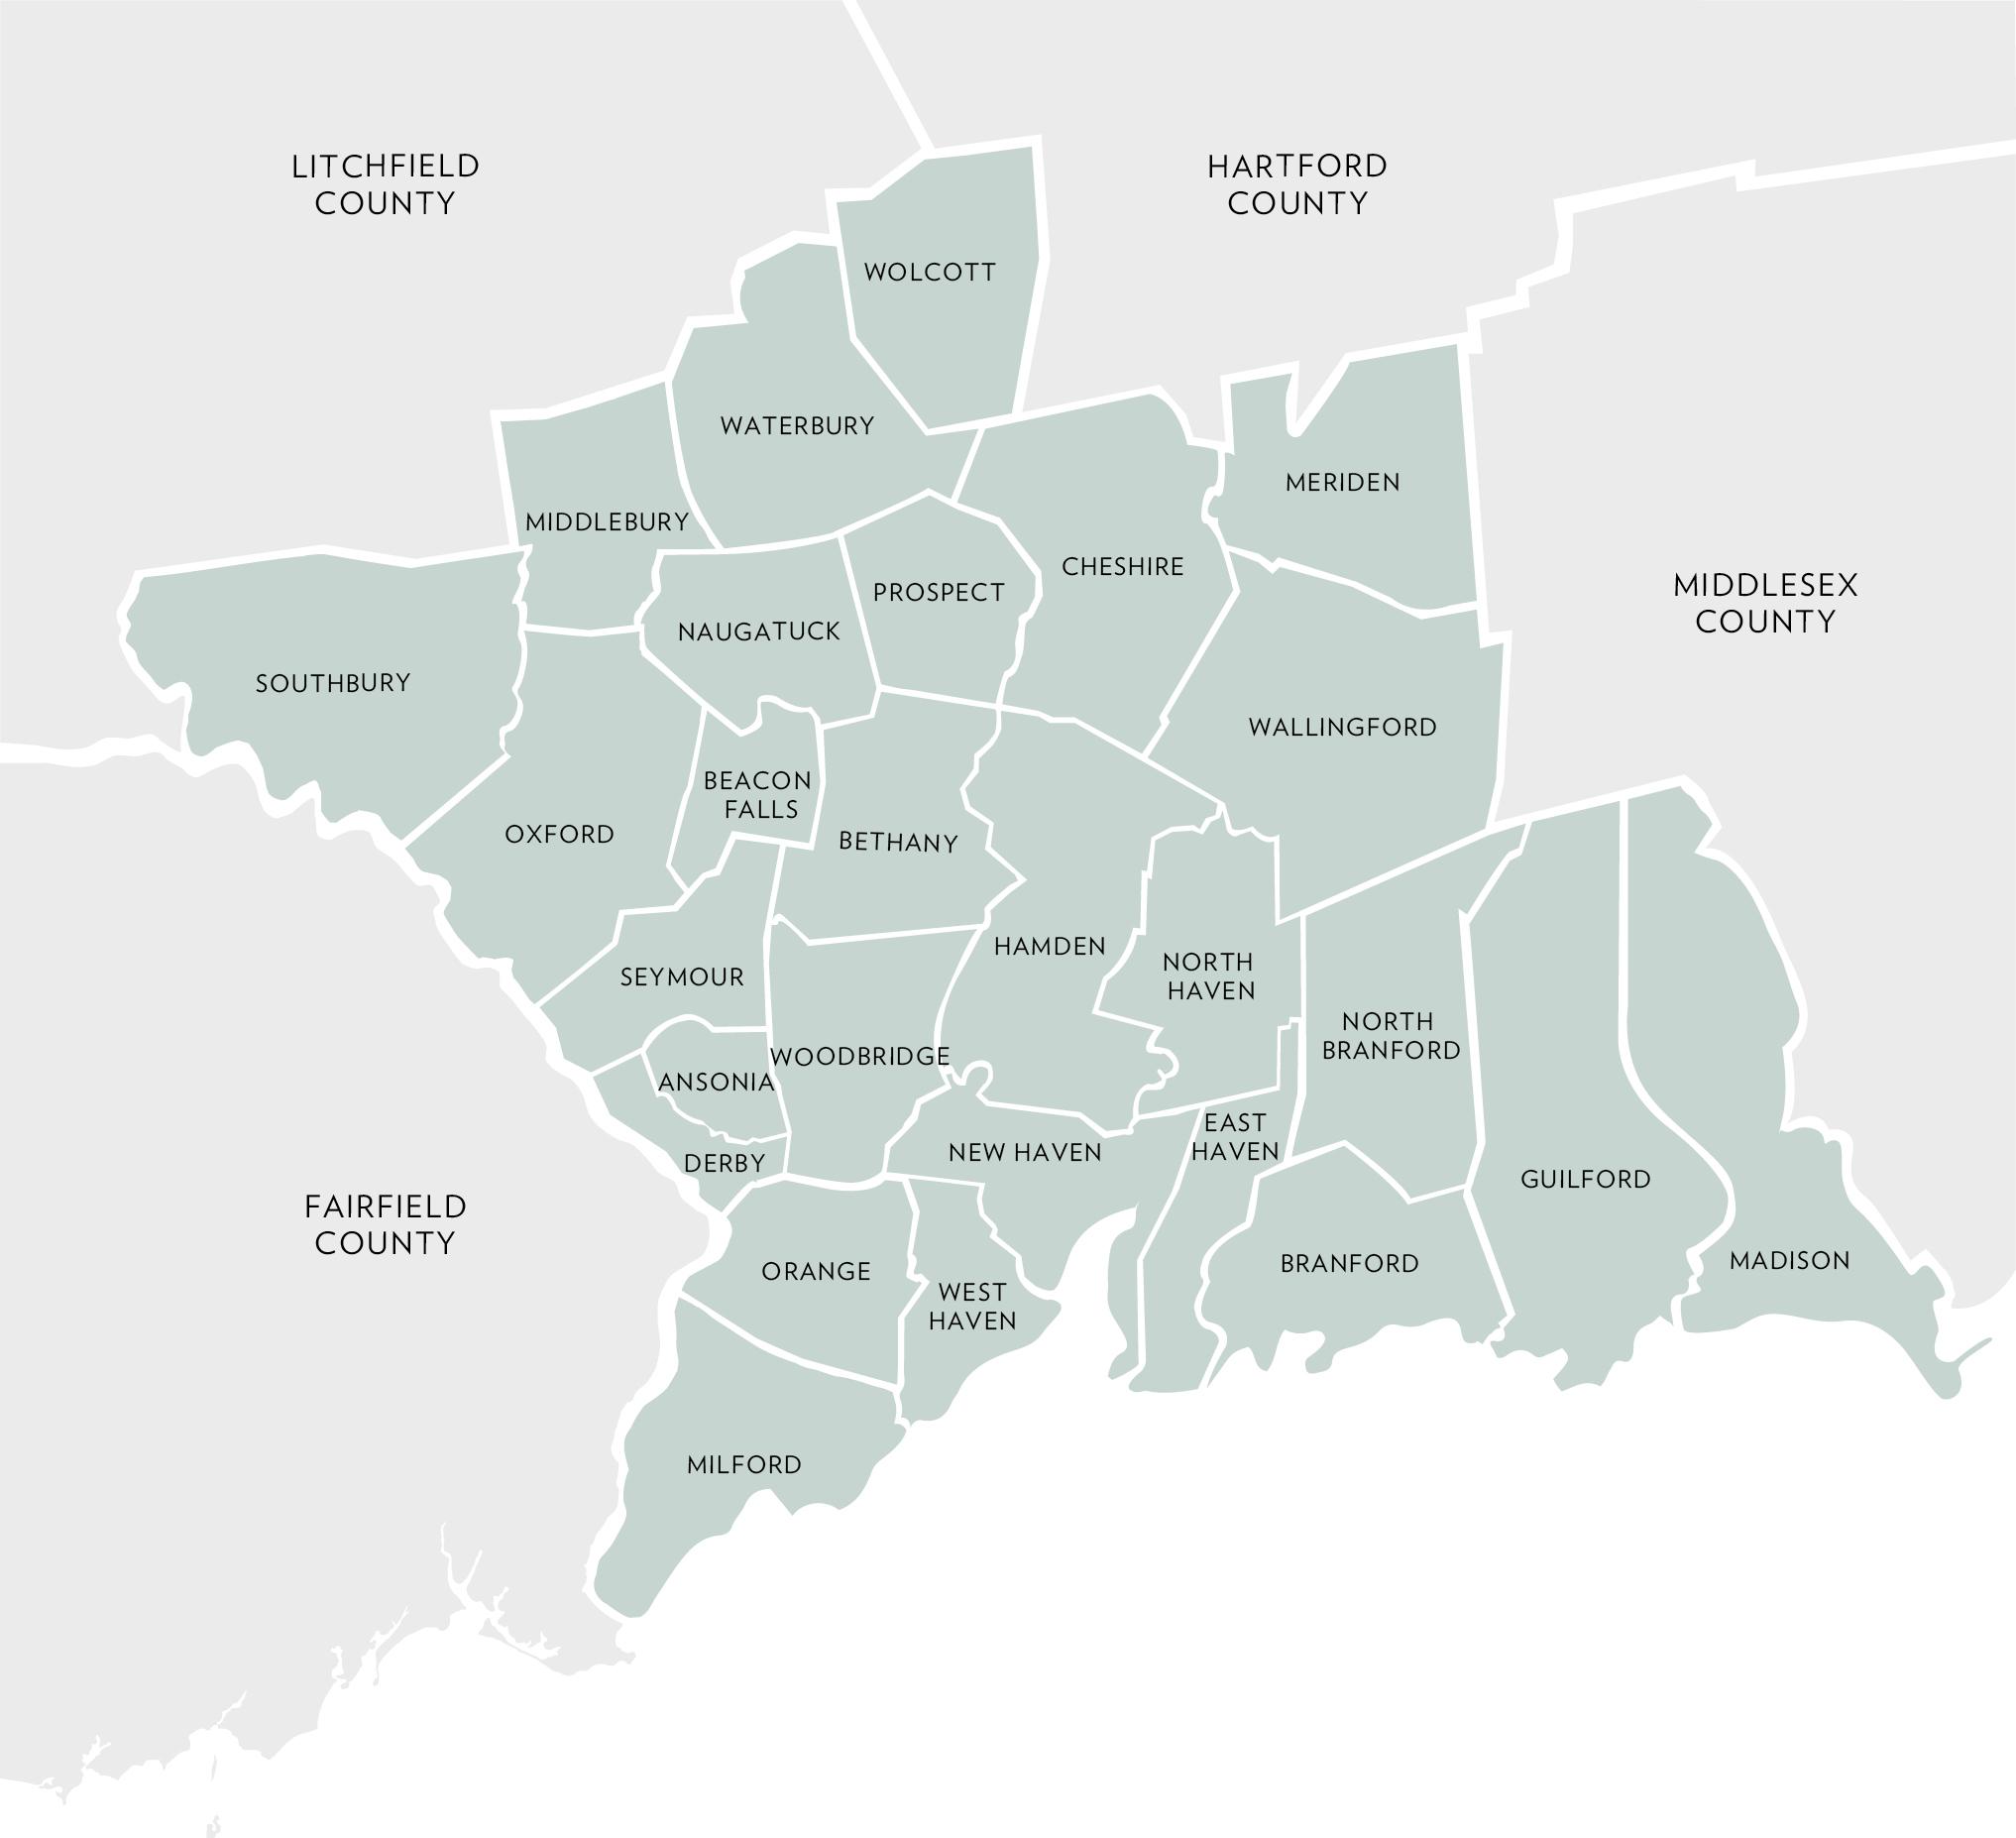
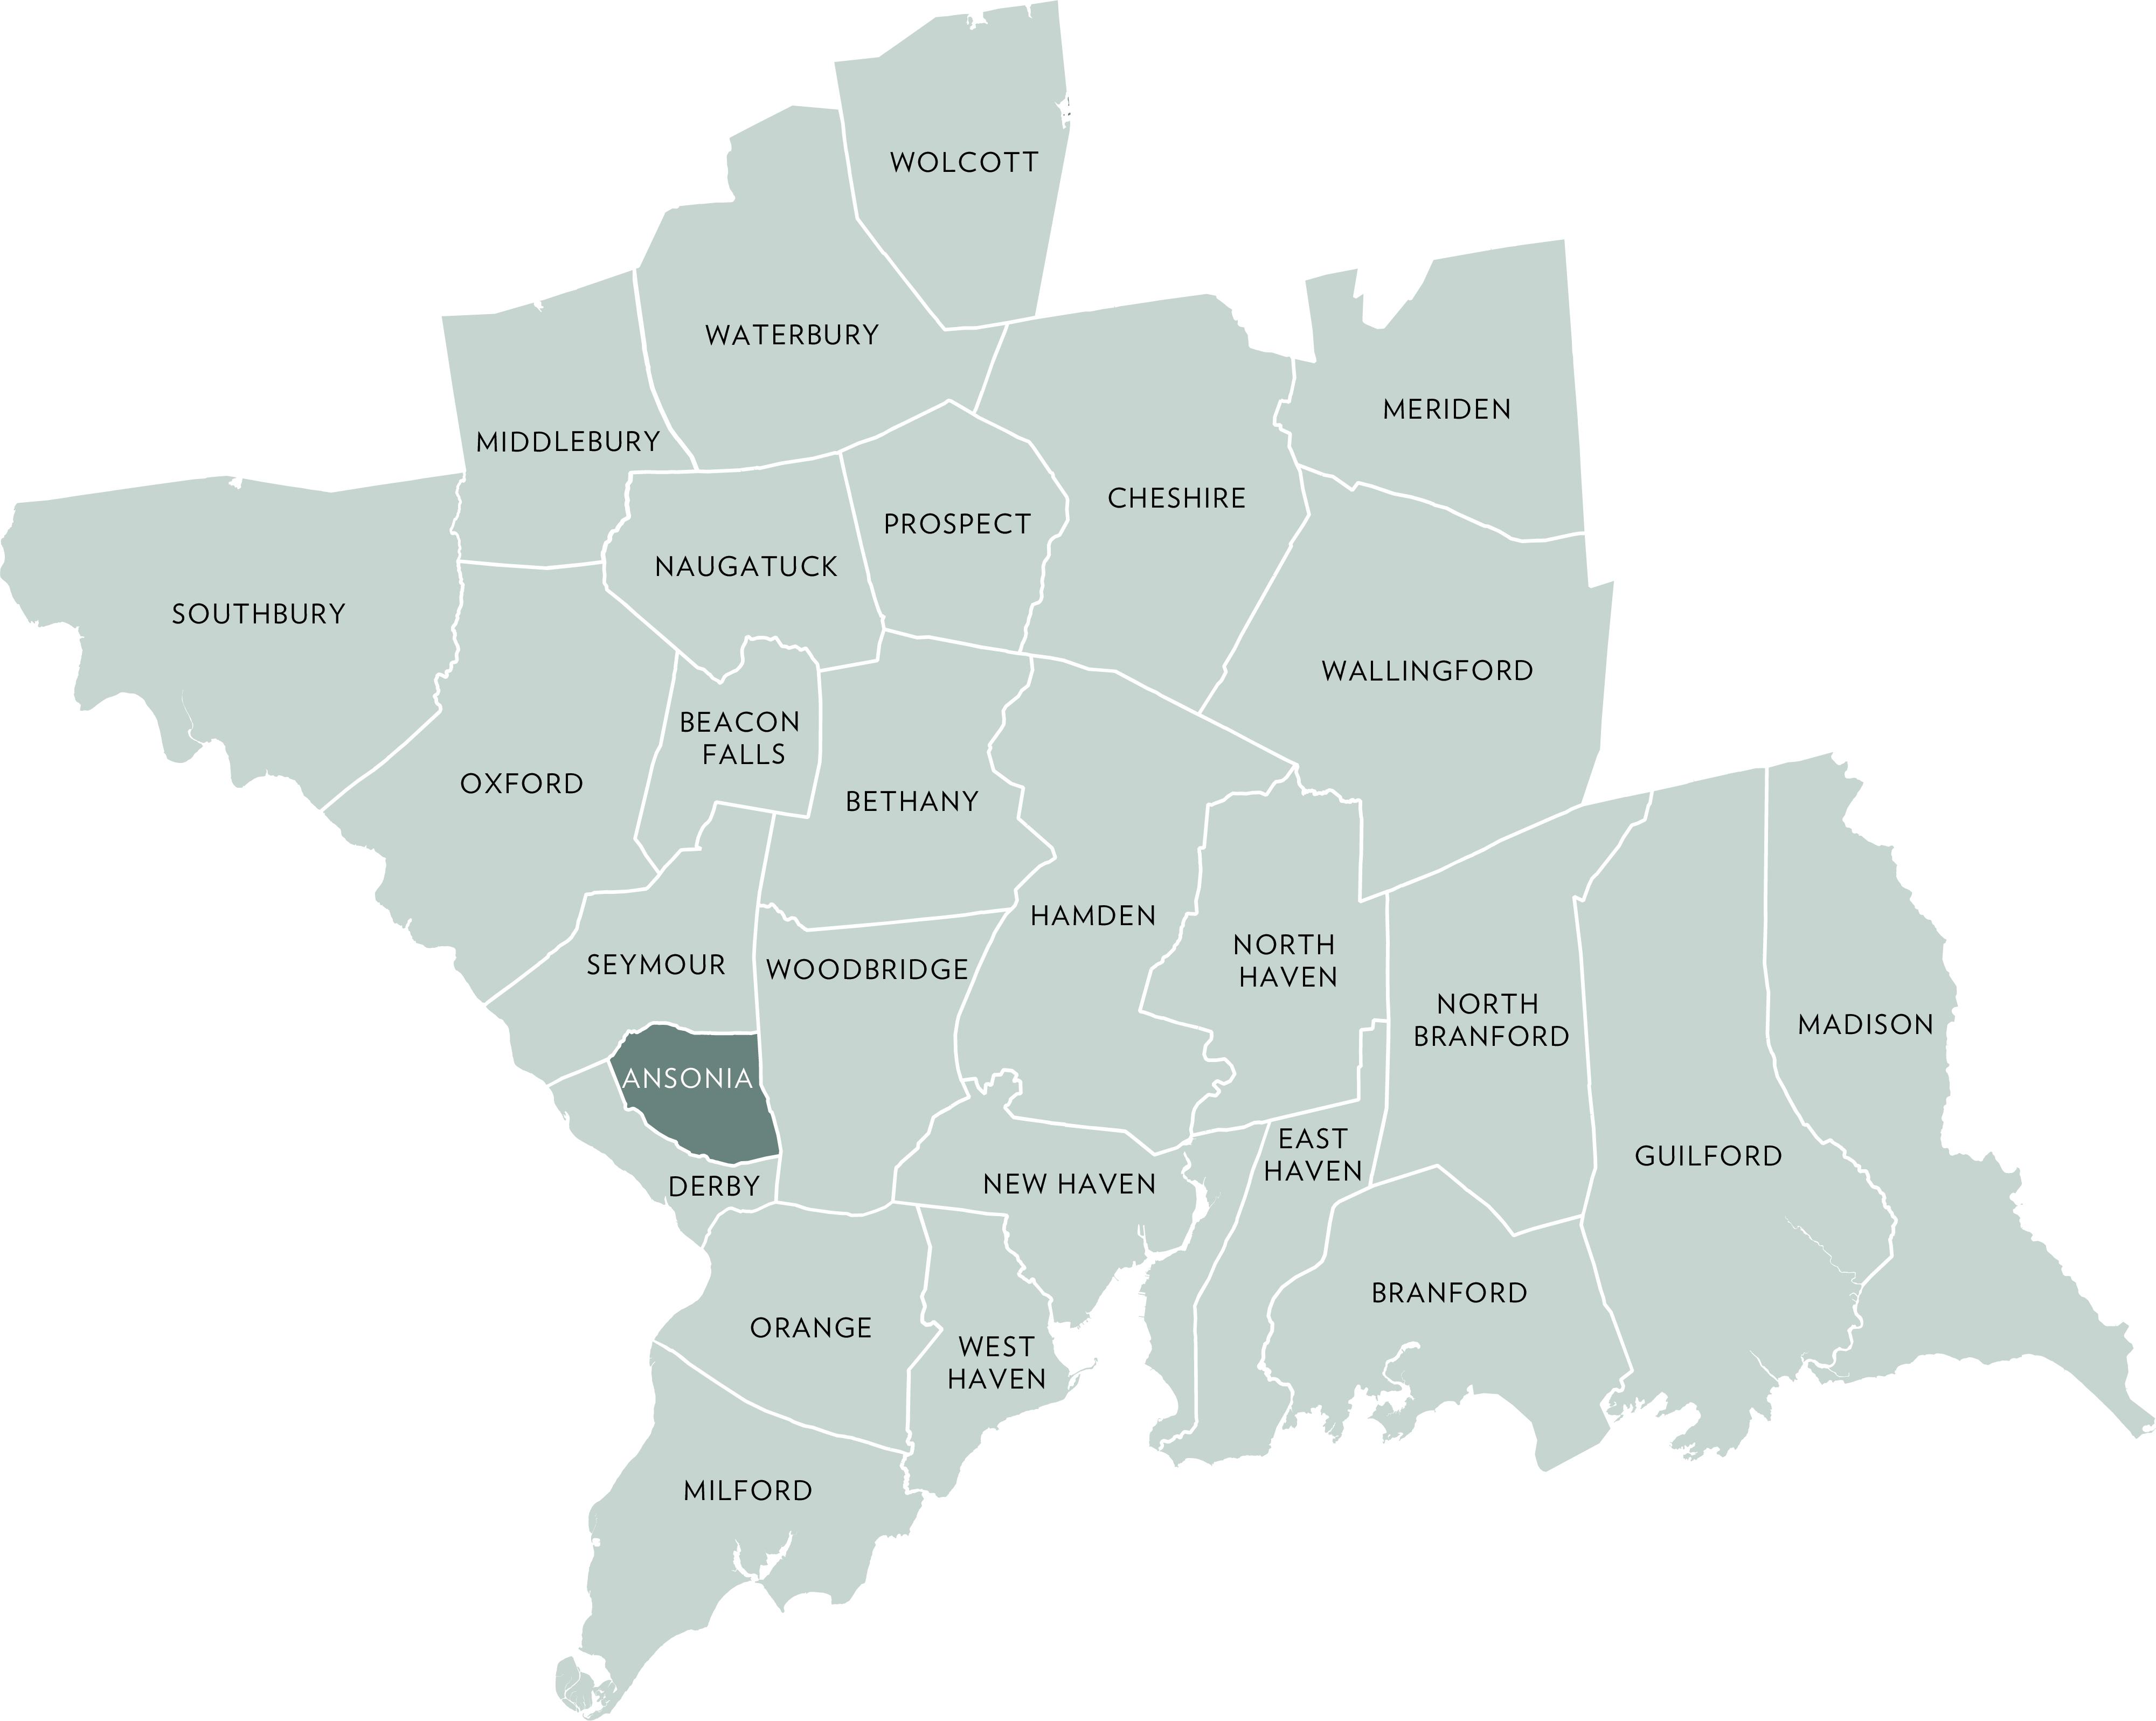
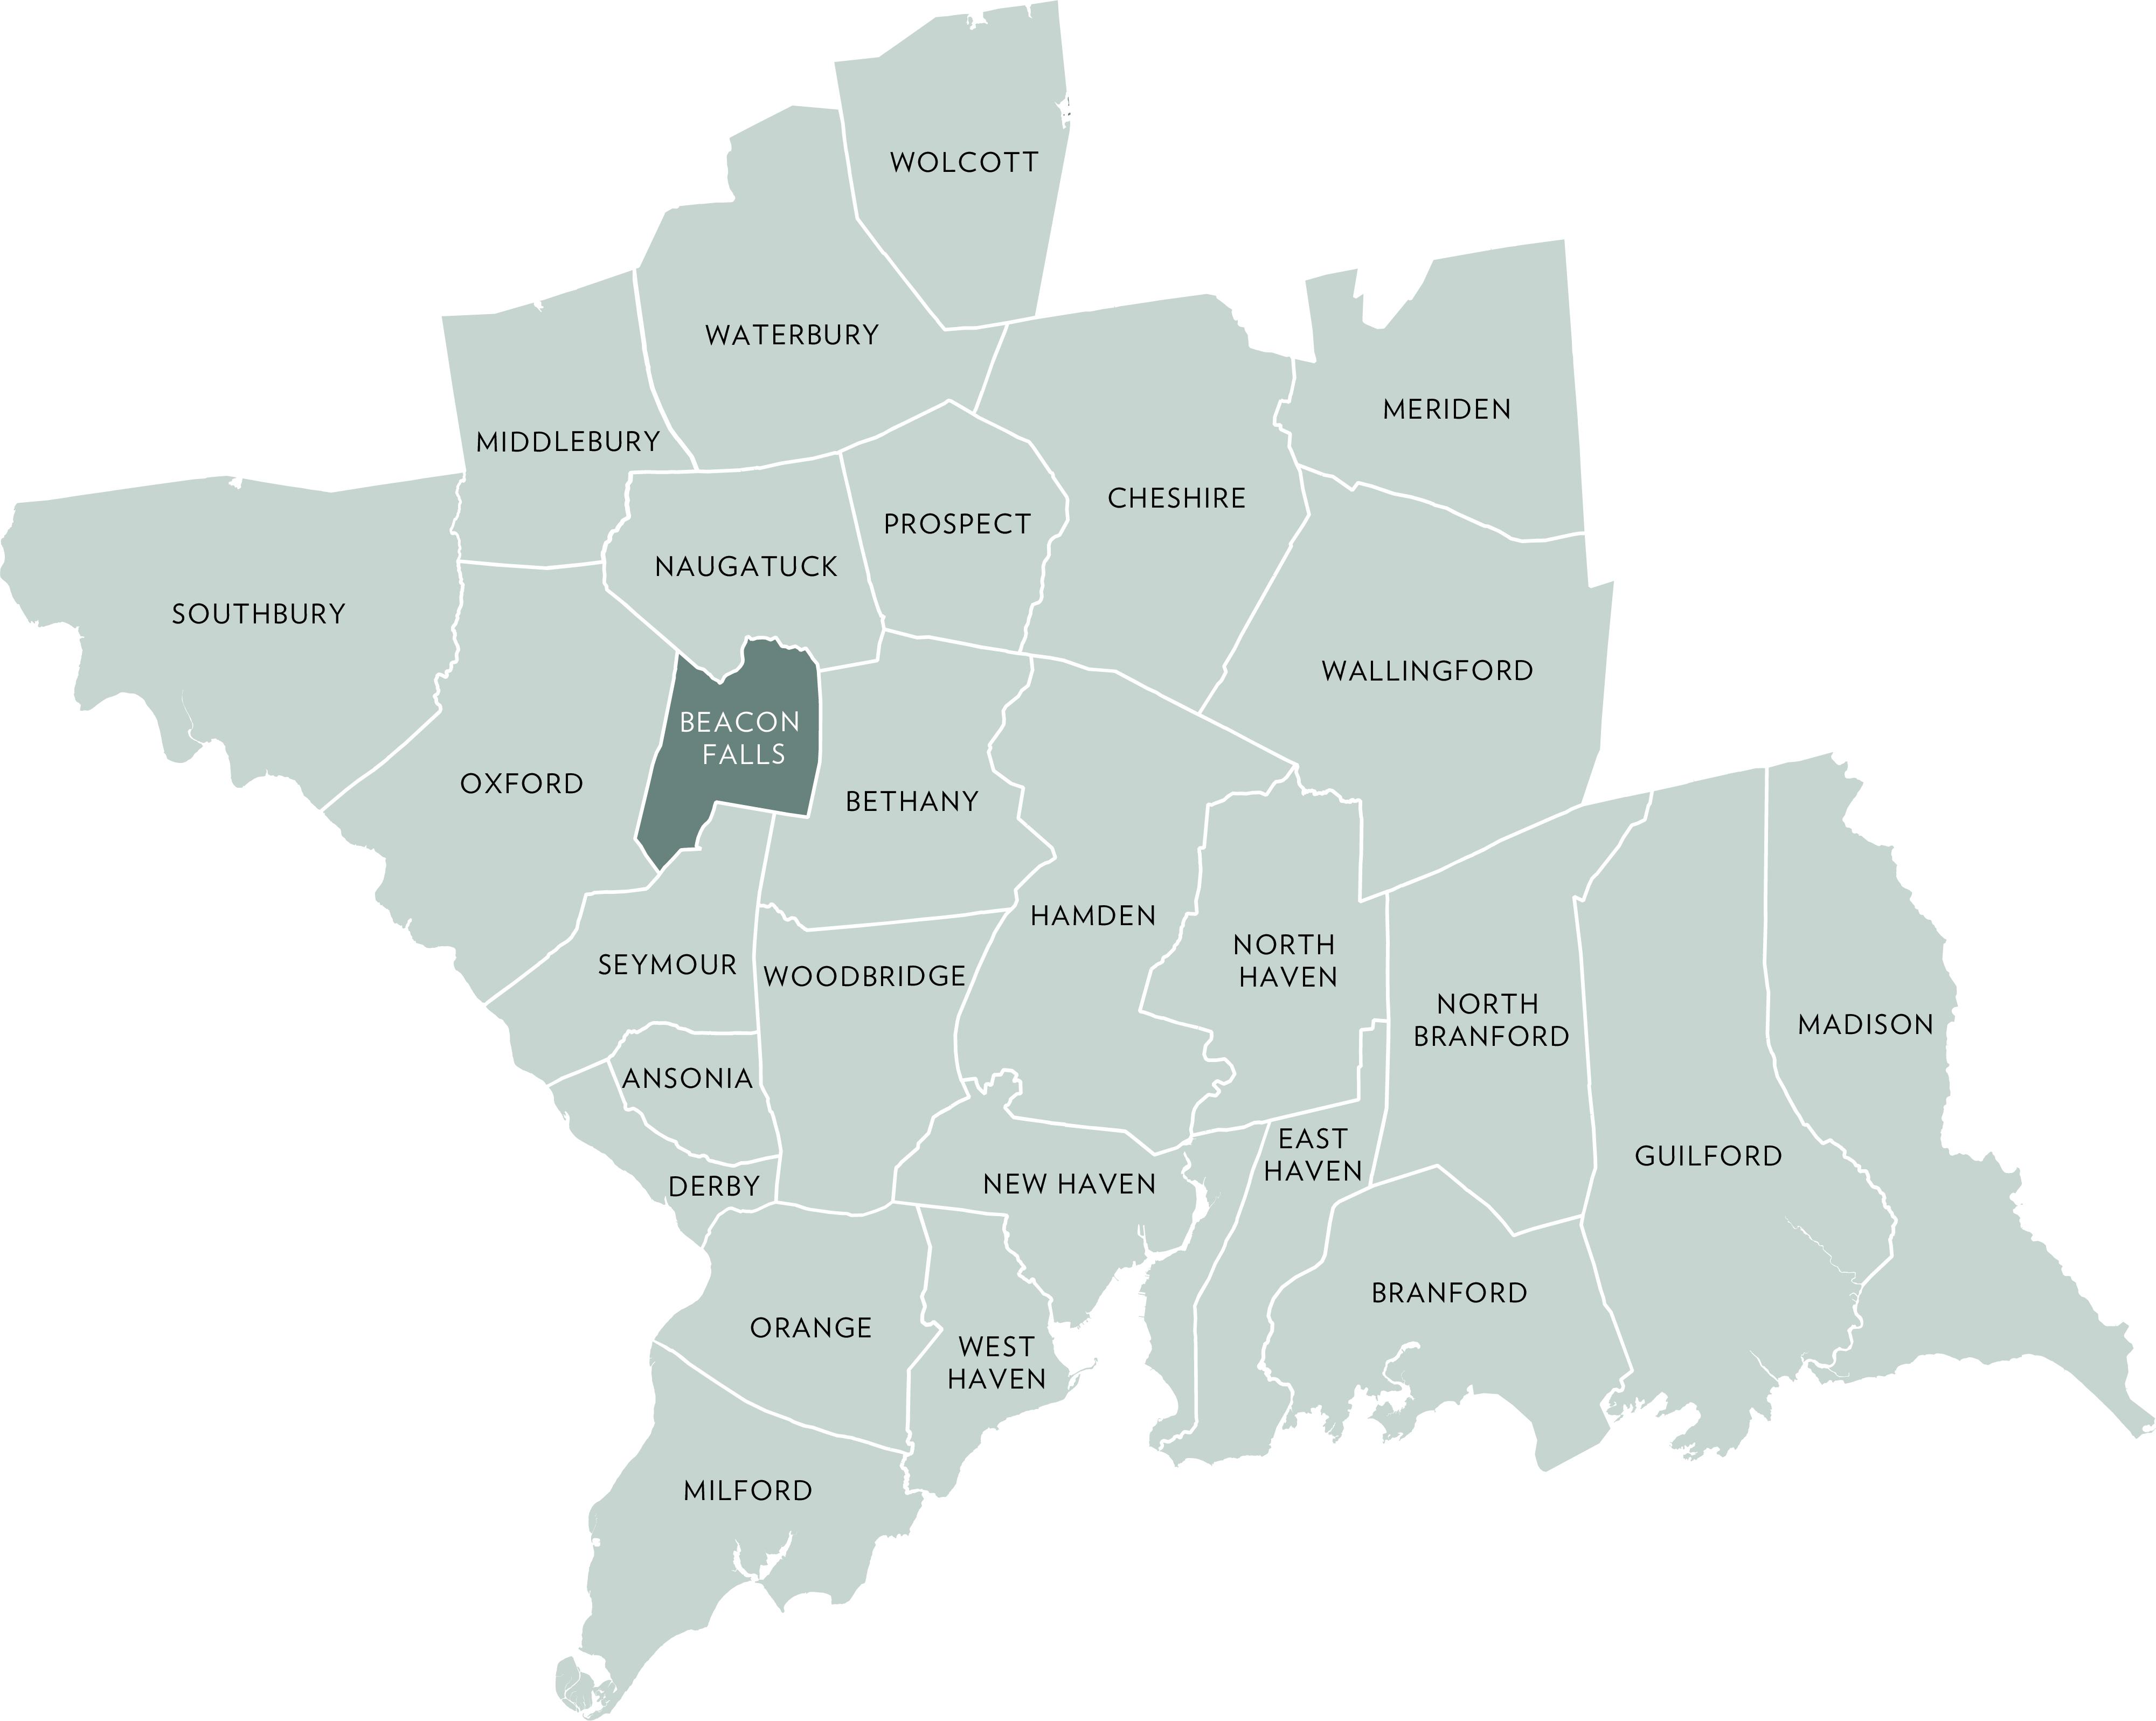
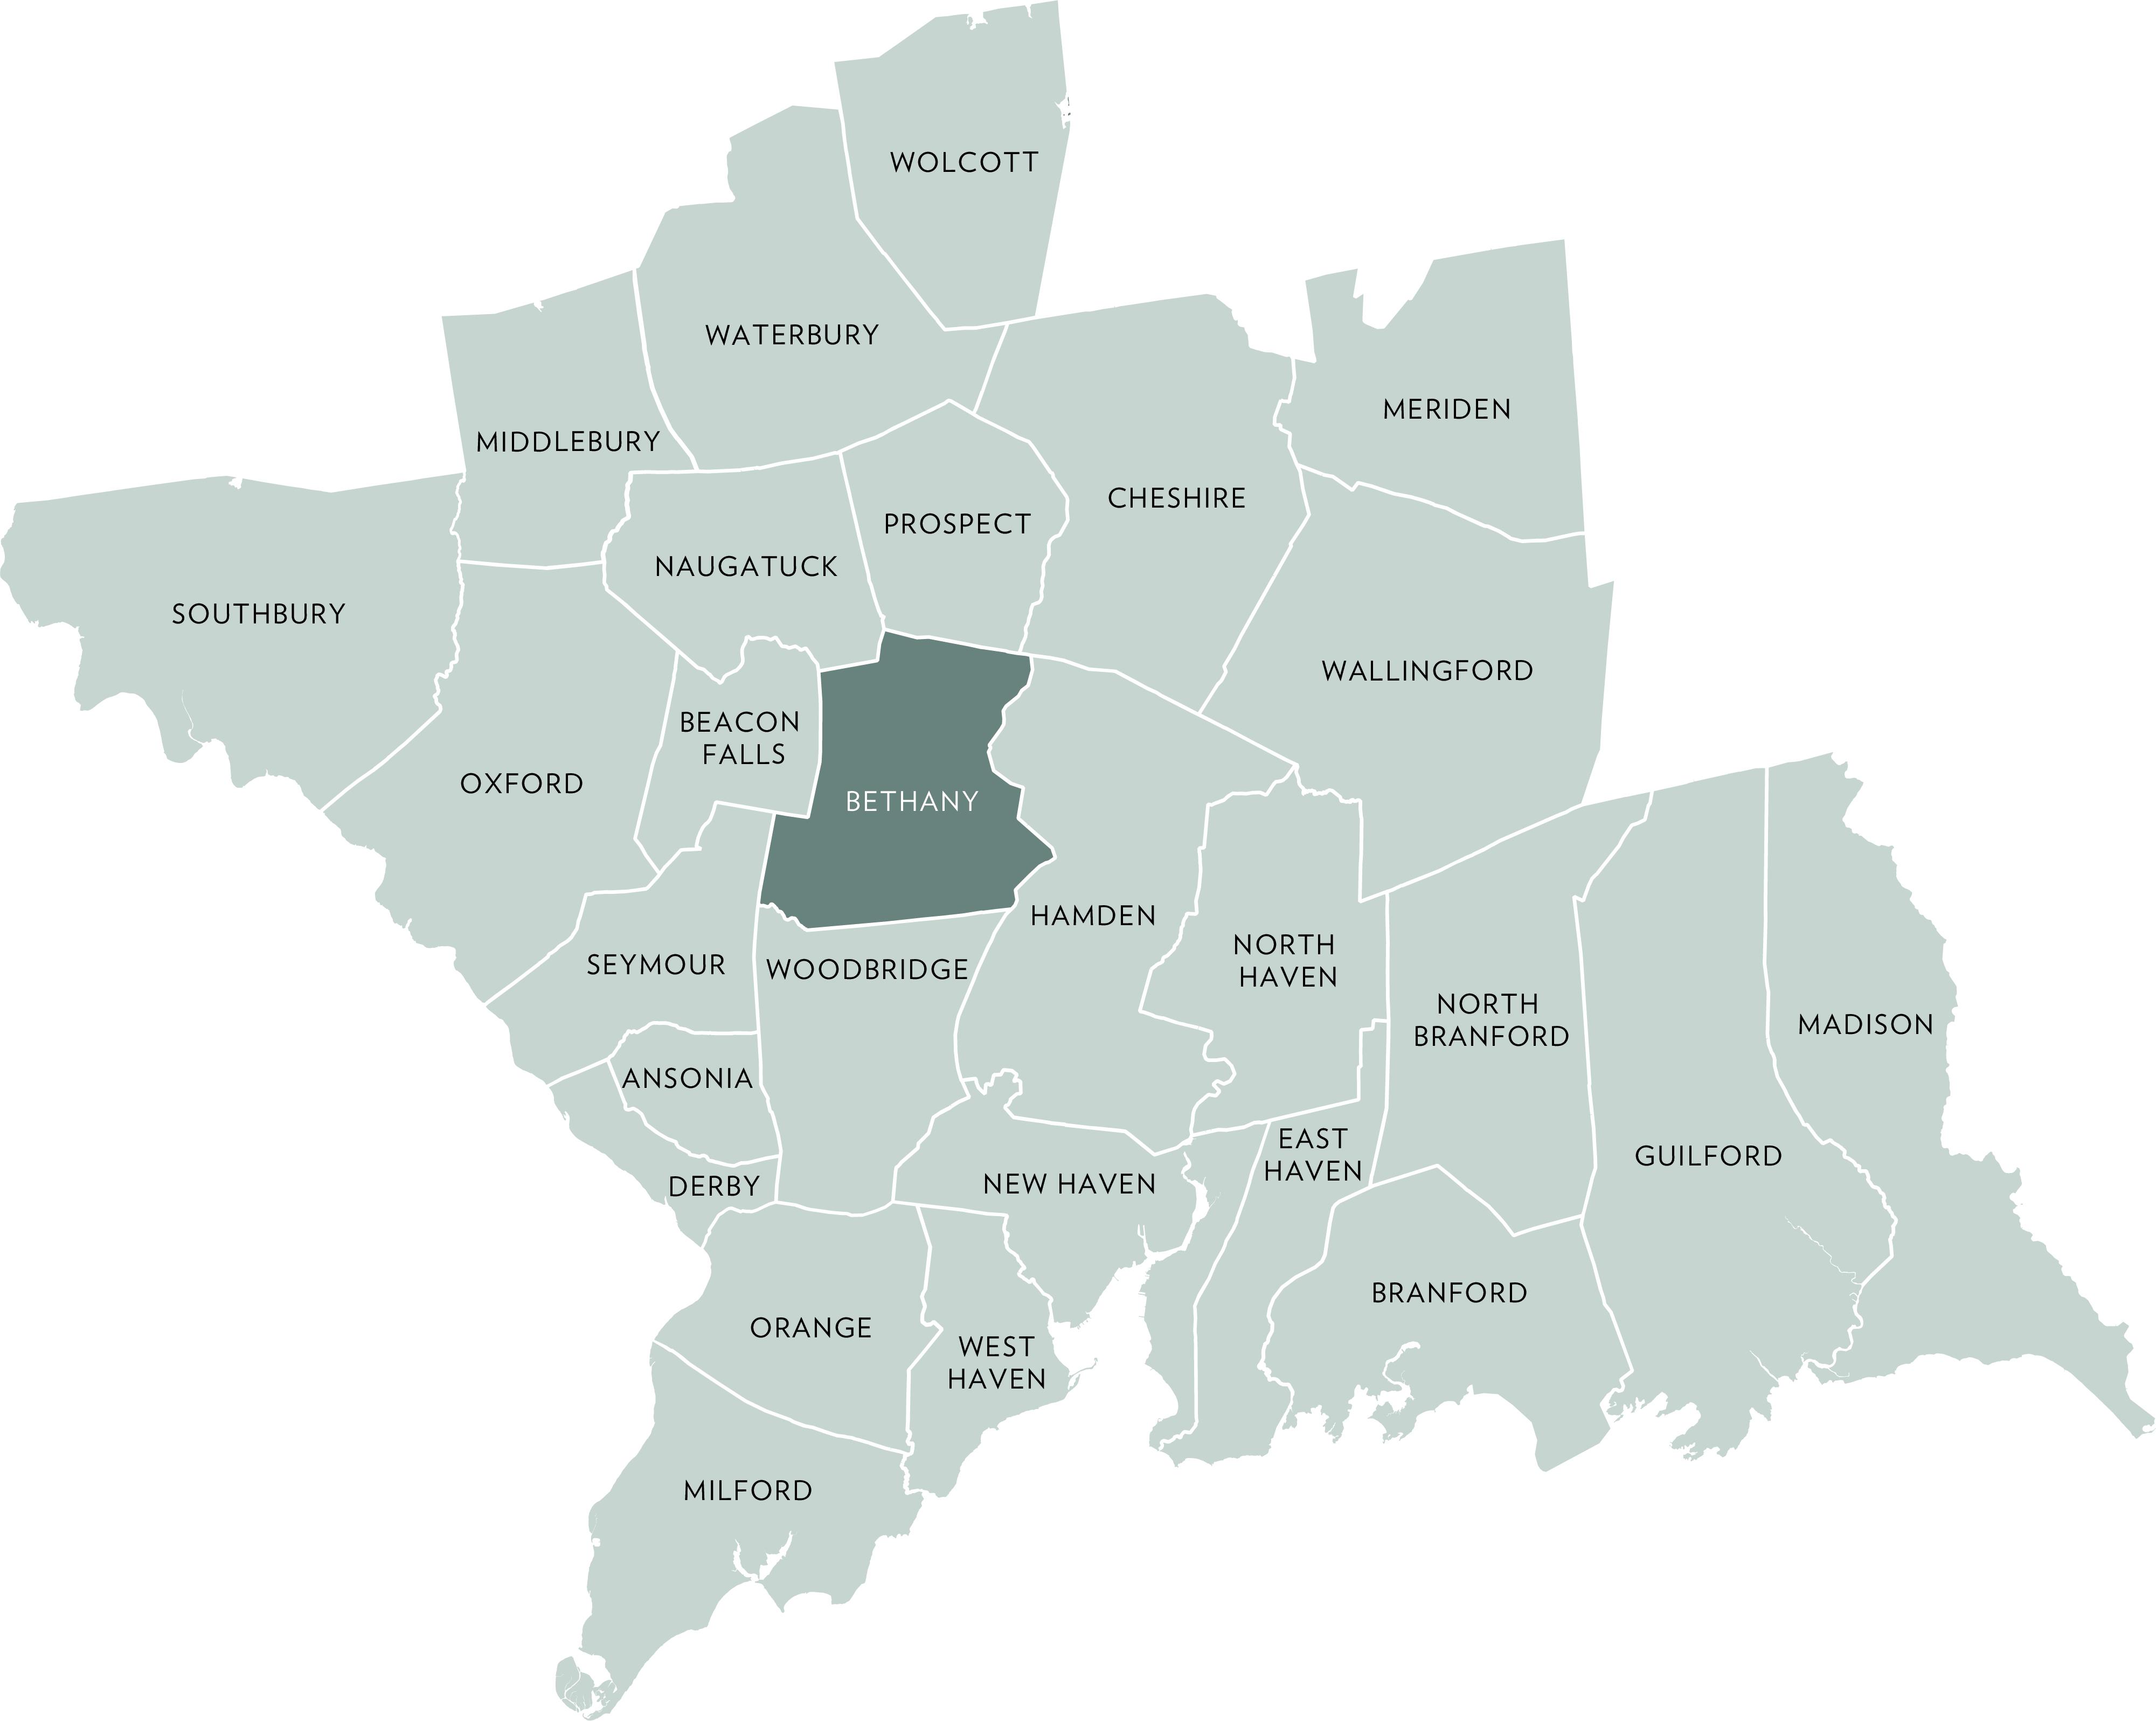
ANSONIA BEACON FALLS BETHANY BRANFORD
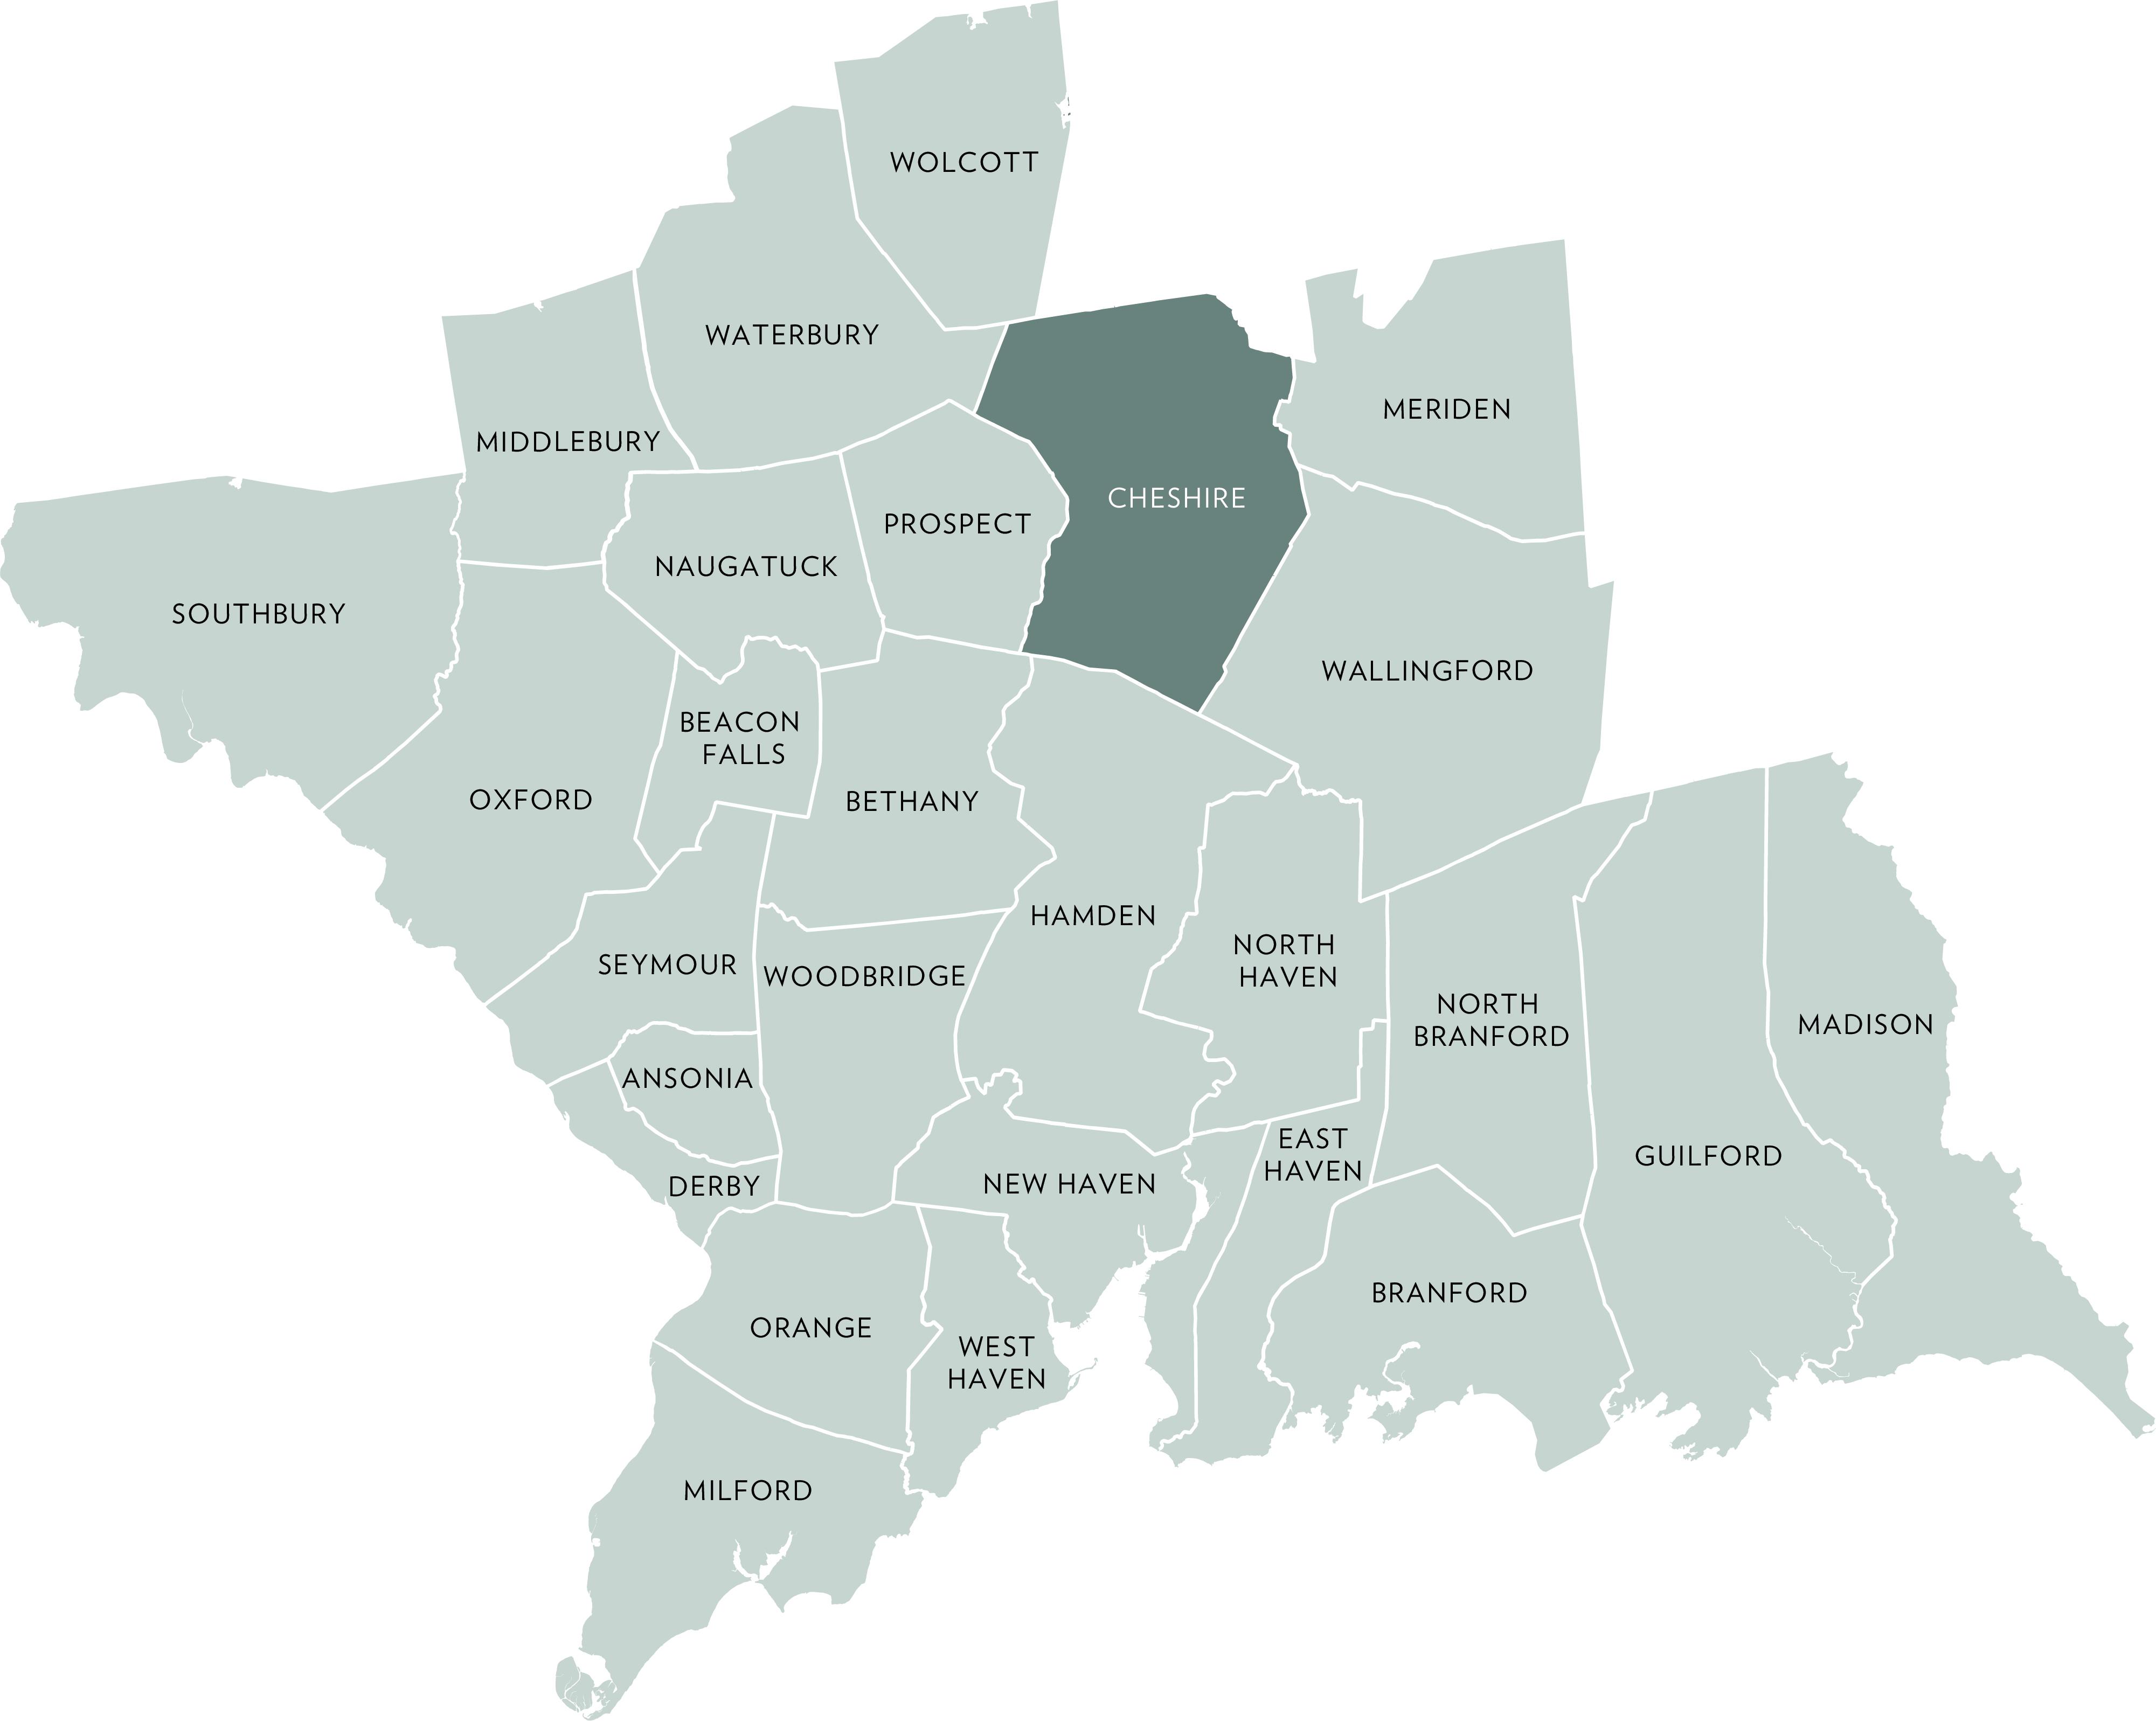
CHESHIRE DERBY EAST HAVEN GUILFORD
HAMDEN MADISON MERIDEN MIDDLEBURY MILFORD NAUGATUCK NEW HAVEN NORTH BRANFORD
FIRST QUARTER 2026
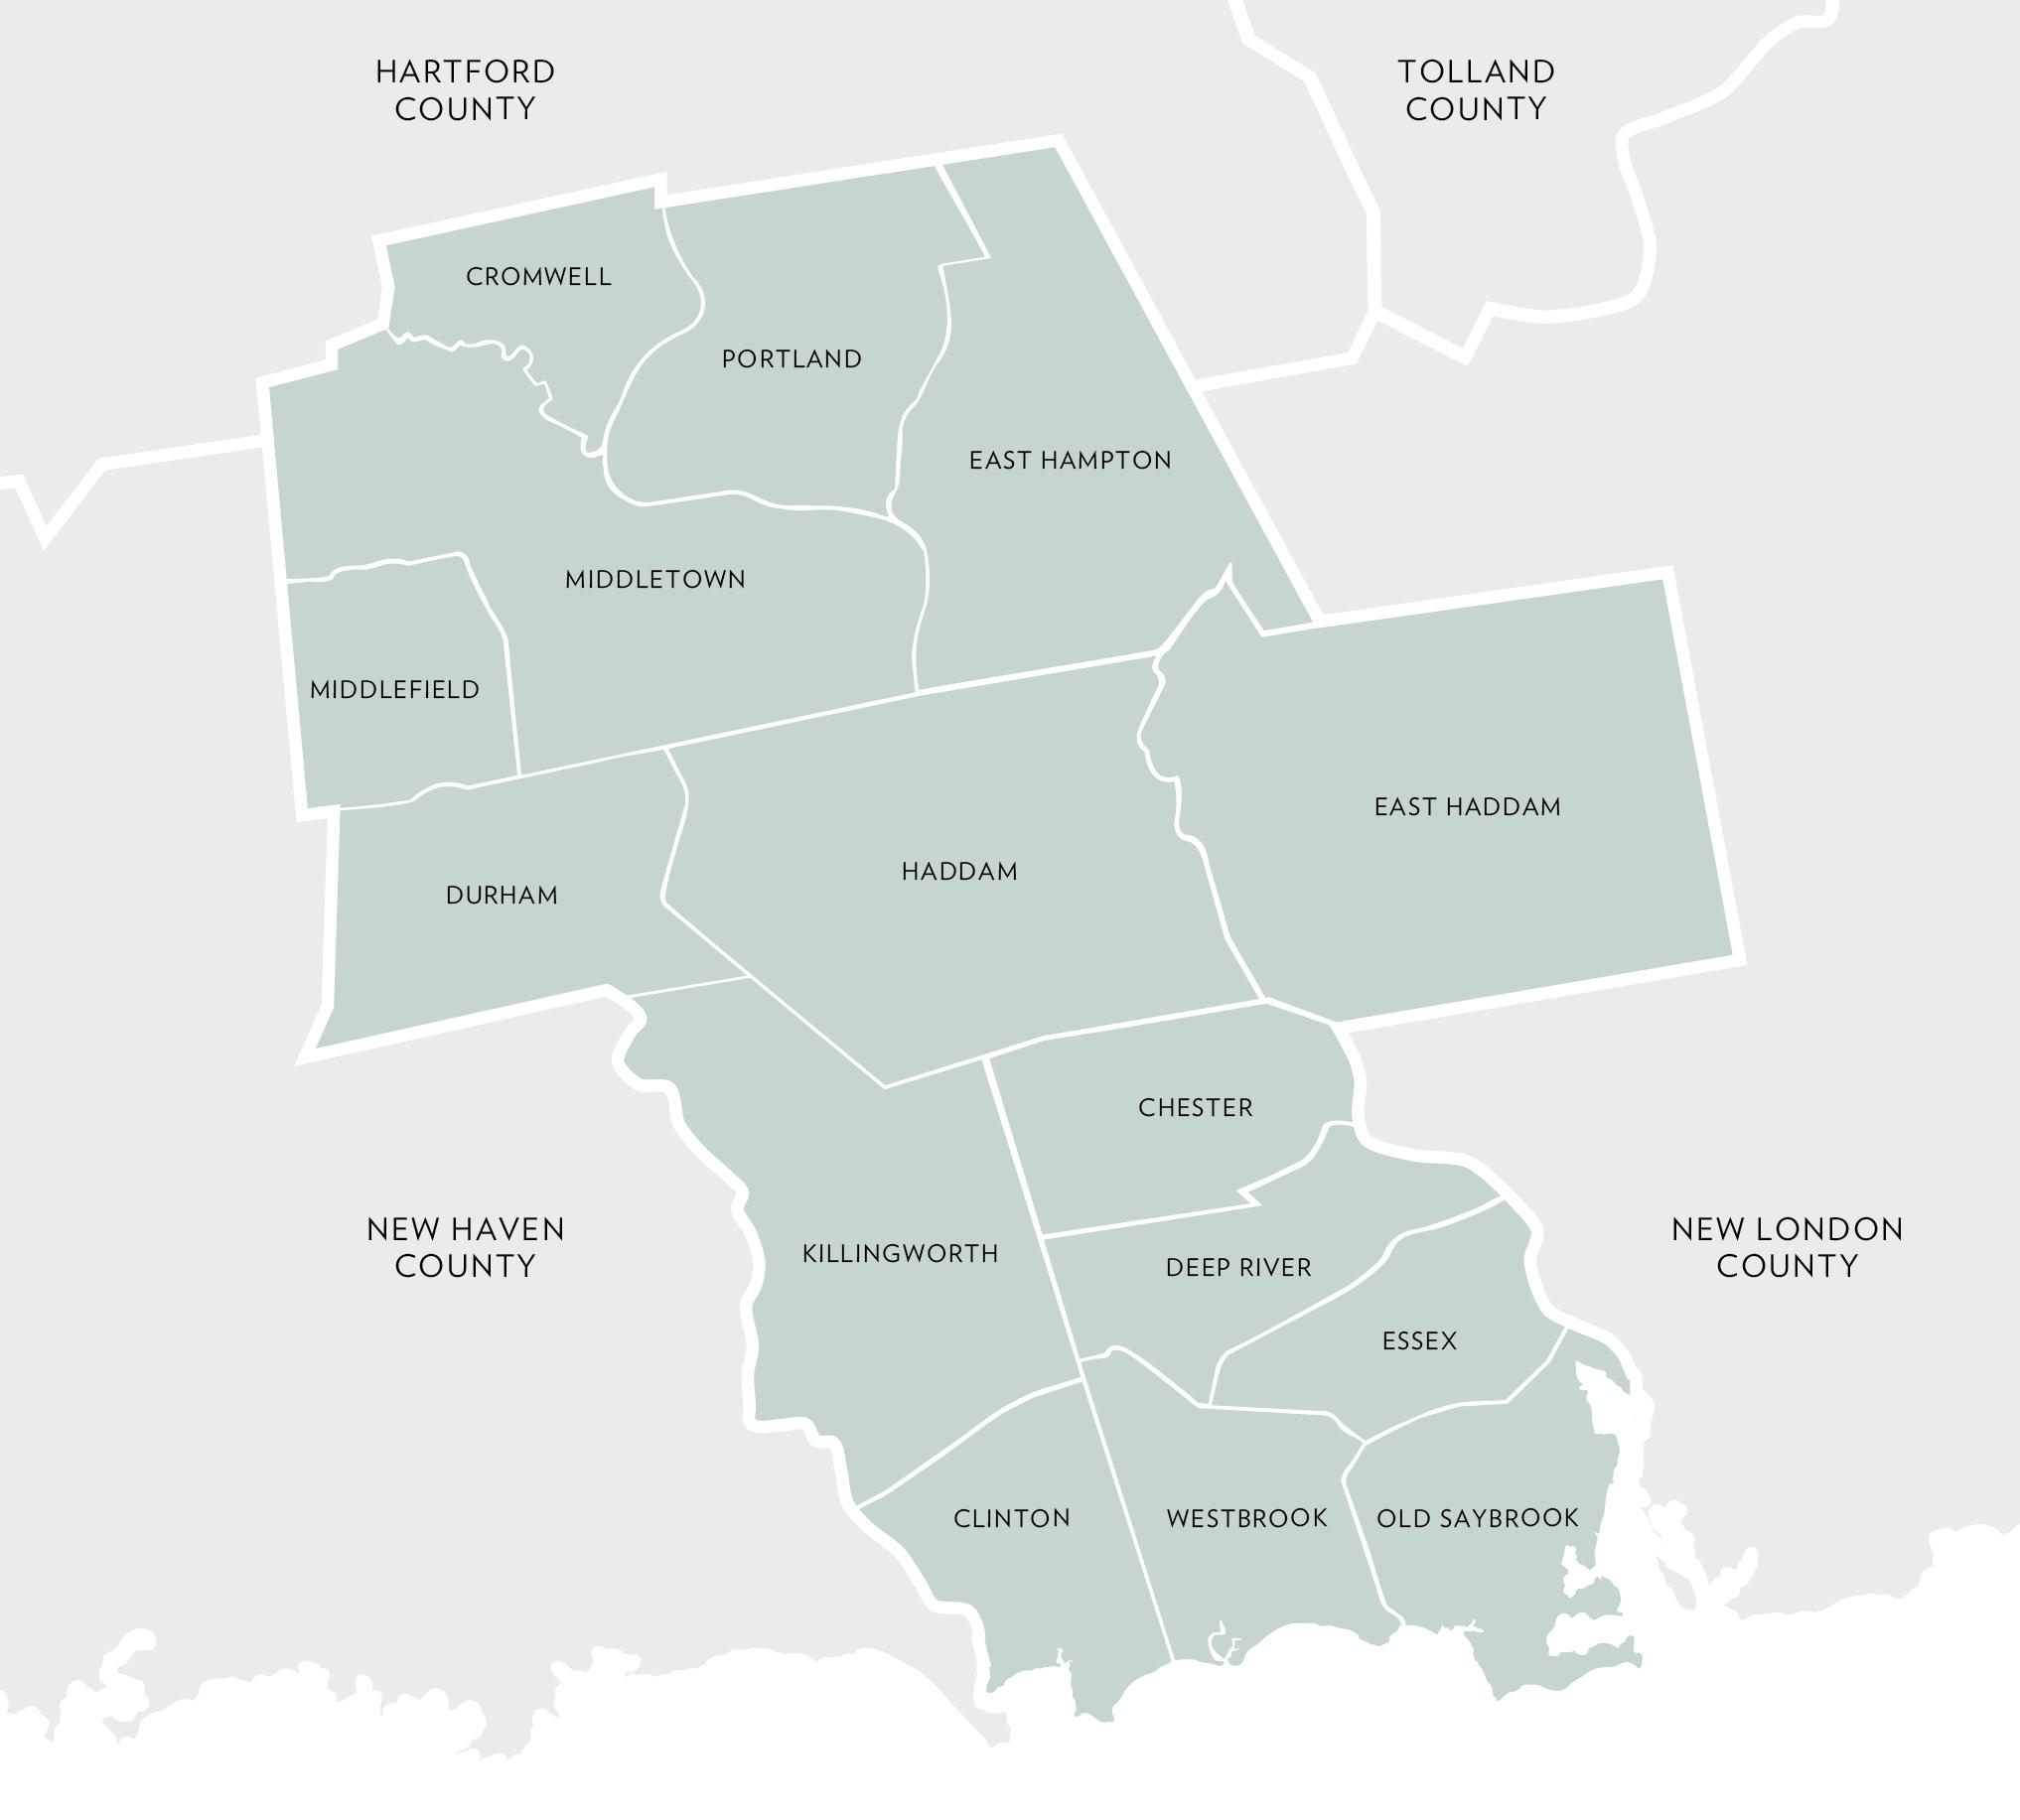
DEEP RIVER DURHAM EAST HADDAM
EAST HAMPTON ESSEX HADDAM
KILLINGWORTH MIDDLEFIELD MIDDLETOWN
OLD SAYBROOK PORTLAND WESTBROOK
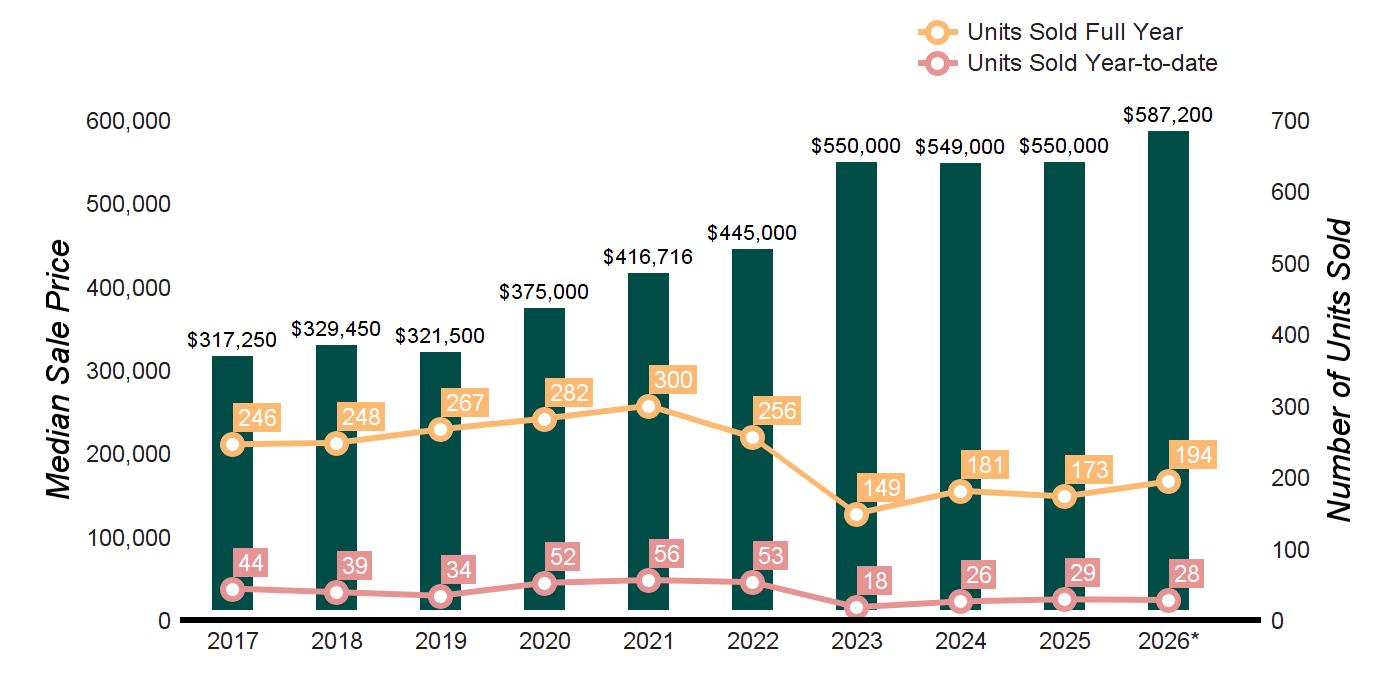

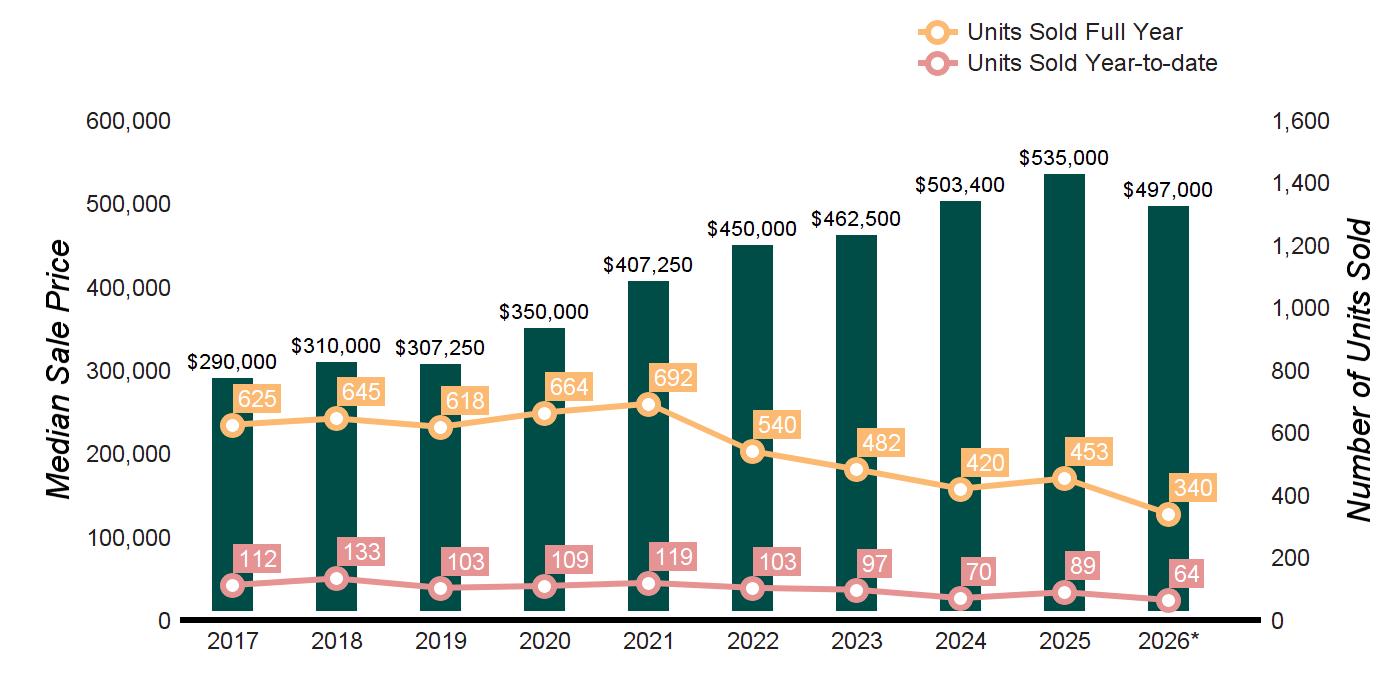
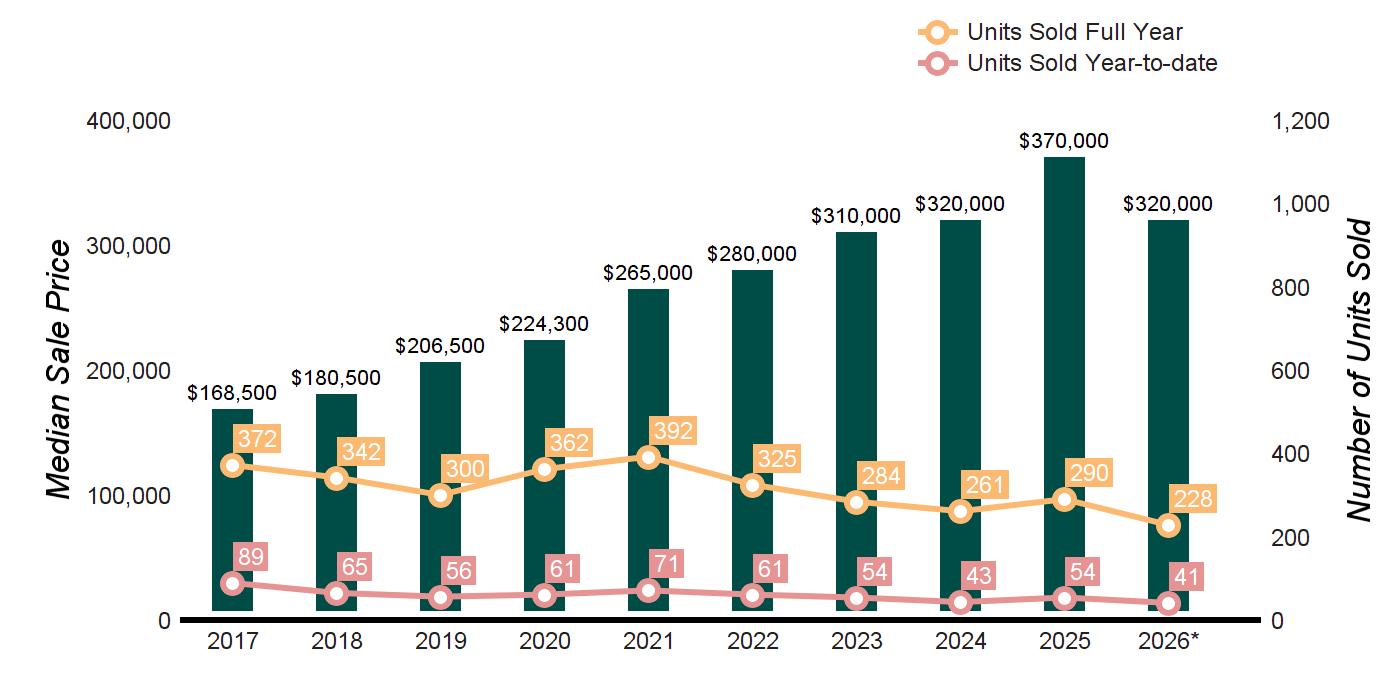
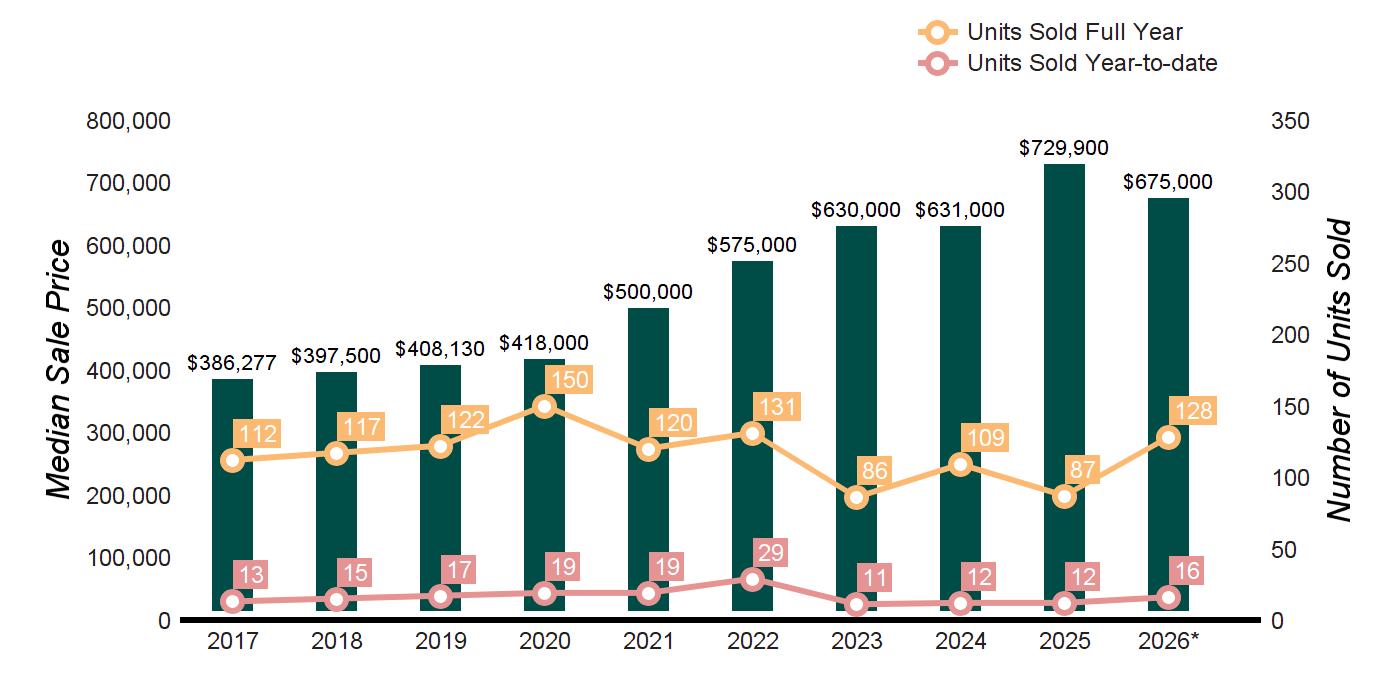
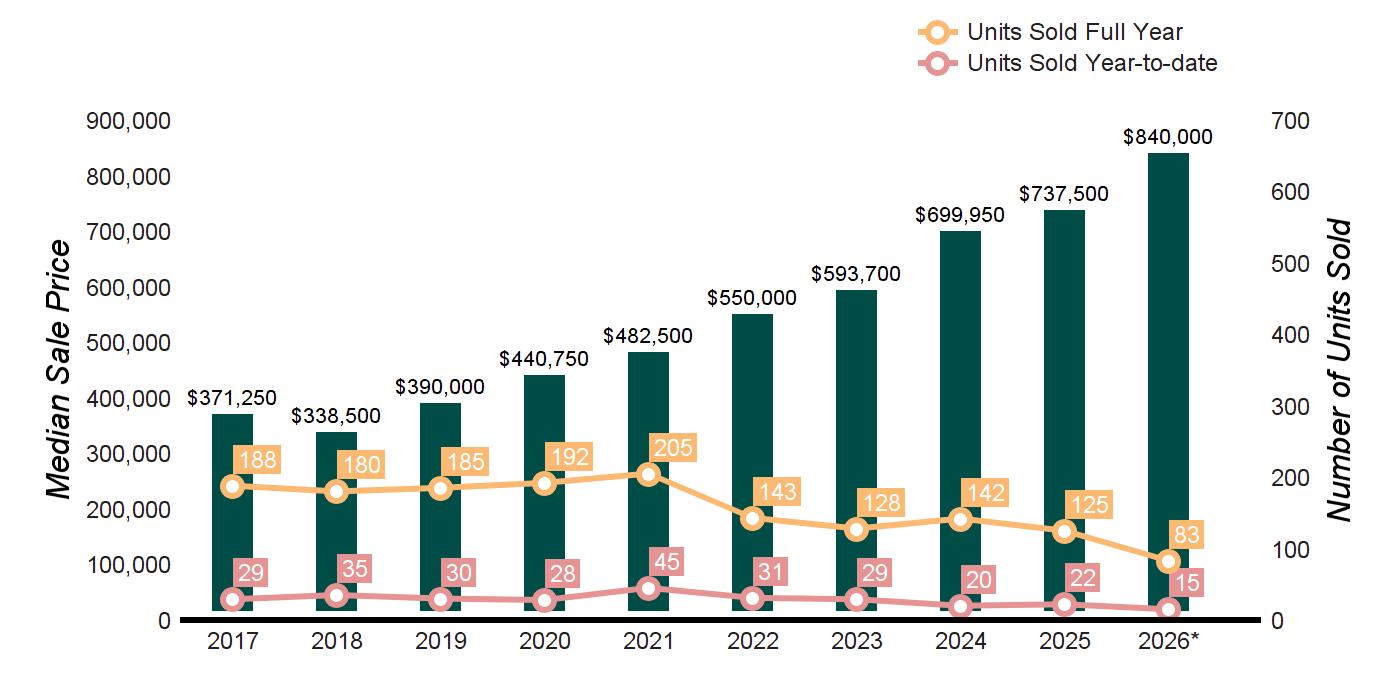
TEN-YEAR MARKET HISTORY

ACTIVE LISTINGS
Q1- 2026 vs Q1- 2025 -55.6%
PENDING LISTINGS
Q1- 2026 vs Q1- 2025 100.0%
Q1- 2026 vs Q1- 2025 44.4%
QUARTERLY MARKET
ACTIVE LISTINGS
Q1- 2026 vs Q1- 2025 -11.4%
PENDING LISTINGS
Q1- 2026 vs Q1- 2025 -25.9%
Q1- 2026 vs Q1- 2025 -9.1%
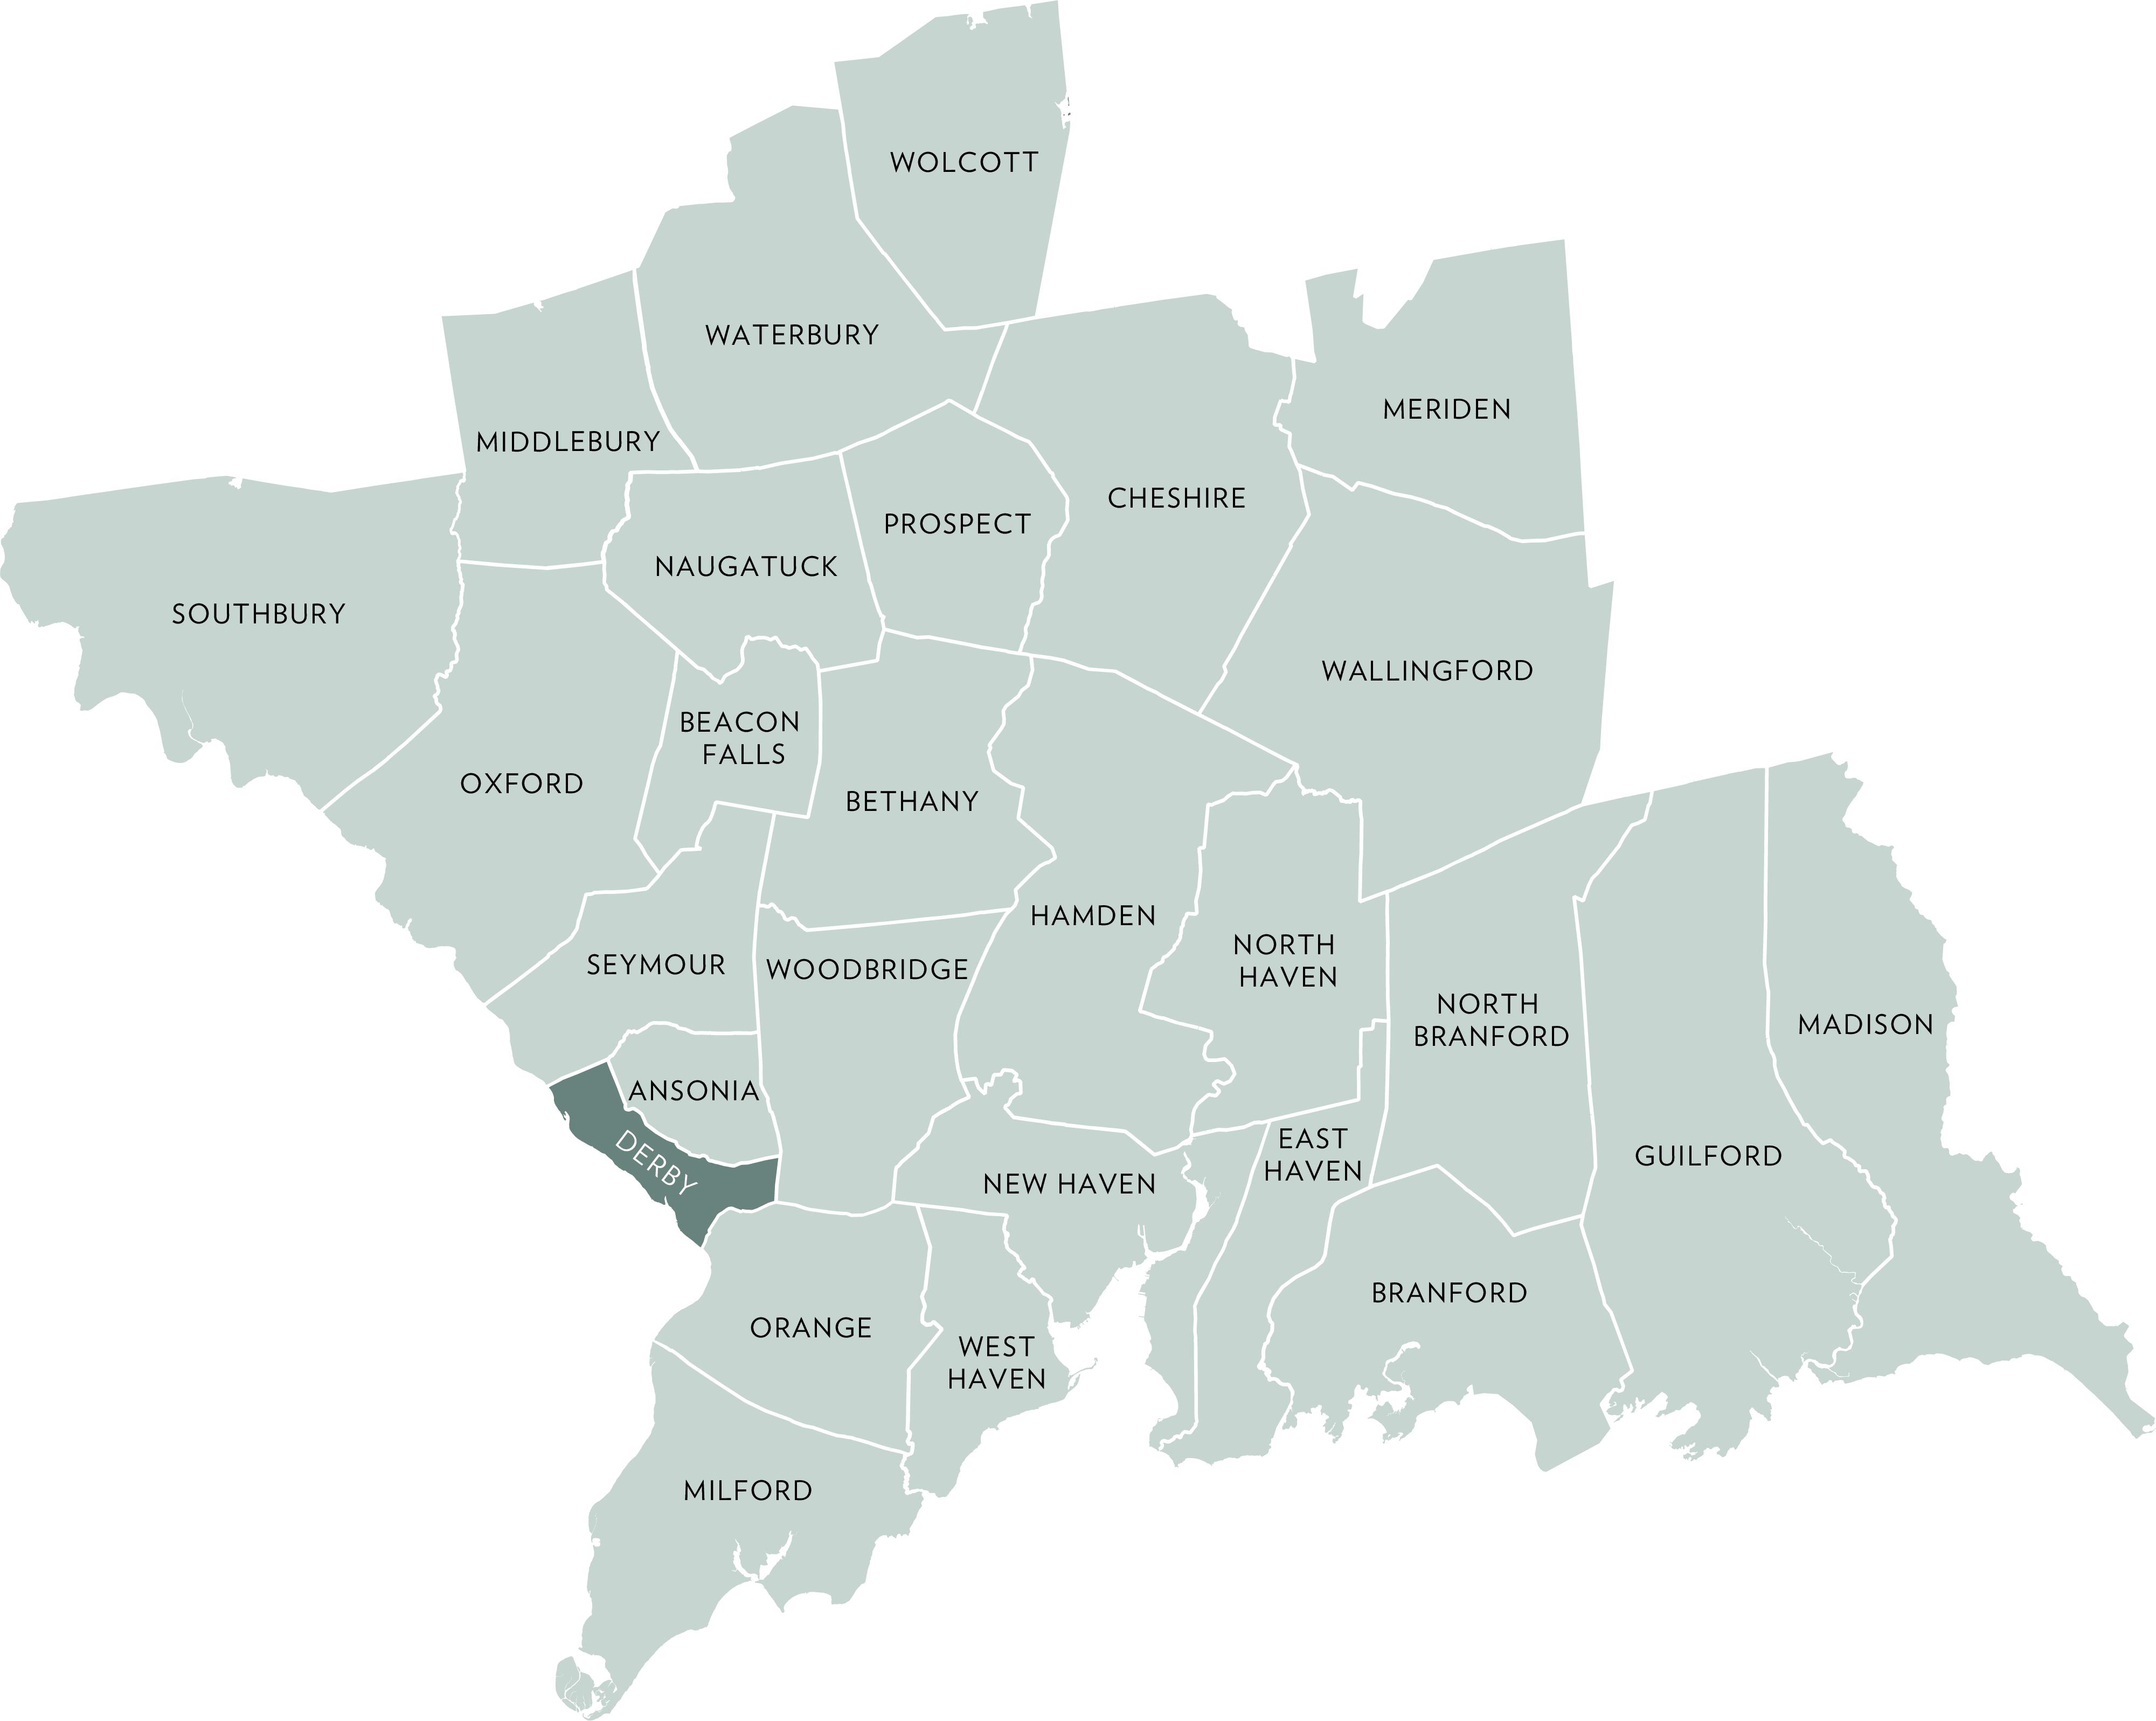
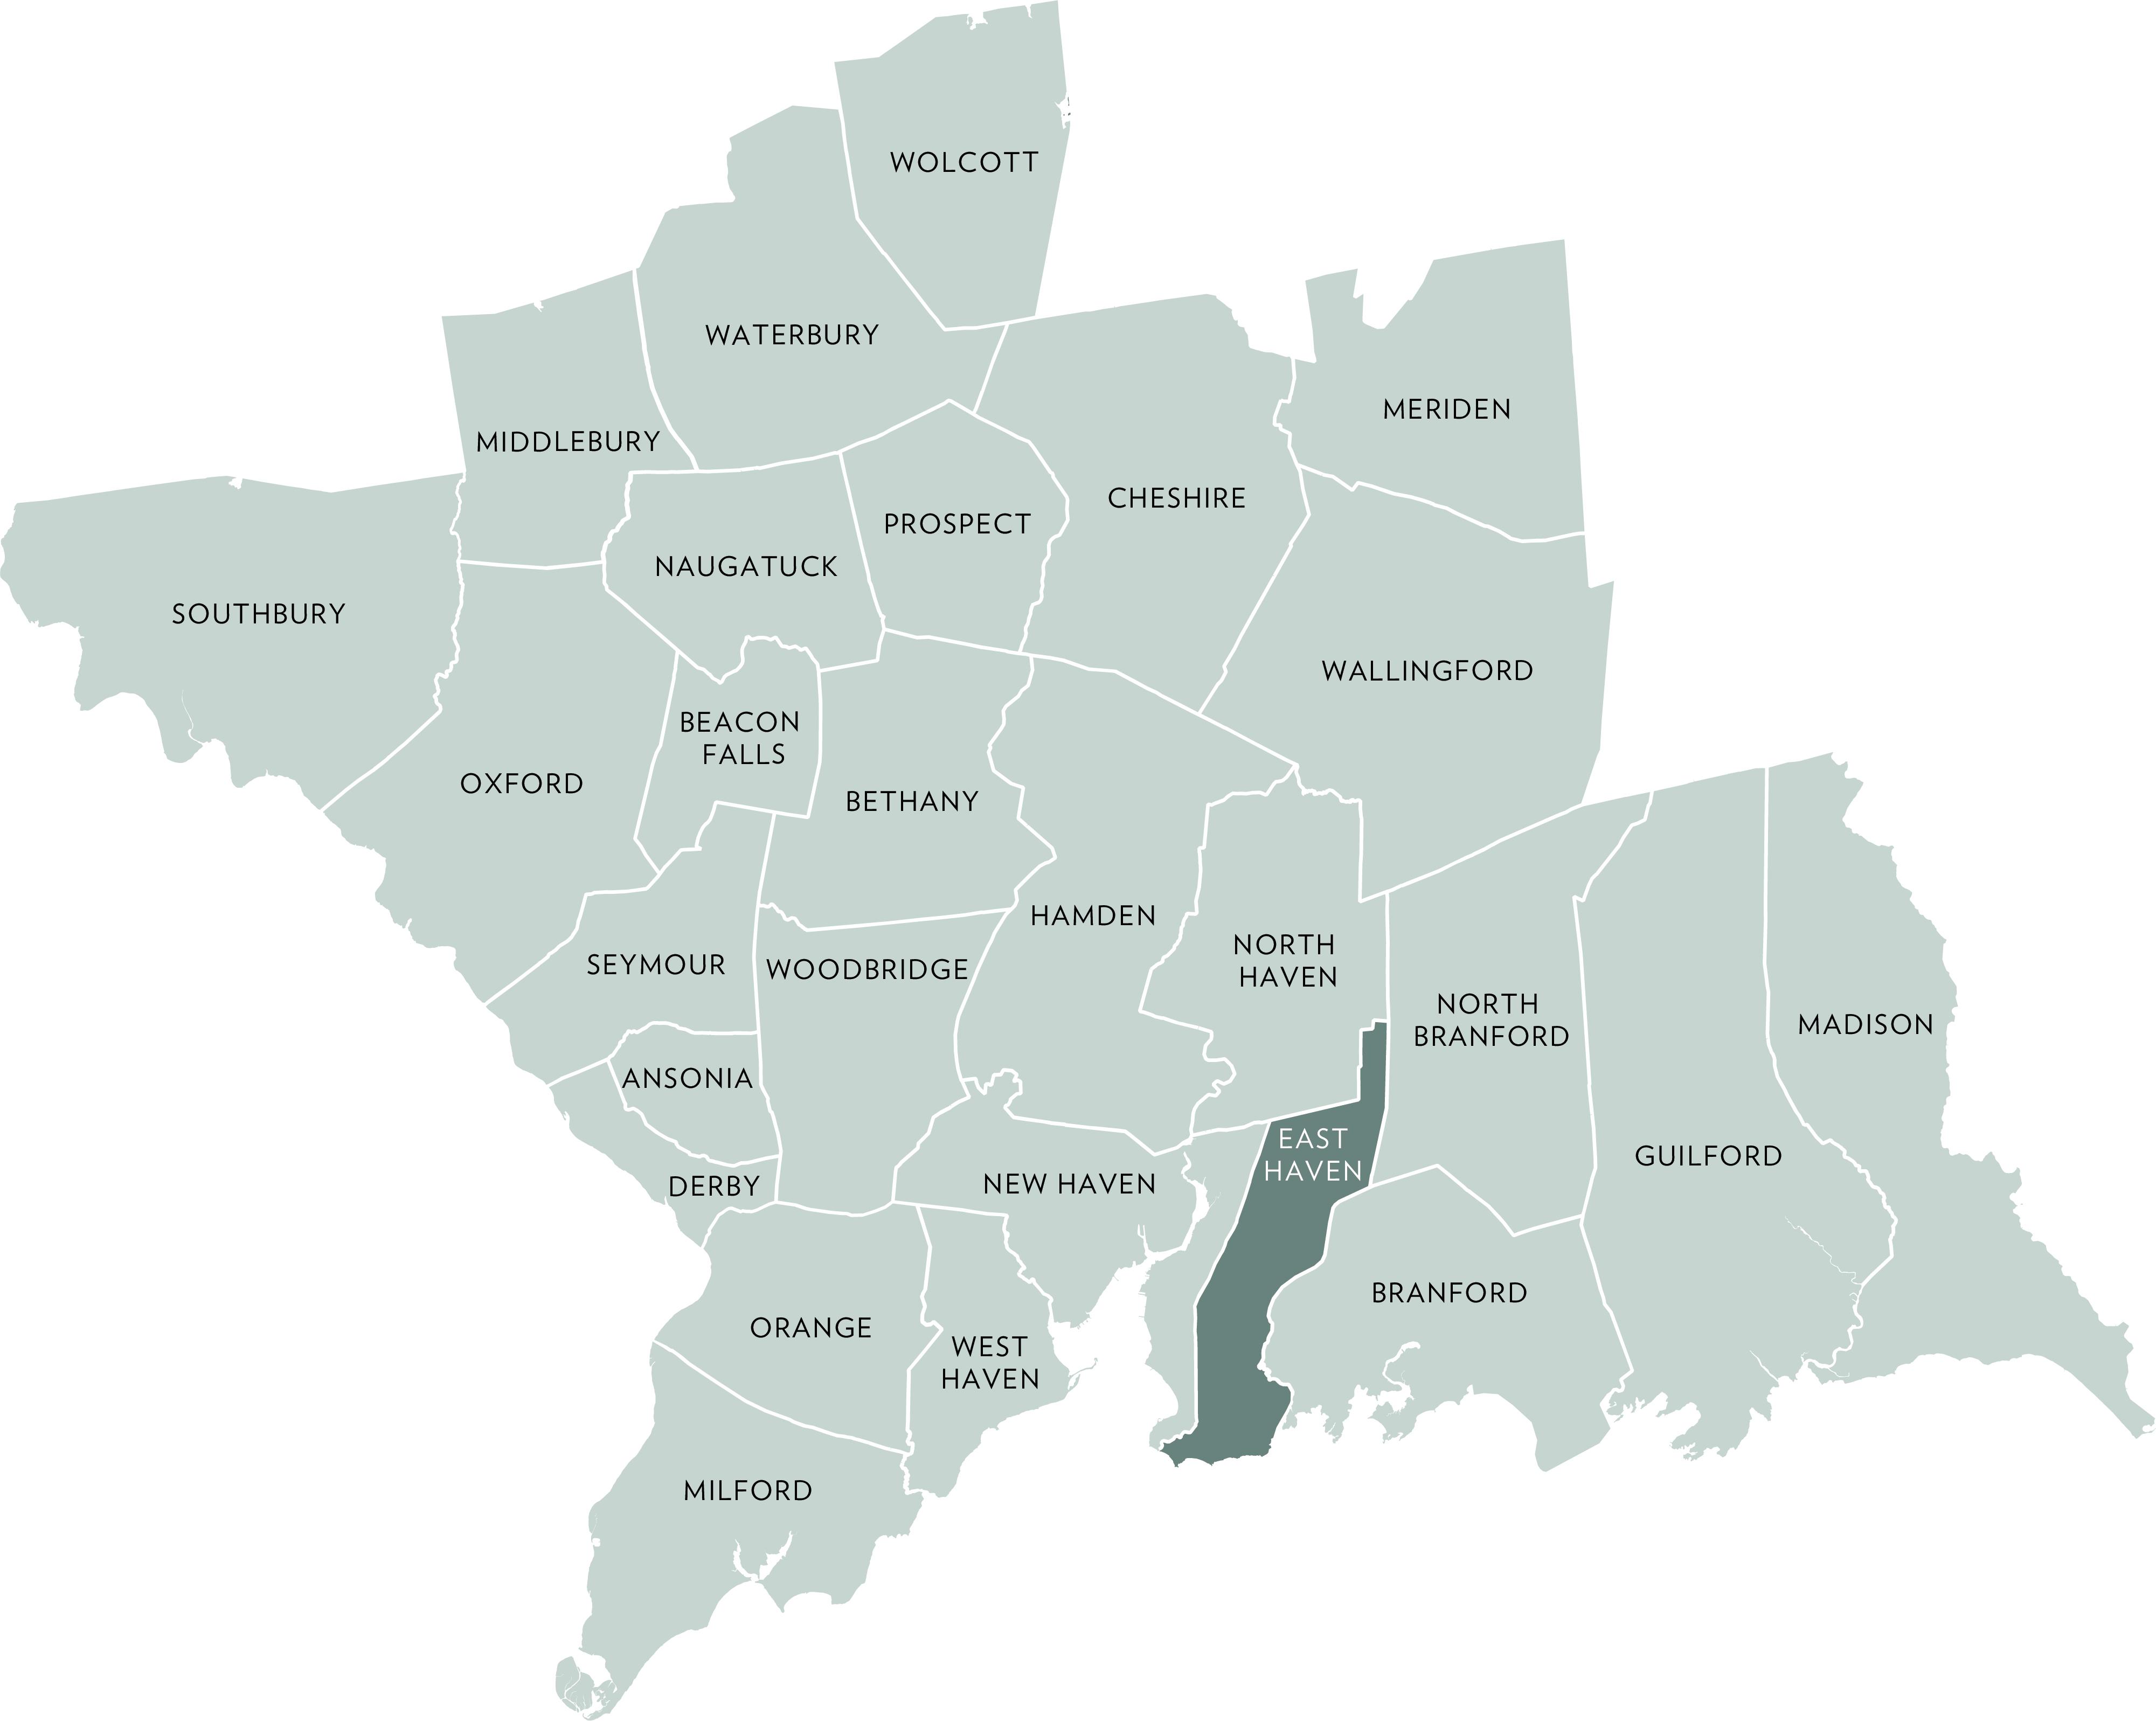
Q1- 2026 vs Q1- 2025 -20.6%
PENDING LISTINGS
Q1- 2026 vs Q1- 2025 -5.9%
Q1- 2026 vs Q1- 2025 -9.6%
QUARTERLY MARKET OVERVIEW
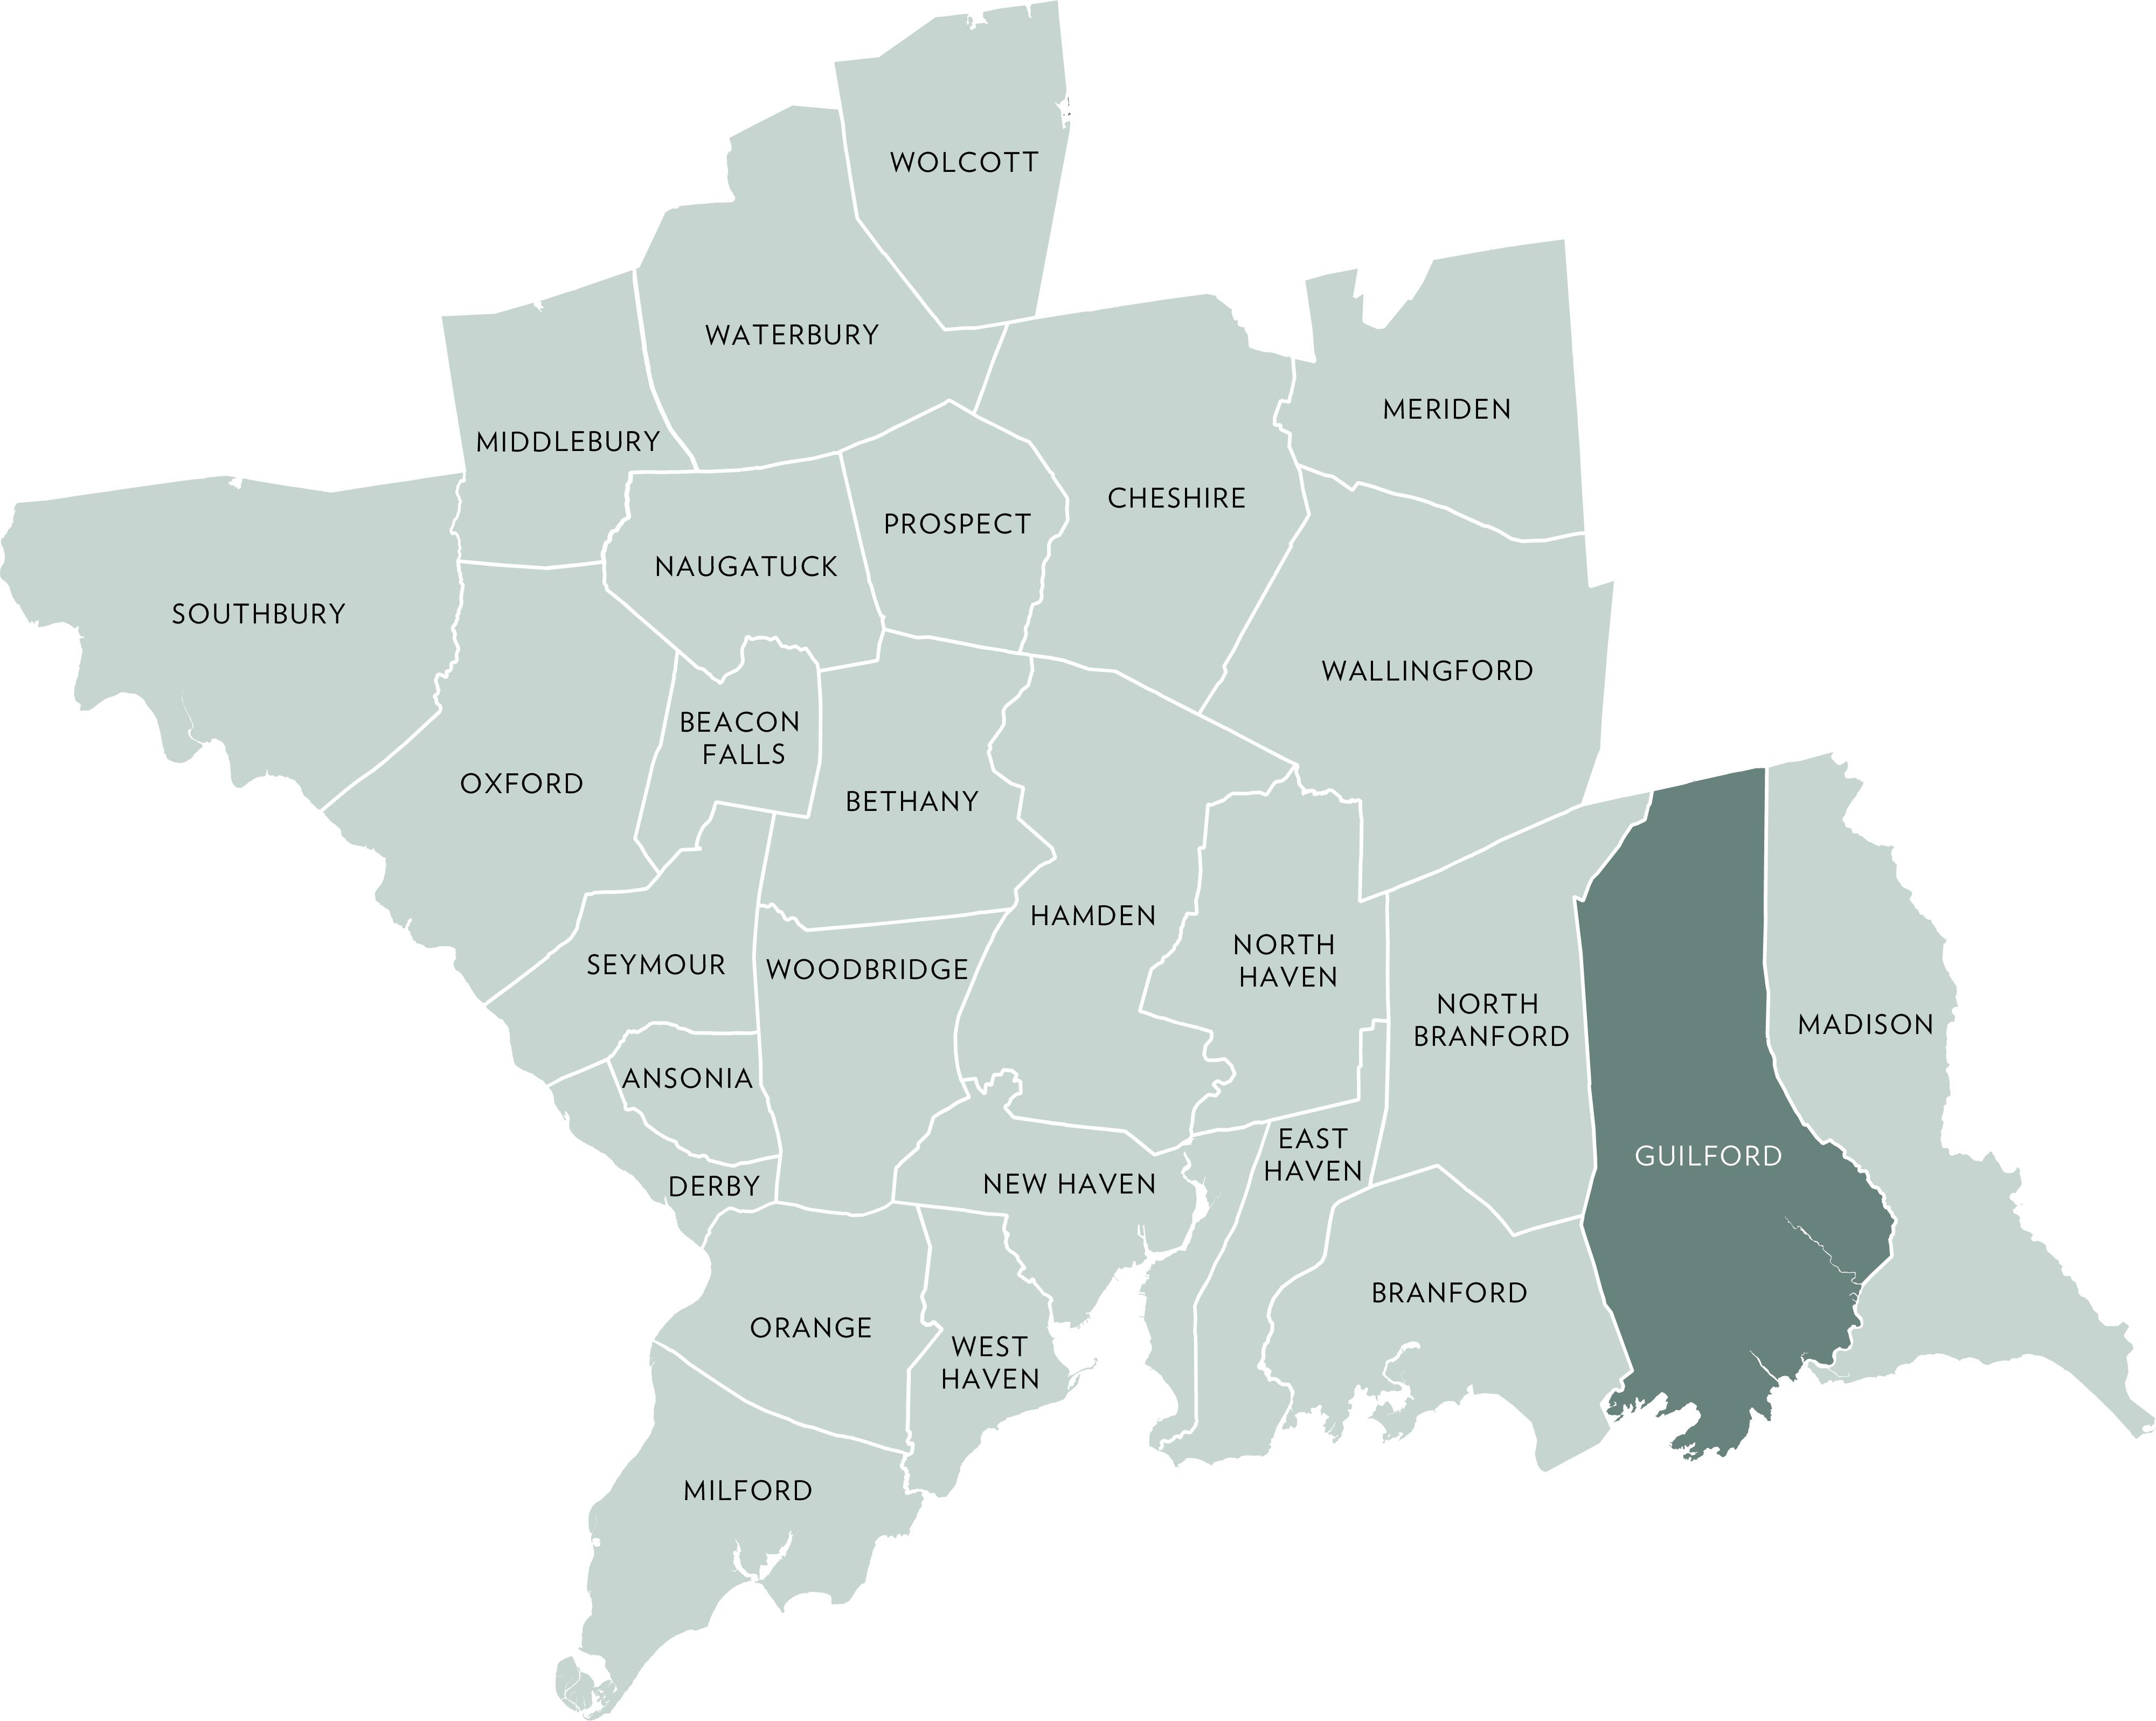
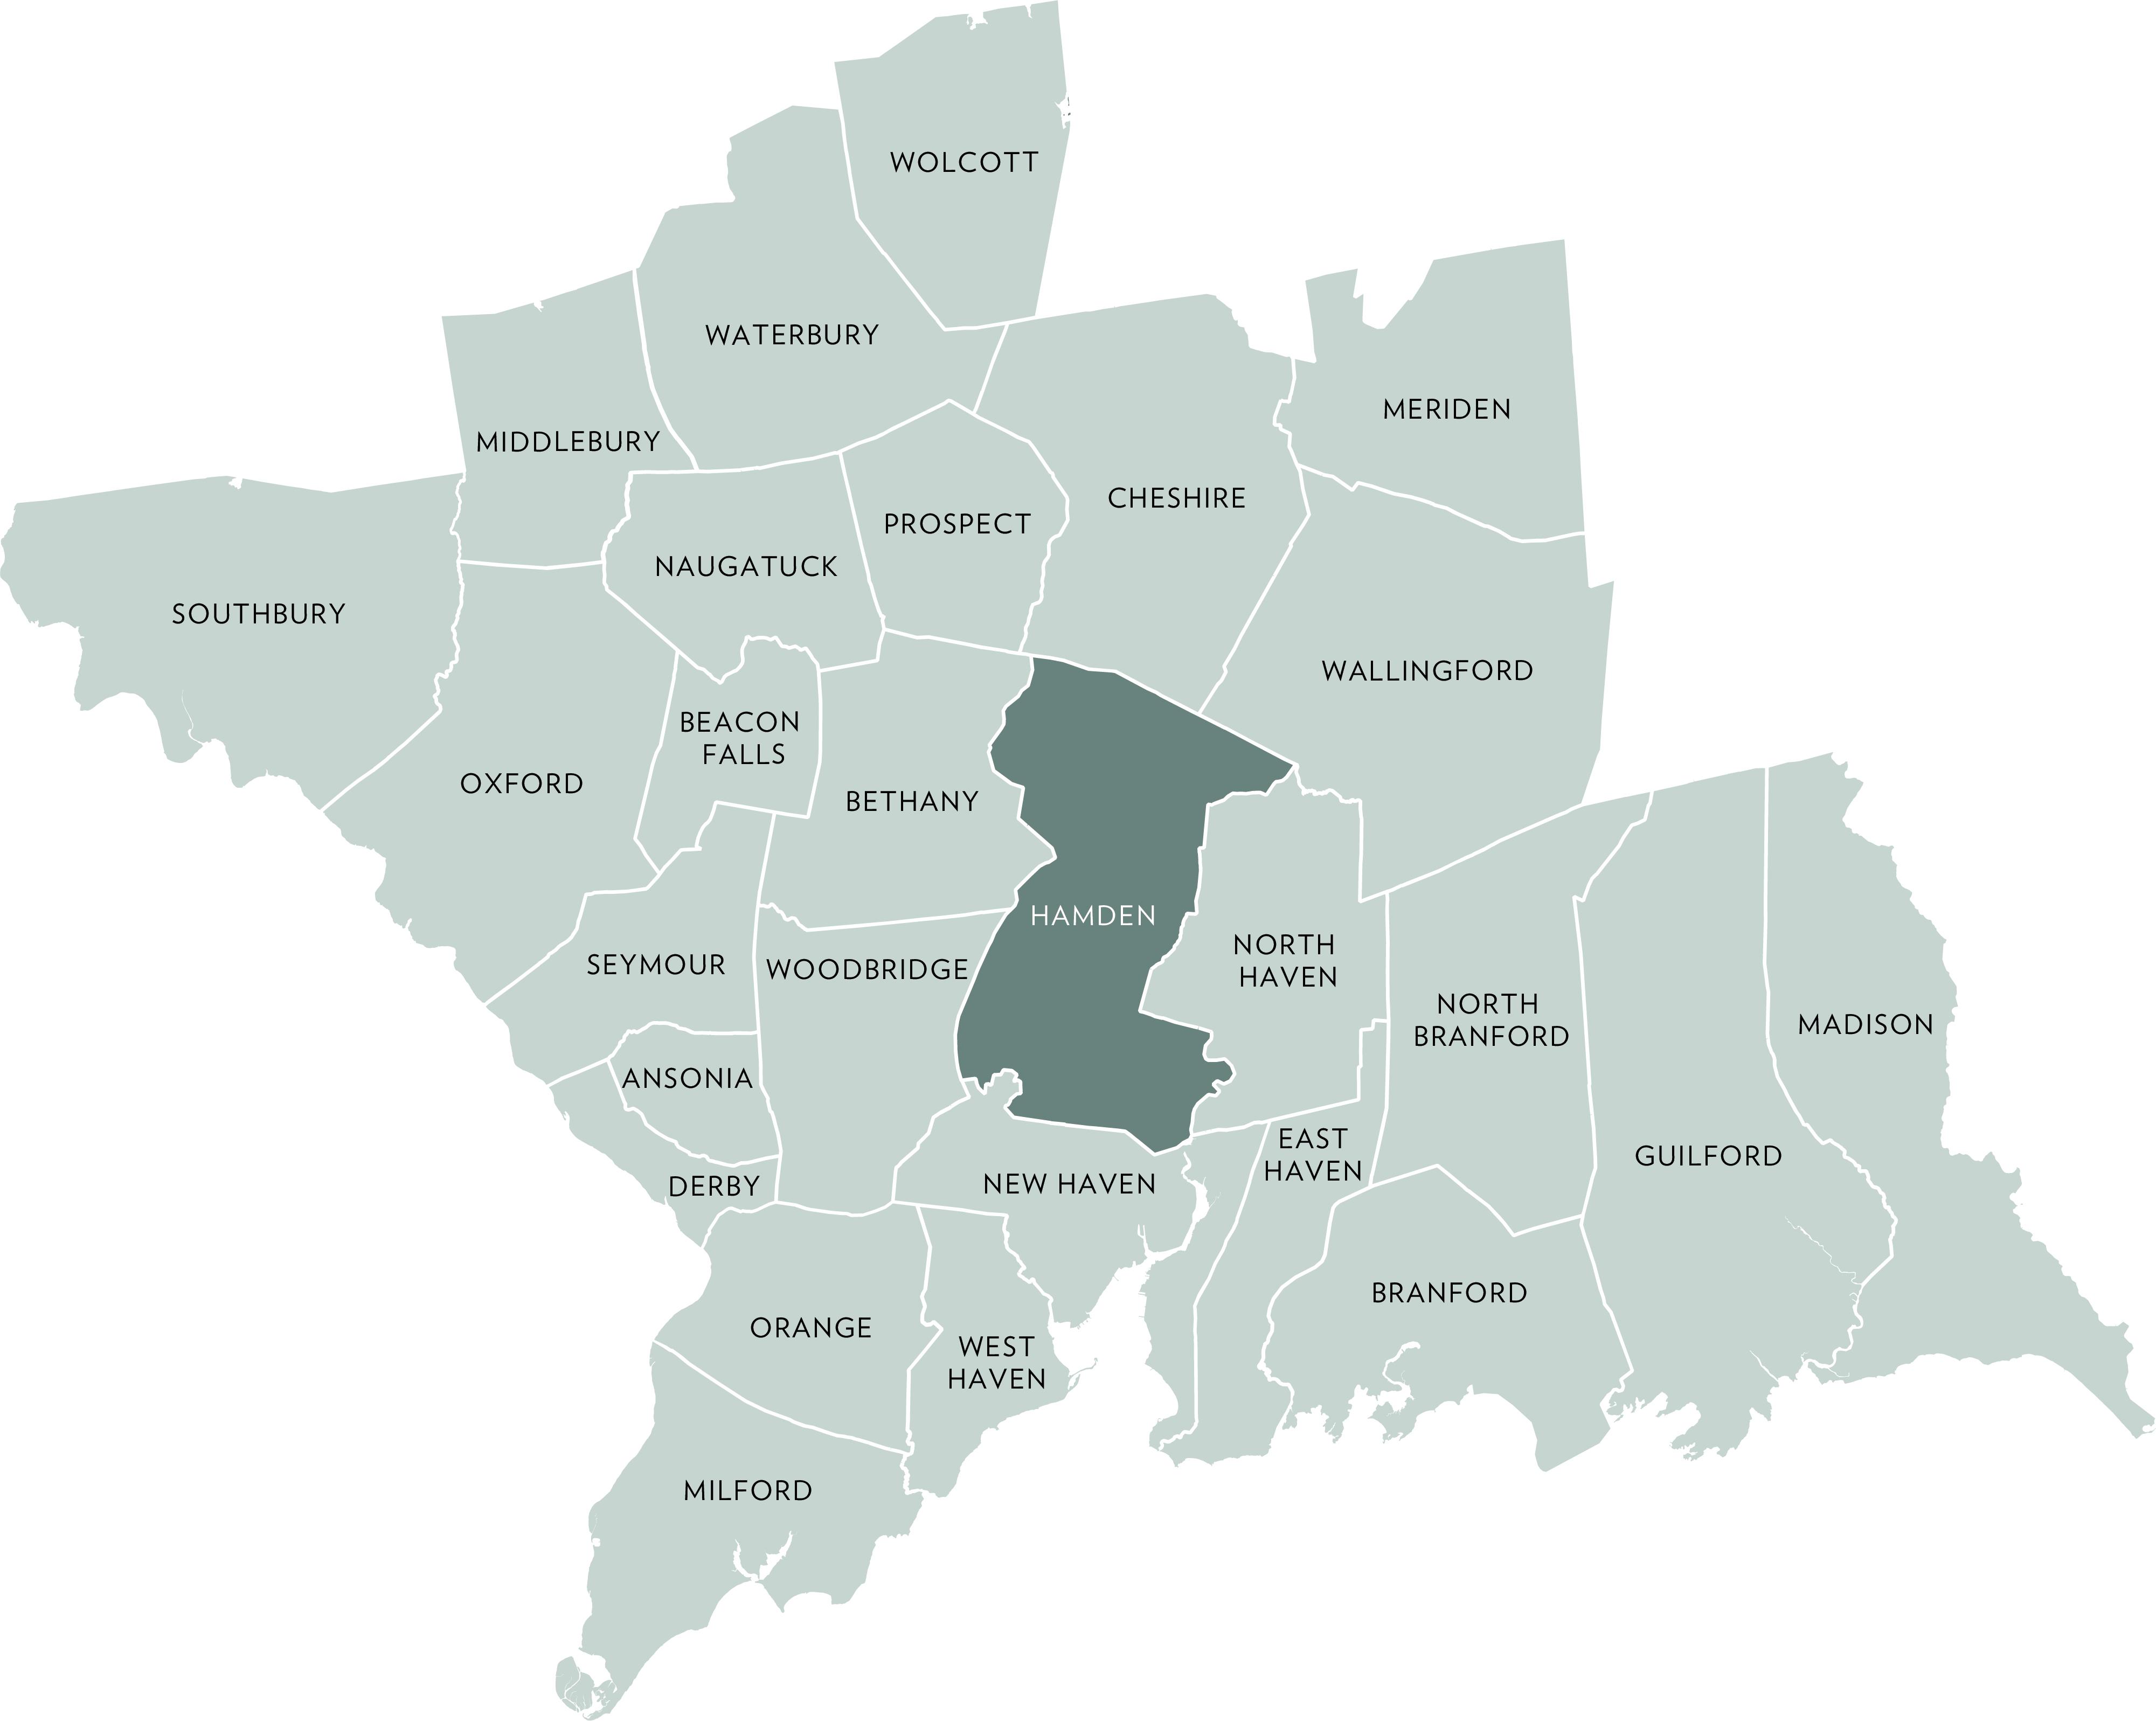
ACTIVE LISTINGS
Q1- 2026 vs Q1- 2025 53.3%
PENDING LISTINGS
Q1- 2026 vs Q1- 2025 8.3%
Q1- 2026 vs Q1- 2025 -14.6%
QUARTERLY MARKET OVERVIEW
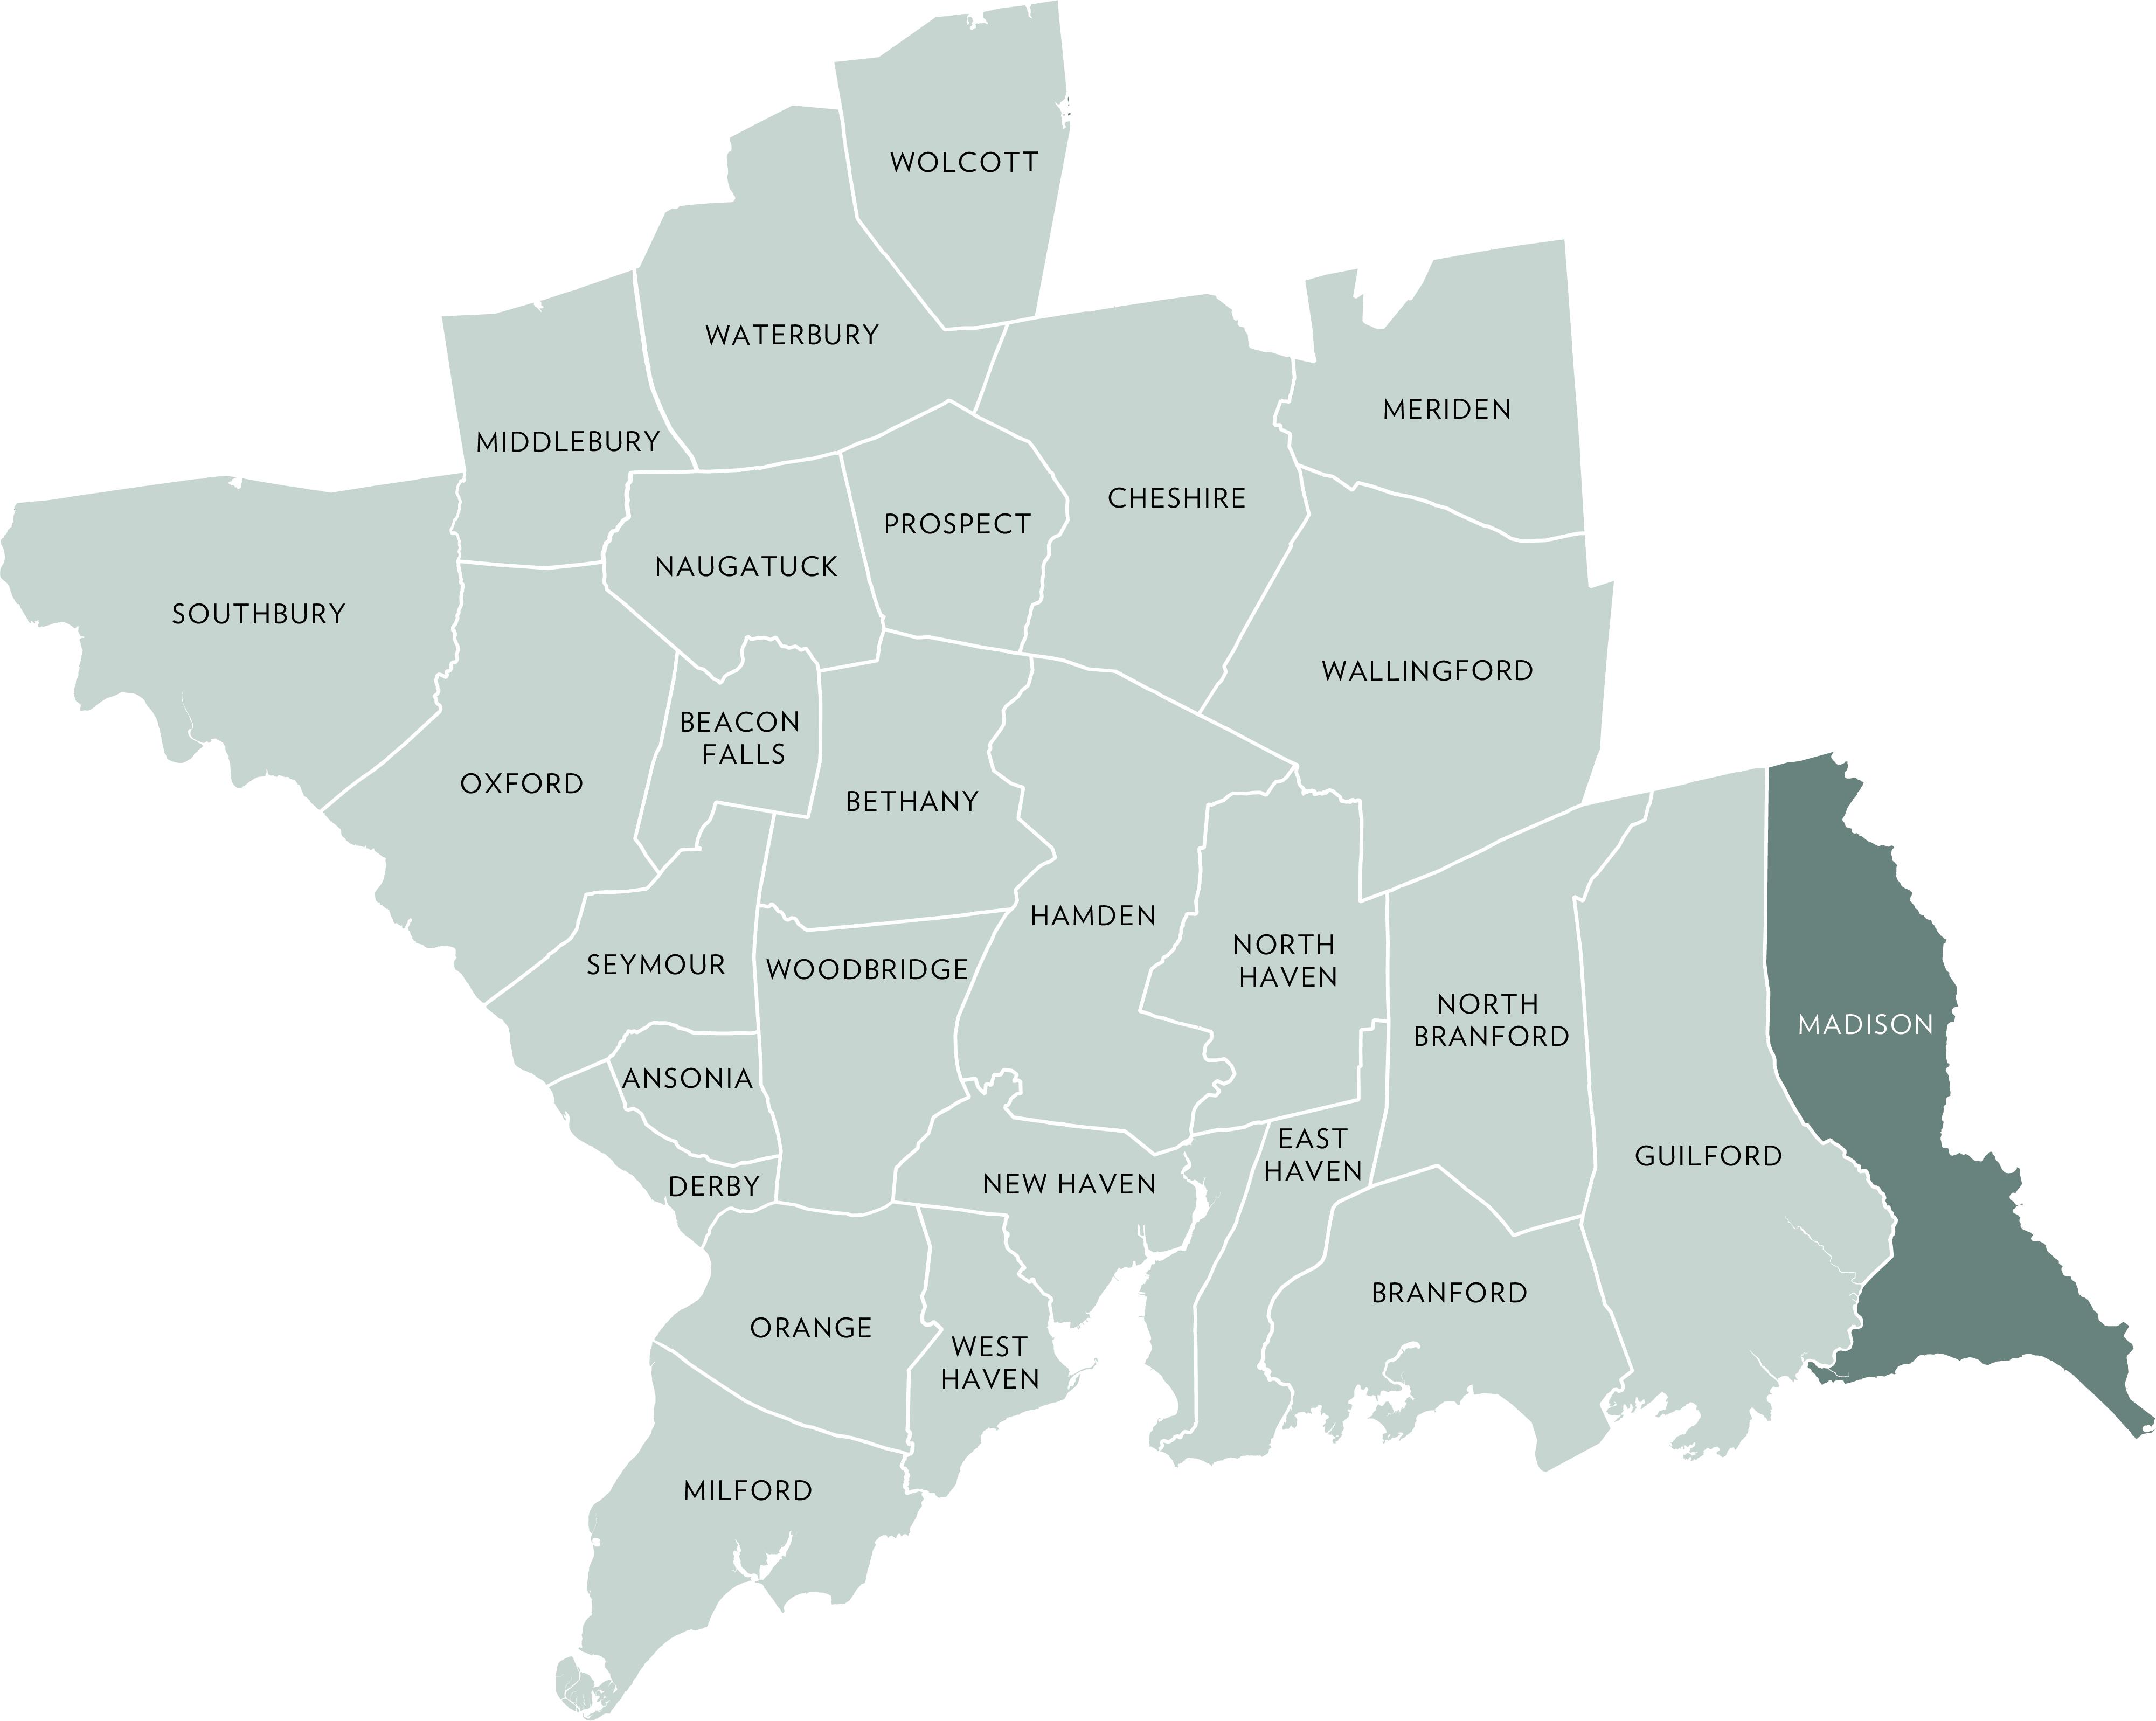
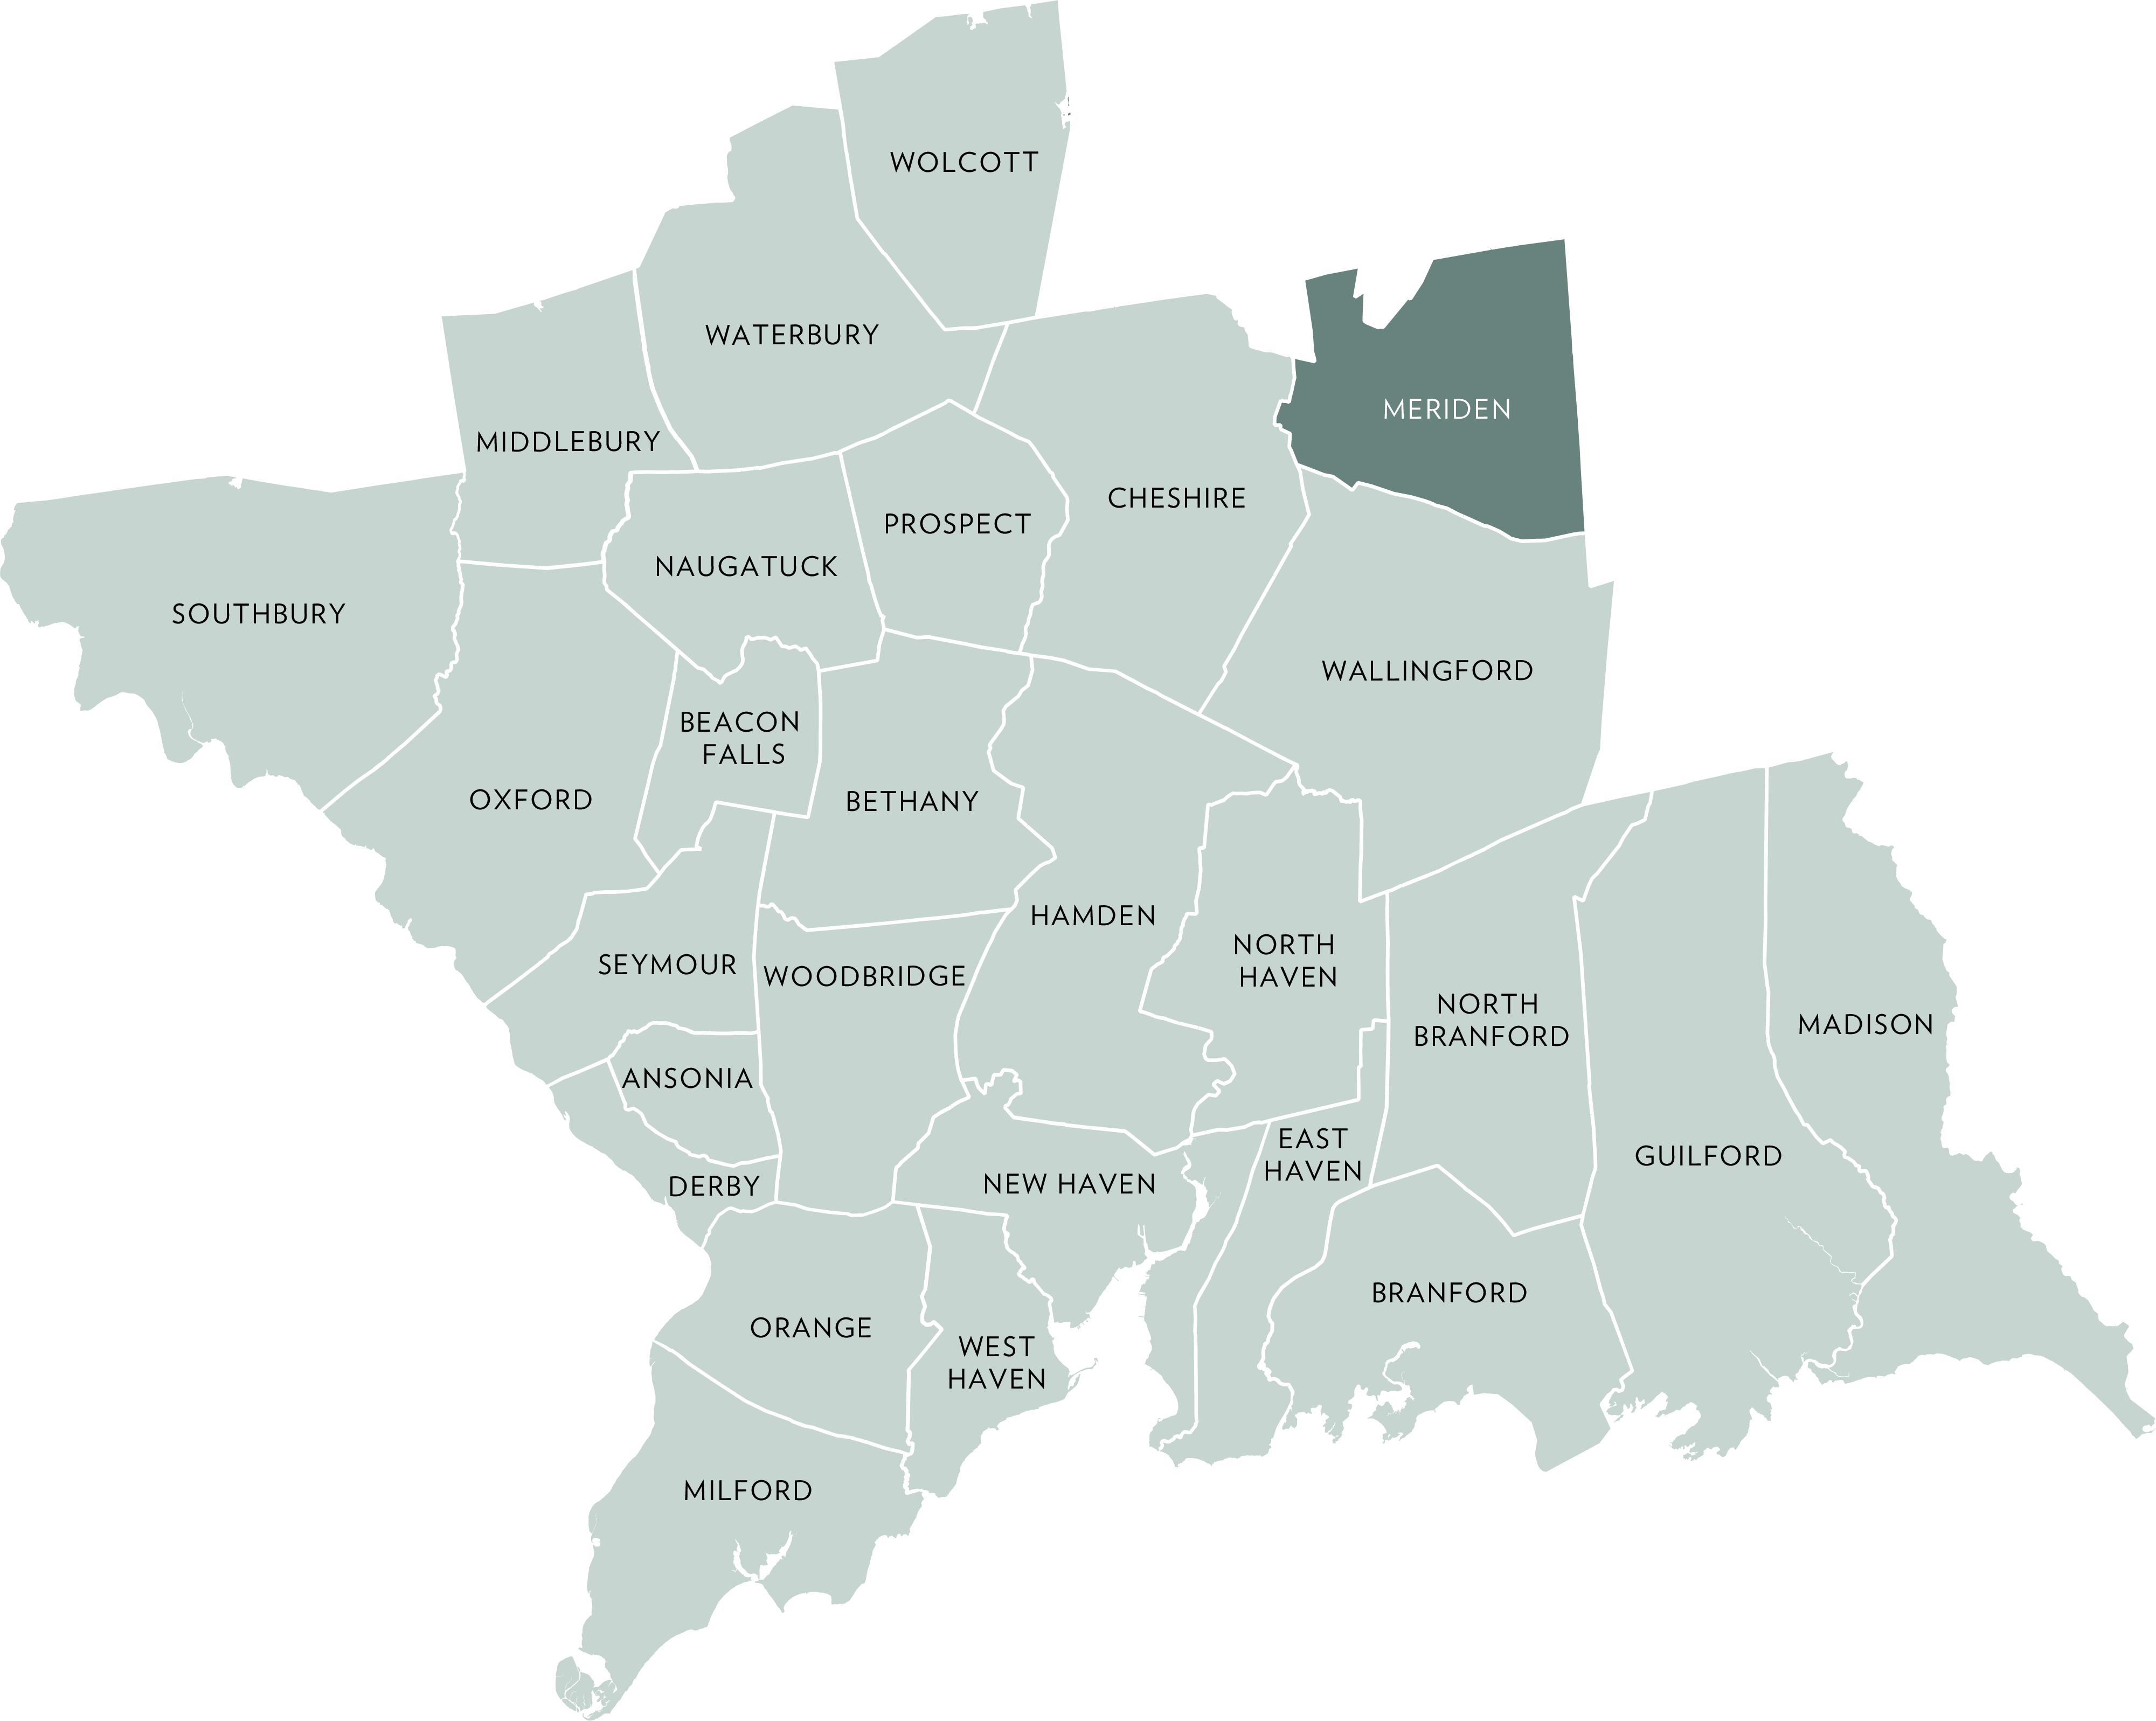
ACTIVE LISTINGS
Q1- 2026 vs Q1- 2025 -8.0%
PENDING LISTINGS
Q1- 2026 vs Q1- 2025 -10.3% SOLD LISTINGS
Q1- 2026 vs Q1- 2025
3.8%
QUARTERLY MARKET OVERVIEW
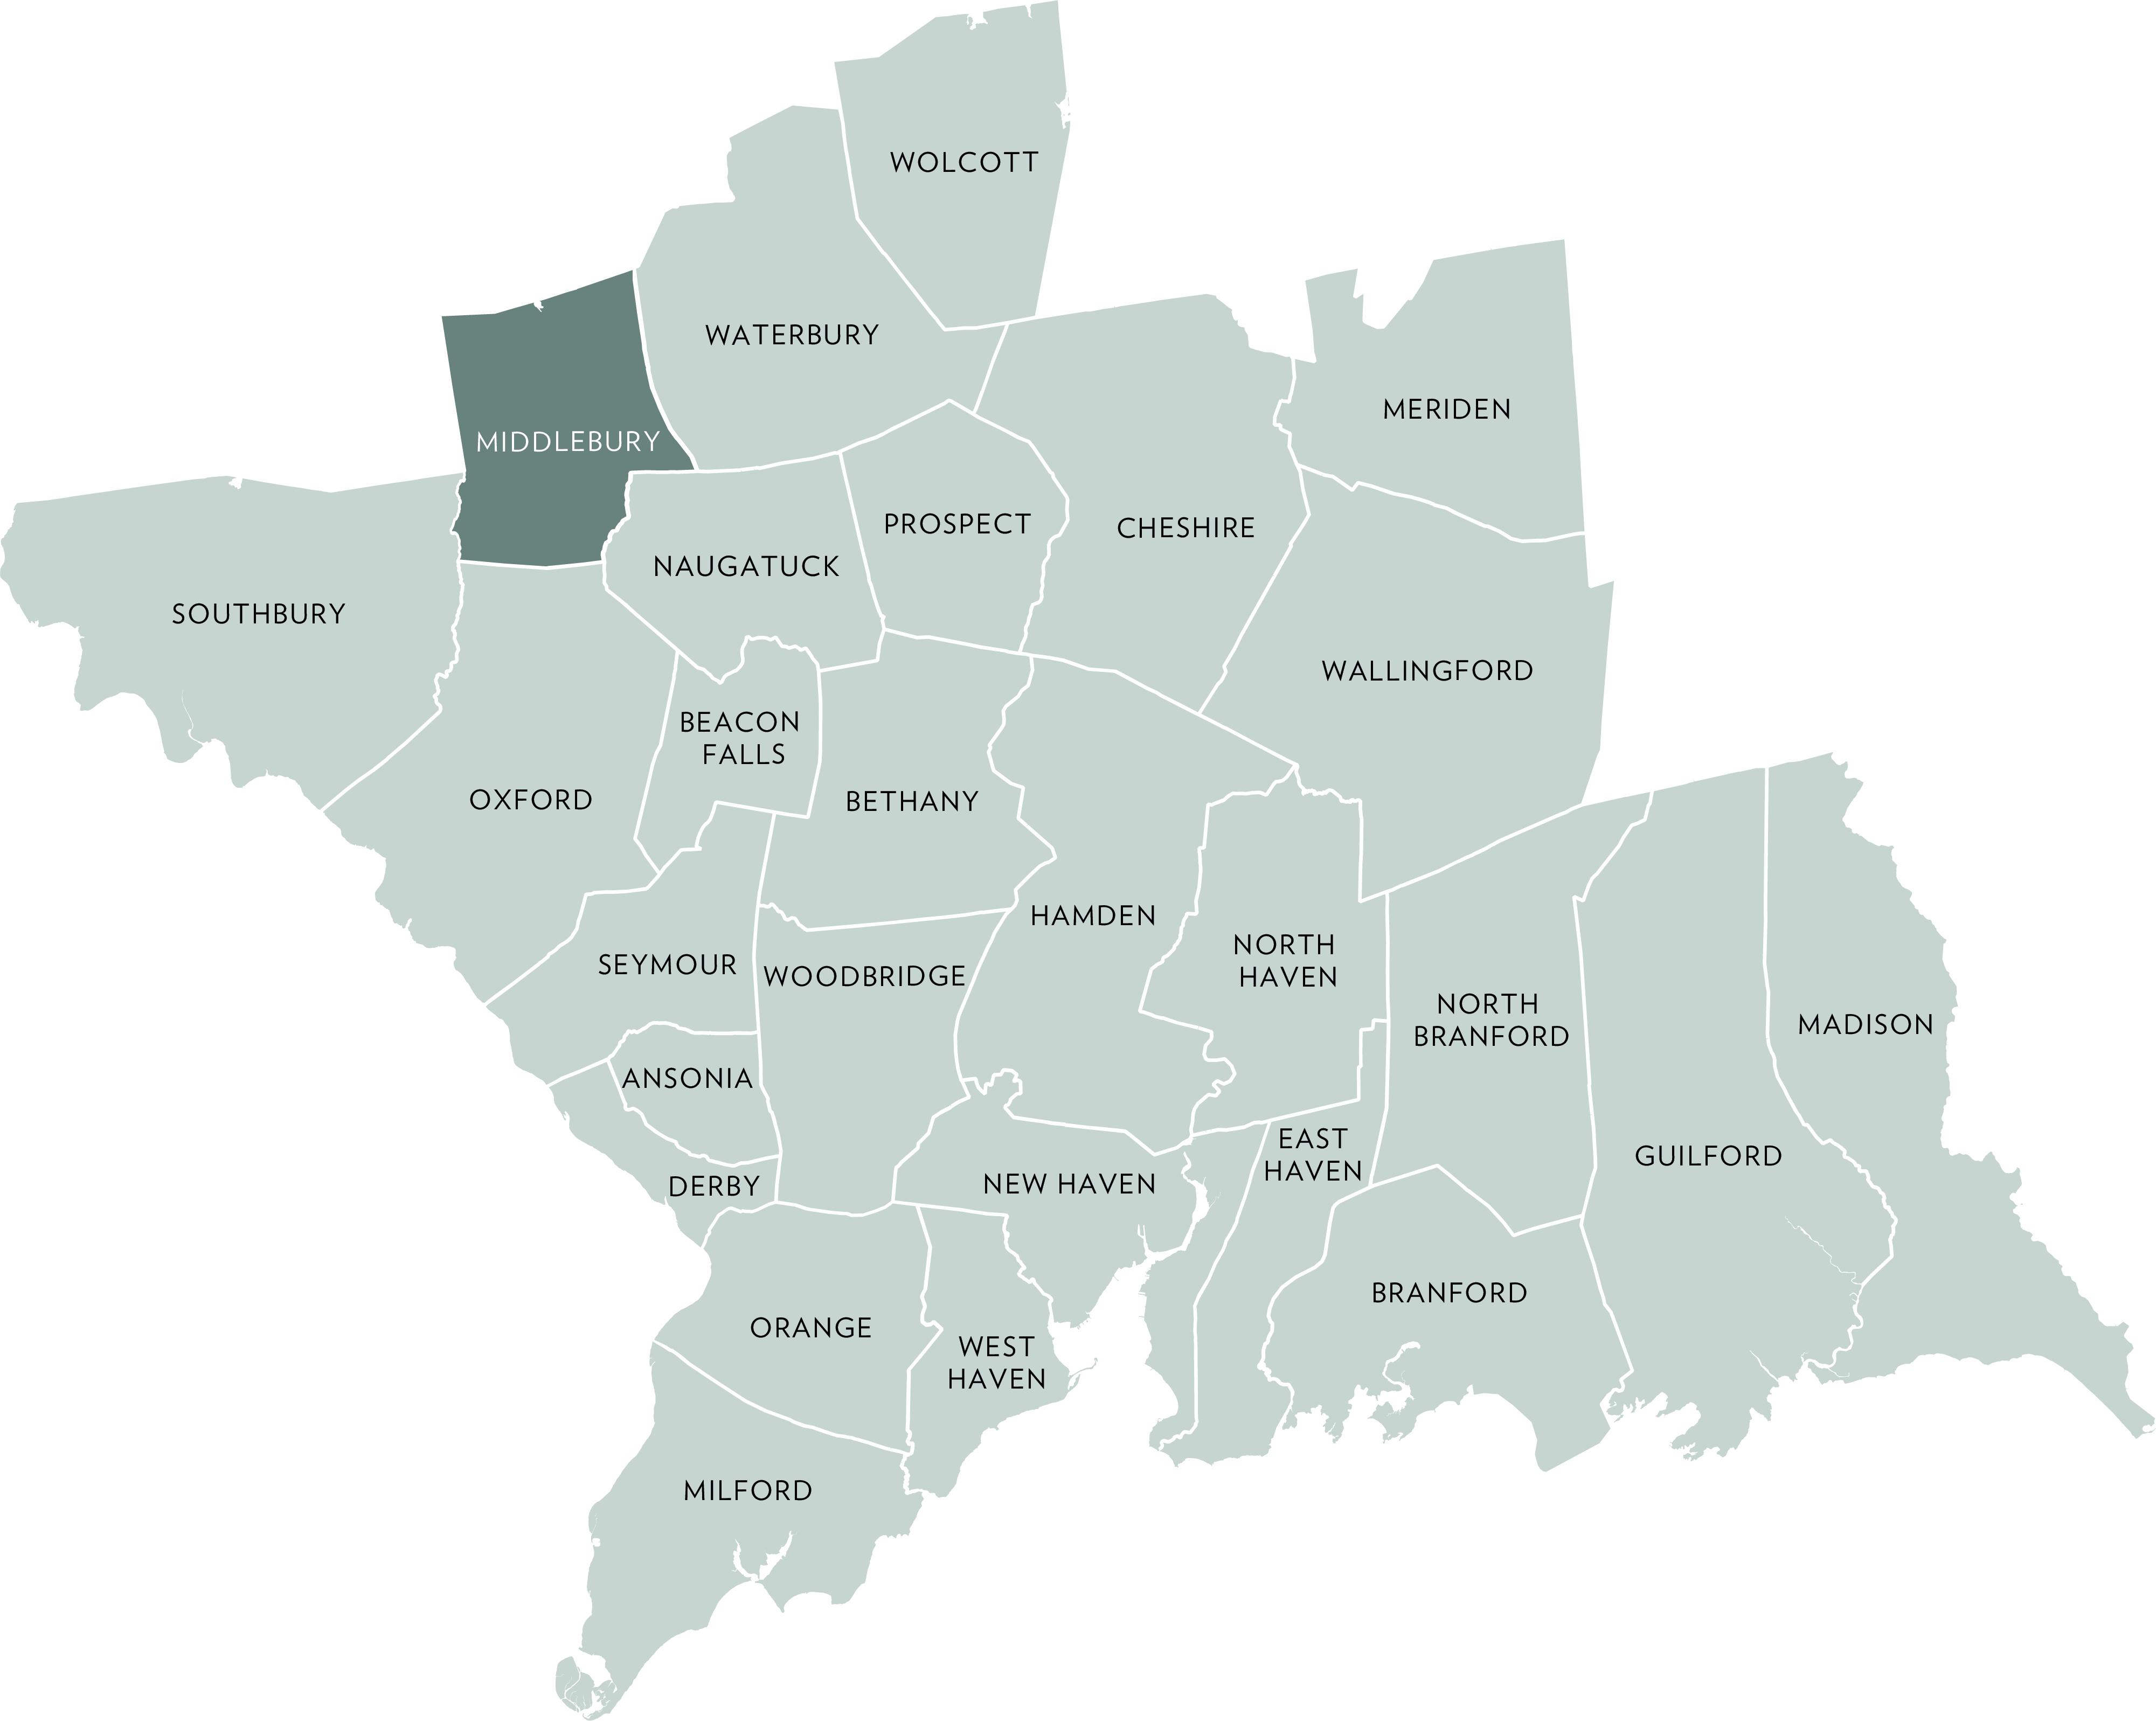
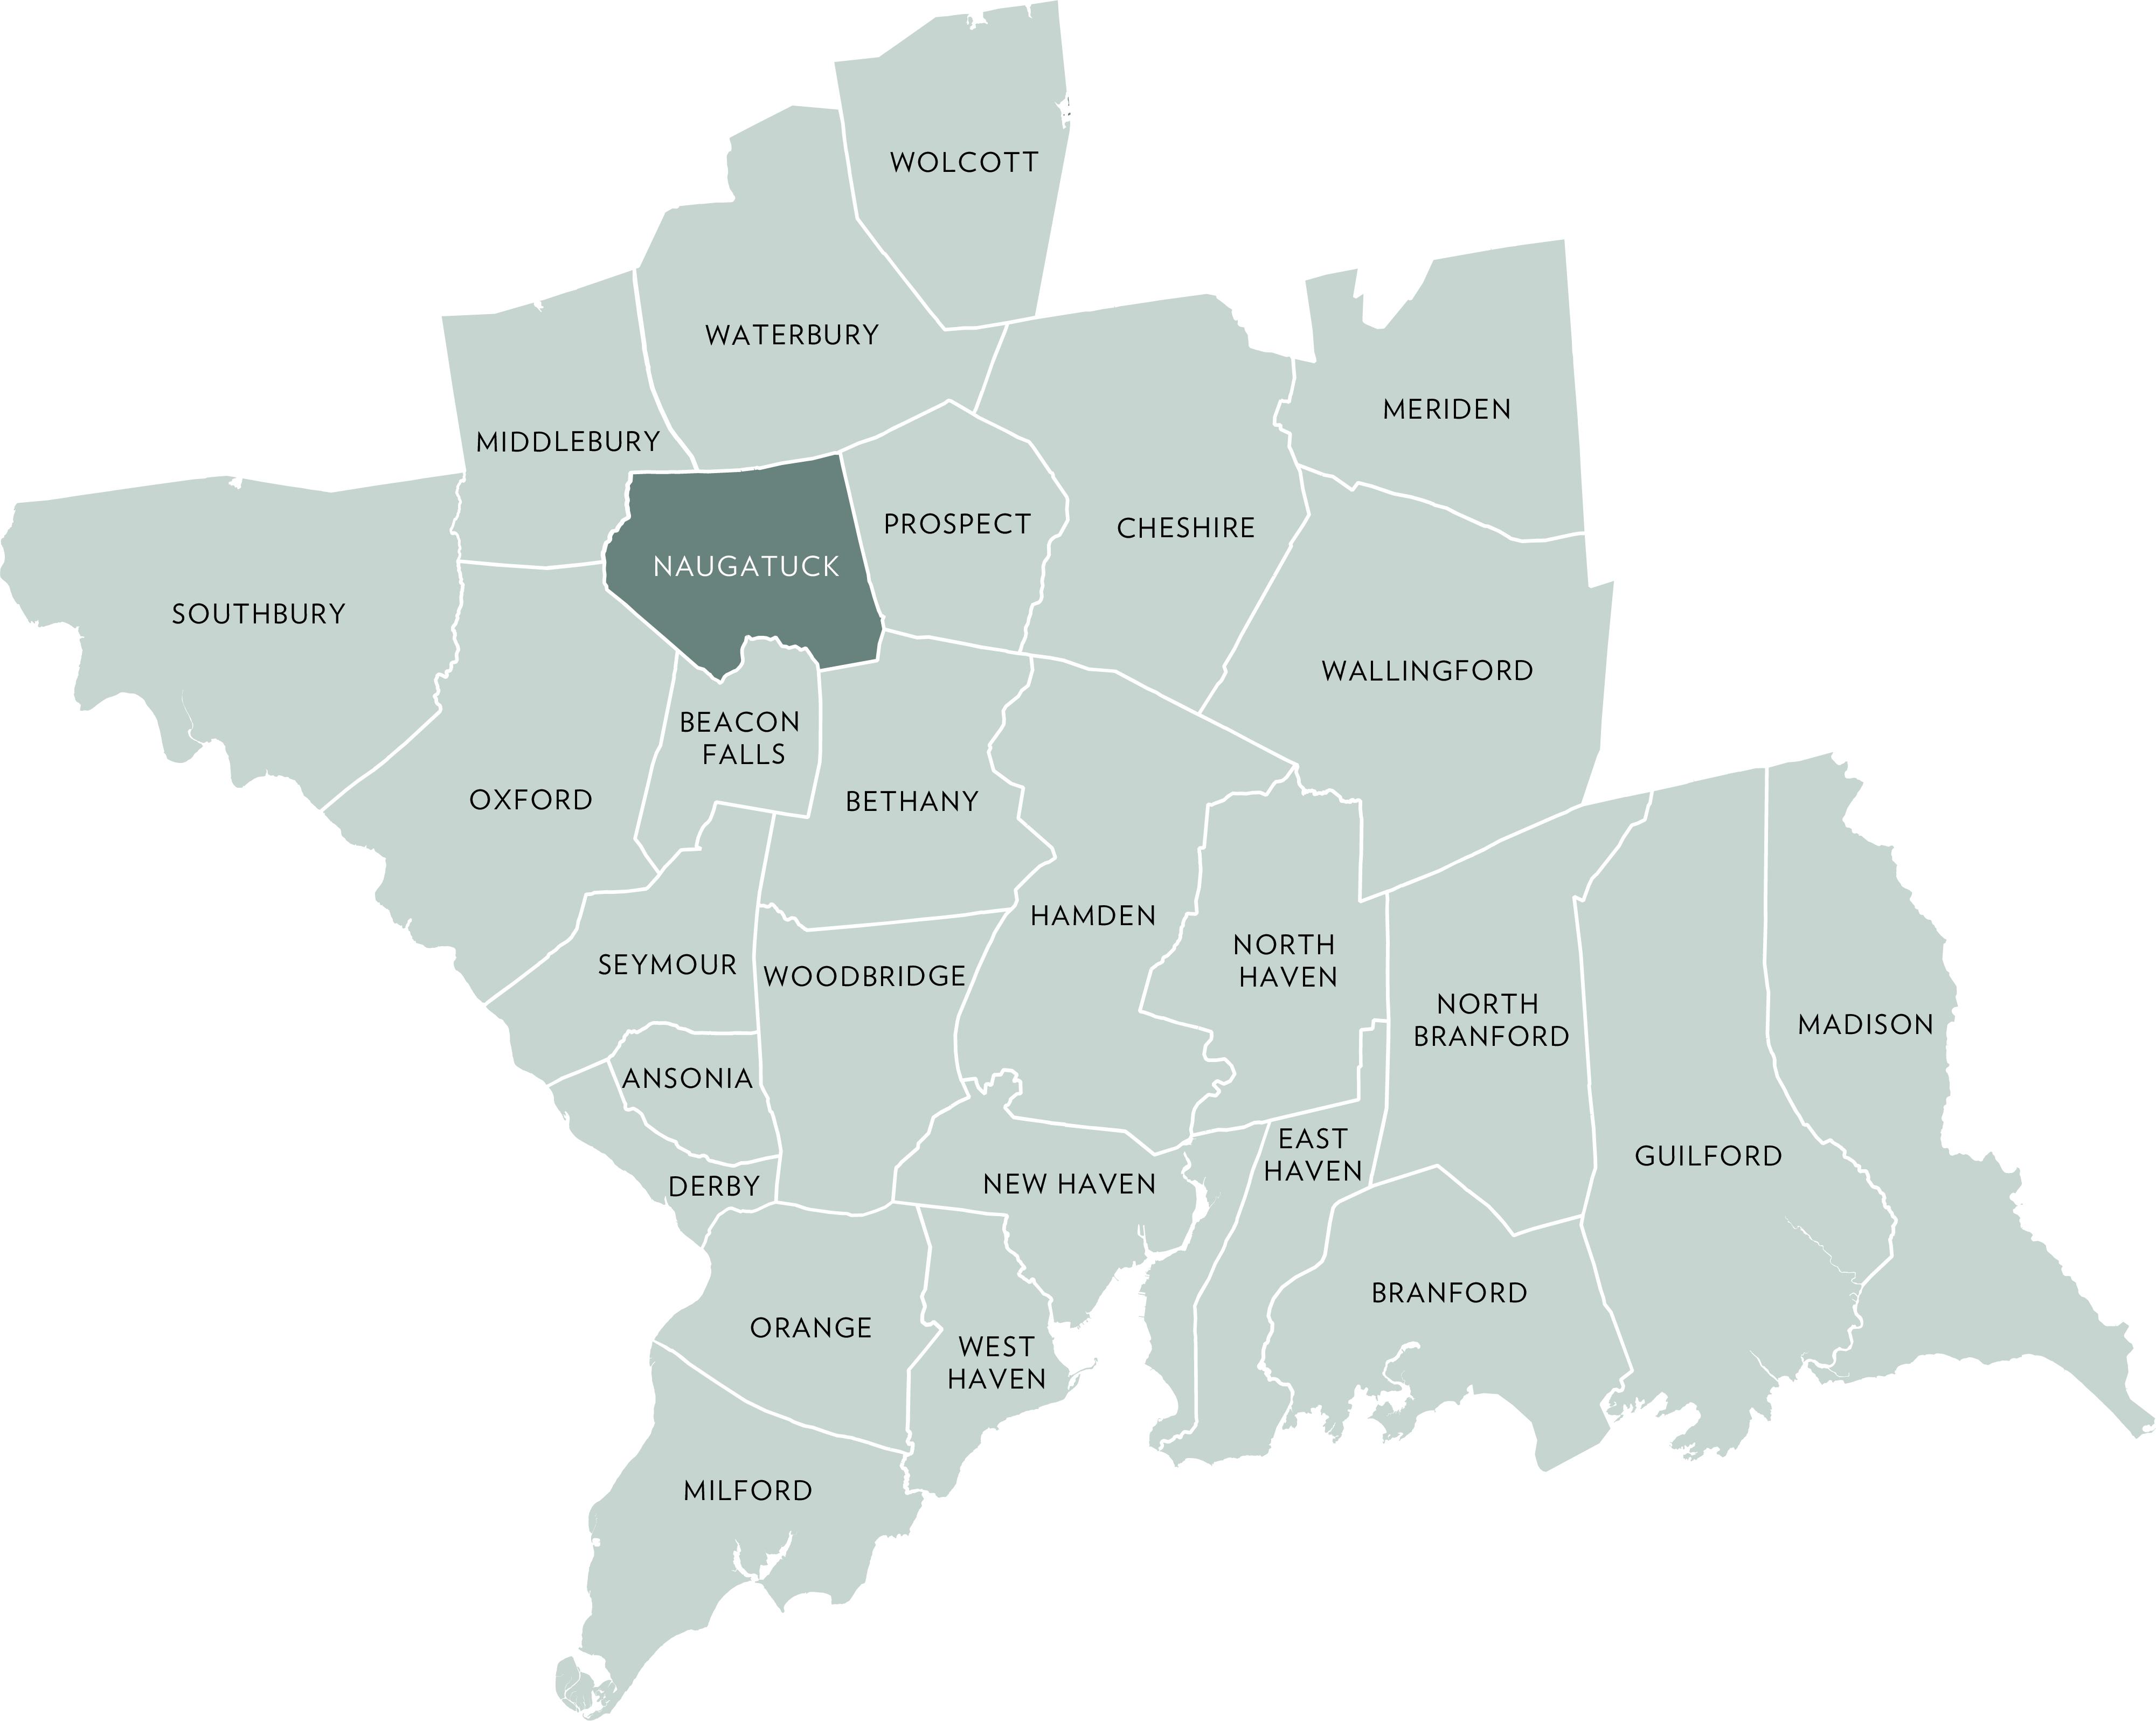
ACTIVE LISTINGS
Q1- 2026 vs Q1- 2025 -2.1%
PENDING LISTINGS
Q1- 2026 vs Q1- 2025 46.2% SOLD LISTINGS
Q1- 2026 vs Q1- 2025 10.9%
QUARTERLY MARKET OVERVIEW
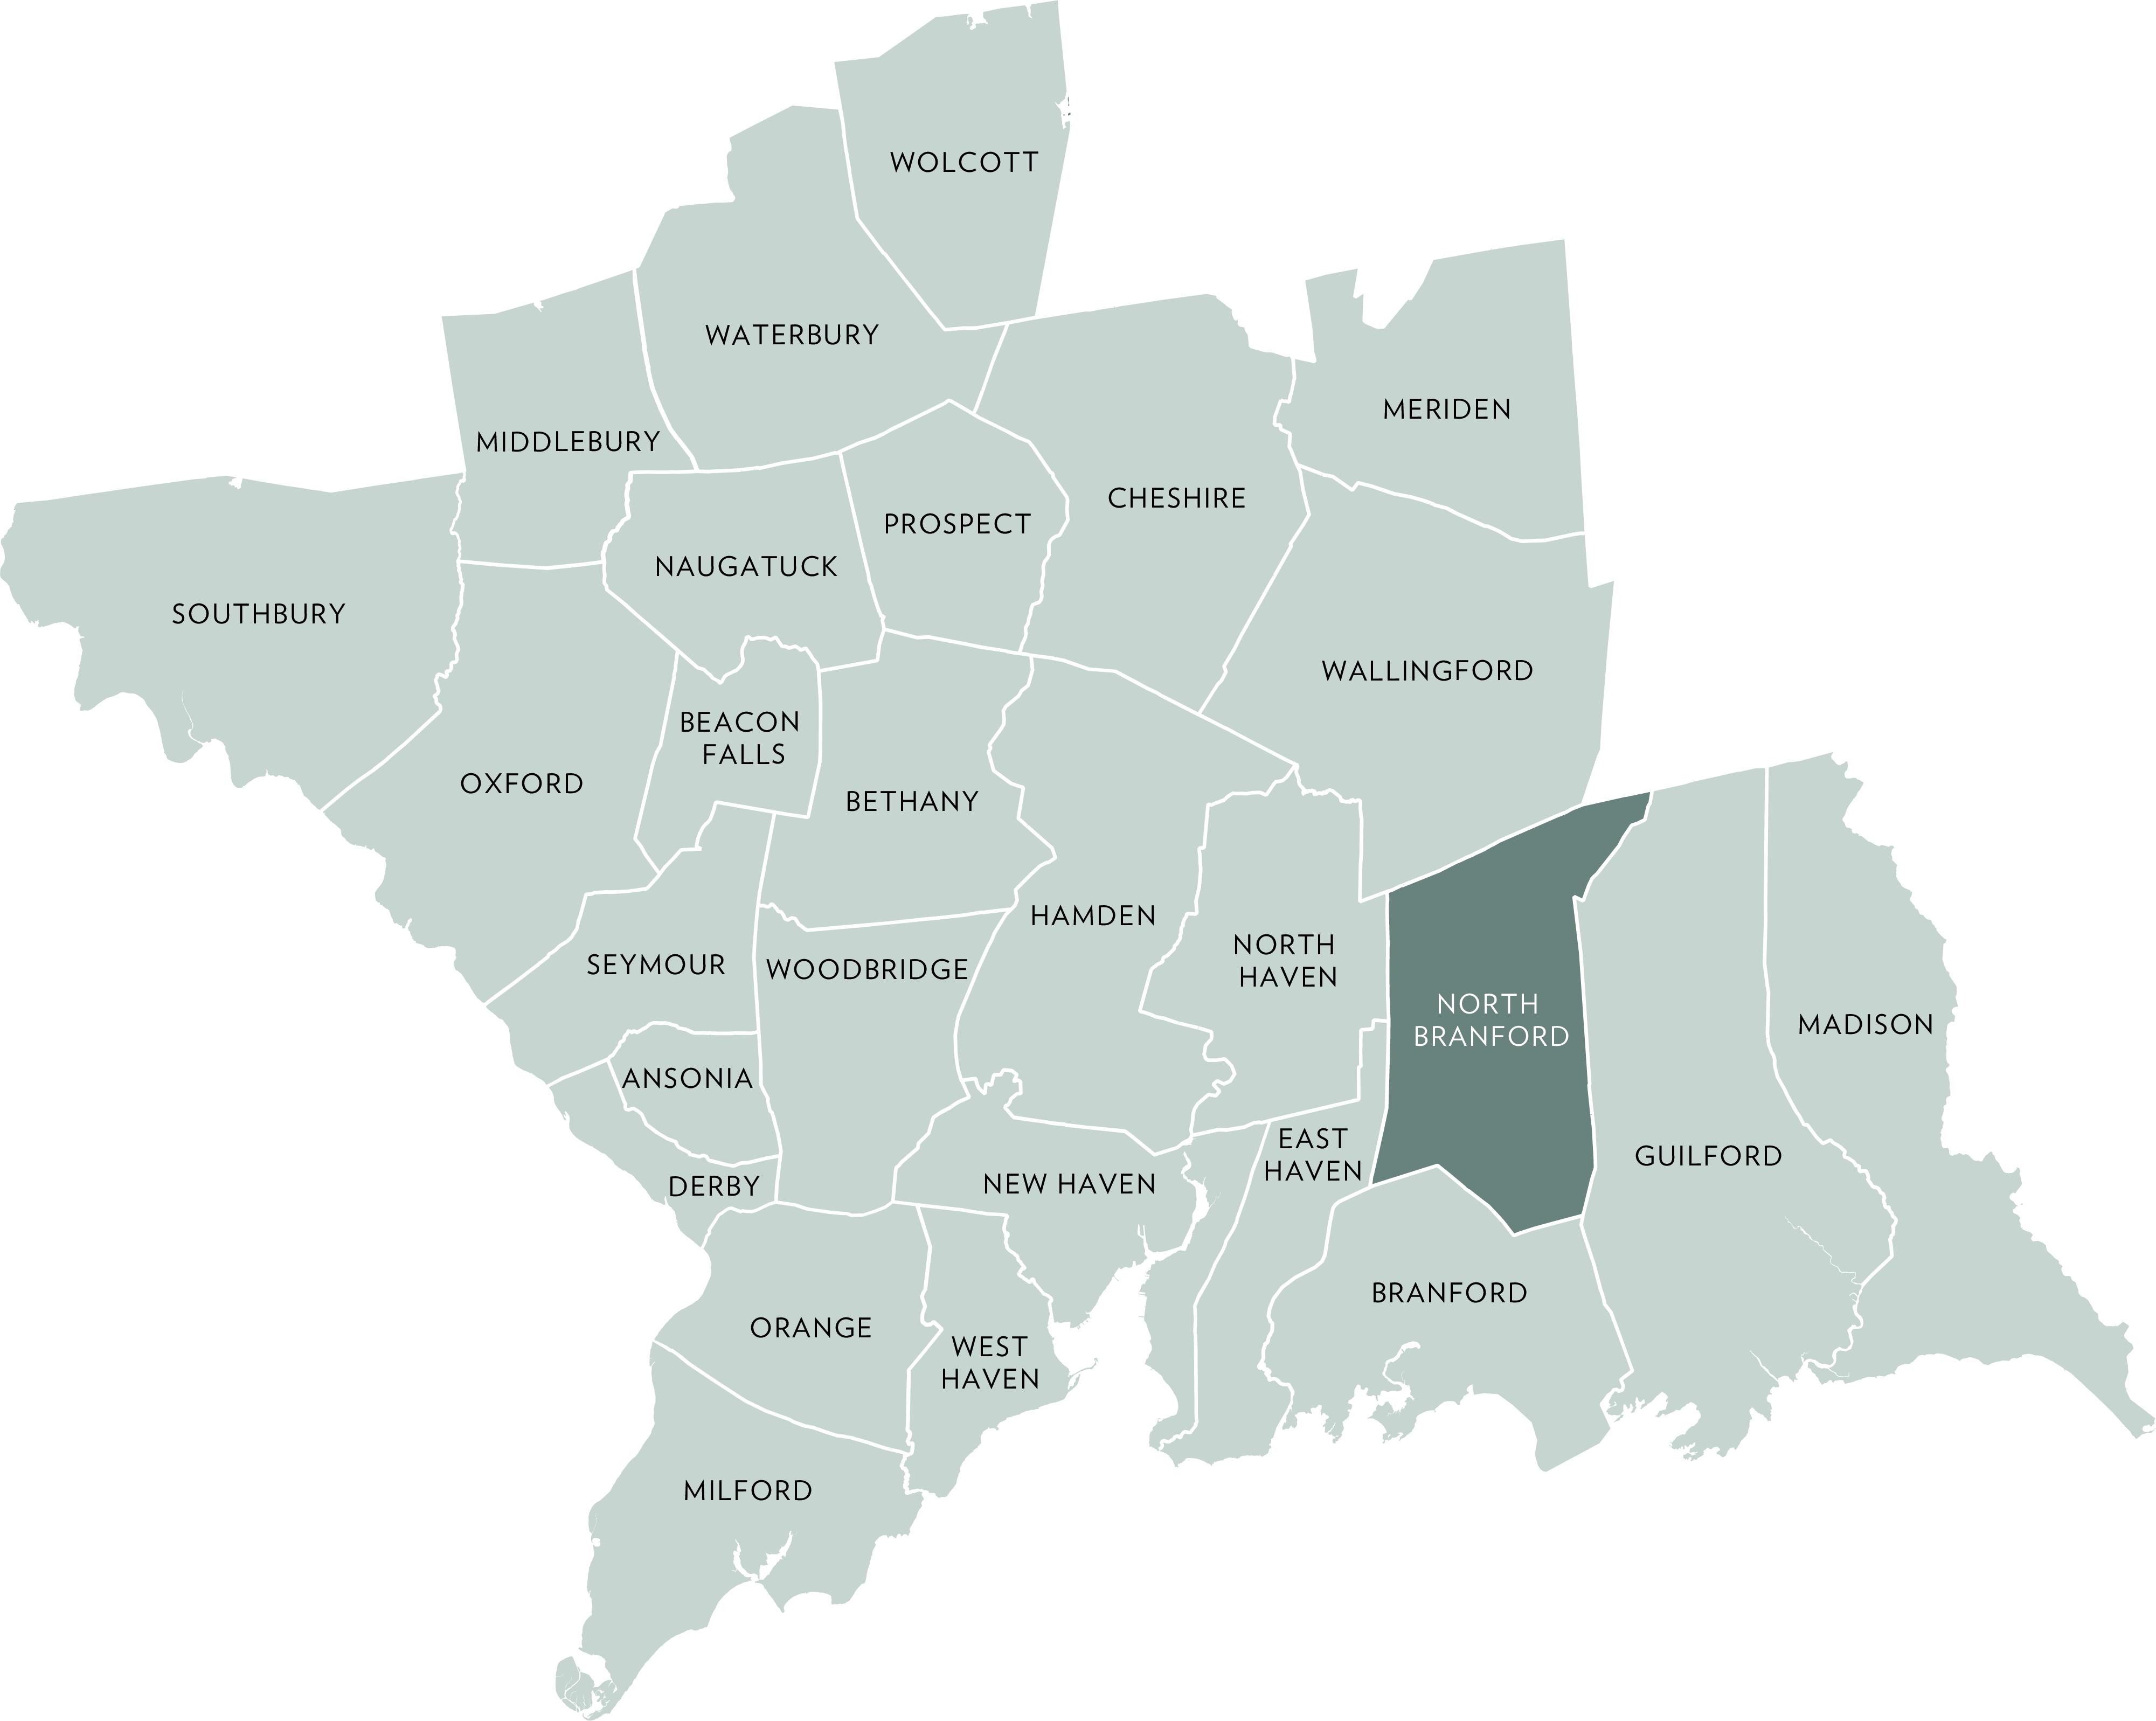
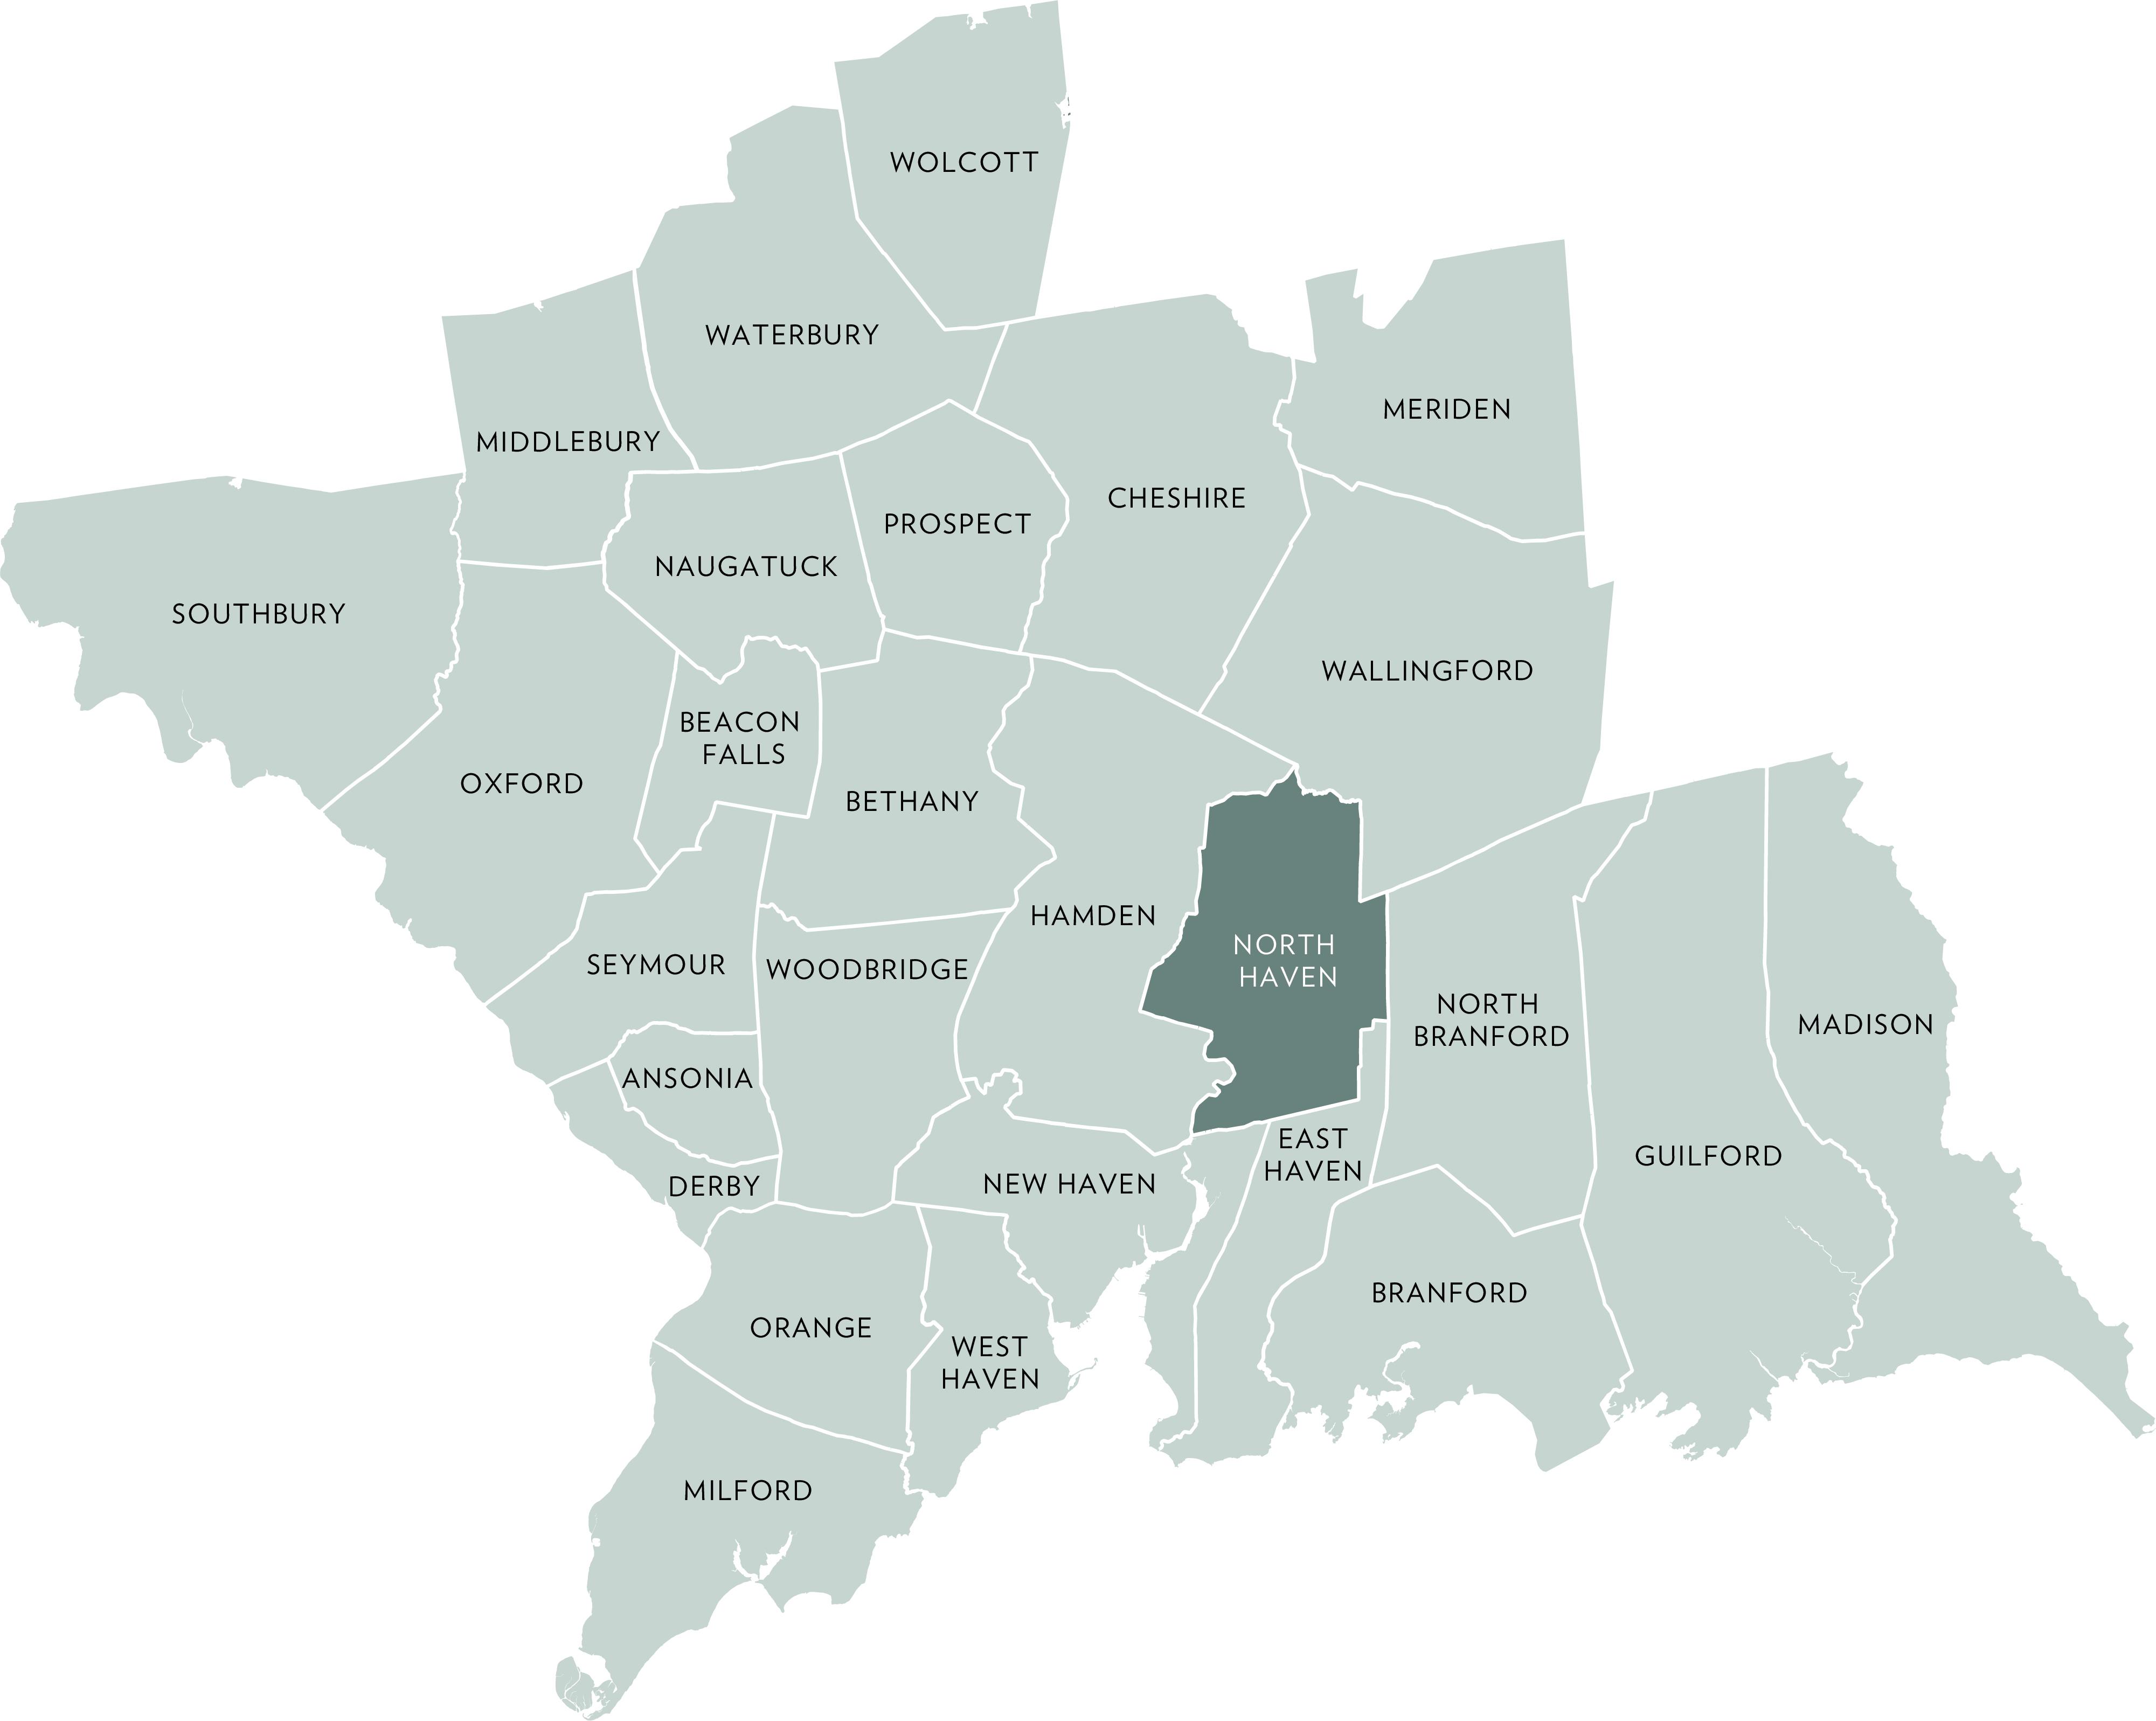
ACTIVE LISTINGS
Q1- 2026 vs Q1- 2025 -12.0%
PENDING LISTINGS
Q1- 2026 vs Q1- 2025 -21.1%
Q1- 2026 vs Q1- 2025 -15.4%
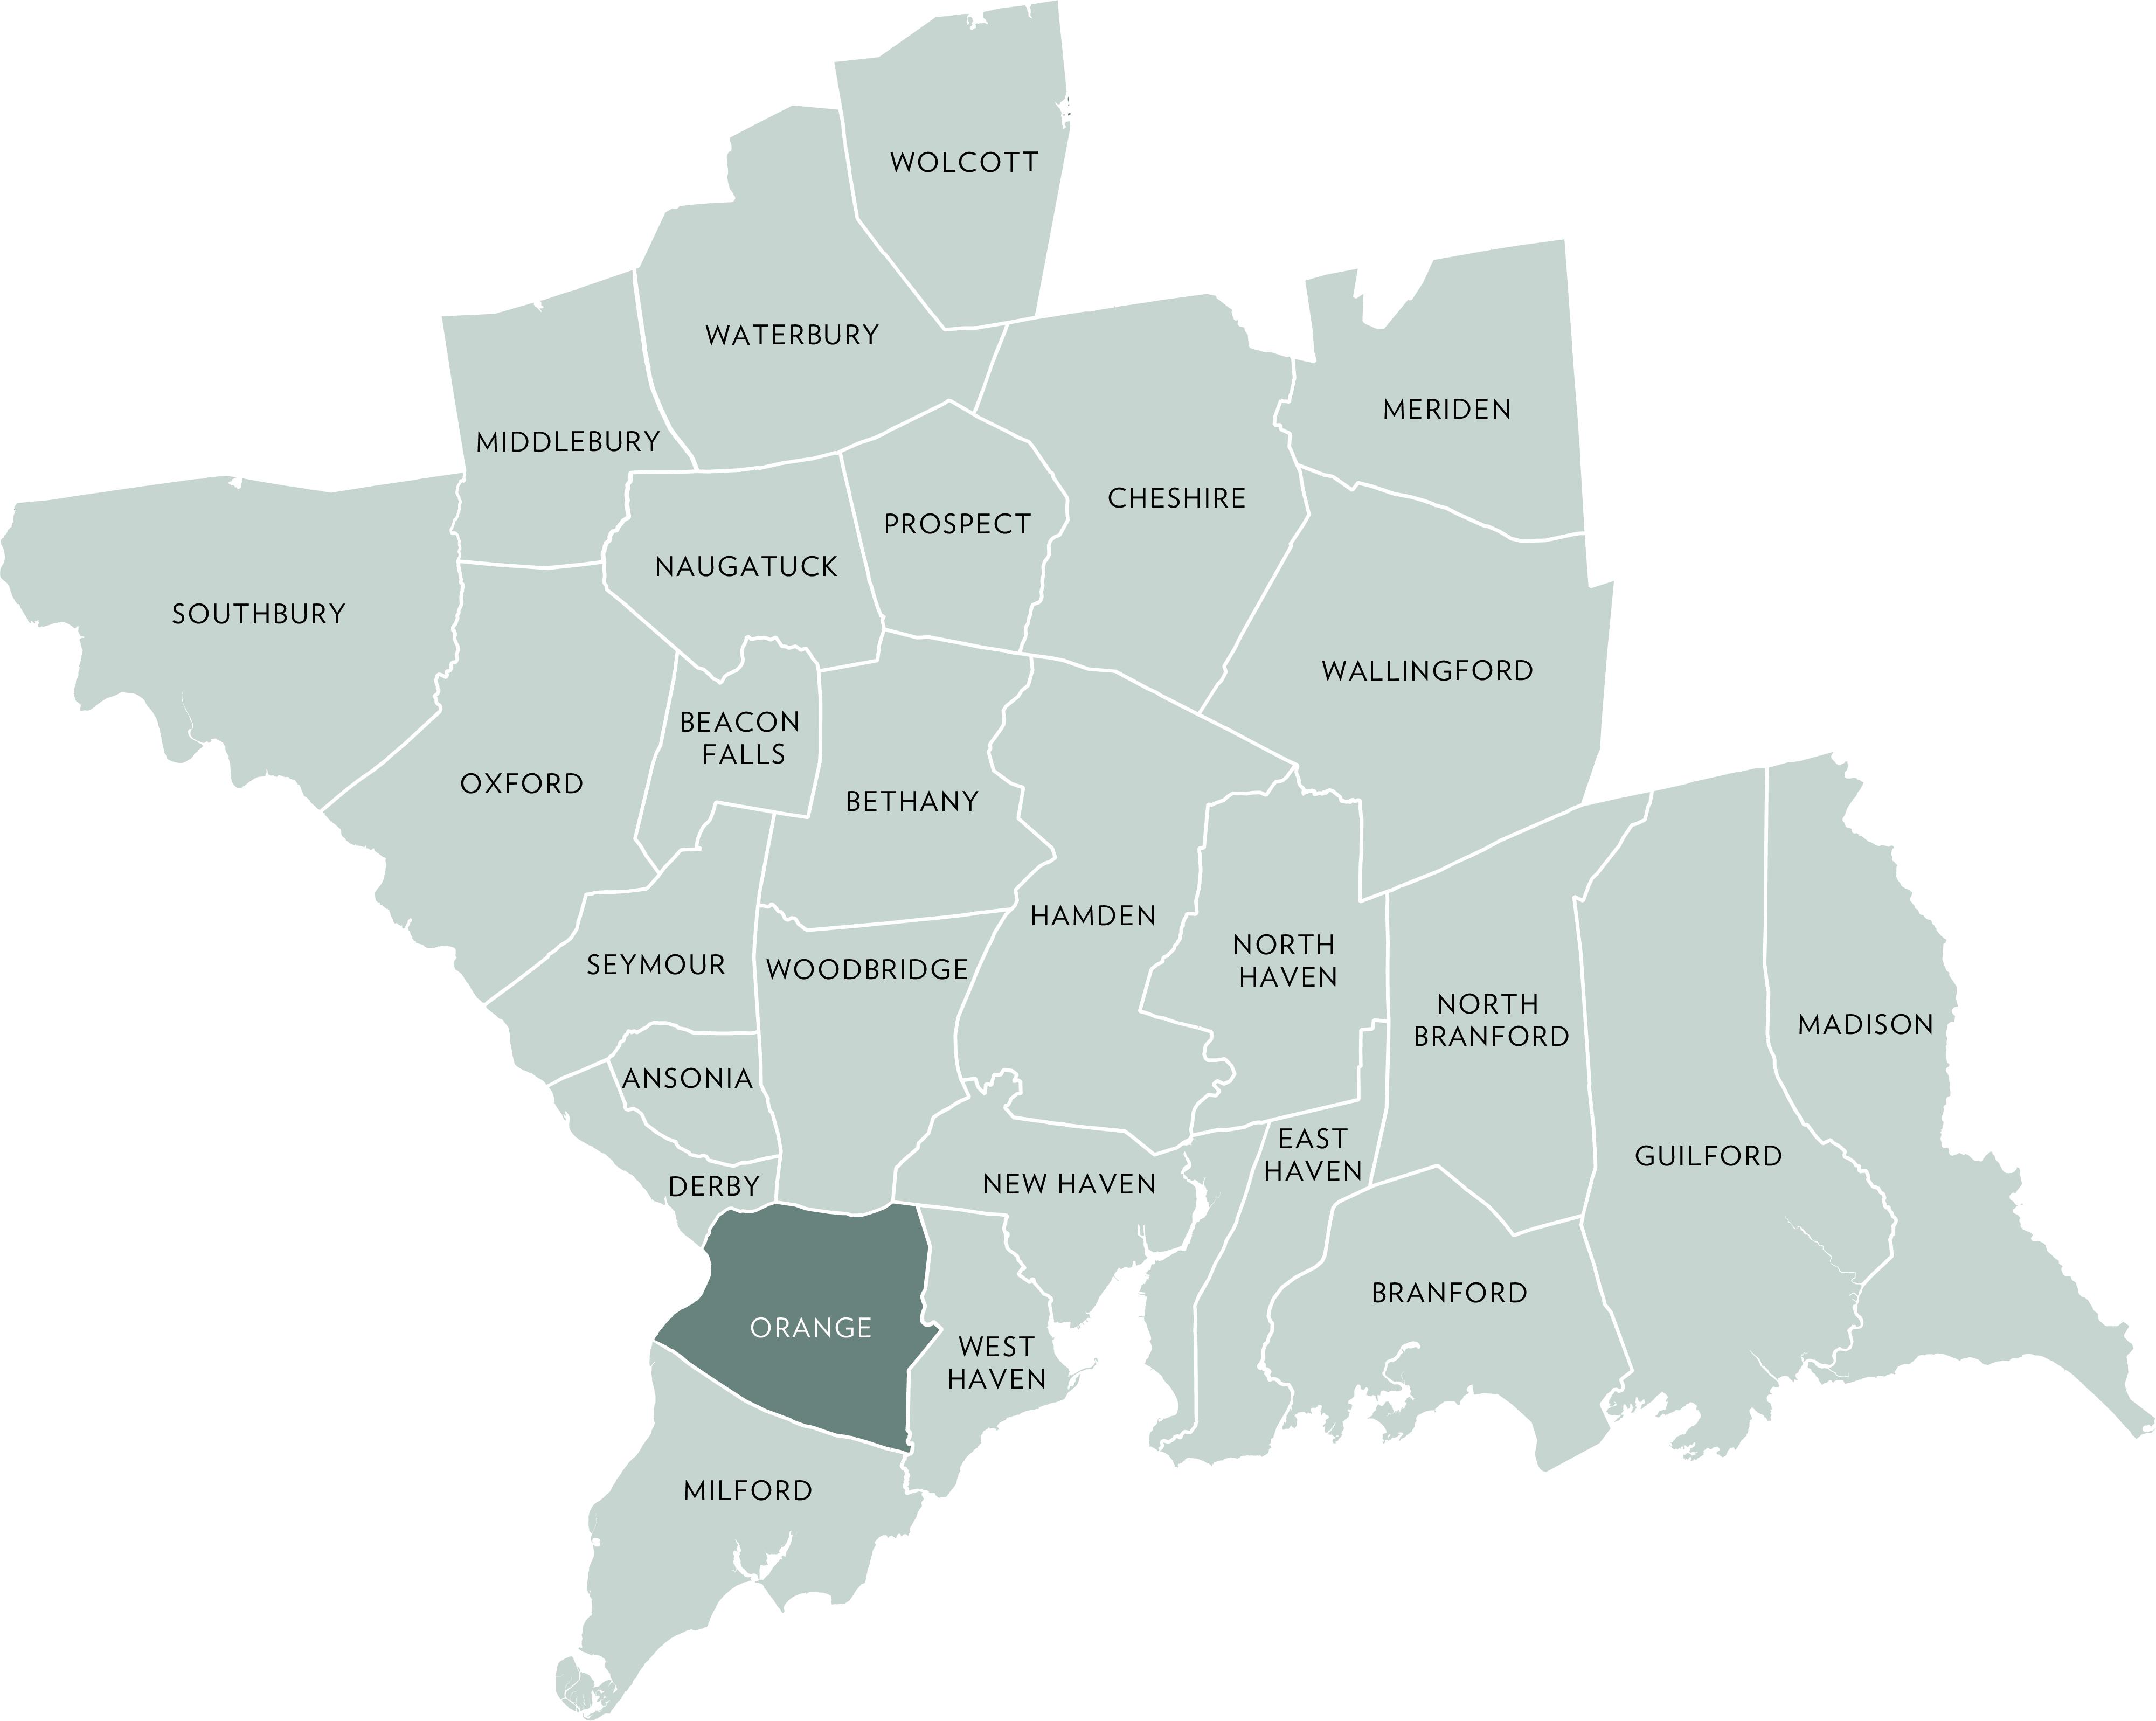
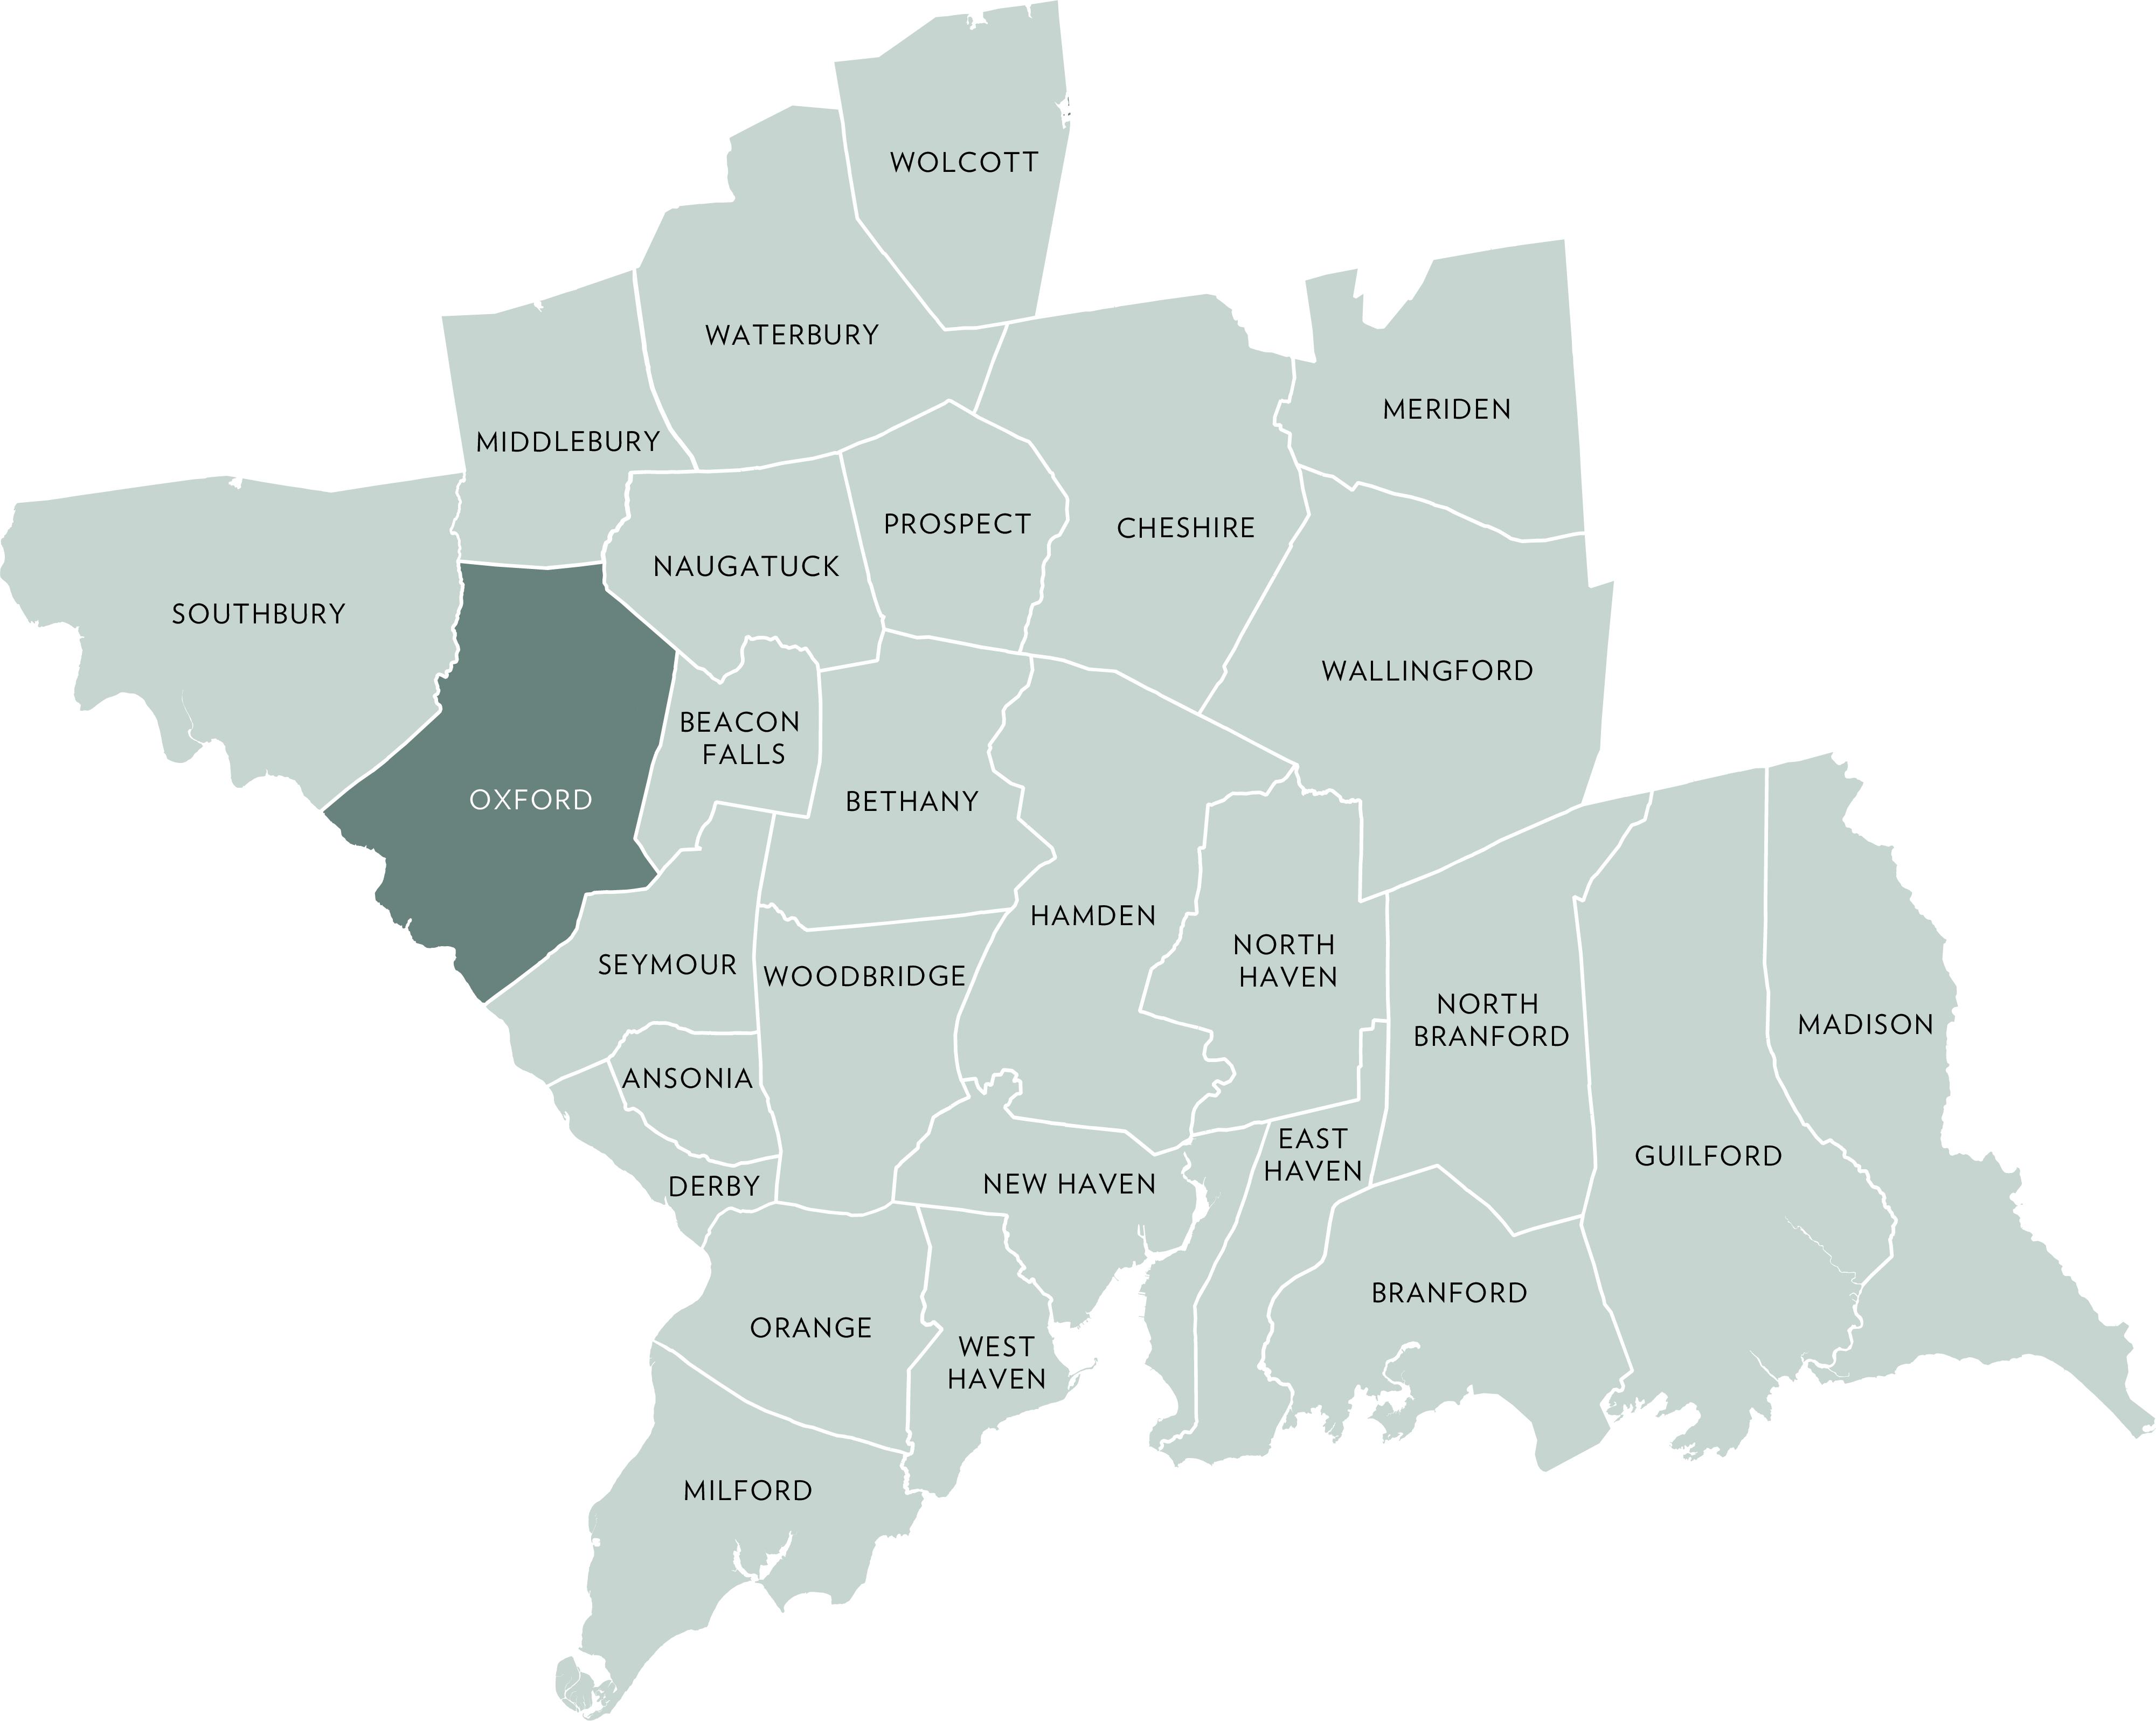
ACTIVE LISTINGS
Q1- 2026 vs Q1- 2025 37.5%
PENDING LISTINGS
Q1- 2026 vs Q1- 2025 -10.0% SOLD LISTINGS
Q1- 2026 vs Q1- 2025 91.7%
ACTIVE LISTINGS
Q1- 2026 vs Q1- 2025 -25.0%
PENDING LISTINGS
Q1- 2026 vs Q1- 2025 28.6%
Q1- 2026 vs Q1- 2025 120.0%
QUARTERLY MARKET OVERVIEW
ACTIVE LISTINGS
Q1- 2026 vs Q1- 2025 -12.9%
PENDING LISTINGS
Q1- 2026 vs Q1- 2025 -7.1%
Q1- 2026 vs Q1- 2025
0.0%
QUARTERLY MARKET OVERVIEW
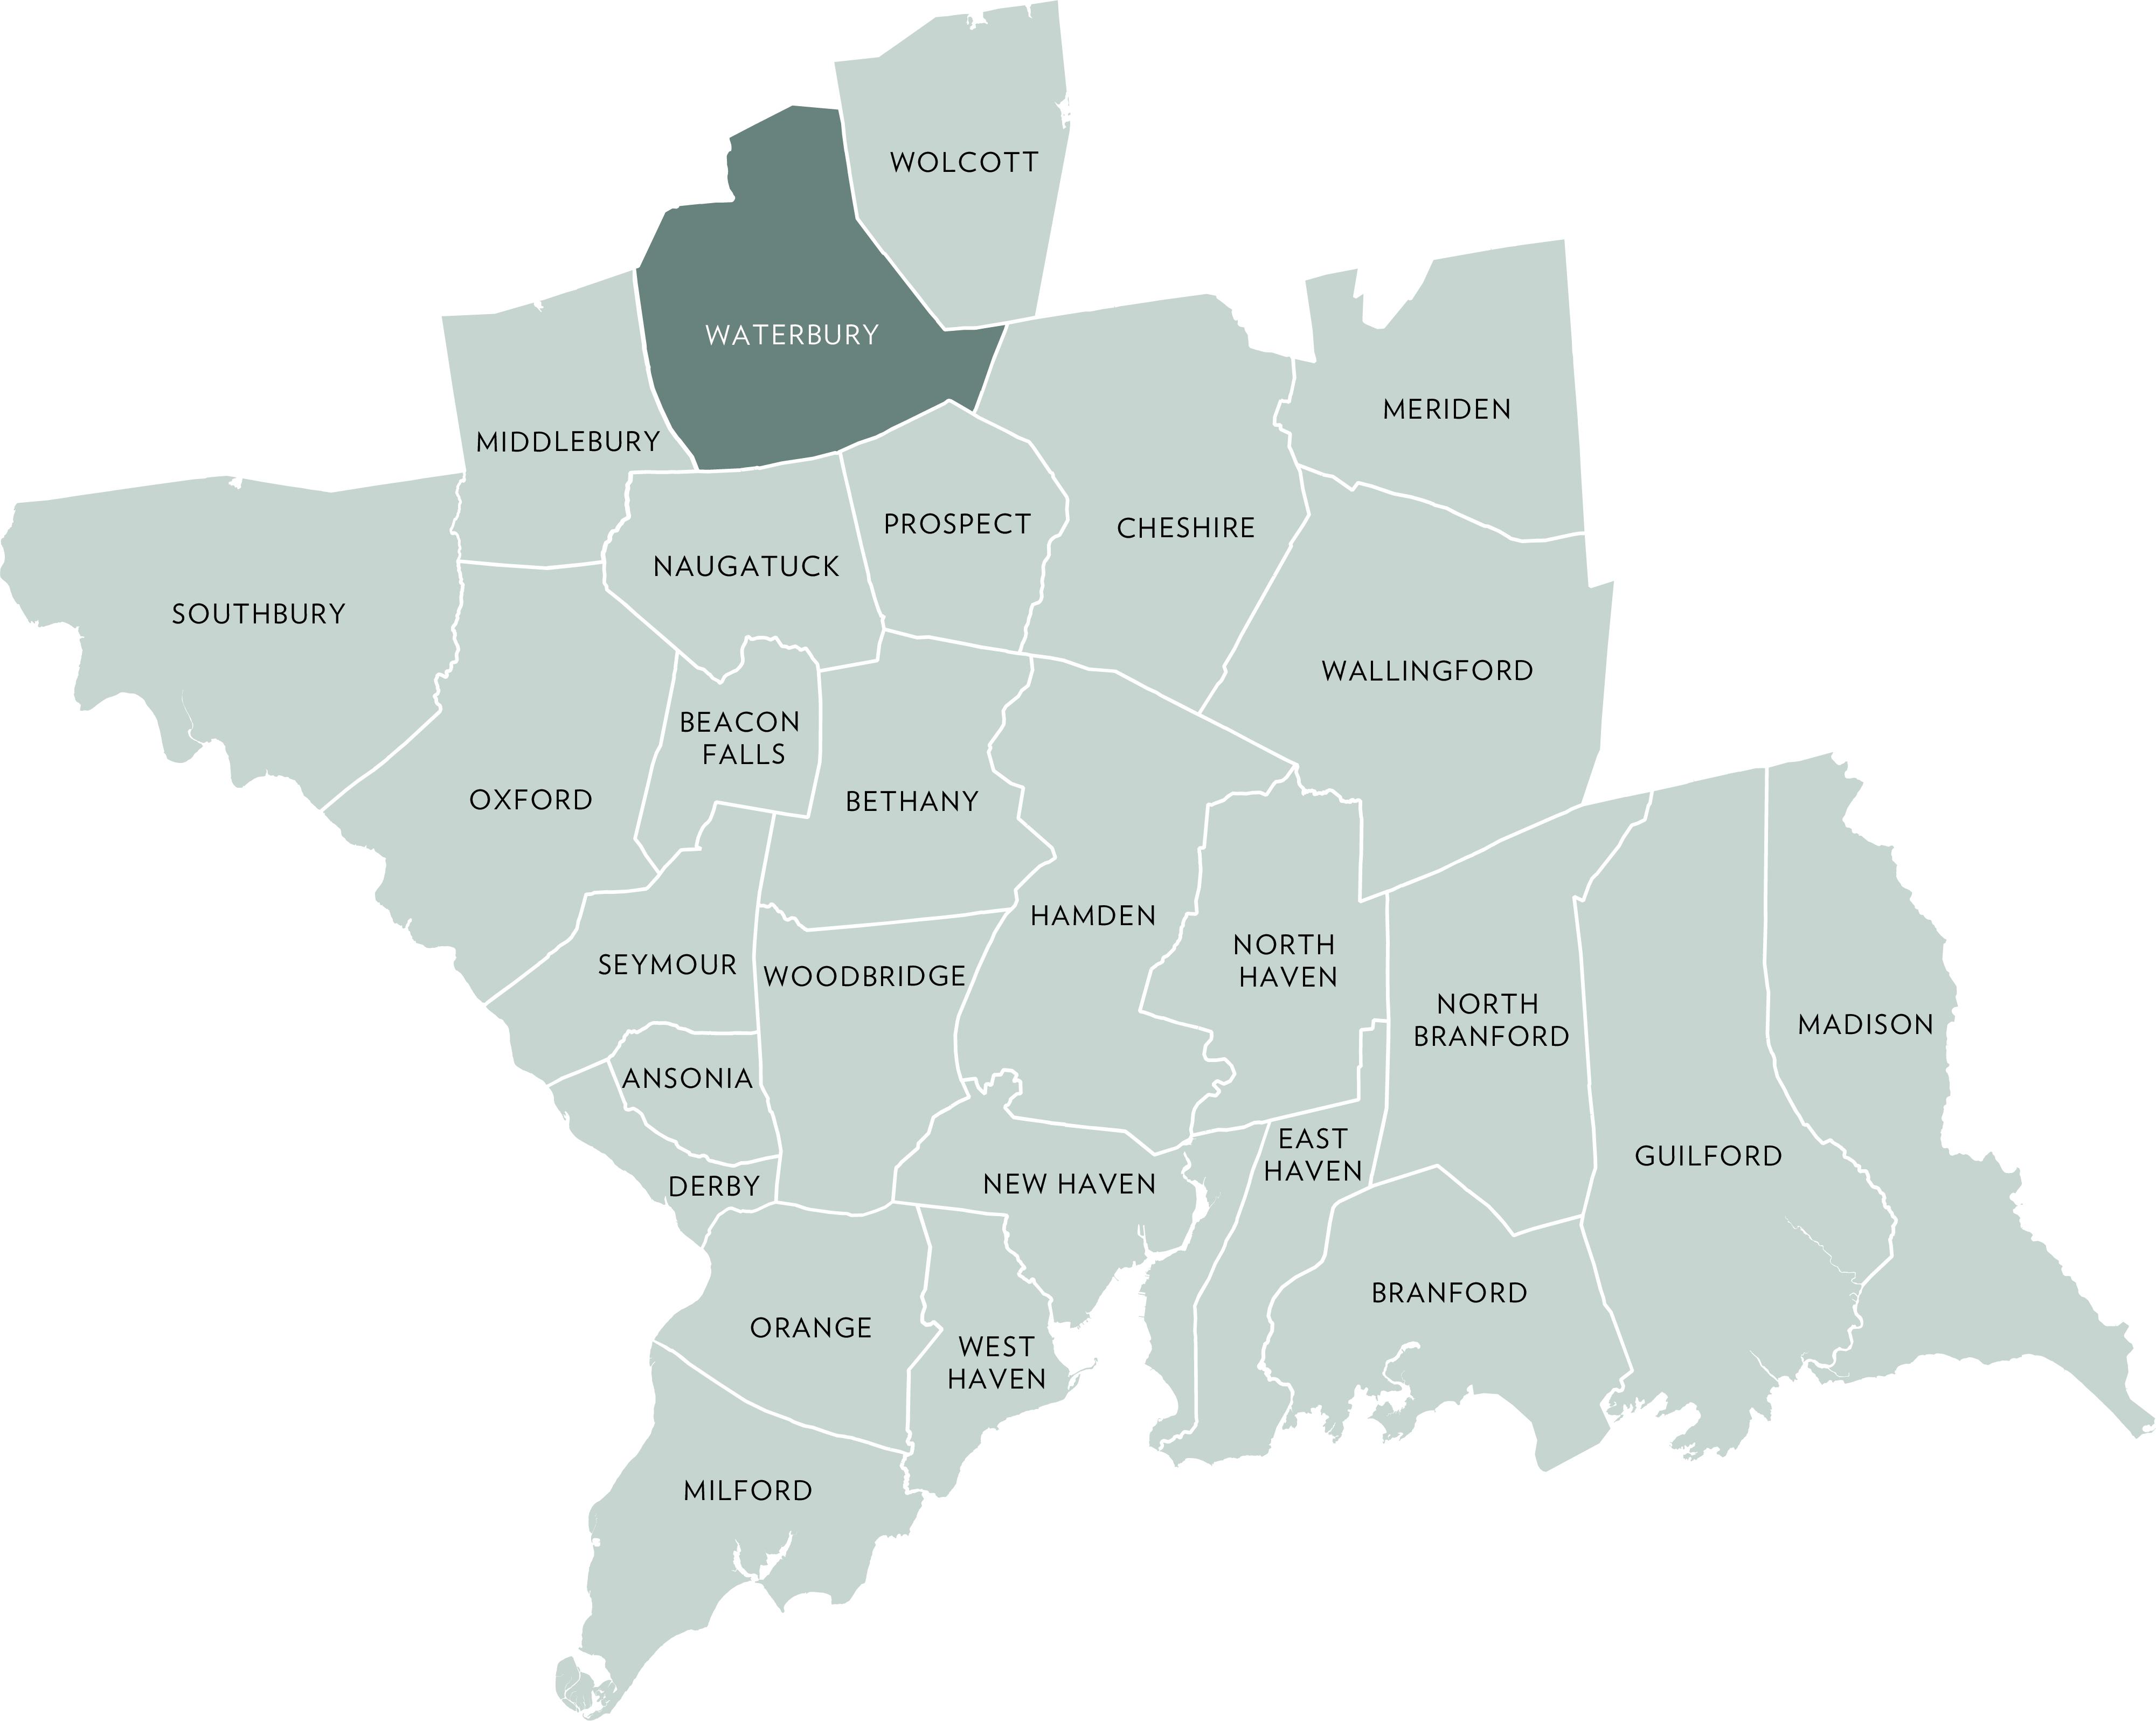
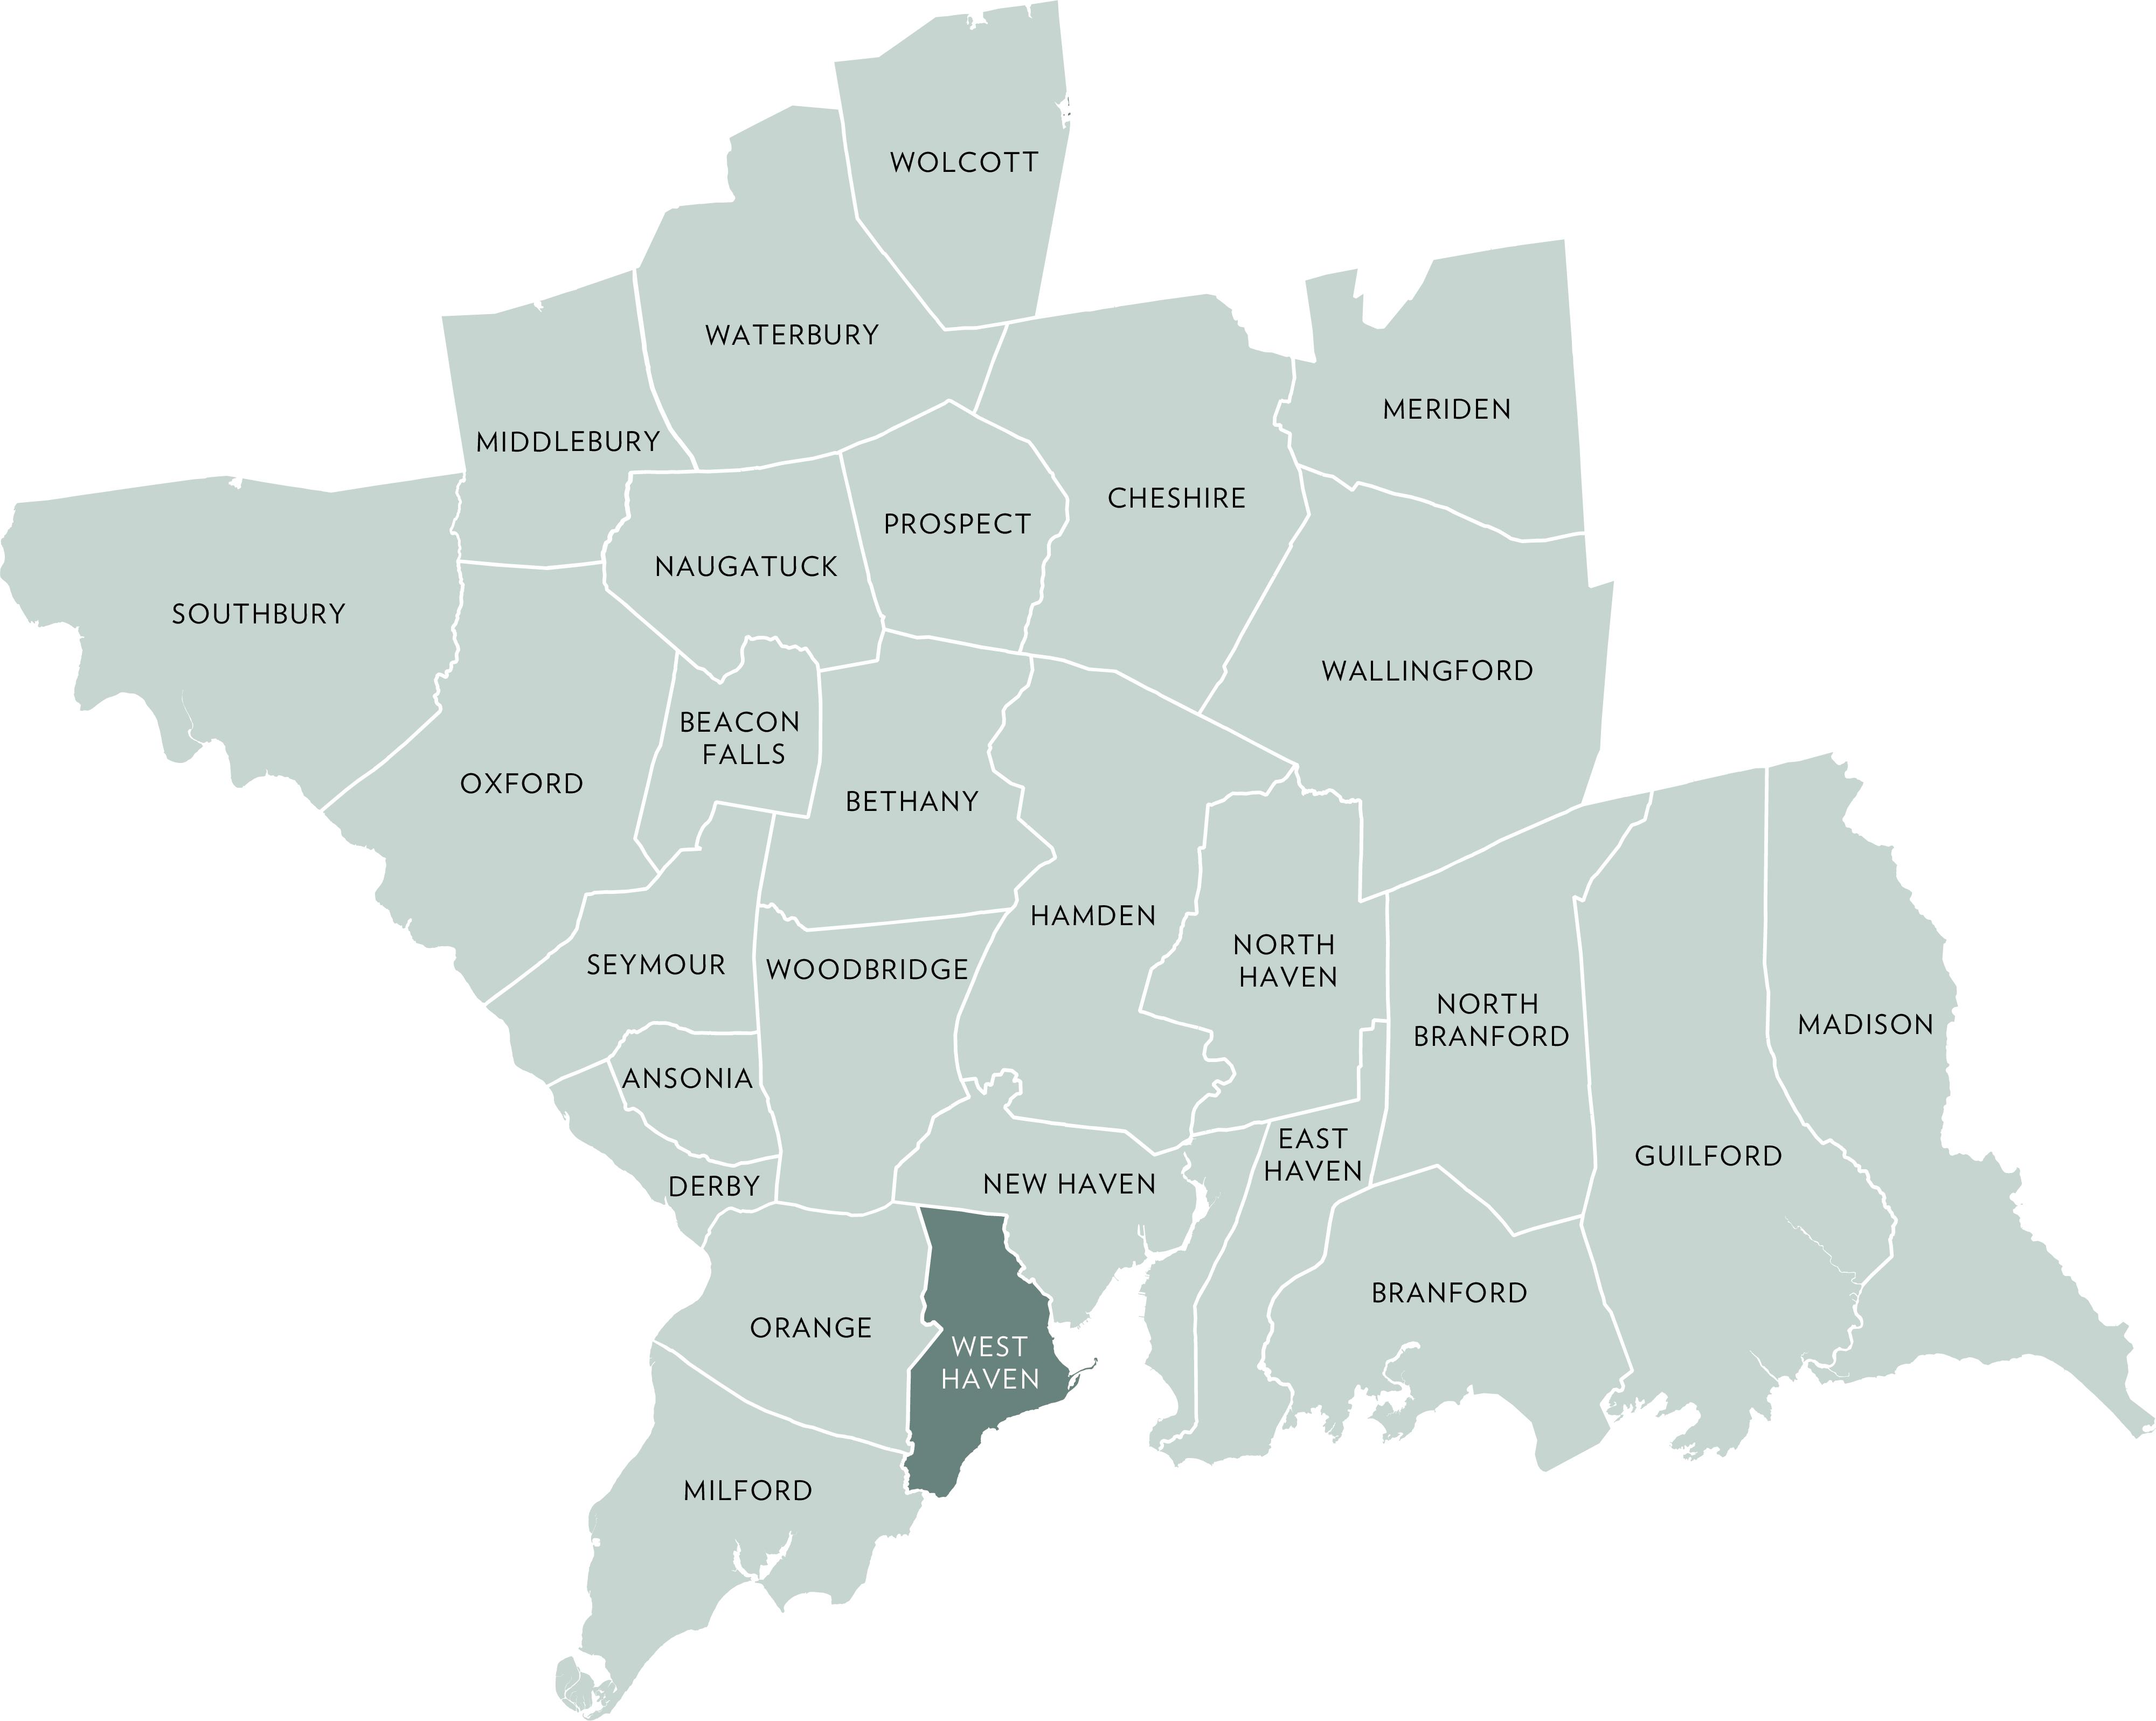
ACTIVE LISTINGS
Q1- 2026 vs Q1- 2025 -3.6%
PENDING LISTINGS
Q1- 2026 vs Q1- 2025 -7.4%
Q1- 2026 vs Q1- 2025 -13.0%
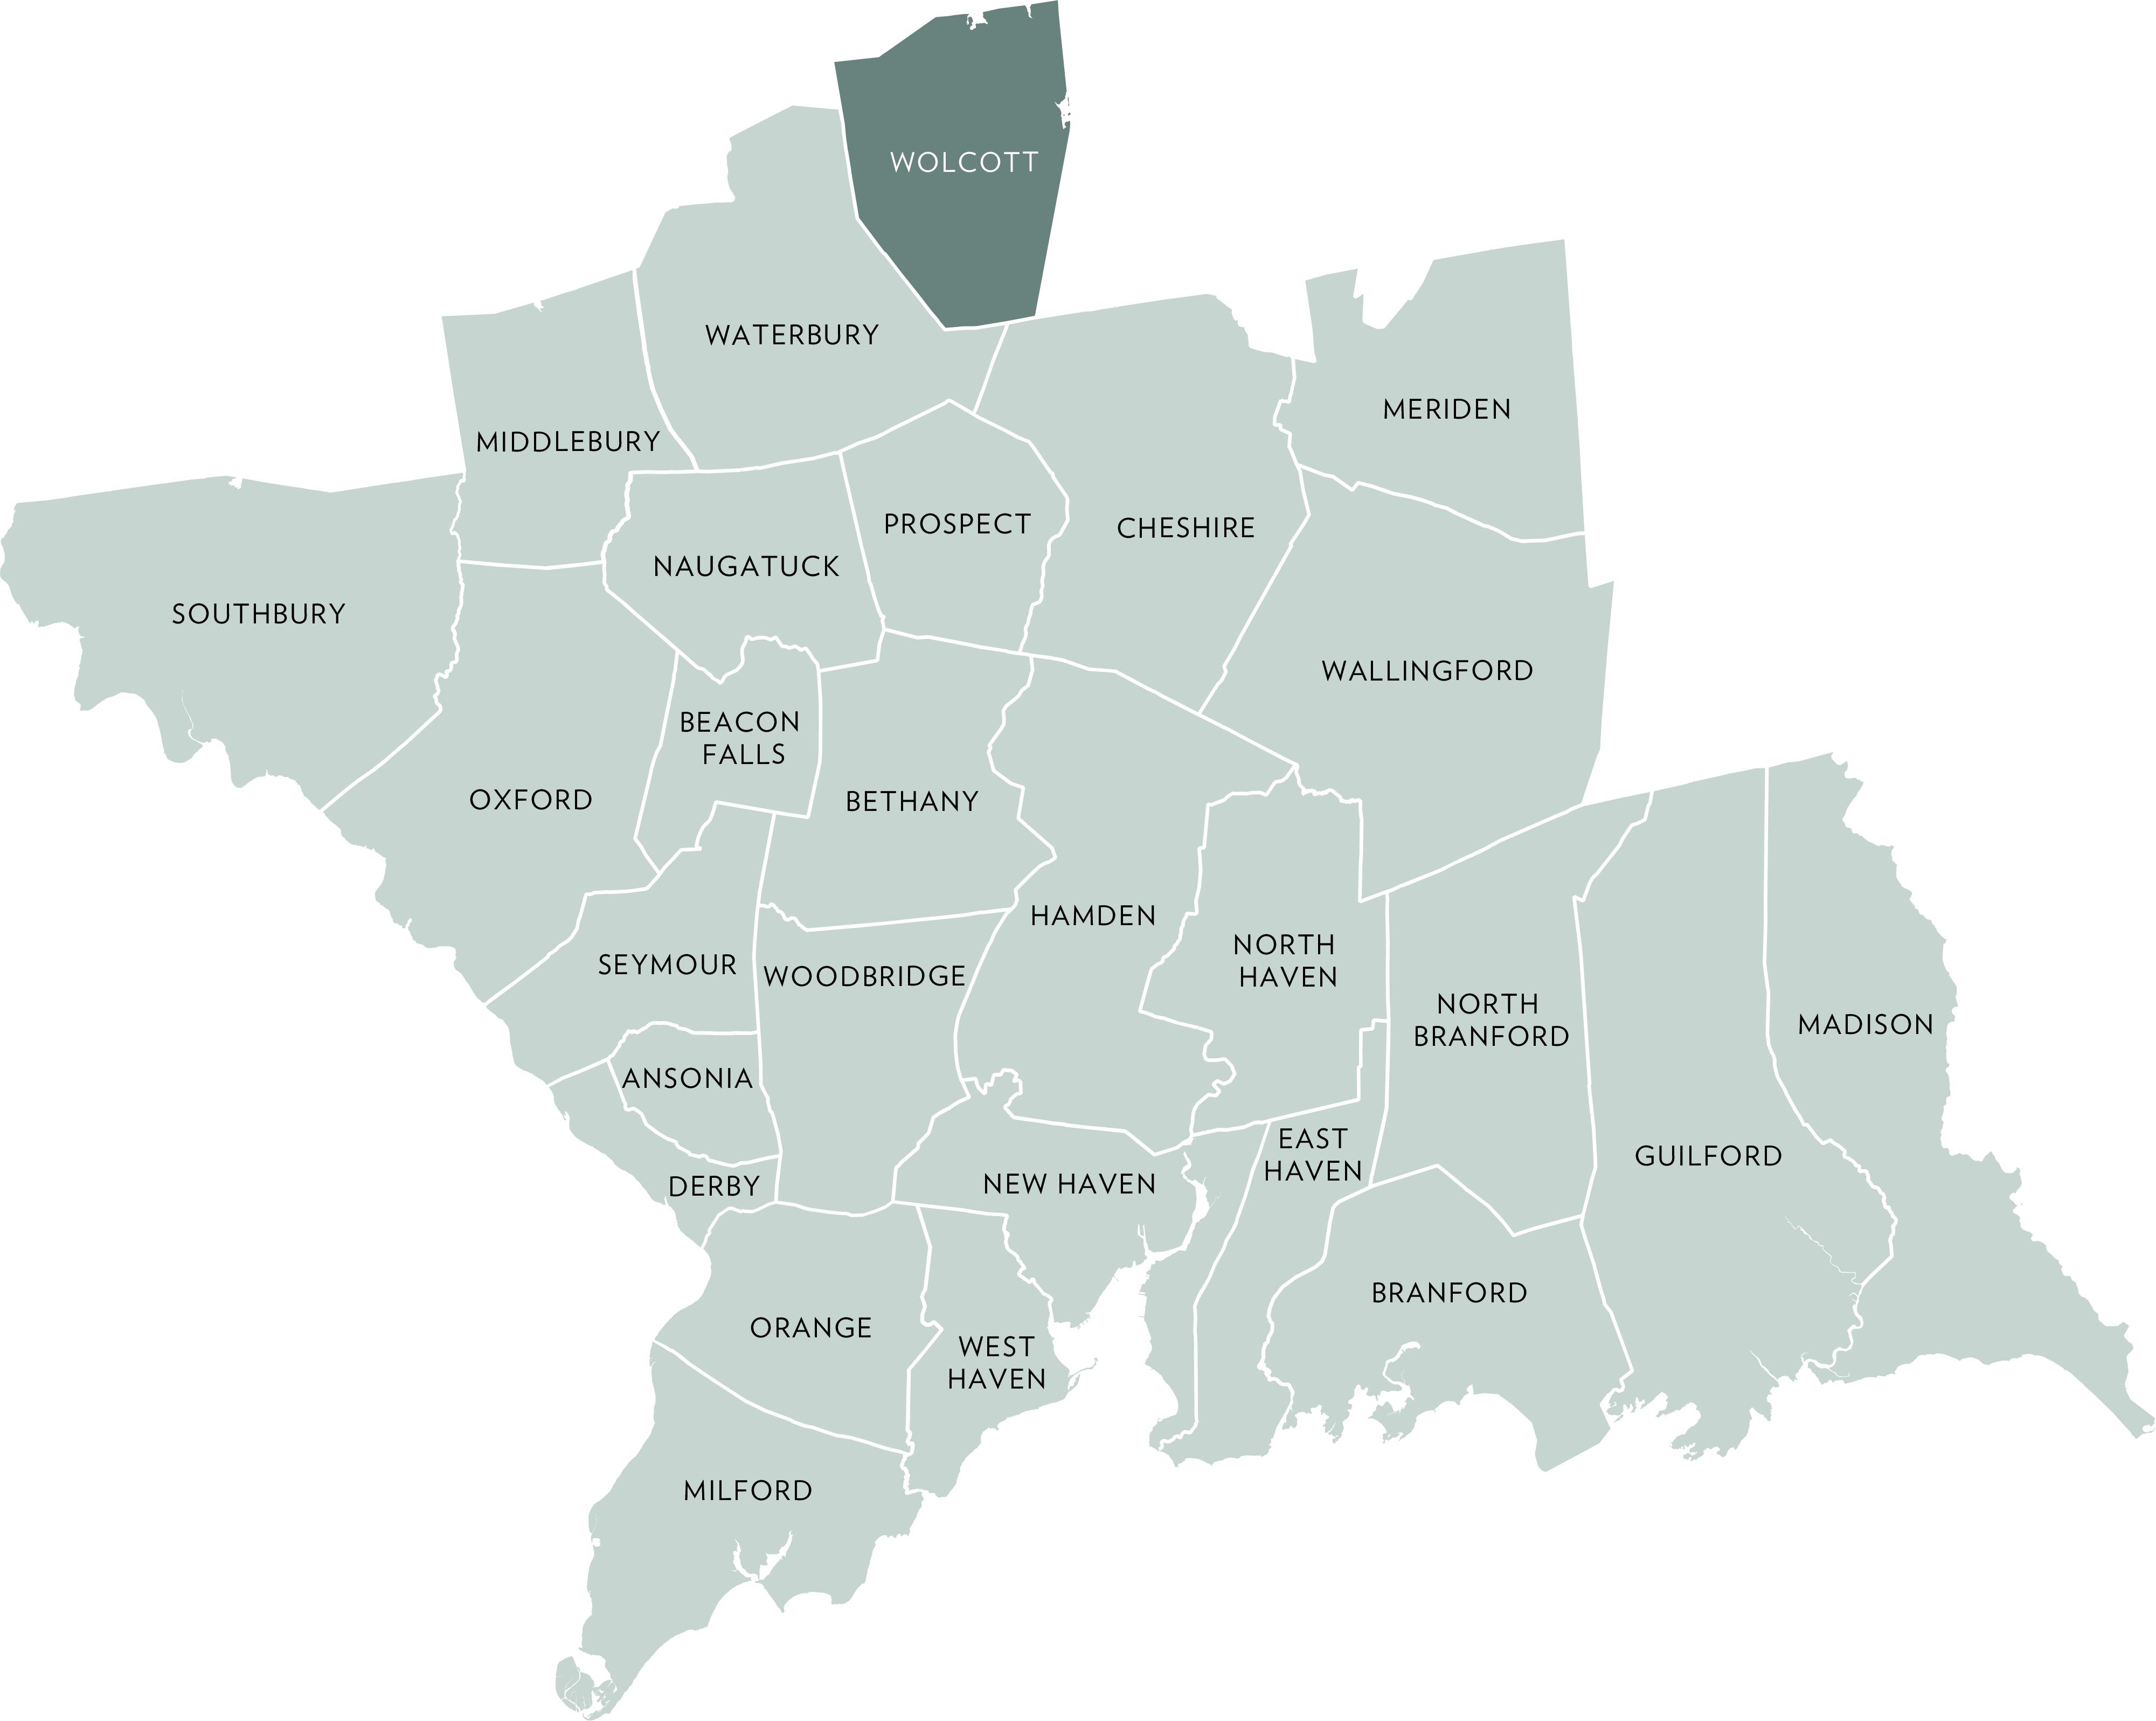
2026 vs Q1- 2025
Source : Smart MLS, Single Family For Sale
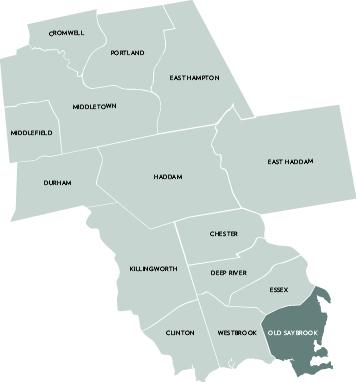
ACTIVE LISTINGS
Q1- 2026 vs Q1- 2025 -40.0%
PENDING LISTINGS
Q1- 2026 vs Q1- 2025 -42.9%
Q1- 2026 vs Q1- 2025 -13.3%
QUARTERLY MARKET OVERVIEW
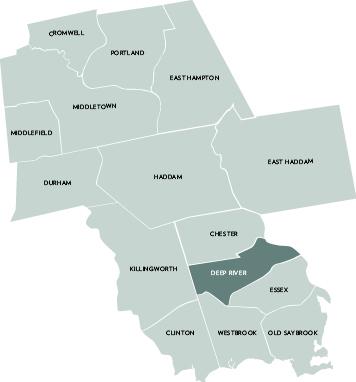
ACTIVE LISTINGS
Q1- 2026 vs Q1- 2025 -40.0%
PENDING LISTINGS
Q1- 2026 vs Q1- 2025 25.0% SOLD LISTINGS
Q1- 2026 vs Q1- 2025 -66.7%
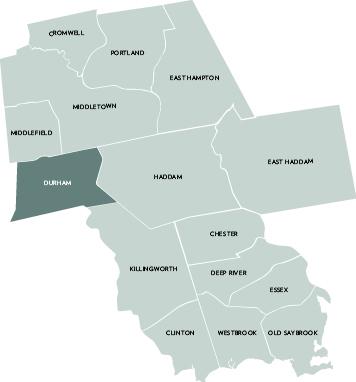
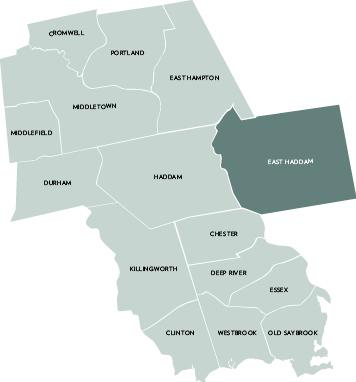
ACTIVE LISTINGS
Q1- 2026 vs Q1- 2025 8.7%
PENDING LISTINGS
Q1- 2026 vs Q1- 2025 -33.3%
LISTINGS
Q1- 2026 vs Q1- 2025 -11.8%
QUARTERLY MARKET OVERVIEW
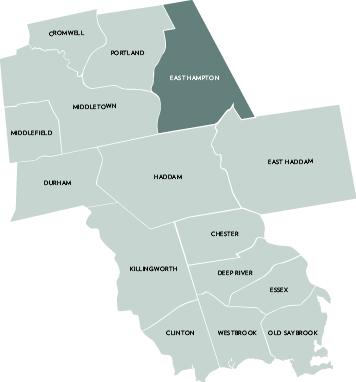
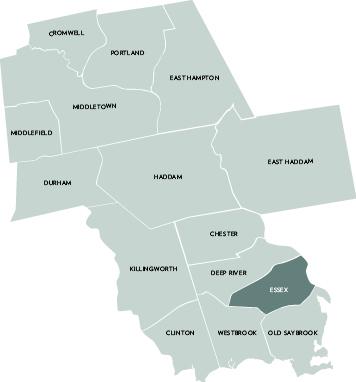
ACTIVE LISTINGS
Q1- 2026 vs Q1- 2025 -8.7%
PENDING LISTINGS
Q1- 2026 vs Q1- 2025 -50.0%
Q1- 2026 vs Q1- 2025 -14.3%
QUARTERLY MARKET OVERVIEW
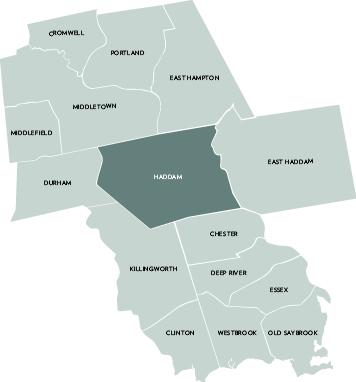
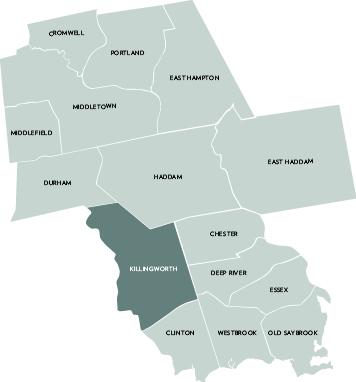
ACTIVE LISTINGS
Q1- 2026 vs Q1- 2025 133.3%
PENDING LISTINGS
Q1- 2026 vs Q1- 2025 -100.0%
Q1- 2026 vs Q1- 2025
30.0%
QUARTERLY MARKET OVERVIEW
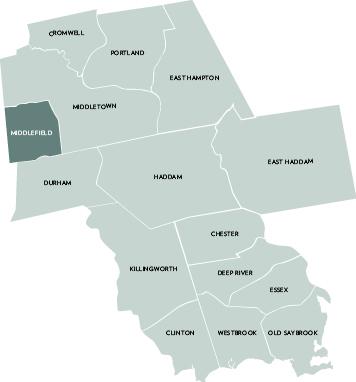
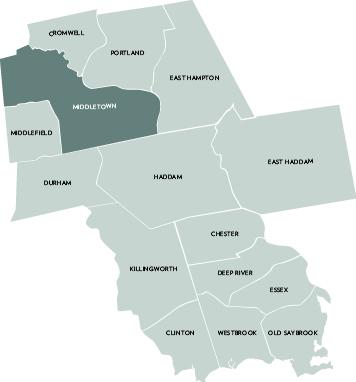
ACTIVE LISTINGS
Q1- 2026 vs Q1- 2025 -16.7%
PENDING LISTINGS
Q1- 2026 vs Q1- 2025 -30.8%
Q1- 2026 vs Q1- 2025 -7.5%
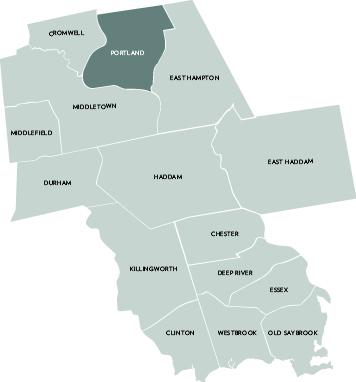
ACTIVE LISTINGS
Q1- 2026 vs Q1- 2025 -65.5%
PENDING LISTINGS
Q1- 2026 vs Q1- 2025 100.0%
Q1- 2026 vs Q1- 2025 44.4%