New York City’s Labor Market Post-COVID: Resilient Recovery and Lingering Losses
By Mario G. Corzo and Vassilios N. Gargalas
The lockdowns and business closures implemented as a response to the COVID-19 pandemic had a major impact on the U.S. economy and labor market.1 Between February and April 2020, the labor force participation rate (LFPR) for the population 16 years or older decreased from 63.3% to 60.1%; employment fell by 13.6%, or 20.5 million jobs, resulting in the largest drop in this vital labor market indicator since its inception in 1939; and the nation’s unemployment rate reached 14.8%, the highest monthly rate reported by the Bureau of Labor Statistics (BLS) since 1948.2
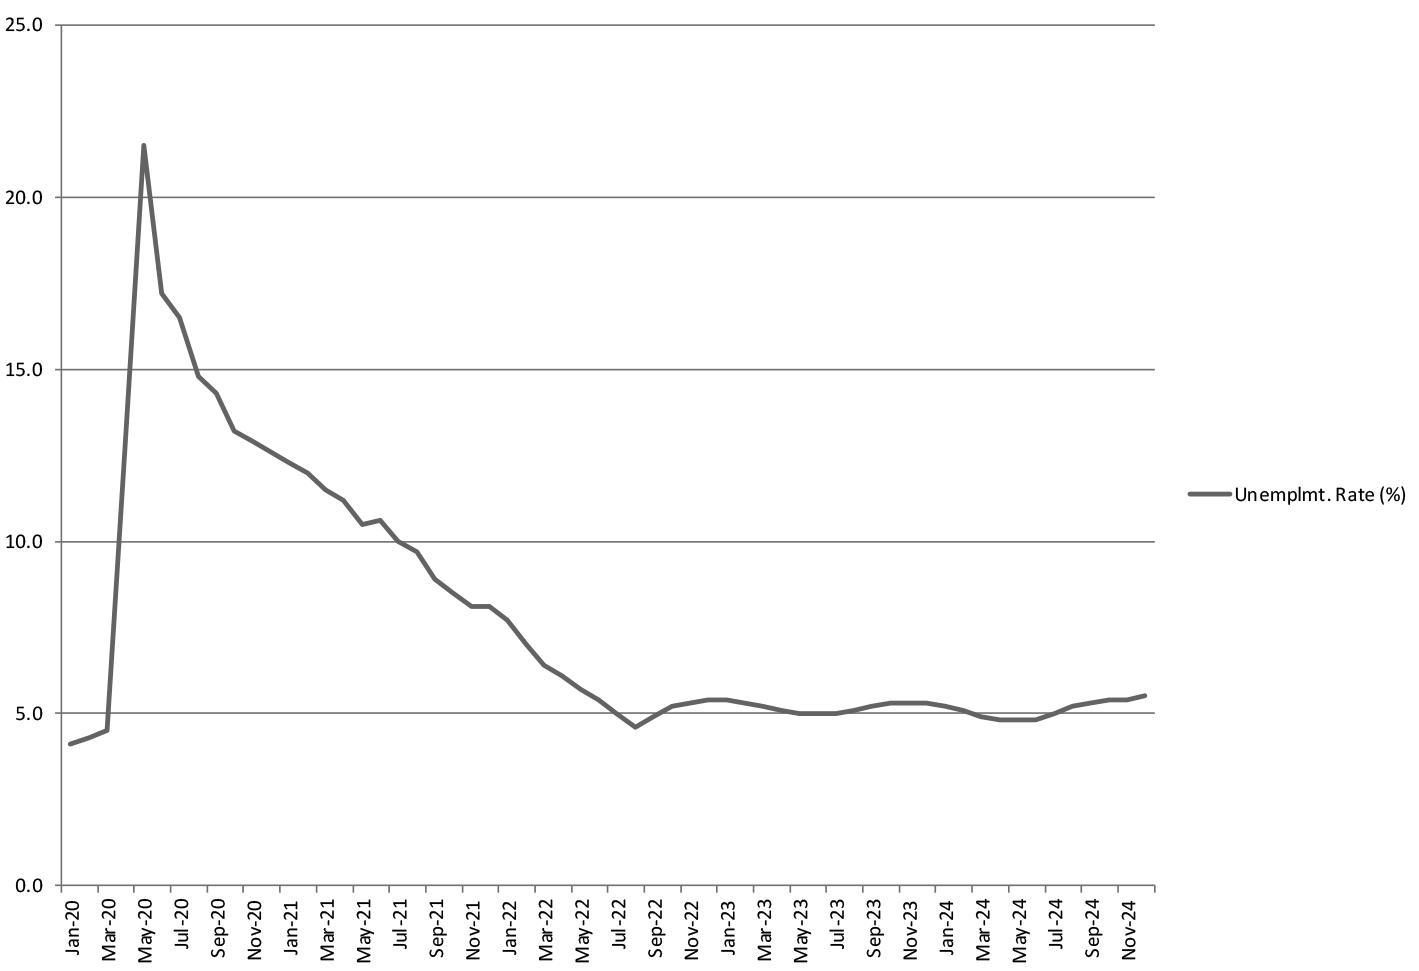
Compared to the rest of the U.S., the labor market effects of the COVID-19 pandemic were significantly larger in New York City (NYC). Between March and May 2020, the City’s economy lost an estimated 915,108 jobs (across all industries and occupations); the unemployment rate (UR) reached a peak of 21.5%, and the labor force participation rate (LFPR) fell from 60.1% to 55.4%, reaching its lowest level since the 2008-2009 financial crisis.
Using seasonally-adjusted data from the New York State Department of Labor, this paper examines the effects of the COVID-19 pandemic on NYC’s labor market. After our introductory overview, we analyze the short-term evolution of six NYC labor market indicators during the worst months of the COVID-19 pandemic (March 2020 – May 2020). We conclude with a brief discussion of the post-pandemic recovery to date.
Peak-Pandemic Job Market Metrics
On March 20, 2020, NY State Governor Andrew Cuomo issued Executive Order No. 202.8, known as the “New York State on PAUSE Order to mitigate the spread of the COVID-19 pandemic.”3 The resulting business shut-downs associated with this measures pandemic had a direct impact on NYC’s economy and its key labor market indicators.
To quantify the immediate (or short-term) labor market effects of the COVID-19 pandemic, we analyze the period between March 2020, when the first cases of COVID-19 were reported in NYC and May 2020, which represents the “peak month” of the pandemic (i.e., the month in which the pandemic’s most significant short-term labor market effects were felt in the City).
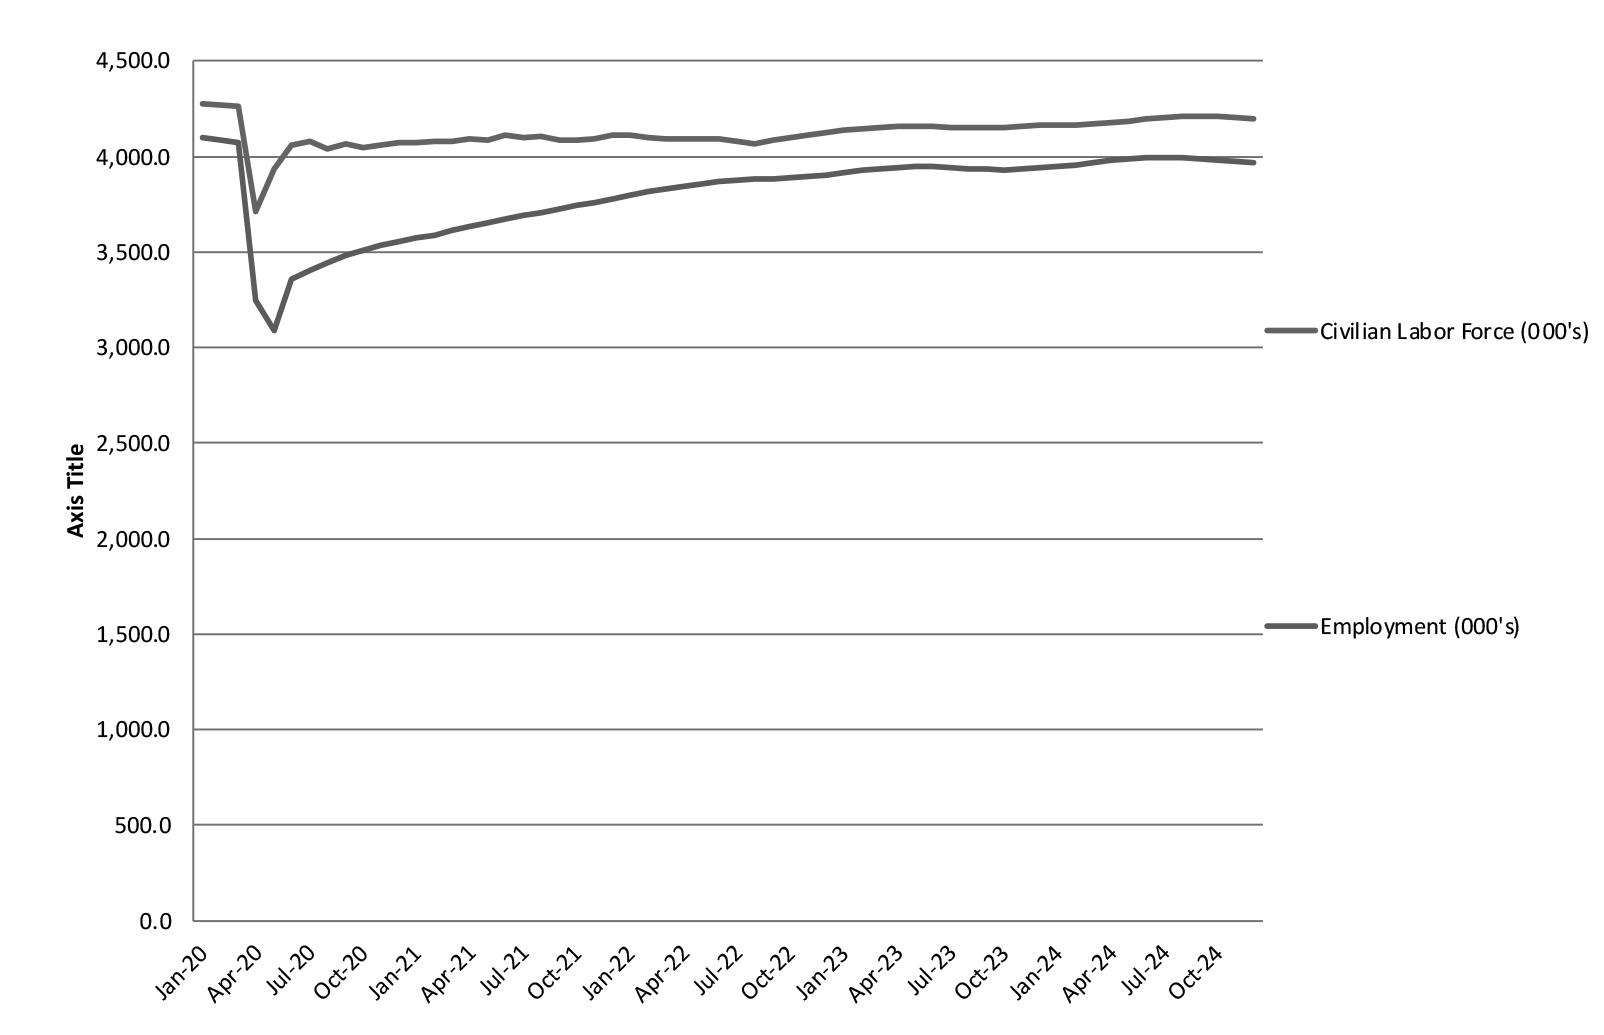
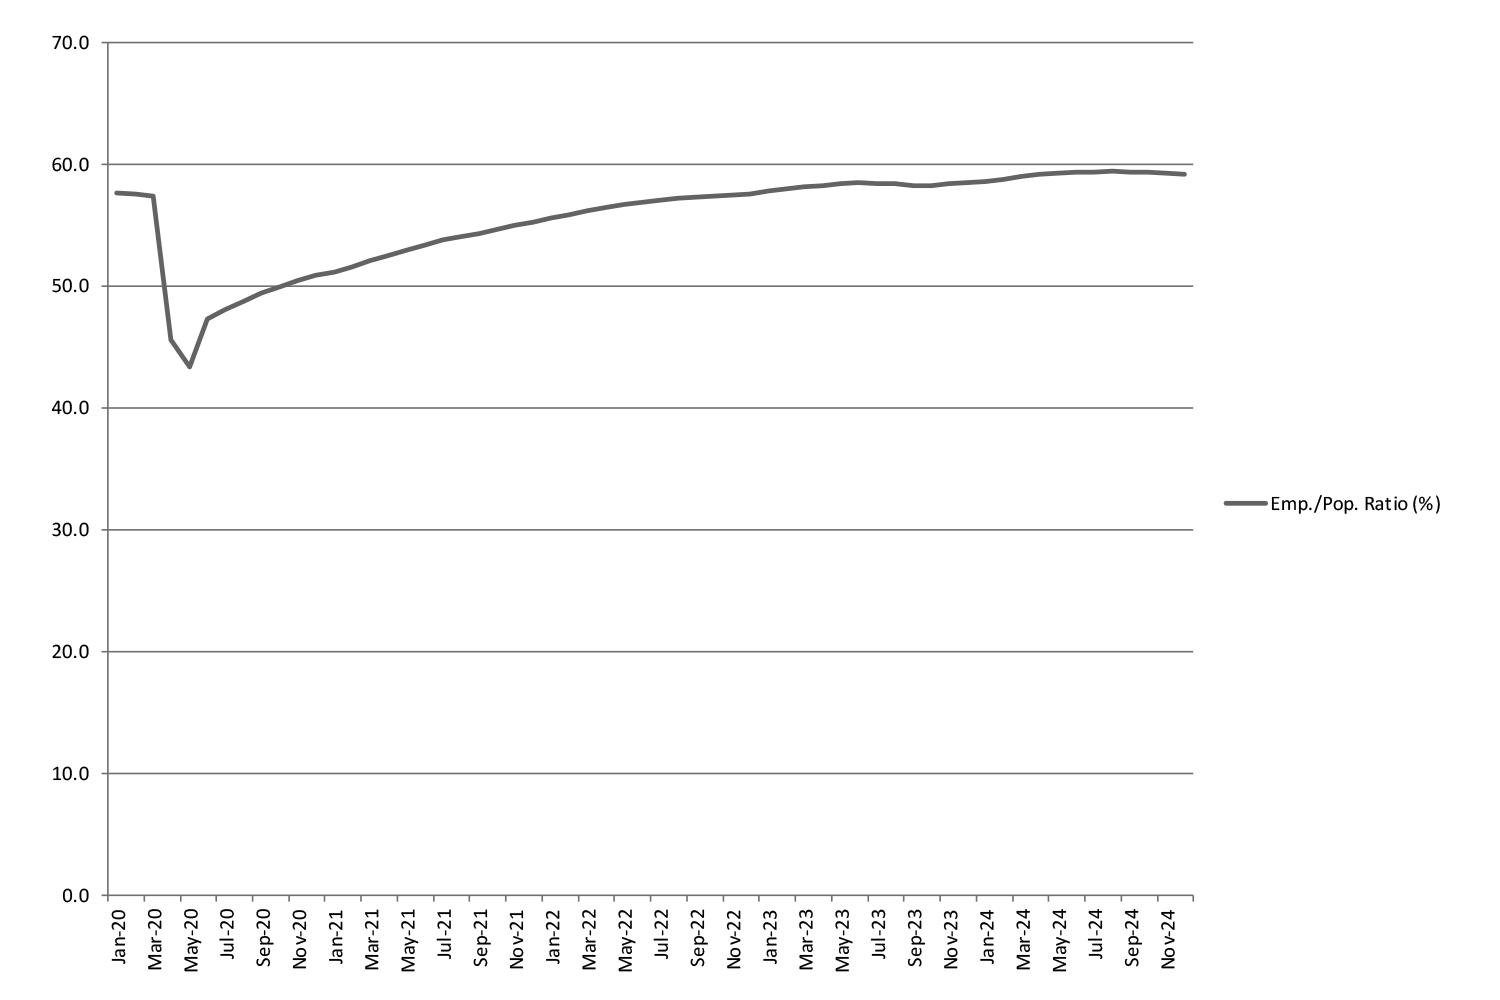
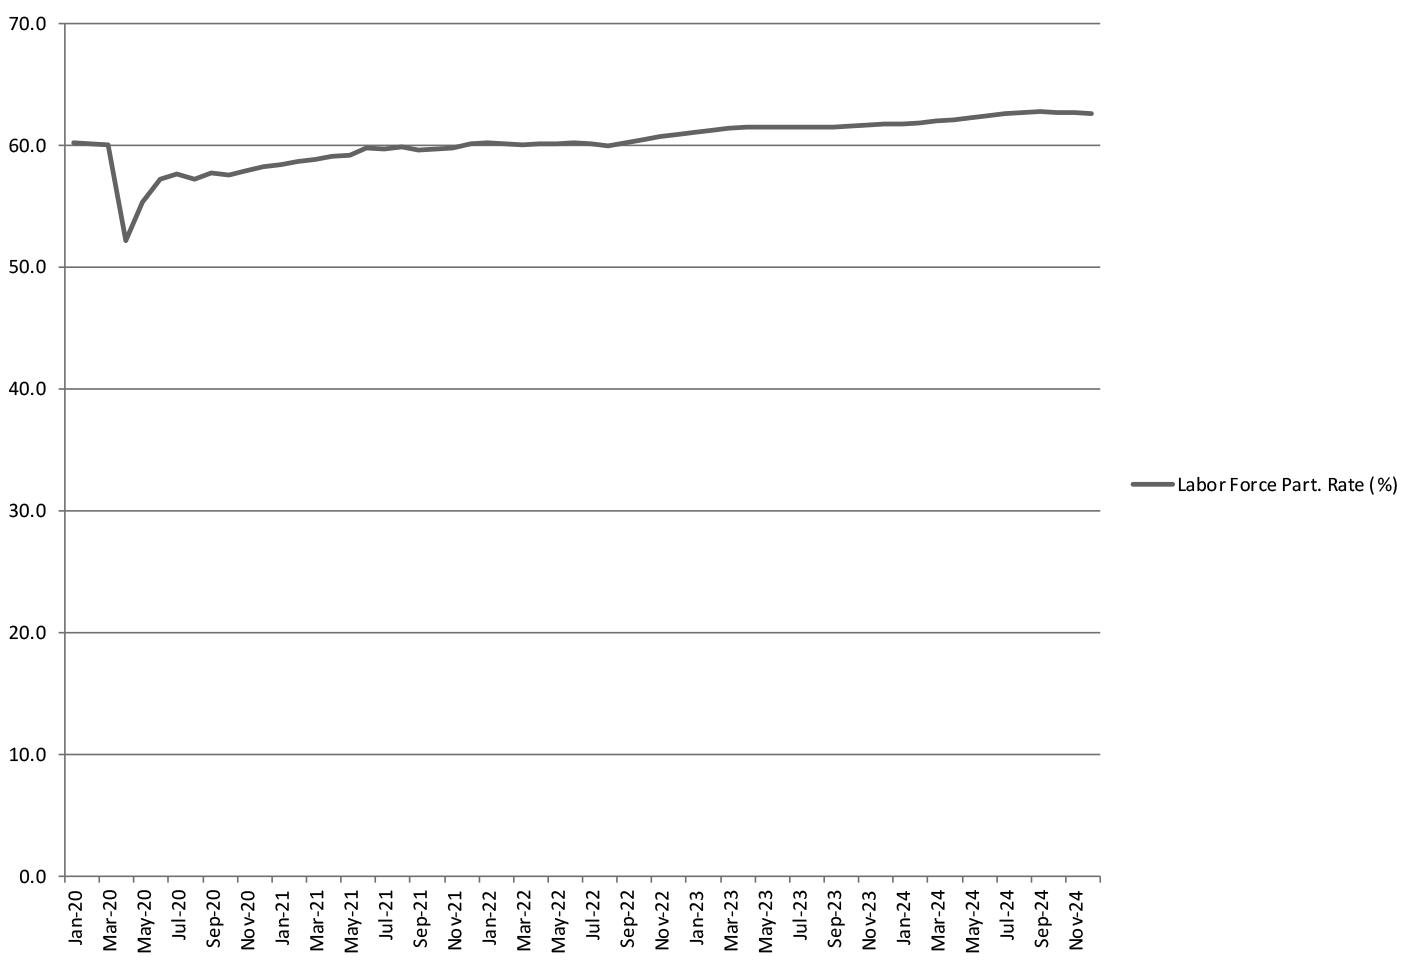
Table 1 and Figures 1 through 4 (below) show the evolution of the six selected key indicators of the labor market (KILMs) in NYC during the 2020-2024 period.
The first labor market indicator analyzed to measure the shortterm COVID-19 labor market effects in NYC during this period is the civilian labor force. Trends in the civilian labor force have a direct impact on economic growth, since it represents the pool of both job seekers and employed individuals engaged in the production of goods and services.4
As Table 1 and Figure 1 illustrate, the onset of the COVID-19 pandemic in March 2020 had an immediate (negative) impact on NYC’s Civilian Labor Force. The City’s civilian labor force declined by 330,100 persons, or 7.7%, during the March-May 2020 period.
Employment, another key driver of economic growth, particularly due to its direct contribution to household (labor) income and consumer spending,5 decreased significantly between March and May 2020. As Table 1 and Figure 1 show, employment in all industries and occupations in NYC fell by 983,600 people, or 24.2%, during this period.
The COVID-19 pandemic also contributed to notable reductions in two commonly-used indicators of participation in the labor force: (1) the employment-population ratio and (2) the labor force participation rate (LFPR). Fluctuations in the former, which measures the proportion of the working age population that is currently employed, can to measure the economy’s (or the labor market’s) ability to provide (or create) jobs for a constant portion of the population.6 The employment-population ratio is a widelyused measure of job growth and due to the nature of its calculation (or formula), it is less cyclical or volatile than other commonly-used labor market indicators, such as LFPR and the unemployment rate (UR).7, 8
As Table 1 and Figure 2 illustrate, between March 2020 and May 2020, NYC’s employment-population ratio fell from 57.4% to 43.4%.
The labor force participation rate, which measures the percentage of the non-institutionalized population, who are employed or are available for work and are seeking employment,9 is another key labor market indicator. The LFPR is influenced by several demographic and economic factors. The most important demographic factors include sex, year of birth, educational attainment (or years of schooling), disability status, marital status, and presence of young children at home.10 The main economic factors that influence the LFPR include federal policies (e.g.,
Source: NY State Dept. of Labor, 2024; authors’ calculations.
education, tax credits, subsidies, etc.), as well as business cycle fluctuations (or periods of contractions and expansions of real GDP growth).11
Between March 2020 and May 2020, the City’s LFPR fell from 60.1% to 55.4%, illustrating the pandemic’s direct (detrimental) effect on the number of New Yorkers engaged in the production of goods and services (Figure 3 and Table 1).
Another key labor market indicator that was significantly impacted by the COVID19 pandemic in NYC was the unemployment rate. This widely-used labor market indicator measures the proportion of the labor force (16 years or older) that is unemployed, but actively searching for work,12 but excludes the institutionalized population (i.e., individuals confined to hospitals, jails, and nursing facilities, as well as members of the armed forces).13
As can be observed in Table 1 and Figure 4 (below), between March 2020 and May 2020, NYC’s unemployment rate increased 4.5% to 21.5%, reaching historically-high levels.
Post-Pandemic Recovery
After reaching their worst levels during the COVID-19 pandemic in May 2020, the six (6) NYC labor market indicators included in our study began to recover. Between May and December 2020, the City’s civilian labor force increased by 3.5% to 4,070,200 persons; employment grew 15.2%, reaching 3,556,800 workers; the number of unemployed New Yorkers fell by 332,900 or 39.3%; the employmentpopulation ratio increased from 43.4% to 50.9%; the labor force participation rate grew from 55.4% to 58.2%; and the unemployment rate fell from 21.5% in to 12.6% (Table 2).
Source: NY State Dept. of Labor, 2024; authors’ calculations.
A comparison with the worst month of the pandemic (i.e. May 2020) demonstrates that NYC’s post-pandemic labor market recovery continues to the present day. As Table 2 demonstrates, between December 2020 and December 2024, NYC’s civilian labor force grew from 4,070,200 persons to 4,195,800, representing an increase of 3.1% during this period. Employment rose 11.5%, from 3,556,800 workers to 3,967,000 and the number of unemployed New Yorkers fell 55.4% from 513,300 in Dec. 2020 to 228,900 in December 2024.
In December 2020, the City had an employment-population ratio of 50.9%; this important indicator of the labor market increased to 59.2% by December 2024. NYC’s labor force participation rate in December 2020 was 58.2%; four years later, the City’s labor force participation rate had increased to 62.6%. Another notable development was the drastic reduction in the City’s unemployment rate between December 2020 and December
2024; this widely-used labor market indicator fell from 8.1% to 5.5% during this period.
The recovery of these important labor market indicators highlight the strength and resiliency of NYC’s economy, and the ability of its labor market to rebound after experiencing the worst pandemic in more than a century. In fact, the City added more than 1 million private sector jobs since May 2020, the worst month (in terms of employment and other key labor market indicators) during the pandemic.14 These post-pandemic private sector job gains have been primarily driven by Health Care and Social Assistance (+195,200), Finance and Insurance (+21,500), and Professional, Scientific, and Technical Services (+13,100).15
How does New York City’s recovery compare to the national pattern? NYC’s leading role as one of the nation’s top centers of post-pandemic private sector job growth is illustrated by the data presented in Table 3.
As Table 3 illustrates, between 2021 and 2022, NYC’s private sector added 321,100 new jobs, representing a growth rate of 8.6%, compared to nationwide private sector job growth rate of 4.5% during the same period.16 Between 2022 and 2023, the City’s private sector created 59,800 new jobs, representing a growth rate of 1.5%, compared to a national level of 2,485,000 private sector jobs, representing a growth rate of 1.9%. Between 2023 and 2024, the number of newly-created private sector jobs reached 76,800, representing growth rate of 1.9% (Table 3).
During the 2020-2021 period, the City’s private sector growth rate (8.6%) was 1.9 greater than the national private sector growth rate (4.5%), underscoring NYC’s rapid labor market recovery. While the City’s private sector job growth rate fell to 1.5% between 2022 and 2023, and to 1.9% between 2023 and 2024; the growth rate for the 2023-24 period (1.9%) was above the national average (1.4%).
Source: NY State Dept. of Labor, 2024; authors’ calculations.
In 2024, NYC’s private sector employment and labor force participation rate reached an all-time of 4,151, 400 and 62.6%,
Source: NY State Dept. of Labor, 2024; authors’ calculations.
respectively.17 These data suggest that at the present time the number of private sector jobs in the City and that the percentage of New Yorkers who are either employed or actively seeking a job have reached historically-high levels.
However, a comparison of the six (6) key NYC labor market indicators included in this study at onset of the pandemic on March 2020 and December 2024 reveals that only two (2)– the
Table 1. New York City (NYC), Selected Labor Market Indicators, Seasonally-Adjusted, 2020-2024
Table 1. New York City (NYC), Selected Labor Market Indicators, Seasonally-Adjusted, 2020-2024
Table 2. New York City (NYC), Selected Labor Market Indicators, Seasonally-Adjusted,
employment-population ratio and the labor force participation rate – have surpassed their pre-pandemic level (Tables 1 and 2).
As Table 2 illustrates, NYC’s civilian labor force of 4,195,800 in December 2024 had 68,100 fewer persons, compared to March 2020. In December 2024, employment (3,967,000) was 2.6% lower than in March 2020 (4,071,300), representing a loss of 104,300 workers. The City had 228,900 unemployed workers in December 2024, compared to 192,700 in March 2020, representing an increase of 18.8%. The unemployment rate in December 2024 was 5.5%, compared to 4.5% in March 2020..
By contrast, by December 2024, the employment-population ratio and the labor force participation rate had recovered from their pre-pandemic levels. The City’s employment population ratio reached 59.2% in December 2024, compared to 57.4% in March 2020. Similarly, in December 2024 the City’s labor force participation rate reached 62.6%, compared to 60.1% in March 2020.increased from 60.1% in March 2020 to 62.6% by December 2024.
However, despite these successes, it is worth noting that it took 19 months (or 1 year and 12 months) for the employment-population ratio to surpass its March 2020 level (on October 2021). As can be observed in Table 1, NYC’s labor force participation rate was able to exceed its March 2020 level for the first time in December
Source: NY State Dept. of Labor, 2024; authors’ calculations.
2021 (or 21 months or a 1 year and 9 months after the start of the COVID-19 pandemic).
Conclusions
As the epicenter of the COVID-19 pandemic, compared to the rest of the U.S., the City of New York experienced disproportionally large labor market effects. The U.S. labor force participation rate fell to 60.1% in May 2020 (the peak month of the pandemic), compared to 55.4% in NYC. In May 2020, the City’s unemployment rate reached a historic 21.5%, compared to 13.3% nationwide.
Other key labor market indicators for the City deteriorated rapidly during the worst months of the COVID- 19 pandemic (i.e., between March and May 2020). These included popular measures of the labor force by employment status (e.g., the civilian labor force, and the number of employed and unemployed workers), as well as measures of labor force participation, employment, and unemployment (e.g., the employment-population ratio, the labor force participation rate, and the unemployment rate).
After experiencing sharp short-term declines during the MarchMay 2020 period, NYC’s key labor market indicators began their gradual recovery (after May 2020), highlighting the strength and resiliency of the City’s economy and the dynamic nature of its labor market. Between 2021 and 2022, the
created
Table 3. Private Sector Job Growth, 2021-2024
Source: New York City Economic Development Corporation (NYCED) , 2024; authors’ calculations
almost 2 times greater than the national growth rate of private sector job creation (4.5%) during the same period. During the 2023-24 period, NYC’s private sector job growth rate (1.9%) remained above the national level (1.4%).
The principal sectors accounting for NYC’s post-pandemic private sector job growth were Health Care and Social Assistance (195,200 jobs), Finance and Insurance (13,100 jobs), and Professional, Scientific, and Technical Services (13,100 jobs).
However, despite these impressive private sector job growth figures, demonstrating NYC’s overall attractiveness as a global center of business and finance, and its relatively competitive, dynamic, innovative, and resilient economy, it is worth noting that by December 2024 only two (2) out of the six (6) key labor market indicators included in this study (i.e., the employment population ratio and the labor force participation rate) had surpassed their pre-pandemic (March 2020) levels.
APPENDIX
Labor Market Indicators
The six key indicators of the labor market (KILMs) in NYC included in our study are grouped in two (2) categories:
1) Composition of the labor force (or economically-active population) by employment status, and 2) Measures of participation in the labor force, employment, and unemployment.
The first category includes the following metrics (or indicators):
1) Civilian Labor force (LF): The labor force (LF) includes all persons 16 years of age or older, who are classified as either: (1) employed (E) or (2) unemployed (U); it represents the number of people, who are currently working (or employed) and those who are unemployed, but are actively looking for work.18
2) Employed (E): This component of the labor force (LF) includes individuals who: (1) worked at least 1 hour as paid employees (i.e., “wage and salary workers”) during the past week, (2) worked at least 1 hour in their own business, farm, profession, or trade (i.e., “self-employed workers”), (3) were absent from their job, business, or farm on a temporary basis, whether or not they were remunerated for the time off (i.e., “with a job,
not at work”), and (4) individuals who worked without pay for a minimum of 15 hours in a business or farm owned by a member of their family (i.e., “unpaid family workers”).19 Individuals engaged in volunteer activities, unpaid internships, unpaid training activities, passive investment activities (i.e., ownership of a business, farm, solely for investment purposes), on reserve at the National Guard, and those engaged in non-market, or household-based, productive activities are excluded from the employed (E) classification.20
3) Unemployed (U): A person who did not work during the past week, but was actively looking for work during the previous 4-week period, or was temporary laid off is classified as unemployed (U).21 Individuals waiting to start a new job, who were not actively looking for work during the last 4-week period, are classified as “not in the labor force” (i.e., they are not counted as unemployed [U]).22
The second category includes the following measures of participation in the labor force, employment, and unemployment:
4) Employment-population ratio (EPR): The employment population ratio represents the portion of total civilian employment to the civilian non-institutionalized population, 16 years of age or older. It measures the portion of the population that is employed (i.e., currently involved in producing goods and services).23
5) Labor force participation rate (LFPR): The labor force participation rate (LFPR) measures the percentage of people participating in the labor force, or economically-active population (EAP).24 The LFPR is calculated as follows:
LFPR=(E+U )/P (1)
Where:
E represents the number of people classified as employed. U represents the number of people classified as unemployed. P represents the civilian non-institutionalized population, 16 years or older.25
6) Unemployment Rate (UR): The unemployment rate (UR) represents the ratio of unemployed persons as a percentage of the labor force (LF). The officially-reported unemployment rate (UR), known as the U-3 unemployment rate, provides a measure of the underutilization of the labor force.26 However, it is an imperfect measure. Workers who have dropped out of the labor force because they have been unable to find a job (“discouraged workers”) are not counted as being unemployed.27 The official unemployment rate also counts other workers as employed even though they are working part-time (i.e., less than 40 hours per week) and would have preferred to work on a full-time basis (i.e., 40 hours per week or more).
The unemployment rate (UR) is calculated as follows: UR=(U )/LF= (U )/(E+U) (2)
Where:
E represents the number of people classified as employed. U represents the number of people classified as unemployed. LF represents the labor force (i.e., the sum of the employed and unemployed), which is also known as the economically-active population (EAP).
Mario G. Corzo and Vassilios N. Gargalas are professors in the Department of Finance, Information Systems, and Economics, School of Business, Lehman College, The City University of New York (CUNY)
REGIONAL LABOR REVIEW, vol. 27, no. 2 (Spring/Summer 2025). © 2025 Center for the Study of Labor and Democracy, Hofstra University.
NOTES
1 Congressional Research Service (CRS). COVID-19 and the U.S Economy, R46606, 2021 (11/05/2024): https://crsreports. congress.gov
2 U.S. Bureau of Labor Statistics (BLS). Labor Market Dynamics during the COVID-19 Pandemic, 2022 (10/15/24): https://www.bls.gov/ blog/2022/labor-market-dynamics-during-the-covid-19-pandemic
3 New York State Department of Financial Services (DFS). A Study of the Impact of the COVID-19 Pandemic on Business in New York, 2022 (10/15/2024): https://www.dfs.ny.gov/system/files/ documents/2022/12/covid_rpt_impact_business_ny_202212.pdf
4 Daly, C. L abor Force Participation and the Prospects for U.S. Growth, 2007 (10/15/2024): https://www.frbsf.org/research-andinsights/publications/economic-letter/2007/11/labor-forceparticipation-us-growth/
5 Blanchard, Olivier. Macroeconomics, 3rd Ed. (Upper Saddle River, NJ: Prentice Hall, 2003).
6 Boyd Leon, C. The Employment-Population Ratio: Its Value in Labor Force Analysis, Monthly Labor Review, 1981 (10/15/2024): https:// www.bls.gov/opub/mlr/1981/02/art4full.pdf
7 Boyd Leon, C. The Employment-Population Ratio: Its Value in Labor Force Analysis, Monthly Labor Review, 1981 (10/15/2024): https:// www.bls.gov/opub/mlr/1981/02/art4full.pdf
8 Donovan, Sarah, A. An Overview of the Employment-Population Ratio, Congressional Research Service (CRS) (R4405) (7/15/2024): https://crsreports.congress.gov/product/details?prodcode=R44055
9 Congressional Budget Office (CBO). Factors Affecting the Labor Force Participation of People 25-54, 2018 (11/20/24): https:// www.cbo.gov/publication/53452
10 Congressional Budget Office (CBO). Factors Affecting the Labor Force Participation of People 25-54, 2018 (11/20/24): https:// www.cbo.gov/publication/53452
11 Congressional Budget Office (CBO). Factors Affecting the Labor Force Participation of People 25-54, 2018 (11/20/24): https:// www.cbo.gov/publication/53452
12 Fagan, Doreen. Different Measures of Unemployment: Is There Just One Number to Watch?, Federal Reserve Bank of St. Louis, 2018 (7/15/2024): https://www.stlouisfed.org/open-vault/2018/june/ unemployment-number-to-watch
13 Aaronson, Stephanie. What Does the Unemployment Rate Measure?, Brookings Institution, 2021 (7/15/2024): https://www. brookings.edu/articles/what-does-the-unemployment-rate-measure/
14 New York City Economic Development Corporation (NYCED). State of the NYC Economy, 2024 (1/17/2025): https://www. NYCEDC-State-of-the-NYC-Economy-2024-v3.pdf
15 New York City Economic Development Corporation (NYCED). State of the NYC Economy, 2024 (1/17/2025): https://www. NYCEDC-State-of-the-NYC-Economy-2024-v3.pdf
16 Between 2021-2022, private sector jobs in the U.S. increased by 5,616,000, representing a growth rate of 4.5%, which was 4.1 percentage points below NYC’s private sector growth rate (8.6%) during the same period. (Table 3)
17 New York City Economic Development Corporation (NYCED). State of the NYC Economy, 2024 (1/17/2025): https://www. NYCEDC-State-of-the-NYC-Economy-2024-v3.pdf
18 Borjas, George, J. Labor Economics, 7th Ed. (New York: McGraw Hill, 2016).
19 U.S. Bureau of Labor Statistics, Labor Force Statistics from the Current Population Survey: Concepts and Definitions, 2024 (6/01/2024): https://www.bls.gov/cps/definitions.htm#population
20 U.S. Bureau of Labor Statistics, Labor Force Statistics from the Current Population Survey: Concepts and Definitions, 2024 (6/01/2024): https://www.bls.gov/cps/definitions.htm#population
21 Mishkin, Frederic, S. Macroeconomics: Policy and Practice, 2nd Ed (New York: Pearson, 2015).
22 U.S. Bureau of Labor Statistics, Labor Force Statistics from the Current Population Survey: Concepts and Definitions, 2024 (6/01/2024): https://www.bls.gov/cps/definitions.htm#population
23 Donovan, Sarah, A. An Overview of the Employment-Population Ratio, Congressional Research Service (CRS) (R4405), 2015, (7/15/2024): https://crsreports.congress.gov/product/ details?prodcode=R44055
24 Congressional Research Service, The Labor Force Participation Rate (IF12615)(3/31/2024): https://crsreports.congress.gov/ product/details?prodcode=IF12615
25 The civilian non-institutionalized population (P) includes the population 16 years of age or older and is commonly-known as the “working age population.” It excludes active members of the U.S. armed forces and “institutionalized individuals” (e.g., people in jails, prisons, or other correctional facilities or detention centers and individuals living in institutionalized care facilities, such as nursing homes, etc.).
26 St. Louis Fed, FRED, Unemployment Rate. (10/31/2024): https:// fred.stlouisfed.org/series/UNRATE
27 Mishkin, Frederic, S. Macroeconomics: Policy and Practice, 2nd Ed. (New York: Pearson, 2015).