LOCAL LABOR MARKET CONDITIONS
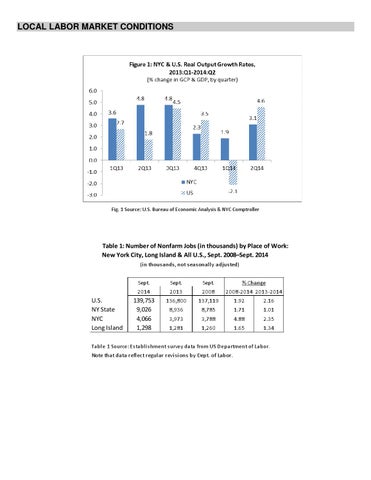
Fig. 1 Source: U.S. Bureau of Economic Analysis & NYC Comptroller
Table 1: Number of Nonfarm Jobs (in thousands) by Place of Work: New York City, Long Island & All U.S., Sept. 2008–Sept. 2014 (in thousands, not seasonally adjusted) Sept.
U.S. NY State NYC Long Island
Sept.
Sept.
% Change 2008-2014 2013-2014
2014
2013
2008
139,753 9,026 4,066 1,298
136,800
137,119
1.92
2.16
8,936
8,785
1.71
1.01
3,973
3,788
4.88
2.35
1,281
1,260
1.65
1.34
Tabl e 1 Source: Es ta bl i s hment s urvey data from US Depa rtment of Labor.
Note that data reflect regular revisions by Dept. of Labor.
Table 2: Civilian Labor Force, Employment & Unemployment (i n thous a nds , not s ea s onal l y a djus ted)
Labor Force
Employed
Unemployed
Unemp. Rate
Sept.
Sept.
Sept.
Sept.
Sept.
Sept.
Sept.
Sept.
AREA
2014
2013
2014
2013
2014
2013
2014
2013
U.S.
155,903
155,536
146,941
144,651
8,962
10,885
5.7%
7.0%
NYC Bronx Brooklyn Manhattan Queens Staten Island
4,071.6 555.0 1,157.8 957.8 1,155.5 245.6
4,057.1 558.0 1,157.0 950.9 1,147.9 243.2
3,822.6 507.6 1,081.0 909.1 1,093.0 231.9
3,711.4 492.9 1,049.6 882.6 1,061.2 225.1
249.0 47.4 76.8 48.7 62.5 13.7
345.7 65.1 107.4 68.3 86.7 18.1
6.1 8.5 6.6 5.1 5.4 5.6
8.5 11.7 9.3 7.2 7.6 7.4
LONG ISLAND Nassau Co. Suffolk Co.
1,459.4 684.2 775.2
1,519.4 709.6 809.8
1,389.6 652.2 737.4
1,425.8 668.0 757.8
69.8 32.0 37.8
93.6 41.6 52.0
4.8 4.7 4.9
5.9 5.8 6.1
Table 2 source: CPS household survey data from NYS Dept. of Labor. Data reflect regular revisions by Dept. of Labor
Table 3: Weekly Wage Growth by County, 2013-14 Avg. Wage/week
Rank
% Chg
Counties
2014
2013-14
by %chg
U.S.
$1,027
3.8
Bronx Brooklyn Manhattan Queens Staten Island
$881 $760 $2,749 $911 $802
2.2 0.8 12.0 1.3 1.8
199 296 2 268 230
LONG ISLAND Nassau Co. Suffolk Co.
$1,091 $1,029
1.8 -0.4
230 329
AREA
Table 3 Source: 2013:Q1-2014:Q1 wages in BLS QCEW establishment survey (9/18/14)
Figure 3 NYC Job Growth by Industry: Sept. 2013 – Sept. 2014 (in thousands of jobs, and percent change) 100
TOTAL 2.4% Services 3.6%
80
60
Jobs 40
GOVT
Constcn.
Wh. Trade
-0.4%
1.9%
0.2%
TWU 0.8%
Manf.
Retail
FIRE
0.3%
4.6%
1.7%
Information -2.2%
20
0
-20
Figure 4 Long Island Job Growth by Industry: Sept. 2013 – Sept. 2014 (in thousands of jobs, and percent change) 20 TOTAL 1.3%
15
Services 2.2%
10
TWU 2.5%
Constcn.
Jobs
Retail
4.0% 5
GOVT -1.1%
2.5 Wh. Trade 2.1%
Manf. -1.9%
0
-5
© 2014 Center for the Study of Labor and Democracy, Hofstra University
FIRE
Info
-2.0%
-1.3%