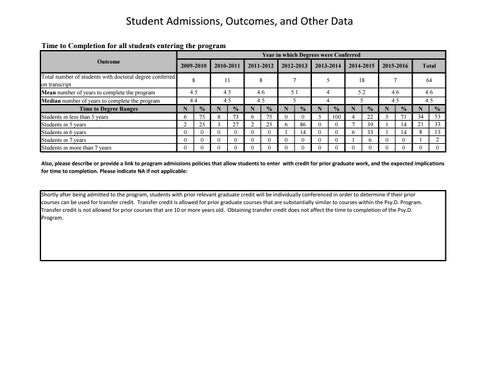
Student Admissions, Outcomes, and Other Data Time to Completion for all students entering the program Year in which Degrees were Conferred Outcome Total number of students with doctoral degree conferred on transcript Mean number of years to complete the program Median number of years to complete the program Time to Degree Ranges Students in less than 5 years Students in 5 years Students in 6 years Students in 7 years Students in more than 7 years
2009-2010
2010-2011
2011-2012
2012-2013
2013-2014
2014-2015
2015-2016
Total
8
11
8
7
5
18
7
64
4.5 4.4
4.5 4.5
4.6 4.5
5.1 5
4 4
5.2 5
4.6 4.5
4.6 4.5
N 6 2 0 0 0
% 75 25 0 0 0
N 8 3 0 0 0
% 73 27 0 0 0
N 6 2 0 0 0
% 75 25 0 0 0
N 0 6 1 0 0
% 0 86 14 0 0
N 5 0 0 0 0
% 100 0 0 0 0
N 4 7 6 1 0
% 22 39 33 6 0
N 5 1 1 0 0
% 71 14 14 0 0
N 34 21 8 1 0
% 53 33 13 2 0
Also, please describe or provide a link to program admissions policies that allow students to enter with credit for prior graduate work, and the expected implications for time to completion. Please indicate NA if not applicable:
Shortly after being admitted to the program, students with prior relevant graduate credit will be individually conferenced in order to determine if their prior courses can be used for transfer credit. Transfer credit is allowed for prior graduate courses that are substantially similar to courses within the Psy.D. Program. Transfer credit is not allowed for prior courses that are 10 or more years old. Obtaining transfer credit does not affect the time to completion of the Psy.D. Program.
Student Admissions, Outcomes, and Other Data
Program Costs st
Description Tuition for full-time students (in-state) Tuition for full-time students (out-of-state) Tuition per credit hour for part-time students (if applicable enter amount; if not applicable enter "NA" ) University/institution fees or costs Additional estimated fees or costs to students (e.g. books, travel, etc.)
2016-2017 1 -year Cohort Cost 42,160 42,160 1,240 450 per term 500 per term
Internship Placement - Table 1 Year Applied for Internship OutcomeÂ
2009-2010
2010-2011
2011-2012
2012-2013
2013-2014
2014-2015
2015-2016
N
%
N
%
N
%
N
%
N
%
N
%
N
%
Students who obtained APA/CPA-accredited internships
0
0
0
0
0
0
0
0
0
0
0
0
0
0
Students who obtained APPIC member internships that were not APA/CPA-accredited (if applicable)
0
0
0
0
0
0
0
0
0
0
0
0
0
0
Students who obtained other membership organization internships (e.g. CAPIC) that were not APA/CPAaccredited (if applicable)
0
0
0
0
0
0
0
0
0
0
0
0
0
0
Students who obtained internships conforming to CDSPP guidelines that were not APA/CPA-accredited (if applicable)
9
41
10
50
7
33
9
53
8
44
9
50
11
50
Students who obtained other internships that were not APA/CPA-accredited (if applicable)
13
59
10
50
14
67
8
47
10
56
9
50
11
50
Students who obtained any internship
22
100
20
100
21
100
17
100
18
100
18
100
22
100
Students who sought or applied for internships including those who withdrew from the application process
22
-
20
-
21
-
17
-
18
-
18
-
22
-
Internship Placement - Table 2 Year Applied for Internship  Outcome
Students who sought or applied for internships including those who withdrew from the application process Students who obtained paid internships Students who obtained half-time internships* (if applicable)
2009-2010
2010-2011
2011-2012
2012-2013
2013-2014
2014-2015
2015-2016
N
%
N
%
N
%
N
%
N
%
N
%
N
%
22
-
20
-
21
-
17
-
18
-
18
-
22
-
13
59
10
50
14
67
8
47
10
56
9
50
11
50
20
91
19
95
17
81
17
100
17
94
18
100
21
95
Attrition Year of First Enrollment Variable
2009-2010
2010-2011
2011-2012
2012-2013
2013-2014
2014-2015
2015-2016
N
%
N
%
N
%
N
%
N
%
N
%
N
%
Students for whom this is the year of first enrollment (i.e. new students)
12
-
11
-
11
-
12
-
13
-
11
-
10
-
Students whose doctoral degrees were conferred on their transcripts
11
92
10
91
7
64
3
25
0
0
0
0
0
0
Students still enrolled in program
0
0
0
0
2
18
8
67
12
92
11
100
9
90
Students no longer enrolled for any reason other than conferral of doctoral degree
1
8
1
9
2
18
1
8
1
8
0
0
1
10
Licensure Outcome The total number of program graduates (doctoral degrees conferred on transcript) between 2 and 10 years ago The number of these graduates (between 2 and 10 years ago) who became licensed psychologists in the past 10 years Licensure percentage
2006-2016 100 66 66%