Executive Summary
In 2025, Fire Rescue responded to 10,040 total incidents, representing a slight increase of 25 calls over 2024. While overall call volume remained stable, notable shifts occurred within response categories, workload distribution, and performance outcomes.
Incident Trends and System Demand
• EMS incidents increased by 181 calls (+2.5%), totaling 7,448 responses and continuing to drive overall system demand (74% of total incidents).
• Fire incidents decreased by 130 calls (-5.1%), while Rescue (-21) and HazMat (-5) incidents also declined slightly.
• Call volume peaked during the afternoon hours (12:00–17:59), accounting for 3,509 incidents (35% of total activity).
Key themes emerging from the data include:
• Continued growth in EMS demand, particularly low acuity and moderate-risk incidents.
• Geographic workload concentration in SPZ 1 and SPZ 5.
• Strong system adaptability during simultaneous incidents.
• Improved hospital turnaround efficiency.
• Slight EMS turnout time opportunities for continued performance improvement.
Overall, Fire Rescue maintains high reliability and effective deployment performance while adapting to increasing EMS demand and fluctuating geographic workload distribution.
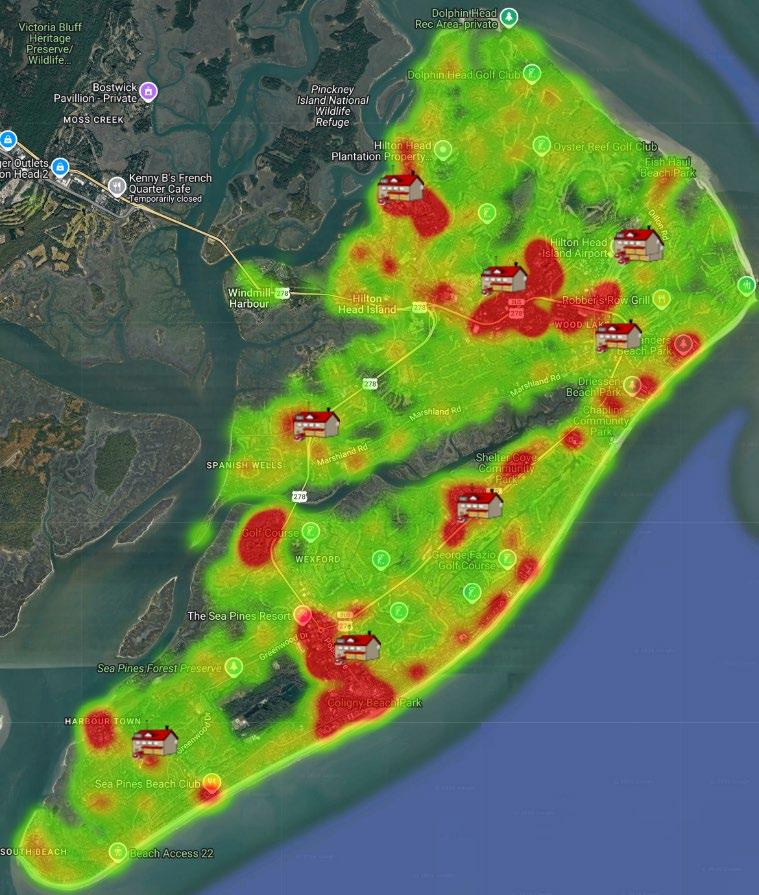
by Station Planning Zone
2024 & 2025 Incidents – Heat Map

Incidents by Risk
The number of incidents by risk level for each of the four response classes.
20 Year Incident Count


Responses by Apparatus by Shift
This table represents the number of incidents each apparatus responded to by shift. The highlighted numbers indicate the unit/shift with the most responses.
Busiest Units
Based on the table above.
Incidents by Time of Day
– 05:59 (12:00AM – 5:59AM)
– 11:59 (6:00AM – 11:59AM)
12:00 – 17:59 (12:00PM – 5:59PM)
18:00 – 23:59 (6:00PM – 11:59PM)
Incidents by Hour of the Day
Simultaneous Incidents by Station Planning Zone
This table represents the number of times additional incidents occurred within an SPZ. For example, SPZ 1 had one incident occur, then a second was dispatched before the first incident was completed 230 times in 2025.
Medic Unit – Station Planning Zone Reliability
All Incidents – Medic Units
This table compares how often Medic units from one SPZ responded to EMS incidents within and outside their SPZ. For clarification, Medic 1 responded to 69 incidents in SPZ2, 11 in SPZ3, etc. Reliability is the percentage of time the Medic unit was available to respond to an incident within their SPZ.
Medic
Engine - Station Planning Zone Reliability
All Incidents – Engines/Ladders
This table compares how often Engines from one SPZ responded to incidents within and outside their SPZ. For clarification, Engine/Ladder 1 responded to 49 incidents in SPZ2, 6 in SPZ3, etc. Reliability is the percentage of time the Engine was available to respond to an incident within their SPZ.
Engine/Ladder
EMS Incident Data
Primary
Ambulance Turnaround Times
Arrival to Available status at Hilton Head Hospital.
EMS Performance Benchmarks
On Scene Time for Stroke Patients
Time crews arrived “on scene” until “enroute to the hospital” for 2025.
Chest Pain
Time crews arrived “at patient” until 12-lead ECG.
At Patient Time to 12-Lead ECG < 10 min (90th Percentile) 09:48 09:49
Critical Task Analysis
The percentage of time the identified number of needed personnel (identified in parentheses) was met or exceeded.
ERF – Effective Response Force – The number of responders determined to be needed to mitigate the incident.
EMS
(ERF)
(2)
Moderate (4)
or Exceeded
Significant (7) 92% (100% Cardiac Arrest)
A review of the significant risk EMS incidents that did not meet the minimum ERF were determined to be incidents that were not cardiac arrests, but the final EFD code was Echo, resulting in the significant level risk being selected. With the transition to NERIS and more accurate EMS incident type selections available, this percentage will be more accurate with 2026’s data.
FIRE
(ERF)
(2)
is Met or Exceeded
(3)
(14)
Maximum (17)
A review of the significant and maximum risk incidents where the minimum ERF was not met were incidents where the fire was out upon arrival or contained, not requiring the full ERF to be dispatched.
HAZMAT
(2)
(9)
Significant (14)
A review of the moderate level risk incidents determined that 82% (9 incidents) were gas leaks on the exterior of a structure that were mitigated by the first arriving crew, not requiring the incident to be upgraded to meet the ERF, leaving additional units available for simultaneous incidents The remaining 2 incidents met the ERF
RESCUE
(2)
(8)
Significant (17)
90th Percentile Turnout Times – FIRE/HAZMAT/RESCUE
Benchmark – 02:30
Turnout time for emergent incidents by unit and shift compared to the benchmark. The highlighted numbers indicate the unit/shift with the fastest turnout time. 2025
(Emergent Responses Only)
90th Percentile Turnout Times – EMS
Benchmark – 01:45
Turnout time for emergent incidents by unit and shift compared to the benchmark. The highlighted numbers indicate the unit/shift with the fastest turnout time.
2025 (Emergent Responses Only)
90th Percentile Times
Individual time breakdown for each response class and risk analyzing all four benchmarks for all three shifts combined. The n= at the bottom of each column indicates the number of incidents in the data set. Low Risk Fire (Low Risk) Fire Suppression – 90th
Moderate Risk Fire (Moderate Risk) Fire Suppression –90th Percentile Times – Baseline
Significant Risk Fire
(Significant Risk) Fire Suppression –90th Percentile Times – Baseline Performance
Fire
Suppression
Response Time
Risk EMS
Risk EMS (Significant Risk) EMS – 90th