QUARTERLY REPORT
FISCAL YEAR 2026-Q2
OCTOBER 1 - DECEMBER 31ST, 2025
QUARTERLY REPORT
FISCAL YEAR 2026-Q2
OCTOBER 1 - DECEMBER 31ST, 2025
In partnership with the Town and in alignment with our community, our destination’s core values support our out-marketing efforts.
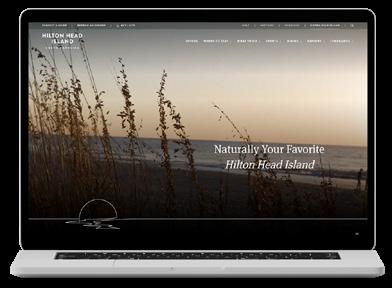
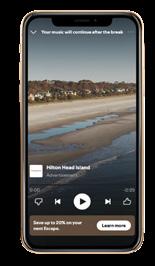
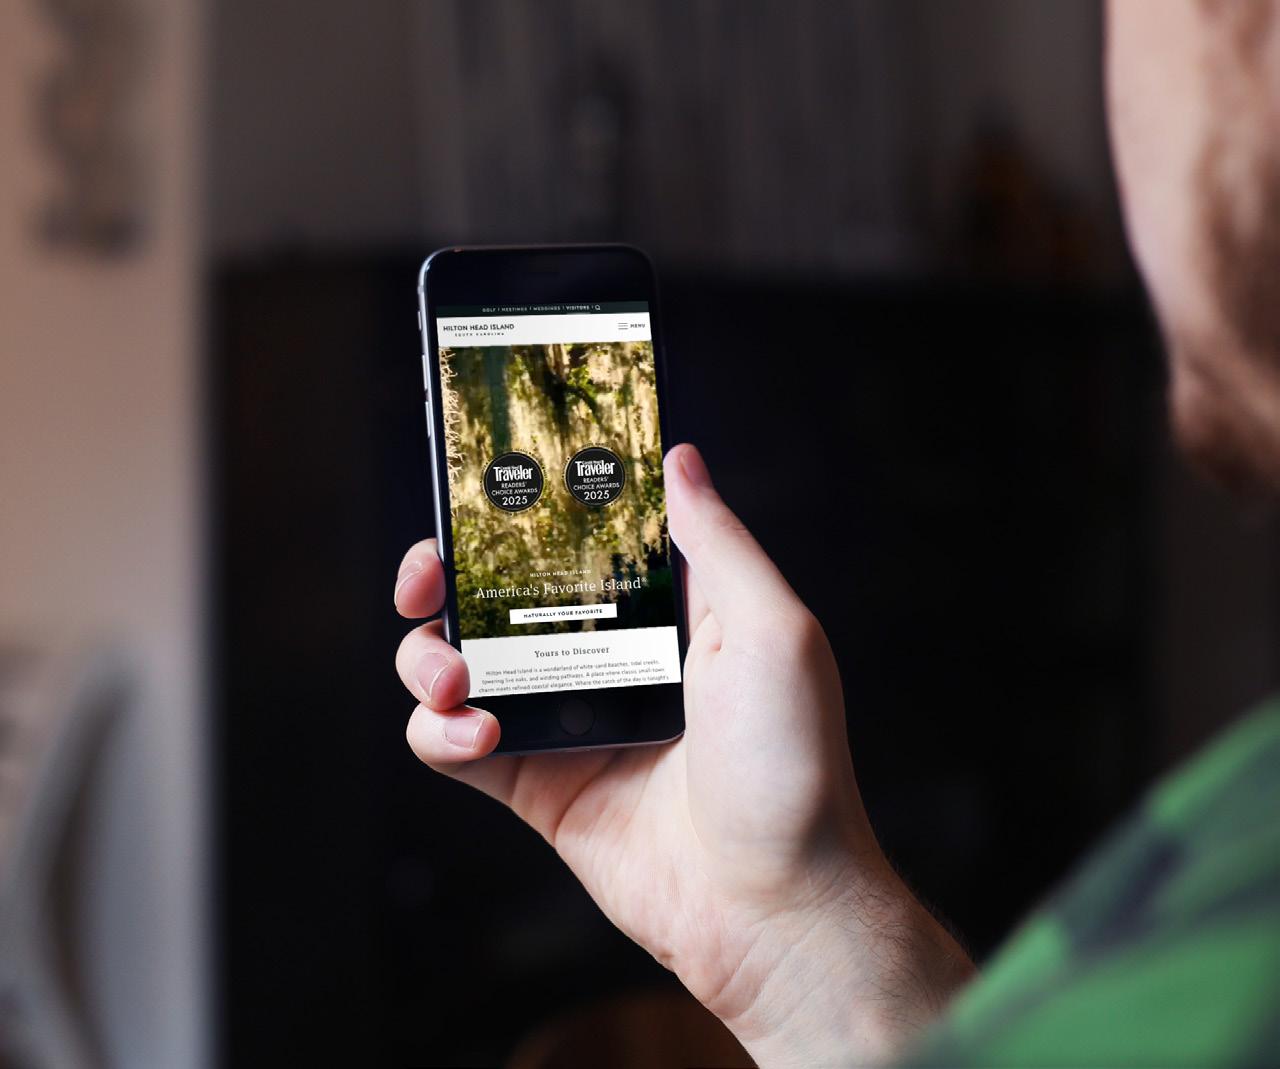
In October 2025, we launched a full-scale brand campaign, designed to reach net new potential guests and inspire them to consider the Island as their next vacation destination. “Naturally Your Favorite” launched across Paid Search, Display, YouTube, Programmatic Display, Connect TV, and Spotify platforms, as well as across organic channels - Email, Social, and Web - and was supported by a press release and media outreach.


Aligning the Hilton Head Island brand with publications that serve luxury travel audiences allows us to consistently build awareness of the destination among our priority target markets. These placements integrate the Hilton Head Island brand into trusted luxury travel content, reinforcing the destination’s premier positioning when travelers are actively planning their trips.


PR builds awareness by showcasing our destination through the voice of national media outlets with substantial reach. This third-party endorsement highlights our island’s appeal and commitment to culture and sustainability, inspiring value-driven travelers.


OCTOBER
CONDÉ NAST TRAVELER (UVPM: 1,582,000)
TOP 10 AIRPORTS IN THE US: READERS’ CHOICE AWARDS 2025
CONDÉ NASTTRAVELER (UVPM: 1,582,000)
THE BEST ISLANDS IN THE UNITED STATES: 2025 READERS’ CHOICE AWARDS
TRAVEL + LEISURE (UVPM: 11,994,568)
DISCOVER 25 OFAMERICA’S BEST BEACHES FROM COAST TO COAST
INSIDER TRAVEL REPORT (UVPM: 17,200)
WHYHILTON HEAD ISLAND WANTS TO BE “NATURALLY YOUR FAVORITE"
THEGRIO (UVPM: 2,110,000)
MEETTHE FIRST SELFRULED COMMUNITYOF BLACK FREEDMEN CALLED MITCHELVILLE STILL STANDING ON HILTON HEAD’S SHORES
CONDÉ NASTTRAVELER (UVPM: 3,243,305) WHERE TO GO ONYOUR NEXTGIRLS TRIP
GOOD HOUSEKEEPING (UVPM: 37,940,000)
46VACATION IDEAS FOR TRAVELERS WHO CAN’T SIT STILL
BUSINESS INSIDER (UVPM: 3,193,185)
I’M 61 WITH 16 GRANDKIDS. INSTEAD OF DOWNSIZING, WE BOUGHT A BIGGER VACATION HOME
THE INDEPENDENT (UVPM: 8,063,004)
YOU’VE PROBABLY NEVER HEARD OF MITCHELVILLE
SOUTHERN LIVING (UVPM: 9,554,761)
6 OF THE BIGGEST TRAVEL TRENDS OF 2026
EBONY (UVPM: 318,151)
THE DESTINATIONS THAT CHANGED HOW WE TRAVELED IN 2025
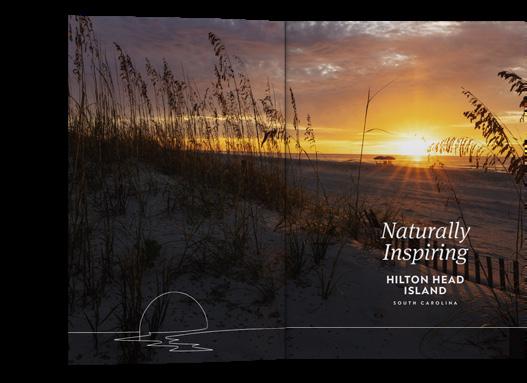
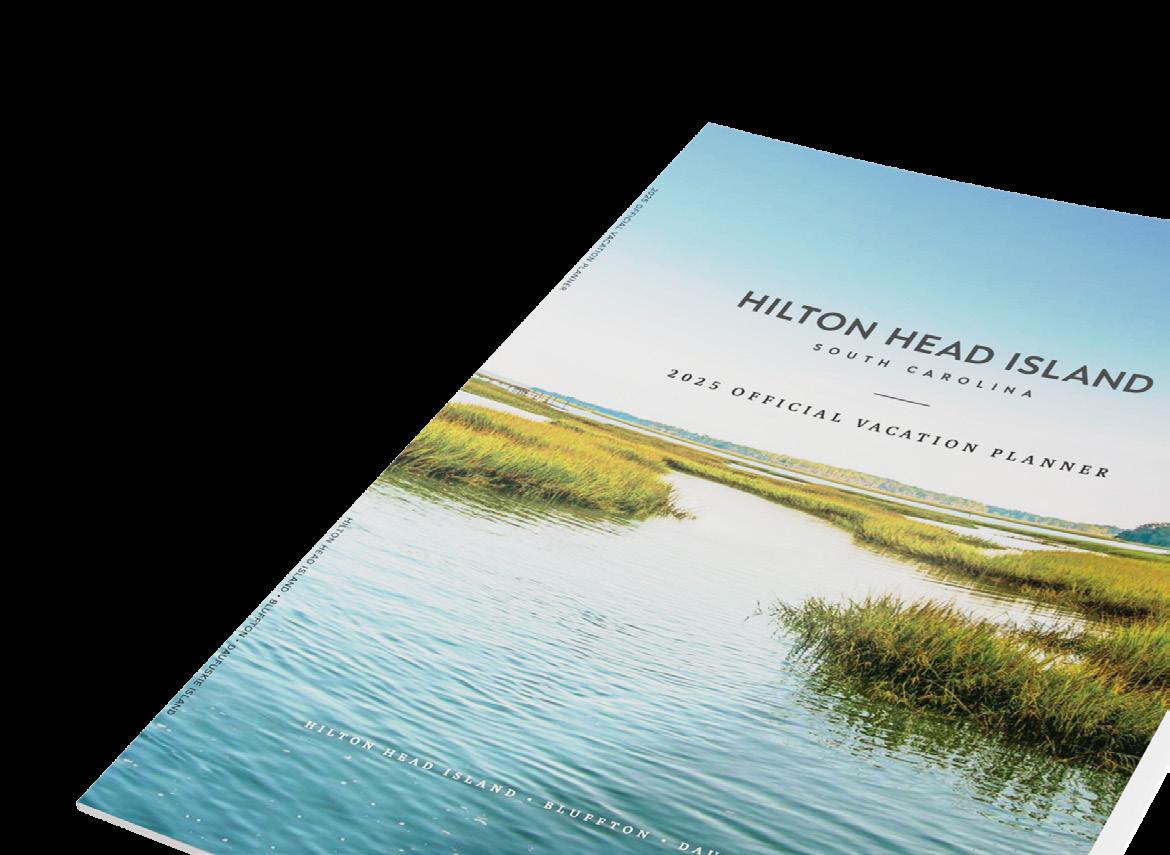
The Official Vacation Planner brings our destination into the homes of our visitors, further instilling our core values and key attributes while serving as a planning tool for those looking to travel to Hilton Head Island.
TOTAL PRINTED 65,000 QUARTERLY DISTRIBUTION 3,600
TOTAL YTD DISTRIBUTION 41,957
DISTRIBUTION TOUCHPOINTS
• Online requests
• Phone inquiries
• Savannah/Hilton Head International Airport
• Hilton Head Island Airport
• South Carolina Welcome Centers
• A AA offices nationwide
• Hotel partners
• Tradeshows » Events
• Media
To ensure continuous fulfillment during the transition to the 2026 edition, a surplus of the 2025 Planner was maintained through year-end. Following the launch of the new guide, remaining units (including boxes and binding materials) were responsibly recycled. This physical distribution is bolstered by our digital edition, which saw 9,543 views/downloads this year (+8.5% YoY), ensuring a seamless, sustainable mix of outreach for our visitors.
The combination of website analytics and social media insights empowers data-driven decision-making, ensuring adaptability and responsiveness to digital out-marketing efforts.
HILTONHEADISLAND.ORG WEBSITE PERFORMANCE
VISITS/ SESSIONS
584K
+8.3% YOY
481K
+12.2% YOY
PARTNER REFERRALS
271K
+38.3% YOY
This quarter’s strong performance, characterized by 584,156 visits (+8.3% YOY), 481,166 users (+12.2% YOY), and 271,363 partner referrals (+38.3% YOY), was significantly bolstered by the launch of the Naturally Your Favorite brand campaign. This full-scale effort successfully drove 155,000 new users through a dedicated landing page and contributed to a 33.8% increase in external partner link clicks. Overall, our co-op referral rate increased to 38% (+63% YOY) this quarter, with Google generating a 38% total site referral rate (+34% YOY)—a performance led by the brand campaign’s high session volume. While core markets remained strong, the campaign’s focus on net new guests fueled surges in growth markets; notably, California saw a 37% site referral rate (+96% YOY).
(October 1 – December 31, 2025)
WEBSITE DEMOGRAPHICS GENDER AND AGE BREAKDOWN
Based on available data within GA4, we’re able to see women made up the largest percentage of visitation, while users within the 55-64 age range visited the website most frequently.
SOCIAL SESSIONS
150K
2+65.9% YOY
SOCIAL REFERRALS 6.5K
-13.2% YOY
364K
2+2.9% YOY SOCIAL TOTAL AUDIENCE
This quarter, social sessions grew 65.9% YOY, though partner referrals saw a 13.2% decrease. This shift reflects a strategic pivot in our social tactics: while last year’s America’s Favorite Escapes campaign prioritized bottom-of-funnel conversions, the current Naturally brand campaign focuses on driving top-of-funnel brand awareness.
The top performing posts of the quarter all featured wildlife in our wellness/coastal outdoors pillar and consisted of three different content types (carousel, short-form video, and UGC content), showing the importance of a balanced content mix on our social platforms. The top performing post was a carousel of photos featuring the local eagles on Hilton Head Island, a new feature on our socials and one to focus on in the upcoming quarters.
By continuing to capitalize on short-form video, owned and UGC carousels, and strategically featuring wildlife in our content, we saw notable growth across platforms YOY in impressions and link clicks. Our cross-channel impressions are up 63.5% YOY and our cross-channel post link clicks are up 50.4% YOY, while our audience steadily grows over time. Comparing our POP metrics gives a greater indication of our growth on each channel. On Facebook, our organic engagement rate held steady at 3% and our organic video views are up 23.4% POP. Our Instagram views are up 61% POP, engagements increased by 16.9% POP, and organic shares increased 33.1%. On LinkedIn, impressions are up 199.8% POP, engagements are up 204.2% POP, and engagement rate has increased to an impressive 18.9% this quarter. On TikTok, impressions have increased 39.6% POP, engagements have increased 61.1% POP (3.6% engagement rate, up by 15.5% POP), and shares are up by 175.3% POP.
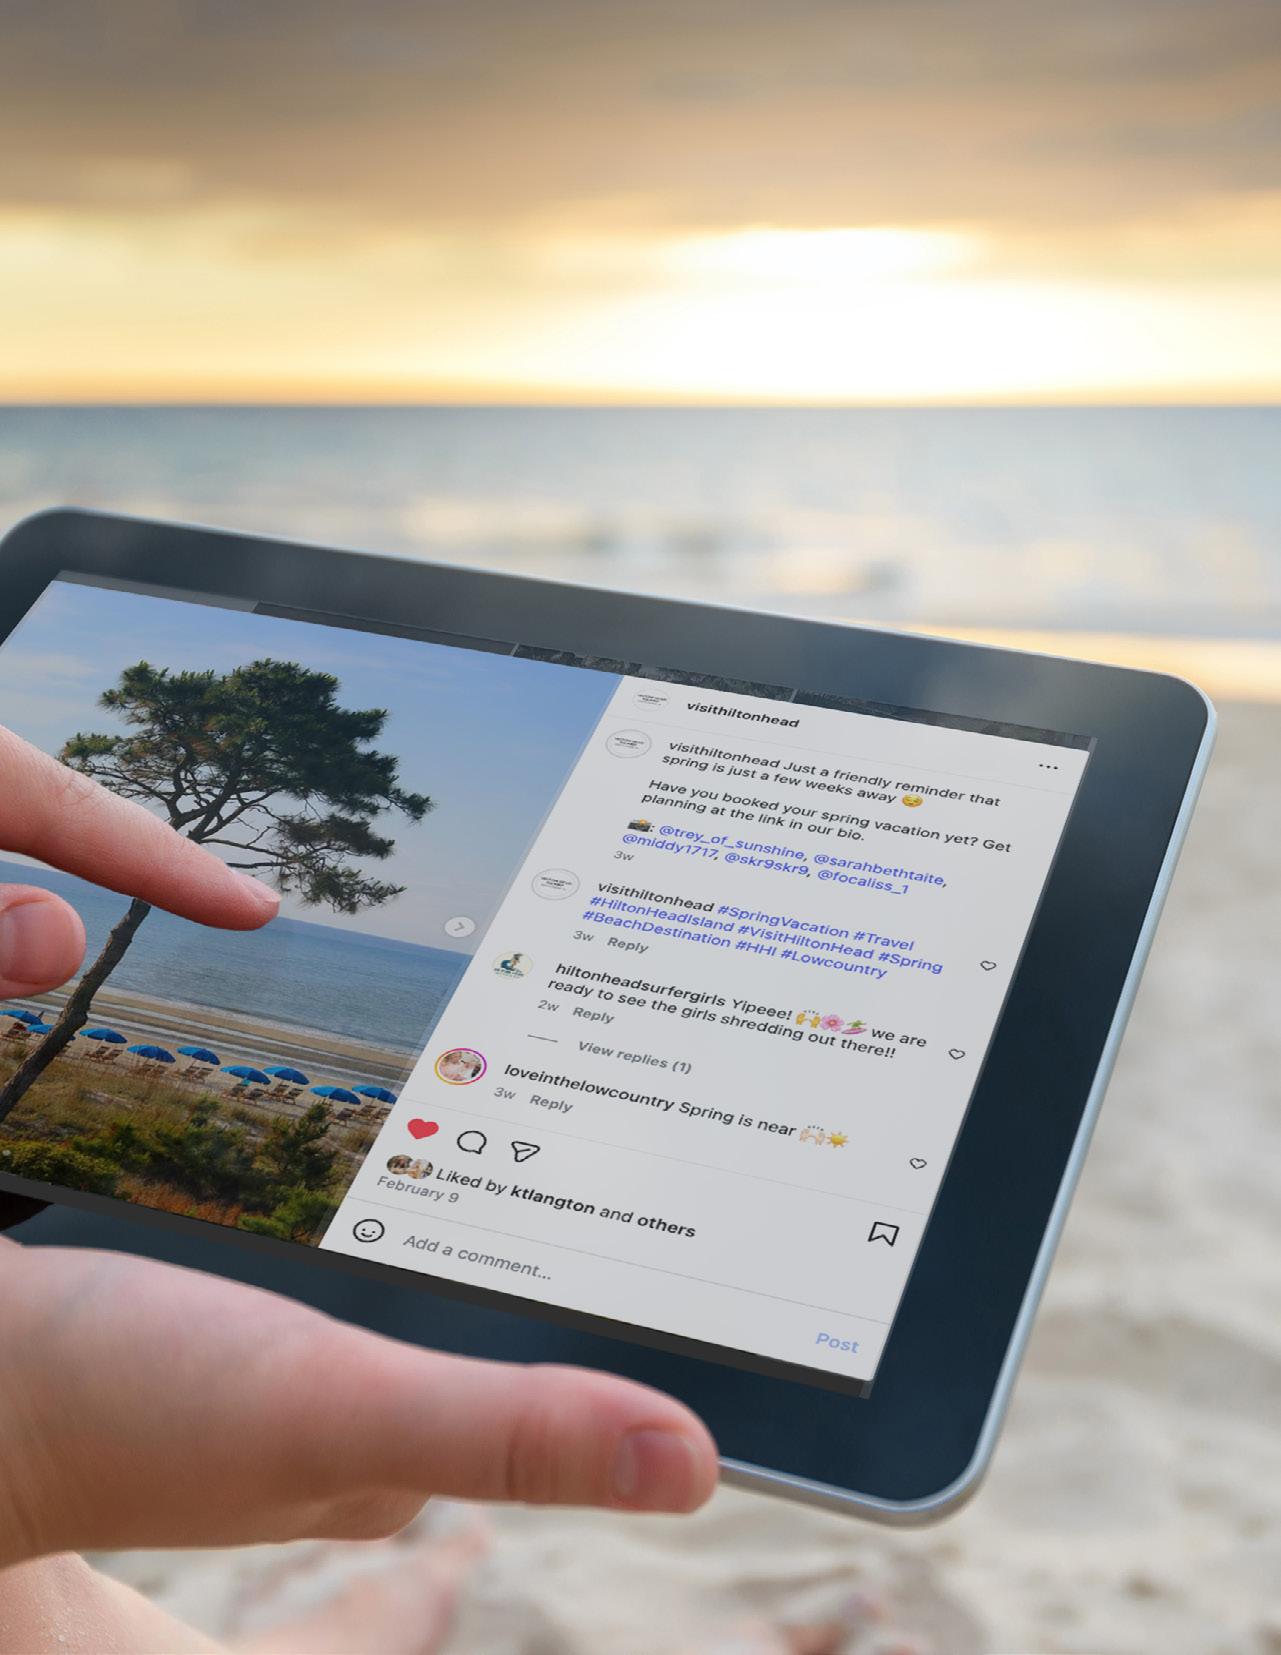
Through the implementation of the Naturally Campaign, we also saw impressive reach and engagement with branded content on our socials. We published 42 posts (stories, videos, and carousels) across social platforms, and saw a total of 163,789 users reached, with 399,789 impressions, 1,310 post link clicks, a net audience growth of 1,519, and 5,573 engagements through the campaign reporting period (October 6–December 31, 2025). We will continue to amplify this campaign through organic social media, weaving the themes of nature, sustainability, and community into our posting cadence throughout 2026.
Source: Sprout Social
(October 1 – December 31, 2025)
OCTOBER 1 - DECEMBER 31, 2025 (FOLLOWERS)
GENDER (LIFETIME)

(October 1 – December 31, 2025)
CROSS-CHANNEL TOP PERFORMING POSTS
ORGANIZED BY CONTENT PILLAR
# of Posts: 259
Total Engagements: 85,072
Total Impressions: 3,269,357
# of Posts: 85
Total Engagements: 15,174
Total Impressions: 568,944
# of Posts: 143
Total Engagements: 29,836
Total Impressions: 1,293,757
CROSS-CHANNEL TOP PERFORMING POSTS
RANKED BY OVERALL ENGAGEMENTS
# of Posts: 132
Total Engagements: 40,127
Total Impressions: 1,256,723
HISTORY
# of Posts: 22
Total Engagements: 3,145
Total Impressions: 86,498


Our analysis of Hilton Head Island accommodations, Hotel, Home & Villa, for a specific quarter, KeyData provides metrics such as occupancy rates, average daily rates, and revenue per available room. This data-driven approach details actionable insights to inform strategic decisions.

This quarter was soft for the lodging market. A near miss from Hurricane Imelda along the Lowcountry coast significantly disrupted early October bookings, weighing on the quarterly average. At the same time, ongoing economic uncertainty continues to suppress occupancy nationwide. While ADR has remained resilient, it has not been sufficient to fully offset the decline in occupancy.
The softening in performance has been most pronounced within the hotel sector. Homes and villas experienced only modest year-over-year declines, whereas hotels saw more substantial decreases in occupancy. Looking ahead, early indicators point to a potential rebound in 2026, with January hotel occupancy currently tracking toward a double-digit increase compared to January 2025.
Disclaimer: Data reflects a point-in-time snapshot. YOY % changes are based on adjusted prior-year data and may not exactly match prioryear snapshot values.
Source: KeyData
Fulfillment - The number of physical vacation planners distributed from requests throughout multiple platforms: online, media and home inquiries. In addition, we also distribute the planner to state and local welcome centers, airports, along with tradeshows and promotional events.
Occupancy - Used within the accommodations industry to gauge the health of tourism. Occupancy percentage is calculated by dividing the occupied rooms by total room supply.
ADR (Average Daily Rate) - Metric widely used to indicate the average realized room rental per day. ADR is calculated by dividing the room revenue by the total rooms sold.
RevPAR (Revenue Per Available Room) - Used to gauge industry health and is calculated by dividing the total room revenue by total room supply within a specific time period.
Paid Media - Paid promotional efforts, such as advertising and sponsored content, where payment is made to third parties for placement across various channels.
HHI - Household Income noted in Media Partnership section.
Media Coverage - Refers to the instances when a destination or brand is featured in content without direct payment.
Impressions - This metric quantifies the number of times destination content has been viewed.
WHY IT MATTERS: The importance of earned media is its role as a third-party endorsement for a destination. Integrating both earned and paid media plays an important role in enhancing a brand’s ROI and credibility.
Ad Values - Sometimes known as AVE, or ad value equivalency, it’s a calculation that estimates the value of a story or mention by comparing it to the cost of a comparable ad in the outlet for that coverage.
WHY IT MATTERS: It helps confer the value of content, however it should be used alongside other metrics of understanding with the knowledge that a news article holds different value than a paid ad.
Mentions - Any instance where a brand or individual is discussed in various media, including news articles, social media posts, blogs, and interviews. These mentions contribute to overall visibility and help assess the impact of communication efforts.
UVPM (Unique Visitors per Month) - This metric represents the number of visitors to a media outlet.
WHY IT MATTERS: The higher the UVPM, the greater the likelihood that the destination will be read about by a larger audience.
2-Source Report - The 2-source report is an aggregated report of both Home and Villa and Hotel data.
Keydata - Keydata is a real time home and villa platform that allows users to view on the books and historical villa data.
STR - Smith Travel Research (STR) is the platformed used to monitor weekly, monthly, quarterly and annually hotel occupancy, average daily rate and revenue per available room.
Impressions - The amount of times your content was seen across a feed or in search terms.
Engagements - A measurement on how much your audience interacts with your content.
This can be measured in likes, comments, shares, etc.
Total Audience - Number of followers across each platform combined.
UGC (User Generated Content) - Content captured by users online, who have given permission to have their content reposted.
Social Sessions - This measures the number of times users visit the website from social media. This includes all visits to the website that originate from social media, regardless of whether its the users first visit or a return visit. It accounts for all the times users engage with the website after coming from social platforms.
Social Referrals - This focuses on the source of the traffic. It tracks how many visits or interactions were initiated by users coming from different social media platforms. This tells us how many time social media has directed users to the website, but not the total number of a users visits.
Visits - A website visit in Google Analytics 4 (GA4) refers to a period of user interaction with a website. Visits help measure user engagement and interactions on a website within a specific time frame.
User - Website users in Google Analytics 4 (GA4) represent individual visitors or devices that access a website within a specified time period. Each user is identified by a unique identifier, allowing GA4 to track and analyze the behavior of distinct individuals or devices interacting with the site.
Partner Referrals - This metric refers to external link clicks to partner websites from ads or partner listings throughout the Hilton Head Island website. This helps quantify how many potential visitors we are connecting to local businesses.