





The official magazine of Home Builders Association of Middle Tennessee
President Eli Routh
Vice President
Danny Clawson
Secretary/Treasurer
Sam Gray
Executive Vice President John Sheley
Editor and Designer Jim Argo
Staff
Connie Nicley
Kim Grayson
THE NAIL is published monthly by the Home Builders Association of Middle Tennessee, a non-profit trade association dedicated to promoting the American dream of homeownership to all residents of Middle Tennessee.
SUBMISSIONS: THE NAIL welcomes manuscripts and photos related to the Middle Tennessee housing industry for publication. Editor reserves the right to edit due to content and space limitations.
POSTMASTER: Please send address changes to: HBAMT, 9007 Overlook Boulevard, Brentwood, TN 37027. Phone: (615) 377-1055.

Register now to secure your SPONSORSHIP at the popular event this month at the HBAMT. Booths have sold out so act quickly to register as a sponsor and join the fun!
The shift in the construction labor force away from construction trades and toward management, business, and technical roles is ongoing and gaining momentum
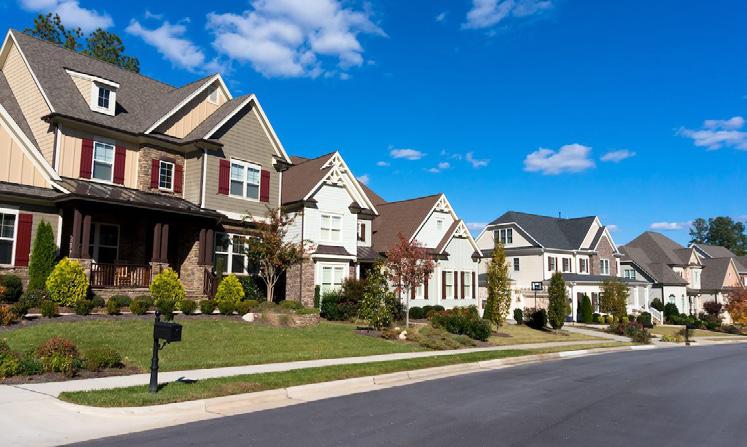
Housing production bounced back in March as builders cautiously ramp up production despite ongoing headwinds.
Overall housing starts increased 10.8% in March to a seasonally adjusted annual rate of 1.5 million units, according to a report from the U.S. Department of Housing and Urban Development and the U.S. Census Bureau.
The March reading of 1.5 million starts is the number of housing units builders would begin if development kept this pace for the next 12 months. Within this overall number, single-family starts increased 9.7% to a 1.03 million seasonally adjusted annual rate and are up 8.9% compared to March 2025. The multifamily sector, which includes apartment buildings and condos, increased 13.3% to an annualized 470,000 pace and are up 15.5% compared to March 2025.
“Housing starts posted a solid rebound in March, suggesting builders are responding to pockets of improving demand despite ongoing affordability challenges, although activity remains sensitive to interest rate movements and construction costs,” said Bill Owens, NAHB chairman. “Overall, the uptick in housing starts is a positive development for residential investment and signals that the sector may be stabilizing.”
“Single-family starts drove much of the monthly increase, indicating that builders are cautiously ramping up production to
meet persistent inventory shortages in the resale market,” said Danushka Nanayakkara-Skillington, NAHB’s assistant vice president for forecasting and analysis. “While this is an encouraging sign, the pace of construction is likely to remain measured as builders continue to navigate elevated financing costs and labor availability. On a regional level, the Midwest continues to outshine the rest of county as the only region to have positive single-family starts growth.”
On a regional and year-to-date basis, combined single-family and multifamily starts were 36% higher in the Northeast, 7.8% higher in the Midwest, 3% higher in the South and 15.5% lower in the West.
Overall permits decreased 10.8% to a 1.37 million unit annualized rate in March. Single-family permits decreased 3.8% to an 895,000-unit rate and are down 7.9% compared to March 2025. Multifamily permits decreased 21.5% to an annualized 477,000 pace and are down 6.3% compared to March 2025.
Looking at regional permit data on a yearto-date basis, permits were 15.4% higher in the Northeast, 1.1% higher in the Midwest, 9.1% lower in the South and 6% higher in the West.
The number of single-family homes under construction is at 587,000 units while the number of apartments under construction is at 677,000 units. n

Residential construction activity began 2026 on a mixed note, with single-family permitting weakening significantly while multifamily activity remained relatively stable. Higher borrowing costs and affordability constraints continue to weigh on single-family construction, while multifamily permitting shows signs of resilience despite regional variation.
Over the first month of the year, the number of single-family permits issued nationwide reached 62,034 — a 15.2%
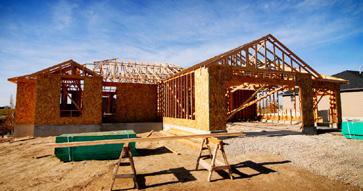
decline compared with the January 2025 (73,115 permits). Multifamily permitting activity was essentially flat, with 38,215 permits issued nationwide, dropping 0.5% from the same period last year.
Single-Family Permitting
Regionally, single-family permitting declined in all four regions:
- Midwest (down 9.1%)
- Northeast (down 10.6%)
- South (down 14.7%)
- West (down 20.1%)
The 10 states issuing the highest number of single-family permits accounted for 63.8% of all single-family permits issued nationwide. Texas led the country with 9,580 permits issued at the start of 2026, although this represented a 21.3% decline compared with January 2025. Florida — the second-high-
Economic uncertainty coupled with rising building material costs and interest rates resulted in a sharp decline in builder sentiment in April as the housing market enters into the heart of the spring buying season.
Builder confidence in the market for newly built single-family homes fell four points to 34 in April, according to the NAHB/Wells Fargo Housing Market Index (HMI) released recently. This is the lowest level since September 2025.
“Builder sentiment has fallen back in spring as buyers face ongoing elevated interest rates and growing economic uncertainty,” said NAHB Chairman Bill Owens. “The year started with hopes for housing momentum growth, but risks with respect to the Iran war, energy costs, and declines for consumer confidence have slowed the market.”
“With oil prices higher in the U.S., 62% of builders reported suppliers have increased building material costs due to higher fuel prices, including gas and diesel,” said NAHB
Chief Economist Robert Dietz. “Energy costs make up approximately 4% of residential construction material input and service costs. With near-term economic risks elevated, 70% of builders reported challenges pricing homes given uncertainty about material costs.”
The latest HMI survey also revealed that 36% of builders cut prices in April, down slightly from 37% in March. The average price reduction was 5%, down from the 6%
est state — saw permits fall by 14.9%, while North Carolina — ranked third — experienced a decline of 9.8%.
Multifamily Permitting Multifamily permits increased in three of the four regions:
- Northeast (up 39.4%)
- West (up 35.5%)
- Midwest (up 10.9%)
The South saw a decline of 24.2%, driven largely by a 42% decrease in Atlanta-Sandy Springs-Roswell, GA metropolitan areas and a 39% drop in the Houston-Pasadena-The Woodlands, TX metropolitan area.
The 10 states issuing the highest number of multifamily permits accounted for 63.1% of all multifamily permits issued nationwide.
Over the first month of 2026, California — which issued the most multifamily permits — recorded a substantial increase of 119.2%. Texas — the second-highest state — posted a decline of 24.4%, while New York — third — saw multifamily permits rise by 66.7%. n
figure in March. The use of sales incentives was 60% in April, down from 64% in March, and marking the 13th consecutive month this share has reached 60% or higher.
Derived from a monthly survey that NAHB has been conducting for more than 40 years, the NAHB/Wells Fargo HMI gauges builder perceptions of current single-family home sales and sales expectations for the next six months as “good,” “fair” or “poor.”
The survey also asks builders to rate traffic of prospective buyers as “high to very high,” “average” or “low to very low.” Scores for each component are then used to calculate a seasonally adjusted index where any number over 50 indicates that more builders view conditions as good than poor.
All three of the major HMI indices posted losses in April. The HMI index gauging current sales conditions fell four points to 37 from March to April, the index measuring future sales dropped seven points to 42 and the index charting traffic of prospective buyers posted a three-point decline to 22.
Looking at the three-month moving averages for regional HMI scores, the Northeast fell two points to 42, the Midwest dropped two points to 41, the South held constant at 35 and the West fell three points to 29. n


The Builders Show exhibit tent will be located on the south side of the HBAMT building and measure 120 x 40 feet boasting space for forty-five (47) 10 x 5 feet exhibit spaces.
DON’T MISS OUT ON THIS TERRIFIC OPPORTUNITY!
Return your registration form to the HBAMT today to reserve your space or sponsorship! Exhibit spaces are limited to two per company.
Return your registration form to the HBAMT today! = 10’x5’
Return form to: cnicley@hbamt.org
I am registering as an: r EXHIBITOR - $630 per booth r SPONSOR - $575
Secure your spot today by returning the registration form provided below to the HBAMT today!
EXHIBITORS are provided exhibit space inside the exhibit tent. SPONSORS enjoy all the benefits of an exhibitor, including access to the tent, without being provided exhibit space in the tent.
Your name: ______________________________________ Company: _______________________________________
Product/service exhibiting: _____________________________
EXHIBITORS: Top 3 booth location preferences (not
Number of booths you’re purchasing (no more than two):
x $630 = your total payment*: $____________
r *Register me for the Builders Raffle held during the event. I will pay an additional $50 entry raffle entry fee.
SPONSORS: will be charged $575.
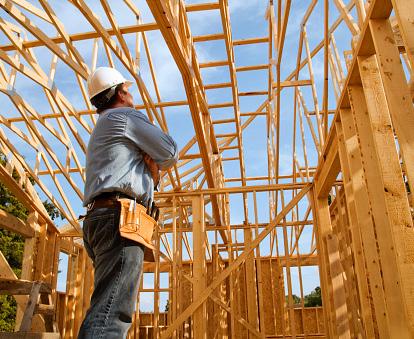
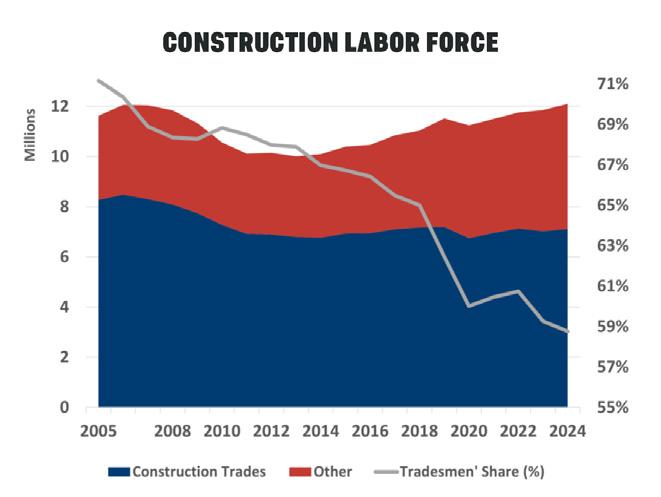
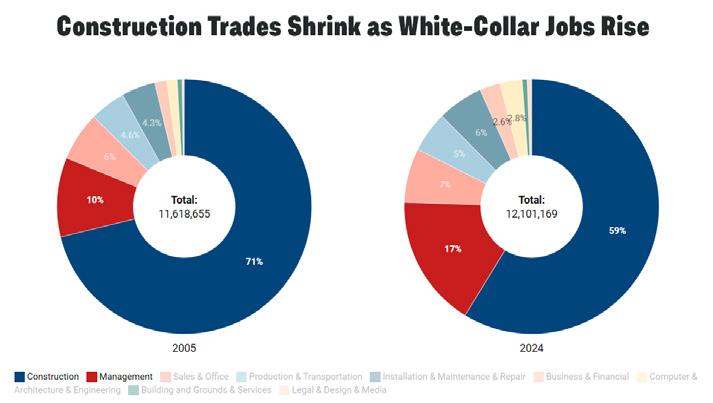
Tlong-running shift in the construction labor force away from construction trades and toward management, business, and technical roles is ongoing and gaining momentum, according to NAHB’s analysis of the latest 2024 data from the American Community Survey (ACS). Although total industry employment now slightly exceeds the levels reached during the 2005–2006 housing boom, the composition of that workforce has changed markedly. The share of construction trades workers has declined from 71% in 2005 to less than 59% in 2024. At the same time, the share of computer, engineering, and science occupations has more than doubled, while management and business roles have expanded by 73%.
These shifts are particularly striking in the context of persistently modest productivity growth in construction. In principle, a larger presence of engineering and technology workers should support productivity gains through improved project design, coordination, and innovation. However, the expansion of management and business roles may also reflect increasing regulatory complexity, permitting requirements, and compliance costs, all of which can lengthen project timelines and raise overhead without directly increasing output. The declining share of skilled trades workers, the group most directly responsible for on-site production, may also offset any productivity gains. Taken together, these compositional changes complicate the link between workforce structure and productivity.
As of 2024, the construction labor force exceeds 12.1 million workers, slightly above its mid-2000s peak. Construction trades, such as carpenters, electricians, painters, plumbers, laborers, and first-line supervisors, account for 7.1 million workers, or 58.8% of the total. By comparison, there were 8.5 million trade workers at the peak of 2006. The loss of more than one million tradesmen helps explain the persistent labor shortages reported in the NAHB/Wells Fargo Housing Market Index (HMI) Survey. Over the same period, the industry has absorbed a growing number of white-collar workers. Management ranks expanded from 1.2 million to 2 million workers, increasing its share from 10% to 17%. Business and financial occupations grew at similar rates. Meanwhile, the number of engineers, architects, and science-re-
lated occupations more than doubled, now accounting for nearly 2.8% of the workforce, up from just 1.3% in 2005. Even with these gains, white-collar roles remain less prevalent in construction than in the broader U.S. economy. However, their growth has outpaced national trends. For example, the share of computer, engineering, and science occupations more than doubled in construction, compared to a 48% increase across the overall U.S. workforce. Similarly, legal and design occupations doubled their share in construction, while their economy-wide presence grew only 20% since 2006.
Several structural factors likely underpin
these trends. Advances in construction technologies—including digital design, project management software, and prefabrication—have increased demand for technical expertise. At the same time, a more stringent regulatory and building code environment has raised the need for administrative, compliance, and managerial functions. The changing workforce composition also coincides with declining self-employment rates in construction, suggesting a shift toward larger firms. These firms are generally better positioned to invest in new technologies, manage regulatory complexity, and absorb rising overhead costs n

Twenty-seven SPIKES (in bold) increased their recruitment numbers last month. What is a SPIKE? SPIKES recruit new members and help the association retain members. Here is the latest SPIKE report as of March 31, 2026.
Big Spikes
Mitzi

CHEATHAM COUNTY CHAPTER
Chapter President - Roy Miles
Cheatham County Chapter details are being planned. Next meeting: to be announced.
RSVP to: cnicley@hbamt.org
DICKSON COUNTY CHAPTER
Chapter President - Matt Spann
Dickson County Chapter meetings are typically held on the third Thursday of the month.
Next meeting: to be announced.
Topic: to be announced.
Free w/RSVP to: cnicley@hbamt.org
MAURY COUNTY CHAPTER
Chapter President - Sam Gray
Maury County Chapter meetings are typically held on the third Tuesday of the month.
Next meeting: to be announced.
Topic: to be announced.
FREE w/RSVP pending sponsorship; $20 w/o RSVP PLEASE RSVP to cnicley@hbamt.org
METRO/NASHVILLE CHAPTER
Chapter President - Lisa Underwood
Metro/Nashville Chapter details are typically held on the fourth Thursday of the month. Next meeting: to be announced. RSVP to: cnicley@hbamt.org
ROBERTSON COUNTY CHAPTER
Robertson County Chapter details are currently being planned.
Next meeting: to be announced. RSVP to: cnicley@hbamt.org
SUMNER COUNTY CHAPTER
Chapter President - Joe Dalton
The Sumner County Chapter typically meets on the third Tuesday of the month. Next meeting: to be announced. RSVP to: cnicley@hbamt.org
WILLIAMSON COUNTY CHAPTER
Chapter President - Rachel Holloway
Williamson County Chapter meetings are typically held on the third Tuesday of the month.
Next meeting: to be announced.
FREE w/RSVP pending sponsorship. RSVP to: cnicley@hbamt.org
WILSON COUNTY CHAPTER
Chapter President - Margaret Tolbert
Wilson County Chapter meetings are typically held on the second Thursday of the month.
Next meeting: Thursday, April 9th, Thursday, 8:00 a.m. to 9:30 a.m. at the Holiday Inn Express - Mt. Juliet
565 S. Mt. Juliet Road Mount Juliet, TN, 37122
Topic: "Business & Building in Wilson County: An Economic Outlook." What’s driving growth in Wilson County—and how does it impact the way you build and do business? Join local experts as they break it down.
Holiday Inn Express - Mt. Juliet
565 S. Mt. Juliet Road Mount Juliet, TN, 37122
FREE with RSVP thanks to Consistent Capital!
RSVP to: cnicley@hbamt.org
HBAMT REMODELERS COUNCIL
The HBAMT Remodelers Council meets at varying locations throughout the year.
Next meeting: to be announced.
RSVP to RMC meetings and events to: cnicley@hbamt.org
INFILL BUILDERS COUNCIL
Infill Builders Council meetings are typically held on the last Wednesday of the month.
Next meeting: to be announced.
PLEASE RSVP to: cnicley@hbamt.org
MIDDLE TENN SALES & MARKETING COUNCIL Council President - Kristen Carbine
The SMC typically meets on the first Thursday of the month. Next event: Thursday, May 7th, 9 a.m. at the HBAMT.
Topic: "2026 Design Trends." Join us for the May meeting of the Sales & Marketing Council at the HBAMT Thursday, May 7th. This month we will welcome very special guest from Haus of Black who will discuss "2026 Design Trends." Haus of Black is your comprehensive solution to transforming your spaces from concept to construction.
The HBAMT - 9007 Overlook Blvd., Brentwood, TN 37027
SMC Members Free w/RSVP thanks to Spire!
NON-SMC MEMBERS MUST RSVP and PAY: $15 with RSVP; $20 w/o RSVP
**HBAMT members must be a paid member of the Sales & Marketing Council in order to receive council rates** RSVP to: cnicley@hbamt.org
$0 enrollment fee with code: FITNESSGOALS²






Plus 9,400+ additional premium exercise studios at 20% - 70% off retail1
Bundle and save. Get $5 off each additional gym you join.3
No long-term contracts. Easily sign up, switch gyms, or cancel online with no fees or penalties.
Connect 1-on-1 with a personal well-being coach for motivation in nutrition, stress management, sleep, and more at no additional cost.
Create a free account to get instant access to 14,000+ on-demand workout videos!









1
3