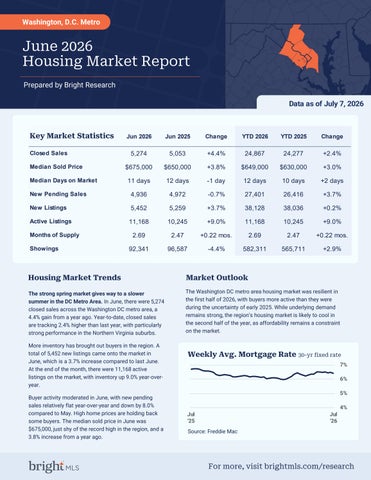
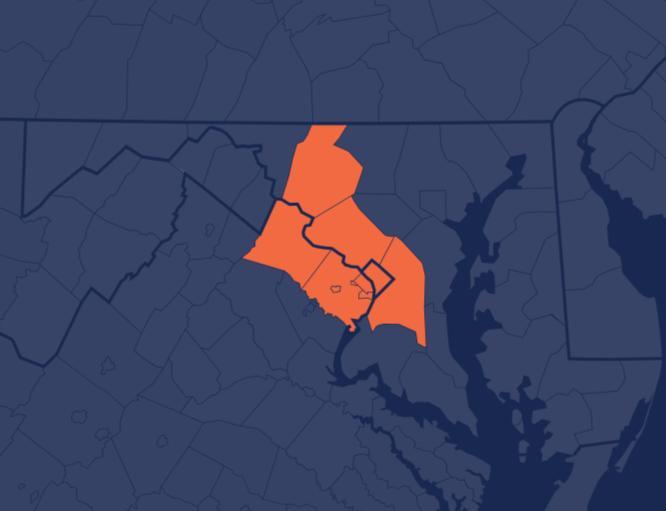
Washington, D.C. Metro
June 2026
Housing Market Report
Prepared by Bright Research
Key Market Statistics
Data as of July 7, 2026
Housing Market Trends Market Outlook
The strong spring market gives way to a slower summer in the DC Metro Area. In June, there were 5,274 closed sales across the Washington DC metro area, a 4.4% gain from a year ago. Year-to-date, closed sales are tracking 2.4% higher than last year, with particularly strong performance in the Northern Virginia suburbs.
More inventory has brought out buyers in the region. A total of 5,452 new listings came onto the market in June, which is a 3.7% increase compared to last June. At the end of the month, there were 11,168 active listings on the market, with inventory up 9.0% year-overyear.
Buyer activity moderated in June, with new pending sales relatively flat year-over-year and down by 8.0% compared to May. High home prices are holding back some buyers. The median sold price in June was $675,000, just shy of the record high in the region, and a 3.8% increase from a year ago.
The Washington DC metro area housing market was resilient in the first half of 2026, with buyers more active than they were during the uncertainty of early 2025. While underlying demand remains strong, the region’s housing market is likely to cool in the second half of the year, as affordability remains a constraint on the market.
Source: Freddie Mac
Jun '26 vs. Jun '25
(Jun '25: 5,053) (May '26: 5,207)
Jun '26 vs. May '26
Median Sold Price
Jun '26 vs. May '26 June 2026 Closed Sales June 2026
$675,000 +3.8% -0.7% (Jun '25: $650,000) (May '26: $680,000)
Jun '26 vs. Jun '25
Median Days on Market
11 days -1 day
Jun '26 vs. Jun '25 June 2026
+3 days
Jun '26 vs. May '26
(Jun '25: 12 days) (May '26: 8 days)
June 2026
Jun '26 vs. Jun '25
Jun '26 vs. May '26
4,936 -0.7% -8.0% (Jun '25: 4,972) (May '26: 5,367)
New Listings
June 2026
Jun '26 vs. Jun '25
Jun '26 vs. May '26
5,452 +3.7% (Jun '25: 5,259) -4.3% (May '26: 5,697)
Active Listings
June 2026
Jun '26 vs. Jun '25
Jun '26 vs. May '26
11,168 +9.0% +1.7% (Jun '25: 10,245) (May '26: 10,976)
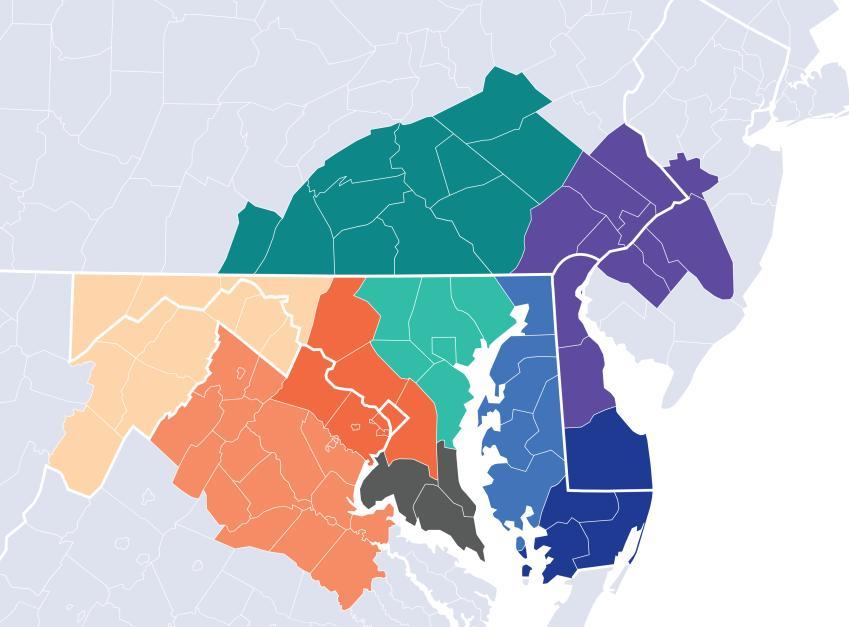
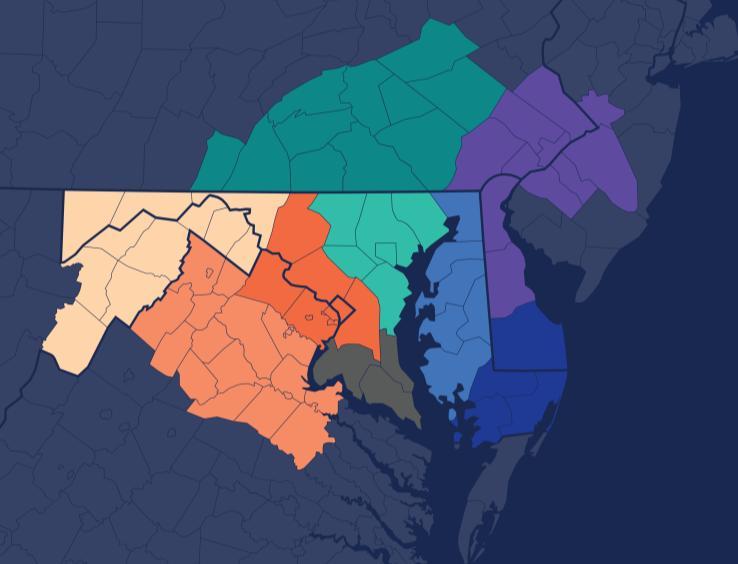
Markets
Local Market Map
MD/WV Panhandle
North Central Virginia
Washington D.C., Metro
Central Pennsylvania
Baltimore Metro
Southern Maryland
Maryland Eastern Shore
Philadelphia Metro
Del/Mar Coastal
About Bright MLS
Bright MLS powers some of the nation’s most dynamic real estate markets as the largest MLS in the U.S. Serving over 100,000 professionals across Delaware, Maryland, New Jersey, Pennsylvania, Virginia, West Virginia, and D.C., Bright provides real-time data, deep market intelligence, and tools supporting more than half a million buyers and sellers each month. In 2025, Bright enabled over 460,000 listings. Built to lead, Bright delivers trusted housing insights and industry-leading tools that drive a more transparent, competitive marketplace. Learn more at BrightMLS.com
Please contact Christy Reap, Media Relations Director with interview or information requests:
• (202) 309-9362
• christy.reap@brightmls.com
Prepared by Bright Research
Market Statistics
2,654 June 2026
+9.8%
Jun '26 vs. Jun '25 (Jun '25: 2,418)
+2.4%
Jun '26 vs. May '26 (May '26: 2,592)
Data as of July 7, 2026
$875,000
June 2026
+1.7%
Jun '26 vs. Jun '25 (Jun '25: $860,000) -2.8%
Jun '26 vs. May '26 (May '26: $900,000)
$950,000
$900,000
$850,000
$800,000
$750,000
$700,000
$650,000
$600,000
Median Days on Market
8 days
June 2026
-2 days
Jun '26 vs. Jun '25 (Jun '25: 10 days)
+2 days
Jun '26 vs. May '26 (May '26: 6 days)
New Pending Sales
2,457
June 2026
+7.0%
Jun '26 vs. Jun '25 (Jun '25: 2,296) -5.9%
Jun '26 vs. May '26 (May '26: 2,610)
2,231 June 2026 -3.5%
Jun '26 vs. Jun '25 (Jun '25: 2,311) -11.3%
Jun '26 vs. May '26 (May '26: 2,515)
4,145 June 2026 -3.7%
Jun '26 vs. Jun '25 (Jun '25: 4,305)
-0.8%
Jun '26 vs. May '26 (May '26: 4,177)
About Bright MLS
Bright MLS powers some of the nation’s most dynamic real estate markets as the largest MLS in the U.S. Serving over 100,000 professionals across Delaware, Maryland, New Jersey, Pennsylvania, Virginia, West Virginia, and D.C., Bright provides realtime data, deep market intelligence, and tools supporting more than half a million buyers and sellers each month. In 2025, Bright enabled over 460,000 listings. Built to lead, Bright delivers trusted housing insights and industry-leading tools that drive a more transparent, competitive marketplace. Learn more at BrightMLS.com.
Prepared by Bright Research
Market Statistics
1,468 June 2026
+7.2%
Jun '26 vs. Jun '25 (Jun '25: 1,370)
+3.9%
Jun '26 vs. May '26 (May '26: 1,413)
Data as of July 7, 2026
$618,000
June 2026 -0.3%
Jun '26 vs. Jun '25 (Jun '25: $620,000) -1.1%
Jun '26 vs. May '26 (May '26: $625,000)
Median Days on Market
10 days
June 2026
-1 day
Jun '26 vs. Jun '25 (Jun '25: 11 days)
+2 days
Jun '26 vs. May '26 (May '26: 8 days)
New Pending Sales
1,383
June 2026 -0.5%
Jun '26 vs. Jun '25 (Jun '25: 1,390)
Jun '26 vs. May '26 (May '26: 1,495)
1,599
June 2026 +7.0%
Jun '26 vs. Jun '25 (Jun '25: 1,494) +7.0%
Jun '26 vs. May '26 (May '26: 1,495)
2,639
June 2026
+8.2%
Jun '26 vs. Jun '25 (Jun '25: 2,439)
+7.0%
Jun '26 vs. May '26 (May '26: 2,467)
About Bright MLS
Bright MLS powers some of the nation’s most dynamic real estate markets as the largest MLS in the U.S. Serving over 100,000 professionals across Delaware, Maryland, New Jersey, Pennsylvania, Virginia, West Virginia, and D.C., Bright provides realtime data, deep market intelligence, and tools supporting more than half a million buyers and sellers each month. In 2025, Bright enabled over 460,000 listings. Built to lead, Bright delivers trusted housing insights and industry-leading tools that drive a more transparent, competitive marketplace. Learn more at BrightMLS.com.
June 2026 Condos Report
Prepared by Bright Research
Market Statistics
1,150 June 2026
-8.9%
Jun '26 vs. Jun '25 (Jun '25: 1,263)
-4.2%
Jun '26 vs. May '26 (May '26: 1,201)
Data as of July 7, 2026
$406,000
June 2026
+4.1%
Jun '26 vs. Jun '25 (Jun '25: $390,000)
+1.8%
Jun '26 vs. May '26 (May '26: $399,000)
$420,000
$320,000 $340,000 $360,000 $380,000 $400,000
$300,000
Median Days on Market
24 days
June 2026
+5 days
Jun '26 vs. Jun '25 (Jun '25: 19 days)
+7 days
Jun '26 vs. May '26 (May '26: 17 days)
New Pending Sales
1,095
June 2026 -14.7%
Jun '26 vs. Jun '25 (Jun '25: 1,284) -13.1%
Jun '26 vs. May '26 (May '26: 1,260)
1,619
June 2026 +11.5%
Jun '26 vs. Jun '25 (Jun '25: 1,452) -3.9%
Jun '26 vs. May '26 (May '26: 1,685)
4,384
June 2026
+25.2%
Jun '26 vs. Jun '25 (Jun '25: 3,501)
+1.2%
Jun '26 vs. May '26 (May '26: 4,332)
About Bright MLS
Bright MLS powers some of the nation’s most dynamic real estate markets as the largest MLS in the U.S. Serving over 100,000 professionals across Delaware, Maryland, New Jersey, Pennsylvania, Virginia, West Virginia, and D.C., Bright provides realtime data, deep market intelligence, and tools supporting more than half a million buyers and sellers each month. In 2025, Bright enabled over 460,000 listings. Built to lead, Bright delivers trusted housing insights and industry-leading tools that drive a more transparent, competitive marketplace. Learn more at BrightMLS.com.