Washington, D.C. Metro
July 2026 Housing Market Report Prepared by Bright Research
Data as of August 6, 2026
Key Market Statistics
Jul 2026
Jul 2025
Change
YTD 2026
YTD 2025
Change
Closed Sales
4,690
4,692
-0.0%
29,730
29,156
+2.0%
Median Sold Price
$650,000
$640,000
+1.6%
$649,889
$633,000
+2.7%
Median Days on Market
15 days
15 days
+0 days
12 days
11 days
+1 day
New Pending Sales
4,202
4,385
-4.2%
31,509
30,726
+2.5%
New Listings
5,085
4,922
+3.3%
44,747
44,537
+0.5%
Active Listings
11,431
10,283
+11.2%
11,431
10,283
+11.2%
Months of Supply
2.75
2.48
+0.27 mos.
2.75
2.48
+0.27 mos.
Showings
86,477
90,732
-4.7%
668,788
656,443
+1.9%
Housing Market Trends
Market Outlook
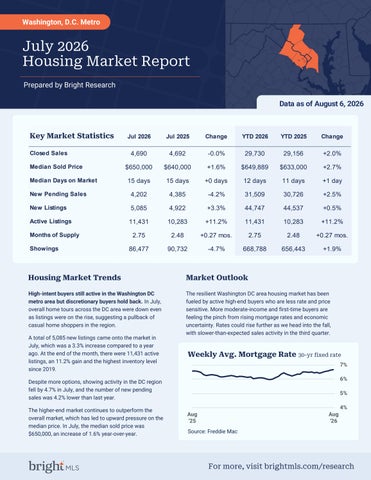
High-intent buyers still active in the Washington DC metro area but discretionary buyers hold back. In July, overall home tours across the DC area were down even as listings were on the rise, suggesting a pullback of casual home shoppers in the region.
The resilient Washington DC area housing market has been fueled by active high-end buyers who are less rate and price sensitive. More moderate-income and first-time buyers are feeling the pinch from rising mortgage rates and economic uncertainty. Rates could rise further as we head into the fall, with slower-than-expected sales activity in the third quarter.
A total of 5,085 new listings came onto the market in July, which was a 3.3% increase compared to a year ago. At the end of the month, there were 11,431 active listings, an 11.2% gain and the highest inventory level since 2019.
Weekly Avg. Mortgage Rate 30-yr fixed rate 7% 6%
Despite more options, showing activity in the DC region fell by 4.7% in July, and the number of new pending sales was 4.2% lower than last year. The higher-end market continues to outperform the overall market, which has led to upward pressure on the median price. In July, the median sold price was $650,000, an increase of 1.6% year-over-year.
5% 4% Aug '25
Aug '26
Source: Freddie Mac
For more, visit brightmls.com/research