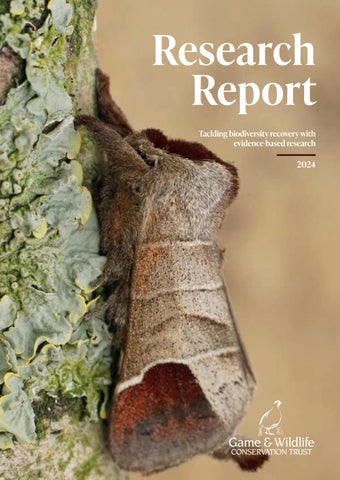
Research Report Tackling biodiversity recovery with evidence-based research
2024
gwct.org.uk
GWCT RESEARCH REPORT • 2024 |
1
Download your free no-obligation Wills guide today
Leave a gift that lasts for generations What made you fall in love with the British countryside? Whether it was the call of a curlew or a day spent with a loved one that sparked your love for the countryside, your gift will ensure that future generations can experience the same joy and wonder.
By leaving a gift to the GWCT in your Will, you will be doing something very special. You will be giving us the best chance of ensuring the countryside you love is there to be enjoyed by generations to come. So that they can have that same moment that makes them love the nature around them.
To find out more, scan the QR code above, visit gwct.org.uk/legacy or call us on 01425 651021.
Game & Wildlife Conservation Trust is a charitable company limited by guarantee registered in England and Wales under number 05579632. Charity registered in England and Wales, 1112023, in Scotland SC038868. Registered office: Burgate Manor, Fordingbridge, Hampshire SP6 1EF.
Legacy advert.indd 1
08/02/2023 09:03:17
CONTENTS |
ISSUE 56 A full report of the activities of the Game & Wildlife Conservation Trust (Registered Charity No. 1112023) during the year. Game & Wildlife Conservation Trust Fordingbridge, Hampshire SP6 1EF Tel: 01425 652381 Email: info@gwct.org.uk Reg. Charity No: 1112023 Reg. Company No. 05579632 Vat No. 665 2959 92 Patron HM King Charles III President The Marquess of Salisbury PC, DL Chairman Sir Jim Paice, PC, DL, FRAgS
CONTENTS
Editing, Design and Layout Science editors Andrew Hoodless, Julie Ewald and Amber Hopgood Editing, Design and Layout Louise Shervington
RESEARCH IN ACTION
Thank you to all the photographers who have contributed to this publication. All rights reserved. No reproduction without permission. Ref: FPUBGCT-ANR0625. ISSN 1758-1613 Printed on Elemental Chlorine Free (ECF) fibre sourced from well managed forests. GWCT charitable objects To promote for the public benefit the conservation of game and its associated flora and fauna. To conduct research into game and wildlife management (including the use of game animals as a natural resource) and the effects of farming and other land management practices on the environment, and to publish the useful results of such research.
4
GWCT Highlights from 2024
5
Foreword – Andrew Hoodless
6
Welcome – Sir Jim Paice
7
Comms – Amber Hopgood
8
The Closing Word – Teresa Dent
SPECIES RECOVERY
16 Salmon population on the River Frome 18 Automating fish detection on salmon counters 20 Grayling and brown trout on the River Wylye
© Erik Mandre
62 Understanding the value of headstarting curlew 66 Breeding curlew in the New Forest 68 The impact of human food on fox numbers 70 Innovative use of drone technology 74 Boosting the abundance and diversity of moths
SUSTAINABLE GAME MANAGEMENT
76 Auchnerran Breeding Bird Survey
26 Grey partridge counts
GWCT SCIENCE
36 Long-term changes in gamebird numbers and releasing
gwct.org.uk
60 Lapwing chick survival on fallow plots
22 Beaver dams and trout
32 Red grouse monitoring: now and into the future
Chocolate-tip moth. © H Wall
54 Auchnerran farming year
12 Advisory – Roger Draycott
28 The effects of pheasant releasing on habitats in designated woodland areas
On the cover
52 Allerton: Soil compaction costs 56 The PepsiCo Farming Arable Biodiversity project
AQUATIC ECOSYSTEMS
To conserve game and wildlife for the public benefit including: where it is for the protection of the environment, the conservation or promotion of biological diversity through the provision, conservation, restoration or enhancement of a natural habitat; or the maintenance or recovery of a species in its natural habitat on land or in water and in particular where the natural habitat is situated in the vicinity of a landfill site.
48 Allerton farming year
10 Policy – Alastair Leake, Lee Oliver and Ross MacLeod 13 Fundraising – Jeremy Payne
To advance the education of the public and those managing the countryside in the effects of farming and management of land which is sympathetic to game and other wildlife.
46 Boosting biodiversity through Farmer Clusters
GREENER FARMING
78 Black grouse range expansion 80 Capercaillie population in Scotland
84 Scientific publications 86 Research projects 90 External committees 92 GWCT staff 94 Financial report 98 Council & county chairmen
42 Upscaling farmers’ environmental ambitions GWCT RESEARCH REPORT • 2024 | 3
GWCT Highlights from 2024 Professor Chris Stoate retired after 36 years at the GWCT, mostly at the Allerton Project, respected by both the scientific and agricultural communities for his ability to communicate his ideas and research effectively to both.
As part of the Curlew Connections Partnership project in Wales, 38 curlew nests were identified, resulting in 83 chicks hatching and 18 curlew successfully fledging.
146 individuals across 37 estates in Scotland have signed up for the practitioner monitoring initiative and are using the Epicollect mobile app for recording.
As part of the Gravelly Shores Project, we designed and evaluated a novel nest protection cage for oystercatchers.
Annual salmon count shows the lowest estimated number of juveniles for more than 20 years. The team aim to tag 10,000 salmon parr each year, but only 4,594 were caught and tagged. 4 | GWCT RESEARCH REPORT • 2024
Images supplied courtesy of Tarquin Millington-Drake, Peter Thompson and GWCT Employees.
RESEARCH HIGHLIGHTS |
59,000 acres of farmland were surveyed by advisory in 2024.
FOREWORD ANDREW HOODLESS DIRECTOR OF RESEARCH
Spring songbird numbers were twice as high in hedges near game crops in managed grassland.
37% insect decline over 50 years in the Sussex Study highlights the need for farmer support in biodiversity recovery.
2024 marks the second year of lead-free shooting at Allerton.
gwct.org.uk
T
he conservation world is collectively trying to tackle the twin crises of climate change and biodiversity loss. To achieve this requires engagement with land users at the landscape scale. The GWCT has an important role in working with farmers, gamekeepers, river keepers, and moorland managers to ensure environmentally sensitive practices and foster greater collaboration. It was good to see our scientists secure funding for projects from Natural England’s Species Recovery Programme in 2024 for work on black grouse, lapwing, coastal waders and farmland songbirds. These projects are essential for evaluating effective solutions for species recovery. I anticipate continued research on translating proven game management principles to species recovery and long-term population resilience, as well as more work on routes to net environmental gain at the landscape-scale. Working on our strategic plan in 2024 provided an opportunity to reassess our research priorities and scope likely future resource needs. Reflecting increased dialogue and more flexible working between the research and advisory teams and between research departments, you will notice a different, themed layout to the Review (now our Research Report) this year. We believe that a focus on the themes of sustainable game management, greener farming, species recovery, and aquatic ecosystems will raise awareness of the GWCT’s work and its importance. While our work is greatly varied and spans species and habitats all over the UK, we believe these four themes successfully group our work and help us demonstrate the difference we are making for biodiversity. Environmental Farmer Groups, involving co-operation between farmers at a catchment scale, present an exciting opportunity to assess how far farmers are prepared to accommodate wildlife-friendly measures, to inform effective deployment, and to determine how best to monitor success at the landscape scale. Our research team has embraced new technologies from GPS tracking and drones to DNA analysis, responsibly employing AI to speed up data processing and using novel statistical analysis to inform management. We see a need to invest in our data support team to ensure timely scientific outputs, increase data collection by practitioners, and to facilitate modelling of likely outcomes of policy options and land management scenarios. We foresee a need for greater expertise in social science because an understanding of the capacity and willingness of land managers to change practices is as important to developing long-term solutions as an in-depth understanding of ecological processes.
GWCT RESEARCH REPORT • 2024 | 5
We featured a number of our scientists in project videos as part of our four fundraising appeals, sharing expert insights and research updates from across the UK for curlew, grey partridge, wild Atlantic salmon, and black grouse
WELCOME
F
SIR JIM PAICE GWCT CHAIRMAN
or the first time for 22 years there is no article by our former CEO Teresa Dent. However, everything described within this report took place under her watch and is testament to her amazing legacy. Elsewhere you will read more of her achievements, but this edition marks a turning point in the history of the GWCT. You will also read in Gamewise of our new CEO Nick von Westenholz, but I would be remiss in not welcoming him. He brings with him a wealth of experience and knowledge, as well as a longstanding love of what we do. I wrote last year of the challenges which face us; they have not diminished. The election of a new Government with less natural sympathy for the countryside means our policy team has been enlarged as we try to engage with ministers. By the time you read this I hope that at least two ministers will have visited our Allerton Project farm at Loddington. I should add that we have won a contract with Defra to deliver training courses for 650 staff which will give them an introduction to our world. It builds on the 250 Defra staff already trained. This is a long-term investment in educating civil servants in the ways of the countryside. It is not just desk based but includes practical things like trap setting so that they see the reality. There are those who say that the shooting world has nothing to worry about from the new Government but tell that to the farmers who were promised no change to inheritance tax. It just means that our role in generating the evidence and giving it to politicians across the board is critical. But our work goes far beyond game shooting so I encourage readers to study all of it. Our charitable remit is for all wildlife, from the humble earthworm to majestic birds of prey. That is why trustees are currently reviewing our image and how others see us. We see sustainable shooting as part of the whole living countryside for wildlife. We can prove that well managed shooting produces increased wildlife so we support it. All our policies are evidence led; some may seem obvious to the countryman or woman, but I know from experience that often the first question from a civil servant is ‘where is the evidence’? So proving what may seem commonsense to some is often necessary. Conversely sometimes we can prove that what may seem obvious is in fact counterproductive. It is this myriad of often conflicting challenges which marks out GWCT research. Every edition of our Research Reports demonstrates that and this edition is no different. 6 | GWCT RESEARCH REPORT • 2024
RAISING OUR PROFILE |
COMMS AMBER HOPGOOD DIRECTOR OF COMMS
© Emily Graham Media
L
gwct.org.uk/research
ooking back on 2024 it is clear that we have made excellent progress, not only in our research, policy, and advisory work, but also in our success spreading the word about what we do. 2024 represented a year of change and growth for our team as we tried new approaches and boosted our efforts to use video in our storytelling. We are very lucky to have so many fantastic research projects and talented scientists and advisors at the centre of our work who are willing and enthusiastic about sharing what they do. This year we featured a number of our scientists in project videos as part of our four fundraising appeals, sharing expert insights and research updates from across the UK for curlew, grey partridge, wild Atlantic salmon, and black grouse. With your help we managed to raise £126,038 to continue these projects. Throughout the year we showcased our work in the media on a larger scale than we have before. In the spring, the GWCT’s Big Farmland Bird Count reached new audiences when it was featured on the BBC’s Countryfile by Adam Henson. Through the summer we enjoyed seeing many of you at the Game Fair and shared the latest findings from our long-term monitoring work at the Sussex Study which found that in a 50-year period insect numbers in cereal fields declined by 37%. This work was featured widely in national and regional media. We also shone a spotlight on local farmers in Hampshire, Dorset, and Wiltshire who have been working to put up swift boxes in local villages and saw the Balgonie estate and its grey partridge work featured on BBC Landward. Through the autumn we shared updates on the Breeding Woodcock Survey and made national and international headlines with the news that our research team tagged the lowest numbers of salmon parr on the River Frome in 20 years. Across the year we generated 848 mentions in the British press and saw a great increase in the number of articles about our work in sector publications and online. Overall it has been a fantastic year. Thank you to everyone that shared and supported our work, we couldn’t achieve what we do without your continued interest and enthusiasm. GWCT RESEARCH REPORT • 2024 | 7
| INTERVIEW
THE CLOSING WORD Teresa Dent chats to Joe Dimbleby about her distinguished career leading the GWCT and what is next
T
eresa Dent, GWCT’s chief executive (CEO), retired in March 2025 calling time on 22 years of leading the GWCT and expanding its reach. Teresa succeeded Dick Potts as CEO and came from a farm business background. Here she reflects on her busy GWCT career.
It is really important to understand what motivates people to save nature, and then to design incentives that fit that motivation
Were there things you had to pick up quickly when you started? I was okay with everything to do with farming, business management, financial management, and strategic thinking. I had never worked with scientists before, so had a lot to learn about response curves, confidence limits, randomised designs, etc. I also had a lot to learn about running a charity, fundraising, nature conservation policy, and the politics (small p) of wildlife conservation. There are some things I’ve never managed to learn even over 20 years later, like how to count farmland birds by listening to them singing.
Has the organisation changed since then? It hasn’t in terms of its soul. It always was and still is, an organisation dedicated to helping farmers, land managers and gamekeepers turn the land they look after into a better place for nature. But, we now make a point of taking our research into policy; when I joined the Trust it was felt that was a job for others. That has become really important since devolution and we now have very good policy teams in Scotland, Wales and England. We do much more on fisheries and river restoration. In 2008, we took on our salmon and trout research centre at East Stoke on the River Frome in Dorset. Overall, our research is now broader covering more species recovery, but the GWCT is still the only environmental NGO researching the ecology and biology of game species, and actively supporting sustainable game management as a force for good for nature conservation. In the last 10 years we have built a very strong focus on collaborative, farmer-led, landscape-scale conservation; no-one 8 | GWCT RESEARCH REPORT • 2024
was doing that before. We developed Farmer Clusters, and more recently the Environmental Farmers Groups. As an organisation we have expanded but we are still tiny at about 140 staff compared with the RSPB at more than 2,500 staff and the Wildlife Trusts at 3,600. We now have the largest team of advisors that we have ever had; they still give excellent game management advice and training, but also nowadays species recovery, natural capital, large scale biodiversity audits, and biodiversity baseline and net gain calculations. We are much stronger on communications. Our coverage across all media has increased and we now reach 130,000 people a day with our newsletter. We are still completely science-based and evidence-led. It seems to amaze people when I tell them that I literally do not say anything that does not have the approval of the scientists and is supported by evidence; either ours or someone else’s.
What is the soundest advice you have been given? To have a basket of fundraising activities so that, as a charity, one is not reliant on any single income stream. People talk about tight margins in business, try running a charity. That spread of income was vital in the Covid years as every single fundraising event stopped and if we hadn’t had a reasonable mix of other types of fundraising, as well as fantastic members and supporters who rallied when they realised we needed them, we would have been in real difficulty.
TERESA DENT |
One highlight is seeing so much of the GWCT research end up in modern agri-environment schemes, now being replicated all over Europe. There are not many fields, hedgerows, woods, or moorland that have not been influenced by our research What have you learned about successful conservation? That successful conservation is only 50% ecology; the other 50% is psychology. The outcome one wants may be species recovery, but how to get it is all about people. It is really important to understand what motivates people to save nature, and then to design incentives that fit that motivation. I don’t think the Government really gives enough thought about how to do that.
money to your charity is an extraordinary thing; it is a gift of much more than money, it is a gift of trust and faith. We have to really understand what our donors want us to achieve, we have to listen, then we have to make sure we use that money as wisely and cost effectively as we possibly can in achieving those outcomes. After that we have to explain what we’ve achieved and say thank you.
How has the approach of policymakers changed?
What you think of as highlights from your time at the Trust?
I think there is a growing danger of accepted truths: statements that become accepted as truth simply because they are said so often. A classic at the moment is the one that says the UK is one of the most nature depleted countries in the world; that we are in the bottom 10% of 240 nations. Our policy officer Henrietta Appleton, did a very good blog on that last September. The metric that has now become a truth came from the Natural History Museum’s ‘Global Biodiversity Intactness Index (BII)’. But this is only one metric, and one which is soley focused on global biodiversity depletion by human activity. An alternative might be the biodiversity metrics within the Environmental Performance Index produced by Yale University. Using this metric, our performance is very different. Rather than estimate the area of the UK that is ‘natural’, they use a number of different indicators to assess a country’s actions toward retaining natural ecosystems and protecting the full range of biodiversity within their borders. Overall, for biodiversity and habitat in 2024, the UK ranks 15th out of 180, a very different picture indeed. But that does not mean we can be complacent; we know many species are in trouble based on the Government’s data on wild bird populations for example.
That’s a difficult one because I’m so proud of everything the scientists, advisors and all the staff have achieved. One highlight is seeing so much of the GWCT research end up in modern agri-environment schemes, now being replicated all over Europe. There are not many fields, hedgerows, woods, or moorland that have not been influenced by our research. We’ve also invented this collaborative, farmer-led, bottom-up style of ‘Working Conservation’ that I think probably has the best chance of achieving nature recovery of anything we’ve got going in the UK.
What did you learn from being on the NE board? First, that there are a lot of very good staff in Natural England (NE), who are very dedicated to improving our natural environment. However, NE is not as good as it needs to be at taking science into practice. It tends to take science into practice as if it’s managing a nature reserve, where the only outcome required is more nature; that’s fine on the 8% of England that is nature reserve, but the rest of it is land that is managed for many things including food production, clean water and other economic land uses, such as shooting. In those cases, the way one takes science into practice has to be adapted so that the practice can sit effectively alongside other land uses, otherwise it just creates conflict. During my time with the Trust I’ve seen that conflict happen time and again, especially in the uplands where NE finds itself as regulator of SSSIs determining practical land management on the ground. These are situations where, in modern parlance, one needs to find compromises to achieve human-wildlife coexistence. NE has no decision-making mechanism that allows it to do that at present, but good models are now out there, and I hope they can take us forward.
What is the key to successful fundraising? The fact that somebody has chosen to give their hard-earned
gwct.org.uk
What’s your favourite landscape and wildlife? Favourite landscapes are those with a big sky, so Wiltshire’s chalk downland or Yorkshire’s moorland. Then there are things that are so stunning and exotic one almost can’t believe they’re in England; my two favourite examples of those are bluebell carpets under beechwoods and displaying black grouse.
What are the things you are most likely to miss about GWCT? The people: staff, our chairman, trustees and vice-presidents, members, donors, gamekeepers and farmers. I’ll also miss having a farm to visit – the Allerton Project always provided fresh inspiration about how to get more wildlife alongside good farming.
Where do you see future opportunities for the organisation? The GWCT is an extraordinary organisation. It’s done much of the science that shows how to restore wildlife. It knows how to work with the people who look after 72% of our land and it’s developed the mechanism of Farmer Clusters and Environmental Farmer Groups through which all of those people can be galvanised into action to work collaboratively to achieve nature recovery. I think the GWCT has a wonderful future. It has found an excellent new chief executive in Nick von Westenholz and I wish him every success. I will do anything I can to support him and I really look forward to watching him take the GWCT from strength to strength supported by our dedicated trustees, amazing staff and scientists, incredibly generous supporters and the large number of farmers and gamekeepers who want to make the land they look after a better place for nature.
What are you planning to do post GWCT? Have more time at home with my husband and do some hobbies that I enjoy. But also, I’m hugely looking forward to remaining involved with the Environmental Farmer Groups. GWCT RESEARCH REPORT • 2024 | 9
I
ENGLAND
WALES
ALASTAIR LEAKE DIRECTOR OF POLICY
LEE OLIVER DIRECTOR OF WALES
n 2024 we saw the maturation of the Environmental Land Management Scheme (ELMS), as the base standard Sustainable Farming Initiative (SFI) completed its rollout during the summer. This scheme has had several iterations since the first pilots were rolled out and is now refined and improved. The SFI scheme has the potential to deliver ‘public money for public goods’ across the farmed landscape in England. Its flexibility allows farmers to sign up some areas of their farm but exclude others and to join the scheme at a time of their own choosing. Particularly welcome are the whole field options, where land can be given over to legume-based pollen and nectar mixes that help to sustain pollinators while building soil fertility and reducing pressure from arable weeds, and payments for controlling grey squirrels and mink to benefit native wildlife. Mid-year saw the election of a new Government with new priorities including commitments to strengthen Britain’s food security, boost rural growth and speed up nature’s recovery. Natural England, celebrating 75 years since the designation of the first National Parks, signalled the adoption of a new strategy to move from focusing simply on nature conservation to nature recovery. This change of focus is especially pertinent since most National Parks do not presently meet the levels of wildlife required to be eligible contributors to the 30by30 targets. We have been busy looking at what ‘Other Effective area-based Conservation Measures’ (OECMs) might be considered as eligible contributors to these targets, particularly within the Environmental Farmer Groups. Further to the success of our wildfire workshop in January 2023, chaired by Lord Deben, then chair of the climate change committee, we have continued to emphasise the increased risk of severe wildfires that the reduced management of our seminatural habitats presents. We led a visit by Defra, Natural England, and the Home Office to the Peak District to highlight the threat posed by wildfire to peatland restoration, as well as other public goods such as water and air quality, carbon storage and biodiversity. During the year we also highlighted the concerns of land managers and farmers about the future of bracken management following the withdrawal of the herbicide Asulox in 2023. This change in bracken management is also intricately connected to an increased risk of tick-borne diseases. 10 | GWCT RESEARCH REPORT • 2024
T
he last few years in Wales have been hard for land managers and working conservationists. The banning of snares and humane cable restraints for fox control, and the removal of magpies from the General Licence have increased the pressure on vulnerable species. This is not to mention the devastating effects of TB within rural communities, coupled with the end of Glastir farm subsidies and the formation of the new Sustainable Farming Scheme (SFS). All have caused a lot of uncertainty. Welsh Government leadership and the cabinet changed in spring 2024. This gave a glimmer of hope for the countryside with the appointment of Huw Irranca Davies as minister for climate change and rural affairs. He came with respected countryside credentials One of the first things he did was listen to the concerns of farmers and land managers regarding the required ‘Universal actions’ within the SFS scheme – especially the need for 10% tree cover on every farm taking part. This resulted in the Government dropping the 10% tree cover requirement. The result was more confidence in the Government, encouraging open, honest conversations. Huw Irranca-Davies subsequently became deputy first minister but retained the rural portfolio. This was much to the relief of farmers and land managers as it continued the momentum he had initiated and maintained the confidence of farmers. Since then, GWCT Wales has had several meetings with the deputy first minister. We are actively involved in the SFS stakeholders’ group, who will help design future schemes. In October we held our first event in the Senedd to talk about the plight of the curlew. This was attended by more than one hundred cross party attendees with presentations from Mark Isherwood MS (CON), Llyr Gruffydd MS (Plaid) Owen Williams (GWCT), Lee Oliver and Huw Irranca-Davies. Our Curlew Connections project, funded by the Welsh Government, is entering its final year with remarkable success and momentum. Without farmers GWCT Wales cannot help wildlife thrive. We see them as the answer to the biodiversity crisis, not the problem. We have recently applied for the latest Welsh Government rural funding, Integrated Natural Resources Scheme. Our plans are to work with eight farms from our ‘farming community’ network. This project will show the excellent work farmers do for conservation and the valuable research we can facilitate with them.
POLICY |
The Wildlife Management and Muirburn (Scotland) Act was passed in March, introducing licencing for grouse shooting and muirburn
SCOTLAND ROSS MACLEOD HEAD OF POLICY
© Laurie Campbell
T
gwct.org.uk gwct.org.uk/policy
he Wildlife Management and Muirburn (Scotland) Act was passed in March, introducing licencing for grouse shooting and muirburn. This concluded nearly seven years of scrutiny. GWCT provided evidence throughout this period, initially with expert witness contribution to the ‘Werritty’ Grouse Moor Management Review, via the Langholm Moor Demonstration Project and through our long record of peer-reviewed research papers covering upland conservation and predation impacts. We contributed to both the Grouse and Muirburn Code Working Groups throughout 2024, as well as the Moorland Management Best Practice Guidance Group, to help build clarity regarding legal and good practice requirements. In advance of the Act, we devoted considerable effort to providing land managers and keepers with the means to collate evidence necessary for demonstration of sound management and biodiversity gain. This initiative has been central to the development of our ‘Best Practice with Proof’ appbased recording approach. The value of the evidence base will increase in importance as NatureScot starts compliance monitoring for grouse moor management through desk-top checks, on-site visits and in advance of license renewals. The Agriculture and Rural Communities (Scotland) Act was passed in June, introducing public funding support changes and increased focus on environmental good practice. Although secondary legislation will be necessary to define how this works in practice, the development of best practice recording for licensing provides a template on which the GWCT can design advisory support for farmers. Practical work at the Game & Wildlife Scotland Demonstration Farm at Auchnerran and on our Farming Arable Biodiversity project site in Fife continued to inform our policy engagement with the Scottish Government during 2024. We emphasised the importance of cross-sector collaboration in achieving the ambitions of the Agriculture Act and the Scottish Biodiversity Strategy to the minister for agriculture and connectivity when he visited the GWCT Scottish Game Fair in June. GWCT RESEARCH REPORT • 2024 | 11
ADVISORY ROGER DRAYCOTT DIRECTOR OF ADVISORY
D
uring 2024 the advisory team experienced significant demand from farmers and estate owners and managers for biodiversity surveying from all corners of Britain. Our clients increasingly see monitoring of natural capital assets as core to their approach to managing a successful rural business. For example, we undertake annual monitoring of breeding birds and butterflies on farmland and woodland on a growing number of farms and estates. These surveys show how habitat provision and management influences the number and species diversity in different habitats, and allows us to benchmark progress over time and compare performance against regional and national figures. It can also provide insight into how particular types of land management (eg. game management) compares with non-game managed areas. In the current climate, game management is increasingly under the spotlight and data can demonstrate that a farm or shoot is delivering a net biodiversity gain. We firmly believe that to secure a long-term sustainable future for game shooting, all shoots should be able to demonstrate that they are delivering a net biodiversity gain, ie. that there is more wildlife on the farm because there is a shoot than there would be if there wasn’t. During 2024 we surveyed more than 59,000 acres of farmland and woodland for baseline biodiversity net gain projects. These boots-on-the-ground audits, combined with detailed digital mapping and analysis, provide farms and estates with a detailed understanding of the current value of biodiversity and potential opportunities for improving their natural assets. They are essential for land managers to be able to access environmental trades and offset markets. The advisory team have 13 advisors who are competent in the use of the Defra Biodiversity Metric which is the statutory measure by which biodiversity units are calculated. We also started our first Habitat Management and Monitoring Plans (HMMPs) in 2024, which are required for statutory Biodiversity Net Gain projects in England. We also launched our Practitioner Science Programme, (essentially citizen science but the data are collected by farmers, gamekeepers and wildlife managers) including employing two practitioner science project officers to promote and develop existing and future practitioner science programmes. We are developing a GWCT data hub that will enable practitioners to collect data in the field using digital technology to aid decisions and, if shared with GWCT, contribute to large datasets supporting our research programme and helping to inform policy. We look forward to sharing more over the coming months.
12 | GWCT RESEARCH REPORT • 2024
FUNDRAISING |
On behalf of all at the GWCT, sincere thanks to everyone who made this another strong fundraising year
FUNDRAISING JEREMY PAYNE DIRECTOR OF FUNDRAISING
F
© Bob L Parker
or the first time the combined efforts of all those involved generated an income of more than £3 million, a remarkable achievement against a challenging backdrop of financial uncertainty. Our major donors are the backbone of our voluntary income. Growth in this area (which means more people being more generous) has directly enabled expansion of the GWCT’s work in science, policy, advisory, and communication and education. We also owe a particular debt of gratitude to those supporters who gave us auction lots, whether that was a full day for eight guns, a day’s fishing or a sculpture. All of this is generosity that supports so much of our fundraising. GCUSA had another strong year under the leadership of Ron Beck supported by Robyn Hatch. The profile of our income there has transformed with the auction being matched by other fundraising activities led and supported by the trustees. Our county committees work hard for every pound they raise, but they’re also vital as both eyes and ears, and as a way for us to spread our message face-to-face. In London the same amount of hard work by the team produced less income this year as people seemed to be less keen to buy tickets and bid on lots. Michel Roux Jr. at The Langham was a particular highlight, and we have been successful in engaging a younger audience.
gwct.org.uk
Scotland: Despite ongoing challenges including the cost of living, the regional committees still managed to accomplish fantastic results in 2024. Our flagship Scottish Auction, held at Prestonfield House Hotel, was again the frontrunner helping to account for over half of our regional income for the year. Meanwhile, the West of Scotland committee were just short of matching their best fundraising record of 2023. The Highland committee returned to the fundraising fold with two events including a walk and talk, which are integral in our attempts to engage with members and educate and update them on our advisory services. The Grampian committee followed up its recordbreaking event in 2023 by improving on it, raising more than £50,000 which was a phenomenal success. Major donor fundraising remains an essential pillar of our income, and 2024 saw continued support from our generous donors. Their contributions were instrumental in funding key policy work and research initiatives, ensuring we can continue to deliver impactful conservation across Scotland. On behalf of all at the GWCT, sincere thanks to everyone who made this another strong fundraising year. GWCT RESEARCH REPORT • 2024 | 13
© Laurie Campbell
SECTION 1 AQUATIC ECOSYSTEMS
14 | GWCT RESEARCH REPORT • 2024
Aquatic ecosystems 16
Salmon population on the River Frome
18
Automating fish detection on salmon counters
20
Grayling and brown trout on the River Wylye
22
Beaver dams and trout
Wild Atlantic salmon are in crisis. The species could be lost from many of our rivers within our lifetime if we don’t act now
gwct.org.uk gwct.org.uk/salmon
GWCT RESEARCH REPORT • 2024 | 15
| ATLANTIC SALMON
Salmon population on the River Frome At the Salmon & Trout Research Centre at East Stoke we carry out research on all aspects of wild Atlantic salmon, trout, grayling, and eel life history and have monitored the run of adult salmon on the River Frome since 1973. The installation of our first full-river-coverage PIT-tag systems in 2002 made it possible for us to study the life-history traits of salmon and trout at the level of the individual fish. The PIT-tag installation also enabled us to quantify the smolt output. The River Frome is one of only 12 index rivers around the North Atlantic reporting to the International Council for Exploration of the Sea on the marine survival of wild Atlantic salmon.
P
average of 9,337. Smolt estimates for 2024 were 24,096 (± 3,411 95% CI) — this is 124% above the 10-year average (10,764). Hence we are expecting a good adult run in 2025 and/or 2026 (depending on the ratio of one sea-winter to two sea-winter returning adults) from this 2024 smolt cohort, if marine survival remains stable.
Smolts: Due to heavy rains and floods, smolt trapping started on the 18 April 2024 rather than in March as is usual. The peak of the smolt migration took place in mid-April during a heavy discharge period. The estimated number of salmon smolts at East Stoke in 2023 was 10,958 (± 1,429, 95% CI, see Figure 2). This is 17% above the 10-year
Adults: In 2023 the total annual estimate of returning adult salmon to the River Frome from the counter was 467 salmon, which is 26% below the 10-year average (636). In 2024 there were an estimated 432 adult salmon returning, 34% below the 10-year average (659; see Figure 3), this is despite a slightly above average smolt cohort for 2022 and 2023, indicating low marine survival for these two cohorts (see Figure 3). These results indicate increased survival from parr to smolt in recent years and a decline in ‘at seaʼ survival. It should, however, be noted that the estimates of the number of juveniles are known to fluctuate much more than estimates in the number of adults.
arr: Each year we estimate the number of juvenile salmon called parr, in the Frome, from the number of parr PITtagged during our autumn fieldwork programme and the subsequent ratio of recaptured parr, now called smolts caught in our fish trap on the lower Frome, the following spring as they migrate to sea. The estimate of the number of salmon parr for autumn 2023 was 142,908 (± 20,204 95% confidence intervals, CI). This is 50% above the 10-year average (94,830; see Figure 1), as opposed to 2022, when the parr estimate was 7% below average (82,846 ± 10,718 95% CI). During 2024 parr tagging, only 4,594 parr were tagged, compared with an average of 9,460 parr caught since 2005.
Figure 1 Estimated number of salmon parr in the Frome catchment in September with 95% confidence intervals (2005-2023)
Mean parr estimate between 2005 and 2023 10-year mean (2013-2023)
160,000 140,000
100,000
SALMON PARR
80,000 60,000 40,000 20,000
2006
2008
2010
2012
2014
Year
16 | GWCT RESEARCH REPORT • 2024
2016
2018
2020
2022
A salmon parr is a juvenile salmon and in the UK can live in rivers for onethree years before migrating to sea in spring. In the River Frome, salmon parr migrate to sea at one year old and are then called smolts, returning as adults after usually between one to two years feeding in the North Atlantic ocean.
© Laurie Campbell
Parr estimate (± 95% CI)
120,000
AQUATIC ECOSYSTEMS |
Figure 2
Smolt estimate (± 95% CI)
Estimated spring smolt population with 95% confidence intervals between 2012-2024
Mean smolt estimate between 2012 and 2024
20,000
PIT TAG
A PIT tag is a small tag with a unique identification code and is the same tag a vet would put into a dog or cat. The tags can be scanned either manually by hand or automatically by our tag readers installed in the River Frome.
10,000
0 2012
2014
2016
2018
2020
2022
2024
Year
Figure 3 The long-term annual net upstream movement of adult salmon*
*Prior to 1985 the counter did not take downstream movement into account, this has been corrected in this figure. Note the counter was not working well during 2001 and 2012-2014, when particularly low counts were observed.
4,000
Net upstream salmon count
Average number since 1973 to date Average for the last 10 years
3,000
2,000
1,000
0 1970
1975
1980
1985
1990
1995
2000
2005
2010
2015
2020
2025
Year
KEY FINDINGS The estimates of parr encountered during 2023 (surviving juveniles produced from 1SW adults in 2022 and 2021) were high (142,908, 95% CI 20,204, 50% above the 10-year average). This promises high numbers of returning adults in 2025 if survival at sea does not decline. However, the number of parr tagged in 2024 was 49% below the 20-year average (4,594 individuals caught compared to the mean of 9,460) which may lead to low smolt estimates in 2025. The estimated smolt output of the River Frome in 2024 was up 124% (24,096 smolts, with 95% confidence intervals ± 3,411) compared with the 10-year average 10,764. This most likely reflects the heavy spring rains. The number of adult salmon returning to the River Frome continued to decline in 2023 and 2024. For both years adult returns were below the 10-year average (26% and 34% respectively) as measured by the fish counter. Sophie Elliott gwct.org.uk/salmon
GWCT RESEARCH REPORT • 2024 | 17
| COUNTING SALMON
The River Frome counter which was installed in 1970.
Automating fish detection on salmon counters
O
n the River Frome, in Dorset, we have been collecting data on adult Atlantic salmon returning from the sea since 1973. Various pieces of equipment have been used to collect and interpret these data, notably the use of a resistivity counter which produces trace waveforms and video recordings, when fish swim past our counter. From the resistivity counter, passing salmonids (salmon and trout) can be identified from distinctive waveform signals as they pass over the electrodes (see Figure 1). To date, to obtain estimates of the number of passing Atlantic salmon, hundreds of hours of staff time has been required to manually examine 1,000s of waveform signals and their associated video images. Salmon identification is then based on existing knowledge of salmon migratory periods and their body length and shape at the time of migration. Within the fisheries team, we have implemented a series of deep learning models to automate identification of salmonids from these waveform and video images (see Figure 1 and 2). Although this work is not yet complete, our results have led to an increased number of returning salmon identified compared with the traditional method. 18 | GWCT RESEARCH REPORT • 2024
Specifically, from the trace data, we were able to detect 43% more salmonids (Atlantic salmon and anadromous brown trout) waveforms than the traditional method (with some 7% more salmonids >30cm, since the new method can also process juveniles). The modelling method to detect Atlantic salmon from video data correctly identified salmon with 81% accuracy and measured the lengths of >20% more returning adults than traditional methods. This new method also far outpaces traditional counting methods in terms of time taken. Beyond identifying salmon, we are also able to identify other species, with a confidence estimate attached to each. Over the coming year we hope to have completed this work and gained increased accuracy for species identification, abundance and length estimates. The team are working with the Environment Agency (EA) to be able to trial these techniques on another salmonid river for validation. Initial exploration has shown that, because of better quality images on other rivers (the River Frome’s water is quite murky), more accurate identification should be achieved. It is hoped that, with the support of the EA, we will be able to roll this out at a national level.
© GWCT
The GWCT’s fisheries team have begun trialling deep learning modelling methods to process our resistivity counter data more accurately and efficiently. We use these counter data to count fish in the river. Deep learning models are a type of machine learning which uses artificial neural networks to perform computations on large amounts of data. As fish pass over the resistivity counter large amounts of trace waveforms are produced for which salmonids can be identified from the specific waveforms produced. The team also collects large amounts of video data to help confirm waveform identifications and narrow down this identification to a species level (salmon or trout) when the image is clear enough. Various deep learning models have been used to facilitate automated identification of salmonids (Atlantic salmon and sea trout), and to estimate their length. The new method is being compared with traditional salmon estimates with exceptional results.
AQUATIC ECOSYSTEMS |
Figure 1 Examples of data generated by the resistivity counter on the River Frome. The characteristic waveform data generated by (a) a salmonid, and (b) background noise (note different y-axis) a
b
0.8 0.6
0.2
0
0.2
Amplitude
Amplitude
0.4
0 -0.2
-0.2
-0.4
-0.4 -0.6
-0.6
Time frequency
23:15:47
23:15:46
23:15:45
23:15:44
23:15:43
23:15:42
23:15:41
23:15:40
23:15:39
23:15:38
23:15:37
11:11:27
11:11:26
11:11:25
11:11:24
11:11:23
11:11:22
11:11:21
11:11:20
11:11:19
11:11:18
11:11:17
-0.8
Time frequency
Figure 2 Automated fish identification from deep learning modelling techniques on the River Frome using video data with individual species identification confidence (between 0 and 1). (L-R) Eel, salmon and mullet
KEY FINDINGS Deep learning models are being used to support salmon abundance estimates, using the River Frome’s resistivity counter and video data. Although the complete dataset has not been analysed, we are able to detect more returning adult Atlantic salmon using these models compared with estimates from experienced fisheries scientists. Specifically, the new waveform part of the deep learning model was able to detect 43% more salmonid waveforms than the traditional method was able to detect (with some 7% more salmonids >30cm, since the new method can also process juveniles). The deep learning video analysis models were able to detect salmon with 81% accuracy from testing data and measure the lengths of >20% more returning adults than traditional methods. These methods are currently being expanded to identify other endangered diadromous fish (eg. the river and sea lamprey, and European eels). Sophie Elliott & Keerthan Boraiah gwct.org.uk/salmon
GWCT RESEARCH REPORT • 2024 | 19
| RIVER WYLYE
Grayling and brown trout on the River Wylye The European grayling is a member of the salmonid family, found in the UK and central and northern Europe. It is typically a freshwater species which, owing to its distinctive large and iridescent dorsal fin and streamlined body-shape, is affectionately known as the ‘Lady of the Stream’. The Wylye Grayling and Trout Study (WGTS) has been monitoring European grayling and brown trout since 1996 on the River Wylye, a tributary of the Hampshire Avon. This makes the dataset one of the longest continuous time series of a European grayling population.
S
ince 1996, European grayling and brown trout have been monitored on the River Wylye, a tributary of the Hampshire Avon (see Figure 1). The annual fishing survey, which is supported by the GWCT, the Grayling Research Trust, and the Piscatorial Society, takes place each autumn. Survey methods have evolved with improvements to telemetry technology and increased capacity. Six sites have been continuously monitored since 1996, and from 2009 onwards, have been quantitatively electro-fished (ie. multiple fishing passes) to collect data on numbers of grayling and brown trout, as well as morphological data, such as length and weight. Additionally, since 1999, all caught grayling are tagged so that we can monitor movements, growth, and survival of recaptured individuals. Long-term monitoring is a powerful tool in the management and conservation of species. Only with consistent surveying of populations can we build up time series data to be able to detect trends over time. Grayling abundance, while fluctuating between years, appears to have declined over time, with the mean number of newly caught grayling in a single fishing pass since 2018 (ranging from nine to 18) consistently below the long-term average (n = 34) (see Figure 2a). Similarly, mean abundance of small trout (≤ 150mm in length) caught in a single fishing pass has declined from 69 to 29 between 2018 to 2024 (see Figure 2b). Comparatively, mean abundance of larger trout (> 150mm in length) caught in a single fishing pass appears to have increased over
time, from 63 to 84 between the first half (1996 to 2010) and second half (2011 to 2024) of the time series (see Figure 2b). Detecting trends is an essential first step in understanding the status of a population; determining what is driving trends is often more difficult as the availability of covariates describing potentially influential biological and environmental factors is often limited and generating robust estimates of population structure can require bespoke analysis. Nonetheless, previous GWCT studies using these grayling data (see Review of 2018, pp.32-33 and Review of 2020, pp.58-59) have identified several factors considered detrimental to both survival and growth of grayling at various lifestages. These include low flow and high temperature events during summer and increased macrophyte cover. In June this year, these findings were presented to members of the Trout and Grayling Group (Environment Agency and Natural Resources Wales), in discussions shaping the group’s future grayling research priorities at a meeting hosted by the GWCT and the Piscatorial Society on the banks of the River Wylye. The 2024 survey was successfully completed despite challenging field conditions following the unusually wet spring and summer months. We caught a total of 127 grayling and a total of 949 trout. Grayling body length ranged from 106 to 416mm with a mean length of 265.5mm and the length of trout ranged
Figure 1 Location of the six long-term monitoring sites on the River Wylye (main channel shown in black) and its situation within the Hampshire Avon catchment, and the location of the Hampshire Avon (black rectangle) in the UK (inset map) 8km
Lower Parsonage
51.20 °N N
Rive
Below Boyton Stockton
51.10 °N Salisbury 51.05 °N 2.2 °W
2.1 °W
2.0 °W
20 | GWCT RESEARCH REPORT • 2024
1.9 °W
Upton Lovell Heronry
Rive
51.15 °N
rA von
rW ylye
1.8 °W
1.7 °W
© Benny337, Kuttelvaserova Stuchelova
Lower Knook
AQUATIC ECOSYSTEMS |
from 68 to 408mm with a mean length of 184.3mm. Of grayling caught in the first fishing pass, the percentage of age 0+ grayling was lower (11.8%) than the long-term average (30.8%) and the percentages of ages 1+, 2+, 3+ and 4+ were higher (42.2%, 25.5%, 12.7%, and 7.8%, respectively) than the long-term averages (33.4%, 19.9%, 10.1%, and 4.1%, respectively). We always aim to review and improve our sampling methods for the benefit of the study species as well as the data collection. This year we trialled a new tagging method for grayling older than 0+, reducing the
amount of processing time and thus, the time that the fish spent out of the water. We have also expanded the data collected on trout to include weight, a useful metric for assessing condition of individuals. Next steps for the Wylye study will be to understand better the drivers of changes in grayling population dynamics, particularly under predicted climate change scenarios, and to begin to use this valuable dataset and the research to date, to implement and monitor management actions that aim to improve habitat conditions for this iconic species.
Figure 2 The mean number of a) grayling and b) brown trout caught during electro-fishing on the River Wylye over time. Grayling are categorised as newly tagged fish or recaptured tagged individuals, and trout are classified by length: > 150mm and ≤ 150mm. Panels indicate the change in electro-fishing methods over time from semi-quantitative (single-pass fishing, 1996 to 2008) to quantitative (depletion electro-fishing, 2009 onwards)
Number of grayling (± 1 SE)
a
Semi-quantitative
Quantitative New fish
75
Recaptured tagged individuals
50
25
0 1996
2000
2004
2008
2012
2016
2020
2024
2020
2024
Year
Number of brown trout (± 1 SE)
b
Semi-quantitative 125
Quantitative
> 150mm length ≤ 150mm length
100 75 50
25 1996
2000
2004
2008
2012
2016
Year
KEY FINDINGS 2024 marked the 29th year of data collection for European grayling on the River Wylye. Since 2018, the mean number of newly caught grayling in a single fishing pass (ranging from nine to 18 between years) has been consistently lower than the long-term average (n=34) and well below the peak in 1996 (n=75). Similarly, mean abundance of small brown trout (≤ 150mm in length) caught in a single fishing pass has declined from 69 in 2018 to 29 in 2024. In contrast, mean abundance of larger brown trout (> 150mm in length) caught in a single fishing pass appears to have increased across the time-series, from 63 (1996 to 2010) to 84 (2011 to 2024). In the 2024 survey we caught 127 grayling and 949 brown trout. Jessica Marsh gwct.org.uk/grayling
GWCT RESEARCH REPORT • 2024 | 21
| BEAVERS
Beaver dams and brown trout The return of Eurasian beaver to large areas of Europe represents a conservation success with the current European population estimated to be around 1.2 million individuals. Beaver reintroduction to many areas, including Great Britain, has been controversial in some cases. Despite numerous documented benefits for biodiversity, concerns related to localised flooding, adverse impacts on land use and engineered structures (eg. culvert blockage), and disease spread have been raised. An important concern is the influence of beaver habitat modifications on fish that need to migrate up and down rivers. This is particularly important in relation to the migratory behaviour of economically important salmonids such as brown trout and Atlantic salmon, the latter now classified as endangered in Britain.
22 | GWCT RESEARCH REPORT • 2024
Figure 1 Study site where the movements of brown trout were investigated in response to fluvial landscape modification by Eurasian beaver. The map illustrates the modified stream post-beaver modification and the surrounding landscape and habitat types. The inset map illustrates an overview of the site, with the loch in the north and control stream to the east of the modified stream. The position of beaver dams, passive integrated transponder (PIT) loops (to monitor fish movement), and water data loggers (to monitor depth and temperature) are indicated
© Robert Needham, Laurie Campbell
W
e investigated the impacts of a series of four beaver dams on the upstream movement of brown trout during the spawning period (October to December) at a field site in Scotland, quantifying the possible impact of beaver dams on the movements of brown trout (hereafter trout). Individual motivation was assessed through movement patterns based on telemetry data with some individuals displaying highly motivated movements, while others showed no movements during the study period. The study site comprised two streams entering a common loch, one modified by a series of four beaver dams, the other remained unaltered (see Figure 1). Electro-fishing was used to capture trout in both streams and the loch from autumn 2014 to autumn 2016. Trout were anaesthetised, fork length and weight were recorded, and trout greater than 80 millimetres (mm) were PIT-tagged (n = 701). To establish if passage success was related to flow conditions, rainfall data were obtained from a local weather station six kilometres from the site. PIT telemetry antennae were installed below and above each dam to monitor the passage of trout during the monitoring period. This included trout spawning movements in 2015 (high flows) and 2016 (low flows). There was a distinct difference in passage success between years, with high flows (using prior rainfall as a proxy measure) and larger fish size being important positive predictors of upstream passage success. A combination of environmental (prior rainfall and water temperature) and biotic (fish size) factors influenced passage success with high flows being a significant factor at all four dams used to define trout passage dynamics. This provided the best explanation for fish passage at two of the four dams. Survival analysis and associated modelling indicated that migratory delay was inversely related to previous passage success (see Figure 2), while motivation was also a determinant of success, with the highest probability of passage in highly motivated trout. Beaver dams may pose a greater challenge in the future due to shifting climatic conditions if periods of warmer and drier weather persist and coincide with peak migratory movements of fish.
AQUATIC ECOSYSTEMS |
Figure 2 Passage prediction plots, illustrating how the probability of remaining below a dam (ie. failing to pass a dam) is affected by two fish characteristics. 1. Whether a fish was attempting their first passage or whether this was a repeat passage; 2. Fish size fork length of 100mm versus fish with fork lengths of 300mm. The solid and dashed lines represent estimated proportion remaining, and the dotted lines indicate 95% prediction intervals Repeat passage 1.0
Dam 2 First passage Repeat passage
0.8
Probability (remaining below dam)
Fish lengths 1.0 0.8
0.6
0.6
0.4
0.4
0.2
0.2
0
0 0
5
10
15
1.0
20
25
Dam 3 First passage Repeat passage
0.8
0
5
10
1.0
0.6
0.4
0.4
0.2
0.2
15
20
25
Dam 3 Fish length = 100mm Fish length = 300mm
0.8
0.6
0
Dam 2 Fish length = 100mm Fish length = 300mm
0 0
5
10
15
20
25
Days
0
5
10
15
20
25
PIT telemetry antennae were installed above and below each dam to monitor the passage of trout.
KEY FINDINGS Given the right environmental and biotic factors, brown trout are capable of passing beaver dams. Under certain conditions, beaver dams can impede the movement of brown trout. The barrier effects of beaver dams are exacerbated under low flow conditions. Shifting climatic conditions may result in beaver dams presenting a greater challenge at times of peak migratory movements of fish in future. Robert Needham gwct.org.uk/trout
GWCT RESEARCH REPORT • 2024 | 23
© Tarquin Millington-Drake
SECTION 2 SUSTAINABLE GAME MANAGEMENT
24 | GWCT RESEARCH REPORT • 2024
Grey partridges face many of the same challenges as other farmland birds – a lack of insect-food for their chicks, little suitable nesting and winter cover, and increased predation pressure
Sustainable game management
gwct.org.uk
26
Grey partridge counts
28
The effects of pheasant releasing on habitats in designated woodland areas
32
Red grouse monitoring: now and into the future
36
Long-term changes in gamebirds and releasing
GWCT RESEARCH REPORT • 2024 | 25
| PARTRIDGE COUNT SCHEME
ACKNOWLEDGEMENTS
We are extremely grateful to GCUSA for its ongoing support of our grey partridge work.
Grey partridge counts Partridge counts offer valuable insight into how well your partridges breed, survive, and benefit from your habitat and management provision throughout the year. Each count (spring and autumn) is easy to carry out and helps measure how the birds have fared during the previous six months without the need for continual monitoring. Find out more about the Partridge Count Scheme at gwct.org.uk/pcs.
T
he results of the 2024 spring and autumn grey partridge counts – undertaken by participating farmers, gamekeepers, and land managers across the country – are summarised in Table 1. The weather conditions and timing of the counts complicate interpreting this year’s results. After a cold beginning to the year, spring was unsettled and very wet, with counting particularly challenging for those who were still able to try. It was not until May, when more typical conditions for spring resumed and sodden land had dried out sufficiently, that many Partridge Count Scheme (PCS) participants could access their ground. The PCS received 452 spring counts in 2024 (a small but welcome increase on 2023). PCS participants recorded a total of 5,324 grey partridge pairs, 314 fewer pairs (-5.6%) than in 2023. They surveyed 139,900 hectares (ha) (345,700 acres) across the
UK – a 4% decline compared to the 146,000ha (360,800 acres) surveyed in 2023. Despite fewer pairs seen and a dip in the area counted, the average spring pair density over all PCS sites increased slightly (by 6%) to 5.1 pairs/100ha. However, there was great variation in density between regions in 2024. Eastern and northern England recorded 50% and 23% of all grey partridge pairs counted in the PCS this year. Overwinter survival (OWS) is calculated using counts from sites that returned information from both autumn 2023 and spring 2024. Nationally, the mean OWS for 2023/24 was 59%, an increase from 2023. While northern, eastern and Midland regions reported the highest OWS, it was northern England and Scotland that achieved the largest increases in overwinter survival. This may be due to their improved 2023 autumn densities fortuitously offsetting subsequent winter losses.
TABLE 1 GREY PARTRIDGE COUNTS Densities of grey partridge pairs in spring and birds in autumn 2023 and 2024, from contributors to our Partridge Count Scheme
Region
2023
2024
Spring pair density (pairs per 100ha) 2023
2024
Change (%)
Number of sites counted in autumn 2023
2024
Young-to-old ratio (autumn) 2023
2024
Autumn density (birds per 100ha) 2023
2024
Change (%)
South 64 56 1.5 2.1 40 75 57 2 2 9.6 11.1 15.6 East 141 146 5.9 5.6 -5.1 123 124 2.5 2 24.1 25.8 7.1 Midlands 53 65 3.6 3 -16.7 61 55 2.7 1.9 26.8 14.2 -47 Wales 1 2 0 0 1 1 0 0 North 108 112 7.2 7.6 5.6 106 72 3 1.9 36.1 21.6 -40.2 Scotland 70 71 3.2 4.6 43.8 56 44 3.2 2.9 17.8 17 -4.5 Overall 437 452 4.8 5.1 6.3 422 353 2.7 2.1 24 19.6 -18.3 The number of sites includes all that returned information, including zero bird counts. The young-to-old ratio is calculated where at least one adult grey partridge was counted. Autumn density was calculated from sites that reported the area counted. No counts were made in Northern Ireland.
26 | GWCT RESEARCH REPORT • 2024
© Tarquin Millington-Drake
Number of sites counted in spring
SUSTAINABLE GAME MANAGEMENT |
The spring pair density for long-term sites (participating before 1999) and ‘new’ sites (joined since 1999) showed little difference with 3.6 pairs/100ha (250 acres) and 3.9 pairs/100ha (250 acres) respectively. It is encouraging to see that, given the difficulties in counting, PCS sites appear to have ‘held their own’ in 2024. This is especially important for the index on the long-term sites, where a 35% drop was recorded in spring 2023. According to the UK Met Office, September 2024 was wetter than average for the UK overall (125% of the long-term average), and particularly for southern England, which recorded 144.4mm of rainfall, 233% of the long-term average and the third-wettest September on record. Although there was a respite from the rain in early October, this was followed by several storms. For PCS members who had to choose between farming operations and counting grey partridges the conditions compelled them to prioritise farming. The early wet conditions, followed by changeable weather, meant that in autumn 2024 only 342 counts were submitted to the PCS. The number of grey partridges recorded nationally by PCS participants was 14,900 – a drop of 6,900 birds from 2023 (-32%), reflecting the large drop in counts. This was from a total area counted of 103,900ha, 28,900ha lower (-22%) than in 2023. Yet again, eastern England reported the greatest proportion of birds counted by PCS participants, with 6,180 birds recorded (42% of
the total counted), with northern England and Scotland recording 2,531 and 2,423 birds respectively (each about 17% of the total). The Young-to-Old ratio (YtO) for the whole of the UK averaged 2.1 YtO. Comparing with the past decade, this is at the lower end of breeding success – on a par with 2016 and 2019 (both 2.1 YtO). Yet, like the weather, regional YtO was variable. Scotland achieved the highest YtO with 2.9 respectively. Nationally, average autumn bird density was 19.6 birds per 100ha. The Midlands and northern England saw the largest decrease in density compared with 2023, with 14.2 birds per 100ha (down 47% compared with 2023) and 21.6 birds per 100ha (a decrease of 40% compared with 2023), respectively. Only eastern England reported an increase in grey partridge density and recorded the highest average density with 25.8 birds per 100ha (an increase of 7% compared to 2023). Although the drop in autumn counts undertaken by PCS participants is a concern, the productivity (YtO) figures for 2024 do not suggest a catastrophic decline, which might lead to avoidance in counting if things are bad. What this does seem to indicate is that partridge counts (which need to be undertaken at specific stages in the partridge life cycle) are being impacted by environmental conditions. With the added instability of our climate year-to-year, partridge counting may become more challenging and time sensitive.
Figure 1
Spring grey partridge pairs per 100 hectares (95% CL)
Trends in grey partridge spring pair density, controlling for variation in different count areas
Long-term sites New sites
40 The disparity between the results of Table 1 and Figure 1 is due to more complex analysis in producing Figure 1 which, unlike Table 1, looks at the between-year changes within each site then averages those changes across sites. This adjusts for the fact that counts are not available for all sites every year and includes only sites with more than one spring count. This gives a more accurate long-term overview than is provided from Table 1.
35 30 25 20 15 10 5 0 1960
1965
1970
1975
1980
1985
1990
1995
2000
2005
2010
2015
2020
2025
Year
KEY FINDINGS National average spring pair density on PCS sites increased to 5.1 pairs per 100ha. Summer productivity, measured as Young-to-Old ratio, declined but at 2.1 young birds per adult remained above that needed to maintain grey partridge numbers. Autumn weather complicated the ability of PCS members to count. The result was that the number of counts returned was down by nearly one fifth, and the average autumn density also decreased by 18%. Neville Kingdon & Julie Ewald gwct.org.uk/pcs
GWCT RESEARCH REPORT • 2024 | 27
| PHEASANT RELEASING
The effects of pheasant releasing on habitats in designated woodland areas
W
e know there are elements of degradation of, for example, flora and soils at pheasant release sites, especially within pens containing high bird densities. Our current study investigates how evident these impacts, and potentially others, are at increased distance from the release pen. We used 20 pheasant release sites, located across England and Wales, all of which released into ancient semi-natural woodland (many were SACs), with each study pen releasing upwards of 800-1,000 pheasants. One of the strengths of the study was having a large sample of study sites spread widely across England, plus two in Wales. We measured various ecological variables at increasing distance from the edge of the release pen in plots up to 500 metres (m) away, along a transect route into or across the designated woodland. The 500m survey plot mirrors the extent of the buffer zone outlined in the licence. The route avoided other areas of game management where pheasants congregate, eg. game crops, feeding points, strawed rides, or other release pens. This was crucial to this study as the aim was to record ecological effects across a gradient, from an area of potentially high pheasant density (close to the release pen) through an area of woodland that the game manager does not encourage birds to use, but which pheasants may use to
28 | GWCT RESEARCH REPORT • 2024
some extent. We sampled in plots at the pen edge (5-10m from the wire fence), 100m, 250m, and 500m from the pen, and a control plot in the same or another woodland at least 1km away from the study pen and not closer to other game ‘hotspots’ (see Figure 1). The main concern driving the study was that extra nutrification, due to pheasant faeces, would affect the ecology of the woodland through eutrophication of the atmosphere and the ground. Firstly, we measured the nutrient status of the soil in each study plot at each of the sites. Together with any trampling and pecking by the birds, this might then affect ground flora composition and abundance. This was quantified and we also completed assessments of plant diversity, weediness, woodland indicator species, bare ground, and tree seedlings. Secondly, we looked at aspects of lichens in our study woodlands that might be affected via the atmosphere. Research has identified certain lichens and bryophytes that are either especially sensitive to, or tolerant of, increasing concentrations of nitrogenous pollutants in the atmosphere. We used an established field-survey method to assess percentage cover of these ‘indicator species’ on the trunks of suitable trees in each of our study plots at each site. We did lichen surveys on trees in winter 2023 through to early spring 2024 (Visit 1) and the ground flora and soil surveys in spring and summer 2024 (Visit 2).
© Maureen Woodburn, Chris Mole
Defra introduced licencing in England and Wales to regulate gamebird releasing on or near protected sites, namely Special Areas of Conservation (SAC) and Special Protection Areas (SPA). In summary, these licences (GL43 and GL45) require releases to comply with GWCT best practice guidelines in the protected areas, and within a 500m buffer zone around them. With the current licencing arrangements due for review in 2025, Defra and Natural England contracted the GWCT to carry out the research described here.
SUSTAINABLE GAME MANAGEMENT |
ACKNOWLEDGEMENTS
We are very grateful for the cooperation of the 20 estates involved in our study. This project was funded by Defra and managed by Natural England. We collaborated with the University of Exeter on data analysis and presentation (undertaken by Dr Joah Madden) and on soil chemistry analyses.
LICHENS
Lichens have no roots, obtain their nutrients from the atmosphere, and are therefore highly susceptible to changes in atmospheric chemistry. Consequently, they have been used as indicators of air quality for well over 100 years.
Figure 1 A diagrammatic representation of a typical area of broadleaved woodland, showing the location of a pheasant release pen (in red) and other game management ‘hotspots’ in the vicinity. An example transect (blue dashed line) containing five sampling points (A to E) is shown to illustrate the route, going from an area of potentially high pheasant density near the pen edge (A) to lower pheasant density at 500m (D) and the ‘control’ point (E) at approximately 1km from the release pen (note, D to E is not to scale). Points B and C are located at approximately 100m and 250m from the pen edge respectively
gwct.org.uk/sustainablereleasing
GWCT RESEARCH REPORT • 2024 | 29
| PHEASANT RELEASING
Figure 2 The probability of detecting germinating tree seedlings or saplings in a quadrat at five distances from the release pen during spring and summer surveys in 2024 Probability of detecting germinating tree seedlings and saplings (95% CI)
0.7 0.6 0.5 0.4 0.3 0.2 0.1 0
5-10
100
250
500
1,000 (control)
Distance from pen (m)
Figure 3 Estimated mean cover (%) by Nitrogen-tolerant and Nitrogen-sensitive tree flora (lichens and bryophytes) in quadrats on trees at five distances from release pens during winter/early spring surveys Estimated marginal mean coverage (%) of quadrat by Nitrogen tolerant tree flora (95% CI)
12
10
8
We found detectable effects at 250m from the release pen, but not at 500m
6
4
2
0
5-10
100
250
500
1,000 (control)
Distance from pen (m)
Estimated marginal mean coverage (%) of quadrat by Nitrogen sensitive tree flora (95% CI)
3.5 3.0
GWCT RESEARCH INTO POLICY
2.5 2.0 1.5 1.0 0.5 0
5-10
100
250
Distance from pen (m)
30 | GWCT RESEARCH REPORT • 2024
500
1,000 (control)
Current releasing licence restrictions are based on GWCT Advisory’s Guidelines for Gamebird Releasing, which in turn are based on our research findings: decades of rigorous, well-structured science looking at the impact of gamebird releasing and associated management in and around release pens.
SUSTAINABLE GAME MANAGEMENT |
To select survey points within plots at all five distances, we randomly assigned a central tree (suitable species with approximate trunk diameter >15cm), this being the first sampling point, and then identified another four sampling points, chosen by walking 15 paces in each of the four cardinal directions (ie. N, S, E, W) from point 1 and using the nearest suitable tree. For the ground flora surveys we used approximately the same sampling plots that were used above but having relocated the central tree (or close to it) we took six paces to one side to assign our first sampling point and then used the same method as before to select the other four points. At each point we recorded: Ground flora in five 1m x 1m quadrats. All vegetation species were identified and quantified, including bare ground and moss cover. Soil samples – analysed for nutrient levels in the soil. One sub-sample was taken at each of the five sampling points, then combined to give one soil sample at each distance plot along the transect. We found ground flora species diversity increased as we moved away from the release pen, with fewer species closer to the pen. We considered various groupings of species, including ancient woodland indicator species, ruderal species (species that are first to colonise disturbed ground), stress-tolerant species, and species thriving in nutrient-rich soils, and found very little evidence of an effect of distance outside the release pen. We did, however, find that the number of tree seedlings and young saplings increased as we moved further away from the pen, (up to 250m away), suggesting that released birds or their management during the releasing period may damage or trample young tree saplings or disturb seedling establishment (see Figure 2). The results from the soil chemistry analysis, looking at nitrates, phosphates, and potassium, did not indicate any differences in nutrient status of the soil related to distance from the release pen. Our results for lichens showed significantly higher scores of negative indicator lichen species (ie. those that are N-tolerant) in plots near the edge of the pen, decreasing as we moved away to between 100m and 250m (see Figure 3). From this distance onwards the enrichment effect reduced. In a similar but opposite way, the positive indicator lichen species (N-sensitive species) were found at lower levels near the release pen, increasing at the 100m sampling plot and possibly at the 250m plot, but with no effect detected at 500m. Some of these results may be surprising, given the findings
We carried out ground flora surveys identifying all vegetation species, including moss cover.
from early GWCT research which showed clear effects on soils and woodland plants inside or alongside pheasant release pens. However, as indicated earlier, this study took place in areas away from direct game management. We consider it likely that the soil and flora effects at pen sites may be repeated at other places where released birds congregate, such as feed sites within and at the edge of woodland. This should be considered when releasing pheasants near to designated sites, but we did not measure it in this study. Since the earlier GWCT work on the impacts of pheasant releasing, it is also true that aspects of game management have changed quite considerably, including a reduced tendency to release at high densities. In summary, the results for lichens, plus aspects of our ground flora data, provide useful information on the distance at which atmospheric eutrophication around pheasant release pen sites and away from other game-managed areas may be affecting the ecology of woodlands. With a review of the current licencing arrangements imminent, the results of this study do not provide support for a more onerous approach ie. detectable effects were found at 250m from the release pen, but not at 500m.
KEY FINDINGS Moving away from the game-managed areas in ancient woodland sites, the impacts of pheasant release pens were detectable up to, but not beyond, 250m from the pen edge, well within the buffer zone of 500m in the current licencing arrangement. The presence of N-tolerant lichens decreased moving from the pen edge into the woodland with a converse increase in N-sensitive species with distance. Ground flora species’ diversity increased, and more tree seedlings and saplings were found with increasing distance from the pen. No detectable effects on measures of soil chemistry or other aspects of ground flora such as the amount of bare ground or ancient woodland indicator plants were found. These results support, rather than contradict, the current releasing licencing arrangements. Maureen Woodburn, Joah Madden, Joe Werling, Clive Bealey & Rufus Sage gwct.org.uk/sustainablereleasing
GWCT RESEARCH REPORT • 2024 | 31
| UPLAND RESEARCH
© Laurie Campbell
Management for red grouse increases the chances of breeding waders and black grouse being present
32 | GWCT RESEARCH REPORT • 2024
SUSTAINABLE GAME MANAGEMENT |
Red grouse monitoring: now and into the future Since the 1980s the GWCT uplands research team have undertaken red grouse counts across the uplands of northern England and Scotland. Typically, we count grouse twice per year at each site, first in spring (March or early April) to assess pre-breeding numbers when grouse are in pairs, and second, in summer (July or early August) when fledged chicks are in family groups and still distinguishable from the adults. These counts allow GWCT scientists to assess pre-breeding and post-breeding densities and breeding success (the ratio of young to adult grouse in the summer coveys). Red grouse count data are augmented with information on estate management and strongyle worm burdens, and periodically (every 10 years) with other breeding bird and vegetation surveys.
R
ed grouse counts are undertaken by GWCT research staff using pointing dogs, typically English pointers or setters. Our count areas are either 100-hectare (ha) block counts where the dog handler walks a series of, usually six, one-kilometre long parallel transects, or line transects typically six kilometres (km) in length. The dog quarters in front of the handler to locate and point birds, allowing the handler to flush the birds, recording their sex and, in summer counts, age of the birds. This allows researchers to derive a measure of the number of red grouse and their breeding productivity. In the past, research staff maintained several teams of working dogs, with 38-86 grouse count sites surveyed annually across northern England and Scotland. There are now only two teams of working dogs maintained by two of the GWCT’s most experienced research staff, with 58 sites counted in 2024.
The 2024 red grouse count data Red grouse count data allow us to assess long-term trends in numbers and to put long-term and regional changes into context. Overall, red grouse counts from 2024 confirmed that this was, for the second time in the last four years, a very bad year for red grouse productivity in England and Scotland. While spring counts of breeding pairs were low for Scotland (mean ± 1 standard error
Red grouse counts from 2024 confirmed that this was, for the second time in the last four years, a very bad year for red grouse productivity in England and Scotland
= 40 ± 5 birds seen per 100 ha), they were exceptionally high on many moors across northern England (162 ± 8 birds seen per 100ha, see Figure 1). However, the post-breeding surveys clearly showed that grouse numbers declined between spring and summer, and productivity (young-to-old ratio), was very poor. Across the count sites in Scotland the mean number of birds seen per 100ha was below 100, as has been the case since 2018, with counts in 2024 recording 41 ± 6 birds per 100ha (see Figure 2). The productivity in Scotland was the lowest reported since 1990 with a young-to-old ratio of 0.5 ± 0.1 (see Figure 3a). The postbreeding surveys in England reported mean densities 44% lower than those reported in 2023, with 167 ± 20 birds per 100ha (see Figure 2). The average productivity of 0.9 ± 0.1 in 2024 in England was similar to that in 2021, when the young-to-old ratio was
Figure 1 Mean annual spring red grouse counts (number of birds seen per 100ha ± 1 SE) for England and Scotland
England Scotland
Red grouse per 100 hectares ( ± 1 SE)
180 160 140 120 100 80 60 40 20 0
1990 1990
1995 1995
gwct.org.uk/redgrouse
2000 2000
2005 2005
Year
2010 2010
2015 2015
2020 2020
GWCT RESEARCH REPORT • 2024 | 33
| UPLAND RESEARCH
below 1.0 (see Figure 3b). The decline in the number of birds seen in summer compared with the spring, and the low productivity imply that either breeding birds died, that breeding pairs failed to breed successfully, or that chicks failed to fledge.
Future grouse monitoring and research The red grouse counts have been a central part of the GWCT’s upland research for more than 40 years, have been an integral part of much of our science on red grouse ecology, disease, and management, informed our advice on red grouse and moorland management, and to some extent represent the outward face of GWCT upland research. In recent years, although we have maintained red grouse counts, research priorities have shifted as we sought to inform many of the recent and proposed policy changes affecting grouse moor management. As reported in previous articles (see Review of 2021 pp.30-33), we have had to drop some of our long-term grouse count sites, scaling back our grouse count teams and their pointing dogs. The two recent poor years of grouse productivity highlight the need for us to reinvigorate the GWCT’s red grouse research. To enable the GWCT to leverage the value of this long-term red grouse count data we have initiated a review of our data holdings. Although our data are always meticulously recorded, entered into databases and error-checked, office moves, and staff changes have inevitably meant that data have become fragmented and less well documented than we would like. The upland research team, along with colleagues across the GWCT, are working to ensure that our data are centrally stored, curated, and clearly documented. To step up our red grouse research we are fundraising to undertake comprehensive and detailed analyses of our long-term red grouse count data, in combination with data on grouse moor management, land cover, and climate. This has the potential to identify some of the key factors driving the recent poor grouse years. In addition, we will reinitiate our work on the causes and effects of poor breeding success and recruitment in red grouse. We will initially focus on three sites in the Pennines in 2025, but
we are looking for funding to allow us to expand the number of study sites across northern England and extend the project into Scotland. In addition to these research projects, with a goal of putting our work on a secure footing for the future, we are undertaking a review of all our red grouse count research.
Red grouse counts are carried out with the help of our pointing dogs.
Figure 2 Mean annual post-breeding red grouse numbers (number of birds seen per 100ha ± 1 SE) for red grouse count areas in England and Scotland
England Scotland
Red grouse per 100 hectares ( ± 1 SE)
500 450 400 350 300 250 200 150 100 50 0
1990
1995
2000
34 | GWCT RESEARCH REPORT • 2024
2005
Year
2010
2015
2020
SUSTAINABLE GAME MANAGEMENT |
Figure 3a Mean young-to-adult ratio (+ 1 SE) for red grouse count sites in Scotland
3.0 2.5 2.0
1.5 1.0 0.5
2010
2015
2020
2020
Year
2015
2005
2010
2000
2005
1995
2000
1990
1990
0
1995
Red grouse young to adult ratio (+ 1SE)
3.5
Figure 3b Mean young-to-adult ratio (+ 1 SE) for red grouse count sites in England
Productivity across Scottish and English count sites was the lowest recorded since counts began
Red grouse young to adult ratio (+ 1SE)
© Laurie Campbell, Nick Hesford
3.5 3.0 2.5 2.0
1.5 1.0 0.5 0
1990
1995
2000
2005
Year
2010
2015
2020
KEY FINDINGS Spring grouse counts in Scotland remained low for the third consecutive year, but with some sign of an upturn in 2024. Grouse count sites in England, which are invariably substantially higher than Scotland, recorded the highest pre-breeding numbers since the Trust started grouse counts in the 1980s. Counts of post-breeding adult birds in Scotland and England were the lowest recorded since counts began. Productivity across Scottish and English count sites was the lowest recorded since counts began. Overall, 2024 was a poor year for red grouse. Scott Newey, Kathy Fletcher & Phil Warren gwct.org.uk/redgrouse
GWCT RESEARCH REPORT • 2024 | 35
| NATIONAL GAMEBAG CENSUS
Long-term changes in gamebirds and releasing
The NGC was established by the GWCT in 1961 to provide a central repository of records from shooting estates in England, Wales, Scotland, and Northern Ireland. The records comprise information from shooting and gamekeeping activities on the numbers of each quarry species shot annually (‘bag data’).
36 | GWCT RESEARCH REPORT • 2024
an index of change compared to the first year (1961) when data were available. In the graphs, this means that the 1961 value is set to 1, and subsequent index values represent the change since then. For instance, a value of 4 in 2021 indicates that numbers have quadrupled over the span of 60 years from 1961 to 2021.
Pheasant (Figure 1) Pheasant releasing was widespread at the beginning of the NGC. It began in response to a decline in the traditional shooting of grey partridges following the Second World War, as agricultural intensification in the 1950s started to reduce wild stocks of both grey partridges and pheasants. Since then, demand and economics have led to continued increases in the numbers of pheasants released for shooting, estimated in 2016 to be 47 million. In 2018 and 2019, the NGC index of releasing had increased over 10-fold compared with what it was in 1961, reflecting an average rate of increase of 2.5% per annum over the last 25 years. In 2020, the level of pheasant releasing was 75% of that in 2019, corresponding to levels similar to those 15 years earlier, albeit still eight times higher than in 1961. Following the end of Covid-19 restrictions, pheasant releasing – as measured by the releasing index – had increased again, though it remains below the 2019 level. On average, in the 10 years both before and during the restrictions, 80% of those that reported shooting pheasants also reported releasing them. In 2022 this reduced to 70% – indicating some effect of the HPAI restrictions on importing pheasants from France. In 2023, 79% of shoots reporting shooting pheasants also reported releasing them, returning to levels pre-2022. The bag index has increased more slowly overall; in 2019 it was 2.7 times higher than in 1961. In 2020, when Covid-19 restrictions curtailed
© Laurie Campbell
I
n the National Gamebag Census (NGC) the species with the most records are the four avian species whose numbers in the bag are now commonly supplemented with releases of reared birds. These are pheasant, red-legged partridge, grey partridge and mallard. Except for red-legged partridge, releasing of these species was generally widespread but not intensive when the NGC started in 1961, 63 years ago. The pattern of releases has been different between the four species, and all have recently been affected by the implementation of Covid-19 restrictions in the 2020/21 shooting season. Here we consider the long-term changes in bags and releases, particularly in relation to the three seasons following that of 2020/21, when Covid-19 restrictions were at their height. We examine whether bags and number released resumed the trajectory observed before the Covid pandemic or changed to a different trend pattern. In addition to Covid-19 restrictions, movement restrictions due to Highly Pathogenic Avian Influenza (HPAI) could have affected releases and subsequently bags. These were restrictions on the supply of pheasants and redlegs from France, particularly in the 2022/23 shooting season. For each of the four species, the analysis is based on sites that have returned bag records for at least two years, with the number of NGC contributors varying from over 900 to just under 500. The bag index provides information on the change in numbers of a species shot and the releasing index considers numbers of a species released in a year. For pheasant, redleg, and mallard, we also looked at the percentage of sites that reported shooting and releasing a species, comparing years before the HPAI restrictions with 2022 and 2023 figures. Our bag and releasing indices analysis takes account of variation between sites and allows us to calculate
SUSTAINABLE GAME MANAGEMENT |
Figure 1 Pheasant: bag index (left-hand scale) and releasing index (right-hand scale)
Pheasant bag 12
3.5
10
2.5 8 2.0 6 1.5 4 1.0 2
0.5
0 1961
Releasing index (1961=1)
Bag index (1961=1) (95% CI)
3.0
Releasing index
1966
1971
1976
1981
1986
1991
1996
2001
2006
2011
2016
0 2021
Year
Figure 2
Red-legged partridge bag
Red-legged partridge: bag index (left-hand scale) and releasing index (right-hand scale) 300
14
250
10 200 8 150 6 100 4 50
2
0 1961
Releasing index (1961=1)
Bag index (1961=1) (95% CI)
12
Releasing index
1966
1971
1976
1981
1986
1991
1996
2001
2006
2011
2016
0 2021
Year
many shoots, the bag index was a little under half of what it was in 2019 and down to 1.3 times what it was in 1961. Between 2021 and 2023 the bag index increased again but remains around 80% of what it was in 2019 – perhaps reflecting restrictions on the supply of pheasants due to avian influenza restrictions. Neither the pheasant releasing index, or the bag index have returned to pre-Covid-19 levels.
Red-legged partridge (Figure 2) The releasing of red-legged partridges was an uncommon practice in 1961 when the NGC began. Only 19% of shoots in the NGC that reported bags of redlegs in that year also released them, and numbers released were tiny. This has changed in recent years, and the UK estimate in 2016 was 10 million redlegs released. There was an almost exponential increase in redleg
gwct.org.uk/ngc
releasing in the early part of the NGC, but that had slowed in the period up to 2019, when the Covid-19 pandemic resulted in restrictions on shooting. In the 20 years before 2020 the average rate of yearly increase in the redleg releasing index was 4.1%, while in the 20 years preceding that (from 1981 to 2000) there was an average increase of 10.2% per year. The result was that in 2019, the redleg releasing index was 242 times what it had been in 1961. In 2020, reflecting Covid-19 restrictions, the releasing index fell by 30% compared with 2019, down to levels seen in the later part of the 2000s. Thereafter, the redleg releasing index increased rapidly, surpassing 2020 levels in 2022. In 2023 the releasing index reached 274 times what it was in 1961. On average, in the 10 years both before and during the Covid-19 restrictions, 62% of NGC members that shot redlegs also reported releasing them. In 2022 this dropped to GWCT RESEARCH REPORT • 2024 | 37
| NATIONAL GAMEBAG CENSUS
Figure 3 Grey partridge: bag index (left-hand scale) and releasing index (right-hand scale) 6
1.4
1.2
5
1.0 4 0.8 3 0.6 2
0.4
1
0.2
0 1961
Releasing index
Releasing index (1961=1)
Bag index (1961=1) (95% CI)
Grey partridge bag
1966
1971
1976
1981
1986
1991
1996
2001
2006
2011
2016
0 2021
Year
Figure 4 Mallard: bag index (left-hand scale) and releasing index (right-hand scale)
Mallard bag 10
6
Releasing index
9 8 7
4
6 3
5 4
2
3
Releasing index (1961=1)
Bag index (1961=1) (95% CI)
5
2
1
1 0 1961
1966
1971
1976
1981
1986
1991
1996
2001
2006
2011
2016
0 2021
Year
39%, indicating a large effect of HPAI import restrictions on the percentage of shoots releasing redlegs. The releasing index of 254 in 2022 indicates that the level of releasing, where it was done, was slightly higher than that in 2019. In 2023 58% of those who shot redlegs also reported releasing them – returning to the levels seen before 2022. The redleg bag originally relied on wild production, and it fell in the 1960s owing to the impact of early agricultural intensification. Since then, the increase in releasing has fed through to the bag: in 2019 the redleg bag index was 9.5 times what it was in 1961. In 2020 the bag index declined by half but subsequently rebounded, though not to the extent of the releasing index. In 2023 the bag index was 10.1 times what it had been in 1961, slightly above the 2019 index. Unlike the indices for pheasants, the trajectories of the redleg indices appear to have recovered from when Covid-19 and avian influenza restrictions were brought in. 38 | GWCT RESEARCH REPORT • 2024
Grey partridge (Figure 3) The grey partridge is the only one of the four species reviewed here whose bag index since 1961 is consistently below what it was at the beginning of the NGC. It reached a low of 0.04 in 2019, indicating that bags had dropped by 96% since 1961. This is the species that is least suitable for mass rearing, and it is rare for it to be released in large numbers; the estimated number released in the UK in 2016 was 190,000. In slight contrast to the pattern observed for the other three species considered here, the grey partridge releasing index in 2020 was higher than in 1961, although similar to the values seen in the 2010s. The releasing index in 2022 was over five times what it was in 1961, with the implication that shoots may have released grey partridges when they had difficulty sourcing redlegs due to import restrictions. In contrast to the releasing index there was no increase in
SUSTAINABLE GAME MANAGEMENT |
the grey partridge bag index, indicating either low returns or the possibility that some of the releasing in 2022 was directed towards conservation interests. Released grey partridges rarely survive to breed successfully, so efforts to support remnant wild greys represent a better conservation approach than the release of game-farm-reared stock (see our guide Re-establishing grey partridges through releasing at gwct.org.uk/gpreleasing). Grey partridges continue to decline nationally, so it is important to count any wild birds in the autumn and avoid shooting them if there are fewer than 20 birds per 100 hectares (250 acres), or if numbers drop below this level (see our guide Conserving the grey partridge at gwct.org.uk/greypartridge).
© Laurie Campbell
Mallard (Figure 4) The mallard is another species that was released uncommonly in 1961, with just 17% of NGC returns involving shot mallards also reporting releases. The practice started to become more popular after 1980, although it never engaged more than just over a quarter of the NGC participants who reported mallard in the bag. Mallard releasing peaked in 1999 (at six times the level of 1961) then fell back again for several years, increasing from 2003 with nearly eight times as many released in 2016 and 2017 as in 1961. The estimated number of mallard released in the UK in 2016 was 1,200,000. Restrictions due to Covid-19 had little effect on the level of mallard release. The releasing index in 2020 was only 5% lower than in 2019, with increases since. The releasing index in 2022 was 9.2 times what it was in 1961, with the trend in the releasing index now restored to the pre-2020 trajectory. On average, in the 10 years both before and during the Covid-19 restrictions, 26% of NGC members that shot mallards also reported releasing them. In 2022 21% of shoots that shot mallard reported releasing them, and in 2023 19% of shoots that shot them also released them. The bag index, which tripled from 1961 to 1999, reflects a combination of numbers released and numbers available in the wild. It shows a pattern very similar to that of releasing: stability until 1980, a peak in 1999, then a decline followed by a modest recovery. The bag index in 2020 was 70% of the index in 2019, indicating that the Covid-19 restrictions had more of an effect on the bag than on the level of releasing. This
The wild overwinter mallard population has declined by 33% over the last 25 years.
decline was short-lived, with the bag index in 2021 returning to 2019 levels – 2.9 times higher than in 1961 – though there is no sign of a sustained increase in the bag index beyond levels in the late 2010s. It appears that the restrictions due to HPAI had very little effect on levels of mallard release (measured as the releasing index or as the percentage of shoots with mallard as a quarry that release them) or in the mallard bag. When considering the mallard bag, it is worth bearing in mind that the wild overwinter population has declined by 33% over the last 25 years (WWT/ BTO/RSPB surveys). The mallard bag is a mix of wild and reared birds, so declines in wild stock will lead to lower bags.
KEY FINDINGS Restrictions in 2020/21 and 2022/23, due to Covid-19 and subsequently avian influenza, may have affected the level of releasing and the bag of four game species that are commonly released for shooting in the UK. Neither the release nor bag indices for pheasant have returned to the trajectory seen before the onset of the Covid-19 restrictions, with the bag index 80% of what it was in 2019. In the case of redlegs, after reductions in both releases (down by 30%) and bags (down by half) in 2020/21, indices of release and the bag of redlegs have returned to the trajectory seen before Covid-19. The index of grey partridge releasing in 2022/23 was five times what it was in 1961, perhaps reflecting releasing of greys when other gamebirds could not be sourced due to import restrictions. The grey partridge bag index did not increase in response to the increase in releases. Mallard releases showed only a slight decline in 2020/21 (5% lower than in 2019). The bag index was 30% lower than in 2019. Both then recovered to the levels pre-Covid, with little sign of an effect of movement restrictions due to avian influenza. Julie Ewald & Ashlee Rossiter gwct.org.uk/ngc
GWCT RESEARCH REPORT • 2024 | 39
© Will George
SECTION 3 GREENER FARMING
40 | GWCT RESEARCH REPORT • 2024
Greener farming 42
Upscaling farmers’ environmental ambitions
46
Boosting biodiversity through Farmer Clusters
48
Allerton farming year
52
Allerton: Soil compaction costs
54
Auchnerran farming year
56
The PepsiCo Farming Arable Biodiversity project
The Allerton Project has shown that ordinary farms can make a profit while still doing extraordinary work for wildlife. Many farmers and landowners have visited over the years and have left inspired to do more for wildlife on their own land
gwct.org.uk/research
GWCT RESEARCH REPORT • 2024 | 41
| THE ENVIRONMENTAL FARMERS GROUP (EFG)
Upscaling farmers’ environmental ambitions The Avon Valley Environmental Farmers Group (EFG) launched in May 2022. It resulted from the GWCT collaborating with local farmers, reflecting shared concerns about the financial and environmental consequences of the phasing out of Europe’s Common Agricultural Policy and Basic Payment Scheme after Brexit. EFG’s mission is to harness member co-operation at scale to secure the best environmental results and financial returns for a wide range of natural capital goods and services. EFG’s key environmental aims are: 1) biodiversity and species recovery; 2) clean water; and 3) net carbon zero farming by 2040. EFG is a farmer-owned, farmer-led co-operative, utilising GWCT’s ecological scientific research, and Natural Capital Advisory’s understanding of the markets to produce quality assured, natural capital goods, and a positive environmental impact on a landscape scale. Natural Capital Advisory is a wholly owned subsidiary of the GWCT, sitting alongside the GWCT’s Game and Wildlife Advisory. Since 2023, additional lowland EFGs have been launched across England, as well as two in the uplands (one in the Peak District and one in Swaledale and Wensleydale). In early 2024, EFGs had nearly 700 farmers as members or who had expressed interest in joining, covering more than 350,000 hectares of land.
42 | GWCT RESEARCH REPORT • 2024
Defra’s Test & Trial scheme and Environmental Improvement Plan The three ambitions of the EFGs align neatly with three of Defra’s key Test & Trial (T&T) project policy questions that test and develop Defra’s Environmental Land Management Schemes (ELMS). The EFGs will help Defra reach its Environmental Improvement Targets. We successfully applied for a T&T project bid in 2023, implementing it in 2024. The project involved exploring the opinions of farmers in the Avon Valley EFG and the Swaledale & Wensleydale EFG (SWEF) to provide answers on three Government ELMS policy objectives: 1) Incentivising environmental gains, especially biodiversity; 2) Monitoring and compliance; and 3) Co-operative working. This
© Megan Lock
O
ne of the key ambitions of the EFGs is to meet and beat the Government’s environmental targets outlined in Defra’s Environmental Improvement Plan (the first version was published in 2023). A further shared ambition of EFGs and the Government is to monitor progress towards these targets. To achieve the latter, baseline data are required to compare subsequent progress to a starting point. A third ambition of the EFGs is to provide a strong and competitive platform. This will allow farmer members to trade in the Biodiversity Net Gain market (BNG), Carbon Offsetting and Nutrient Neutrality markets, and attract other green finance from both public and private sources (eg. grants and Environment Social Governance funding).
GREENER FARMING |
ACKNOWLEDGEMENTS
We thank all farmers and GWCT staff that took part in our T&T surveys, workshops, and panel discussions as well as Defra for funding. There are too many to mention by name. Special thanks go to Digby Sowerby and Rachel Ridd, both from Natural Capital Advisory.
A species-rich margin which is beneficial for biodiversity, including dark green fritillary butterflies (below).
also provided an excellent opportunity to explore whether the views of EFG members align with the objectives set out by the EFG Board. We used a qualitative social science approach to explore the common views and related emerging themes linked to the three T&T main objectives. We held in-person farmer workshops to gather initial information that was then used to construct targeted online surveys. We then used panel discussions with small groups of farmers to deepen our understanding of the results obtained from the survey, followed by a final high-level farmer workshop to formulate key recommendations to Defra. We involved several biodiversity monitoring experts and farm
advisors to explore the themes relating to monitoring and compliance (for the full report please contact efg@gwct.org.uk).
Objective 1. Incentivising environmental gains, in particular biodiversity A clear majority of lowland farmers (70.3%, n=104 submitted online survey forms) and upland farmers (67.5%, n=35) were willing to meet and beat the Government’s environmental target by creating 5.1 hectares (ha) per 100ha or more wildlife-friendly habitats. Around 57% of all farmers would prefer their wildlifefriendly habitats to be on unproductive land. Hedge planting and flower-rich habitats were more popular in the lowlands than in the
DEFINITION BOX Biodiversity Net Gain (BNG) – legal requirement for developers to increase the overall biodiversity value of a development site. Developers can either increase biodiversity on their site or purchase biodiversity units from land managers to meet this requirement. Carbon Offsetting – the purchase of carbon credits to offset carbon emissions. Companies are planning to reduce carbon emissions to zero. Many will never be able to reach net zero due to the nature of their operations. Instead, they can purchase carbon credits from projects which are sequestering carbon. On farms, carbon can be sequestered by planting trees or changing management practices to improve soil carbon stocks. Nutrient Neutrality – is an ‘approach’ developed by Natural England. Local Planning Authorities require housing developers in specific water catchments to mitigate the nutrient impact of their development on their local river. Housing developers can purchase nutrient credits from land managers who produce such credits. Francis Buner & Teresa Dent environmentalfarmersgroup.co.uk
GWCT RESEARCH REPORT • 2024 | 43
| THE ENVIRONMENTAL FARMERS GROUP (EFG)
EFG FARMER HIGHLIGHTS
© Megan Lock, Jennie Stafford, Nathan Jewell, Serenity Images23, Sandra Standbridge
The Avon Valley EFG, the Peak District EFG (PEF), and the Swaledale & Wensleydale Environmental Farmers group (SWEF) shaded in green. Further EFG member areas are shown in blue. (Inset) Several red-listed butterflies, flowers and birds, such as curlew, are already benefiting from the shared conservation goals in these areas.
44 | GWCT RESEARCH REPORT • 2024
GREENER FARMING |
Farmers from the Swaledale & Wensleydale Environmental Farmers Croup (SWEF) and (inset) the uplands. Farmers from the Martin Down Farmer Cluster and Allenford Farmer Cluster, who sit within the Avon Valley EFG.
uplands, while both groups have similarly ‘low’ aspirations regarding woodland creation. There was no rule that fits all, indicating that policy must be flexible. Around half of all farmers feel that they have not been rewarded for the existing biodiversity and habitat on their farm through Agri-Environment Schemes, with slightly more upland farmers thinking so. Most farmers feel that Biodiversity Net Gain units should be worth more in the marketplace if building on an already elevated level of biodiversity, with significantly more farmers in the uplands (70%) thinking so than lowland farmers (53%).
Objective 2. Monitoring and compliance We analysed existing practitioner survey data to quantify the value of such data and held one-to-one in-depth interviews with four GWCT advisors and two GWCT scientists who are directly involved in ongoing farmer-led monitoring activities on English farms. The areas involved were the Allenford Farmer Cluster, the Martin Down Super Cluster, and the Selborne Landscape Partnership Farmer Cluster, as well as on several upland farms. We also used the results from our online farmer survey (Objective 1) to obtain farmers’ views. The most suitable methods identified, that can provide long-term trend data are represented by long-term monitoring schemes such as the GWCT Partridge Count Scheme (see page 26), the Breeding Bird Survey run by the British Trust of Ornithology, or butterfly surveys run by Butterfly Conservation. Innovative methods that involve artificial intelligence (AI), such as sound recorders, require further development before they can be deployed sensibly. Farmers like the idea of practitioner monitoring. Both upland and lowland farmers have a good understanding of what baseline monitoring means and prefer to do survey tasks together with an expert rather than on their own. In the uplands, most farmers seem happy to help with monitoring (82%), while only 60% of the lowland farmers would be willing to do so. The
environmentalfarmersgroup.co.uk
reason for wanting to be directly involved in the surveys, despite their reluctance/inability to commit significant amounts of time towards this, is that most farmers wish to own or at least co-own the data. However, when implementing standardised monitoring protocols, farmers are typically unable to commit to the time needed to collect data over an extended period at defined times during the year. Both farmer groups prefer single species monitoring (particularly specific birds, plants, or insects), and generally struggle to engage with multi-species surveys (except in the uplands where grassland wader surveys were favoured). Given the geographic spread and size of the EFG co-operatives, we are confident that the land changes across the EFG catchment groups will allow the on-going long-term monitoring schemes mentioned above to track progress against Government targets in the future.
Objective 3. Co-operative working EFG farmers are clearly driven by a deep motivation and passion for their farmed environment, with more than two-thirds stating that they feel proud to be part of an EFG because of its environmental ambitions. Half of them went on to say that being at the forefront of farmer-led action on the environment made them proud to be part of EFG. These results clearly indicate that EFG farmers are very motivated to do more for the environment than they currently do, making them the perfect partners for reaching Government-set targets for the environment. Additionally, they see the risks of joining the EFG as generally low to medium, indicating confidence in the way the co-operative is run. Overall, the EFG co-operatives provide an exciting new opportunity to upscale farmers’, conservationists’, and the Government’s shared environmental ambitions at large landscape scales, beyond Farmer Clusters. They have a real chance to deliver national environmental targets. This includes the recovery of red-listed farmland species that continue to decline despite local success stories. GWCT RESEARCH REPORT • 2024 | 45
| FARMLAND ECOLOGY
Boosting biodiversity through Farmer Clusters
F
armer Clusters have emerged as a powerful tool for change as environmental and societal pressures on farming continue to grow. From biodiversity enhancements that support ecosystem services, to farm business support opportunities, there are many potential benefits to being part of a Farmer Cluster. However, the process of creating and running a Farmer Cluster can seem a huge task. To overcome this, the FRAMEwork project has produced an online training course, Landscape Leaders, and a Guideline series targeted at facilitators and farmers setting up a new Farmer Cluster. Landscape Leaders, our online training course targeting new facilitators, is designed to make the process of creating and managing a Farmer Cluster more accessible, particularly for those who may find the initial steps daunting. It includes a full library of resources, quizzes, activities, and real-world case studies to equip facilitators with practical tools and knowledge. The course covers key topics including managing agricultural landscapes for biodiversity, understanding biodiversity in agriculture, and communication and engagement strategies for Farmer Clusters. Additionally, the course provides valuable guidance on troubleshooting common challenges offering practical solutions to help facilitators navigate obstacles effectively. By simplifying
46 | GWCT RESEARCH REPORT • 2024
these concepts, the course aims to foster a new generation of Farmer Cluster facilitators who are informed, empowered, and equipped to lead projects in sustainable agriculture. In addition to the module content and resource library, the course features downloadable module summaries and interactive elements to help facilitators apply what they learn via activities. The Farmer Cluster Guidelines are designed to offer clear, practical advice for facilitators and farmers, and they’re also an excellent resource for anyone curious about the vital work of Farmer Clusters and the processes involved in their success. Each guideline focuses on a key topic and includes real world case studies from the FRAMEwork network of 11 pilot Farmer Clusters across Europe, established with the assistance of the GWCT. The topics cover a range of socio-ecological, climatic, and agricultural contexts. The guidelines are an essential tool, providing step-by-step guidance for anyone considering setting up a new cluster. The guidelines cover: Farmer Clusters – an Overview – Learn what a Farmer Cluster is and the importance of working at landscape-scale to achieve meaningful outcomes.
© Peter Thompson, Framework
A Farmer Cluster is a community of farmers who work together toward common self-set conservation goals, under the guidance of a Cluster facilitator. This provides a unique opportunity for farmers to pool resources, share knowledge, and increase their collective positive impact on biodiversity. Through Farmer Clusters, farmers are finding new ways to protect the environment and enhance their businesses. The environmental benefits also extend beyond individual farms to entire landscapes, creating connected ecosystems that better support biodiversity and prevent ecological degradation. By scaling up conservation efforts, Farmer Clusters allow members to contribute to landscape-scale conservation goals. This is vital in an age where interconnected landscapes are essential for ecological resilience to our changing climate.
GREENER FARMING |
From biodiversity enhancements that support ecosystem services, to farm business support opportunities, there are many potential benefits to being part of a Farmer Cluster Starting a Farmer Cluster – Understand the first steps needed to establish a Farmer Cluster, from forming a group to setting shared objectives. Managing a Farmer Cluster – Explore how to keep the group engaged and cohesive, and how to effectively provide useful events and engaging meetings. Farmer Cluster Communication – Discover the importance of communication, both within the cluster and with external stakeholders, to promote success and engage with new audiences. Monitoring Biodiversity – Gain insight into the benefits of monitoring biodiversity across a Farmer Cluster and targeting monitoring to fit each individual group’s interests. Farmer Cluster Engagement – Find creative ideas for events, media campaigns, and outreach, targeting different audiences, such as policymakers, researchers, and local communities, helping to foster synergistic relationships.
ACKNOWLEDGEMENTS
This work was made possible through the support and contributions of multiple partners and collaborators. We would like to thank Taskscape for its role in the development of the Farmer Cluster Guidelines, including the preparation of the communication guideline and translation of the series into Czech, Dutch, Estonian, French, Italian and Spanish. Special thanks also go to the Farmer Cluster facilitators across Europe who provided invaluable feedback on all these resources, ensuring their relevance and practicality for on-the-ground application. This project receives funding from the European Union’s Horizon 2020 research and innovation programme under grant agreement No. 862731.
These free resources can be found on the FRAMEwork project’s online information hub, Recodo (recodo.io). You can also explore and join our network of Farmer Clusters there.
KEY HIGHLIGHTS The FRAMEwork project established a Europe-wide Farmer Cluster network. FRAMEwork produced a Farmer Cluster Facilitator online training course (Landscape Leaders) to assist in creating and running clusters. The course is supported by a series of published Farmer Cluster Guidelines. The topics covered in the course and the guidelines include Starting a Farmer Cluster and Farmer Cluster communication as well as understanding and monitoring biodiversity. Jayna Connelly, Ellie Ness, Rachel Nichols & Niamh McHugh gwct.org.uk/farming
GWCT RESEARCH REPORT • 2024 | 47
| ALLERTON PROJECT
The unprecendented rain waterlogged and drowned much of the late-planted seed, with field drains struggling to cope.
Allerton farming year The Allerton Project is based around a 333-hectare (822 acres) estate in Leicestershire. The estate was left to the GWCT by the late Lord and Lady Allerton in 1992 and the Project’s objectives are to research ways in which highly productive agriculture and protection of the environment can be reconciled. In 2022, it celebrated its 30th anniversary.
T
he entire Allerton Project team would happily not have another year like the 2023-2024 season, with excessive rainfall giving rise to what must have been the most challenging year we have had at the Project since its inception. Between September 2023 and August 2024, we received 913mm of rainfall, well above our average expectation of 630mm. The trouble began with storm Babet in mid-October 2023 (one of 12 named storms this year) which delivered more than 80mm (3.1 inches) of rain in 48 hours to already moist soil. From this point until spring 2024, it was a rare day which did not bring some additional rain. A late 2023 harvest (owing to the wet conditions and late planting the previous spring) had led, by necessity, to a later drilling plan for autumn 2023. Indeed, some fields of winter wheat were 48 | GWCT RESEARCH REPORT • 2024
direct drilled only days after the combine had cleared the previous bean crop. However, in our under-drained, heavy silt-clay soils the aforementioned deluge sadly waterlogged and drowned much of the late-planted seed, while large areas planned for further autumn plantings went un-drilled. With the ground too wet to plant crops, it was also too wet (and agronomically too late) to plant cover crops, so we were forced to endure months of watching bare fields being pummelled by the elements. Sadly, spring brought no respite (with February alone seeing 112mm of rain) and it was not until May that some spring crops were finally planted. In the ultimate assessment, a full 40% of our arable land lay fallow for the entire 2023-2024 season, an unprecedented experience both in my farming career and here at the Project (see Figure 1). A single unplanted field would
GREENER FARMING |
Figure 1 Allerton Project cropping 2023/24
Woodland Permanent pasture Winter wheat Spring wheat Summer cover crops Winter barley Spring oats Red clover & lucerne Bicropping trials Stewardship and shoot cover Hedgerow/verge
TABLE 1 ARABLE GROSS MARGINS (£/HECTARE) 2010-2024
2010
2011
2012
2013
2014
2015
2016
2017
2018
2019
2020
2021
2022
2023
2024
Winter wheat 673 783 255 567 590 457 442 766 Winter oilseed rape 799 1,082 490 162 414 533 524 713 Spring beans 512 507 817 580 646* 396* 289* 436* Winter oats 808 873 676 570 354 507 156** Winter barley 367 Spring wheat 367 Spring barley 367
780 377 176* 733 733 733
837 528 459* 386 423 423 423
568 301 324 630 630 630
551 1,025 953 485 550 460 620 495 380 605** 587 558 624 531 502 390 720
495
256** 68
No single/basic farm payment included * winter beans, **spring oats
gwct.org.uk/allerton
GWCT RESEARCH REPORT • 2024 | 49
| ALLERTON PROJECT
© Joe Stanley
(Left & inset) New experiments looked at bi-cropping, a highly ‘regenerative’ practice that is beneficial for soil and climate, but it’s also very challenging as different crops have differing requirements throughout the season; Harvest itself was finished in reasonable time by calling on multiple contractors.
previously have been an unusual aberration. Yet this feels like only the latest escalation of extreme weather, which appears to be a consistent trend since the spring of 2018. Finally, crop yields were predictably disappointing, with our winter wheat averaging only six tonnes per hectare (t/ha), our winter barley 5.5 t/ha, and our spring oats 4.0 t/ha (see Figure 2). In fairness, given the extreme late drilling date, suboptimal soil conditions, and the fact that their yields were also curtailed by entry into the ‘low input cereal’ option in our MidTier scheme, the oats performed surprisingly well. As reported in the Review of 2023 (p.52), our single field of low-cost autocasted oilseed rape failed to establish in the late autumn, while the planned winter and spring beans never made it out of the store. In some fields, we finally settled on plan ‘D’ this season, an indication of the turmoil unpredictable weather can and does have on farm plans.
Harvest 2024 itself was a truncated (if catchy) affair, and was finished in reasonable time by calling on the services of more than one contractor in the neighbouring area. It was wrapped up in glorious sunshine on the evening of 18 September. Sad to relate, but more than one neighbouring farm still has unharvested crops at the time of drafting this article in November 2024. This season has highlighted – at Allerton as on many other farms – any shortcomings of existing field drainage, and subsequently we have expended considerable time and effort since the summer identifying and rectifying the most serious issues. Ditches have been cleared, blown drains patched, and in some cases culverts and main drains replaced entirely. Not only is this in response to ageing clay drains, which are several years past their best, but also reflects the extremes of rainfall we have had, with which these old systems were never designed to cope. No significant amount of field drainage has been installed nationally since the end of grant support in the 1980s, and we
Figure 2 Allerton Project crop yields 2012-2024 Spring oilseed rape was sown in 2013, *winter beans, **spring oats 10
2012 2013
9
2014 8
2015 2016
Yields (t/hectare)
7
2017
6 5 4
*
2018
** **
*
2019 2020
**
2021
**
*
2022
**
3
2023 2024
2 1 0
Winter wheat Winter/spring oilseed rape
Spring beans
50 | GWCT RESEARCH REPORT • 2024
Winter oats Winter barley
Crop type
Spring wheat
Spring barley
GREENER FARMING |
cannot help but feel that many farms are approaching a drainage ‘cliff edge’, over which yields are soon to precipitously tumble. At the Allerton Project we have already arrived at this precipice; it is difficult to see how comprehensive drainage works can be funded from ever smaller – if any – annual farming profits (see Figure 3). One of the more interesting farm experiments we have conducted this year was our work as part of the Nitrogen Climate Smart (NCS) consortium led by the PGRO, which led us to establish a series of strips of field peas, field beans, oats and bi-crops (ie. mixtures) of those crops. We will report on this trial in a future article, but, from a farming perspective, it was an interesting experience. Although bi-cropping is, in theory, a highly ‘regenerative’ practice that is beneficial for soil and climate (and is supported by the Sustainable Farming Incentive), we are by no means the first to discover that it’s also very challenging. Different crops have differing requirements throughout the season – not least at harvest, after which the mixed grains must be separated for their end market uses. But as always, the devil will be in the data collected and soon to be analysed by our outstanding research team. The value of cover crops was certainly demonstrated this year, and more than one visitor commented on how well our early autumn drilled covers looked all through the winter, holding water, and retaining soil even as it was lost in large quantities elsewhere on the estate. Indeed, it was alarming to see the impact of last
It was alarming to see the impact of last winter’s rainfall on the loss of soil and erosion, even on a farm which has been focusing for more than a decade on building soil health and resilience winter’s rainfall on the loss of soil and erosion, even on a farm which has been focusing for more than a decade on building soil health and resilience. It was only thanks to the permanent green infrastructure measures around and across many of our fields – such as buffer strips and beetle banks – that the impact on our soil was not worse. This raises broader questions about agricultural land use and climate change. Will the crops and farming methods in use across many acres of the UK (and elsewhere) still be viable if climate change continues its current path? Or will we – as predicted by organisations such as the Met Office – be obliged to shift to more weather resilient pasture, and livestock-based outputs? The mere act of planting annual crops used to be something which we all took for granted, with only the final yield (within a narrow band) being in question. Today, risk rises year-on-year, and farming is increasingly akin to a game of chance played with ever-higher stakes.
Figure 3 Gross profit at the Allerton Project 1994-2024 180 160 140 120 100 80 60
£000
40 20 0 -20
’94
’96
’98
2000
’02
’04
’06
’08
2010
’12
’14
’16
’18
2020
’22
’24
-40 -60 -80 -100 -120 -140 -160
KEY FINDINGS Climate change is having a major impact on farm operations. Crop yields were much lower than expected in 2023-2024. Extreme weather and the loss of direct payments are impacting farm profitability. Winter 2023-2024 demonstrated the value of cover crops and effective field drainage. Joe Stanley & Saya Harvey gwct.org.uk/allerton
GWCT RESEARCH REPORT • 2024 | 51
| ALLERTON PROJECT
The results supported the earlier work, with waterlogged and compacted areas of direct-drilled land emitting significant levels of N₂O in comparison with virtually no N₂O emissions from ploughed land in the same field Allerton Project trials manager, Gemma Fox, measuring soil greenhouse gas (GHG) emissions.
52 | GWCT RESEARCH REPORT • 2024
GREENER FARMING |
Soil compaction costs Soil is a farm’s – and society’s – most valuable resource. A few score inches of weathered rock and decomposing life are all that stand between us and starvation. It provides food, fibre, fuel, and the ecosystem services on which we all depend, such as clean water and carbon storage. But all too often we treat it in an unsustainable way. At the Allerton Project, we are working to turn that around.
T
he Allerton Project was established in 1992 with the objective of conducting research into more sustainable landscape management and how that pertains to farming and food production. That key aim, at the bequest of Lord and Lady Allerton, was ahead of its time given the prevailing policy and economic landscape of the time. Yet it is a prescience which has survived in the DNA of the Allerton Project in its subsequent 32 years. One of the particular areas of forward-thinking research at the Allerton Project centres on the impact of compaction on soil, a condition that is all too easy to inflict on the heavy silt-clay loams found at Loddington. As long ago as 2019, the Environment Agency suggested an annual economic cost of £470m for compacted soils in England and Wales alone, with 3.9 million hectares of agricultural land considered to be at risk (36% of the total). This was estimated to be three times the cost of soil erosion, a problem that tends to be higher up on the political agenda. Allerton Project research has demonstrated that compacted soil is, of course, massively compromised in terms of water infiltration. In one arable field we recorded an infiltration rate of just 2.5mm/hr, compared with 42mm/hr in an un-trafficked permanent wildflower strip only 20 metres away. Unable to pass through the soil, water instead flows over it, scouring and eroding the soil surface with all the negative implications for surface water quality that this brings. We can also demonstrate that compaction leads to poorer crop growth, yields, and profitability. We are also interested in the climate impact of compacted soil, and what compaction means for farm carbon accounting – an increasingly pertinent question. It’s well known that soil tillage leads to organic matter loss, and thus the release of stored carbon into the atmosphere as carbon dioxide. We have been able to demonstrate that compacted, direct-drilled clay soils have a higher carbon footprint through the winter than if they had been ploughed. This is because such soils are a source of nitrous oxide (N₂O), a greenhouse gas some 300 times more warming than carbon dioxide (CO₂), that also depletes the ozone. Nitrous oxide is generated by bacteria from fertiliser nitrates in the anaerobic conditions found in wet, tight soil.
Compacted, direct-drilled clay soils are a source of nitrous oxide (N₂O), a greenhouse gas some 300 times more warming than carbon dioxide (CO₂), that also depletes the ozone
This initial research was carried out as part of a field-scale trial where compaction was purposefully increased in a field. However, the wet weather of this season has offered the opportunity to measure N₂O emissions from a range of commercial field treatments. The results supported the earlier work, with waterlogged and compacted areas of direct-drilled land emitting significant levels of N₂O in comparison to virtually no N₂O emissions from ploughed land in the same field. Where shallow, low-disturbance subsoiling had been applied to compacted land in that same field, N₂O emissions were around a tenth of what they had been, albeit still higher than where the soil had been ploughed. Carbon dioxide emissions were relatively consistent across all three field treatments, largely it is thought due to recent rainfall which had ‘woken up’ bacteria that digest organic matter, which had subsequently set to work in the recently disturbed soil. Climate change will increasingly make even basic soil management a challenge, both through evaporative loss in hotter, drier summers and – at least for us on heavier, clay-dominated land, representative of about one third of lowland England – via milder, wetter winters. Research into how best to counteract the effects of climate change and limit our contribution to it will be vital to a wide range of agricultural activity in future. This will include the growing of crops, the management of natural capital, or indeed the fight against climate change. Farm carbon accounting methods will need to take note of our research findings as greenhouse gasses are invisible and without odour. Without this important research we run the risk of just swinging in the dark when it comes to some of the most pressing issues of our time.
KEY FINDINGS Soil compaction in England and Wales costs £470m per year (Environment Agency, 2019). Soil compaction causes water runoff, erosion, and nitrous oxide (N2O) emissions. Nitrous oxide is 296 times more warming than carbon dioxide. Allerton research has shown how to manage soil more sustainably. Joe Stanley & Jenny Bussell gwct.org.uk/allerton
GWCT RESEARCH REPORT • 2024 | 53
| SCOTLAND - AUCHNERRAN FARM
We need enough single bearing ewes to head out and tackle early tick rises on the hill, carrying out their function as ‘tick mops’.
Auchnerran farming year
The Game & Wildlife Scottish Demonstration Farm (GWSDF), trading as Auchnerran Farm, is a 482 hectare farm in east Aberdeenshire, bordering the Cairngorms National Park. GWCT took on the farm lease in 2015, with the aim to demonstrate how modern agricultural practices and livestock management can co-exist with wildlife conservation and game management to form an economically viable system in a hill-edge setting. More information, including our Auchnerran reports, can be found at gwct.org.uk/auchnerran.
A
uchnerran had a challenging year in 2024. With wetter and colder weather providing a difficult season for the livestock and their management, resulting in increased cases of flystrike, feet issues and worm burdens. Hill gathers were also disrupted by the weather and postponed to minimise grouse disturbance. Just over 1,500 ewes went to the tup in early December 2023, resulting in an overall scanning percentage of 139% (see Table 1). Although this is lower than in recent years, we are trying to find the balance between having enough single bearing ewes to head out and tackle early tick rises on the hill, carrying out their
function as ‘tick mops’, while also retaining a profitable low cost, low input system. The farm grew enough winter forage crop (swedes) to take the ewes through in good condition until spring grass appeared in mid-April. All swedes were sown by direct drilling; reducing cost, time/labour, and diesel, while maintaining soil structure and reducing the release of carbon. Last year saw the first invertebrate monitoring on the farm to measure the impact of glyphosate used in establishing
Figure 1 Auchnerran farm profit, 2015-2024 200
150
100
During winter the flock consumes around 500-600 bales of good quality silage.
£000
50
-50
-100
-150
2015
2016
2017
2018
54 | GWCT RESEARCH REPORT • 2024
2019
2020
2021
2022
2023
2024
© Dyfan Jenkins
0
GREENER FARMING |
TABLE 1 FLOCK SIZE AND SILAGE PRODUCTION Flock size at the start of the year and productivity (percentage of lambs per ewe that reach weaning age) at Auchnerran, along with annual silage production Year
Breeding ewes
Scanning percentage
2015 2016 2017 2018 2019 2020 2021 2022 2023 2024
1,440 1,205 1,126 1,000 986 1,400 1,380 1,400 168% 1,388 156% 1,500 139%
Productivity lambs/ewe
Mortality (lambs) percentage
Silage bales per year
Bales per hectare
60% 730 17 97% 717 20 120% 1,100 25 126% 460 12 124% 986 23 129% 830 24 126% 600 20 127% 41% 551 16 125% 31% 841 20 120% 19% 400 15
crops through direct drilling. Glyphosate has been a tool the farm has used historically, whether in combination with ploughing, direct drilling, or other uses. The monitoring will also provide useful information on the invertebrates taken by waders as a food source. During the winter months the flock consumes around 500600 bales of good quality silage and, with most sheep out on the hill during the summer months, it can be easier to make too much rather than not enough silage. This year we did not apply fertiliser to the silage ground. This, in turn, yielded lighter crops, requiring less turning/drying/good weather and resulted in fewer silage bales but these were denser and had higher levels of dry matter (see Table 1). The requisite fertiliser was then applied to the fields after baling to address the nutrient loss taken by the bales. This allowed us to take higher volumes of grass into the winter, extending the grazing platform. We were also fortunate with the weather making 140 bales of hay with the added benefit of cutting costs in plastic wrapping and its consequent recycling cost. A large amount of the hay is mixed species herbal ley which was allowed to seed before cutting. Feeding this to stock around the farm will be
Average dry matter %
52% 42% 77%
something we can monitor, checking for changes in sward diversity. Dr Phil Scott came to Auchnerran for his second year to examine the flock’s lungs for cancerous tumours. Ovine Pulmonary Adenocarcinoma (OPA) is a contagious lung tumour of sheep, resulting from infection with a betaretrovirus called Jaagsiekte Sheep Retrovirus (JSRV). Phil uses ultrasound to examine the lungs; this is a method he invented and is now widely used by others to check and manage the disease. The results at Auchnerran again proved to be relatively low at around 0.75% with 12 cases found throughout the flock. This level is regarded to be of low concern and allows for discussions to be had over the use of feed blocks on the hill to pull the ‘tick mop’ into high tick density areas. The Cairngorms National Park Authority has selected Auchnerran, together with other farms, to be a part of its ‘Cairngorms Future Farming’ project, which is part of a wider Cairngorms 2030 Programme. We will use the funding to trial equipment that will improve sward diversity, help collect livestock data, and improve performance and efficiency within the flock. Boosting our productivity, efficiency, and biodiversity will reduce our carbon footprint and help Scotland reach its target of net zero by 2045.
KEY FINDINGS Direct drilling of swedes has proved to be a useful method of growing sufficient winter food for sheep, while reducing cost, labour, and fuel use. The farm produced 400 bales of silage with an average of 77% dry matter, cutting the cost per bale and reducing our waste plastic. Low cases of OPA viral infection (<1%) were found within the flock for the second year running. We have been awarded funding for the ‘Cairngorms Future Farming’ project. This will be used to demonstrate how we can boost our productivity, efficiency, and biodiversity and reduce our carbon footprint, helping Scotland reach its target of net zero by 2045. Dyfan Jenkins gwct.org.uk/auchnerran
GWCT RESEARCH REPORT • 2024 | 55
| PEPSICO FAB PROJECT
The PepsiCo Farming Arable Biodiversity project The PepsiCo Farming Arable Biodiversity (PepsiCo FAB) project, initiated in 2022, represents a partnership between PepsiCo, Scottish Agronomy, NatureScot and the GWCT. This initiative strives to merge productive farming with biodiversity conservation, using evidence-based methods and collaboration to enhance semi-natural habitats while maintaining agricultural productivity. The project builds on the success of the EU Interreg PARTRIDGE project (2016-2023), which demonstrated how tailored management practices could boost farmland biodiversity. PepsiCo FAB seeks to scale up these proven approaches, demonstrating them across multiple farms in Scotland, and helping to prepare for the implementation of broader agri-environment schemes.
A
key focus of the project was on improving the quality of semi-natural habitats, such as field margins and hedgerows, to support pollinators, farmland birds, and other wildlife. The main demonstration site was Balgonie Estate, a lowland arable farm in Fife, where we hosted workshops, field visits, and training for farmers, policymakers, and other stakeholders. The project also supported five additional farms around the Fife and Angus region to apply biodiversity management techniques. Baseline biodiversity surveys were conducted at these farms to identify the effect of our various interventions and NatureScot biodiversity scorecards were used to measure on-farm outcomes. The project assesses the potential to improve biodiversity benefits at a landscape scale through a Farmer Cluster whose members share a common production interest, specifically supplying raw materials to PepsiCo.
Grey partridge counts: In 2024, we completed our 10th annual partridge count at Balgonie Estate. This revealed a stable and productive population of partridges, underscoring the effectiveness of the conservation strategies implemented over the past decade. The spring count recorded 40 pairs and four individuals across 676 hectares; an average density of 5.9 pairs per 100 /hectares. While this figure represents a slight decrease from the 6.2 pairs per 100 hectares recorded in 2023, it remains well above the 10-year average of 5.0 pairs per 100 hectares (see Table 1), highlighting the long-term success of our management interventions. The autumn count provided further encouraging results, recording a total of 268 partridges. The young-to-old (YtO) ratio of 3.12 was marginally lower than the 3.30 recorded in 2023, yet it remains a strong indicator of reproductive success. The
TABLE 1 GREY PARTRIDGE COUNTS Ten years of grey partridge counts at Balgonie. From spring pair counts we calculated breeding density. Autumn covey counts provide information on grey partridge productivity Spring pairs Autumn totals
2014 4.3 48 49 2015 4.4 62 112 2016 4.6 69 139 2017 -* 23 76 2018 5.0 31 83 2019 6.1 44 105 2020 -* 43 102 2021 3.8 61 153 2022 6.0 73 204 2023 6.2 81 267 2024 5.9 65 203 * No spring counts were undertaken in 2017 and 2020
56 | GWCT RESEARCH REPORT • 2024
97 174 208 99 114 149 156 214 294 381 268
1.02 1.81 2.01 3.30 2.68 2.39 2.37 2.51 2.79 3.30 3.12
% coveys Mean brood Area counted with young size (ha) 71 94 70 100 80 87 91 96 95 87 88
4.1 7 6.6 5.4 6 5.3 4.9 5.9 5.8 7.9 7.8
688 688 688 348 369 526 468 528 579 641 596
Total/100ha
14.1 25.3 30.2 28.5 30.9 28.3 33.3 40.5 50.8 59.4 45.0
© David Stone, Fiona Torrance
Year Pairs/ 100ha Adult Young Total YtO ratio
GREENER FARMING |
mean brood size of 7.8, only slightly below the 7.9 observed in 2023, demonstrates the continued health and productivity of the population. These results are a testament to the favourable conditions provided by our management practices and illustrate the resilience of the population, even in the face of fluctuating environmental conditions. Notably, our autumn counts have increased by 219% since records began in 2014. This can be attributed to several key habitat management efforts, including the establishment of wildflower-rich field margins, which provide critical foraging areas for broods, and the planting and maintenance of hedgerows, which offer shelter and nesting sites. These measures have also enhanced biodiversity more broadly, benefiting a wide range of farmland species. We aim to build on this success by expanding and incorporating innovative approaches and enhancing connectivity between habitats, to further bolster biodiversity. These efforts align with PepsiCo and the GWCT’s broader commitment to sustainable farming practices that support biodiversity while maintaining agricultural productivity.
Gamebird feeders: We also investigated whether a redesigned feeder could influence which species used it. Gamebird feeders are used as a management tool to mitigate the ‘hungry gap’ over the late winter/early spring months when food scarcity can lead to
increased bird mortality. The study aimed to compare the usage of two feeder designs by target species (gamebirds and songbirds) and non-target species (mammals and corvids) to develop a more efficient design. The original feeder design consists of a stationary plastic drum supported by three wooden legs, with a metal spiral dispenser exposed at the bottom. This design allows non-target species, such as rats and roe deer, to easily access the grain through the dispenser. The new improved feeder design is free hanging to prevent rats from climbing up the legs, and deters deer as birds have to peck at slits in the bottom of the feeder to access the grain. Across the study, original feeders exhibited higher overall activity, but this was largely due to visits by non-target species. New feeders showed consistent activity but proved more selective, favouring species such as grey partridges and songbirds. Notably, new treatment feeders effectively reduced non-target species, with mammals such as deer, mice, and badgers showing a clear preference for original feeders. This further highlights the treatment feeders’ effectiveness in minimising non-target activity (see Figure 1). The introduction of gamebird feeders has provided valuable insights into optimising supplementary feeding. The new improved treatment feeders demonstrated greater efficiency in targeting gamebirds and songbirds. Future research should focus on refining the design to maximise its potential as a conservation tool.
Figure 1 The mean percentage of days each mammal species was observed at new improved and original feeders for all study sites
Original New improved
100
Proportion of days observed (%) (+ 1SE)
90 80 70 60 50 40 30 20 10 0
Deer
Hare
Mouse
Fox
Badger
KEY FINDINGS We worked closely with NatureScot and Scottish Government to inform new agrienvironment policies. We have demonstrated that biodiversity management techniques such as field margin enhancements have increased grey partridge numbers. We devised a modified gamebird feeder to reduce seed wastage to non-target species. Alistair Green gwct.org.uk/balgonie
GWCT RESEARCH REPORT • 2024 | 57
SECTION 4 SPECIES RECOVERY
© Sander Meertins Photography
While moth numbers are showing a steady drop nationally, the longterm monitoring of moths at the Allerton Project shows significant increases in both abundance and diversity
58 | GWCT RESEARCH REPORT • 2024
Species recovery
gwct.org.uk
60
Lapwing chick survival on fallow plots
62
Understanding the value of headstarting curlew
66
Breeding curlew in the New Forest
68
The impact of human food on fox numbers
70
Innovative use of drone technology
74
Boosting the abundance and diversity of moths
76
Auchnerran Breeding Bird Survey
78
Black grouse range expansion
80
Capercaillie population in Scotland
GWCT RESEARCH REPORT • 2024 | 59
| LAPWING FALLOW PLOTS
Lapwing chick survival on fallow plots In the UK, the breeding lapwing population is currently red-listed due to ongoing declines. In arable areas where lapwing breed, these declines have been attributed to low breeding success caused by agricultural intensification and increases in generalist predator populations. Fallow plots have been available to farmers as an option under various agri-environment schemes since the 1990s as a method of supporting arable-breeding lapwing. GWCT studies between 2012 and 2016, however, have shown mixed results regarding their effectiveness in improving lapwing breeding success.
60 | GWCT RESEARCH REPORT • 2024
sites to be 0.52 chicks per pair. This is below the 0.7 chicks per pair threshold required to maintain a stable population, suggesting that fallow plots alone may not be providing suitable brood-rearing habitat. Three of the sites did, however, reach a productivity greater than 0.7 (see Figure 1). These were sites where some form of additional targeted management was in place, such as nearby cover crops or active predation management. Although radio-tracking can help determine chick fate, it is labourintensive and provides only a small amount of data per chick, making it less suitable for assessment of brood range and habitat use. In 2024, we trialled tagging adult female lapwing with GPS tags, allowing us to collect more and increasingly accurate data. The results from the eight adults tagged in 2024 are promising, and we hope to tag more in 2025 to improve our understanding of breeding habitat use in adult lapwing and assess how this reflects the movement of broods. We planned to experimentally trial annual spring-sown brood cover strips next to a subset of fallow plots. However, the wet winter of 2023/24 meant that cover crop strips could not be sown or establishment was poor. Therefore we could not determine their effectiveness for improving invertebrates availability or lapwing breeding success. Autumn-sown or perennial seed mixes may provide more suitable and cost-effective alternatives, which we hope to trial in 2025. Nevertheless, we found that invertebrate numbers were higher at sites where covers were already available, suggesting that they may be able to increase lapwing chick food availability on plots.
ACKNOWLEDGEMENTS
This project was funded as part of Natural England’s (NE) Species Recovery Programme. Thank you to Sarah Anthony and Harold Makant from NE, Anna Thompson, Piera Coleman, Josh Deakins, Gemma Morgan, Lydia Farnell, Ferne Ellington, Robert English, Sophie Eldrett and Andrew Hoodless. We are also indebted to all the landowners and farmers who allowed access to their fallow plots, including members of the Selborne Landscape Partnership.
© Chris Heward
F
allow plots are an agri-environment scheme (AES) option where one to five hectares of open ground are cultivated or sprayed in the spring, then left unplanted and undisturbed until the summer. They were originally designed to provide both nesting and foraging habitat for ground-nesting birds such as lapwing, in an attempt to improve breeding success. Previous GWCT studies, running from 2012 to 2016, found that lapwing nest survival on fallow plots was high, but that chick survival was low. Most chick losses were the result of predation or starvation, although these factors could be interacting. One possible solution for improving chick survival is to provide brood-rearing habitat, such as cover crops, near fallow plots. In theory, such brood-rearing habitat should provide cover for chicks to shelter from predators and invertebrates for chicks to feed on. Building on the previous fallow plot studies, our new study aimed to monitor lapwing breeding on fallow plots and identify whether factors such as the surrounding habitat might be influencing their productivity. Over 2023 and 2024, we monitored 47 fallow plots on 24 farms across Hampshire, Wiltshire, and Dorset. Ten of these plots were visited in previous studies from 2012 to 2016. Since then, the total number of breeding pairs declined at all but one site, and five farms completely lost their breeding lapwing. From the 2023 and 2024 surveys, fallow plots with a greater proportion of their perimeter bordered by an ‘agri-environment crop’ (ie. a crop which is sown for the benefit of farmland wildlife) were more likely to support breeding lapwing. This was probably not because these AES habitats had ‘attracted’ lapwing, but because the provision of suitable habitat had slowed declines and prevented lapwings from being completely lost from these sites. On the nine plots with breeding lapwing, 32 nests were monitored using temperature loggers and trail cameras. Similar to previous studies, overall nest survival was high, with 71.9% of nests hatching at least one egg, suggesting that fallow plots continue to provide suitable nest conditions for lapwing. Overall chick survival was low. Via a combination of observing chicks in the field and radio-tracking (we tagged 21 chicks from 11 broods), we estimated overall productivity across the occupied
SPECIES RECOVERY |
Figure 1 Fallow plots with breeding lapwing in 2024, showing (a) the number of breeding lapwing pairs, (b) daily nest survival probabilities and (c) chick fledging success for nine fallow plots. A threshold of 0.7 chicks per pair (dashed line, c) is required to maintain a stable population. Fallow plots A and B were on the same farm c
10
0.9
8
0.8
7
0.7
6 5 4 3
0.5 0.4 0.3 0.2
1
0.1 0 A
B
C
D
E
F
G
H
A
I
B
C
D
E
F
G
H
I
Fallow plot ID
Fallow plot ID
1.0 0.9
STUDY IMPORTANCE
0.8
Nest survival probability
0.6
2
0
b
1.0
9
Chicks fledged per pair
Number of breeding pairs
a
This study informs how fallow plots, provided under agri-environment schemes, can improve the breeding success of arable-breeding lapwing. Fallow plots are among the highest paying options available under the expanded Sustainable Farming Incentive 2024 (option AHW5: ‘Nesting plots for lapwing’), with payments of £765 per hectare per year available. It is vital that they provide good value for money and are achieving their primary aims, while remaining practical and cost-effective for farmers.
0.7 0.6 0.5 0.4 0.3 0.2 0.1 0 A
B
C
D
E
F
G
H
I
Fallow plot ID
KEY FINDINGS Breeding lapwing have been lost from a large proportion of surveyed fallow plots over the past 10 years, with five of the 10 plots we resurveyed from previous studies having no breeding birds in 2024. Sites that still had breeding lapwing tended to be those providing additional habitat near fallow plots. During 2024, we observed high nest survival (0.5 to 1.0) on fallow plots, suggesting that the option continues to provide good nesting habitat for lapwing. The average chick survival of 0.52 chicks per pair across our sites was below the 0.7 chicks per pair level required to maintain a stable population. Although our trials of spring-sown brood-cover strips were unsuccessful in 2024, our study suggests that providing additional brood-rearing habitat, such as cover crops or wild bird seed mixes, could be a solution for improving chick survival and thus lapwing productivity on fallow plots. Bleddyn Thomas, Lizzie Grayshon & Chris Heward gwct.org.uk/lapwing
GWCT RESEARCH REPORT • 2024 | 61
| CURLEW HEADSTARTING
Understanding the value of headstarting curlew
H
eadstarting is one of several tools available to curlew conservationists. By its strictest definition, it involves captive-rearing individuals through the risky, initial stages of their life cycle, then returning them to their natal sites for release. The intention is to artificially increase nest and chick survival and bolster populations experiencing low breeding success. This approach has been demonstrated by the Curlew Country project in Shropshire, where curlew eggs, in an area where nests were experiencing a substantial risk of predation or destruction, were collected under licence, hatched, and the chicks reared in safe, captive conditions. In 2021, headstarting projects were initiated by the Wildfowl and Wetlands Trust (WWT), British Trust for Ornithology (BTO), Pensthorpe Conservation and Natural England (NE) to hatch curlew eggs collected from East Anglian airfields, where the risk posed to aircraft meant that curlew nests there would be destroyed. The young curlew, once reared to fledging age, could not be returned to their natal sites, and so were released at alternative sites where native curlew populations had been lost or greatly reduced. This differed from the traditional definition of headstarting because it also included translocation. Headstarting remains relatively untested as a conservation intervention for curlew and has largely been employed in situations where nest destruction was otherwise inevitable. It is also costly; curlew rearing is a specialist process requiring expensive equipment and trained aviculturists. It is only a 62 | GWCT RESEARCH REPORT • 2024
worthwhile conservation tool if released curlew eventually breed and contribute to wild curlew populations, either at their release site or elsewhere. There is, therefore, a pressing need to improve our collective understanding of headstarting’s longterm effectiveness before it can be considered an effective conservation tool. In 2022, the Norfolk Estate in West Sussex initiated a curlew headstarting and translocation programme to reintroduce curlew to the South Downs. The project is built on the strong foundations of the estate’s existing habitat quality and effective predation management, which already allows grey partridge and lapwing to flourish. NE, who grant licences for reintroduction projects, recognised that the Norfolk Estate’s conservation project could be used to scientifically evaluate and demonstrate how headstarting might be used to conserve curlew more widely. GWCT are working with the Norfolk Estate to monitor their project, using GPS-GSM tracking and colour-ringing to monitor post-release movement and survival of curlew. In 2022, 40 eggs were collected from nests in the Yorkshire Dales, at sites where there was a substantial risk of accidental destruction from silage production or public access. Thanks to the effort of the Norfolk Estate’s chick-rearing team, 31 curlew fledglings (78%) were released at two sites on the South Downs, 16 of which were tagged with GPS transmitters by the GWCT. All released birds were marked with unique colour rings that allow them to be identified by birdwatchers and reported.
© Chris Heward, Lizzie Grayshon, MMCez
Breeding curlew numbers in the UK are estimated to have fallen by 65% since 1970. UK declines have been most severe in southern England and Wales, where it is thought approximately c.1,600 pairs of breeding curlew remain. Although these fragmented southern populations are small compared with those in their upland strongholds, conservation priorities also consider other metrics of a species’ status, eg. range extent. The provision of suitable habitat, prevention of nest destruction, and legal control of predators remain the most important methods of increasing curlew breeding success, but there is a need to explore additional solutions at sites where curlew numbers have become critically low or been lost completely.
SPECIES RECOVERY |
Headstarting is only a worthwhile conservation tool if released curlew eventually breed and contribute to wild curlew populations, either at their release site or elsewhere.
Curlew chicks are raised in large, naturalistic enclosures for the first 50-70 days of their lives. These are enlarged as the chicks grow.
ACKNOWLEDGEMENTS
The Southern England Curlew Headstarting Project is only possible because of the continued dedication of its originators, particularly the Duke of Norfolk. We commend everyone at the Norfolk Estate, Cranborne Estate and Elmley NNR for their efforts, especially those involved in the challenging task of rearing chicks. We thank all three sites for accommodating and assisting with GWCT monitoring. The project is reliant on the Yorkshire Dales donor sites and the egg collection teams, including Darren Chadwick who oversees incubation and transportation of eggs. We thank all gwct.org.uk/aboutcurlew
members of the project’s steering committee, including representatives of NE, who have provided advice and support. Thank you to Lizzie Grayshon, Bleddyn Thomas, Molly Brown, Anna Thompson, Ferne Ellington, Lydia Farnell, Ryan Burrell, Elli Rivers, Will Connock and the Swale Ringing Group for the assistance during ringing and tagging work. Also thank you to Clive Bealey for monitoring donor sites. We thank staff at NE, BTO, Curlew Country, RSPB, UEA and WWT for sharing their experience and expertise, particularly Kane Brides and Dan Gornall at WWT, who manage the curlew colour-ringing scheme. GWCT RESEARCH REPORT • 2024 | 63
| CURLEW HEADSTARTING
Figure 1 The distance (km) and bearing of first winter locations for GPS-tagged curlew relative to their release locations. Points are colour co-ordinated according to release location (Cranborne Estate, Dorset = orange, Elmley NNR, Kent = burgundy, and Norfolk Estate, Sussex = blue). The three points marked by triangles are birds that overwintered in France North 400 350 300 250 200 150 100 50
West
0
East
South
At least eight of the 16 GPS-tagged curlew (50%) survived their first year. This compares to a typical first-year survival rate of approximately 39% among wild-reared curlew. A relatively large proportion of the mortality occurred in the two weeks after release, when released curlew were still adapting to life in the wild. Mortality stabilised at a low level thereafter. In 2023, the South Downs Curlew Project became the Southern England Curlew Project as two new sites joined the project: Cranborne Estate in Dorset and Elmley National Nature Reserve in Kent. Like the Norfolk Estate, these sites were selected because they already provide suitable habitat and predator management. The intention is to run curlew headstarting and translocations at these three sites for five years, which will allow us to assess whether the method can establish self-sustaining, breeding curlew populations. Since 2022, a total of 192 curlew have been released across the three sites, 80 of which (42%) have been GPS-tagged. Young, wild-reared curlew leave their natal sites in late summer to migrate to coastal wintering sites. We found that the same natural behaviours were exhibited by headstarted individuals. Headstarted curlew moved between one and 380 kilometres (km), typically in August. The shortest distances were travelled by curlew at Elmley NNR, whose release site is close to the wintering habitats offered by the Swale Estuary. From the Norfolk and Cranborne Estates, some curlew migrated as far as the nearest estuary, in both cases around 30km. Of the 30 curlew for 64 | GWCT RESEARCH REPORT • 2024
which post-release migrations were recorded, 13 (43%) travelled more than 100km, to Dorset, Devon, Cornwall and France. The majority of curlew moved in westerly or southerly directions (see Figure 1). In general, once settled at a coastal site, headstarted curlew remained faithful to a single site throughout their first winter and the following year (but see Figure 2). This behaviour corresponds with that of wild-reared curlew, which usually do not attempt to breed until they are two or three years old. Of the 16 GPS-tagged curlew released in 2022, seven (44%) were still transmitting in spring 2024. By May 2024, all seven had returned to, or remained, within 30km of their release site. Four of these seven GPS-tagged curlew returned to the Norfolk Estate itself, and at least one other colour-ringed curlew from 2022 was also recorded there. At least three of the 2022 curlew attempted to breed in 2024. One GPS-tagged curlew paired with a wild partner and attempted to breed in the East Midlands, with a nest site identified from its tracking data. Two headstarted curlew paired with one another and attempted to breed within 100 metres of the female’s release site in Sussex. They were later joined by a third headstarted curlew who had not found a mate. Although none of these nesting attempts hatched chicks, they provide promising signs of normal breeding behaviour. As the number of returning curlew increases over successive years, the likelihood of curlew pairing, nesting, and fledging chicks increases.
SPECIES RECOVERY |
Figure 2 The movements of a single curlew, ‘N0’ during 2022 (light pink), 2023 (dark pink) and 2024 (green). N0 was the only curlew to make a substantial relocation between the juvenile autumn migration (2022) and second-year spring migration (2023), moving from Cornwall to Pembrokeshire in June 2023. In April 2024, N0 returned to West Sussex and attempted to breed
Curlew headstarting is a major undertaking. There are key factors that must be considered, including animal welfare, cost effectiveness, the possible impacts on donor populations, and interactions with wild-breeding populations. It is essential that projects pioneering new techniques like headstarting adopt methods with in-built scientific monitoring, ensuring that their efforts can inform other conservation projects that will be following in their footsteps.
KEY FINDINGS Since 2022, we have tagged 80 ‘headstarted’ curlew with GPS-GSM transmitters to understand their post-release movements. Of 28 curlew GPS-tagged in Dorset and Sussex, for which full post-release migrations were recorded, 25 (89%) selected wintering sites along the south-west coast of England, ranging from 30 to 320km from their release site. Three GPS-tagged curlew (11%) selected wintering sites in France. Curlew released at a coastal site in Kent wintered locally, between one and five kilometres from their release site. Of the 16 curlew GPS-tagged in 2022, seven (44%) were alive and still transmitting in spring 2024. All returned, at least briefly, to within 30km of their release site, and at least two attempted to breed there. Chris Heward & Andrew Hoodless gwct.org.uk/aboutcurlew
GWCT RESEARCH REPORT • 2024 | 65
| BREEDING CURLEW
a
b
Figure 1 Different adult concealment strategies during nesting – (a) low dry heath vegetation with good visibility, and (b) concealed in dense mire vegetation but sacrificing some visual range (in red dashed circle)
Breeding curlew in the New Forest The UK is crucial for the conservation of breeding Eurasian curlew, playing a significant part in maintaining global population numbers. Approximately 25% of the global population breeds in this country every year, although numbers are declining rapidly. Suitable breeding habitat is under increasing threat from human land use change – from roads and recreation, to woodland expansion created to mitigate climate change. We need to understand what constitutes a good nest site for a curlew, so these areas can be protected effectively, or better yet, expanded.
G
round-nesting birds, such as curlew, are declining more rapidly than any other group of birds in Europe. Habitat degradation plays a part in this, when birds cannot access habitat that meets their ecological needs during the breeding cycle. Both adult curlew and their nests are vulnerable to predation during breeding. Selecting a suitable nest site requires decisions about factors that affect predation risk, balancing the risk to both adult and nest as much as possible. Different nest locations offer variable levels of camouflage, visibility, foraging opportunities, and perceived or actual predator and human presence (see Figure 1).
The New Forest, Hampshire, holds a significant population of breeding curlew, alongside high levels of human recreation, habitat fragmentation, and a large predator assemblage. This population is critical in maintaining the breeding range of curlew in the UK and losing them would cause significant range contraction. We undertook research into nest site selection and habitat use of breeding adult curlew to better inform habitat management decisions. Intensive fieldwork took place from 2020 to 2022, recording the location of 76 curlew nests. Additionally, a sample of seven adult curlews breeding in the New Forest were tagged with a GPS
Figure 2 Comparison of the habitats occupied by real and randomly located pseudo nests. Solid symbols show the number of real nests located in each habitat. Error bars show the range of pseudo nest numbers in each habitat
Dry heath
Mire
0
20
40
Number of nests
66 | GWCT RESEARCH REPORT • 2024
60
© Elli Rivers
Habitat
Wet heath
SPECIES RECOVERY |
transmitter. Their movements were analysed to understand habitat use during 11 subsequent incubation periods. We used this sample of incubating curlew to produce a biologically informative proxy of the habitats utilised by adults around the nest site. The size of the home ranges of the sampled adults, containing 95% of the recorded adult locations, correlated best with a buffer of 500 metres (m) around their nest. This 500m buffer was then applied to the 76 nests in the study, as a measure of average home range for incubating curlew. Forestry England supplied mapped data for the New Forest, detailing the location of semi-natural habitat (dry heath, wet heath, mire, dry grassland, wet grassland, woodland and scrub), as well as car parks, campsites, minor roads and the A31/A35 – the main A roads through the New Forest. To understand whether the placement of nests was non-random, each nest location was assessed against 10,000 replicates of randomly-located pseudo nests. We also compared daily nest survival in different habitats and tested for a relationship between daily nest survival and distance from woodland. There is substantially more dry heath in the New Forest (4,237 hectares (ha)) than mire (1,249ha) and wet heath (1,224ha). However, in comparison to a random distribution, a
greater proportion of curlew nest locations were in mire than dry heath, suggesting this habitat was strongly selected by the birds (see Figure 2). When the distance from nests to habitat features was compared to those of the pseudo nests, actual nests were significantly further from woodland and the A31 than pseudo nests, and showed some avoidance of minor roads (see Figure 3). The distance actual nests were from car parks, campsites and the A35 did not differ from those of the pseudo nests. The strongest relationship between the probability of daily nest survival and any of the recorded habitat variables was the proportion of mire in a 500m buffer around the nest; with the likelihood of nest survival increasing with the area of mire. Comparison of the three main nesting habitats showed that the likelihood of daily nest survival was highest in mire, followed by wet heath, and lowest in dry heath, reflecting the same order as the strength of their selection for each habitat. No relationship was found between the distance to woodland and nest survival, suggesting the relationship between predator activity and woodland cover is more complex than might be assumed. However, the impact on nest distribution is significant, with woodland planting having the potential to exclude curlew from optimal nesting habitats.
Figure 3 Comparison of the mean distance to habitat features between real and randomly-located pseudo nests. Due to the variation in the distance to features, two groups of features were plotted with different ranges on the horizontal axis. Solid symbols show mean distances from real nests, error bars show the range of mean distances from pseudo nests
Woodland Campsites
Feature
Scrub
Permanent pond
A35
Forest roads A31 Car park 0
500
1,000
1,500
0
2,000
4,000
6,000
8,000
Mean nearest distance
KEY FINDINGS Curlew nesting in the New Forest showed a strong preference for nesting in mire habitats, as opposed to dry heath, despite the greater availability of the latter. Nest survival was also highest in mire habitats, and lowest in dry heath. Curlew nest locations indicated a strong avoidance of woodland, but we found no significant effect of proximity to woodland on nest survival. These findings can help inform habitat management decisions in the future, especially with growing pressure to plant trees for climate change mitigation. Elli Rivers gwct.org.uk/aboutcurlew
GWCT RESEARCH REPORT • 2024 | 67
| FOXES IN THE NEW FOREST
The impact of human food on fox numbers Breeding waders, such as Eurasian curlew, are struggling with poor breeding success, especially in the New Forest, largely due to nest predation by foxes. To help improve curlew breeding success by reducing predation, Forestry England wildlife managers lethally control foxes. Yet, human-provided food might be supporting fox populations, undermining culling efforts, and putting additional pressure on ground-nesting birds. Human-sourced food is attractive to foxes as it offers lots of energy, without a fox needing to spend much time or effort foraging.
T
he New Forest National Park is an important breeding area for a number of red-listed breeding wader birds, but recent surveys show steep declines in wader numbers linked to poor productivity. Although the area is well protected by high-level conservation designations, waders breeding here are subjected to significant anthropogenic pressure. The park is flanked by the cities of Southampton and Bournemouth, and the adjacent rural landscape includes numerous towns, villages, settlements, and open-access land. More than 1.2 million humans reside in the region, and the population doubles with visitors to the park during the spring and summer months when wader breeding occurs. The importance of predation as a contributor of poor breeding productivity is evidenced by our trail camera monitoring of 429 wader nests across nine different species, between 2021 and 2024, showing 151 predation events, of which 54% were attributed to foxes. As a result, we are particularly interested in
understanding how human activity drives the population dynamics of generalist predators – especially foxes – in this region. We examined the stomach contents of 447 foxes culled in the vicinity of New Forest curlew breeding areas. We sorted these stomach contents into several broad food categories (including plant material, invertebrates, small mammal, birds and human-sourced food), measuring the frequency of occurrence and the average proportion of the stomach content of each category when present. These seasons aligned with key stages of the fox life cycle such as breeding and raising cubs, as well as shifts in natural food availability. Distance to human infrastructure typically reflects the availability of human-sourced food (see Figure 1), potentially influencing fox stomach content as well. We analysed the relationship between time of year (breeding or nonbreeding period) and proximity to human infrastructure, with the occurrence of the broad food categories in the stomach contents. We also developed simulation models to estimate the number of
Figure 1
a
b
68 | GWCT RESEARCH REPORT • 2024
c
d
© Elli Rivers, Nathan Williams, Laurie Campbell
Examples of stomachs containing different types of anthropogenic foods and human-derived materials consumed by foxes. (L-R) a) peanuts, b) cooked fish and potatoes, c) pet food, cooked chicken, and an egg box label, d) potato chips and remains of a rubbish bag
SPECIES RECOVERY |
Figure 2 Diet of foxes in terms of volume of a given food category when present (left axis) against its frequency of occurrence (x-axis). Different coloured lines connect points with equal relative volume (right axis) 100 100
Large mammal 90 90
Gamebird Lagomorph Anthropogenic Bird
70 70 60 60 50 50
50%
40 40 30 30
Total volume in diet (%)
Volume when present (%)
80 80
Small mammal Invertebrate Plants Herptile Fish Other Eggshells Unidentified
20 20
20%
10 10
10%
00
5% 1% 0 0
10 10
20 20
30 30
40 40
50 50
60 60
70 70
80 80
90 90
100 100
Frequency of occurrence (%)
foxes in the New Forest that were supported by human-sourced food, with the aim of understanding the extent to which humansourced food might be bolstering fox populations. Fox stomach content varied substantially and was not dominated by any single food category (see Figure 2). Humansourced food accounted for 14% of fox diet on average, although this is probably an underestimate as 22.6% of the stomach contents could not be assigned to a category. Overall, humansourced food was significantly more likely to be found in fox stomachs sampled close to human infrastructure, like houses, public buildings, and car parks, although interestingly it occurred uniformly in fox stomachs year-round. Due to the uncertainties in factors such as adult fox density, the results of the simulations varied widely. Despite this, all simulations showed that human food would be undermining culling efforts to some extent, supporting between 29.5% and 287.7% worth of foxes that are culled each year, thus exacerbating predation pressure to vulnerable groundnesting birds and other at-risk wildlife, such as reptiles.
Diversionary feeding is recognised as a management tool for reducing predation pressure on vulnerable wildlife, but it requires careful implementation and robust monitoring. However, unregulated food provisioning, as observed here, is unlikely to prevent an increase in fox predation. Consumption of humansourced food did not change based on season, despite higher tourism rates in the New Forest during summer. Until 2025 the New Forest District Council have left household waste in bags on the street for collection, making them very accessible to foxes and other scavengers. Improved food sanitation could therefore help to reduce fox densities and predation pressure, helping to preserve the remaining breeding wader populations in the New Forest. Our findings have recently been published open access in the journal Mammal Research. To complement this research, we are conducting separate dietary studies using the more advanced dietary analysis tools of metabarcoding and stable isotope analysis, which will continue to improve our understanding of fox diet in the New Forest and the wider region.
KEY FINDINGS Foxes are generalist predators found throughout the UK. They often predate nests and so are linked to declines in native wildlife such as ground-nesting waders. We studied the contents of fox stomachs, collected from across the New Forest National Park, an important breeding area for several wader species. The analysis showed that foxes have a very varied diet and a considerable proportion of this was human food. Simulation models demonstrated the potential impact of human food in supporting fox populations, likely undermining fox control efforts. Introducing wheelie bins to replace plastic sacks could reduce the food available to foxes. Nathan Williams gwct.org.uk/predation
GWCT RESEARCH REPORT • 2024 | 69
| DRONE TECHNOLOGY
Innovative use of drone technology In recent years, we have witnessed firsthand how drone technology has revolutionised conservation efforts. It has provided a cost-effective, accurate, and environmentally friendly alternative and addition to traditional wildlife surveying methods. At GWCT Wales, we have been at the forefront of integrating drones into ecological monitoring, transforming the way we assess and manage wildlife populations and habitats.
Precision and efficiency in deer monitoring One of the standout successes of our use of drone technology has been in deer population surveys. An example in South Wales illustrates this. We were asked to survey the deer herd on a 2,000-acre estate with no current, accurate population data. Using historic estimates, we initially estimated the herd size at around 120. After conducting the drone survey, we found the actual number was closer to 140. We were also able to conduct additional surveys to assess the herd’s activity levels and the impact on the habitat. We were then able to determine future, detailed management strategies with the estate. The real power of drones in deer surveys is their ability to provide continuous monitoring without disturbing the animals – especially in difficult terrain. The drone allowed us to track deer without causing them to move, which helped avoid double-counting and led to highly accurate population estimates. It has been invaluable 70 | GWCT RESEARCH REPORT • 2024
in helping landowners make informed decisions on deer population control, culling, and maintaining sustainable herd numbers. In places like South Wales, the drone’s capabilities have directly influenced land management practices. We were able to identify key targets for population reduction, such as female deer, as male numbers were found to be low. This is critical for maintaining the health of the herd and preventing further habitat damage.
Expanding drone use across the UK The success we saw with deer surveys in South Wales opened the door to even larger projects. In early 2024, we were part of a team tasked with conducting aerial surveys across a 14,500-acre Scottish Highland estate. Over the course of three days, we used the drone to map and survey all three deer species present on the estate. We produced maps showing localised abundance and gender classifications for the herd, all while navigating challenging terrain. By using the onboard laser rangefinder, we could gather critical data in areas that would have been impossible to survey by foot or with a helicopter. This project was our largest to date and really demonstrated the power of drones in large-scale wildlife monitoring. It also highlighted how drones can assist in land management decisions, especially in remote or rugged areas where traditional survey methods would struggle.
Groundbreaking work in bird conservation Drones are not just for mammal surveys – they have also played a vital role in bird conservation. One of the most exciting projects we have been involved in is the Curlew Connections Wales Project, which involves the monitoring of curlew nests and chicks.
© James Warrington, Lee Oliver
W
e first decided to invest in drone technology to aid in deer surveys. Before we started using drones, conducting deer surveys often required helicopters. While this method was effective, it was financially unsustainable, with each flight costing around £2,500, and multiple flights needed annually for each survey area. Not only was this expensive, but it also raised concerns about the environmental impact and the scientific accuracy of the surveys. In 2020, we invested in a high-spec drone, equipped with a thermal camera and an impressive 200x zoom lens. Over the past five years, we have used it to conduct numerous surveys across the UK, including tracking deer, feral goats, foxes, and invasive species such as grey squirrels and Himalayan Balsam.
SPECIES RECOVERY |
Drones provide valuable data on tern colony behaviour, nesting, and location of birds.
Using drones to survey deer can provide continuous monitoring without disturbing the animals – especially in difficult terrain.
gwct.org.uk/wales
GWCT RESEARCH REPORT • 2024 | 71
| DRONE TECHNOLOGY
We’ve since used drones to enhance traditional species surveys. This has included assessing the use of a drone during the annual grey partridge counts in Sussex
Using thermal and zoom cameras on our drones, we were able to locate curlew nests and track chick movements – something that had never been done before with such precision. In 2024, we successfully used drones to monitor curlew nests in real-time, reducing human disturbance, and improving the chances of chicks fledging successfully. The quickest time we located a curlew nest in the season with a drone was five minutes and 30 seconds (in 63 acres of farmland). It would have taken much longer had we done this from a car with binoculars and searching on foot. In Sussex, we also used drones to read leg tags on a headstarted curlew (see page 62) – a first for us and a remarkable breakthrough. This was made possible by the drone’s ability to get close enough to read tags without disturbing the birds, providing valuable data for long-term tracking.
A new era for partridge and tern surveys Similarly, at high altitudes, we were able to assess tern colony size and health, without disturbing the birds. Using drones also provided valuable data on colony behaviour, nesting, and location of birds. This was an opportunity to check and investigate the potential disturbance a drone might cause on such a sensitive species. The results reassured us that, at the altitudes we were flying, disturbance was minimal. 72 | GWCT RESEARCH REPORT • 2024
We’ve since used drones to enhance traditional species surveys. This has included assessing the use of a drone during the annual grey partridge counts in Sussex. Using drones, we were able to locate coveys alongside traditional methods of counting using vehicles and were able to spot coveys in dense vegetation. Further work is needed to compare with traditional survey methods, but the use of drones may allow better estimates of partridge numbers in areas with dense cover. In Sussex we also observed the effectiveness of drone surveys for monitoring brown hares, meadow pipits, and corn buntings in farmland environments.
Habitat mapping and monitoring Beyond wildlife surveys, drones have also transformed the way we can map and monitor habitats. Traditional methods of habitat recording can be time consuming and, in some cases, impossible due to access issues, for example in marshland. Using the drone has allowed us to create detailed, automated, and repeatable maps with great accuracy. We are particularly excited about how we have been using Orthomosaic maps to track habitat changes over time. These are large, map-quality images with high detail and resolution made by combining many smaller images collected by the drone camera.
SPECIES RECOVERY | Using drones to help with the Sussex grey partridge counts enabled coveys to be detected in dense vegetation that might otherwise have been missed.
IN THE PRESS
As part of the Curlew Connections Wales project, curlew drone work has been publicised in various media outlets including The Times.
One of the most exciting aspects of this technology is its ability to track habitat improvements. After conducting habitat restoration work, we can use drones to assess changes, such as increased water levels or new vegetation growth. This allows us to collaborate with farmers and landowners to understand the success of their interventions and make data-driven decisions about future habitat management.
Conclusion: A bright future for drone-assisted conservation
possibilities for wildlife monitoring, habitat mapping, and species management. The advantages over traditional methods are clear: drones are cost-effective, accurate, and non-disruptive. As drone technology continues to evolve, we are excited to develop ever more innovative applications that will improve conservation efforts across the UK and beyond. The future of wildlife monitoring is certainly in the sky, and drones are leading the way to a more sustainable and scientifically informed approach to environmental stewardship.
The integration of drones into conservation has broadened the
KEY FINDINGS The drone can locate deer through dense canopy (winter) and with the zoom capabilities, sexing and ageing of animals is simple with prior deer knowledge. Surveying of 3,000 terns. Approaching from maximum height of 120m and a distance of 500m, terns were observed at ground level from 100m resulting in zero disturbance. The GWCT are the first conservation organisation to locate curlew nests and chicks with no disturbance. For example we found a nest after searching a 63 acre field for only five minutes and 30 seconds. We have already trialled the drone to locate and sex red grouse with great success. We will soon trial on counting brood size and black grouse. From 2D imagery and photomosaic stitching we can produce 3D images of habitats that can be manipulated with software to produce volume size. James Warrington & Lee Oliver gwct.org.uk/wales
GWCT RESEARCH REPORT • 2024 | 73
| ALLERTON PROJECT
Clifden nonpareil may have colonised Loddington due to a warming climate or planting larval foodplants such as poplars.
Boosting the abundance and diversity of moths Moths are important components of the invertebrate fauna of the UK. Many act as pollinators, and their different life stages serve as food resources for other wildlife such as birds, bats, and parasitic insects. The Rothamsted Insect Survey has been operating a network of light traps since 1964 to monitor airborne insects and help predict pest outbreaks. This information gathered on moths represents one of the most comprehensive long-term datasets on insects in the world. The network currently includes around 80 traps, and one is based at Loddington, which has been running since 1995. A core aim of the Allerton Project is to boost biodiversity. Our light trap catches are an important measure on how we are progressing with this.
A
nnual total catches from the moth trap and their species diversity at our Allerton Project farm at Loddington allow a broad appraisal of macro (larger) moth populations (see Figure 1). Fluctuations in the total number of moths caught annually are largely explained by weather influences. However, there is an overall significant increasing trend in the total number of moths collected each year, along with a significant improvement in moth species diversity (measured using Simpson’s Diversity Index). The highest annual diversity value was the most recent (2023), when, even after 29 years operation, seven new species were added to the list of 330 species that were collected over the previous years.
Merveille du Jour
© Peter Thompson
Scorched carpet
It is possible to place these results into a national perspective because Rothamsted Research have published an analysis of their light trap network data covering the 50-year period, 1968-2017. Their network in the southern half of Britain, Loddington included, recorded an overall drop of 39% in the total number of larger moths caught over this period. Long-term data for all Britain showed that 41% of species had significantly declined in number, compared to 10% of species that showed an increase. So, four times as many species had declined as had increased. At Loddington, over a 29-year period (1995-2023), 26% of species have shown an increase, with only 4% decreasing, and 70% showing no significant change. It should be noted that the national and Loddington trapping periods
74 | GWCT RESEARCH REPORT • 2024
SPECIES RECOVERY |
Figure 1 Loddington Rothamstead Macro moth trap catches
Total no. of macro moths Simpson’s diversity index (average)
0.98
6,000
Linear (Total no. of macro moths) Linear (Simpson’s diversity index)
0.975 5,000
Number of individuals
0.965 4,000
0.96 0.955
3,000
0.95 0.945
2,000
0.94
Simpson’s diversity index
0.97
0.935
1,000
0.93 0
1995 1997 1999 2001 2003 2005
2007 2009
2011 2013 2015 2017 2019 2021
2023
0.925
Year
are not the same and that the national picture includes all habitats. Nevertheless, these results give some cause for optimism. The drivers for moth population changes are difficult to assess because our knowledge of how well larval life stages are performing is limited, since most monitoring measures adults. Most moth caterpillars are polyphagous (eats a range of plant foods) on relatively common and widespread plants. Examples of moths that may have colonised Loddington due to a warming climate or planting larval foodplants (indicated in brackets) or both are: scorched carpet (spindle); chocolate-tip and Clifden nonpareil (poplars); and merveille du jour (oak).
Chocolate-tip. (Bottom) Straw dot.
Habitat changes, especially within a few hundred metres of the light trap, have undoubtedly had an impact. The creation of two small grassy ponds within a wide grass margin adjacent to permanent pasture that has had its fertiliser inputs reduced, may have boosted the numbers of grass-breeding moth species such as flounced rustic, lunar underwing, middle-barred minor and straw dot. All these have shown significant increases in the number caught at Loddington. Management, such as planting apple trees and allowing blackthorn to flower freely and hold fruit, will have benefited dun-bar and November moth. Similarly, the inclusion of clovers and vetches in farm stewardship options, will have helped shaded broad-bar. Finding space for ‘injurious’ weeds such as nettles and ragwort, will have benefited numbers of the snout and cinnabar, respectively. Eliminating the use of pesticides, adopting a mosaic of a wide range of habitat options and managing them sympathetically for wildlife are key to maintaining moths on a site. In common with many insect groups, moth populations are responding to climate change. During a large part (1995-2016) of the time of the Loddington trap operation, the range of moths nationally will have shifted their ranges northwards by five kilometres per year on average. For healthy moth populations in the future, it is essential that suitable new habitat is available to receive these colonists. Carefully managed farmland is capable of this, as demonstrated by our moth data from Loddington.
KEY FINDINGS The long-term monitoring of moths at the Allerton Project shows significant increases in both abundance and diversity. At Allerton, over six times as many species have shown increases in abundance as opposed to decreases. Nationally, four times as many species have decreased as increased. Grassland and woodland species are faring particularly well at Allerton. A warming climate, small and large-scale habitat diversification, coupled with sympathetic management for wildlife are thought to be the main drivers of these changes. John Szczur gwct.org.uk/allerton
GWCT RESEARCH REPORT • 2024 | 75
| SCOTLAND - AUCHNERRAN FARM Conservation-conscious management practices we have instigated to help breeding waders such as lapwing, should have also benefited other groundnesting species.
Auchnerran Breeding Bird Survey
M
any species of UK farmland birds have declined substantially since the 1970s. Multiple factors are widely accepted as driving these declines, including moving from spring- to autumn-sown crops, increasing pesticide use, and the removal of non-cropped features like hedgerows. All of these drivers centre around increased agricultural intensification. As a result, the UK-wide Farmland Bird Index (FBI) is now 61% below the value recorded in 1970. At Auchnerran we are fortunate to retain a wide diversity of different farmland birds and have monitored these consistently, using a modified Breeding Bird Survey (BBS) technique. We have surveyed all the fields on the farm, completing three surveys each year. In 2024 we recorded 51 different bird species and have recorded 82 in total since 2015, with 21 of those red-listed. Of the total recorded, this includes 16 of the 19 species included in the UK’s FBI. Of these FBI species, eight are now red-listed in the UK due to population declines. However, at Auchnerran we have recorded our highest maximum count in a single BBS round for five of these species (greenfinch, skylark, starling, tree sparrow, and yellowhammer) within the last two years. Moreover, when comparing the twoyear average maximum count for 2023-24 to the initial 2015-16 76 | GWCT RESEARCH REPORT • 2024
figures, for seven of the nine farmland specialist species, we have recorded higher counts in the last two years (see Table1). Comparing counts from 2024 to those in 2015, we recorded higher counts in a single round for 12 of the 16 FBI species, no difference for three species, with only one species, whitethroat, having a lower count in 2024 (none recorded in 2024 compared to two in 2015). Overall, this is very encouraging and indicates a positive picture for how our management has affected our breeding farmland birds. The measures we have implemented since taking on Auchnerran, such as planting hedgerows and providing supplementary overwinter feeding, are known to provide nesting and overwinter habitats for farmland birds. Additionally, other conservation-conscious management practices we have instigated, such as delayed topping (which we began in 2017) designed to help breeding waders, should have also benefited other ground-nesting species. This includes skylarks, for which we have been recording increasing counts since 2015-16 (see Table 1). Comparing our results to those from the UK-wide trends for the 16 FBI species, across the country the population trends of just two species (jackdaw and skylark) have increased over a similar timeframe (2017-2022).
© Olivia Stubbington, Max Wright
Based on the British Trust for Ornithology-led Breeding Bird Survey (BBS) monitoring across the UK, the Farmland Bird Index (FBI) is 61% below its 1970 value, with pronounced declines in farmland specialists. Although declines have slowed since the late 1980s, over the short-term (2017-2022) there has still been a 9% decline in the UK’s FBI. Since the GWCT began managing Auchnerran in 2015, we have undertaken BBS counts across the whole farm, three times each year during spring-summer. Here we compare our results with the situation across the UK. We will continue to conduct BBS each year to monitor the long-term population trends of breeding birds at Auchnerran so we can better understand the impact our management has on these birds.
SPECIES RECOVERY |
TABLE 1 FARMLAND BIRD INDEX SPECIES The average maximum count of the 16 farmland bird index species present at Auchnerran, at two-year intervals from 2015-2024, compared with the UK-wide annual short-term (2017-2022) percentage change of the same species (from BTO Breeding Bird Survey, BBS) Maximum 2017-2018 (average)
Maximum 2019-2020 (average)
Maximum 2021-2022 (average)
Maximum 2023-2024 (average)
UK annual percentage change short term (2017 to 2022)
0.0 80.5 1.5 5.0 25.0 130.0 0.0
1.0 125.0 2.5 5.5 63.5 291.0 0.0
2.5 74.0 0.5 1.5 58.5 133.5 0.5
2.0 61.0 1.0 3.0 30.0 113.0 0.0
6.5 78.0 1.0 2.0 48.0 85.0 0.0
-4.32 0.73 -1.94 -1.34 -0.13 -0.14 -1.27
6.0 76.5 4.0 2.0 64.5 0.0 0.0 1.0 6.0
11.5 142.0 29.0 2.0 403.5 0.0 0.0 0.0 7.5
8.5 101.5 10.5 12.0 45.0 0.0 0.0 0.5 9.0
4.5 67.0 75.0 22.5 150.5 0.0 0.5 0.0 6.0
23.5 75.0 27.0 38.5 309.0 4.0 13.5 0.0 8.5
0.34 -3.07 -1.00 1.70 -1.04 3.42 -5.65 -0.46 -2.39
Maximum 2015-2016 (average) Generalist farmland species: Greenfinch Jackdaw Kestrel Reed bunting Rook Woodpigeon Yellow wagtail Specialist farmland species Goldfinch Lapwing Linnet Skylark Starling Stock dove Tree sparrow Whitethroat Yellowhammer
UK Conservation status. Species are assessed and placed onto one of three lists, red, amber or green, according to their level of conservation concern.
These results indicate that we are looking after our breeding farmland birds well. There are large fluctuations in our breeding bird counts from one year to the next. This reflects counts of flocking species such as starling, jackdaw, and woodpigeon, which may not be recorded every year in such high numbers. For example, 2023 saw our largest ever count of starlings in a single survey period (566 individuals) but for other species the numbers recorded in 2023 were very similar to those recorded in 2024.
These survey results highlight the importance of long-term monitoring, with 10 years of our BBS counts now allowing us to better understand trends in breeding birds at Auchnerran. This enables us to put into context our ongoing research into management strategies likely to benefit a broad suite of farmland bird species, such as overwinter supplementary feeding, the effects of alternative leys, or different grazing regimes.
KEY FINDINGS We recorded a total of 51 breeding bird species in 2024, and have recorded a total of 82 species since 2015, of which 21 are now red-listed in the UK. We recorded higher counts for 12 of the 16 species included in the UK-wide Farmland Bird Index (FBI) in 2024 compared with 2015. Across the UK, only four of these species have increased over a similar time frame (2017-2022). Since taking on the tenancy we have undertaken a variety of different management interventions to better support our bird life, such as increasing hedgerow cover and supplementary overwinter feeding, which is reflected in our healthy BBS results for the farmland index species. Max Wright gwct.org.uk/auchnerran
GWCT RESEARCH REPORT • 2024 | 77
| BLACK GROUSE
Female black grouse fitted with radio transmitter prior to release.
Black grouse range expansion Black grouse were once widespread in England but have declined over the past 150 years, largely owing to habitat changes, and are now restricted to the North Pennines. Here, numbers remain broadly stable, fluctuating between 1-2,000 displaying males over the last 25 years. To safeguard black grouse, we need to increase both numbers and occupied range. This will ensure that the population is large enough to withstand environmental events, which may become more frequent with a changing climate.
Brood foraging In northern England, black grouse recovery is limited by low breeding productivity. Chicks hatch in June and require a plentiful supply of sawfly larvae in the first two to three weeks after hatching to grow fast and survive. Chick survival appears to be driven by both the abundance of preferred insects and weather conditions when chicks hatch. To inform management prescriptions we need to better understand where broods forage, how livestock grazing influences sward composition and structure, and how this in turn influences sawfly larvae. To investigate this, we embarked on a pilot study to assess whether we could use GPS tags to explore brood habitat use. In spring 2024, seven females were caught at night and fitted with Ornitela GPS-GSM solar-powered tags under licence from the British Trust for Ornithology. These tags allowed us to track the bird’s movements with minimal disturbance. Once chicks hatched, we visited chick-feeding locations the day after feeding to sample insect abundance by sweep netting, record habitat measures, and collect chick roost droppings to quantify chick diet and survival. Five tagged females nested, with three nests hatching, but all lost their broods, two within the first week. The third retained her chicks for 27 days during which they foraged over 0.98km2 78 | GWCT RESEARCH REPORT • 2024
(see Figure 1). This foraging range was large in relation to previous studies and, combined with the low sawfly abundance we recorded, suggested that food availability for chicks was low. Poor breeding productivity was mirrored in wider brood counts using pointing dogs, where only 22% of females had chicks, with an overall average of 0.4 young per female. In summary the GPS tags provided good data on brood habitat use and we plan to continue this study.
Male ringed prior to release.
ACKNOWLEDGEMENTS
We would like to thank all the help from landowners and gamekeepers at donor and receptor sites who make this project possible. We would also like to thank the financial support from Natural England’s Species Recovery Programme Capital Grant Scheme, contributors to the GWCT black grouse appeal, and the BASC Wildlife Fund for supporting this project moving forward.
© Holly Appleby
T
he Black Grouse Range Expansion Project is a two-year project funded by Natural England’s Species Recovery Programme Capital Grant Scheme. This project aims to help safeguard against any potential negative impacts of a changing climate by supporting measures to help increase breeding success, and through expanding the current range of black grouse into the North York Moors.
SPECIES RECOVERY |
Figure 1 Brood foraging movements of a GPS-tagged female between hatching a clutch of eggs and brood loss at 27 days
Range expansion to the North York Moors The second phase of the project involves re-establishing black grouse into the North York Moors. These more easterly, lowaltitude sites have markedly lower rainfall than the wetter, highaltitude sites in the North Pennines. Here suitable connected habitats on the fringes of grouse moors, where gamekeepers undertake predator control, have the potential to support a network of connected lekking groups. The nearest black grouse are currently 30-40km away in the Pennines, separated by an effective barrier of lowland grassland-cereal farmland. Longdistance dispersal by females between the two areas has been reported in recent years. However, it is infrequent and appears restricted by the distance between these two areas, with females typically dispersing on average 9km up to a maximum 30km, compared with males, which only move short distances. Thus, we aim to re-establish black grouse in the North York Moors, by
translocating birds (males and females) from donor moors in the North Pennines, where we have identified harvestable surpluses. To develop the project, we followed Natural England’s guidelines on re-introductions and conservation translocations, completing a habitat suitability assessment and identifying release areas and donor moors. We successfully applied for a Natural England conservation translocation licence and in November 2024 we caught 20 birds (10 males and 10 females) at night, transported them to the release site and released them the same night. Released birds were equipped with radio transmitters to allow us to follow settlement patterns, survival, and lekking and breeding behaviour. We will evaluate the survival rates and settlement patterns of translocated birds prior to confirming any further releases. Further releases may be needed to either reinforce the initial one, or to establish birds at a second recipient site to help create a network of inter-connected lekking groups.
KEY FINDINGS GPS-tagged female black grouse have provided us with new, useful information on brood foraging behaviour. Low chick survival was related to low insect abundance. Twenty black grouse (10 males and 10 females) were translocated in November 2024 (under Natural England licence) from the North Pennines to the North York Moors. Phil Warren & Holly Appleby gwct.org.uk/blackgrouse
GWCT RESEARCH REPORT • 2024 | 79
| CAPERCAILLIE
The Scottish capercaillie population has declined by around 50% over a period of six to 10 years and is at its lowest level since the start of national monitoring in 1992-1994.
Capercaillie population in Scotland Capercaillie were successfully reintroduced to Scotland in the 1830s, with numbers thought to be about 20,000 in the 1970s. Since then, numbers have been declining due to a range of factors including habitat fragmentation, predation pressure, fence strikes, disturbance, and weather.
80 | GWCT RESEARCH REPORT • 2024
This study showed that declines were greater for females than for males, and 80% of the population is now concentrated in the Badenoch and Strathspey area of Scotland (Wilkinson et al. 2024). Although these two studies used different methods and differ in their estimated number of individual capercaillie, the population size estimated from the lek and brood survey data does fall within the 95% confidence interval of the national winter survey. Both studies agree that the Scottish population has declined by around 50% over a period of six to 10 years and is at its lowest level
ACKNOWLEDGEMENTS
Carrbridge Capercaillie Group within the Cairngorm Capercaillie Project funded the GWCT population assessment. All fieldwork is only possible with the support of local land managers.
© Laurie Campbell
D
espite decades of intensive conservation efforts from a wide range of stakeholders, the capercaillie population in Scotland continues to decline. The GWCT, working with land managers and other organisations across the capercaillie’s Scottish range, have been studying and monitoring capercaillie for many years. Biannual data collected between 2010 and 2020 have been used to estimate recent population trends. This has included counts of male birds at 151 known lekking sites in the spring and pointing dog surveys of adult and young birds at 45 study sites in August. Combining these counts with published survival estimates, we estimated that there were just 304 (95% CL: 239-369) capercaillie left in 2020 compared with an estimated 580 birds (95% CL: 462-698) in 2011 (Baines and Aebischer, 2023). Based on winter line-transect surveys, the most recent national winter survey conducted in 2021-2022 (led by the RSPB), estimated 532 individuals (95% CI: 227-810), down 52% from the estimate produced by the same survey method in 2015-2016.
SPECIES RECOVERY |
since the start of national monitoring in 1992-1994. Worryingly, the likelihood of extinction in Scotland for a second time seems inevitable without a step-change in conservation action.
Future monitoring of capercaillie productivity It is essential to monitor how capercaillie numbers and productivity change in response to proposed management actions, and to assess the effectiveness of the recently launched Capercaillie Emergency Plan (see box). Traditionally, teams of pointing dogs have been used to survey forests for capercaillie. However, due to concerns over the possible effect disturbance by dogs might cause, this method has fallen out of favour on some landholdings. Instead, these landholdings have switched to using non-intrusive camera traps to monitor capercaillie productivity. Camera traps certainly offer some advantages over the use of pointing dogs but will certainly give slightly different results. To assess the long-term change in numbers it is imperative that the survey results from camera traps are rigorously compared to results from surveying using pointing dogs. In late summer 2024, the GWCT started a project to compare these two methods in three capercaillie forests. With the small number of birds present in these areas it will take another two to three years of data collection to enable a robust comparison.
Capercaillie used to be surveyed using pointing dogs but some landholdings have switched to using non-intrusive camera traps (below).
THE CAPERCAILLIE EMERGENCY PLAN
The scope of the Capercaillie Emergency Plan, published by the Cairngorms National Park and NatureScot in September 2024, focuses on: Landscape scale restoration of pinewood habitat for long-term capercaillie recovery. Costed management measures based on NatureScot SAC sub-group recommendations. Fundraising to explore a range of mechanisms for capercaillie conservation funding. A pine marten study. The Emergency Plan budget of £12.9m allocates 90% to expanding and improving habitat, 3.8% to fence removal, and just 3.3% to reducing the impact of predation. Of the £422k allocated to predation work, over half is for diversionary feeding, £97k to monitoring vole populations, £60k to monitoring pine marten populations, with a mere £5k to assess efficiency of fox and predator control. The Review of Capercaillie Conservation and Management, published by NatureScot’s Scientific Advisory Committee (SAC) sub-group in February 2022, was clear that the options likely to have the greatest immediate positive impact on the population in its core stronghold were: 1. Predator control. 2. Diversionary feeding of predators. 3. Creation of refuges through permanent or seasonal closure of paths and tracks. 4. Fence marking/removal. The SAC group recognised that, given the current rate of capercaillie decline, there is a need for action that will achieve immediate results. The massive bias of Emergency Plan funding towards long-term habitat restoration runs counter to the recommendations made by NatureScot’s SAC sub-group to get to grips with predation impacts.
KEY FINDINGS The most recent capercaillie population estimates suggest 304-532 individuals, with 80% of those in the Badenoch and Strathspey area of Scotland. The Capercaillie Emergency Plan 2025-2030, led by Cairngorm National Park and NatureScot, has consulted a range of stakeholders to promote management opportunities that are expected to increase the numbers of capercaillie in Scotland. Many landholdings no longer monitor productivity using surveys with pointing dogs and are instead using trail cameras. It is vital that these two methods are compared to allow the impact of management to be assessed in future. Kathy Fletcher, Ross Macleod & Louise de Raad gwct.org.uk/capercaillie
GWCT RESEARCH REPORT • 2024 | 81
© Laurie Campbell
SECTION 5 GWCT SCIENCE
82 | GWCT RESEARCH REPORT • 2024
GWCT science 84
Scientific publications
86
Research projects
90
External committees
92
GWCT staff
94
Financial report
98
Council and county chairmen
GWCT monitoring, on the water meadows of the Avon valley, has demonstrated how lapwing declines can be reversed by the actions of committed landowners, farmers and gamekeepers, though declines on arable farmland remain a challenge
gwct.org.uk
GWCT RESEARCH REPORT • 2024 | 83
Aebischer, NJ (2024) Numbers, densities and distribution of mallards released for shooting in the UK over the last 20 years. European Journal of Wildlife Research. 70 (76): 1-8.
McHugh, NM, Ness, ER & Begg, G (2024) Identification of arable farmland bird indicator species. ‘Landscape Management for Functional Biodiversity’ IOBC-WPRS Bulletin. 170: 48-50.
Berthon, K, Jaworski, CC, Beacham, JD, Krzywoszynska, A, Jackson, P, Leake, JR, McHugh, NM, Capstick, L, Daniell, T, Cameron, D, Holland, J, Hartley, S, Desneux, N, Jowett, K, The H3 Farmers Consortium, Zhao, Y, Watt, PJ & Dicks, LV (2024) Measuring the transition to regenerative agriculture in the UK with a co-designed experiment: design, methods and expected outcomes. Environment Research Food Systems. (025007): 1-22.
Meister, FJ (2024) The history of the name ‘lagopus’ used in avian nomenclature. Archives of Natural History. 51: 370-385.
Coulon, N, Elliott, SAM, Teichert, N, Auber, A, McLean, M, Barreau, T, Feunteun, E & Carpentier, A (2024) Northeast Atlantic elasmobranch community on the move: Functional reorganisation in response to climate change. Global Change Biology. 30 (e17157): 1-15. Elliott, SAM, Dubost, G, Rivot, E, Acou, A, Toison, V, Réveillac, E & Beaulaton, L (2024) Accurately predicting rare and poorly detectable species habitat for spatial protection. Journal of Applied Ecology. 61: 1673-1690. Ewald, JA, Potts, GR, Aebischer, NJ, Moreby, SJ, Wheatley, CJ & Burrell, RA (2024) Fifty years of monitoring changes in the abundance of invertebrates in the cereal ecosystem of the Sussex Downs, England. Insect Conservation and Diversity. 17: 758-787. Fielding, D, Newey, S, Pakeman, RJ, Miller, D, Gagkas, Z, Matthews, K & Smith, SW (2024) Limited spatial co-occurrence of wildfire and prescribed burning on moorlands in Scotland. Biological Conservation. 296 (110700): 1-8. Heward, CJ, Conway, GJ, Hoodless, AN, Norfolk, D & Aebischer, NJ (2024) Population and distribution change of Eurasian woodcocks (Scolopax rusticola) breeding in the UK: results of the 2023 Breeding Woodcock Survey. Bird Study. 71: 109-123.
Mountain hare. © Laurie Campbell
King, RA, Ellis, CD, Bekkevold, D, Ensing, D, Lecointre, T, Osmond, DR, Piper, A, Roberts, D, Launey, S & Stevens, JR (2024) Leveraging the genetic diversity of trout in the rivers of the southern British Isles and northern France to understand the movements of sea trout (Salmo trutta) around the English Channel. Evolutionary Applications. 17 (e13759): 1-15.
84 | GWCT RESEARCH REPORT • 2024
Moreno, A, Heward, CJ & Sánchez-García, C (2024) Opportunistic camera trapping reveals the predators of a Eurasian woodcock nest in northern Spain. Wader Study. 131: 62-65. Needham, RJ (2024) The impacts of reintroduced Eurasian beaver dams on brown trout (Salmo trutta) in upland areas of Great Britain. Unpublished PhD Thesis, University of Southampton. Newey, S, Hubbard, C, Gibbs, S, McLeod, J, Smith, A & Ewald, J (2024) The distribution of mountain hares and the possible effects of woodland expansion using the Cairngorm National Park as a case study. European Journal of Wildlife Research. 70 (72): 1-13. Osmond, DR (2024) Adapting to life in metal polluted rivers: implications for conservation, genetic diversity and fisheries management in the brown trout (Salmo trutta). Unpublished PhD Thesis, University of Exeter. Osmond, DR, King, RA, Russo, IRM, Bruford, MW & Stevens, JR (2024) Living in a post-industrial landscape: repeated patterns of genetic divergence in brown trout (Salmo trutta) across the British Isles. Diversity and Distributions. 30 (e13854): 1-19.
SCIENTIFIC PUBLICATIONS 2024 |
Porteus, TA, Short, MJ, Hoodless, A & Reynolds, JC (2024) Movement ecology and minimum density estimates of red foxes in wet grassland habitats used by breeding wading birds. European Journal of Wildlife Research. 70 (8): 1-18. Sage, RB, Woodburn, MIA, McCready, S & Coomes, JR (2024) Winter game crop plots for gamebirds retain hedgerow breeding songbirds in an improved grassland landscape. Wildlife Biology. 2024 (e01156): 1-12.
Solé, M, Brendel, S, Aldrich, A, Dauber, J, Devictor, V, Duquesne, S, Ewald, J, Gottschalk, E, Hoffmann,J, Kuemmerlen, M, Leake, A, Matezki, S, Meyer, S, Natal-da-Luz, T, Pieper, S, Piselli, D, Rigal, S, Ross-Nickoll, M, Schäffer, A, Settele, J, Sigmund, G, Sotherton, N, Wogram, J & Messner, D (2024) Assessing in-field pesticide effects under European regulation and its implications for biodiversity: a workshop report. Environmental Sciences Europe. 63 (153): 1-15. Stakenas, S, Gregory, SD, Britton, JR, Marsh, JE, Tarkan, AS, Zieba, G, Welsey, KJ & Copp, GH (2024) Tracking the invasive and euryhaline pikeperch (Sanderl ucioperca) in the lower River Thames using acoustic telemetry indicates no movements into areas of relatively high salinity. Journal of Fish Biology. 105: 1200-1211. Stanbury, AJ, Burns, F, Aebischer, NJ, Baker, H, Balmer, DE, Brown, AF, Dunn, TE, Lindley, P, Murphy, M, Noble, DG, Owens, R & Quinn, LR (2024) The status of the UK’s breeding seabirds: an addendum to the fifth Birds of Conservation Concern in the United Kingdom, Channel Islands and Isle of Man and second IUCN Red List assessment of extinction risk for Great Britain. British Birds. 117: 471-487. Valette, M, Newey, S, Schreckenberg, K & Dawson, TP (2024) Woodland expansion and upland management strategy dilemmas for biodiversity and carbon storage in the Cairngorms National Park. Frontiers in Environmental Science. 12 (1411659): 1-13. White, PJC, Stoate, C, Aebischer, NJ, Szczur, J, Ferrer, L & Norris, K (2024) Choice of model and re-nesting probability function influences behaviour of avian seasonal productivity models and their demographic predictions. Ibis. 166: 353-755. Williams, NF, Short, M, Andreou, D, Porteus, TA, Stillman, RA, Hoodless, A & Hardouin, EA (2024) Ancestry and genetic differentiation of red foxes (Vulpes vulpes) on the Isle of Wight. Mammal Communications. 10: 8-14. Wright, MA (2024) A lapwing clutch of five eggs. Scottish Birds. 44: 234-235. Zimova, M, Newey, S, Denny, B, Pedersen, S, & Mills, LS (2024) Scottish mountain hares do not respond behaviourally to camouflage mismatch. Oikos. 2024 (e10834): 1-6.
GWCT current and past staff in bold
gwct.org.uk/research
GWCT RESEARCH REPORT • 2024 | 85
WETLAND RESEARCH
Project title
Description
GWCT/BTO Breeding Woodcock Survey and annual monitoring
Largescale assessment of UK’s resident Chris Heward, Andrew Hoodless, woodcock population and annual assessments collaboration with BTO of change
Funding source
Date
Shooting Times Woodcock Club, BASC, private donors, John Swire 1989 Charitable Trust
2003- ongoing
Avon Valley Farmer Cluster Farmer-led habitat restoration and wader recovery Lizzie Grayshon in the Avon Valley
NE Facilitation Fund, core funds
2020-2026
Breeding redshank in the Avon Valley
Examining habitat use and breeding success of Lizzie Grayshon, Clive Bealey redshank in the Avon Valley using GPS tracking and colour-ringing
Hampshire Ornithological Society, core funds
2021-2024
Year-round habitat use of British breeding curlew
Assessing breeding success, broadscale winter habitat use and migration strategy of curlew using GPS-GSM tags
Headstarting curlew in southern England (see p62)
Assessing the viability of headstarting as a method Andrew Hoodless, Chris Heward of establishing breeding curlew populations
Norfolk Estate, Cranborne Estate, Elmley Estate
2022-2027
Lapwings on fallow plots (see p60)
Monitoring and improving lapwing breeding success on arable fallow plots
Lizzie Grayshon, Bleddyn Thomas, Chris Heward, Andrew Hoodless
Natural England’s Species Recovery Programme (SRP)
2023-2025
New Forest Farming in Protected Landscapes collaboration
Assisting farmers in applying for FiPL grants to achieve conservation goals
Lizzie Grayshon
New Forest National Park Authority 2023-2025
PhD: Woodcock in Ireland
Breeding woodcock distribution and habitat relationships. Effect of shooting on winter woodcock behaviour and mortality rate
James O’Neill. Supervisors: Andrew Hoodless, Irish Research Council, NARGC, Prof John Quinn (UCC) NPWS, core funds
2019-2024
Elli Rivers. Supervisors: Andrew Hoodless, Hampshire Ornithological Mike Short, Prof Richard Stillman & Society, Forestry England, Dr Kathy Hodder (BU), Andy Page (FE) private donors
2020-2024
PhD: Landscapes for curlews Monitoring breeding success and use of GPS tracking (see p66) to determine foraging areas of adult curlews and brood ranges PhD: Lapwings and avian predators
Staff
Chris Heward, Andrew Hoodless, Abbeystead Estate, private donors Aisha Bruendl, collaboration with David Scott
Quantifying lapwing chick survival in arable habitats Ryan Burrell. Supervisors: Andrew Hoodless, Core funds and the effects of disturbance by corvids and raptors Prof Richard Stillman & Dr Kathy Hodder (BU)
2022-2024
2020-2025
© Laurie Campbell
UPLANDS RESEARCH
Project title
Description
Grouse count scheme (see p32)
Annual grouse and parasitic worm counts in relation David Baines, Philip Warren, Core funds to moorland management indices and biodiversity Kathy Fletcher, Nick Hesford, Felix Meister
Staff
Funding source
Date 1980- ongoing
Black grouse monitoring Annual lek counts and brood counts
Philip Warren, David Baines, Kathy Fletcher
Core funds, Natural England
1989- ongoing
Heather burning on peatland Vegetation and hydrological responses to burning on peatland
Leah Cloonan, Sian Whitehead
Core funds
2018-2027
Long-term heather management experiments on blanket peat
Are burning and cutting useful management tools for blanket bog restoration? Does the structure and composition of pre-burn vegetation influence post-burn vegetation recovery?
Leah Cloonan, Holly Appleby Sian Whitehead
Core funds
2019-2028
Long-term heather cutting experiments
Vegetation recovery and brash decomposition rates Leah Cloonan, Sian Whitehead following heather cutting at different heights and over different peat depths
Core funds
2021-2030
Recovery of heather postbeetle outbreak
Experimental cutting and burning to aid heather recovery after heather beetle attacks
Leah Cloonan, Sian Whitehead
Gunnerside Estate
2021-2030
Upland Review
A review of the biodiversity impacts of upland management in the UK
Felix Meister, Scott Newey, Louise de Raad, Andrew Hoodless
Core funds, private donors
2022-2024
Mountain hare and tick
The relationship between mountain hare abundance and the number of ticks on red grouse and wader chicks
Scott Newey, Kathy Fletcher
Private donors, Core funds
2022-2025
Fires in the uplands
Future impact of prescribed fires and woodland restoration on biodiversity and carbon stocks in the Cairngorms National Park
Michel Valette (Imperial College London), Scott Newey, Kate Schrenberg and Terry Dawson (Kings College London)
Leverhulme Trust (Grant No. RC-2018-023), Core funds
2023-2024
Black Grouse Range Expansion (see p78)
Translocation of black grouse from North Pennines Philip Warren, Holly Appleby, to North York Moors. Exploration of factors David Baines influencing chick survival
Natural England Species Recovery Programme
2023-2025
86 | GWCT RESEARCH REPORT • 2024
PARTRIDGE AND BIOMETRICS RESEARCH
Project title
Description
Staff
Funding source
Date
Partridge Count Scheme Nationwide monitoring of grey and red-legged (see p26) partridge abundance and breeding success
Neville Kingdon, Julie Ewald, Nicholas Core funds, GCUSA Aebischer, Sabeeth Shoeb, Lucy Costick, Eleanor Humphryes, Sophie Jackson, Phoebe James, Arthur Prince, Amin Alhawary, Matt Cooper, Ferne Ellington
1933- ongoing
National Gamebag Census Monitoring game and predator numbers with (see p36) annual bag records
Julie Ewald, Corinne Duggins, Ashlee Rossiter, Core funds Nicholas Aebischer, Cameron Hubbard, Amin Alhawary, Matt Cooper, Ferne Ellington, Phoebe James
1961- ongoing
Sussex Study
Long-term monitoring of partridges, weeds, invertebrates, pesticides and land use on the South Downs in Sussex
Julie Ewald, Nicholas Aebischer, Steve Core funds Moreby, Cameron Hubbard, Amin Alhawary, Matt Cooper, Ferne Ellington
1968- ongoing
Grey partridge management
Researching and demonstrating grey partridge management at Whitburgh Farms
Hugo Straker, Fiona Torrance, Alistair Green
2011- ongoing
Cluster Farm mapping
Generating cluster-scale landscape maps for use by the Advisory Service and the Farmer Clusters The PepsiCo FAB (Farming Arable Biodiversity) project (see p56)
Whitburgh Farms, Core funds
Julie Ewald, Neville Kingdon, Cameron Core funds Hubbard, Matt Cooper, Ferne Ellington, Eleanor Humphryes, Sophie Jackson, Phoebe James
Demonstrates how arable farming can support the Louise de Raad, Fiona Torrance, Alistair environment by implementing measures to improve Green Ross MacLeod, Lara Auld, Isabella the quality of available semi-natural habitats to benefit Allan, Rachael Hustler, Georgie Gargett biodiversity and by adjusting agricultural practices to increase cost-effective, nature-friendly productivity
2014- ongoing
PepsiCo PAO fund, Core funds, Scottish Agronomy, Balgonie Estates Ltd, Kingdom Farming, NatureScot
2022-2025
Core funds
2023 - ongoing
Automate reporting and Automate app-collected practitioner data collation image recognition and image recognition from field cameras
Sabeeth Shoeb, Cameron Hubbard, Leyla Hunn, Marlies Nicolai, Elli Rivers, Robert Turner, Amin Alhawary, Lucy Costick, Arthur Prince, Phoebe James, Nick Hesford, Mike Short, Julie Ewald
South Downs Farmland Birds Initiative
Analyse trends in farmland bird data collected under the South Downs Farmland Bird Initiative
Julie Ewald, Leyla Hunn, Eleanor Humphryes, South Downs National Park Sophie Jackson, Phoebe James
2024
Test & Trial GWCT407 (see p42)
The Environmental Farmers Group (EFG) – Upscaling farmers’ environmental ambitions to help achieve Defra’s environmental targets
Francis Buner, Teresa Dent, Digby Sowerby, Defra Rachel Ridd
2024
Helen Waters. Supervisors: Julie Ewald, NERC/GWCT Dr Alfred Gathorne-Hardy (University of Edinburgh), Dr Barbara Smith (Coventry University)
2019- ongoing
Date
PhD: Biodiversity footprint Creating an index of crop-farming traits to assess of foods the biodiversity footprint of foods
FARMLAND RESEARCH
Project title
Description
Staff
Chick-food and farming systems
A comparison of grey partridge chick-food in conventional and organically farmed crops and habitats
Steve Moreby, Niamh McHugh, Jayna Private funds Connelly, Madeleine Baker, Imogen Vowles, Emily Aitken
2015- ongoing
Long-term monitoring
Monitoring of wildlife on BASF demonstration farms
Lucy Capstick, Niamh McHugh, Jayna Connelly, Madeleine Baker, Madeline Kettlewell, Imogen Vowles, Emily Aitken
BASF
2017- ongoing
Chick-food invertebrate levels Chick-food invertebrate levels in crops and non-crop habitats on three estates
Niamh McHugh, Steve Moreby, Jayna Connelly, Madeleine Baker, Madeline Kettlewell, Imogen Vowles, Emily Aitken
Private funds
2017- ongoing
FRAMEwork (see p46)
Evaluation and development of Farmer Cluster approach across Europe
Niamh McHugh, Rachel Nichols, Ellie Ness, EU Horizon 2020 Jayna Connelly, Madeleine Baker, Madeline Kettlewell
2020-2025
Farmland birds and farming systems
Niamh McHugh, Ellie Ness
2020- ongoing
Comparison of farmland bird abundance relative to conventional and organically farmed crops and agri-environment habitats
H3 Healthy soils, healthy food, Ecological evaluation of Regenerative Agriculture healthy people
Funding source
Private funds
Niamh McHugh, Lucy Capstick, Ellie Ness, UKRI (Subcontract) Jayna Connelly, Imogen Vowles, Emily Aitken Cambridge University
2021-2025
Use of green finance by Farmer groups
Explores the potential of Regional Farm and Rural Niamh McHugh, Lucy Capstick Support Groups to stimulate Green Finance Markets
Natural England
2023-2024
Badgers and pollinators
Understanding relationships between badger and red-tailed bumblebee densities on farmland
Lucy Capstick, Niamh McHugh, Madeline Baker
NFU
2024
PhD: Effects of farm management practices
Exploring the synergies and trade-offs of farm management practices on environmental health and human wellbeing
Samantha Bishop. Supervisors: Niamh McHugh, Dr Mark Lee (Royal Holloway University Of London)
Royal Holloway
2023-2027
gwct.org.uk
GWCT RESEARCH REPORT • 2024 | 87
ALLERTON PROJECT RESEARCH
Project title
Description
Staff
Funding source
Date
Monitoring wildlife at Loddington (see p74)
Annual monitoring of game species, songbirds, invertebrates, plants and habitat
Chris Stoate, John Szczur, Alastair Leake, Steve Moreby, John Holland
Allerton Project funds
1992- ongoing
Effect of game management at Loddington
Effect of ceasing predator control and winter feeding Chris Stoate, Alastair Leake, on nesting success and breeding numbers of songbirds John Szczur
Allerton Project funds
2001- ongoing
Water Friendly Farming
A landscape-scale experiment testing integration Chris Stoate, John Szczur, Jeremy Biggs, EA, Regional Flood and of resource protection and flood risk management Penny Williams, (Freshwater Habitats Trust), Coastal Committee with farming in the upper Welland Prof Colin Brown (Uni’ of York)
2011-2027
Soil monitoring (see p52)
Survey of soil biological, physical and chemical properties
Chris Stoate, Jenny Bussell, Alastair Leake, Gemma Fox
Allerton Project
2014- ongoing
Conservation & Regenerative Economic and environmental impacts of three Agriculture contrasting crop production approaches
Alastair Leake, Joe Stanley, Jenny Bussell, Gemma Fox, John Szczur, Oliver Carrick
Syngenta
2017- ongoing
Kellogg’s Origins
Helping Kellogg’s cereal growers reduce their environmental and climate impact
Alastair Leake, Alice Mead
Kellogg’s
2017-ongoing
Agroforestry
Optimising tree densities to meet multiple objectives in grazed pasture
Chris Stoate, Jenny Bussell, Gemma Fox, Alastair Leake, John Szczur, Joe Stanley
Woodland Trust
2018- ongoing
Farming with Nature
Promoting sustainable farming practice & Integrated Pest Management
Saya Harvey, Jemma Clifford, Alice Mead
Marks & Spencer
2019- ongoing
Biochar Demonstrator
Working with the University of Nottingham to assess impact of biochar application to arable land
Jenny Bussell, Gemma Fox, Olly Carrick, Joe Stanley, Chris Stoate
UKRI
2022-ongoing
Eye Brook Farmer Cluster
Identifying synergies between environmental and farm business objectives at the landscape scale
Chris Stoate, Joe Stanley, Olly Carrick
RPA
2022-2025
Climate Neutral Farms (ClieNFarms)
Working with Nestlé UK to help wheat farmers Alastair Leake, Joe Stanley, Alice move toward carbon neutrality in the east of England Mead, Amie Pickering
EU Horizon 2020
2022-2025
Biostimulant trials
Working with Nestlé UK and FERA to trial a variety of novel biostimulants on arable crops
Jenny Bussell, Gemma Fox, Olly Carrick, Joe Stanley
Nestlé UK
2023-ongoing
Landscape use by bats Landscape use by bats in Leighfield Forest
Chris Stoate, Niamh McHugh, Nathalie Cossa, Andy Neilson, LRWT
Natural England
2023-2024
Landscape scale bumblebee conservation
Spatial modelling of landuse change to deliver 10% nature recovery of bumblebees
Chris Stoate, Max Rayner
Natural England
2023-2024
Brown trout in the Eye Brook
Survey of brown trout in the Eye Brook, and farmer Chris Stoate, Will Beaumont, Luke engagement to reduce agricultural impacts Scott, John Szczur
Natural England
2023-2024
Nitrogen Climate Smart (NCS) Farming
Working with PGRO to increase the area of the UK pulse crop and reduce climate impact of UK arable rotation
Defra
2023-2026
Cover crops
Investigating both the nitrogen capturing and the Jenny Bussell, Gemma Fox environmental benefits of using summer cover crops
Lens (Nestle), Anglian Water
2024
Decarbonising Agriculture
Testing the environmental benefits of using chemical Jenny Bussell, Alice Mead, Gemma Fox N fixation technology (R-leaf) to reduce the need for inorganic fertiliser and reduce the N2O in the air
Defra (Innovate)
2024-2026
Jenny Bussell, Olly Carrick, Gemma Fox, Chris Stoate, Joe Stanley
PREDATION RESEARCH
Project title
Description
Fox GPS-tracking in the Avon Valley
Analysis of GPS tracking data and DNA evidence Mike Short, Tom Porteus, to determine resident density, activity patterns and Jodie Case, Andrew Hoodless habitat use of foxes in the Avon Valley, in the context of declining wading bird populations
How effective is predator control Collection and analysis of predator culling records for wading bird conservation? from multiple sites managed for breeding waders
Staff
Mike Short, Jodie Case, Elli Rivers, Nathan Williams, Tom Porteus
Funding source
Date
Core funds, private funds
2015-2025
Core funds, private funds
2021- ongoing
Diet of foxes in the Avon Valley and New Forest
Macro and molecular analysis of stomach and faecal Mike Short, Jodie Case, Rosa Hicks, material to determine main dietary components Nathan Williams supporting foxes in areas where wading birds breed
Core funds, The Kilroot Foundation, 2021-2024 Exeter University
Non-lethal nest protection for wading birds
Design and evaluation of novel nest protection Mike Short measures for wading birds of conservation concern
Core funds, Natural England, private funds
2022- ongoing
Natural England Species Recovery Programme
2023-2025
Core funds, GCUSA, private funds
2023-2026
The Gravelly Shores Project Creation of shingle habitat for coastal shorebirds breeding in the Solent, and evaluation of novel non-lethal predation management measures Curlew chick survival in the New Forest
Mike Short, Elli Rivers, Matthew Cooper, Ben Stephens
Radio-tracking curlew chicks to determine survival Elli Rivers, Jodie Case, Rosa Hicks, outcomes and causes of mortality Mike Short
PhD: Why are there so many foxes? (see p68)
How the large-scale spatial population dynamics of Nathan Williams Supervisors: Mike Short, Core funds, private funds the red fox, may determine the local fate of wading Tom Porteus, Andrew Hoodless, Dr Emilie NERC birds breeding in the Avon Valley and New Forest Hardouin, Dr Demetra Andreou & Prof Richard Stillman (BU)
88 | GWCT RESEARCH REPORT • 2024
2021-2024
AUCHNERRAN PROJECT RESEARCH
Project title
Description
Staff
Funding source
Date
Rabbit population monitoring
Assessing rabbit numbers in relation to control methods
Max Wright, Panagiotis Nikolaou, Adam Watts, Kate Goodman, Seth Howell
Core funds
2016- ongoing
Wader population monitoring
Surveying of wader numbers, distribution and prod- Max Wright, Panagiotis Nikolaou, uctivity in relation to farm management practices Adam Watts
Core funds, Working for Waders
2017- ongoing
Core farm monitoring (see p76)
Assessing population trends of farmland birds, raptor nesting and breeding success, surveying corvid numbers and distribution, assessing gamebird and hare numbers
Max Wright, Panagiotis Nikolaou, Adam Watts, Kate Goodman, Seth Howell
Core funds
2017- ongoing
Woodcock surveys
Assessing woodcock resident and migratory population trends
Max Wright, Panagiotis Nikolaou, Adam Watts
Core funds
2017- ongoing
Carbon and natural capital assessments
Undertaking and assessing the applicability Ross Macleod, Louise de Raad of assessments
Core funds, CNPA Horizon 2020 funding
2021- ongoing
Core funds, Working for Waders
2021- 2025
The impact of egg predators Quantifying the impact of different predator on waders species on wader productivity
Louise de Raad, Max Wright, Panagiotis Nikolaou, Adam Watts
Songbird feeders
Providing two different songbird mixes across the farm Louise de Raad, Max Wright, to enhance winter survival and breeding condition Panagiotis Nikolaou, Adam Watts
Core funds
2022- ongoing
Soil sampling
Investigating soil condition in advance of new grassland management techniques
Louise de Raad, Dyfan Jenkins, Max Wright
Core funds, CNPA Horizon 2020
2022- ongoing
Badger monitoring
Monitoring activity and population of badgers at GWSDF
Max Wright, Panagiotis Nikolaou, Adam Watts, Kate Goodman, Seth Howell
Core funds
2023- ongoing
Louise de Raad, Dyfan Jenkins, Max Wright, Kate Goodman, Seth Howell
Core funds
2023- ongoing
Staff
Funding source
Frost resistance & productivity Trialling new farm initiatives such as testing fodder beet trial fodder beet and swede crop frost resistance
FISHERIES RESEARCH
Project title
Description
Date
Salmonid life-history Understanding the population declines strategies (see p16) and solutions to reverse the trends
Dylan Roberts, William Beaumont, Luke Core funds, EA, Cefas, Scott, Sophie Elliot, Jessica Marsh, Keerthan The Missing Salmon Alliance Boraiah, Jonathan Gilson (Cefas), EU Interreg Channel Rasmus Lauridsen (6 Rivers Iceland)
Grayling ecology (see p20)
Jessica Marsh, Luke Scott, Will Beaumont, Core funds, Grayling Research Trust 2009- ongoing Stephen Gregory (GRT). Robert Wellard (PS) (GRT), Piscatorial Society (PS)
Long-term study of the ecology of River Wylye grayling
2009- ongoing
Salmon and trout smolt Movements and survival of salmon and sea tracking: write up of trout smolts through four estuaries in the SAMARCH project English Channel (2017-2023) papers
Céline Artero, Jessica Marsh, Luke Scott, The Missing Salmon Alliance, Dylan Roberts, Will Beaumont, Thomas, Core funds Lecointre, Stephen Gregory (Cefas), Elodie Reveillac (Agrocampus Ouest), Rasmus Lauridsen (6 Rivers Iceland)
2017-2025
Sea trout kelt tracking: Movements, behaviour and survival of sea trout write up of SAMARCH kelts at sea from three rivers in the project (2017-2023) papers English Channel
Céline Artero, Jessica Marsh, Will Beaumont, The Missing Salmon Alliance, Luke Scott, Dylan Roberts, Elodie Reveillac, Core funds (Agro-campus Ouest), Rasmus Lauridsen (6 Rivers Iceland)
2017-2025
Database redevelopment Creation of a SQL database and clean-up of data
Sophie Elliott, Keerthan Boraiah, Tommy Tham, Sabeeth Shoeb
2023-2026
Bycatch analysis
Pelagic fisheries bycatch risk assessment of Atlantic salmon and other diadromous fish
Sophie Elliott, Colin Bull (MSA, University WGNAS/WKSALMON, of Stirling/ ICES WGNAS), Aislinn Borland Missing Salmon Alliance (Strathclyde University), Simon Toms (EA), Jon Gilson (Cefas/ ICES WGNAS), Kjell Rong (ICES WGNAS)
2023-2025
Ecology of European eels
Ecology of yellow & silver eels and elvers in the River Frome Dorset
Jessica Marsh, Sophie Elliott, Will Beaumont, EA, Core funds, Cefas Luke Scott, Dylan Roberts, Rob Britton, Sibusisiwe Moyo (BU), Andy Don & Ros Wright (EA), Tea Basic (Cefas)
2024- ongoing
WGTRUTTA
Brown/sea trout juvenile and adult stock assessments
Sophie Elliott, Robert Britton (BU), Jon Gilson (Cefas), WGTRUTTA members
Core funds, BU
2024- ongoing
AI Fish counter (see p18)
Modelling trace and video data to identify, count and measure the length of different diadromous fish passing over the counter
Sophie Elliott, Keerthan Boraiah, Tommy Tham
Core funds
2024-2025
Core funds
Assessment of priority Modelling diadromous fish distribution at sea, Sophie Elliott, Laurent Beaulaton (OFB), EU Interreg for the DiadSea Project 2024-2025 marine areas for conservation understanding climate change shifts in distribution Gaspard Dubost, Patrick Lambert, and identify priority areas for conservation Géraldine Lasalle (INRAE), DiadSea members
gwct.org.uk
GWCT RESEARCH REPORT • 2024 | 89
LOWLAND GAME RESEARCH Project title
Description
Staff
Funding source
Date
Released gamebird dispersal
Documenting movement and dispersal of released gamebirds
Rufus Sage, Maureen Woodburn, Jenny Coomes, Joseph Werling, Katie Holmes
BASC
2021-2024
Releasing gamebirds and foxes
Field-based study of fox abundance and diet in relation to releasing gamebirds and predator control
Jenny Coomes, Maureen Woodburn, Rufus Sage, Joseph Werling
BASC
2021-2025
Enhanced pheasants
Documenting release success for pheasants enhanced in rearing system
Maureen Woodburn
Core funds
2022- ongoing
Invertebrates and releasing gamebirds
Review paper of effect of releasing on invertebrates
Rufus Sage
NE
2023-2024
Rufus Sage, Maureen Woodburn, Clive Bealey, Joseph Werling
NE
2023-2025
Pheasant releasing and desig- National field study of effects of pheasant nated woodlands (see p28) releases on SAC and SSSI woodlands
EXTERNAL COMMITTEES WITH GWCT REPRESENTATION
1.
Agricology Steering committee
Alice Mead
29.
Defra Upland Stakeholder Forum
Henrietta Appleton
2.
Agricultural Reform Programme (Scotland)
Ross Macleod
30.
Dorset Beaver Trial
Dylan Roberts
3.
Aim to Sustain Avian Influenza working group
Roger Draycott
31.
Durham County Council – Ecological Emergency Board Phil Warren
4.
Aim to Sustain group (Wales)
Sue Evans
32.
East Cairngorms Moorland Partnership
5.
Aim to Sustain Standards Committee
Roger Draycott
Rory Kennedy/ Louise de Raad
6.
Allenford Farmer Cluster
Megan Lock (Facilitator)
33.
Echoes Project Advisory Board
Matt Goodall
7.
Animal Network Welfare Wales Group
Matt Goodall
34.
Ecosystems and Land Use Stakeholder Engagement Group (Scotland)
Ross Macleod
8.
Arun to Adur Farmer Cluster Steering Group
Julie Ewald
35.
Environmental Farmers Group
Teresa Dent
9.
Avon Valley Farmer Cluster
Lizzie Grayshon (Facilitator)
36.
European Sustainable Use Group
10.
BBC Rural Affairs Committee
Mike Short
Nicholas Aebischer/ Julie Ewald (Chair)
11.
BBC Scottish Rural and Agricultural Advisory Committee
37.
Diadromous Fish at Sea Research Committee
Sophie Elliott
Rory Kennedy
38.
12.
Birds of Conservation Concern Steering Group
Nicholas Aebischer
Fellow of the National Centre for Statistical Ecology Nicholas Aebischer
13.
Bracken Management Group
Alastair Leake
39.
Fish Welfare Group
Dylan Roberts
40.
FWAG (Administration) Ltd
Alastair Leake
41.
Gamekeepers Welfare Trust
Mike Swan (Trustee)
42.
Gelli Aur Slurry Project Steering Group
Sue Evans
43.
German Grey Partridge Recovery Project Steering Committee
Francis Buner
44.
Glamorgan Rivers Trust
Dylan Roberts
45.
Good Food Leicestershire Expert Advisory Group
Chris Stoate (Chair)
46.
Greenhouse Gas Recovery Biochar Demonstrator Expert Advisory Group
Chris Stoate (Chair)
47.
Hampshire Avon Catchment Partnership
Andrew Hoodless
48.
Hen Harrier Brood Management Project Board
Henrietta Appleton
49.
HORIZON PRO-Coast co-ordination team
Julie Ewald
50.
ICES Trout Working Group
Sophie Elliott
51.
ICES Working Group on North Atlantic Salmon
Sophie Elliott
52.
International Association of Falconry Biodiversity Working Group
Julie Ewald/ Francis Buner
53.
IUCN Commission on Ecosystem Management
Julie Ewald/ Nicholas Aebischer
54.
IUCN Species Survival Commission Galliformes Specialist Group
Francis Buner (Vice Chair)/ Nicholas Aebischer
55.
IUCN Species Survival Commission Grouse Specialist Group
David Baines
14.
Camlad Valley Project
Matt Goodall
15.
Capercaillie Science Advisory Group
David Baines
16. 17.
CIC Head of Small Game Specialist Group CNPA Cairngorm Upland Advisory Group
Francis Buner Rory Kennedy/ Louise de Raad
18.
CNPA Nature Index Group
Ross Macleod
19.
Code of Good Shooting Practice
Mike Swan
20.
Cold Weather Wildfowling Suspensions
Mike Swan/Marlies Nicolai/Matt Goodall
21.
Co-ordinated Uplands Partnership
Henrietta Appleton
22.
Cors Caron Project
Matt Goodall
Curlew Recovery Partnership (England) Steering Group
Andrew Hoodless/ Teresa Dent
24.
Gylfinir Cymru
Amanda Perkins/Lee Oliver Julieanne Quinlan/ Katie Appleby
25.
Cynnal Coetir Sustainable Management Scheme Elwy Project
Lee Oliver/ Sue Evans
26.
Deer Management Qualifications
Alex Keeble
27.
Defra 30by30 on land stakeholder working group
Henrietta Appleton
28.
Defra Gamebird stakeholder Avian Influenza working group
Roger Draycott
23.
90 | GWCT RESEARCH REPORT • 2024
EXTERNAL COMMITTEES |
56.
IUCN Species Survival Commission Re-introduction Specialist Group
Francis Buner
57.
IUCN Species Survival Commission Woodcock & Snipe Specialist Group
Andrew Hoodless/ Chris Heward
58.
IUCN Sustainable Use and Livelihoods Specialist Group (SULI)
Nicholas Aebischer/ Julie Ewald
59.
Martin Down Farmer Cluster
Megan Lock (Facilitator)
60.
Missing Salmon Alliance Steering Group
Teresa Dent/ Dylan Roberts
61.
Missing Salmon Alliance Technical Group
Dylan Roberts/Sophie Elliott
62.
Moorland Management Best Practice Steering Group
Ross Macleod
63.
Mountain Hare Monitoring Group
Nick Hesford/Ross Macleod
64.
Natural England Scientific Advisory Committee
Nicholas Aebischer
65.
Natural Resources Wales Fish Eating Birds Review Group
66.
Natural Resources Wales Fisheries Forum
67.
Natural Resources Wales Wild Bird Review Stakeholder Meeting - Land Management and Shooting Sector Group
Scottish Capercaillie Group
Kathy Fletcher
92.
Scottish Farmed Environment Forum
Ross Macleod
93.
Scottish Government Technical Assessment Group (Snares and traps)
Hugo Straker
94.
Scottish Grouse Shoot Code Review Group
Ross Macleod
95.
Scottish Moorland Groups
Hugo Straker/ Nick Hesford
96.
Scottish Muirburn Code Review Group
Nick Hesford
97.
Scottish PAW Executive, Raptor and Science sub-groups
Ross Macleod/ Nick Hesford
98.
SGR Monitoring Group
Alastair Leake
99.
Shoot Liaison Committee Wales
Matt Goodall/Sue Evans
Dylan Roberts
101. South Coast White-tailed Eagle Reintroduction project steering group
Mike Short
102. South Downs Farmland Bird Initiative
Julie Ewald
103. South East England Pine Marten Working Group
Mike Short
104. South of England Curlew Project Steering Group
Andrew Hoodless/ Chris Heward
105. Southern Curlew Forum
Andrew Hoodless/ Amanda Perkins
106. Sparsholt College Industry Liaison Group – Land & Wildlife
Jodie Case/ Mike Short
107. Speyside Black Grouse Study Group
Kathy Fletcher
108. Swedish Environmental Protection Agency Scientific committee for wildlife research
Scott Newey
109. Tayside Biodiversity Partnership
Fiona Torrance
110. The Bracken Management Group
Alastair Leake
111. The CAAV Agriculture and Environment Group
Alastair Leake
112. The Curlew Country Board
Amanda Perkins/Sue Evans
113. The Grayling Research Trust
Jessica Marsh
114. Voluntary Initiative National Steering Group
Alastair Leake
115. Warcop Conservation Group – MoD
Phil Warren
116. Welland Resource Protection Group
Chris Stoate (Chair)
Matt Goodall/Sue Evans
69.
NatureScot - Farming with Nature External Advisory Group
Ross Macleod
70.
NatureScot Species Reintroduction Forum
Ross Macleod
71.
NE Compliance and Enforcement Stakeholder Group
Henrietta Appleton
72.
NFU County Chairman (Leicestershire, Northants & Rutland)
Joe Stanley
73.
NFU Midlands Regional Board
Joe Stanley
74.
NFU National Environment Forum
Joe Stanley
75.
NGO National Committee
Roger Draycott
76.
Nurturing Nature Project Advisory Group
Jodie Case
77.
Oriental Bird Club Conservation manager for Pakistan and India
Francis Buner
Perthshire Black Grouse Study Group
91.
Jodie Case
Hugo Straker/Felix Meister
79.
Rory Kennedy/Ross Macleod/Nick Hesford
Dylan Roberts
NatureScot Assured Trapping Training Working Group
Peakland Environmental Farmers Board
Scotland’s Moorland Forum and sub-groups
100. Snakes in the Heather Advisory Group
68.
78.
90.
Teresa Dent Kathy Fletcher
80.
Pesticides Forum Indicators Group of the Chemicals Regulation Directorate
Julie Ewald
117. Welland Valley Partnership
Chris Stoate (Chair)
81.
PHCI Fisheries Sub group
Dylan Roberts
118. Welsh Government Fox Snaring Advisory Group
Matt Goodall
82.
Poole Harbour Agriculture Sub Group
Dylan Roberts
119. Welsh Government Land use Stakeholder Group
Sue Evans
83.
Poole Harbour Catchment Initiative
Dylan Roberts/ Will Beaumont
120. Wild Purbeck Group
Dylan Roberts
121. Wildlife Estates England Scientific Committee
Andrew Hoodless
122. Wildlife Estates England Steering Group
Roger Draycott
123. Wildlife Estates, European Scientific Committee
Alastair Leake
124. Wildlife Estates Scotland Board & Sub Groups
Rory Kennedy/ Ross Macleod
125. Working for Waders
Ross Macleod/Max Wright
126. World Pheasant Association Scientific Advisory Committee
David Baines
84.
Purdey Awards
Mike Swan
85.
River Deveron Fisheries Science
Dylan Roberts
86.
River Otter Beaver Trial
Dylan Roberts/Mike Swan
87.
Rural Environment & Land Management Group (Advisors)
Ross Macleod/ Rory Kennedy (Chair)
88.
Rutland Agricultural Society
Alastair Leake
89.
Salisbury and District Natural History Society committee
Jayna Connelly
Key to abbreviations: BASC = British Association for Shooting and Conservation; BASF = Badische Anilin und Soda Fabrik; BBSRC = Biotechnology and Biological Sciences Research Council; BEESPOKE = Benefiting Ecosystems through Evaluation of food Supplies for Pollination to Open up Knowledge for End users; BTO = British Trust for Ornithology; BU = Bournemouth University; CAAV = Central Association of Agricultural Valuers; CEFAS = Centre for Environment, Fisheries & Aquaculture Science; CIC = International Council for Game and Wildlife Conservation; CNPA = Cairngorms National Park Authority; EA = Environment Agency; EU = European Union; FE = Forestry England; FRAMEwork = Farmer clusters for Realising Agrobiodiversity Management across Ecosystems; GCUSA = Game Conservancy USA; GRT = Grayling Research Trust; GWSDF = Game & Wildlife Scottish Demonstration Farm; H2020 = Horizon 20:20; HLF = Heritage Lottery Fund; ICES = International Council for the Exploration of the Sea; INRAE = Institut National de Recherche pour l’Agriculture, l’Alimentation et l’Environnement; Interreg = European Regional Development Board; IOBC-WPRS = International Organisation for Biological and Integrated Control of Noxious Animals and Plants-West Palearctic Regional Section; IUCN = International Union for Conservation of Nature; LRWT = Leicestershire & Rutland Wildlife Trust; LIFE = L’Instrument Financier pour l’Environnement; NARGC = National Association of Regional Game Councils; NPWS = National Parks and Wildlife Service; NE = Natural England; NERC = Natural Environment Research Council; NFU =National Farmers’ Union; NGO = National Gamekeepers’ Organisation; NNR = National Nature Reserves; NSR PARTRIDGE = North Sea Region Protecting the Area’s Resources Through Researched Innovative Demonstration of Good Examples; PAO = Positive Agriculture Outcomes Fund; PAW = Partnership for Action Against Wildlife Crime; PGRO = Processors and Growers Research Organisation; PHCI = Poole Harbour Catchment Initiative; SGR = Second Generation Rodenticide PS = Piscatorial Society; QMUL = Queen Mary University of London; RPA = Rural Payments Agency; SAMARCH = SAlmonid MAnagement Round the CHannel; SARIC = Sustainable Agriculture Research and Innovation Club; SSSI = Sites of Special Scientific Interest; UCC = University College Cork; UKRI = UK Research Innovations; WRT = Westcountry Rivers Trust.
gwct.org.uk
GWCT RESEARCH REPORT • 2024 | 91
GWCT STAFF CHIEF EXECUTIVE
Teresa Dent BSc, FRAgS, CBE
Personal Assistant Minute Taker (p/t) Chief Operating Officer Facilities Assistant HR Administrator HR Administrator Headquarters Site Maintenance Site Maintenance Cleaner Chief Finance Officer Head of Finance Finance Assistant Finance Assistant Finance Assistant Finance Assistant Head of Information Technology IT Assistant
Laura Gell (until June) Venetia Tucker Edward Macfarlane Kitty Benson Thomas Davis (until December), Linda Villegas (from December) Judi Weston (from October) Steve Fish Kevin Hill Theresa Fish Nick Sheeran BSc, ACMA, CGMA Hilary Clewer BA Lindsey Chappé De Leonval Alan Gray (until June), Beth Hales (from August) Julie Jones Fiona Tierney James Long BSc Dean Jervis HNC, BA
DIRECTOR OF RESEARCH
Andrew Hoodless BSc, PhD
Personal Assistant (p/t) Research Scientist cross departmental postdoc PhD Student (Bournemouth University) - lapwings and avian predators PhD Student (UCC Cork) - woodcock in Ireland PhD Student (University of Reading) - large herbivores impacts in the New Forest Public Sector Fundraiser Public Sector Fundraiser Administrator Public Sector Grants – Research Admin Curlew Country Curlew Country Project Officer Senior Biometrician p/t Principal Scientist – Farmland Ecology & GIS Librarian, National Gamebag Census Co-ordinator & Head of CRM Data Support Officer/National Gamebag Census Co-ordinator Partridge Count Scheme Co-ordinator GIS/Biometrics Analyst Placement Student shared with Predation (Sheffield University) Placement Student shared with Natural Capital Advisory (Newcastle University) Data Engineer/Scientist Placement Student – Computer Science (University of Bath) Placement Student – Computer Science, shared with LGU (Harper Adams Univ.) Head of Wildlife Recovery PARTRIDGE Placement Student shared with GIS (Leeds University) Research Assistant Head of Fisheries Senior Fisheries Scientist Data Scientist Data Scientist Fisheries Ecologist Senior Research Assistant Senior Research Assistant Senior Fisheries Scientist (p/t) PhD Student (University of Exeter) - adaption of trout to metal polluted rivers PhD Student (University of Southampton) – impacts of beaver dams on brown trout in a stream in Scotland Principal Scientist - Lowland Gamebird & Wildlife Research Senior Scientist Fieldwork Assistant Head of Wetland Research Ecologist Research Assistant Placement Student (University of Sheffield) Head of Predation Management Research Research Assistant PhD Student (Bournemouth University) - fox genetics and diet PhD Student (Bournemouth University) - New Forest curlew Principal Scientist - Head of Farmland Ecology Research Senior Entomologist Senior Scientist Research Scientist (p/t) Research Assistant Research Assistant PhD Student (Royal Holloway) - effects of farm management practices Placement Student (University of Lincoln) Placement Student shared with Wetlands (University of Sheffield) Director of Upland Research Head of Upland Research Senior Research Assistant - Scottish Upland Research Senior Scientist Species Recovery Project Assistant Graduate Intern Senior Scientist Research Assistant Uplands - shared with Advisory Graduate Intern Director of GWSDF & Head of Research - Scotland Research Assistant - Scottish Grey Partridge Recovery Project Research Assistant - Scottish Lowlands Placement Student (University of Exeter) Placement Student (University of York)
Lynn Field Aisha Bruendl BSc, PhD (from September) Ryan Burrell BSc James O’Neill BSc Alexandros Theodorou BSc Paul Stephens BApp.Sc Ben Stephens MAAT George Whale (until October) Amanda Perkins Caleb Stradling Nicholas Aebischer Lic ès Sc Math, PhD, DSc Julie Ewald BS, MS, PhD Corinne Duggins Lic ès Lettres (until May) Ashlee Rossiter (from May) Neville Kingdon BSc, PgCert Cameron Hubbard BSc, MSc (until September), Leyla Hunn BA (from September) Phoebe James (from September) Eleanor Humphryes (from September) Sabeeth Shoeb B.Tech, MSc Arthur Prince (from September) Lucy Costick (from September) Francis Buner Dipl Biol, PhD Sophie Jackson (from September) Ellie Raynor BSc (until March) Dylan Roberts BSc Sophie Elliott BSc, MSc, PhD Tommy Tham BSc (until September) Keerthan Boraiah BSc, MSc (from May) Jessica Marsh BSc, MSc, PhD Will Beaumont BSc, MSc Luke Scott William Beaumont MIFM Daniel Osmond BSc, MSc (until March)
92 | GWCT RESEARCH REPORT • 2024
Robert Needham (until March) Rufus Sage BSc, MSc, PhD Maureen Woodburn BSc, MSc, PhD Joe Werling Chris Heward BSc, PhD Lizzie Grayshon BSc, MRes Bleddyn Thomas BSc, MSc Robert English (from September) Mike Short HND Jodie Case BSc (until September), Rosa Hicks, BSc (from September) Nathan Williams BSc, MSc Elli Rivers BSc, MSc Niamh McHugh BSc, MSc, PhD Steve Moreby BSc, MPhil Lucy Capstick BSc, MSc, PhD Rachel Nichols BSc, MSc, PhD Eleanor Ness BSc Jayna Connelly BSc, MSc Samantha Bishop BSc, MSc Isabel Bamford (from September) Sophie Eldrett (from September) David Baines BSc, PhD (until March) Scott Newey BSc, MSc, PhD Kathy Fletcher BSc, MSc, PhD Phil Warren BSc, PhD Holly Appleby BSc, MRes Molly Brown MBiolSci (from October) Siân Whitehead BSc, DPhil (until August) Leah Cloonan Sam Rawlinson BSc, MRes (from September) Louise de Raad BSc, MSc, PhD Fiona Torrance BSc Alistair Green BSc, MSc (from February) Lara Auld (from September) Georgia Gargett (from September)
STAFF 2024 | Research Assistant - GWSDF Auchnerran Head Shepherd Agroecologist – Scottish Research Placement Student (University of Reading) Placement Student (University of Sheffield) DIRECTOR OF ADVISORY & EDUCATION Co-ordinator Advisory Services (p/t) Regional Advisor Senior Advisor Head of Education & Advisor for Wales and NW England Regional Advisor Game Manager (p/t) – Allerton Project Biodiversity Advisor – northern England (p/t) Farmland Biodiversity Advisor Ecologist Graduate Ecologist Graduate Ecologist Interim North of England Manager Operations Officer – Natural Capital Advisory Business Manager – Natural Capital Advisory Commercial Officer – Natural Capital Advisory
Max Wright BSc, MRes Dyfan Jenkins Kirsty Paterson BSc, MSc, PhD (from July) Honor Jones (from October) Lily Dobson (from September) Roger Draycott HND, MSc, PhD² Lizzie Herring Amber Lole BSc, MSc, BASIS Mike Swan BSc, PhD Matthew Goodall BSc, MSc Alex Keeble BSc, BASIS Matthew Coupe Jennie Stafford BSc, BASIS Megan Lock BSc, MCIEEM, BASIS Ellie Raynor BSc Sebastian Seely BSc Kirsty Melville BSc (from October) Rebecca Barber (from May) Digby Sowerby Rachel Ridd Tom Vacher (from April)
DIRECTOR OF POLICY, PARLIAMENTARY AFFAIRS & THE ALLERTON PROJECT
Alastair Leake BSc, MBPR (Agric), PhD, FRAgS, FIAgrM, FRASE, CEnv
Secretary (p/t) Policy Officer (England) (p/t) Assistant Manager – Allerton Projects Administrator Project Officer Head of Research for the Allerton Project Ecologist Soil Scientist and Head of Agri-Environmental Science Research Assistant & Trials Officer (p/t) Head of Training & Partnerships Communications Manager Farm Manager
Sarah Large Henrietta Appleton BA, MSc Alice Mead BSc, MSc, MBA Joanne Horrigan Amie Pickering BSc, MSc Prof. Chris Stoate BA, PhD (until July) John Szczur BSc Jennifer Bussell BSc, PhD Gemma Fox BSc, MSc Joe Stanley BA, GDip, ARAgS Jemma Clifford Oliver Carrick BSc (until August) Saya Harvey MSc, PhD (August-Dec)
DIRECTOR OF FUNDRAISING
Jeremy Payne MA, MCIOF
Prospect Researcher Interim Head of Fundraising Events Manager Senior Regional Fundraiser Regional Organiser (p/t) Regional Organiser (p/t) Regional Organiser (p/t) Regional Organiser (p/t) Regional Organiser (p/t) Regional Organiser (p/t) Regional Organiser (p/t) Regional Organiser (p/t) Administration Assistant
Tara Ghai Vanessa Steel BA, MA Iona Campbell BScl Max Kendry Sophie Dingwall Tony Holdsworth Sam Middleton Stephen Roberson Gay Wilmot-Smith BSc Charlotte Meeson BSc Pippa Hackett Fleur Fillingham BA Daniel O’Mahony
DIRECTOR OF COMMUNICATIONS, MARKETING & MEMBERSHIP
James Swyer (until March), Amber Hopgood (from April)
Publications Officer (p/t) Graphic Designer Membership & Shop Manager Membership Administrator Data Entry Administrator Shop & Database Administrator Marketing Officer Online Marketing Manager Website Editor Online Marketing Executive Head of Communications Communications Officer Communications & Engagement Officer
Louise Shervington Chloe Stevens Beverley Mansbridge Heather Acors Helen Pape Caroline Marlow Sally Frisby MSc Rob Beeson (until December) Olly Dean Danny Sheppard Joe Dimbleby Eleanor Williams Emma Mellen BA, PgCert (until June)
DIRECTOR SCOTLAND
Rory Kennedy, Nick Hesford BSc, PhD (interim from December)
Scottish HQ Administrator Head of Policy (Scotland) Head of Events & Membership Head of Development Farm Administrator (GWSDF) Head of Advisory - Scotland Senior Scottish Advisor Advisor Scotland Advisor Scotland Advisor Scotland Ecologist & Assistant Advisor
Beth Davies (until June), Mandy Cann (from October) Ross Macleod MA, MBA Rory Donaldson Chloe Thornton (until December) Janine Stikeleather Nick Hesford BSc, PhD Hugo Straker NDA¹ Marlies Nicolai BSc Felix Meister BA, MSt, DPhil Martyn Davies (until April) Laura Williamson BSc, MSc (from August)
DIRECTOR WALES
Lee Oliver BSc CF
Projects Officer James Warrington BSc Agriculture and Conservation Officer Elin Thomas BSc (until September), Logan Crimp BSc (from October) Curlew Connections Project Manager Julieanne Quinlan BSc Curlew Connections Curlew & People Officer Katie Appleby Fundraising & Engagement Officer Alaw Ceris BSc Placement Student - University of Gloucestershire Kaylee Fay (from September) 1 Hugo Straker is also Regional Advisor for Scotland and Ireland; ² Roger Draycott is also Regional Advisor for eastern and northern England. Placement students spend one year with the GWCT. This list includes students who began their placement with us in 2024.
gwct.org.uk
GWCT RESEARCH REPORT • 2024 | 93
FINANCIAL REPORT FOR 2024 KEY FINDINGS Income was £11.6 million, an increase of 5% on 2023. Expenditure on charitable activities was £8.1 million compared with £7.4 million in 2023. There was an increase of £110,000 in total funds, but a deficit of £557,000 on unrestricted funds. The Trust’s net assets were £12.81 million at the end of the year.
The summary report and financial statement for the year ended 31 December 2024, set out below and on pages 96 to 97, consist of information extracted from the full statutory Trustees’ report and consolidated accounts of the Game & Wildlife Conservation Trust and its whollyowned subsidiaries Game & Wildlife Conservation Trading Limited, Game & Wildlife Scottish Demonstration Farm, GWCT Natural Capital Advisory Limited and GWCT Events Limited. They do not comprise the full statutory Trustees’ report and accounts, which were approved by the Trustees on 29 April 2025 and which may be obtained from the Trust’s Headquarters. The auditors have issued unqualified reports on the full annual accounts and on the consistency of the Trustees’ report with those accounts, and their report on the full accounts contained no statement under sections 498(2) or 498(3) of the Companies Act 2006.
T
© Nathan Jewell
hanks to the continuing generosity of our supporters and some very welcome legacies we were able to increase our research programme while maintaining the stable financial position which the Trust has established over the last few years. The Trust ran a full programme of fundraising events while engaging with an increasing constituency of supporters through our use of modern communications methods. The Trustees reviewed the Trust’s reserves policy in 2021 in light of the pandemic and determined that the target should be increased to £2.2 million, with a minimum of £1.5 million, to reflect the uncertainties which the pandemic created. In current circumstances, where the UK and the world economy remain under strain, we feel that the revised level remains appropriate. Having established this new level the Trustees continue to be satisfied that the Trust’s financial position is sound. Plans for future periods A new five-year business plan was approved in July 2021. The key aims are: 1. To establish and build significant public support for a more positive approach to conservation. 2. To tackle research knowledge and evidence gaps in: Released gamebird dispersal, predator distribution and the recovery of salmonid species. 3. To persuade game managers to: Practise GWCT’s Sustainable Game Management Principles; To embed the ethos of net biodiversity gain into their game management and quantify its biodiversity and environmental delivery; Quantify and communicate their net biodiversity gain through structured reporting using apps such as EpiCollect, backed with timely interpretation; Accredit their net biodiversity gain through GWCT Shoot Biodiversity Assessments either online or through assessment visits. 94 | GWCT RESEARCH REPORT • 2024
4. To secure policy change such that: The role of predation control in species recovery is understood and embedded in Environmental Land Management Schemes and equivalent agri-environment schemes in Wales; There are practical, workable licences for the control of protected predators to enhance nature conservation; Post-Brexit Agri-Environment Schemes are fit for purpose, informed by GWCT’s researched options; Environmental principles such as the Precautionary, Polluter Pays, and Offsetting principles are pragmatically implemented into future policy; Game management remains economically and culturally active enough to continue to make a net contribution to biodiversity gain. 5. To be a leader in the demonstration and uptake of greener farming. 6. To support our staff by: Drawing up our first people strategy and people plan; Creating a flexible, agile, adaptable team of scientists delivering accessible high-quality science. 7. To maintain the financial viability of GWCT by: Increasing the number of membership subscriptions; Reviewing the cash reserves policy and increase cash reserves as appropriate. These continue to direct our work; our research and policy initiatives aim to deliver effective wildlife conservation alongside economic land use and in the light of the new challenges of food security and climate change. Our focus on practical conservation in a working countryside makes our work even more relevant as these challenges unfold.
SIR JIM PAICE CHAIRMAN OF THE TRUSTEES
Figure 1 Total incoming and outgoing resources in 2024 (and 2023) showing the relative income and costs for different activities 12
10
£million
8
6
4
2
0 Income
Expenditure
Income
2024
Income
Trading income Advisory Services Fundraising events
Public education
Expenditure
Other income Investment income
Expenditure 2023
Research and conservation Other fundraising costs Membership and marketing Direct costs of fundraising events
Charitable activities Donations and legacies Members’ subscriptions
Independent auditors’ statement to the Trustees and Members of the Game & Wildlife Conservation Trust (limited by guarantee) We have examined the summary financial statement for the year ended 31 December 2024 which is set out on pages 96 and 97.
Opinion In our opinion the summary financial statement is consistent with the full annual financial statements of the Game & Wildlife Conservation Trust for the year ended 31 December 2024 and complies with the applicable requirements of Section 427 of the Companies Act 2006 and the regulations made thereunder.
Respective responsibilities of Trustees and Auditors The Trustees are responsible for preparing the summarised Financial Report in accordance with applicable United Kingdom law. Our responsibility is to report to you our opinion of the consistency of the summary financial statement with the full annual financial statements and the Trustees’ Report, and its compliance with the relevant requirements of section 427 of the Companies Act 2006 and the regulations made thereunder. We also read the other information contained in the summarised Financial Report and consider the implications for our report if we become aware of any apparent misstatement or inconsistencies with the summary financial statement. The other information comprises only the Review of Financial Performance.
FLETCHER & PARTNERS Chartered Accountants and Statutory Auditors Salisbury, 29 April 2025
gwct.org.uk
GWCT RESEARCH REPORT • 2024 | 95
Consolidated
Statement of financial activities General Fund £
Restricted Funds £
Endowed Funds £
Total 2024 £
Total 2023 £
1,295,195 1,569,436
1,584,329
-
1,295,195 3,153,765
1,327,363 3,191,208
2,864,631
1,584,329
-
4,448,960
4,518,571
-
3,045,764
-
3,045,764
2,151,769
2,256,927 790,012 159,349 45,936
10,291 220,638
-
2,267,218 790,012 159,349 266,574
3,052,947 714,769 169,337 182,073
Other
296,384
323,171
-
619,555
213,599
TOTAL
6,413,239
5,184,193
-
11,597,432
11,003,065
EXPENDITURE ON: Raising funds Direct costs of fundraising events Membership and marketing Other fundraising costs
914,379 673,538 2,054,132
-
10,725
914,379 673,538 2,064,857
1,307,798 620,345 1,752,030
3,642,049
-
10,725
3,652,774
3,680,173
1,112,731 446,681 396,483 279,735
1,639,773 219,072 1,891,938 315,848
4,150 -
2,752,504 665,753 2,292,571 595,583
2,689,036 648,269 1,961,446 596,443
2,235,630
4,066,631
4,150
6,306,411
5,895,194
1,092,762
743,292
-
1,836,054
1,488,835
3,328,392
4,809,923
4,150
8,142,465
7,384,029
TOTAL
6,970,441
4,809,923
14,875
11,795,239
11,064,202
Income/(expenditure) before investment gains Net gains/(losses) on investments: Realised Unrealised
(557,202)
374,270
(14,875)
(197,807)
(61,137)
21,390 26,964
-
48,349 211,740
69,739 238,704
2,813 186,467
NET INCOME/(EXPENDITURE) Transfers between funds
(508,848) -
374,270 -
245,214 -
110,636 -
128,143 -
NET MOVEMENT IN FUNDS
(508,848)
374,270
245,214
110,636
128,143
RECONCILIATION OF FUNDS Total funds brought forward
5,415,188
2,316,124
4,969,891
12,701,203
12,573,060
TOTAL FUNDS CARRIED FORWARD
£4,906,340
£2,690,394
£5,215,105
£12,811,839
£12,701,203
INCOME AND ENDOWMENTS FROM:
Donations and legacies Members’ subscriptions Donations and legacies
Charitable activities
Other trading activities Fundraising events Advisory Service Trading income Investment income
Charitable activities Research and conservation Lowlands Uplands Demonstration Fisheries
Public education
96 | GWCT RESEARCH REPORT • 2024
Consolidated
Balance sheet as at 31 December 2024
£ FIXED ASSETS Tangible assets Investments
CURRENT ASSETS Stock Debtors Cash at bank and in hand
CREDITORS: Amounts falling due within one year
2024 £
£
2023 £
3,863,612 5,123,595
4,059,137 4,888,590
8,987,207
8,947,727
427,543 2,444,797 2,935,977
475,759 2,110,726 2,983,156
5,808,317
5,569,641
1,760,659
1,562,293
NET CURRENT ASSETS
4,047,658
4,007,348
TOTAL ASSETS LESS CURRENT LIABILITIES
13,034,865
12,955,075
CREDITORS: Amounts falling due after more than one year
223,026
253,872
NET ASSETS
£12,811,839
£12,701,203
Representing: CAPITAL FUNDS Endowment funds
5,215,105
4,969,891
2,690,394
2,316,124
INCOME FUNDS Restricted funds Unrestricted funds: Fair value reserve Legacy reserve General fund Non-charitable trading fund
TOTAL FUNDS
281,617 323,862 4,268,826 32,035
276,043 5,106,438 32,707 4,906,340
5,415,188
£12,811,839
£12,701,203
Approved by the Trustees on 29 April 2025 and signed on their behalf
J PAICE Chairman of the Trustees
gwct.org.uk
GWCT RESEARCH REPORT • 2024 | 97
COUNCIL
& COUNTY CHAIRMEN - 1 JANUARY 2025
Patron Chairman of the Trustees Vice-Chairmen of the Trustees
HM King Charles III The Rt Hon Sir Jim Paice DL FRAgS John Shields, Jeremy Young
Elected Trustees
Bernard Taylor CBE DL FRSC, Jules Gibbs, Preben Prebensen, The Rt Hon Sir Robert Goodwill, Andrew Knott, Zoe Henderson, The Lord Bolton, Lady Minette Batters, Andrew Reed, Alexandra Henton
Ex-Officio Trustees
Stephen Morant, Jeremy Finnis DL, David Mayhew CBE, Peter Misselbrook, John Shields, Stephen Catlin, Owen Williams, James Corbett
Advisory Members
Simon West, George Davis, Prince Albrecht Fürst zu Oettingen-Spielberg, David Pooler, Alex Hogg
President and Vice-Presidents President Vice-Presidents
The Most Hon the Marquess of Salisbury KG KCVO PC DL Henry Hoare, Baron van Tuyll van Serooskerken, Colin Stroyan, James Bowdidge ARICS, Andrew Christie-Miller FRAgS, The Earl Peel GCVO DL, Sir Mark Hudson KCVO FRAgS, Ian Haddon, Robert Miller, Richard Wills, The Duke of Northumberland DL, Bruce Sargent, The Duke of Norfolk DL, David Flux, Ian Yates, Jonathan Kennedy BSc FRICS, The Rt Hon The Earl of Dalhousie DL, Ian Coghill, The Hon Philip Astor, Hugh Oliver-Bellasis FRAgS, Ron Beck, Richard Chilton, The Rt Hon Sir Nicholas Soames, James Keith, The Duke of Westminster, Andrew Law
County Chairmen England Bedfordshire Berkshire Bristol & North Somerset Buckinghamshire Cambridgeshire
Simon Maudlin No chair No chair Andrew Knott Andrew Ramply (Sam Topham) Richard Goodwin Gary Champion William Johnson Mark Parramore
Cheshire Cornwall Cumbria Derbyshire & South Yorkshire Devon Stewart Priddle Dorset Peter Wilson Essex Mark Latchford Gloucestershire Mark Ashbridge Hampshire Louise Crichton Herefordshire Luke Freeman Hertfordshire Neil Macleod Isle of Wight No chair Kent Jack Sadler Lancashire Nick Mason Leicestershire & Hamish Byers Rutland Lincolnshire George Tinsley
98 | GWCT RESEARCH REPORT • 2024
London Norfolk Northamptonshire Northumberland & County Durham Nottinghamshire
no chair Carlo Fountaine Andrew Cowling (Alex Coles) Dick Murphy
Libby Harrison (Chris Butterfield) Oxfordshire Tim Huddart (Chris Robinson) Shropshire Steve Barker (Charlotte Marrison) Somerset Christopher Norfolk Staffordshire Aaron Chetwynd (David Dale interim) Suffolk George Thomas Surrey no chair Sussex Jamie Evans-Freke Warwickshire & Edward Beale West Midlands Wiltshire Ben Hamilton (Colin Elwell) Worcestershire Ray Foster-Morison (Mark Steele) East Yorkshire No chair North Yorkshire Harry Scrope West Yorkshire no chair
Scotland Edinburgh & SE Scotland Fife & Kinross Grampian Highland East Tayside West Tayside West of Scotland Scottish Auction
Luke French (Malcolm Leslie) Kathryn Bontoft Alan Hamilton Charlotte Gilfillan Michael Clarke Guy Spurway David MacRobert Tim Wishart
Wales Wales Chairman Ceredigion North-East Wales North-West Wales Powys South-East Wales South-West Wales
Owen Williams Dr Susan Loxdale Richard Thomas Owain Griffith Tom Till Roger Thomas Amanda Harris-Lea
Names in brackets were chairmen that stepped down during 2024
Game & wildlife management Good productivity is essential for all shoots; whether from the rearing field or achieving maximum productivity from wild stock
Get the best advice The GWCT’s advisory team are the most experienced consultants in their field, able to provide advice and training across all aspects of game management, from wild bird production and farm conservation management to the effective and sustainable management of released game and compliance with the Code of Good Shooting Practice.
Renowned for our science-based game and wildlife management advice that guarantees the best possible outcome from your shoot, we will work closely with your farm manager, gamekeeper and existing advisors to identify ways of making your game and shoot management more effective, by providing tried and tested advice backed by science.
Call us today on 01425 651013 or email advisory@gwct.org.uk AdvisoryAdvert.indd 1
09/05/2023 13:38:03
100 | GWCT RESEARCH REPORT • 2024