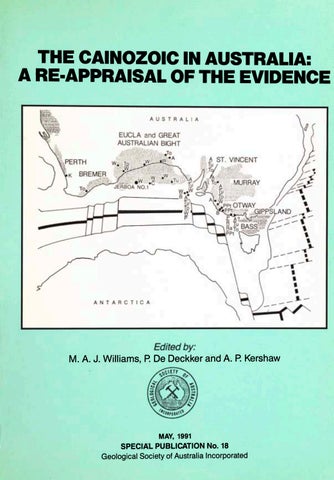
THE CAINOZOIC IN AUSTRALIA: A RE-APPRAISAL OF THE EVIDENCE
Edited by: M. A. J. Williams, P. De Deckker and A. P. Kershaw
MAY, 1991 SPECIAL PUBLICATION No. 18 Geological Society of Australia Incorporated
SP 1 3
THE CAINOZOIC IN AUSTRALIA: A RE-APPRAISAL OF THE EVIDENCE
EDITED BY: M.A.J. WILLIAMS
Department of Geography and Environmental Science, Monash University, Melbourne. P. De DECKKER
Department of Geology, The Faculties, The Australian National University, Canberra. A.P. KERSHAW
Department of Geography and Environmental Science, Monash University, Melbourne.
SPECIAL PUBLICATION NO. 18 GEOLOGICAL SOCIETY OF AUSTRALIA INCORPORATED MAY, 1991
The Cainozoic in Australia: a re-appraisal of the evidence M.A.J. Williams, P. De Deckker and A.P. Kershaw Geological Society of Australia Special Publication No. 18 ISBN 0 909869 76 6 ISSN 0072 1085 © Geological Society of Australia This book is copyright. Apart from any fair dealing for the purposes of private study, research, criticism or review, as permitted under the Copyright Act, no part may be reproduced by any process without written permission. Enquiries to: The Business Manager Geological Society of Australia Inc. 606 ANA House 301 George Street Sydney NSW 2000 Typeset by Sun Photoset Pty. Ltd., Brisbane Printed by Watson Ferguson, Brisbane
Table of Contents LIST OF CONTRIBUTORS
v
PREFACE
vii
ACKNOWLEDGEMENTS
x
Palaeogene VEEVERS J.J. Mid-Cretaceous tectonic climax, Late Cretaceous recovery, and Cainozoic relaxation in the Australian region
1
SUTHERLAND F.L. Cainozoic volcanism, eastern Australia: a predictive model based on migration over multiple 'hot spot' magma sources
15
DAVIES P.J., SYMONDS P.A., FEARY D.A. & PIGRAM C.J. The evolution of the carbonate platforms of northeast Australia
44
McGOWRAN B. Maastrichtian and early Cainozoic, southern Australia: planktonic and foraminiferal biostratigraphy
79
SLUITER I.R.K. Early Tertiary vegetation and climates, Lake Eyre region, northeastern South Australia
99
Neogene ROY P.S. & THOM B.G. Cainozoic shelf sedimentation model for the Tasman Sea margin of southeastern Australia..
119
HOLDGATE G.R. & SLUITER I.R.K. Oligocene-Miocene marine incursions in the Latrobe Valley depression, onshore Gippsland Basin: evidence, facies relationships and chronology BOLGER P.F. Lithofacies variations as a consequence of Late Cainozoic tectonic and palaeoclimatic events in the onshore Gippsland Basin
137
158
MARTIN H.A. Tertiary stratigraphic palynology and palaeoclimate of the inland river systems in New South 181
Wales McEWAN MASON J.R.C. The late Cainzoic magnetostratigraphy and preliminary palynology of Lake George, New South Wales WEBB J.A., FINLAYSON B.L., FABEL D. & ELLAWAY M. The geomorphology of the Buchan Karst — implications for the landscape history of the Southeastern Highlands of Australia iii
195
210
YIM W.W.-S. Tin placer genesis in northeastern Tasmania
235
Quaternary WILLIAMS M.A.J., De DECKKER P., ADAMSON D.A. & TALBOT M.R. Episodic fluviatile, lacustrine and aeolian sedimentation in a late Quaternary desert margin system, central western New South Wales
258
KERSHAW A.P., BAIRD J.G., D'COSTA D.M., EDNEY P.A., PETERSON J.A. & STRICKLAND K.M. A comparison of long Quaternary pollen records from the Atherton and Western Plains volcanic provinces, Australia
288
HEAD L., D'COSTA D. & EDNEY P. Pleistocene dates for volcanic activity in western Victoria and implications for Aboriginal occupation
302
WHITEHEAD P.W. The geology and geochemistry of Mt Napier and Mt Rouse, western Victoria
309
GILL E.D., SHERWOOD J.E., CANN J.H., COUTTS P.J. & MAGILTON C.J. Pleistocene shell beds of the Hopkins River, Warrnambool, Victoria: estuarine sediments or Aboriginal middens?
321
PETERSON J.A. Human dispersal from Wallacea to Sahul: a re-appraisal
339
iv
List of Contributors D.A. Adamson School of Biological Sciences, Macquarie University, Sydney, N.S.W. 2109. J.E. Baird Department of Earth Sciences, Monash University, Clayton, Victoria 3168. P.F. Bolger Investigations Branch, Rural Water Commission of Victoria, Melbourne, Victoria 3000. J.H. Cann School of Pure and Applied Sciences, Salisbury Campus of South Australian College of Advanced Education, Salisbury East, S.A. 5109. P.J. Coutts G.P.O. Box 6602, Hong Kong. P.J. Davies Division of Marine Geosciences and Petroleum Geology, Bureau of Mineral Resources, G.P.O. Box 378, Canberra, A.C.T. 2601. D.M. D'Costa Department of Geography and Environmental Science, Monash University, Clayton, Victoria 3168. P. De Deckker Department of Geology, The Faculties, The Australian National University, Canberra, A.C.T. 2601. P.A. Edney Telecom Research Laboratories, 770 Blackburn Road (P.O. Box 249) Clayton, Victoria 3168. M. Ellaway Department of Geography, Melbourne University, Parkville, Victoria 3052. D. Fabel Department of Geography, Melbourne University, Parkville, Victoria 3052. D.A. Feary Division of Marine, Geosciences and Petroleum Geology, Bureau of Mineral Resources, G.P.O. Box 378, Canberra, A.C.T. 2601. B.L. Finlayson Department of Geography, Melbourne University, Parkville, Victoria 3052. E.D. Gill — Deceased L. Head Department of Geography, University of Wollongong, P.O. Box 1144, Wollongong, N.S.W. 2500. G.R. Holdgate Department of Geography and Environmental Science, Monash University, Clayton, Victoria 3168. A.P. Kershaw Department of Geography and Environmental Science, Monash University, Clayton, Victoria 3168. C.J. Magilton Faculty of Applied Science and Technology, Warrnambool Institute of Advanced Education, Warrnambool, Victoria 3280. v
H.A. Martin School of Biological Science, University of New South Wales, P.O. Box 1, Kensington, 2033.
N.S.W.
J.R.C. McEwan Mason Department of Earth Sciences, Monash University, Clayton, Victoria 3168. B. McGowran Department of Geology and Geophysics, University of Adelaide, Adelaide, S.A. 5001. J.A. Peterson Department of Geography and Environmental Science, Monash University, Clayton, Victoria 3168. C.J. Pigram Division of Marine Geosciences and Petroleum Geology, Bureau of Mineral Resources, G.P.O. Box 378, Canberra, A.C.T. 2601. P.S. Roy Geological Survey of New South Wales, G.P.O. Box 5288, Sydney, N.S. W. 2000. J.E. Sherwood Faculty of Applied Science and Technology, Warrnambool Institute of Advanced Education, Warrnambool, Victoria 3280. I.R.K. Sluiter Department of Conservation and Environment, Mildura, Victoria 3500. K.M. Strickland Department of Geography and Environmental Science, Monash University, Clayton, Victoria 3168. F.L. Sutherland Division of Earth Sciences, The Australian Museum, G.P.O. Box A285, Sydney, N.S.W. 2000. P.A. Symonds Division of Marine Geosciences and Petroleum Geology, Bureau of Mineral Resources, G.P.O. Box 378, M.R.Canberra, Talbot A.C.T. 2601. Geologisk Institutt Avd. A., Universitetet i Bergen, Allegt 41, 5014 Bergen, Norway. B.G. Thorn Department of Geography, University of Sydney, N.S. W. 2006 J.J. Veevers Australian Plate Research Group, School of Earth Sciences, Macquarie University, N.S.W. 2109 J.A. Webb Department of Geology, La Trobe University, Bundoora, Victoria 3083. P.W. Whitehead Department of Geology, James Cook University, Townsville, Queensland 4811. M.A.J. Williams Department of Geography and Environmental Science, Monash University, Clayton, Victoria 3168. vi
W.W.-S. Yimof Geography and Geology, University of Hong Kong, Hong Kong. Department
PREFACE The Cainozoic era spans the past 65 million years of geological time and was of critical importance in earth history. It was during this time that the now familiar geographical distribution of land, sea and ice was achieved as a result of Cainozoic sea-floor spreading and lithospheric plate movements. Associated with these global tectonic events were a number of major regional episodes, including uplift of the Himalayas, northward movement of Africa and Australia, closure of the Panama isthmus, continental desiccation and cooling, reduction in tropical rainforest cover, expansion of deserts, and emergence of bipedal, tool-using hominids in the rift valleys of East Africa. In brief, the fashioning of the world environment in which we now live, together with the emergence of the plants and animals upon which we depend for food and shelter, were principally effected during the Cainozoic. Much of the evidence of these events is still well preserved, especially in a continent as dry and tectonically stable as Australia, where the erosional and depositional evidence from rivers, lakes and dunes has not been obscured or obliterated by the great ice sheets which periodically covered much of North America and northwest Europe during the very late Cainozoic. A critical re-examination of the evidence from land and sea involves a re-appraisal of the timing of past tectonic and volcanic activity around Australia, as well as careful scrutiny of the correlative depositional record offshore. A willingness to help achieve this re-appraisal of Australia's Cainozoic record brought together seventy earth scientists from all around Australia to take part in the Cainozoic conference which was held at Warrnambool in Victoria in the second week of December, 1987. A similar spirit provides the raison d'etre for this special publication of the Geological Society of Australia, which includes revised and expanded versions of many of the papers delivered and debated at Warrnambool, together with a number of additional contributions. In keeping with Australia's status as an island of continental extent, this volume contains a number of chapters which discuss the links between the terrestrial and the marine geological records (Fig. 1). The opening chapter by Veevers begins in the mid-Cretaceous and sets the scene for subsequent chapters by tracing the major tectonic events which influenced Australia before and during the Cainozoic. Sutherland then traces the impact of Australia's northward migration upon the pattern and tempo of Cainozoic volcanism in eastern Australia. The next three chapters deal with the oceanic evidence. Davies et al take up some of the themes outlined in the first two chapters, and focus upon the progressive evolution of the carbonate platforms of northeastern Australia in response to both tectonic and climatic changes. McGowran concentrates upon the terminal Cretaceous (Maastrichtian) and early Cainozoic biostratigraphic record from southern Australia, and re-interprets some of the evidence from planktonic and foraminiferal microfossils. In the last chapter in this section, which we have rather loosely labelled as Palaeogene (see Fig. 1), we leave the sea for the land, and are presented by Sluiter with substantially new information about the changing early Tertiary vegetation and climates of the Lake Eyre region. The next section deals, very broadly, with the Neogene. Roy and Thom consider the Oligocene and Miocene depositional sequences of the southeastern continental shelf, and offer a refined version of their shelf sedimentation model for the Tasman Sea margin. The economically important Oligocene and Miocene coal-bearing formations of the Latrobe Valley and Gippsland Basin are the subject of two detailed scrutinies. Holdgate and Sluiter examine the timing and depositional legacy of successive marine incursions, while Bolger sifts out the separate imprints of tectonic and palaeoclimatic events. In the next chapter we move further north and west to the late Tertiary vii
inland river systems of New South Wales. Here Martin synthesises her long-term palynological work and offers a revised interpretation of the vegetation history and associated palaeoclimatic changes in this region. One of the classic sites used in the reconstruction of late Tertiary and Quaternary climates in southeastern Australia is Lake George near Canberra. McEwen Mason has carried out detailed pollen analysis on core samples from older sediments of Lake George, but sound interpretation of vegetation history depends upon good chronology, so she concentrates here upon her magnetostratigraphic work, and offers a revised chronology for this important site. The next chapter by Webb et al draws together evidence from a variety of sources — limestone caves, lava flows, river gravels, erosion surfaces — to provide a landscape history for the far Southeastern Highlands. The only paper which deals solely with Tasmania is the elegant analysis by Yim of the age and provenance of Late Tertiary tin placer deposits in northeastern Tasmania. It is also the only paper which deals specifically with mineral resources, and brings to a fitting conclusion the section on the Neogene.
Paleogene Neogene Quaternary Fig. 1 Location of studies in this volume grouped according to approximate age range considered by the authors.
viii
Six chapters round off this book and are the subject of the Quaternary section. Williams et al consider the low gradient desert margin environment of central western New South Wales, and conclude that many of the landforms which are characteristic of this region are not forming there today, but are a legacy of late Quaternary climates which have no modern counterpart. They also note the very close integration between fluviatile lacustrine and aeolian depositional systems. In the next chapter Kershaw et al compare two of Australia's longest and most detailed pollen records, one from the tropical Atherton Tableland of northeastern Queensland, the other from volcanic lakes in western Victoria. The timing of late Quaternary volcanic eruptions in western Victoria is the subject of reconsideration by Head et al who offer both palynological and radiocarbon dating evidence to extend the age of certain prehistoric artefact concentrations from Holocene to Pleistocene. Whitehead's account of late Quaternary volcanism in this area is essentially geochemical in approach, but his chronology may require revision in the future. A tantalising set of marine shell beds near Warrnambool in coastal western Victoria were considered by the late Dr Edmund Gill as possible Aboriginal middens. If so, they would double or treble the known antiquity of human occupation in Australia. Sherwood and colleagues take up the challenge in a paper which is exemplary as a study in method. The concluding chapter by Peterson is also an example of lateral thinking and draws attention to a hitherto neglected mechanism for possible human entry into northern Australia. This book provides a critical overview of Australia's Cainozoic history both on land and offshore. Analysis of the terrestrial record proceeds from a re-evaluation of major tectonic and volcanic events through more detailed studies of regional and local sedimentary and volcanic sequences to an examination of the fluviatile, lacustrine and aeolian record. The techniques of microfossil analysis supplement the inferences drawn from the litho-stratigraphic sequences preserved in our sedimentary basins, ocean floors and continental shelves. Against this background of long-term tectonic, volcanic and climatic changes, the volume concludes with some intriguing new data and fresh ideas relevant to the nature and timing of late Quaternary environmental changes and associated prehistoric human settlement in Australia. Martin WILLIAMS Patrick De DECKKER Peter KERSHAW Melbourne July 1990
ix
ACKNOWLEDGEMENTS
We are deeply conscious of how much we owe our referees, all of whom worked hard to improve the clarity and scientific content of this volume. Our very warm thanks go to D.A. Adamson, J. Allen, P. Bishop, M. Bradshaw, D.F. Branagan, J.M.A. Chappell, G.C.H. Chaproniere, E.A. Colhoun, J.L. Davies, P.J. Davies, J. Dodson, A. Ewart, L.A. Frakes, R.W. Galloway, L. Head, R. Hill, E.B. Joyce, M. Macphail, A.H.R. Martin, M. Mclntyre, I. Nichols, C.D. Oilier, A.D. Partridge, J.A. Peterson, P.G. Quilty, R. Roy, I.R.K. Sluiter, P.J. Stephenson, F.L. Sutherland, E.M. Truswell, J.J. Veevers, G.E. Wilford and P.W. Williams. A work like this is always a team effort, so that it is a pleasure to express our appreciation to Donna D'Costa and Helen Quilligan for invaluable help with proof reading, to Maureen Upston and Lyn McMullen for word processing countless manuscripts, and to Gary Swinton and Tony Miller for their professional care with plates and figures. George Fleming, general editor of the Special Publication series, gave constant and wise support. Dr Graham Taylor, on behalf of the Cainozoic Specialist Group, provided much needed financial support for typing. Finally, the Society of Economic Paleontologists and Mineralogists of the American Association of Petroleum Geologists very kindly agreed to allow the Geological Society of Australia to reprint a very slightly modified version of the paper by Davies, Symonds, Feary and Pigram as Chapter 3 of the present volume. We thank them all. Martin WILLIAMS Patrick De DECKKER Peter KERSHAW
x
Mid-Cretaceous tectonic climax, Late Cretaceous recovery, and Cainozoic relaxation in the Australian region J. J. VEEVERS Australian
Plate Research Group, School of Earth Sciences, Macquarie Afew South Wales 2109; Australia.
University,
The Potoroo regime, the plate-tectonic system that has prevailed in Australia since the MidCretaceous (95 Ma), registers the global decline in plate activity manifested by falling sea level, arc-magmatism, and surface temperature. In Australia, the climax of intense plate activity in the Early Cretaceous gave way to recovery in the Late Cretaceous and relaxation in the Cainozoic. The inception of the Potoroo regime was marked by: 1) the change from continental extension to sea floor spreading between Australia and Antarctica; 2) the demise of the Chilean-type magmatic arc in Eastern Australia by a change to Mariana-type subduction by back-arc spreading in the Southwest Pacific; and 3) the start of thermohaline circulation of the widening eastern Indian Ocean so that detrital deposition on the western margin was replaced by carbonate. In terms of the depositional record, the Potoroo regime is marked by thick quartzose sediment beneath the Ceduna Terrace of the Great Australian Bight, deposited at the marine terminus of a postulated centripetal drainage from the rising epeirogen of the Australian platform, in particular the Eastern Highlands, that emerged from the Mid-Cretaceous epeiric sea and outran the high global sea levels; other depocentres in the Otway, Bass, and Gippsland Basins flanked or lay within the Eastern Highlands. From the Paleocene, deposition onshore resumed in local sags between narrower uplifts, while off-shore thin carbonate became widespread. In the Neogene, plate convergence involving terrane accretion in the north led to thick detrital deposition in the foreland basin behind the orogen. The onshore record reflects the two morphotectonic phases of the Potoroo regime: 1) later Cretaceous recovery - denudation followed by deep chemical weathering of a high and smooth epeirogen that lacked sediment traps and 2) Cainozoic relaxation - slow deposition in depressions or sediment traps and weathering on the interfluves of a low but corrugated land surface. The view from the Quaternary is that the Phanerozoic Tasmanides will be superseded by the northern orogen as the dominant morphotectonic element of Australia. Key words: Cainozoic, Late Cretaceous recovery, Mid-Cretaceous tectonic climax.
of Carpentaria and Bass Strait) and the margins, marked in the north by the New Guinea Highlands and elsewhere by the present shoreline, which, approximating the hinge of the subsiding margins, is a tectonic boundary with a history stretching back to the Permian. The epeiric transgression of the shoreline in the Mid-Cretaceous and the subsequent peripheral transgressions provide datum-levels against which the vertical motions of the platform can be gauged.
INTRODUCTION This paper is amplified f r o m Phanerozoic Earth History of Australia (Veevers 1984) by the addition of new material including the geographical extension to the conjugate Antarctica (Veevers 1988), the position of the Cretaceous shorelines (Frakes et al 1987), the idea of the Mid-Cretaceous change of subduction style (Uyeda 1981) in the Southwest Pacific f r o m Chilean- to Mariana-type, and the recognition of the Cainozoic morphotectonics of the platform as a distinct part of the Potoroo regime. Veevers (1984, Fig. 52) divided the continental lithosphere of AustraliaNew Guinea into the emergent to shallowly submerged platform (the land surface and the shallow internal seas of the A r a f u r a Sea/Gulf
The Cainozoic history followed the complex of Mid-Cretaceous tectonic events that terminated the Innamincka regime and initiated the Potoroo regime. These events are interpretable as part of the climax of the second Phanerozoic tectonic-climatic super-
1
2
J.J. Veevers
cycle reflected by high sea level, intense magmatism, continental dispersion, and a greenhouse climate, all driven by mantle convection (Fischer 1984; Worsley et al 1986). The Potoroo regime is characterised by uplift, substantial in the Eastern Highlands, modest in the rest of the platform. In the postCenopianian later Cretaceous, the platform accumulated virtually no sediment, apparently not for lack of sources, but because stream gradients were such that the copious volume of sediment shed from the Eastern Highlands and the smaller amount from the rest of the platform were transported across the platform to be deposited on the periphery. The start of the Cainozoic marks a diminution or relaxation of regional uplift by the growth of sedimentary basins, such that the smaller volume of epiclastic sediment shed from the low platform began to be trapped in epicontinental basins in the eastern half of Australia. Accordingly, Australia developed from a later Cretaceous high-standing platform without deposition to a Cainozoic low-standing (relaxed) platform with slow deposition. The following sequence of reconstructions sets this distinct Cainozoic record within the Potoroo regime and its forebears. MID-CRETACEOUS CHANGE OF PLATE-TECTONIC REGIME From the Late Devonian (350 Ma) to MidCretaceous (Fig. la), a magmatic arc lay landward of a Chilean-type subduction zone (Uyeda 1981) along the convergent Pacific margin of Eastern Gondwanaland. From a fixed point in New Guinea, the arc and related subduction zone moved eastward through jumps in the Permian, Triassic, and Jurassic to reach its terminal Mid-Cretaceous position along the present Queensland coast, Lord Howe Rise, and New Zealand. At the same time, a spreading ridge between India and Australia-Antarctica had generated the early Indian Ocean since spreading started in the Valanginian (132 Ma) (Powell et al 1988). The South Pole was situated in the Ross Sea region of Antarctica. The change from the Innamincka regime to the Potoroo regime (Veevers
1984) was marked by: a) a change in the rate and pattern of plate divergence on the west (present-day coordinates) such that India moved northward behind a rapidly maturing Indian Ocean, the margins of which started accumulating carbonate following the establishment of a thermohaline circulation; b) a change in plate divergence pattern on the
Fig. 1 Mid-Cretaceous change of plate configuration from Chilean-type (a) to Mariana-type (b) subduction (Uyeda 1981) at the Southwest Pacific margin. Continents indicated by present shoreline (full line) and continent-ocean boundary (broken line). Hollow arrows show relative plate motion in cm a , solid arrows absolute motion, from American Association of Petroleum Geologists (1981). LHR - Lord Howe Rise; NR - Norfolk Ridge; SEIR - Southeast Indian Ridge. -1
Mid-Cretaceous to Cainozoic tectonics south such that 360 km of Early Cretaceous continental extension in a 700 km wide riftvalley complex dominated at least in the east by coeval alkaline volcanic detritus (Gleadow & Duddy 1981) was replaced by seafloor spreading from the Southeast Indian Ridge (SEIR); and c) Chilean-type subduction on the east was replaced by Mariana-type subduction entailing back-arc spreading (stipple in Fig. lb) between Australia and Lord Howe Rise/ Norfolk Ridge/New Zealand, marked initially in coastal SE Australia by Mid-Cretaceous alkaline volcanics, such that by today the magmatic arc and related subduction zone have migrated from a hinge in New Guinea by as much as 3000 km from Australia. Eastern Australia is now distant from the plate margin, and the modern volcanic centres in the Western District of Victoria and the McBride Province of Queensland are platecentre types. As a result of faster spreading from the SEIR with respect to a fixed Antarctica, Australia (now the eastern part of the IndoAustralia plate) migrated into lower latitudes by the consumption of oceanic lithosphere beneath the Sunda Arc of Sumatra and Java. The northern edge of Australia in New Guinea and Timor is now rimmed with a diachronous orogen in front of the foreland basin of southern New Guinea-Arafura Sea and the Timor Trough-Sahul Shelf (Powell & Johnson 1980). On the southern margin of Australia, the Southeast Indian Ocean had widened sufficiently by the Early Cainozoic to generate its own circulation and, in the virtual lack of detrital sediment from the platform, was dominated by carbonate. By the Oligocene (35 Ma) the oceanic gap between the transformfaulted western margin of Tasmania/South Tasman Rise and Antarctica was wide enough to allow the passage of the Circum-Antarctic Current which decoupled Antarctica from the warmer surface ocean waters to the north and led to the start of refrigeration. CENOMANIAN PALAEOGEOGRAPY As shown in Figure 2, the change in platetectonic regime in the Cenomanian (91-97.5
3
Ma) was accompanied by: 1) the retreat of the Aptian-Albian epeiric sea to the periphery, including a narrow seaway along the newly formed southern margin; 2) the start of intense uplift and denudation along the newly formed eastern margin, as indicated by apatite fission-track ages and palaeomagnetic overprints in Southeastern Australia, and by rapid accumulation of volcanic detritus (Winton Formation) shed up to 1500 km from the terminal Chilean-type arc along the Queensland coast, with volcanic and plutonic rocks no
Fig. 2 Palaeogeographical data for the Australian region up to the Mid-Cretaceous (Cenomanian, 96 Ma), including: the Cenomanian shoreline (heavy line) and preceding Aptian epeiric sea shoreline (line with dots) (Frakes et al 1987); the preserved extent of the Winton Formation (circles), volcanics and volcanogenic sediment (Veevers 1984); rift-valley complex along the Australian-Antarctic suture (Veevers 1987), including in situ Aptian nonmarine sediment in Antarctica (Domack et al 1980) apatite fission-track ages (Morley et al 1981, Moore et al 1986) and palaeomagnetic overprint ages (Schmidt & Embleton 1981; Sharpies & Klootwijk 1981) in Southeast Australia, and volcanics on the Lord Howe Rise (LHR) (McDougall & van der Lingen 1974). Coordinates refer to present Australia. NZ - New Zealand; VL - Victoria Land Basin (Cooper & Davey 1985).
4 J.J. Veevers younger than 110 Ma and, northward in New Guinea, by the 91-97 Ma Mount Victor Granodiorite (Page 1976); 3) by the replacement of volcanic detritus in the southeastern rift-valley complex by quartzose sediment along the newly formed continental margin; and 4) the onset of carbonate deposition in the basins of the western margin that faced a mature Indian Ocean. Figure 3, a palaeogeographical interpretation of these data, shows the inception of centripetal drainage from the juvenile Eastern Highlands and Transantarctic Mountains through the proximal platform deposition of the Winton Formation to the distal basins of the ancestral Australian Antarctic depression including the Ceduna depocentre (CD).
Fig. 3 Interpreted Cenomanian palaeogeography, from Veevers (1984, Fig. 147D). Retreat of the epeiric sea during general uplift of the platform and marked uplift and denudation of the eastern margin to establish centripetal drainage into the AustraliaAntarctic depression. Line with squares marks axis of magnetic trough (Veevers 1987). CD - Ceduna depocentre; E- Eur oka arch; VL - Victoria Land Basin (Cooper & Davey 1985).
LATER CRETACEOUS PALAEOGEOGRAPY Detrital quartzose deposition (with the possible exception of the poorly-dated 50m-thick Mount Howie Sandstone) was peripheral in the marine basins of the Ceduna depocentre and Otway Basin and non-marine intramontane Bass Basin and Gippsland Basin, whose eastern edge was lapped by the sea (Fig. 4). The copious sediment supplied by the denudation of the Eastern Highlands, indicated by apatite fission-track dates and magnetic overprints, was transported across the platform - the area of former deposition of the Winton Formation now became one of sediment transport - to be deposited in the Ceduna depocentre without loss en route. According to M.A.J. Williams (pers. comm., 1987) the Ethiopian Highlands are a modern example of such a copious sediment supply
Fig. 4 Interpreted later Cretaceous (Campanian, 80 Ma) palaeogeography, from Veevers (1984, Fig. 147F). Mount Howie Sandstone shown by dots and palaeoslope by arrow (Wopfner 1963; Forbes 1972). Shoreline in eastern Gippsland from Frakes et al (1987). Juvenile Southeast Indian Ocean from Veevers (1987). B - Bass Basin; G - Gippsland Basin; O - Otway Basin.
Mid-Cretaceous to Cainozoic tectonics
connected to a copious depocentre (the Nile Delta and Cone) by a river (the Nile) with very little retained sediment. Whatever the precise conditions that led to the complete transport of sediment across the platform in the later Cretaceous, they were succeeded towards the end of the Cretaceous by intense chemical weathering to produce the thick kaolinised, ferruginised, mottled and silicified Morney Profile (Day et al 1983) on the Cenomanian to Early Cretaceous substrate, and then in the Paleocene by the accumulation of sediment. CAINOZOIC PALAEOGEOGRAPY In the Paleocene, a much reduced supply of detrital sediment from the presumably lower and narrower Eastern Highlands started to accumulate within the Eastern Highlands themselves, as in the Mount Royal Range (Martin et al 1987) and in the broad depressions between the Eastern Highlands and the newly risen South Australian Highlands; sediment started to accumulate in Central Australia also, as between the inselbergs of the Olgas and Uluru (Ayers Rock) (Twidale & Harris 1977) but, so far as is known, not in the western half of the platform. By the end of the Eocene (Fig. 5), a discontinuous sheet of fluvial and lacustrine sediment had accumulated in the internal drainage basin of the Central-eastern Lowlands and in the external Murray and Karumba Basins, as well as within the Eastern Highlands in the large Bass and Gippsland Basins and in pockets farther north, including the Eocene oil-shale deposits at Condor, Duaringa, and Rundle in Queensland (Wilford 1981). Basalt flows were scattered along the Eastern Highlands. The only extensive non-marine deposit in the western half of Australia is that behind the only extensive transgression of the Eocene shoreline in southwestern Western Australia. By magnetic anomaly A13, the Southeast Indian Ocean had widened between the South Tasman Rise and Antarctica sufficiently for the Circum-Antarctic Current to start flowing, thereby insulating Antarctica from the
5
rest of the world ocean and leading to its refrigeration.
Fig. 5 Interpreted latest Eocene palaeogeography, from Veevers (1984, Fig. 147H). Opening of the Southeast Indian Ocean to A13 (35 Ma), from Veevers (1988). C - Condor; CEL - Central-eastern Lowlands; D - Duaringa; K - Karumba Basin; M - Murray Basin; O-U - Olgas, Uluru; MR - Mount Royal; R - Rundle; SAH - South Australian highlands; STR - South Tasman Rise.
PRESENT MORPHOLOGY With allowance for the environmental vagaries of the Quaternary (Williams 1984), the present morphology of the platform (Fig. 6) is little changed from that of the older Cainozoic. The only novelty is the northern orogen and foreland basin of the Timor Trough/Sahul Shelf and southern New Guinea/Arafura Sea. According to Pigram and Davies (1987), the New Guinea orogen formed during the Late
6
J.J. Veevers
Oligocene (25 Ma) to the Late Miocene (10 Ma) during collision of Australia with the Sunda trench and the docking of continental and oceanic terranes against the craton margin. Collision of the recessed northwestern part of the continental margin with the Sunda trench was later, in the Pliocene (3.5 Ma), and involved the thrusting over Timor of a 5 km thick set of thrust slices from the basement of the Banda arc (Audley-Charles 1986), subsequently pierced by shale diapirs (Barber et al 1986). For the rest, the division of the platform into the Great Western Plateau, the Central-eastern Lowlands (comprising the internal drainage of the Lake Eyre basin and the external Murray-Darling basin), and the Eastern Highlands, split by Bass Strait, follows the morphotectonic plan that came into operation in the Paleocene.
Fig. 6 Observed Quaternary geography. Drainage divides, elevation and volcanics, from D'Addario (1979a, b). BS - Bass Strait; CEL - Central-eastern Lowlands; EH - Eastern Highlands; GBR - Great Barrier Reef; GC - Gulf of Carpentaria; GWP Great Western Plateau; NGH - New Guinea Highlands; NWS - Northwest Shelf; SAH - South Australian Highlands; TaT - Tanimbar Trough; TiT - Timor Trough.
SEDIMENT THICKNESS
That the Cenozoic was the relaxed phase of the Potoroo regime is shown by the sediment isopachs, with intervals of 0.1, 0.5, and whole kilometres (Fig. 7a). The sediment onshore is very thin - a maximum thickness little more than 0.4 km, equivalent to a volume of 0.09 x 10 km , in the Murray Basin, and for the western three-fifths, little more than 0.2 km in pockets only except the 0.3 km in the Eucla region. The sump of Lake Eyre has only 0.09 6
3
Fig. 7 Sediment thickness (km) and volume (10 km ), shown by cubes, and location of cumulative subsidence diagrams of Fig. 8. a) Cainozoic: onshore (and distribution, except in New Guinea, of volcanics) from D'Addario (1979a), offshore from Veevers (1984, Fig. 150). E - Eucla. b) Late Cretaceous on the southern margin, from Veevers (1984, Fig. 147C and E). 6
3
Mid-Cretaceous to Cainozoic tectonics km of sediment and the Innamincka depocentre 0.02 x 10⁶ km 3 . Offshore thicknesses are of the same order except for a prograding wedge of carbonate off the Northwest Shelf that attains 3 km, fills of 2 km in the Otway, Bass, and Gippsland Basins, and a lens 1.5 km thick off the southeast margin. Except in the northern orogenic margin, sediment starvation, in particular of detrital sediment, is extreme. On the southern margin, the change from the Late Cretaceous (Fig. 7b), a time interval only half as long as the Cainozoic, is striking. The Ceduna depocentre accumulated 0.5 x 10⁶ km 3 of detrital sediment in the Late Cretaceous, compared with much less than a tenth of this amount of detrital sediment in the Cainozoic (most of the Cainozoic sediment is carbonate). The Late Cretaceous volume in the Otway Basin is twice that of the Cainozoic, and those of the Bass Strait basins much the same, though the high proportion of carbonate in the Cainozoic indicates continuing starvation of detrital sediment. As along the southern margin (Mutter et al 1985) and in a north-south transect across southern-central Australia (Fig. 8), the rates of sediment accumulation and tectonic subsidence of the Late Cretaceous are themselves a decline from those of the Albian-Cenomanian except in the Ceduna depocentre, which constituted the sump of the Late Cretaceous platform. On the southern margin, as a Potoroo-1 (Fig. 8b), subsidence was rapid during the mainly Early Cretaceous phase of continental extension, and decelerated from breakup in the Mid-Cretaceous (96 Ma) to a rate attributable to thermal contraction of the oceanic lithosphere. Onshore in the Innamincka area (Fig. 8a), rapid Cenomanian basement subsidence, amplified by a rising sea level, was overtaken by the thick fill of the Winton Formation and by regional uplift of the platform so that the epeiric shoreline of the Late Albian regressed some 2000 km to the periphery during the Cenomanian. It was this uplift, in particular that which formed the Eastern Highlands, that generated the epiclastic sediment that loaded the greatly extended crust of the Ceduna sump (Fig. 8c),
7
giving rise to the very rapid accumulation rate of nearly 300 m/Ma throughout the entire Late Cretaceous phase of recovery. The orderof-magnitude decrease of accumulation rate in the Cainozoic to 30m/Ma marks the change from recovery to relaxation, expressed by (a) a general lowering of the platform and in particular a lowering and narrowing of the Eastern Highlands, modulated during the Cainozoic by 2nd-order pulses of tectonic activity (Grimes 1980; Jones & Veevers 1982, 1983), and hence a reduced supply of epiclastic sediment, and (b) a corrugation of the platform, in particular the intermittent uplift of the South Australian Highlands across the centripetal drainage from the Eastern Highlands, and hence the trapping of sediment in the Murray and Lake Eyre Basins and the starvation downstream of the former sump. Factor (a) led to an accumulation of Cainozoic epiclastic sediment in the intramontane Bass Basin less than half that of the Late Cretaceous. The present starvation of the land-locked Bass Basin is emphasised by its depth of 80 m below sea level compared with Cretaceous to Mid-Eocene deposition above sea level.
VERTICAL MOTION IN THE LATE CRETACEOUS AND CAINOZOIC The shoreline of the Aptian-Albian epeiric sea (Fig. 2) provides a unique continent-wide datum, parallel to the present sea level and estimated (Bond 1979; Watts & Steckler 1979) to be 75 m above it, against which vertical motions since the Aptian-Albian may be gauged, as Wellman (1987) outlined for Eastern Australia. The contours in Figure 9 show the displacement from the present land surface or seafloor of the outcrop or subcrop of the earliest Aptian shoreline, as indicated by the boundary in the stratigraphical succession between nonmarine and marine deposits. If, for example, the Aptian shoreline with an estimated original elevation of + 75 m has a present elevation of + 300 m, then the net vertical motion at this spot since the AptianAlbian would be 3 0 0 - 7 5 = +225 m. If an
8
J.J. Veevers
Fig 8 Cumulative subsidence diagrams on a north-south traverse across Central Australia, located on Fig. 7. Time scale from Berggren et al (1985) and Kent & Gradstein (1985). Sea level curve from Watts and Steckler (1979), as modified by Veevers (1984, Fig. 135). a) Innamincka area of the Eromanga Basin and succeeding Cainozoic depocentre, modified by Veevers (1984, Fig. 144). (i) Land surface modified from Veevers (1984, Fig. 135), age and present compacted thickness of formations from Wopfner et al (1974, Fig. 9) and Exon & Senior (1976, Fig. 3). (ii) Net vertical motion (m) since 144, 103, 91, 80, and 20 Ma. (iii) Net vertical motion (m) between ages above, (iv) Rate of vertical motion (m/Ma) during age intervals. Full line is total motion (tectonic motion and isostatic sediment loading), broken line is tectonic motion, neglecting water loading during Aptian-Albian, equal to one-third of total motion. b) Potoroo-1 on the hinge of the Great Australian Bight Basin, (i) Age and present compacted thickness of formations from Fraser and Tilbury (1979). Cf. diagram using decompacted thickness (Mutter et al 1985, Fig. 9). (ii) Net vertical motion (m) since 124, 107, and 92 Ma. (iii) Net vertical motion (m) between ages above, (iv) Rates of vertical motion m/Ma) during age intervals, as in a) except tectonic motion (taking into account water loading) equal to two-thirds of total motion. c) Ceduna depocentre. (i) Age and present compacted thickness (km, reduced tenfold from scale of a and b), from geophysical, mainly seismic, estimates (Fraser & Tilbury 1979, modified from Boeuf & Doust 1975). (ii) Net vertical motion (km) since 144, 95, and 66 Ma. (iii) Net vertical motion (km) between ages above, (iv) Rates of vertical motion (m/Ma) during age intervals, as in b).
Mid-Cretaceous to Cainozoic tectonics
9
(i) errors of measurement of the elevation of the datum, entailing negligible surveying errors in well-exposed or drilled intervals of the datum. The error in the vertical estimate of the motion is unrelated to that of mapping shorelines on a horizontal plane 'where postdepositional erosion has stripped back the marine rocks to a fraction of their original extension' (Frakes et al 1987).
Fig. 9 Net vertical motion (m) since the Albian (98 Ma). Area of net subsidence stippled. From Veevers (1984, Fig. 145). L - Laura Basin; M - Maryborough Basin; S - Styx Basin.
area now at + 100 m has an Aptian shoreline at - 4 0 0 m, the post-Aptian vertical motion would be - 4 0 0 - 75 = - 4 7 5 m. The greatest motion recorded onshore in Figure 9 is in the Innamincka area, where the subcrop of the Albian shallow marine Allaru Mudstone is at -1150 m (Fig. 8a), indicating a subsequent net vertical motion of - 1250 m since its deposition near sea level then at +100 m, most of it accomplished during the Cenomanian. The precision of the measurements is estimated thus. The datum is the boundary between nonmarine and marine sediments dated as earliest Aptian, at the base of the Cyclosporites hughesii spore-pollen zone (Frakes et al 1987). In the Eromanga Basin (Fig. 8a), this is the boundary between the Cadna-Owie and Wallumbilla Formations at the change in the earliest Aptian from dominantly nonmarine to marine deposition, which lasted to the latest Albian. Earliest Aptian is estimated as 119 ± 4 Ma (Harland et al 1982, p.48). Uncertainties of the vertical motions are compounds of:
(ii) errors in the estimate of past sea level. The estimated + 75 m earliest Aptian sea level is derived from Watts and Steckler's (1979) analysis of wells along the US Atlantic margin as calibrated by Bond's (1979) analysis of changes in continental hypsometry and marine flooding. From a study of the geometry of sediment bodies within passive margins, Haq et al (1987) estimated it at +135 m. The difference of 60 m is a measure of the uncertainty in calibration or a zero-error, and affects measurements within Australia by an equal amount. (iii) errors in the estimate of past water depths affect the estimate of vertical motion of surfaces of deposition below sea level, as for example that of the Albian Allaru Formation (Fig. 8a). Haig (1979) found that benthonic foraminiferids from the Queensland Cretaceous belong mainly to the Ammobaculites association, which indicates uniformly shallow water of the epeiric sea; deeper-water (ca 100-200 m) benthonic foraminiferids are restricted to the Cape York Peninsula. In Figure 8a, I show the estimated depth of deposition of the base of the Allaru Formation as 50 m; from a possible depth range of 0-100 m, the error is ± 50 m. In summary, the present elevations of the earliest Aptian datum plane are known within narrow limits of error; and the contemporary earliest Aptian shoreline has a zero-error of 60 m. This means that the contour values shown in Figure 9 have an estimated error of c. ± 50 m; Figures 10 and 11 deal with Cainozoic motions, entailing a smaller zeroerror, so that the errors are smaller. Average error bands about the contours are accordingly 100 km wide in Figure 9 and narrower in
10
J.J. Veevers
Figure 10. The measurements are as valid in the orogenic terrain of New Guinea, which developed 4000 m of structural relief since the deposition of shallow marine carbonate in the
Fig. 10 Vertical motion (m) in the Cainozoic, detailed for the Lake Eyre and Murray Basins in Figure 11. Heavy inclined letters indicate vertical motion since the Middle Miocene (<Ma), light letters during indicated intervals. Miocene shoreline (+ 20 m) shown by lines of open circles. C - Carandotta; RD - Rockhampton Downs; RoD - Roxborough Downs; WM - White Mountain. | Camp | Maas | Paleo ] Ma
8 0
Eocene
6,0
| Oligocene |
7 surfsice
LAKE
>75^
>135 \ Ev're
40"IT" " 6 0
BASIN
I
>53Il-:•!.•_• L ! 2 o >100v_,_ [65 . f>35 41} 35j,Etadunna _ g 0 +
(b)
MURRAY
/
-
11 |q o
EYRE
j ! +75
i' + 110
>210 -100
Miocene 20
4,0 (a)
sea level
200 — Buccleuch
.J
5 160 I —
BASIN
i?<100 -80*— Ouddo
-200 -300 -400
Fig. 11 Subsidence (m) since the Late Cretaceous, Eocene and Middle Miocene in the Lake Eyre (a) and Murray (b) Basins. Sea level curve from Watts and Steckler (1979). Broad arrows indicate total subsidence since a given age, thin arrows subsidence during intermediate age interval.
Middle Miocene (Fig. 10), as in the epeirogenic terrain of the platform. The indicated motions (Fig. 9), derived mainly from the area of Aptian flooding, show a broad area of net subsidence about the western and southern coastlines and in New Guinea, and a deep reentrant that passes through the Gulf of Carpentaria southward across the Euroka Arch to the Central-eastern Lowlands of the Innamincka area and then divides on either side of the South Australian Highlands into the Murray Basin on the east and the Eucla region on the west. The area of net uplift of the Eastern Highlands is limited to the northeast by the record of an Albian shoreline near present sea level in the Laura Basin (Day 1976) and Styx Basin (de Jersey 1960), and of an Aptian shoreline in the Maryborough Basin (Ellis 1976). The major uplift of the South-eastern Highlands ( + 2000 m) is indicated by fission-track (Morley et al 1981; Moore et al 1986) and magnetic-overprint (Schmidt & Embleton 1981) ages of material within the coastal part of the highland tract itself. As to be expected, the subsidence of the margin since the Albian is much greater. Deposition during the Albian in the Gippsland, Otway, and Bass Basins was in a nonmarine, probably fluvial and lacustrine environment, and hence probably above sea level, so that the minimum subsidence since the Albian is measured by the thickness of the overlying sediments, which reaches 4000 m in the Otway, and 2000 m in the Bass and Gippsland Basins. Other parts of the margin registered similarly large subsidences, characteristic of the downward mobility of the margin. The great subsidence of the Ceduna depocentre is attributable to its situation at the intersection of the east-west trending margin and the north- to northeast-trending AustralianAntarctic Depression, which extends landward into the Innamincka depocentre, and corresponds today with a negative free-air gravity anomaly, interpreted as indicating the dynamic influence of anomalously cool asthenosphere that rises slower than elsewhere (Veevers 1988).
Mid-Cretaceous to Cainozoic tectonics VERTICAL MOTION IN THE CAINOZOIC As suggested already, the greater part of the post-Albian subsidence was effected during Late Cretaceous recovery to leave only a small residue during Cainozoic relaxation, except on the northern margin (Fig. 10). The vertical motion of those parts of the periphery covered by the sea in the Eocene or Miocene is found by the difference between the present elevation or depth of the shallow marine Cainozoic sediment and the Eocene shoreline at + 75 m or the Miocene shoreline at +20 m, as estimated by Bond (1979) and Watts and Steckler (1979). For example, the shallow marine Late Eocene sediment in the southwest now has an elevation of + 250 m, so that net upward tilt since the Eocene is 175 m; shallow marine limestone in the Gippsland Basin is at -300 m today, indicating subsequent subsidence of this amount, but onshore the limestone has been uplifted locally to +300 m onshore. In Northern Australia, outliers of marl, siltstone, and chert at White Mountain (elevation 275 m), and limestone at Rockhampton Downs (220 m), and Carandotta and Roxborough Downs (150 m) (Fig. 10) contain foraminiferids no older than Miocene (Lloyd 1968a,b). The exclusively marine foraminiferids are associated with a nonmarine freshwater biota. Lloyd (1968a) argued that the foraminiferids were introduced to these areas by a marine incursion into coastal lakes during the Miocene, and that the land has since been uplifted to its present elevation, as shown in Figure 10. Lloyd (1968a) regarded as most unlikely the possibility that the foraminiferids were introduced by birds or wind into a brackish lake. The shape of the presumed shoreline is unknown, and Lloyd (1968a) sketched it conservatively as enclosing a narrow inlet from the NW, as shown in Figure 10, to which query marks have been added to signify the uncertainty about the nature of the body of water, whether marine or nonmarine. The near-parallel trend of the outliers and the New Guinea orogen and their similar age suggest a downwarp of the craton related to the distant orogen.
11
Subsidence in the Lake Eyre Basin that accumulated dominantly if not wholly nonmarine sediment during the Cainozoic is detailed in Figure 11a. The nonmarine deposition is assumed to have been in a basin open to the sea (unlike that today), justified by the absence of evaporites in the Eocene distal mud of the Eyre Formation and beneath Lake Torrens in an exoreic environment (Wopfner et al 1974), so that the Late Cretaceous surface, now at -100 m, must have been formed at an elevation above the coeval sea level of + 110 m, whence it has subsided 210 m, and similarly for the surface of the Eyre Formation (post-Eocene subsidence of 135 m) and of the Etadunna Formation (postmiddle Miocene subsidence of 35 m). Derived values are 75 m (35 m + 40 m) for the PaleoEocene, and 100 m (55 m +45 m) in the Oligo-Miocene, comprising 65 m in the Oligocene and 35 m (the thickness of the Etadunna Formation at Lake Eyre) in the Miocene. The later Cainozoic values lie within the error of measurement and hence are insignificant. The monospecific foraminiferid fauna recently discovered by Lindsay (1987) in drill-core of the Etadunna Formation near Lake Palankarinna, 100 km E of Lake Eyre, is attributed to transport from the sea by attachment to birds and not by a marine incursion. The foraminiferid indicates an older (Late Oligocene) age than previously assigned (Middle Miocene). In the Murray Basin (Fig. lib), the land surface exposed in the Late Cretaceous, now at -500 m, indicates subsidence >610 m, and shallow marine deposits - the Late Eocene Buccleuch Beds at -200 m and the Miocene Duddo Limestone at -80 m - indicate postEocene subsidence of slightly less than 275 m, depending on the palaeobathymetry, and post-Miocene subsidence of < 100 m. Derived motions are 335 m for the Paleocene-Early Eocene, and < 175m for the Oligo-Miocene, matching the 160 m thickness of the shallow marine sediments of this age in the Renmark area. Symptomatic of the relaxed state of the Cainozoic, the vertical motions are very small
12
J.J. Veevers
except those of the northern coupled orogen/ foredeep. The maximum differential motion since the Middle Miocene (10 Ma) of 6000 m in Timor and 4000 m in New Guinea overshadows the 630 m in the Otway Basin and a barely measurable subsidence at Lake Eyre. Today, as during the rest of the Cainozoic, relaxation of the platform is almost total. SUMMARY AND DISCUSSION (i) The Mid-Cretaceous tectonic climax in the Australian region was followed by the Potoroo regime of Late Cretaceous recovery and Cainozoic relaxation. (ii) Except the Neogene convergent plate interaction on the northern margin in Timor and New Guinea ('guerilla war'), Cainozoic Australia has entered a long era of 'peace' after the 'decisive battle' fought in the MidCretaceous and its after-effects in the Late Cretaceous 'postwar reconstruction'. (iii) Until the Southwest Pacific back-arc basins close to Australia by a return from Mariana- to Chilean-type subduction, the influence of the Eastern Highlands will become increasingly overborne by that of the expanding Northern Highlands in Timor and New Guinea to impose a new regime on Australia. The decisive event will be the strikeslip amalgamation 10 Ma hence (-10 Ma) of Northwestern Australia and the leading edge
of continental Eurasia in Java and composite terranes such as Sulawesi (Fig. 12). In this scenario, the northwest orogen will replace the Phanerozoic Tasmanides and Eastern Highlands as the dominant morphotectonic element in Australian geology. ACKNOWLEDGEMENTS M. Bradshaw, L.A. Frakes, and G.E. Wilford are thanked for their critical comments, and G.E. Wilford for supplying a reference. This work was supported by the Australian Research Grants Committee. REFERENCE
AMERICAN ASSOCIATION OF PETROLEUM
GEOLOGISTS 1981. Plate-tectonic map of the Circum-Pacific Region, Southwest Quadrant,
1:10,000,000. Tulsa, Oklahoma. AUDLEY-CHARLES M.G. 1986. Timor Tanimbar Trough: the foreland basin of the evolving
Banda orogen. International Association of Sedimentologists Special Publication 8, 91-102.
BARBER A.J., TJOKROSAPOETRO S. & CHARLTON T.R. 1986. Mud volcanoes, shale diapirs, wrench faults, and melanges in accretionary complexes, Eastern Indonesia. American Association of Petroleum Geologists Bulletin 70, 1729-1741. BERGGREN W.A., KENT D.V., FLYNN J.J. & van COUVERING J.A. 1985. Cainozoic geochronology. Geological Society ofAmerica Bulletin 96, 1407-1418. BOEUF M.G. & DOUST H. 1975. Structure and development of the southern margin of Australia.
Australian Petroleum Exploration Association Journal 15, 33-43.
BOND G. 1979. Evidence for some uplifts of large magnitude in continental platforms.
Tectonophysics 16, 285-305.
Fig. 12 Interpreted palaeogeography in the later Quaternary (-10 Ma) (broken lines) superimposed on 0 Ma map (Fig. lb) by extrapolation of vectors of present absolute motion.
COOPER A.K. & DAVEY F.J. 1985. Episodic rifting of Phanerozoic rocks in the Victoria Land Basin, western Ross Sea, Antarctica. Science 229, 1085-1087.
D'ADDARIO G.W. 1979a. Cainozoic cover and weathering, 1:10,000,000, BMR Earth Science
Atlas. Bureau of Mineral Resources, Geology & Geophysics, Canberra.
Mid-Cretaceous to Cainozoic tectonics D'ADDARIO G.W. 1979b. Surface drainage, 1:10,000,000, BMR Earth Science Atlas. Bureau of Mineral Resources, Geology & Geophysics, Canberra. DAY R.W. 1976. Laura Basin. Australasian Institute of Mining & Metallurgy Monograph Series 7 (3), 443-446. DAY R.W., WHITAKER W.G., MURRAY C.G., WILSON I.H. & GRIMES K.G. 1983. Queensland Geology. Geological Survey of Queensland Publication 383, 194 pp. de JERSEY N.J. 1960. The Styx Coal Measures. Journal of the Geological Society of Australia 7, 330-333. DOMACK E.W., FAIRCHILD W.W. & ANDERSON J.B. 1980. Lower Cretaceous sediment from the East Antarctic continental shelf. Nature 287, 625-626. ELLIS P.L. 1976. Maryborough Basin. Australasian Institute of Mining & Metallurgy Monograph Series 7 (3), 447-450. EXON N.F. & SENIOR B.R. 1976. The Cretaceous of the Eromanga and Surat Basins. Journal of Australian Geology & Geophysics 1, 33-50. FISCHER A.G. 1984. The two Phanerozoic supercycles. In Berggren W.A. and van Couvering J.A. eds. Catastrophes and Earth History, pp. 129-150. Princeton University Press, Princeton. FORBES B.G. 1972. Possible post-Winton Mesozoic rocks north east of Marree, South Australia. Geological Survey of South Australia, Quarterly Geological Notes 41, 1-3. FRAKES L.A. and 21 co-authors 1987. Australian Cretaceous shorelines stage by stage. Palaeogeography, Palaeoclimatology, Palaeoecology 59, 31-48. FRASER A.R. & TILBURY L.A. 1979. Structure and stratigraphy of the Ceduna Terrace region, Great Australian Bight Basin. Australian Petroleum Exploration Association Journal 19, 53-65. GLEADOW A.J.W. & DUDDY I.R. 1981. Early Cretaceous volcanism and the early breakup history of southeastern Australia: evidence from fission track dating of volcaniclastic sediments. In Cresswell M.M. and Vella P. eds. Gondwana Five, pp.283-287. Balkema, Rotterdam. GRIMES K.G. 1980. The Tertiary geology of north Queensland. In Henderson R.A. and Stephenson P.J. eds. The Geology and Geophysics of Northeastern Australia, pp. 329-347. Geological Society of Australia, Queensland Division, Brisbane.
13
HAIG D.W. 1979. Cretaceous foraminiferal biostratigraphy of Queensland. Alcheringa 3, 171-187. HAQ B.U., HARDENBOL J & VAIL P.R. 1987. Chronology of fluctuating sea levels since the Triassic. Science 235, 1156-1167. HARLAND W.B., COX A.V., LLEWELLYN P.G., PICKTON C.A.G., SMITH A.G. & WALTERS R. 1982. A Geologic Time Scale. Cambridge University Press, Cambridge, 131pp. JONES J.G. & VEEVERS J.J. 1982. A Cainozoic history of Australia's Southeast Highlands. Journal of the Geological Society of Australia 29, 1-12. JONES J.G. & VEEVERS J.J. 1983. Mesozoic origins and antecedents of Australia's Eastern Highlands. Journal of the Geological Society of Australia 30, 305-322. KENT D.V. & GRADSTEIN F.M. 1985. A Cretaceous and Jurassic geochronology. Geological Society of America Bulletin 96, 1419-1427. LINDSAY J.M. 1987. Age and habitat of a monospecific foraminiferal fauna from near-type Etadunna Formation, Lake Palankarinna, Lake Eyre Basin. South Australian Department of Mines and Energy Report Book 87/93. LLOYD A.R. 1968a. Possible Miocene marine transgression in northern Australia. Bureau of Mineral Resources, Geology & Geophysics, Australia, Bulletin 80, 85-103. LLOYD A.R. 1968b. Outline of the Tertiary geology of northern Australia. Bureau of Mineral Resources, Geology & Geophysics, Australia, Bulletin 80, 105-132. MARTIN H.A., WORRALL L. & CHALSON J. 1987. The first occurrence of the Paleocene Lygistepollenites balmei zone in the Eastern Highlands region, New South Wales. Australian Journal of Earth Sciences 34, 359-365. McDOUGALL I. & van der LINGEN G.J. 1974. Age of the rhyolites of the Lord Howe Rise and the evolution of the southwest Pacific Ocean. Earth & Planetary Science Letters 21, 117-126. MOORE M.E., GLEADOW A.J.W. & LOVERING J.F. 1986. Thermal evolution of rifted continental margins: new evidence from fission tracks in basement apatites from southern Australia. Earth & Planetary Science Letters 78, 255-270. MORLEY M.E., GLEADOW A.J.W. & LOVERING J.F. 1981. Evolution of the Tasman Rift: Apatite fission track dating evidence from the southeastern Australian continental margin. In Cresswell M.M. and Vella P. eds. Gondwana Five, pp.289-293. Balkema, Rotterdam.
14
J.J. Veevers
MUTTER J.C., HEGARTY K.A., CANDE S.C. & WEISSEL J.K. 1985. Breakup between Australia and Antarctica: a brief review in light of new data. Tectonophysics 114, 255-279. PAGE R.W. 1976. Geochronology of igneous and metamorphic rocks in the New Guinea Highlands. Bureau of Mineral Resources, Geology and Geophysics, Australia, Bulletin 162. PIGRAM C.J. & DAVIES H.L. 1987. Terranes and the accretion history of the New Guinea orogen. Bureau of Mineral Resources Journal of Australian Geology & Geophysics 10, 193-211. POWELL C.McA. & JOHNSON B.D. 1980. Constraints on the Cainozoic position of Sundaland. Tectonophysics 63, 91-109. POWELL C.McA., ROOTS S.R. & VEEVERS J.J. 1988. Pre-breakup continental extension in East Gondwanaland and the early opening of the Eastern Indian Ocean. In Scotese C.R. and Sager W. eds. Mesozoic and Cainozoic Plate Reconstructions. Tectonophysics 155, 261-283. SCHMIDT P.W. & EMBLETON B.J.J. 1981. Magnetic overprinting in southeastern Australia and the thermal history of its rifted margin. Journal of Geophysical Research 86, 3998-4008. SHARPLES C. & KLOOTWIJK C.T. 1981. Palaeomagnetic results from the Gordon Subgroup of Tasmania: further evidence for a Late Cretaceous magnetic overprint in southeastern Australia. Papers & Proceedings of the Royal Society of Tasmania 115, 85-91. TWIDALE C.R. & HARRIS W.D. 1977. The age of Ayers Rock and the Olgas, central Australia. Transactions of the Royal Society of South Australia 101, 45-50. UYEDA S. 1981. Subduction zones and back arc basins - a review. Geologische Rundschau 70, 552-569. VEEVERS J.J. ed. 1984. Phanerozoic Earth History of Australia. Clarendon, Oxford.
VEEVERS J.J. 1987. The conjugate margins of Antarctica (Wilkes Land) and Australia. Circum-Pacific Council for Energy and Mineral Resources, Earth Science Series 5A, 45-73. VEEVERS J. J. 1988. Earth history of the Southeast Indian Ocean and the conjugate margins of Australia and Antarctica. Journal and Proceedings of the Royal Society of New South Wales 120, 57-70. WATTS A.B. & STECKLER M.S. 1979. Subsidence and eustasy at the continent margin of eastern North America. In Talwani M., Hay W. and Ryan W.B.F. eds. Deep Drilling Results in the Atlantic Ocean: Continental Margins and Paleoenvironment, pp. 218-234. American Geophysical Union, Maurice Ewing Series 3. WELLMAN P. 1987. Eastern Highlands of Australia; their uplift and erosion. BMR Journal of Australian Geology & Geophysics 10, 277-286. WILFORD G.E. 1981. Petroleum and oil shale, 1:10,000,000, BMR Earth Science Atlas. Bureau of Mineral Resources, Geology & Geophysics, Canberra. WILLIAMS M.A.J. 1984. Quaternary environments. In Veevers J.J. ed. Phanerozoic Earth History of Australia, pp. 42-47. Clarendon, Oxford. WOPFNER H. 1963. Post-Winton Sediments of probable Upper Cretaceous age in the Central Great Artesian Basin. Transactions of the Royal Society of South Australia 86, 247-253. WOPFNER H., CALLEN R. & HARRIS W.K. 1974. The lower Tertiary Eyre Formation of the southwestern Great Artesian Basin. Journal of the Geological Society of Australia 21, 17-51. WORSLEY T.R., NANCE R.D. & MOODY J.B. 1986. Tectonic cycles and the history of the earth's biogeochemical and paleoceanographic record. Paleoceanography 1, 233-263.
Cainozoic volcanism, Eastern Australia: a predictive model based on migration over multiple 'hotspot' magma sources F.L. SUTHERLAND Division of Earth Sciences, The Australian Museum, G.P.O. Box A285, Sydney, iVSJF 2000, Australia. The 3,700 km eastern Australian Cainozoic volcanic belt has many models. Plate migration over rift upwellings proposed here gives a unified model with predictive patterns. Three migratory frameworks are tested: movement relative to bounding sea floor events; motion using a preferred Apparent Polar Wander Path (APWP); and assigned absolute motions. A migratory felsic phase (<34 Ma) separates precursor and subsequent basaltic activity, but some felsic centres found throughout the last 75 Ma suggest similar overall origin. Precursor basalts, using relative and preferred APWP motions, can be generated from 65-95 Ma Tasman - Coral Sea rift lines. Tholeiitic felsic activity within prevalent alkali basalt activity follows the main Tasman zone of rifting and thermal imprinting (Dampier Ridge segment). Tasman rift sources should exist between Tasmania and Antarctica. The Cato-Gippsland-Tasman Rise-South Tasman triple point sites are correlated with Southern Ocean ridge and Balleny Islands-Mt Melbourne-Mt Erebus hotspots and extended Southern Ocean transforms to passage over Tasman upwellings. The main felsic migration matches features of 65 Ma Coral Sea rift structures. The potential sources now lie across Tasmania and the west Tasman Sea. Subsequent basalts can be generated from rift floors and thermal events (<60 Ma) along the north Australian-Pacific plate margin. Younger basalt resurgence in the last 5 Ma is related to zones of tension developing over latent sources, the former probably stemming from adjustments in Pacific-Australian convergence. The migration model predicts future volcanism where sources and tensional fields coincide. Volcanic trails are discontinuous and controlled by stress fields, tectonic features and mantle processes. They show long term decrease in mantle melting southwards. Absolute motions assigned to southern Australian hotspots fail to reach and seem to negate a Coral Sea rift source. However, some 43-75 Ma felsic and sea mount lines diametrically oppose absolute motion trends, but match relative and preferred APWP models. Key words: Cainozoic, eastern Australia, hotspots, thermal rifts, volcanism.
INTRODUCTION The major basaltic belt along eastern Australia (10°-44°S, Fig. 1) was built up in phases of within-plate volcanism over the last 200 million years (Veevers 1984; Sutherland 1985; Duncan & McDougall 1989). The Cainozoic activity includes several lines of basaltic shields with felsic fractionates, numerous scattered basaltic lava fields and minor lines of leucititic centres (Wellman & McDougall 1974a). The precise controls on and origin of the volcanism are extensively debated in the literature (Table 1). The regional setting is shown in Figure 2.
Most models incorporate some migration of activity, particularly for shields with felsic centres. Migration south reflects northward motion of the Australian plate over fixed mantle magma sources. Authors generally place the magma sources in the asthenosphere as representing 'hotspot' volcanism, but differ on the dimensions of the individual sources. These range from broad zones and lines (over 500-1000 km across) to clusters or rows of discrete cells (up to 100 km across). Here hotspot 'cells' refer to magma sources with effects under 500 km, hotspot 'clusters' to groups of cells with effects between 5001000 km across, hotspot 'lines' for series of 15
16
F.L. Sutherland
5 0 0 km
limits of felsic and ieucititic activity
QUEENSLAND
NEW SOUTH WALES
Post-Miocene basaltic episodes
Pre-Pliocene basaltic episodes
TASMANIA
Mofic/feljic Of leucilite episodes
Fig. 1 Generalised distribution of Cainozoic volcanic regions, eastern Australia, showing older and younger basalt fields and felsic fields. Arc-like insets; major felsic/basalt fields (modified from Harrington & Korsch 1985) and all basalt fields (solid lines). Volcanic regions (numbered) largely follow previous usage (Wellman & McDougall 1974a, b; Wellman 1974; Stephenson et al 1980; Sutherland & Wellman 1986). 1. Southeastern Tasmania, 2. Eastern Tasmania, 3. Tasmanian Western Midlands, 4. Tasmanian Central Plateau, 5. Northern Tasmania, 6. Northeastern Tasmania, 7. Northwestern Tasmania, 8. Bass Strait, 9. FHnders, 10. Thorpdale, 11. Gellibrand-Geelong, 12. Portland, 13. Straun, 14. Nerrim, 15. Aberfeldy, 16! Melbourne, 17. Bacchus Marsh, 18. Western Victorian younger basalts, 19. South Austrahan younger basalt, 20. Macedon, 21. Dookie-Euroa-Axedale, 22. Toombullup, 23. Howitt, 24. Bogong, 25. Gelantipy, 26. Bonang, 27. Uplands, 28. Monaro, 29. Moruya, 30. Nerriga, 31. Snowy, 32. MittagongWollongong, 33. Abercrombie South, 34. Abercrombie North, 35. Orange, 36. Condobolin-El CapitanByrock, 37. Blue Mountains, 38. Sydney, 39. Airly East, 40. Airly, 41. Dubbo, 42. Liverpool West 43. Liverpool East, 44. Barrington, 45. Comboyne, 46. Bunda Bunda, 47. Walcha, 48. Warrumbungle' 49! Nandewar, 50. Central, 51. Ebor-Dorrigo, 52. Doughboy, 53. Grafton, 54. Tweed, 55. Focal Peak' 56. South Main Range, 57. Ipswich, 58. Toowoomba, 59. Glass Houses-Maleny, 60. North Main Ranged 61. Bundaberg, 62. Gin Gin-Pialba, 63. Eraser Island, 64. Mitchell, 65. Buckland, 66. Bauhinia, 67. Monto', 68. Duringa, 69. Springsure, 70. Rockhampton, 71. Hoy, 72. Clermont, 73. East Clermont, 74. NeboMt St Martin, 75. Hillsborough, 76. Bogie River-Mt Dalrymple, 77. Mingella, 78. Nulla, 79. Sturgeon 80. Chudleigh, 81. McBride, 82. Mt Fox, 83. Wallaroo, 84. Atherton, 85. Almaden-Petford, 86. McLean! 87. Cooktown, 88. Silver Plains.
Cainozoic Volcanism and 'hotspot' magma sources AUTHORS (and dates) Vogt & Conolly 1971 Wellman & McDougall 1974a Sutherland 1978, 1981
BASALTIC-FELSIC BASALTIC LEUCITITIC FIELDS FIELDS FIELDS (central volcano (lava field (high K provinces) provinces) provinces) No clearly defined relationship to systematic Tasman sea mount trends Migration south by plate motion over asthenosphere magma source(s) Migration south by plate motion over multiple asthenosphere sources related to Coral Sea spreading
Migration westwards with band of tension along Eastern Highlands Mostly migration south by plate motion over multiple asthenosphere sources related to Tasman margin
Probably migration south by plate motion over an asthenosphere source related to Coral Sea spreading
Migration south, marking change to compressive stress field Migration south over linear asthenosphere magma source Migration south by plate motion over multiple, dying magma sources of Coral Sea spreading
Older activity related to earlier tensional stress field Random eruption, with some coinciding with linear source Largely migration south by plate motion over multiple magma sources of Tasman Sea spreading
Migration south over asthenosphere magma source Migration south by plate motion over dying magma sources related to Coral Sea spreading
Migration south, marking change to compressive stress field Migration south over fixed mantle sources
Related to episodes of uplift in the Eastern Highlands Westward migration over lateral thermal pulse from Tasman rifting
McDougall et al 1981 Pilger 1982 Wellman 1983 Sutherland 1983, 1985
Veevers 1984 Karner & Weissel 1984 Middlemost 1985
Harrington & Korsch 1985 Miyashiro 1986
Duncan & McDougall 1989; McDougall & Duncan 1988
Migration south by plate motion over asthenosphere degassing source giving vortexlike magmatism Arc-like emplacement, not easily correlated with migration south or astheno-sources Migrating south by plate motion passing out of a hot zone over a moving regional mantle upwelling Migration over broad stationary hot spot sources, related to onset of fast Southern Ocean opening
TASMAN SEA MOUNTS & ISLANDS (west chain) (east chain) Migration south by lithosphere motion over fixed mantle source
Probably migration south by plate motion over fixed mantle sources, with different ages between chains Migration south, with Lord Howe Island younger than equivalent Australian migration Possibly migration south, related to change in stress field East chain unrelated in age to Australian linear magma source Migration south by plate motion over dying magma sources of Coral Sea and D'Entrecasteau Basin spreading
Arc-like enclosures, differing in pattern to central volcano emplacement Eruption where plate overlies a hot zone over a moving mantle upwelling Problematic, but related to intraplate tensional stress
Migration over broad stationary hot spot sources
17
Migration over two separate stationary hot spot sources
Table 1: Origins ascribed to Cainozoic Volcanism, Eastern Australia-Tasman Sea
F.L. Sutherland
Cainozoic Volcanism and 'hotspot* magma sources
cells 1500-2500 km in length, and hotspot 'superstrings' for exceptionally elongate systems of cells over 2500 km long. The proposed model is based on rifts and spreading floors forming over a mantle upwelling or plume, as envisioned for some passive margins (Meissner & Kopnick 1988). These upwellings continue after spreading as hotspot systems, producing intermittent volcanism for tens of millions of years, but declining in their effects with time. This riftspreading-hotspot model updates previous versions (Sutherland 1978, 1981, 1983, 1985), but is based on considerably more radiometric dating. It considers criticisms of the earlier work and incorporates further petrological, geochemical and isotopic studies. One problem in relating this volcanism to hotspot sources is recognition of asthenospheric contributions. Mantle 'plume' components are assigned to some centres (McDonough et al 1985; Nelson et al 1986). However, basalt lava field activity is more enigmatic, as some coincides with established
19
migrations. Most workers consider it largely random and linked to rifting, uplift or metasomatic events along the eastern Australian margin (Wellman 1983; Menzies & Wass 1983; O'Reilly & Griffin 1984; Veevers 1984). A further view (Sutherland 1981, 1985) considers four orders of increased mantle melting, producing highly undersaturated, under saturated, saturated and intermediatesilicic episodes respectively, any of which may develop over a hotspot source. The assignment of basaltic fields to a migratory origin was criticised on: a) lack of evidence for hotspots south of Tasmania (Pilger 1982); and b) the variance in ages (2.73 Ma2) was near the variance (3.98 Ma2) for random ages (Wellman 1983). Apparent lack of hot spots south of Tasmania may reflect dying sources, as suggested for the felsic migratory centres, and compressive stress fields for the Australian plate since 10 Ma ago (Sutherland 1985). A nearrandom pattern may ensue from a series of sources over-run by plate motion along a
Fig. 2 Spreading floors of the Australasian - Southwest Pacific region (stippled regions) in relation to continental crust (blank), active margins (hatched lines), felsic volcano and sea mount migratory chains. Known initial ages of spreading rifts in Ma, and ridges and transform faults as double and single lines. Volcanic features related to spreading rift migrations include felsic-basaltic volcanoes (solid dots), basalt fields (crosses), olivine leucitite fields (enclosed solid centres), sea mounts and islands (open circles) and mantle (?) COz discharges (asterisk) with arc-like features from Figure 1 (curved lines). Relative migrations of 65 Ma Coral Sea - Louisiade and 36 Ma D'Entrecasteau Basin spreading rifts (12°SSW) and Southern New Zealand-Campbell Plateau centres are indicated by arrowed lines, with transcurrent movements (Alpine Fault-Southwest Pacific-Southern Ocean margin) by opposing arrows. Present projected locations of the Coral Sea-Tasman, D'Entrecasteau Basin, and New Zealand-Campbell Plateau spreading rifts and volcanic lines are outlined by dashed lines at ends of migratory arrows. Restoration of the Campbell Plateau hotspot line (AC, D-B, CR) relative to 12°SSW Australian Plate motion to 36 Ma position is shown by reversed dashed lines, then rotation and shifting (dotted arrowed lines) to allow for Northern New Zealand bending and late marginal opening (H-L). Featured Australian region structures includes South Bismark Basin (SB), Solomon Sea Basin (SS), Woodlark Basin (between SS and SE Papua 60 Ma spreading rift), Louisiade Plateau (LP), Western Coral Sea spreading rift (WCS and WCS1), Eastern Coral Sea spreading rift (ECS), Coral Sea-Cato Trough Triple Points (CST and CTT), Tasman Basin (TB), D'Entrecasteau Basin (DB), Gascoyne Sea Mount line (GS), Lord Howe Island line (LH), East Tasman Plateau (ETP), South Tasman Plateau (STP), Australian-Antarctic Ridge (AAR), displaced by the George V, South Tasman and Balleny transform fracture system towards the Balleny Islands (BI) hotspot (star). Seasat and Magsat ETP-GS Linear (triangles and boxes). Other Australasian-Pacific features include Auckland-Campbell Island (AC), Dunedin-Banks Peninsula (D-B) and Chatham Rise (CR) volcanic migratory lines on the South Pacific floor (SP), Harve-Lau Basin (H-L), Norfolk Basin (NB), South Fiji Basin (SF), Norfolk Ridge (NR), Caledonia Basin (CB), Loyalty Basin (LB), North Fiji Basin (NF) and the North Pacific floor (NP). Note recent 'central volcano' activity near active young spreading rifts (filled triangles, H-L and SB).
20
F.L. Sutherland
similar trend. Location of past and present sources also depends on speeds and directions of plate motions. A constant plate rotation for Australia's migratory centres over the last 33 Ma (Wellman 1983) contrasts with models which suggest changing rates of volcanic migration (Roy & Thom, this volume) or links changes in migration rates to variations in rates of Southern Ocean opening or absolute motion (Sutherland 1981, 1985; Duncan & McDougall 1989). Tectonic and magma source controls are described here using a broader age base, more detailed petrologic assignments and a better known chronology of rifting and spreading events along the eastern continental margins. MIGRATORY VOLCANISM AND REFERENCE FRAMES Three reference frames are used to study Australia's migration over fixed magma sources linked to bounding spreading rifts. 1) Motion related to adjacent seafloor spreading events. The most continuous control is Southern Ocean rifting and opening over the last 95 Ma (Veevers 1984; Eittreim et al 1985), giving a northerly vector, modified by more limited Tasman ENE-WSW opening (95?-57 Ma) and NNE-SSW Coral Sea opening (65?-57 Ma). Opening along the South East Indian Ridge (95-43 Ma; Liu et al 1983) and Central Indian Ridge (since 25 Ma; Norton & Sclater 1979) could introduce ENE to NE vectors into Australia's motion relative to the other openings. 2) Motion related to Australia's Apparent Polar Wander Path. Initial determinations of Australia's APWP since 90-100 Ma include several discrepancies and modifications (Embleton, in Veevers 1984). Re-analysis of palaeomagnetic pole positions yields two possible bias-corrected paths, with significantly different 60 Ma pole positions (Idnurm 1985a, 1985b, 1986). 3) Motion related to an absolute hotspot reference frame. Accurate determination of
Australia's absolute motion depends on whether the migratory volcanism is truly related to fixed asthenosphere sources, or represents delayed eruption (Smith 1982), lithospheric processes (Pilger 1982), or even migrating asthenosphere sources (Miyashiro 1986). If fixed mantle sources do apply, then precision to which absolute motion can be checked depends on whether migrational volcanoes erupt indiscriminately over broad or linear magma sources (Wellman & McDougall 1974a; Wellman 1983) or trace separate discrete sources (Sutherland 1983, 1985). Which framework best applies to Australia's volcanism is uncertain. Magma sources for triple points and spreading ridges may move with time. Thus the Indian Ridge triple point linked to Australian-Antarctic spreading has migrated east from Africa towards Australia at 20 mm/year over the last 35 Ma (Fisher & Sclater 1983), and AustralianAntarctic and Tasman ridges exhibit asymmetric spreading due to ridge migration (Weissel & Hayes 1971; Veevers 1984). Shifts may also occur between palaeomagnetic and hotspot frameworks, though perhaps insignificantly in the last 80 Ma, and possibly within the hotspot framework (Jurdy 1987). Absolute motion for Australia determined from southern hotspots (Duncan 1981; Duncan & McDougall 1989) may be subject to uncertainties in Antarctic-Australian-Tasman plate reconstructions. These include: i) a slow north-west movement of Antarctica between 39-10 Ma suggested by rectilinear seamount chains between Kerguelen and Heard Islands, which conflicts with assigned motions (Coffin et al 1986); ii) a possible plate boundary between East and West Antarctica active prior to 20-25 Ma (Yan & Kroenke 1987, and pers. comm.); and iii) a possible rotation of Tasman seafloor in the last 57 Ma (Roots 1986; Sutherland et al 1988b). This study first uses observed migratory volcano trends for the last 35 Ma and
Cainozoic Volcanism and 'hotspot' magma sources Southern Ocean opening rates, with changes in trend estimated for Tasman and Coral Sea opening beyond 57 Ma. This is then modified using a preferred bias-corrected APWP change in trend for Australia, from 43 Ma to 90-100 Ma (Idnurm 1986). These versions are then compared with an absolute motion model for Australia (Duncan & McDougall 1989). Applying the Relative Motion Model To test volcanic migration from rift upwellings requires coincidence of timing and position with the initiating rift. A 16°SSW regression fit to the most coherent migratory line (Central Queensland, Sutherland 1983), matches motion given for a southern Gondwanan reference (Smith 1982) and a western limit for felsic activity (Fig. 1). This trend, combined with Southern Ocean opening rates, projects migratory centres along the 65 Ma Coral Sea rift system (Sutherland 1983). To test older basaltic activity against the Tasman rift system is more complex, as only the north end is 65 Ma rifting (Weissel & Hayes 1977, and Shaw 1978 reconstructions). The central and southern Tasman rift shows spreading from 80-82 Ma, with extra rifting and spreading jumps around 69 Ma isolating Dampier Ridge. An alternative scheme (Veevers 1984, 1986) invokes earlier Tasman rifting with slow spreading from 95 Ma, with progressive ridge jumping at 82, 77 and 72 Ma developing quicker spreading compartments. TasmanGippsland spreading around 76-78 Ma is proposed by Lowry (1988), so that both 80 and 95 Ma alternatives are used in the modelling. The simple vector projection used to intersect the Coral Sea rift spreading needs modification for additional opening events. Australia's westerly APWP between 100 to 50-60 Ma (Embleton 1981; Schmidt & Embleton 1981; Embleton et al 1985) may reflect rapid pushing of Australia east from India, as corresponding latitudinal movement is subdued in India's APWP (Klootwijk & Peirce 1979) and the APWP for combined southern continents relative to India (Embleton &
21
McElhinny 1982). It fits unexpected fast motion for Australia relative to hotspots for 64-56 Ma (Jurdy & Gordon 1984). This is compensated by adding an equal easterly vector to the 16°NNE vector for time of Tasman opening, giving a 41 °NE vector. This is near the 6 mm/year east migration observed in asymmetric Tasman spreading (Veevers 1984). Further modification to allow for Coral Sea opening (65-57 Ma) halving northerly motion gives a 65°ENE vector. These vectors (16°NNE 0-57 Ma, 65°ENE 57-65 Ma and 41°NE 65-95 Ma) are used to project the southernmost basaltic activity (Tasmania) to proposed times of Tasman rifting (Figs. 3 and 4). Projections that meet the north Tasman margin are plotted at 65 Ma positions, those meeting the central-south Tasman margin at 80 Ma positions (Fig. 3). Plots scatter near the Tasman margin (with restored Dampier Ridge), raising a possible genetic link. Projection of Tasmanian and older western Victorian basalt ages to 95 Ma positions gives strong correspondence to rift and basin events (Fig. 4). The precise projection of Tasmanian activity, including new unpublished age limits (Baillie 1986, 1987), along the North Tasman and Gippsland triple point structure supports a magma source originating from this line. A major geothermal pulse on the 90-100 Ma margin heated rocks by 70-200°C, increasing coal reflectivity (Shiboaka & Bennett 1977), resetting mineral ages (Morley et al 1981; Moore et al 1986) and overprinting magnetic components along the uplifted edge from south Tasmania to southeastern Queensland (Sharpies & Klootwijk 1981; Schmidt & Embleton 1981; McConnochie & Henstridge 1985). Scattered older basalt ages in Queensland are similarly projected to 85 and 95 Ma positions (Fig. 5). They plot along Late Cretaceous three-branch or radiating grabens of the Queensland coast (Mutter & Karner 1980; Falvey & Mutter 1981; Symonds et al 1984) which were precursors to subsequent Tertiary rifts. The uplift was at least 80-82 Ma (Mutter 1977; Veevers 1984), but basal sediments
22
F.L. Sutherland
Fig. 3 Tasmanian basalt age dates (solid dots) projected to 80 Ma positions (central-south Tasman) and 65 Ma positions (North Tasman), using 16°NNE (to 56 Ma point), 65°ENE (to 65 Ma point) and 41°NE (to 80 Ma point) vectors (age data from Sutherland & Wellman 1986). The hatched line represents the east Australian margin restored from a continental Dampier Ridge separating the Tasman, Middleton (MB) and Lord Howe ,(LB) basins. Submarine contours in metres; Sydney Basin coal reflectance contours (dashed lines) increase towards the continental margin; and Clarence-Moreton Basin (CMB) is enclosed by marginal dots.
Fig. 4 Tasmanian basalt age dates, plus western Victorian Geelong-Gellibrand region (11) basalts, projected to 95 Ma positions using previous vectors. The youngest Tasmanian episodes (<16 Ma) are only taken to 65 Ma North Tasman rift positions (circled dots). A restored early spreading Tasman rift zone 95-82 Ma is shown (stippled zone), based on the spreading compartment model (Inset (a)) of Veevers (1984). The Capricorn, Maryborough and Clarence-Moreton Basins (Late Cretaceous uplift and rift zones) are shown (marginal dots), and the present position of the Dampier Ridge and eastern Tasman Basin are shown by solid line (right side of diagram).
in northern Capricorn Trough suggest some older Cretaceous rifts (Falvey & Mutter 1981; McConnochie & Henstridge 1985). As thermal sources, they would represent extensions of the mid-Late Cretaceous Tasman system.
Ma is favoured by Idnurm (1986). This indicates rotational movements associated with latitudinal shifts during this period. If this trend is combined with a 16°NNE vector for 0-43 Ma, projections for the basalts give a similar end result to those for the relative motion model (see Sutherland 1989). Thus, with either projection, the younger Tasmanian alkali basalts (8-16 Ma) plot at 65 M a positions along the north Tasman rift system
Applying the Preferred APWP Model A bias-corrected A P W P for Australia which features a NE-SW trend f r o m 43 to 90
Cainozoic Volcanism and 'hotspot' magma sources
23
Fig 5 Basalts in regions with ages (numbers in Ma) older than migration of Coral Sea track. The ages are projected to 85 Ma positions (dots) on the 16°NNE vector. The main groupings A, B, C and D are then plotted to positions allowing for a 56-65 Ma 65°ENE and 65-85 Ma 41°NE vector (enclosed fields A, B, C and D). These are then extrapolated to 95 Ma positions (shaded fields A95 B95 C95 D95). The Cretaceous branched rift system (Falvey & Mutter 1981; stippled zones) contains a volcanic core of uncertain age (shaded area with close stippled margin representing inner and outer magnetic highs; Symonds et al 1984). The rift is lost on the other side of the Cato Trough spreading floor (CT).
24
F.L. Sutherland
and the main tholeiitic associations (21-38 Ma) plot at 95 Ma positions along the central Tasman segment where there is maximum rifting and thermal contouring (Schmidt & Embleton 1981; Middleton & Schmidt 1982; Moore et al 1986). If the meridional A P W P for 0-43 Ma is used, basalt ages plot further west, off the Tasman rift line. Meridional motion matches trends of the younger Tasman sea mounts, but not overall continental volcanic trends, so that relative rotations between the continent and Tasman floor may be involved (Sutherland et al 1988b). Applying the Absolute Motion Model Predicted absolute paths for southern Australia (Duncan 1981; Duncan & McDougall 1989) taken to 80-100 Ma positions do not cross the Coral Sea rift. This seems to deny its role as a magma source region for the main felsic migration, and casts doubt on basaltrift relationships. However, calculated absolute motion paths show some departures from migratory volcanic lines from 20-43 Ma (Sutherland et al 1988b), so that the zig-zag absolute motion from 43-90 Ma needs further confirmation.
These frameworks provide different interpretations for eastern Australian volcanism. The relative motion and combined A P W P models favour a migratory relationship to bounding thermal rifts; the absolute motion models suggest little relationship. To consider this, an appraisal of east Australian volcanic regions is presented.
DISTRIBUTION OF CAINOZOIC VOLCANISM Precursor Volcanism This basaltic activity and its dated episodes are related to times of Tasman-Cato Trough rifting in Figure 6. General migrations from rifts (Weissel & Hayes 1977; Shaw 1978) are propagated southwards using Southern Ocean opening rates, and encompass most observed basaltic activity. Similar migrations can be generated from 95 Ma rifts, as northward motion from Southern Ocean opening was slow between 80-95 Ma. Synthetic volcanic trails are shown for each rift migration (Fig. 7). Basaltic episodes intersected by the trail are included and give relatively continuous trails. However gaps
Fig. 6 Latitude-age distribution of volcanic episodes, eastern Australia (19-44°S, 0-85 Ma). Episode age ranges are defined on K-Ar and zircon fission track age dates and their ISD error limits, with each episode separated by age gaps greater than 2 Ma. Only reliable age dates are used (A-B categories), but likely episodes from minimum ages of less reliable dates (C-D categories) and well-established stratigraphic correlations are indicated by dashed outlines. Episodes show the full latitudinal range of regions, except for more specific fields amongst leucitite and isolated young basalt centres. Petrological ranges of episodes include tholeiites (inclinedstripes), felsic-basaltic volcanoes (stipples) and leucitites (double line enclosures), with alkali basalt and incompletely known episodes (blank). Episodes are numbered after regions listed in Figure 1. Eastern Australian Tasman-Coral Sea rifting events (Weissel & Hayes 1977; Shaw 1978; Weissel & Watts 1989) are used to generate general migration zones, reflecting Australia's northward motion from Southern Ocean spreading rates (after Cande & Mutter 1982; bottom of diagram). Age dates, petrological affinities and stratigraphic data are taken from summaries of Harding (1966), Wellman et al (1970), Sutherland (1973), Wellman and McDougall (1974a b), Wellman (1974), Bowen (1975), Brown (1976), Birch (1979), Stephenson et al (1980), Sutherland (1981)' Sutherland et al (1977), McKenzie et al (1984), Embleton et al (1985), Etheridge et al (1984), Sutherland and Wellman (1986), with additional data from Owen and Wyborn (1979), Young and Bishop (1980) Young and McDougall (1982, 1985), Oilier (1982), Bishop et al (1985), Ewart (1982), Ewart and Grenfell (1985), Robertson et al (1985), Robertson (1985), Hollis and Sutherland (1985) and unpublished zircon fission track ages). Unpublished dates per C.D. Oilier, R. Schon, J.H.C. Bain and B.S. Oversby, K.G. Grimes, A. Ewart, P.J. Stephenson and additional dates in Appendix, this paper. All dates quoted in the script are corrected for new constants (Appendix).
Cainozoic Volcanism and 'hotspot' magma sources
25
26
F.L. Sutherland
appear in the 40-60 Ma sections, a distribution that favours the preferred APWP model (SW trend to 43 Ma) rather than the relative motion model (SSW trend from 57 Ma). The petrological character and order of mantle melting involved in each episode is shown along each trail (histograms, Fig. 7). Some trails include small silicic centres (regions 44 to 50; Sutherland 1985; Barron 1987; Appen-
dix; and unpublished data), which is important for suggested migratory origin. Both silicic (fourth order) and tholeiitic (third order) melts appear at northern ends of trails. Though variable in petrologic character, episodes seen in the longer trails suggests southward decrease in mantle melting and hence a decay of magma sources with time. This also holds for main migratory volcanism
Fig. 7 Migration tracks projected from Tasmanian basalt regions to the Tasman-Cato rift margin (80 Ma, tracks 1-3, South-Central rift; 65 Ma, tracks 4-5, North Tasman-Cato rift; Inset a). Migration vectors as in Figures 3 and 4. Shaded areas represent basalt regions showing volcanic episodes of appropriate age from Figure 6 (close shadings represent regions based on radiometric dating, broad shadings regions based only on good stratigraphic control). The Gippsland-South Tasman and Capricorn-North Tasman triple point alucogens are positioned (three-branched circles), and a thermal-coal reflectivity peak in the Sydney Basin is marked (star). Histograms beside each track indicate the petrological range in each region of activity, with alkali basalts (A), tholeiites (T) and felsic centres (F) representing increasing orders of melting. Broad levels of activity are represented by long dashed lines. Inset (b) represents the Australian APWP over the last 100 Ma, showing its general westward course between 95 to 60-50 Ma (taken from Embleton et al 1985). Inset (c) shows generalised regions of Tasmanian basalt, showing limits to quartz tholeiite (QT), olivine tholeiite (OT), alkali basalt (AB) and fractionated alkaline rock (A) distribution. Note that each area within another may contain basalts types of the outer regions.
Cainozoic Volcanism and 'hotspot' magma sources (Fig. 6) and the regional southerly decrease in saturated basaltic melts in Tasmania (Fig. 7c). Certain volcanic trails, such as those from the central Tasman rift complex and Coral Sea rift, involve greater mantle melting than others (Fig. 6) and suggest magma sources that range in size and effect. The more extensive tholeiitic (third order) melts in Tasmania are anomalous in regional context, but may reflect a hotter Cainozoic geotherm under Tasmania (50-100° higher: Sutherland 1989). The older Queensland activity also includes felsic episodes clearly separate from the main migratory volcanism in this area (33-21 Ma), namely the Mt Jukes intrusive complex (42 Ma zircon fission track date; F.L. Sutherland and J.D. Hollis), a Clermont plug (cut by a 33 Ma basalt dyke, Appendix) and numerous plugs and volcanic remnants of the Rockhampton province (69-72 Ma; Sutherland et al 1988a). These are considered likely migratory centre
Main Migratory Volcanism The migration over latitudinally extended magma sources considered by Wellman and McDougall (1974a) and Wellman (1983) has proved more complex in some lines (Sutherland 1983) on new age dating. Separate pulses and extended felsic activity over 2-5 Ma are found in central Queensland (regions 69, 72, 74; Griffin et al 1987), southeast Queensland (regions 54-63; Ewart & Grenfell 1985) and New South Wales (regions 36 and 49; Sutherland 1985; Stolz 1985). If this occurs over binary magma sources, this pattern should continue the length of the trail. Thus, compound felsic activity suggested within the central Queensland line near Mackay (36-32 Ma) may match extended leucititic activity in central New South Wales near Condobolin (14-10 Ma) and two ages suggested by euhedral, apparently cognate zircons of 'trachytic' habit found in separate central Victoria volcanoes around Woodend (6 and 1.7 Ma; F.L. Sutherland and J.D. Hollis, unpublished fission track dating).
27
Trends seem to differ between felsic continental volcanic migrations (8-16°SSW; Wellman & McDougall 1974a; Smith 1982; Sutherland 1983; Fig. 1 this paper) and southern ends of Tasman Sea mount chains, Australia's APWP and calculated absolute motion paths (<5°SSW; Pilger 1982; Idnurm 1986; Duncan & McDougall 1989). Smith's South American reference trend may be inappropriate, as that continent is more mobile than originally thought, when referring to a near-stationary Antarctic motion (Hartnady & Le Reox 1985). However, further dated migratory centres (regions 47, 55 and 63) will weight the Wellman and McDougall trend towards a higher angle. An average 12°SSW trend projects trails from Coral Sea sites (Fig. 2) from the Coral SeaCato Trough triple points (CST, CTT) and western spreading rift compartments (WCS, WCSI) to give broad traverses along main continental migratory lines. Trails projected from the eastern Coral Sea and D'Entrecasteau Basin rift, however, transgress across the Tasman Sea migratory lines. This implies some relative clockwise rotation of Australian continent and Tasman Sea floor after 57 Ma (Sutherland et al 1988b), possibly involved with westerly truncation of D'Entrecasteau Basin later than anomaly 8 time (<28 Ma). Detailed implications of this for Australian volcanism and uplift are under study. Subsequent Volcanism Basaltic activity following the migratory sweep was substantial in places (Queensland, western Victoria), but not everywhere (New South Wales). Traditionally, the younger northern volcanism (Stephenson et al 1980; Robertson 1985) is linked with younger southern volcanism (Veevers 1984). Both include restricted earlier phases between 12-5 Ma ago, then more prolific activity after 5 Ma. The southern activity is interpreted here as: (a) local felsic break-through over a deep magma source during compressive stress conditions, 10-5 Ma ago; and (b) widening of volcanism after 5 Ma, over
28
F.L. Sutherland
this source or a second source, with relaxation under tensional stress fields (Gunn 1975). In this view, young southern Australian volcanism partners migratory volcanism, and young northern Australian volcanism is clearly much later than inception of this phase. Northern volcanism groups into three periods of activity: 1) Late Oligocene-Late Miocene volcanism (29-12 Ma, Fig. 8). Alkali basalts are dominant, with rare tholeiitic and felsic centres (Green & Stevens 1975; Sutherland 1977;
Sutherland et al 1977; Hollis et al 1983, Robertson et al 1985; Robertson 1985; Appendix; and B.S. Oversby and J.C.H. Bain, pers. comm.). Two peaks of activity up to 6 Ma apart are observed in north (29-22 Ma), central (24-14 Ma) and southeast (21-12 Ma) regions, but these do not correlate across regions. The earlier phase largely represents second order (grading into third order) mantle melting, and the later more undersaturated first to second order mantle melting. 2) Late Miocene volcanism (12-5 Ma). This is the early McBride activity (region 81; Griffin & McDougall 1975; Anonymous 1985; and K.G. Grimes, pers. comm.). It ranges into third order mantle melting. 3) Pliocene-Quaternary volcanism (5-0 Ma). This is relatively widespread (Fig. 1), and ranges across the basaltic spectrum into minor fourth order melting (Stephenson et al 1980; Robertson 1985; Griffin et al 1987).
Fig. 8 Basalts in regions with ages younger (numbers in Ma) than migration of Coral Sea track. Southeast Queensland basalts projected (16° vector) to 43 Ma positions relative to Louisiade Plateau 42 Ma? spreading (LP). N.B. 19 Ma age may be minimum and so unrelated to this line, and ?18 Ma may be a maximum mineral date. Central Queensland basalt trails, older (criss crosses) and younger (crosses), are projected to Solomon Sea spreading margin, with Northeast Queensland basalts (stars).
Before 5 Ma, north Queensland activity centred around the McBride region, between 8.8 to 5.5 Ma. This could be a restricted break-through over a magma source during plate migration under compressive conditions. As in southern Australia, relaxation into tensional fields at 5 Ma developed more voluminous volcanism as the source moved southwards. Activity then slowly passed through the Chudleigh, Sturgeon and Nulla regions (79-88), and a cluster of dates around 5.5-3 Ma match the expected peak in the Nulla region (radiometric ages and comparative erosion estimates; Stephenson et al 1980). A second McBride peak (2.7 Ma to present) forms a migration from typical Atherton activity (3.2 Ma to present; Anonymous 1985; and K.G. Grimes, pers. comm.) and passes through Nulla dates around 1.7 Ma (Stephenson et al 1980). Thus, a migratory interpretation for younger north Queensland volcanism requires a ghange in stress field operating over two separate magma sources. Some supportive dates over 5 Ma are expected north of the McBride region, but would be limited under a compressive stress regime.
Cainozoic Volcanism and hotspot' magma sources Young volcanism also appears after 5 Ma in the Gin Gin-Gayndah-Brigooda region (Wellman 1978; Robertson et al 1985; Robertson 1985). Pleistocene eruptives suggest southwesterly migration from Bundaberg (1 Ma) through Gayndah (0.6 Ma) to Brigooda (0.4 Ma). The apparent migration rate (270 mm/year) exceeds present continental motion (over 70 mm/year), but may be unrepresentative, as the Brigooda event is only a volatile blast rather than an outpouring. The 3 Ma Mt Saint Martin volcano is an isolated episode between the northern and southeastern Queensland fields. It is exceptional as a hybrid mixture of highly undersaturated mantle-derived magma and high level, fractionated trachytic magma typical of migrational activity (Sutherland et al 1977; Griffin et al 1987). PREDICTIVE RIFT-SPREADINGHOTSPOT MODEL If valid, it should: 1) predict episodes of Australian volcanism relative to known spreading rifts; 2) locate further spreading rifts from unassigned episodes of volcanism; and 3) identify present positions for magma sources, now remote from their original sites. The model assumes each major feature of a rift-spreading system formed from a discrete magma cell evolved in the initial upwellings. The favoured process is destabilisation of a hotspot or mantle degassing plume (Yuen & Fleitout 1985) setting up secondary small scale convection. This can cause rapid uplift (23 km elevation) and lithospheric thinning (10 km/Ma) within 10 Ma, which fits early Tasman rifting ± slow spreading (95 to 77-82 Ma) and Coral Sea-North Tasman rifting and spreading (65 to 57 Ma). Narrow rifts, like the Gulf of Suez, also show rift uplift and subsidence of some 3 km, caused within 8-10 Ma by extra heating induced by secondary convection (Steckler 1985). This could provide additional uplift and heating along parts of
29
the Tasman rift, as its length was ten times that of the Gulf of Suez. Uplift and subsidence reached 5-6 km vertical displacement, with a high asymmetric profile, and initiated spreading for over 25 Ma. Greater extension in northeast Australia (Karner & Weissel 1984) formed branch rifting, reducing the heating, uplift and spreading. The early Tasman-Coral Sea spreading probably proceeded from spaced magmatic cells, as for many segmented mid-ocean ridges (Schouten et al 1985). When spreading ceased, Australia, moving largely in response to Southern and Indian Ocean openings, travelled over the old upwellings. These acted as intermittently productive magma sources, and series of volcanic trails, so formed, would reflect initial size and decay in magma sources as well as any prevailing local tectonic and structural conditions. Volcanism would blossom under tensional stress fields and be inhibited under compressional conditions. Prediction of Australian Episodes Tasman-Coral Sea rifting on the eastern margin involved mid-Late Cretaceous and Palaeocene upwellings. The latter was more limited in extent, but probably also involved intense thermal effects, giving anomalous gravity and reset topography over the Coral Sea ridge system (Karner 1985). The predicted ages for volcanism in Australia have been matched against dated basaltic or felsic centre activity and accounts for much of the volcanism. Thus northern Tasmania (regions 5-7) would pass over the twelve Tasman spreading compartments (magma cells) proposed by Veevers (1984), lying north of 40°S (Fig. 4a). The potential twelve outbursts match observed radiometric and stratigraphic controlled episodes (i.e. 46-47, 43-44?, 40-41?, 38, 35-37?, 31, 26, 19-24?, 16-17, 13-14, 9-10, and 8-9 Ma; Fig. 6; and F.L. Sutherland, unpublished data). Similarly, eight episodes in the period 77-22 Ma (regions 31 and 33) match eight spreading compartments lying above 35°S. However, four episodes recorded between 65-38 Ma (region 57) at 28°S for
30
F.L. Sutherland
two spreading compartments would require magma sources formed from both older and younger north Tasman rift events. Coral Sea magma cells would predict additional episodes between 0-35 Ma. Fission track ages on alluvial zircons shed from this field (3, 20, 31 and 41 Ma; F.L. Sutherland & J.D. Hollis, unpublished data) support the model, as not every basalt need yield reset zircons. The relative importance of triple point and spreading compartment features should also show in the volcanic pattern. The largest triple point Coral Sea system is linked to voluminous migratory lines across eastern Australia and western Tasman Sea (Fig. 2). Apparent correspondence is seen between size and extent of volcanoes in trails from triple points (CST, CTT) and the largest (WCSI) and second largest (WCS) spreading compartments. Lesser Cato Trough and the North TasmanCato Trough triple points generate trails with some tholeiitic and minor felsic episodes in the precursor volcanism. The main central Tasman thermal rift also generates trails with more tholeiitic (and minor felsic) activity (regions 51 to I), than in trails from adjacent segments of the rift. The Gippsland-Tasman triple point, marked by a large thermal embayment (Moore et al 1986), generates a trail across the Tasman floor to intersect the large Soela Seamount volcano (lat. 44°S) at a predicted age between 37-42 Ma (Fig. 6), compatible with its Late Eocene stratigraphic age (Duncan & McDougall 1989). Locating Further Magma Sources
Magma sources along Tasman-Coral Sea rifts can account for much of Australia's volcanism, but not all the northern activity. If the model applies generally, then the further activity would arise from magma sources beyond those particular rifts. They would lie in now tectonically complex outer margins (Kroenke 1984; Pigram & Davies 1987), introducing uncertainties and conjecture into the modelling discussed here.
The compound activity in central Queensland migratory volcanoes, with multiple silicic and basaltic phases, suggests further thermal rifts on the north Coral Sea margin. A subsidiary spreading rift possibly extended into Southeastern Papua at around 60 Ma, associated with Late Cretaceous-Palaeocene oceanic basalts of the Kutu Terrain (Pigram & Davies 1987). This would provide a magma source for the 'flood basalt' phase found in upper parts of several migratory successions (regions 74-66, Fig. 6). Lesser episodes with undersaturated basalts also erupted in some central Queensland regions 7-14 Ma after the main build-ups and seem to form migrational trails (Fig. 8). They are too spaced to represent typical late-stage alkaline phases as follows Hawaiian hotspot migration (Clague & Dalrymple 1987). If projected back beyond the Coral Sea rift, these trails intersect the Solomon Sea Basin around 50 Ma and 43 Ma respectively (maximum ages due to minor displacement by younger Woodlark Basin opening; Luyendyk et al 1973). The later age is close to oldest identified spreading anomalies on the western Solomon Sea floor at 39 Ma (Joshima et al 1987), which suggests rifting older than 40 Ma. The older intersection would require earlier rift floors to the north or in the eastern part of this poorly known and tectonically truncated basin (Honza et al 1987). Other scattered Miocene volcanoes in Southeastern Queensland, when projected back to 43 Ma positions (Fig. 8), straddle a small spreading zone proposed within the Louisiade Plateau and assigned a magnetic anomaly age around 42 Ma (Landmesser et al 1975). This would represent an extension of 40-43? Ma Solomon Basin rifting. The extensive, late Miocene-Quaternary basaltic episodes of north Queensland (Fig. 1) are interpreted as two migratory sources under compression, then tension. The older and younger McBride episodes (11-5 Ma and 3-0 Ma), projected north beyond the Coral Sea spreading rift, intersect New Guinea along the
Cainozoic Volcanism and *hotspot9 magma sources Papuan Basin-Moresby Trough-Papuan Plateau structure line (Mutter & Karner 1980). The Moresby Trough contains 7 km thickness of sediments and is structurally part of the Aure Trough (Veevers 1984). The McBride episodes project here around 27-21 Ma and 16-14 Ma, both times of abundant volcanism/intrusion within the deep marine sequence. The earlier phase is less extensive, and the later phase would correlate with the younger McBride activity with its long and voluminous flows (Stephenson & Griffin 1976). These correlations equate the Aure Trough to OligoceneMiocene thermal rifts, which became detached as a foreland basin developed with docking of various terranes in New Guinea over the last 25 Ma (Pigram & Davies 1987). Evidence for such original rifts is obscure, but Pigram and Davies suggest oceanic basement may underlie Aure Trough. Other alternative rift sources could include the Late OligoceneMiocene Cape Vogel Basin structure dated to over 28 Ma (Bickel 1976) or extensions of older Coral Sea (and Solomon Basin?) rifting suspected north of New Guinea (P.A. Symonds, pers. comm.). Tracing Present Hotspot Positions The postulated Tasman magma sources would now lie south of Tasmania, but diminished with time. Only the largest upwellings associated with the triple point positions would form the longest surviving and more obvious hotspots. The North Tasman 95 Ma triple point at 23°S projects to 52-53°S under the swell of the active Australian-Antarctic mid ocean ridge, and would be difficult to discern. The Gippsland-Tasman 95 Ma triple point at 37°S projects to 66-67°S, the latitude of the Balleny Island hotspot. At 78-82 Ma it would be lying on the Tasman spreading ridge, and from here distinct linear magnetic anomalies trend southeast across the Tasman ocean floor from 37°S to 40°S. If this marks a subdued migratory trail during Tasman spreading, it passes into a chain of old, partly sedimented sea mounts at an estimated age of 55-58 Ma, the time spreading ceased. This sea-
31
mount chain trends 26°SSW and forms a line of distinct anomalies on Seasat gravity altimeter data (Fig. 2; Haxby et al 1983). Assuming that it represents a migratory trail over the Gippsland triple point source, it gives a predicted age for Soela Seamount (44°S) around 43 Ma. From here and through seamounts south of East Tasman Rise lies the Balleny hotspot trail, modelled on absolute motion for the Australian and Antarctic plates during fast Southern Ocean opening in the last 43 Ma (Duncan 1981; Duncan & McDougall 1989). Correlation of the Gippsland-Tasman triple point with the Balleny hotspot allows present location of other southern Tasman aulacogen and triplepoint structures. An aulacogen may exist in the South Tasman (median point 46°) for apparent rifts between East and South Tasman Plateaus (west) and Bellona Valley (east). Its old position would be 75°S, the latitude of the active Mt Melbourne volcano. The old South Tasman-Antarctic-New Zealand plate junction (48-49°S) likewise would lie at 78-79°S, the latitude of the Mt ErebusMt Discovery hotspot volcanoes (Moore & Kyle 1986). These correlations would take the whole Tasman magma source line through the Australian-Antarctic spreading zone, closely segmented by the Balleny-Tasman-George V transform fault system (140-160°E, Fig. 2; see also 1A of Vogt et al 1983). Thus, the unusual progressive north-stepping displacements across the transform zone are consistent with prolonged westward flow from hotter magma sources. This is equated here with passage over the Tasman magma source line. Magma sources along northern extensions of the rifts through northeastern Australia (Fig. 5) would now lie between 44-47° south of Tasmania. These are fairly small sources and basalts related to them are not obvious after 35 Ma, so current activity is unlikely. In contrast, the 65 Ma Coral Sea rift sources are related to prominent migratory activity continuing into the Holocene in southern Australia. The projected sources now lie across Bass Strait, Tasmania and West Tasman floor
32
F.L. Sutherland
(Fig. 2). Possible eruption on the Bass Strait floor (Yolla Well; Davidson & Morrison 1986), discharges of C0 2 with mantle C isotope ratios in mine waters in western Tasmania (Green 1982), high heat flow across the island (Cull 1982), evidence of recent coastal uplift in north Tasmania (Bowden & Colhoun 1984), and zones of seismic activity in northeastern Tasmania and on the West Tasman floor (Denham 1985) all suggest underlying thermal and magmatic activity capable of further volcanism. Within the young north Australian volcanism, the magma source for the 9-5 Ma McBride activity would migrate through the more southern fields between 5-2 Ma and should now lie between 22-25 °S (based on Southern Ocean opening of 3/4°/Ma). This predicted position in the Longreach-Blackwall region shows anomalous mantle He and unradiogenic 87Sr/86Sr isotopic ratios in groundwaters and circular positive magnetic anomalies suggesting small plutons, all thought to relate to young (< 1 Ma) basaltic activity at depth (Torgersen & Clarke 1987; Crocket et al 1988). The postulated magma source for young McBride activity (3-0 Ma) would now lie at 20-21°S under active basalt fields. The young volcanism in southeastern Queensland (mostly 3-0 Ma, 24.5-26°S) has shifted southeasterly in its latest ( < 1 Ma) activity, and the predicted source position extends to 27°S. DISCUSSION The R-S-HS model advanced here provides coherent explanation for prolonged and extensive eastern Australian volcanism. Outlying thermal rifts of several ages continued as magma sources to produce a spectrum of basaltic activity, other than just prominent silicic centres (maximum mantle melting) and small distinctive leucititic centres (minimum mantle melting). Identifications of felsic centres within basaltic phases that bracket the main migratory phase support this. Direct tracing of volcanic trails to their rift sources is still needed for critical zones obscured by
erosion or marine submergence. The westward drift of volcanism (Wellman & McDougall 1974a, b) and lateral propagation and decay of an initial thermal pulse (Karner & Weissel 1984) are not consistent features observed in the broad volcanic pattern, but are partly inherent within the R-S-HS model. A consequence of the model is that major sources for the 95-65 Ma Tasman-Coral Sea upwellings should still exist from East Antarctica to Tasmania, but with mantle melting reduced by long term thermal decay. This fits relatively low degrees of partial melting represented by undersaturated lavas in Antarctic hotspot volcanoes (Balleny-Mt Melbourne-Mt Discovery-Mt Erebus; Johnson et al 1982; Moore & Kyle 1986). The lines of magma cells proposed for the older Tasman and Coral Sea rifts, if linked, provide one of the most extended hotspot lines known and an example of a superstring system. Discrete hotspot cells of different magnitudes linked to spreading rift features will provide systematic differences along trails. However, intensity of volcanism over each cell, cluster or string of magma sources is also dependent on the operative stress field, structural access and fluctuations in mantle processes supplying magma generation. Such variations will obscure less prominent migratory patterns. Inactive intervals, even in areas over magma sources for the main migratory trails, led to progressive extinctions and resurgences across broad zones (Sutherland et al 1988b). Null periods probably reflect extensive compression, possibly even periods of relative rotation between Tasman Sea floor and the Australian continent. Volcanism contracted over much of the eastern margin about 10 Ma ago, probably as widespread compression developed as increased opening rates in the Southern Ocean (Yogt et al 1982, 1983) drove Australia north against a zone of major convergence along New Guinea (Pigram & Davies 1987). Late Basalt Resurgence Basaltic activity surfaced prominently in a few regions in the last 5 Ma, particularly since
Cainozoic Volcanism and 'hotspot' magma sources
33
Fig. 9 Potential volcanic risk areas, eastern Australia based on R-S-HS migration model, assuming rotation to NNE-SSW 'central volcano' trend. Low risk young basalt fields (blank enclosures), higher risk basalt fields (coarse stippled enclosures), highest risk basalt fields (dense stippled enclosures), zones of potential volcanism of negligible risk (shaded areas), slight risk (small question marked volcanoes) and more likely risk (small volcanoes). Large question marked line marks western limit of any possible central volcano activity. Older enclaves in young Queensland basalt fields (5-12 Ma; solid dots), young (2-3 Ma) New South Wales zircon dates (stars) and mantle He site (He).
34
F.L. Sutherland
3 Ma ago (Fig. 9), and some areas include Holocene activity (Joyce 1975; Barbetti & Sheard 1981; Smith & Prescott 1987). This is interpreted as a response to tensional zones forming over existing magma sources. The differential stress pattern probably grew with slight but definite decrease in convergence along the Australian-Pacific plate boundary between 5 and 3.2 Ma, observed from detailed studies of the Hawaiian hotspot line (Cox & Engebretson 1985; Pollitz 1986). This was related to a change in torque as subduction rates increased under the Kurile Trench, and closer to Australia a possible switch in subduction direction under the New Hebrides boundary. Stress fields modelled for the Australian plate (Cloetingh & Wortel 1986) show zones of arcuate tension; these develop apical to both the New Hebrides-Fiji boundary and Pacific plate margins, where velocity vectors are maximal against the Australian plate (Coral Sea and South New Zealand). Extensions predicted for magma sources from volcanism initiated in the last 5 Ma (Fig. 9) use a continental volcanic migration trend of 12°SSW, but could lie towards a more meridional trend given by Australia's APWP (Idnurm 1986) and Australian absolute motion paths for the last 10 Ma (< 5° NNE; Duncan & McDougall 1989). Intersections of these migration zones and fields of tensional stress (Cloetingh & Wortel 1986) will define regions with greatest potential for future volcanism. Thus, although magma sources extend under Tasmania, most lie within a compressive stress regime, so that potential for eruption is largely limited to the north coast. Origin of Australian Volcanism The various schemes (Table 1) can be evaluated against the R-S-HS model. Those which relate migratory centres to indirect, unfixed or alternative processes rather than to direct mantle sources (Smith 1982; Pilger 1982; Miyashiro 1986) all use older 1974 data and are not supported by the later data. The
hotline model with a constant lithospheric rotation over magma sources (Wellman 1983) provides a general fit to felsic volcano distribution, but cannot account for two ages of activity along some lines (Sutherland 1983) or a lag of a few Ma in relative ages between Australian and West Tasman lines (see McDougall & Duncan 1988). These features fit better with migration over broad magma sources (Wellman & McDougall 1974a; Duncan & McDougall 1989), or an elongate cluster of hotspot cells (Sutherland 1983). Distinction between a general hotspot model and one involving specific rift lines rests on detailed reconstructions of Australian plate motions. Absolute motion paths calculated by Duncan and McDougall (1989) for the last 100 Ma from Tasmania do not cross, and seem to rule out a hotspot migration from the 65 Ma Coral Sea rift. However, the only confirmatory magmatism cited in support for the complex motion between 43-100 Ma, determined for the Balleny hotspot, is 90-100 Ma syenite bodies in Tasmania. In this case, similar syenites along eastern Australia (Mt Dromedary, Ridlers Creek) should also provide hotspots and sea mount trails on the Southern Ocean-Tasman floor, for which evidence is not yet presented. Volcanic trails along the calculated tracks would trend NNW along the Australian margin (43-55 Ma) and SSW outwards during Tasman spreading (55-80 Ma), but are not readily observed in Tasmanian or eastern Australia activity (Sutherland et al 1988a). Neither do the calculated trends match the basaltic seamount line extending NNE of Soela Seamount across the Tasman floor and presumably formed between 43-55 Ma, nor Late Cretaceous 69-75 Ma NE-SW volcanic lines (Rockhampton, Bunda Bunda-Timor; Sutherland et al 1988a, b). These volcanic lines are more consistent with proposed R-S-HS trends, particularly using the preferred APWP path, giving a northeasterly trend from 43-90 Ma. Duncan and McDougall (1989) relate the main felsic migration to onset of rapid spreading in the Southern Ocean (after 43 Ma). However, Cainozoic felsic volcanoes were already
Cainozoic Volcanism and 'hotspot' magma sources 35 established (42-46 Ma) and appear well in Campbell Plateau (Fig. 2). It may form a advance of this progression (up to 9-30 Ma), hotspot line (Adams 1981; Wellman 1983); so that this cause is incomplete. more specifically, continental overriding of Southeastern Indian-Antarctic Ridge Apparent bends and arcs observed along the (Farrar & Dixon 1984). However this does not Australian migratory lines (Fig. 2) have dif- adequately explain large gaps between ferent interpretations in regard to Australia's volcanic centres, extra episodes or lags in ages absolute motions. They may result from: in some centres relative to the reconstructed 1) changes in stress fields or underlying ridge position (see Farrar & Dixon 1984, volcanic sources (Pilger 1982; Miyashiro Fig. 4). Alternatively, the volcanic migration 1986), and therefore not firmly relatable to can be equated to spreading rift magma absolute motions; sources north of New Zealand. This requires complex reconstructions of movements on the 2) arc-like emplacements over broad Alpine Fault, bending of the North Island, magma sources, probably relating to strucopenings of marginal basins on the tural features (Wellman & McDougall 1974a; and Pacific-Australian plate boundary. A comHarrington & Korsch 1985), and so giving prehensive account will be presented only general senses of absolute motion; elsewhere, but its elements are outlined here 3) changes in Australia's motion over parti- (Fig. 2) as a further application of the cular magma sources (Sutherland 1981; Australian R-S-HS model. The present migraKroenke 1985; Yan & Kroenke 1987), and tory line for Campbell Plateau volcanism thus recording plate interactions and con- (A-C, D-B, CR; Fig. 2) is projected to its 36 vergences; Ma position relative to Australian plate NNE then rotated 30°W to accommodate 4) spiral emplacements of magma generated motion, North Island bending (Walcott et al through vortex-like mantle degassing (Middle- later 1981). It is then displaced westwards to allow most 1985), and so lying concentric to abso- for late Harve-Lau Basin opening. This 36 Ma lute motion paths; or line now shows close correspondence with the 5) crescentic 'boomerang' shaped migra- rift margin for South Fiji spreading (36-25 tions that are convex westwards (Sutherland Ma). The four main spreading junctions (now 1987a; Sutherland et al 1988b), and may partly rotated and dislocated) are correlated represent deflections of hotspot plumes away with the four main lines of migratory volcanoes traversing the New Zealand-Campbell from plate motion paths. Plateau region, completing the analogy with Further studies of these curvilinear features the main Coral Sea-Australian migration are underway to determine their precise nature lines.fourOccurrences of active felsic volcanoes and relationships to R-S-HS models. on ends of young spreading rifts on the Pacific margin between New Zealand and New Guinea (Fig. 2) are another point of interest General Application for the R-S-HS model. A general migratory volcanism model should also apply to other periods and areas ACKNOWLEDGEMENTS of within plate activity, e.g. as described for E. Scheibner (Geological Survey of NSW), Australian Mesozoic and South New Zealand Cainozoic migrations (Wellman 1983). In the J.D. Hollis, R.E. Pogson (Australian Australian case, progenitor hotspot rift Museum), and L.R. Raynor and R. Schon sources were suggested in the Palaeozoic New (University of Sydney) assisted with discusEngland Orogenic belt (Sutherland 1987b), sion, information or reading of the paper. but need detailed confirmation. In the New P. Wellman, C.D. Oilier, J.H.C. Bain, B.S. Zealand case, this activity extends across the Oversby and C. Klootwijk (Bureau of Mineral
36
F.L. Sutherland
Resources, Canberra), kindly assisted with dating and other information on Cainozoic basalts and Palaeozoic palaeomagnetic data. K.G. Grimes and A.D. Robertson supplied age and other information on Queensland basalts, with permission of Chief Government Geologist, R.J. Allen. D.A. Henstridge (Southern Pacific Petroleum) permitted use of the Gladstone basalt date. Reports on dating of Victorian basalts were supplied by K.G. Bowen, R.J. Nott through the Director, Geological Survey of Victoria. M.J. Sheard (South Australian Dept. of Minerals and Energy) supplied information on South Australian basalts. Prof. P.J. Stephenson (James Cook University of North Queensland) generously supplied information on age ranges of basalts in the Hoy region and has greatly encouraged the authors studies. I. McDougall (Australian National University) supplied an advance copy of his work with R.A. Duncan. The Australian Museum Trust supplied funds for radiometric age dating of basaltic rocks (AMDEL, Adelaide, South Australia) and fission track dating of associated zircons (Geotrack Intl., University of Melbourne), as well as providing field and other logistic support, including assistance for drafting of diagrams (K. Hollis and A. Valja).
BARBETTI M. & SHEARD M.J. 1981. Palaeomagnetic results from Mounts Gambier and Schank, South Australia. Journal of the Geological Society of Australia 18, 385-394. BARRON L.M. 1987. Summary of petrology and chemistry of rocks from the Sapphire project. Unpublished Petrological Report 87/9. Geological Survey of New South Wales Report GS1987/050. BICKEL R.S. 1976. Cape Vogel Basin. In Leslie R.B., Evans H.J. & Knight C.L.E. eds. Economic Geology of Australia and Papua New Guinea: 3. Petroleum, pp.506-513. Australian Institute of Mining and Metallurgy, Parkville, Victoria. BISHOP P., YOUNG R.W. & McDOUGALL I. 1985. Stream profile change and long term landscape evolution - Early Miocene and Modern rivers of the east Australian highland crest, New South Wales. Journal of Geology 93, 455-474. BIRCH W.D. 1979. Mineralogy and geochemistry of the leucitite at Cosgrove, Victoria. Journal of the Geological Society of Australia 25, 369-385. BOWDEN A.R. & COLHOUN E.A. 1984. Quaternary emergent shorelines of Tasmania. In Thom B.G. ed. Coastal Geomorphology in Australia, pp.313-342. Academic Press, Sydney. BOWEN K.G. 1975. Potassium-argon dates determinations carried out by the Geological Survey of Victoria. Geological Survey of Victoria Report 1975/3.
REFERENCES
BROWN B.R. 1976. Bass Basin, some aspects of petroleum geology. In Leslie R.B., Evans H.J. & Knight C.L. eds. Economic Geology of Australia and Papua New Guinea 3. Petroleum, pp.67-82. Australian Institute of Mining and Metallurgy, Parkville, Victoria.
ADAMS C.J. 1981. Migration of Late Cainozoic vulcanism in the South Island of New Zealand and the Campbell Plateau. Nature 294, 153-155.
CANDE S.C. & MUTTER J.C. 1982. A revised identification of the oldest sea-floor spreading anomalies between Australia and Antarctica. Earth and Planetary Science Letters 58, 151-160.
ANONYMOUS 1985. Summary of activities of the Geological Survey of Queensland for the year ended 30 June 1985. Geological Survey of Queensland Record 1985/52 (unpublished). BAILLIE P.W. 1986. Radiometric ages for Circular Head and the Green Hills basalt, northwestern Tasmania. Unpublished Report, Department of Mines, Tasmania 1986/39. BAILLIE P.W. 1987. A Paleocene radiometric age for basalt at Bream Creek, south-eastern Tasmania. Unpublished Report, Department of Mines, Tasmania 1987/21.
CLAGUE D.A. & DALRYMPLE G.B. 1987. The Hawaiian-Emperor volcanic chain: part 1. geologic evolution. United States Geological Survey Professional Paper 1350, 5-54. CLOETINGH S. & WORTEL R. 1986. Stress in the Indo-Australian plate. Tectonophysics 132, 49-68. COFFIN M.F., DAVIES H.L. & HAXBY W.F. 1986. Structure of the Kerguelen Plateau province from Seasat altimetry and seismic reflection data. Nature 324, 134-136.
Cainozoic Volcanism and 'hotspot' magma sources
37
COX A. & ENGEBRETSON D. 1985. Change in motion of Pacific plate at 5 Myr BP. Nature 313, 472-475.
1. New South Wales Institute of Technology, Sydney.
CROCKET K.D., ULLMAN W.J. & TORGERSEN T. 1988. Groundwaters with unradiogenic 87 Sr/86Sr ratios in the Great Artesian Basin, Australia. Geology 16, 59-63.
ETHERIDGE M.A., BRANSON J.C., FALVEY D.A., LOCKWOOD K.L., STUART-SMITH P.G. & SCHERL A.S. 1984. Basin-forming structures and their relevance to hydrocarbon exploration in Bass Basin, south eastern Australia. Bureau of Mineral Resources Journal of Australian Geology and Geophysics 9, 197-206.
CULL J.P. 1982. An appraisal of Australian heatflow data. Bureau of Mineral Resources Journal of Australian Geology and Geophysics 7, 11-21. DAVIDSON J.K. & MORRISON K.C. 1986. A comparison of hydrocarbon plays in the Bass, Gippsland, Otway and Taranaki Basins. 2ndPESA Symposium, Melbourne. DENHAM D. 1985. The Tasman Sea earthquake of 25 November 1983 and stress in the Australian plate. Tectonophysics 111, 329-338. DUNCAN R.A. 1981. Hotspots in the southern oceans - an absolute frame of reference for motion of the Gondwanan continents. In Solomon S.C., van der Voo R. & Chinnery M.A. eds. Quantitative Methods of Assessing Plate Motions. Tectonophysics 74, 29-42. DUNCAN R.A. & McDOUGALL I. 1989. Timespace Relationships. In Johnson R.W. ed. Intraplate Volcanism in Eastern Australia and New Zealand, pp.43-54. Australian Academy of Science, Canberra and Cambridge University Press. EITTREIM S.L., HAMPTON M.A. & CHILDS J.R. 1985. Seismic reflection signature of Cretaceous continental break up on the Wilkes Land Margin, Antarctica. Science 229, 1082-1084. EMBLETON B.J.J. 1981. A review of the palaeomagnetism of Australia and Antarctica. In McElhinny M.W. & Valencio D.A. eds. Palaeoreconstruction of the Continents pp.77-92. American Geophysical Union, Geodynamics Series 2. EMBLETON B.J.J. & McELHINNY M.W. 1982. Marine magnetic anomalies, palaeomagnetism and the drift history of Gondwanaland. Earth and Planetary Science Letters 58, 141-150. EMBLETON B.J.J., SCHMIDT P.W., HAMILTON L.H. & RILEY G.H. 1985. Dating volcanism in the Sydney Basin: Evidence from K-Ar ages and palaeomagnetism. In Sutherland F.L., Franklin B.J. & Waltho E.A. Volcanism in Eastern Australia, with Case Histories from New South Wales pp.59-72. Publications of the Geological Society of Australia, New South Wales Division
EWART A. 1982. Petrogenesis of the Tertiary orogenic volcanic series of southern Queensland, Australia, in the light of trace element geochemistry and O, Sr, and Pb, isotopes. Journal of Petrology 23, 344-382. EWART A. & GRENFELL A. 1985. Cainozoic volcanic centres of Southeastern Queensland with special reference to the Main Range, Bunya Mountains and the volcanic centres of the northern Brisbane coastal region. Papers of the Department of Geology, University of Queensland 11, 1-57. FALVEY D.A. & MUTTER J.C. 1981. Regional plate tectonics and the evolution of Australia's passive continental margins. Bureau of Mineral Resources Journal of Australian Geology and Geophysics 6, 1-29. FARRAR E. & DIXON J.M. 1984. Overriding of the Indian-Antarctic Ridge: origin of Emerald Basin and migration of late Cainozoic volcanism in southern New Zealand and Campbell Plateau. Tectonophysics 104, 243-256. FISHER R.L. & SCLATER J.G. 1983. Tectonic evolution of the South West Indian Ocean since the mid-Cretaceous: Plate motions and stability of the pole of Antarctica/Africa for at least 80 Myr. Geophysical Journal of the Royal Astronomical Society 73, 553-576. GREEN D.C. 1982. Soda springs and C0 2 discharges in Tasmania as an index of enhanced geothermal gradient. Abstract, Stable isotopes in the Environment Workshop, Canberra, 23-24 August 1982. GREEN D.C. & STEVENS N.C. 1975. Age and stratigraphy of Tertiary volcanic and sedimentary rocks of the Ipswich district, southeast Queensland. Queensland Government Mining Journal 76, 148-150. GRIFFIN T.J. & McDOUGALL I. 1975. Geochronology of the Cainozoic McBride Volcanic Province, Northern Queensland. Journal of the Geological Society of Australia 22, 387-396.
38
F.L. Sutherland
GRIFFIN W.L., SUTHERLAND F.L. & HOLLIS J.D. 1987. Geothermal profile and crust-mantle transition beneath east-central Queensland: volcanology, xenolith petrology and seismic data. Journal of Volcanology and Geothermal Research 31, 177-203. GUNN P.J. 1975. Mesozoic-Cainozoic tectonics and igneous activity: Southeastern Australia. Journal of the Geological Society of Australia 22, 215-221. HARDING R.R. 1966. Catalogue of age determinations on Australian rocks, 1962-1965. Bureau of Mineral Resources, Geology and Geophysics, Australia, Report 117. HARRINGTON H.J. & KORSCH R.J. 1985. Late Permian to Cainozoic tectonics of the New England Orogen. Australian Journal of Earth Sciences 32, 181-203. HARTNADY C.J.H. & Le ROEX A.P. 1985. Southern Ocean hotspot tracks and the Cainozoic absolute motion of the African, Antarctic, and South American plates. Earth and Planetary Science Letters 75, 245-257. HAXBY W.F., KARNER C.D., LaBRECQUE J.L. & WEISSEL J.K. 1983. Digital images of combined oceanic and continental data sets and their use in tectonic studies. EOS 64 (52), 995-1004. HOLLIS J.D. & SUTHERLAND F.L. 1985. Occurrences and origins of gem zircons in eastern Australia. Records of the Australian Museum 36, 299-311. HOLLIS J.D., SUTHERLAND F.L. & POGSON R.E. 1983. High pressure minerals and the origin of the Tertiary breccia pipe, Ballogi gem mine, near Proston, Queensland. Records of the Australian Museum 35, 181-194. HONZA E., DAVIES H.L., KEENE J.B. & TIFFIN D.L. 1987. Plate boundaries and evolution of the Solomon Sea region. Geo-Marine Letters 7, 161-168. IDNURM M. 1985a. Late Mesozoic and Cainozoic palaeomagnetism of Australia: I. A redetermined apparent polar wander path. Geophysical Journal of the Royal Astronomical Society 83, 399-418. IDNURM M. 1985b. Late Mesozoic and Cainozoic palaeomagnetism of Australia: II. Implications for geomagnetism and true polar wander. Geophysical Journal of the Royal Astronomical Society 83, 419-433. IDNURM M. 1986. Late Mesozoic and Cainozoic palaeomagnetism of Australia: III. Bias-corrected
pole paths for Australia, Antarctica and India. Geophysical Journal of the Royal Astronomical Society 86, 277-287. JOHNSON G.L., KYLE P.R., VANNEY J.R. & CAMPSIE J. 1982. Geology of Scott and Balleny Islands, Ross Sea, Antarctica, and morphology of adjacent seafloor. New Zealand Journal of Geology & Geophysics 25, 427-436. JOYCE E.B. 1975. Quaternary volcanism and tectonics in southeastern Australia. In Suggate R.P. & Cress well M.M eds. Quaternary Studies, pp. 169-176. The Royal Society of New Zealand, Wellington. JOSHIMA M., OKUDA Y., MURAKAMI F., KISIMOTO H. & HONZA E. 1987. Age estimation of the Solomon Sea based on heat flow data. Geo-Marine Letters 6, 211-218. JURDY D.M. 1987. Plates and their motions. Reviews of Geophyics 25, 1286-1292. JURDY D.M. & GORDON R.G. 1984. Global plate motions relative to the hotspots 54 to 56 Ma. Journal of Geophysical Research 89 (B12), 9927-9936. KARNER G.D. 1985. Thermally induced residual topography within oceanic lithosphere. Nature 318, 527-531. KARNER G.D. & WEISSEL J.K. 1984. Thermally induced uplift and lithospheric flexural readjustment of the eastern Australian highlands. Geological Society of Australia Abstracts Series 12, 293-294. KLOOTWIJK C.T. & PEIRCE J.W. 1979. India's and Australia's pole path since the late Mesozoic and the India-Asia collision. Nature 282, 605-607. KROENKE L.W. 1984. Cainozoic tectonic development of the Southwest Pacific. United Nations Economic and Social Commission for Asia and the Pacific Committee for Co-ordination of Joint Prospecting for Mineral Resources in South Pacific Offshore Areas, Technical Bulletin 6. KROENKE L.W. 1985. Tectonic Evolution of the Southwest Pacific. Hawaii Institute of Geophysics, University of Hawaii (Unpublished Workshop Paper). LANDMESSER C.W., ANDREWS J.E. & PACKHAM G.H. 1975. Aspects of the geology of the eastern Coral Sea and Western New Hebrides basin. In Andrews J.E. & Packham G.H. eds. Initial Reports of the Deep Sea Drilling project 30, pp.637-642. United States Government Printing Office, Washington, D.C.
Cainozoic Volcanism and 'hotspot' magma sources LIU C.S., CURRAY J.R. & McDONALD J.M. 1983. New constraints on the tectonic evolution of the eastern Indian Ocean. Earth and Planetary Science Letters 65, 331-342. LOWRY D.C. 1988. Alternative Cretaceous history of the Gippsland Basin. Australian Journal of Earth Sciences 35, 181-194. LUYENDYK B.P., MACDONALD K.C. & BRYAN W.B. 1973. Rifting history of the Woodlark Basin in the southwest Pacific. Geological Society of America Bulletin 84, 1125-1134. McCONNOCHIE M.J. & HENSTRIDGE D.A. 1985. The Lowmead Graben-geology, Tertiary oil shale genesis and regional tectonic implications. Australian Journal of Earth Sciences 32, 205-218. MCDONOUGH W.F., MCCULLOCH M.T. & SUN S.S. 1985. Isotopic and geochemical systematics in Tertiary - Recent basalts from southeastern Australia and implications for the evolution of the sub-continental lithosphere. Geochimica et Cosmochimica Acta 49, 2051-2067. McDOUGALL I. & DUNCAN R.A. 1988. Age progressive volcanism in the Tasmantid Seamounts. Earth and Planetary Science Letters 89, 207-220. McDOUGALL I., EMBLETON B.J.J. & STONE D.B. 1981. Origin and evolution of Lord Howe Island, south-west Pacific Ocean. Journal of the Geological Society of Australia 28, 155-176. McKENZIE D.A., NOTT R.J. & BOLGER P.F. 1984. Radiometric age determinations. Geological Survey of Victoria Report 74. MENZIES M.A. & WASS S.Y. 1983. C0 - and LREE - rich mantle below Eastern Australia: A REE and isotope study of alkaline magmas and apatite - rich mantle xenoliths from the Southern Highlands Province, Australia. Earth and Planetary Science Letters 65, 287-302. MEISSNER R. & KOPNICK M. 1988. Structure and evolution of passive margins: the plume model again. Journal of Geodynamics 9, 1-13. MIDDLEMOST E.A.K. 1985. Miocene shield volcanoes of New South Wales. In Sutherland F.L., Franklin B.J. & Waltho E.A. Volcanism in Eastern Australia, with Case Histories from New South Wales, pp.49-58. Publications of the Geological Society of Australia, New South Wales Division 1. New South Wales Institute of Technology, Sydney. MIDDLETON M.F. & SCHMIDT P.W. 1982. Palaeo-thermometry of the Sydney Basin. Journal of Geophysical Research 87 (B7), 5351-5359. 2
39
MIYASHIRO A. 1986. Hot regions and the origin of marginal basins in the western Pacific. Tectonophysics 122, 195-216. MOORE J.A. & KYLE P.R. 1986. Mantle upwelling and evolution of phonolitic magmas at Ross Island, Antarctica. International Volcanological Congress Abstracts Auckland-Hamilton-Rotorua, 188.
MOORE M.E., GLEADOW A.J.W. & LOVERING J.F. 1986. Thermal evolution of rifted continental margins: new evidence from fission tracks in basement apatites from southern Australia. Earth and Planetary Science Letters 78, 255-270. MORLEY M.E., GLEADOW A.J.W. & LOVERING J.F. 1981. Evolution of the Tasman Rift: Apatite fission track dating evidence from the southeastern Australian continental margin. In Cress well M.M. & Vella P. eds. Gondwana Five, pp.289-293. Balkema, Rotterdam. MUTTER J.C. 1977. The Queensland Plateau. Bureau of Mineral Resources, Geology and Geophysics Australia, Bulletin 179. MUTTER J.C. & KARNER G.D. 1980. The continental margin off northeastern Australia. In Henderson R.A. & Stephenson P.J. eds. The Geology and Geophysics of North Eastern Australia, pp.47-69. Geological Society of Australia, Queensland Division, Brisbane. NELSON D.R., McCULLOCH M.T. & SUN S.S. 1986. The origins of ultrapotassic rocks as inferred from Sr, Nd and Pb isotopes. Geochimica et Cosmochimica Acta 50, 231-245. NORTON I.O. & SCLATER J.G. 1979. A model for the evolution of the Indian Ocean and the breakup of Gondwanaland. Journal of Geophysical Research 84, 6803-6830. OLLIER C.D. 1982. Geomorphology and tectonics of the Armidale region. In Flood P.G. & Runnegar B. eds. New England Geology, pp. 141-147. Department of Geology, University of New England and A.H. Voisey Club, Armidale, New South Wales. O'REILLY S.Y. & GRIFFIN W.L. 1984. Sr isotopic heterogeneity in primitive basaltic rocks, southeastern Australia: correlation with mantle metasomatism. Contributions to Mineralogy and Petrology 87, 220-230. OWEN M. & WYBORN D. 1979. Geology and Geochemistry of the Tantangara and Brindabella areas. Bureau of Mineral Resources, Geology & Geophysics, Australia, Bulletin 204.
40
F.L. Sutherland
PIGRAM C.J. & DA VIES H.L. 1987. Terranes and the accretion history of the New Guinea Orogen. Bureau of Mineral Resources Journal of Australian Geology and Geophysics 10, 193-211. PILGER R.H. 1982. The origin of hotspot traces: evidence from Eastern Australia. Journal of Geophysical Research 87 (B5), 1825-1834. POLLITZ F.F. 1986. Pliocene change in Pacificplate motion. Nature 320, 738-741. ROBERTSON A.D. 1985. Cainozoic volcanic rocks in the Bundaberg-Gin Gin-Pialba area, Queensland. Papers of the Department of Geology, University of Queensland 11, 72-92. ROBERTSON A.D., SUTHERLAND F.L. & HOLLIS J.D. 1985. Upper mantle xenoliths and megacrysts and the origin of the Briggoda Basalt and Breccia, near Proston, Queensland. Papers of the Department of Geology, University of Queensland 11, 58-71. ROOTS W.D. 1986. Chaotic magnetic patterns in marginal seas and small ocean basins have similar origin to structural magnetic quiet zones in deep oceans. Marine Geophysical Researches 8, 383-389. SCHMIDT P.W. & EMBLETON B.J.J. 1981. Magnetic overprinting in Southeastern Australia and the thermal history of its rifted margin. Journal of Geophysical Research 86 (B5), 3998-4008. SCHOUTEN H., KLITGORD K.D. & WHITEHEAD J.A. 1985. Segmentation of mid-ocean ridges. Nature 317, 225-229. SHARPLES C. & KLOOTWIJK C.T. 1981. Palaeomagnetic results from the Gordon Subgroup of Tasmania: further evidence for a Late Cretaceous magnetic overprint in southeastern Australia. Papers and Proceedings of the Royal Society of Tasmania 115, 85-91. SHAW R.D. 1978. Sea floor spreading in the Tasman Sea: A Lord Howe Rise - Eastern Australian Reconstruction. Australian Society of Exploration Geophysicists Bulletin 9, 75-81. SHIBOAKA M. & BENNETT A.J.R. 1977. Patterns of diagenesis in some Australian sedimentary basins. APEA Journal 17, 58-63. SMITH A.G. 1982. Late Cainozoic uplift of stable continents in a reference frame fixed to South America. Nature 296, 400-404. SMITH B.W., & PRESCOTT J.R. 1987. Thermoluminescence dating of the eruption at Mt Schank, South Australia. Australian Journal of Earth Sciences 34, 335-342.
STECKLER M.S. 1985. Uplift and extension at the Gulf of Suez: indications of induced mantle convection. Nature 317, 135-139. STEPHENSON P.J. & GRIFFIN T.J. 1976. Some long basaltic lava flows in North Queensland. In Johnson R.W. ed. Volcanism in Australasia, pp.41-51. Elsevier, Amsterdam. STEPHENSON P.J., GRIFFIN T.J. & SUTHERLAND F.L. 1980. Cainozoic volcanism in northeastern Australia. In Henderson R.A. & Stephenson P.J. eds. The Geology and Geophysics of Northeastern Australia, pp.349-374. Geological Society of Australia, Queensland Division, Brisbane. STOLZ A.J. 1985. The role of fractional crystallisation in the evolution of the Nandewar Volcano, Northeastern New South Wales, Australia. Journal of Petrology 26, 1002-1026. SUTHERLAND F.L. 1973. The geological development of the southern shores and islands of Bass Strait. Proceedings of the Royal Society of Victoria 85, 133-144. SUTHERLAND F.L. 1977. Cainozoic basalts of the Mt Fox area, North Queensland. Records of the Australian Museum 30, 532-543. SUTHERLAND F.L. 1978. Mesozoic-Cainozoic volcanism of Australia. Tectonophysics 48, 413-427. SUTHERLAND F.L. 1981. Migration in relation to possible tectonic and regional controls in Eastern Australian volcanism. Journal of Volcanological and Geothermal Research 9, 181-213. SUTHERLAND F.L. 1983. Timing, trace and origin of basaltic migration in eastern Australia. Nature 305, 123-126. SUTHERLAND F.L. 1985. Regional controls in eastern Australian volcanism. In Sutherland F.L., Franklin B.J. & Waltho E.A. eds. Volcanism in Eastern Australia, with Case Histories from New South Wales, pp. 13-32. Publications of the Geological Society of Australia New South Wales Division 1. New South Wales Institute of Technology, Sydney. SUTHERLAND F.L. 1987a. 'Boomerang' volcanic hotspot trails from Australia. International Union of Geodesy and Geophysics XIX General Assembly, Vancouver, Canada, Aug. 9-22, Abstracts VI, 1200. SUTHERLAND F.L. 1987b. A major thermal cycle contributing to late Palaeozoic-Mesozoic magmatism and mineralization, Pacific Rim,
Cainozoic Volcanism and 'hotspot' magma sources Australia. Proceedings of the Pacific Rim Congress 87, 413-416. Australian Institute of Mining and Metallurgy, Parkville, Victoria. SUTHERLAND F.L. 1989. Tertiary basaltic magmas and the Tasmanian lithosphere. In Burrett C.F. & Martin E.L. eds. Geology and Mineral Resources Deposits of Tasmania. R.M. Johnston Commemorative Volume. Special Publication Geological Society of Australia 15, 386-398. SUTHERLAND F.L. & WELLMAN P. 1986. Potassium argon ages of Tertiary volcanic rocks, Tasmania. Papers and Proceedings of the Royal Society of Tasmania 120, 77-86. SUTHERLAND F.L., ROBERTSON A.D. & HOLLIS J.D. 1988a. The Rockhampton Province - A Cretaceous central volcano migration? Geological Society of Australia Abstracts Series 21, 389-390. SUTHERLAND F.L., ROOTS W.D. & ROBERTSON A.D. 1988b. Late compression and relative rotation events between eastern Australia and the Tasman Sea floor. New England Orogen Tectonics and Metallogenesis Symposium, pp. 186-191. The University of New England, Armidale. SUTHERLAND F.L., STUBBS D. & GREEN D.C. 1977. K-Ar ages of Cainozoic volcanic suites, Bowen-St. Lawrence hinterland, North Queensland (with some implications for petrologic models). Journal of the Geological Society of Australia 24, 447-460. SYMONDS P.A., FRITSCH J. & SCHLUTER HU. 1984. Continental margin around the western Coral Sea Basin: structural elements, seismic sequences and petroleum geological aspects. In Watson S.T. ed. Transactions of the 3rd Circum Pacific Energy & Mineral Resources Conference, August 22-28 (1982). Honolulu, Hawaii. TORGERSEN T. & CLARKE W.B. 1987. Helium accumulation in groundwater: III. Limits on helium transfer across the mantle-crust boundary beneath Australia and the magnitude of mantle degassing. Earth and Planetary Science Letters 84, 345-355. VEEVERS J.J. ed. 1984. Phanerozoic Earth History of Australia. Clarendon, Oxford. VEEVERS J.J. 1986. Breakup of Australia and Antarctica estimated as mid-Cretaceous (95 ± 5 Ma) from the magnetic and seismic data at the continental margin. Earth and Planetary Science Letters 77, 91-99.
41
VOGT P.R. & CONOLLY J.R. 1971. Tasmantid Guyots, the age of the Tasman Basin, and motion between the Australia plate and the mantle. Geological Society of America Bulletin 82, 1577-1584. VOGT P.R., CHERKIS N.Z., FEDEN R.H. & MORGAN G.A. 1982. Projector Investigator I: Further analysis of a joint US-Australian aeromagnetic survey of the Australian-Antarctic discordance. Part I Magnetic anomalies and plate tectonic evolution. In James P.R., Jago J.B. & Oliver R.L. eds. Fourth International Symposium Antarctic Earth Sciences Abstracts. University of Adelaide, South Australia, August 1982. VOGT P.R., CHERKIS N.Z. & MORGAN G.A. 1983. Project investigator I Evolution of the Australian-Antarctic Discordance deduced from a detailed aeromagnetic study. In Oliver R.L., James P.R. & Jago J.B. eds. Antarctic Earth Science, pp.608-613. Australian Academy of Science, Canberra. WALCOTT R.I., CHRISTOFFEL D.A. & MUMME T.C. 1981. Bending within the axial tectonic belt of New Zealand in the last 9 Myr from palaeomagnetic data. Earth and Planetary Science Letters 52, 427-434. WEISSEL J.K. & HAYES D.E. 1971. Asymmetric sea floor spreading south of Australia. Nature 231, 518-522. WEISSEL J.K. & HAYES D.E. 1977. Evolution of the Tasman Sea reappraised. Earth and Planetary Science Letters 36, 77-84. WEISSEL J.K. & WATTS A.B. 1989. Tectonic evolution of the Coral Sea Basin. Journal of Geophysical Research 84, 4572-4582. WELLMAN P. 1974. Potassium-argon ages on the Cainozoic volcanic rocks of Eastern Victoria, Australia. Journal of the Geological Society of Australia 21, 359-376. WELLMAN P. 1978. Potassium-argon ages of Cainozoic volcanic rocks from the Bundaberg, Rockhampton and Clermont areas of eastern Queensland. Proceedings of the Royal Society of Queensland 89, 59-64. WELLMAN P. 1983. Hotspot volcanism in Australia and New Zealand: Cainozoic and midMesozoic. Tectonophysics 96, 225-243. WELLMAN P. & McDOUGALL I. 1974a. Cainozoic igneous activity in Eastern Australia. Tectonophysics 23, 49-65.
42
F.L. Sutherland
WELLMAN P. & McDOUGALL I. 1974b. Potassium-argon ages on the Cainozoic volcanic rocks of New South Wales. Journal of the Geological Society of Australia 21, 247-272. WELLMAN P., CUNDARI A. & McDOUGALL I. 1970. Potassium-Argon ages for leucite-bearing rocks from New South Wales, Australia. Journal and Proceedings of the Royal Society ofNew South Wales 103, 103-107. YAN C-Y. & KROENKE L.W. 1987. Cainozoic Indo-Australian plate-motion deduced from hotspot traces: global implications. American Geophysical Union Abstracts. Spring Conference, San Francisco.
YOUNG R.W. & BISHOP P. 1980. Potassiumargon ages in Cainozoic volcanic rocks in the Crookwell-Goulburn area, New South Wales. Search 11, 340-341. YOUNG R.W. & McDOUGALL I. 1982. Basalts and silcretes on the coast near Ulladulla, southern New South Wales. Journal of the Geological Society of Australia 29, 425-430. YOUNG R.W. & McDOUGALL I. 1985. The age, extent and geomorphological significance of the Sassafras basalt, southeastern New South Wales. Australian Journal of Earth Sciences 32, 323-331. YUEN D.A. & FLEITOUT L. 1985. Thinning of the lithosphere by small-scale convection destabilisation. Nature 313, 1225-128.
Cainozoic Volcanism and 'hotspot' magma sources
REGION (Figure 1)
%K
^ A r ^ x l O " 1 0 moles/g)
40
A r V 4 0 A r Total
Age (Ma)
Harrington (44) NU6 (biotite)
6.82, 6.83
2.4707
0.69
20.7 ± 0.3
N12544 (K-feldspar)
5.21, 5.21
4.1596
0.874
45.5 ± 0.4
2.148, 2.145
1.3363
0.926
35 ± 0.2
2.099, 2.096
0.58519
0.755
16.0 ± 0.2
SKC1 (Whole Rock)
3.77, 3.77
1.6547
0.957
25.1 ± 0.2
BWC1 (anorthoclase)
3.02, 3.01
1.4399
0.811
27.3 ± 0.2
Walcha (47) WA1 (anorthoclase) North Main Range (60) PR1 (anorthoclase) Buckland (65)
Bauhinia (66) CQ76 (WR)
1.632, 1.637
0.75774
0.888
26.5 ± 0.3
CQ78 (WR)
1.795, 1.799
0.81871
0.890
26.1 ± 0.3
Monto (67) CQ11 (WR)
1.55, 1.55
0.5594
0.416
20.7 ± 0.4
0.5492
0.242
20.3 ± 0.4
CQ15 (WR)
1.71, 1.71
0.7536
0.776
25.2 ± 0.3
RHla (WR)
1.753, 1.753
0.83279
0.921
27.1 ± 0.3
1.66, 1.66
0.7715
0.853
26.6 ± 0.4
NHF (K-oligoclase)
1.054, 1.070
0.5816
0.818
31.5 ± 0.2
CP2 (WR)
2.600, 2.600
1.5025
0.935
33.0 ± 0.2
NH1 (WR)
1.074, 1.070
0.6383
0.884
34.0 ± 0.2
BHC1 (WR)
1.73, 1.72
1.0440
0.901
34.6 ± 0.4
1.168
0.030182
0.410
1.49 ± 0.05
1.165
0.028660
0.404
1.42 ± 0.05
CC1 (WR)
1.619, 1.614
0.60924
0.738
21.6 ± 0.3
CC2 (WR)
0.921, 0.920
0.34123
0.774
21.2 ± 0.3
2.035, 2.037
0.13169
0.586
3.72 ± 0.06
Springsure (69) MTS1 Clermont (72)
Mt Fox (81) SRI (WR)
Silver Plains (88) 80140021 (WR)
APPENDIX: Additional K-Ar age dates, eastern Australian volcanic rocks.
43
The evolution of the carbonate platforms of northeast Australia
P.J. DAVIES, P.A. SYMONDS, D.A. FEARY and C.J. PIGRAM Division of Marine Geosciences and Petroleum Geology, Bureau of Mineral Resources, Canberra, Australia. The carbonate platforms of northeast Australia, the Great Barrier Reef province and the Eastern, Queensland and Marion Plateaux, contain a record of the complex interactions between the factors which controlled carbonate deposition over the past 60 million years. Analysis of the extensive geological and geophysical data shows that both long-term (plate motion and subsidence) and short-term (rifting, eustasy, climate, oceanography, and collision) factors influenced platform evolution: — The size, shape and location of the high standing structural features on which the carbonate platforms developed was determined by continental rifting. — Northward plate movement controlled the distribution of climate-related facies within the Great Barrier Reef sequence, resulting in a southward thinning and younging tropical carbonate wedge overlying temperate and subtropical facies. — Large-scale facies distribution patterns reflect the complexities of the subsidence regimes which affected the northeast Australian platforms. The simple subsidence situation, where high subsidence rates favouring backstepping are succeeded by lower subsidence rates favouring progradation, was complicated by episodes of accelerated subsidence. — Sea level variation directly controlled platform facies: rising and high sea level periods favoured increased carbonate deposition; whereas falling and low sea levels restricted carbonate deposition, caused increased terrigenous input along the shelf, and in many cases resulted in exposure of the platforms and the formation of unconformities. — In addition to the overall climatic consequence of northward plate motion, facies sequences show the effects of the development throughout the Cainozoic of more pronounced latitudinal climatic zonation and progressive high latitude cooling. — Chemical and physical oceanographic factors affected platform evolution in various ways, e.g. the inhibition of reef development by high oceanic phosphate levels during the Early and Middle Miocene, and deposition of facies reflecting the progressive development of the east Australian current from the Miocene. — The development of a foreland basin on the northern edge of the northeast Australian region initially caused a dramatic expansion of carbonate facies, but ultimately terminated carbonate deposition as a result of uplift and inundation by clastic detritus. General conclusions applicable to other carbonate platforms may be deduced from analysis of the factors which controlled deposition on the northeast Australian platforms. The evolution of any particular carbonate platform will be fundamentally dependent on whether the subsidence history is simple or complex; whether plate motion is towards or away from the tropics; and whether movement from one climatic regime to another is slow or rapid. Short-term eustatic, climatic and oceanographic factors are responsible for complexities in the facies sequences produced. The most complex and varied carbonate platform sequences will be those deposited under the influence of compound subsidence, together with plate motion through a range of climatic zones over a substantial time period. The northeast Australian carbonate platforms illustrate such a complex history, and demonstrate that facies diachroneity is a fundamental characteristic of complex carbonate platform development. Key words: Cainozoic carbonate platforms; collision; Great Barrier Reef; Marion Plateau; northeast Australia; palaeoclimate; plate motion; Queensland Plateau; rifting; sea level; subsidence 44
The evolution of the carbonate platforms of northeast Australia
INTRODUCTION The sediments which form carbonate platforms contain a record of vertical and horizontal tectonic effects, sea level change, and palaeoclimatic and palaeoceanographic variation as a result of their dominantly biological, shallow water origin. Carbonate platforms commonly occur in a passive margin setting, and they contain almost 50% of global oil and gas reserves. Their study is therefore of considerable economic and scientific importance. Current knowledge of carbonate platform evolution is based almost exclusively on studies in the Caribbean region, particularly of the Blake Plateau and Bahama platform (Hollister et al 1972; Schlager & Ginsburg 1981; Austin et al 1986). In addition, seismic studies of the eastern margin of the USA have revealed Jurassic and Cretaceous carbonate platforms which extend from the latitudes of New England to Florida (Sheridan et al 1981; Jansa 1981), and into the Gulf of Mexico (Kauffman 1984). Studies of these carbonate platforms along the eastern margin of the USA and in the Caribbean have provided a model for the evolution of passive margin platforms. Analysis of the Cainozoic evolution of the northeast Australia continental margin provides a different perspective, and one which appears to be more complete. The Great Barrier Reef and the Eastern, Queensland and Marion Plateaux (Fig. 1) are major carbonate platforms. Studies by the Australian Bureau of Mineral Resources since the 1970s (Davies 1983; Symonds et al 1983; Davies et al 1988) have provided new insights into the development of these platforms and their evolutionary relationships. Further, these studies have defined the major operative processes, and the relationships between process and product. The Cainozoic history
45
of the northeast Australian margin illustrates a 60 million year history of platform development including both initiation and demise, and demonstrates the facies diachroneity resulting from the complex interdependence of the factors controlling platform evolution. Our objectives in this paper are to describe the major features of the platforms; to describe the major processes controlling platform development; and to discuss the global implications of this study in terms of the long- and short-term factors which control carbonate platform development, emphasising both the major features and principal stages of development, and the dynamic interactions between the controlling factors.
REGIONAL TECTONIC SETTING The passive continental margin off northeastern Australia extends over a distance of about 2,000 km between Fraser Island in the south and the Gulf of Papua in the north, and covers an area of some 930,000 km2 (Figs. 1 and 2). The margin is comprised of a number of marginal plateaux and rift troughs: the Eastern, Queensland and Marion Plateaux; the Pandora and Bligh Troughs; the Osprey Embayment; and the Queensland and Townsville Troughs. In addition a zone of narrow rift basins, which extend southeast from the Queensland Trough towards the Capricorn Basin, separate the Marion Plateau from the continental shelf. The entire margin is generally considered to be underlain by modified continental crust formed as a result of fragmentation of a northeastern extension of the Tasman Fold Belt (Gardner 1970; Ewing et al 1970; Falvey 1972; Falvey & Taylor 1974; Taylor 1975; Mutter 1977; Taylor & Falvey 1977; Mutter & Karner 1980; Symonds 1983; Symonds et al 1984).
46
P.J. Davies, P.A. Symonds, D.A. Feary & C.J. Pigram
GULF OF
,
•6B 4
PAPUA
PAPUA
•BC
GUINEA
\
Osprey^
^mba^mehi C O R A L SEA BASIN
Cooktown
Ml ^Queensland 3 ) ] / ( Plateau 1 Holmes )
R€ef J
AUSTRALIA
To fans
Townsville
12W' Marion PJateau
j Cato Trough
200 km
Swajh? ReefS;.
Gladstone
Tasman
dfraser Island
Basin
Fig 1 Locality map showing the principal bathymetric features of the northeast Australian continental margin (modified after Taylor 1977 and Marshall 1977). Areas of modern reef growth are screened; ABP designates the Ashmore-Boot-Portlock reef system. The locations of figured seismic sections are also shown (e.g. 6A shows the location of Fig. 5A).
The evolution of the carbonate platforms of northeast Australia
47
Fig 2 Map showing the major structural features of northeast Australia (based on Davies et al 1988). The location of exploration wells (BB — Borabi 1; P — Pasca Al & CI; AC — Anchor Cay 1; M — Michaelmas Cay; AQ — Aquarius 1; CP — Capricorn 1A; W — Wreck Reef; H — Heron Island) and DSDP Site 209 are also shown.
48
P.J. Davies, P. A. Symonds, D.A. Feary & C.J. Pigram
The rift phase of margin development, which may have commenced in the Early Cretaceous but was certainly in progress by the Late Cretaceous, preceded continental breakup and the formation of small ocean basins to the east and south (Coral Sea Basin, Cato Trough and Tasman Basin). Tasman Basin seafloor spreading commenced in the Late Cretaceous (80 Ma BP) (Hayes & Ringis 1973; Weissel & Hayes 1977; Shaw 1978), and then extended northwards to form the Cato Trough and Coral Sea Basin by the Palaeocene (65 Ma BP) (Weissel & Watts 1979). Sea-floor spreading had ceased along the length of this system by the earliest Eocene (56 Ma BP). The nature and development of the northern end of the rift system in the Bligh and Pandora Trough region (Fig. 2) appears to have been even more complex. These troughs were initially formed during Late Cretaceous rifting, and were re-activated in the Late Oligocene by foreland basin development (Davies et al 1988). Although the exact structural style and development history of the rift system of the northeast Australia region is not fully understood, there is little doubt that it has controlled the gross architecture of the margin and the form of the high-standing structural elements on which the carbonate platforms have evolved. THE CARBONATE PLATFORMS OF NORTHEAST AUSTRALIA The northeast Australian carbonate platforms are comparable in size to any platforms known in the geological record. The Great Barrier Reef is as large as the Cretaceous and Jurassic reef systems of the eastern USA; the Marion Plateau is almost as large as the Blake Plateau; and the Queensland Plateau is as large as the combined areas of the Great and Little Bahama Banks. The carbonate platforms of
northeast Australia range from the mixed siliciclastic/carbonate Great Barrier Reef to the purely carbonate-dominated oceanic regime of the Queensland Plateau. The most comprehensively studied platform in northeast Australia is the Great Barrier Reef, where integrated geological and geophysical investigations have provided the basis for models of reef growth and platform evolution (Davies 1983; Symonds et al 1983). Our understanding of the structure and composition of the marginal plateaux is based on regional seismic studies and limited geological sampling. The models derived from the detailed studies on the Great Barrier Reef have been used as the basis for interpreting carbonate platform development on the marginal plateaux. Great Barrier Reef The Great Barrier Reef is approximately 2,000 km long and comprised of about 2,500 reefs. The shelf occupied by the Great Barrier Reef is generally narrowest in the north (minimum width of 23 km occurs at 14°S) and widens to the south (maximum width of 290 km at 21°S). Reefs occupy the whole shelf in the northern region, but only the mid to outer shelf in the central and southern parts. The Great Barrier Reef is a very diverse physiographic province (Maxwell 1968; Hopley 1982), and may be divided into five distinct areas using the terminology most commonly applied to carbonate platforms (Ginsburg & James 1974; Wilson 1975): 1. The northernmost area (9-16°S) is a narrow, rimmed, high energy platform (Fig. 3A). This zone is characterised by a shallow, narrow shelf (generally 50-75 km wide) and steep continental slope (10-60°). Reefs have grown across the full width of the shelf, occurring as large mid shelf platform reefs, and as an almost continuous line of ribbon reefs which form the outer barrier.
The evolution of the carbonate platforms of northeast Australia 145°
49
150°
Fig 3 Physiographic variation throughout the Great Barrier Reef province. A — narrow, rimmed platform (nomenclature after Ginsburg & James 1974; Wilson 1975); B — narrow, partially rimmed platform; C — wide, unrimmed platform; D — extremely wide, rimmed platform; E — narrow, unrimmed platform.
2. Between 16°S and 18°S the shelf is a narrow, partially rimmed, high energy platform (Fig. 3B). The shelf is 50-75 km wide, with a steep continental slope. Reefs generally occur on the mid to outer shelf, and are separated from the coast by a channel or inner lagoon approximately 35 m deep. The outer shelf ribbon reefs are less continuous to the south, and are replaced by a line of shoals on the shelf edge. 3. The central Great Barrier Reef (18-20°S) is a wide, unrimmed, high energy platform (Fig. 3C). The shelf is 90-125 km
wide, with a gentle continental slope (<2°). Reefs are sparse and largely restricted to the outer shelf. A drowned barrier reef complex which occurs on a 75 m terrace at the shelf break extends for some 200 km (Davies & Montaggioni 1985). 4. Between 20°S and 22°S the shelf is an extremely wide, rimmed, high energy platform (Fig. 3D). The shelf width ranges from 125 km in the northwest to 290 km in the southeast. The gentle, narrow continental slope passes northeastwards into the Marion Plateau. Reefs are confined to the outer one-
50
P.J. Davies, P. A. Symonds, D.A. Feary & C.J. Pigram
MARION PLATEAU
• •
NE
Foreland basin sedimentation
Q
Sag-phase sedimentation
Tm
Miocene
To
Oligocene
Te
Eocene
Rift-phase sedimentation Pre-rift sedimentation Basement
Tp
Quaternary Pliocene
Tpa Paleocene K Kl Ke
Cretaceous Late Early
Mz Mesozoic Reefs/carbonate platforms
Pz
Palaeozoic
Subtropical carbonate/ temperate buildups v v v
V V
Vo/canics
Fig 4 Schematic sections showing generalised structural and sedimentary geometry beneath the northern (A), central (B), and southern (C) Great Barrier Reef province. MR1, MR2 indicate different phases of carbonate platform development on the Marion Plateau (see Fig. 8). Section locations are shown on the inset.
The evolution of the carbonate platforms of northeast Australia
51
Pandora Reef Prospect
Fig 5 Seismic sections showing buried or partially buried reef complexes in the Gulf of Papua and northern Great Barrier Reef. Section locations are shown on Figure 1. (M is the first water bottom multiple) A. Airgun seismic section over a buried Miocene reef at the northern end of the Ashmore-Boot-Portlock reef complex. The early stage of carbonate buildup (perhaps a subtropical algal mound — A), developed on the corner of a fault block, is overlain by more areally restricted reef facies (R). A leeside talus facies (T) may also be present. The entire complex is buried by fluvioclastic sediments (F) derived from the west. B. Seismic section showing the Miocene Borabi Reef trend in the Gulf of Papua. C. Seismic section showing the Miocene Pasca Reef complex sitting on a structural high in the Gulf of Papua. D. Sparker seismic section across the saddle between Boot and Portlock Reefs showing buried and submerged portions of reef (R) and a possible leeside talus facies (T). The reef complex has been partially buried by fluvioclastic sediments (F) derived from the west. E. Airgun seismic section across the edge of the Torres shelf showing the buried northern extension of the modern shelf edge ribbon reefs. Plio-Pleistocene reefs (R) overlie a broader Miocene buildup, which may consist in part of a subtropical algal mound (A). F. Sparker seismic profile across the outer Torres shelf, showing a 100 m thick ?Pleistocene reef (R) partially buried by terrigenous sediment.
52
P.J. Davies, P. A. Symonds, D.A. Feary & C.J. Pigram
third of the shelf, but are separated from the shelf edge by several kilometres of relatively deep shoals. 5. In the south (23-24°S) the shelf is a narrow, unrimmed, high energy platform (Fig. 3E). The shelf is up to 100 km wide, with reefs occupying a narrow zone on the mid shelf. The shelf edge occurs some 12-20 km east of the reefs and in about 70 m of water. No drowned barrier reefs have been found along the shelf edge although reef materials, apparently in situ, have been reported from the slope in 175 m of water (Veeh & Veevers 1970). The physiographic variation throughout the modern Great Barrier Reef province includes many features which other authors have placed within an evolutionary sequence (e.g. Read 1985). Their existence at one time suggests that process diachroneity is a fundamental factor in platform evolution. The major characteristics of the Great Barrier Reef carbonate platform have been deduced from extensive geological (e.g. Davies 1977; Davies 1983; Davies & Marshall 1985) and geophysical (summarised in Symonds et al 1983; Davies et al 1988) investigations, and are summarised on schematic sections (Fig. 4). In the northern Great Barrier Reef and Gulf of Papua, the occurrence of subsurface reefs are well documented by seismic data and drill holes (Tanner 1969; Tallis 1975) (Figs. 4 and 7A). Miocene reefs occur in the subsurface of the Gulf of Papua (Fig. 5A-C), and Pliocene reefs and Miocene limestones containing algal rhodoliths occur at the northern end of the Great Barrier Reef (Marshall 1983) in Anchor Cay 1 (Fig. 7A). Seismic data acquired by the Bureau of Mineral Resources (Davies et al 1988) in the northern area confirms both the presence of buried reefs and the existence of a thick reef section (Fig. 5D-F). Our seismic data indicates that a major reef structure occurs in the continental slope sequence on the western margin of the Pandora Trough (Fig. 2) between Portlock and Boot Reefs. The data
shows that these modern reefs are constructed on a more extensive Miocene and Pliocene reef complex up to 1.5 km thick. On the adjacent shelf, there are ?Miocene/ Pliocene buried reefs which may be precursors of the modern shelf edge ribbon reefs. A seismic profile across one of these features (Fig. 5E) shows episodic reef growth throughout a 1,500 m section. A prominent fore-reef slope with shallow-dipping beds appears to have built up concurrently with the reef complex. The fore-reef slope sequence is overlain by a thick Pliocene and younger fluvio-deltaic sequence. In contrast, Quaternary buried and partially buried, relict, shelf-edge reefs up to 100 m thick occur along the easterly-trending section of the outer Papuan shelf (Fig. 5F). Therefore in the northern Great Barrier Reef and Gulf of Papua, seismic and drill hole data indicate that a reef sequence of varying thickness and age started to develop in the Miocene. On the outer continental shelf of the central Great Barrier Reef region, the 250-300 m thick reef complex (Fig. 6) is comprised of a series of reef slices separated by low sea level-generated unconformities (Davies 1983; Symonds et al 1983). The reef complex forms only the uppermost part of a thick, outer shelf sequence which is dominated by prograding fluvio-deltaic and onlapping slope sediments overlying a rifted basement (Symonds et al 1983). The reef thickness and a tie to DSDP Site 209 in the Coral Sea (Fig. 2) indicate a probable Pliocene age for initiation of reef growth in this region. A borehole on Michaelmas Cay (Fig. 2) shows 100 m of ?Plio-Pleistocene reef facies overlying siliciclastic sediments (Fig. 7B). The boreholes on Heron Island and Wreck Reef (Fig. 7B), at the southern end of the Great Barrier Reef, show that less than 150 m of reef overlies quartz sand, and that reef growth began in the Plio-Pleistocene (Lloyd 1973; Palmieri 1971, 1974).
The evolution of the carbonate platforms of northeast Australia w
53
Coastal wave-dominated
Fig 6 Carbonate/terrigenous fades geometry on the upper slope and outer shelf of the central Great Barrier Reef (modified after Symonds et al 1983). Inset A is a sparker seismic section off Cairns, showing a submerged reef (R) and siliciclastic prograding units (P2-P4). M marks the first water bottom multiple. Inset B is an Aquapulse seismic section showing the position of outer shelf sequences, particularly the two lower prograding units PI and P2, with respect to underlying basement (x) structure.
P.J. Davies, P.A. Symonds, D.A. Feary & C.J. Pigram
54 A
B
G u l f of P a p u a
PASCA A1
BORABI-1
PASCA CI
Great Barrier Reef HERON
ANCHOR CAY 1 Pliocene to Recent
Pliocene to Recent Late Miocene
WRECK
MICHAELMAS
Holocene
2
Miocene
Middle Miocene
, O o° O O
o oo
Early Miocene Eocene Mesozoic
TD 2878m \
o°o°
o°o 0 0 o 0 •o ° o O o o« 0 o
\Jtt\J
flnPfl TD 183m
\TD 2953m \ >--? . \
Reef i | i | Reef limestone
limestone TD 575m
Fora mini feral limestone
\
Cor/Bryo/foram limestone
Calcarenite
Shale
Quartz sand and
Sandstone
Calcareous
Echinoderm
limestone
Conglomerate
and sandstone
Capricorn
D
sandstone
quartz
Quaternary Queensland
sandstone
Basin
AQUARIUS 1 C
5
CAPRICORN 1A
Plateau Late. — Pliocene— Early Late • Miocene
DSDP 209 Pleistocene Middle-Late — Miocene
Middle Miocene
Late Eocene
Early Miocene
Middle Eocene TD 344 m Calcareous ooze
Late Oligocene
Limestone
Nodular chert
Marl
Terrigenous sand
] CI ay stone Sandstone |::::
;|
Conglomerate
_
Early Tertiary?
Volcanics
K5W81 TD 2658m
Fig 7 Summary lithostratigraphic logs from drill holes in the Gulf of Papua (A), Queensland Plateau (B), Great Barrier Reef (C), and Capricorn Basin (D). Locations of drill holes are shown in Figure 2.
The evolution of the carbonate platforms of northeast Australia
The principal conclusions derived from studies of the Great Barrier Reef carbonate platform are that the reef sequence thins dramatically and the age of initial reef growth becomes younger from north to south. The Great Barrier Reef is a mixed carbonate/siliciclastic province, with reefs forming a discontinuous wedge largely enclosed within terrigenous fluvio-deltaic deposits. However in some areas, particularly in the north, the underlying sequence is dominated by non-reefal carbonate facies. Eastern Plateau The Eastern Plateau is the most northern marginal plateau of the northeast Australian continental margin (Fig. 1). It is bounded by the Moresby, Pandora and Bligh Troughs, the Osprey Embayment, the Moresby Canyon, and the Coral Sea Basin. The plateau has a gently convex surface with an average depth of 1,500 m, and covers an area of about 31,000 km at the 2,000 m isobath. Eastern Fields Reef, the only modern reef on the Eastern Plateau, is about 45 km across at its widest point, and lies at the crest of the plateau near its northern margin (Fig. 1). Submerged and buried reefs (Fig. 9A) extend northeast from Eastern Fields Reef beneath the Moresby Trough (Davies et al 1988). The Eastern Plateau is the least understood marginal plateau in the northeast Australian margin. Our knowledge of the plateau is based on reconnaissance airgun and sparker seismic data (Symonds et al 1984; Davies et al 1988). The major characteristics of the Eastern Plateau basement and sediment cover are summarised on a schematic section (Fig. 8A). The ages of seismic sequences are based on a tie to Anchor Cay 1 well on Torres Shelf. The northern and southern plateau margins are controlled by normal faults. The western margin is more complex, and appears to be a product of thrusting (Fig. 8A). The Eastern Plateau is underlain by complex tilt blocks bounded by re-activated 2
55
normal faults, some of which appear to have undergone both wrench and reverse movement (Davies et al 1988). This deformation appears to have resulted from Late Oligocene and Miocene tectonism caused by the development of the New Guinea Orogen to the north (Pigram & Davies 1987). This late phase of structuring is not represented on the other northeast Australian marginal plateaux, and it produced a Neogene topography on the Eastern Plateau quite unlike that of the other plateaux (Fig. 8A). Eastern Fields Reef is unusual in northeast Australia because it has grown on a complex pedestal that appears to consist of deformed post-Oligocene sediments (Fig. 9C) and a complexly faulted basement block (Fig. 9D) (Davies et al 1988). The elevation of this block was a result of the Late Oligocene to Miocene tectonism described above. The results of limited coring and dredging (Taylor 1977) indicate that the remainder of the Eastern Plateau was covered by Miocene to Recent calcareous ooze and periplatform detritus. Queensland Plateau The Queensland Plateau is the largest marginal plateau of the Australian continental margin. It is one of the largest features of its type in the world (Figs. 1 and 2), and is approximately the same size as the Bahama platform. It is bounded on the northeast by the Coral Sea Basin, on the west by the Queensland Trough, and on the south by the Townsville Trough. The plateau is roughly triangular in shape, and extends over an area of about 165,000 km . Approximately half of the plateau surface lies above the 1,000 m isobath, with living reef systems at or near present sea level making up 10-15% of the surface. The largest modern reef complexes are Tregrosse and Lihou Reefs, lying along the southern margin of the plateau (Fig. 1). Both these complexes are nearly 100 km long from east to west, and 50 and 25 km wide respectively from north to south. The other 2
56
P.J. Davies, P.A. Symonds, D.A. Feary & C.J. Pigram
D
WW W
SHELF *N,:LR
QBR
MARION
PLATEAU
Marion Reef
CATO TROUGH p — • b
Fig 8 Schematic sections showing the generalised structure and sedimentary sequences on the Eastern (A), Queensland (B and C), and Marion (B, D and E) Plateaux. QR1 to QR4 and MR1 to MR4 denote phases of carbonate platform growth on the Queensland and Marion Plateaux respectively. Symbols and legend as for Figure 4.
The evolution of the carbonate platforms of northeast Australia B
57
North of Eastern Fields Reef
1800m
JO km
Eastern Plateau
Pandora
Trough
D WSW
Eastern Pandora T r o u g h
0
ENE
5 km
23/OQ/138
Fig 9 Seismic sections across the Eastern Fields Reef complex. Locations of sections are shown on Figure 1. A. Sparker section showing the submerged northern extension of the Eastern Fields Reef complex (R). Note that reef development has become areally more restricted with time. B. Sparker sections showing buried parts of the northern extension of the Eastern Fields Reef complex (R). C. Airgun section showing the complex structural high, consisting of basement and Mesozoic sediments, on which part of the reef system developed. D. Airgun section showing the deformed and uplifted post-Eocene sediments on which part of the reef system developed.
58
P.J. Davies, P. A. Symonds, D.A. Feary & C.J. Pigram
major areas of modern reef growth are the Coringa, Willis and Diana complexes, which are aligned north to south in the centre of the plateau, and the large isolated pinnacles of Flinders, Holmes, Bougainville and Osprey Reefs, which lie along the western margin of the plateau (Fig. 1). In addition, drowned reefs have been reported from at least 25 different locations (Taylor 1977; Mutter 1977; Davies et al 1988). Away from reef areas, the plateau surface is generally smooth and slopes northwards. A distinct terrace at approximately 450-500 m depth connects both the Willis and Diana reef complexes, and the Tregrosse-LihouCoringa reef complexes. The major characteristics of the Queensland Plateau carbonate platform, as deduced from analysis of extensive airgun and sparker seismic data combined with sampling data, are summarised on schematic sections across the plateau (Fig. 8B-C). The ages of the stratigraphic sequences visible on the seismic data have been deduced by correlation with DSDP Site 209 (Burns et al 1973; Fig. 7C), located on the northeastern margin of the plateau (Fig. 2). Basement on the Queensland Plateau is represented by a series of fault blocks, composed of probable Paleozoic rocks, which form a basement surface which dips northeast towards the Coral Sea Basin (Mutter 1977; Taylor 1977). Basement beneath the western one-third of the plateau is progressively downfaulted towards the Queensland Trough (Fig. 10A). South of Tregrosse and Lihou Reefs, the basement surface slopes gently south towards the northern boundary fault of the Townsville Trough (Fig. 8B). Large parts of the basement surface were exposed and planated during the CretaceousOligocene. From the Early Eocene, this surface was progressively submerged and overlain first by shallow marine siliciclastic sediments, and then by deeper water pelagic sediments (Burns et al 1973). A period of non-deposition or submarine erosion occurred from the Late Eocene until the Late
Oligocene. The sedimentary sequence reflects constant gradual subsidence until the Late Miocene, followed by an increased subsidence rate until the present-day (see below). Although carbonate deposition may have begun earlier, the Queensland Plateau has been a carbonate-dominated province at least since the earliest Miocene. Pinchin and Hudspeth (1975) interpreted a mound structure visible on seismic data from the western margin of the Queensland Plateau as evidence of a possible Eocene barrier reef. More recent Bureau of Mineral Resources seismic data (Fig. 10B) shows that this feature is a complicated mound, some 15 km in diameter and 700-800 m thick, with the steepest margin facing to the west. The mound is a composite feature, comprised of both bedded and chaotic facies, and its form is at least partly the product of erosion. An Early to Middle Eocene age for this feature is suggested by onlap of the Eocene/Oligocene unconformity. Although it is possible that the structure may represent a carbonate build-up, its restricted lateral extent indicates that it is clearly not a 'barrier' reef. Along the western margin of the Queensland Plateau, steep-sided pinnacles 1-2 km across rise from depths of up to 1,200 m, to within 10 m of sealevel (e.g. Fig. 10C). Dredged samples indicate that the flanks of these features are comprised of reefal framework, containing larger foraminiferids of Miocene-Pliocene age (Davies, et al 1988). Seismic data shows that at least some of these pinnacles have developed on the raised corners of fault blocks. In addition to the carbonate build-ups on the plateau margins noted above, seismic data indicates that a thick carbonate platform sequence was deposited on the central part of the plateau (Fig. 10D). At least two phases of separate but superimposed reef and periplatform facies (QR1 & QR2; Figs. 8B-C, 10D) form the core of the carbonate platforms. Dredge samples from this complex on the southern slope of the Queensland
The evolution of the carbonate platforms of northeast Australia sw
59
W e s t e r n Queensland Plateau
W e s t e r n Queensland Plateau
mmbmns
jb.
Eastern Queensland Trough
Coringa Bank
Fig 10 Seismic sections across the Queensland Plateau carbonate platforms. Locations of sections are shown on Figure 1. A. Airgun section across the western Queensland Plateau showing fault-bounded tilt blocks and half graben and an overlying carbonate bank (R). B. Sparker section showing mounded features (Ml and M2), possibly Eocene carbonate build-ups, overlying basement on the western flank of the Queensland Plateau. Recent work indicates that this structure is probably circular, and accordingly is not a barrier reef as earlier suggested (Pinchin & Hudspeth 1975). C. Sparker section over a steep-sided pinnacle (R) rising from 1200 m depth on the eastern side of the Queensland Trough. Miocene and Pliocene reef framework samples were dredged from the lower slopes of this pinnacle. D. Sparker section showing three major phases of platform reef growth (QR1 to QR3) at Coringa Bank.
60
P.J. Davies, P.A. Symonds, D.A. Feary & C.J. Pigram
Plateau between 1,000-1,300 m depth consist of Middle Miocene to Pliocene reefal material (Davies et al 1988). The presence of shallow water sediments at these depths confirms that there has been unusually rapid subsidence of the plateau since the Middle Miocene. The deeper water areas between reef complexes are the sites of hemipelagic sedimentation. A terrace which occurs at 450-500 m depth represents the end of QR2 reef growth (Figs. 8B-C, 10D). A third, more restricted phase of reef growth (QR3) developed on this surface, with associated periplatform sedimentation in front of the reef (Fig. 10D). This reefal platform grew to sea level, and, as a result of relative sea level rise, now forms another terrace at approximately 50 m depth. The most recent reef complexes (QR4) developed on the 50 m terrace (Figs. 8B-C), and are even more restricted than previous phases. Descriptions of the modern coral faunas (Orme 1977; Done 1982) suggest that the modern reefs are oceanic equivalents of high energy reefs present in the Great Barrier Reef. It is therefore likely that throughout their evolution, the different phases of Queensland Plateau reef development have all been products of high energy, oceanic conditions as a result of their exposed, oceanic location. Marion Plateau The 77,000 km2 area of the Marion Plateau lies directly east of the central Great Barrier Reef, and is bounded along its northern margin by the Townsville Trough and along its eastern margin by the Cato Trough (Fig. 1). The present plateau surface forms a deeper water extension of the Australian continental shelf, with water depths ranging from 100 m along the western border to 500 m along the eastern margin. At present, reef growth is restricted to Marion Reef, on the northeastern corner, and Saumarez Reef, at the southeastern extremity of the plateau (Fig. 1).
Little detailed subsurface structure and facies distribution information exists for the Marion Plateau (Mutter & Karner 1980). The results of a study in progress, based on extensive airgun, watergun and sparker seismic data combined with sampling data, are summarised on schematic sections across the plateau (Fig. 8B, D, E). The plateau is bounded on three sides by rifts: the Cato Trough to the east; the Townsville Trough to the north; and a series of north-south oriented, narrow halfgrabens which separate the plateau from the continent to the west (Fig. 2). During the Tertiary, siliciclastic shelf sediments prograded eastwards across these halfgrabens and onto the western Marion Plateau. The most northern of these halfgrabens appears to join the confluence of the Townsville and Queensland Troughs. Therefore the Marion Plateau formed a separate marginal plateau during the Early Tertiary. To the south, the Marion Plateau is separated from the Capricorn Basin by a northwest-trending basement ridge (the Swains Reef High; see Fig. 2). The basement beneath the Marion Plateau is a planated surface which dips gently towards the northeast. The only disruption to this surface occurs in the northeast corner of the plateau, where a basement high forms the pedestal on which Marion Reef developed. Basement beneath the plateau margins is steeply down-faulted into the troughs to the north and east. The slope sequences on the northern and eastern margins of the plateau are both onlapping and progradational. Small reef complexes overlie some of these progradational sequences along the northern margin (Fig. 11 A). The basement surface was completely transgressed during the ?Early Miocene, resulting in development of an extensive carbonate platform (MR1; see Fig. 4). The top of this platform presently lies at 450-500 m depth. Shelf edge barrier reefs (Fig. 11B) and platform reefs separated by lagoons and inter- reef areas (Fig. 11C) can be identified
The evolution of the carbonate platforms of northeast Australia A
NW
Northern Marion Plateau Slope
61
SE
Q w s w
Northern Marlon Plateau
ENE
0.5
E
i.oFig 11 Seismic sections across the Marion Plateau carbonate platforms. Locations of sections are shown on Figure 1. A. Airgun section across the northern margin of the Marion Plateau showing buried reefs (R) overlying a prograding sequence (P). B. Watergun section showing the MR1 platform margin adjacent to the Townsville Trough. Note the reflection-free, thick, barrier reef (BR) and patch reef (PR) facies, fore-reef periplatform facies (P), and back-barrier, bedded, lagoonal facies (L). Note that some reflectors pass into and through the reef facies, and may represent low sealevel erosional surfaces. C. Watergun section across the northeastern Marion Plateau showing development of platform reefs (R) and bedded, inter-reef sediments (IR).
62
P.J. Davies, P.A. Symonds, D.A. Feary & C.J. Pigram
over the northwestern two-thirds of the platform. Barrier reefs formed a distinct rimmed margin only along the northern edge of the plateau. The second phase of platform development (MR2) was more restricted, and confined to the southern one-third of the plateau. This phase was initiated at a level considerably below the top of the earlier phase (Fig. 8E). The top of the MR2 platform presently lies at 350-400 m below sea level. The third phase of reef growth on the Marion Plateau (MR3) is represented by small platform areas that have grown on the 350-400 m surface. Towards the southern Marion Plateau, part of the Great Barrier Reef overlies the third phase of carbonate platform growth. The final, very restricted phase of growth on the Marion Plateau (MR4) is represented by Marion and Saumarez Reefs. Therefore the successive phases of carbonate platform growth have been progressively more restricted in area (Fig. 8D-E). At the present time, the top of the Marion Plateau is swept by moderately strong currents, with the result that, away from the areas of modern reef growth, only thin hemipelagic sediments are accumulating in restricted areas. FACTORS CONTROLLING THE EVOLUTION OF CARBONATE PLATFORMS IN NORTHEAST AUSTRALIA A number of fundamental questions arise from the descriptions of the northeast Australian carbonate platforms: 1. What are the reasons for the northward-thickening of the Great Barrier Reef tropical carbonate platform? 2. Why is there such a thick platform sequence on the Queensland Plateau, with distinct levels of accumulation? 3. What are the causes of platform contraction? 4. What is the age of reef initiation in the region, and what mechanisms controlled the
areal and temporal distribution of facies, e.g. what caused the stepback from the Marion Plateau to the shelf of the Great Barrier Reef? Partial answers to these questions can be obtained through analysis of the major factors which controlled platform development in the region. These factors are rifting, subsidence, plate motion, sea level variation, and collision. Rifting Late Cretaceous extension formed the Queensland-Townsville-Cato Trough rift basin system, with another, apparently less developed system extending southeast from the Queensland Trough to the Capricorn Basin. This rift system separated the continental shelf from the Queensland and Marion Plateaux (Fig. 2). Continental breakup and sea-floor spreading began in the latest Cretaceous/Paleocene, and ceased in the Early Eocene. The main physical elements of the northeast Australian margin have therefore been in existence since Late Cretaceous-Paleocene time. Although the Queensland and Townsville Troughs exist as major physiographic features on the sites of the original rift troughs, the series of small troughs along the western side of the Marion Plateau have now been infilled and are recognised only on seismic sections. The rifting process has influenced the form of carbonate platform development off northeast Australia in both a general way, by providing large shallow water areas suitable for platform growth, and in a very specific way in the case of reefs that have grown on the corners of fault blocks or along major rift boundary faults. Subsidence Quantitative subsidence data has been derived from geohistory analysis (Van Hinte 1978; Falvey & Deighton 1982) of Anchor Cay 1, DSDP Site 209, Capricorn 1A and Aquarius 1 (Fig. 12). The subsidence data
The evolution of the carbonate platforms of northeast Australia
63
from these wells indicate that northeast Australia has not subsided wholly as a result of uniform post-rift thermal cooling, but that subsidence pulses have occurred at different times. The Anchor Cay 1 well at the northern end of the Great Barrier Reef (Fig. 2) contains Triassic to Middle Jurassic siliciclastic rocks unconformably overlain by Eocene to Recent carbonate-dominated sediments, with a hiatus in the Early Oligocene (Oppel 1969; Robertson Research 1984; see Fig. 7A). The pre-Eocene portion of the subsidence curve is not reproduced here, as it is difficult to ascertain how much section has been removed at the major unconformity (Fig. 12A). The accelerated subsidence of 50 m/million years which affected this region in the Miocene (25-5 Ma BP) increased to 140 m/million years in the Pliocene (Fig. 12A).
Time ( M a )
Fig 12 Geohistory plots for Anchor Cay 1 (A), DSDP Site 209 (B), and Aquarius 1 (C). The Capricorn 1A plot is not presented as it is essentially identical to Aquarius 1. Locations of holes are shown in Figure 2, and summary logs are shown in Figure 7.
DSDP Site 209, drilled in 1,428 m of water on the northeastern margin of the Queensland Plateau (Fig. 2), provides the only source of quantitative subsidence data for this plateau. The well contains a Middle Eocene to Recent section, with hiatuses in the Early Oligocene and Middle Miocene (Fig. 7C). The Eocene section consists of calcareous sandstone grading up to carbonate mudstone, with decreasing terrigenous sand content, overlain by Late Oligocene and younger calcareous ooze (Burns et al 1973). The subsidence history of the plateau at this site was characterised by progressively increased rates of subsidence (Fig. 12B). An initial slow rate (20 m/million years) was succeeded by a markedly increased rate (40 m/million years) after the Middle Miocene (11 Ma BP). Two petroleum exploration wells (Capricorn 1A and Aquarius 1) were drilled in the Capricorn Basin, adjacent to the southern Marion Plateau (Fig. 2). Basement consists of Cretaceous volcanics in Capricorn 1A and indurated ?Paleozoic shale and siltstone in Aquarius 1. In both wells, basement is overlain in turn by Paleocene to middle Oligocene basal polymictic conglo-
64
P.J. Davies, P.A. Symonds, D.A. Feary & C.J. Pigram
morate and arkosic red beds, by shallow marine glauconitic and carbonaceous sandstones, and by Miocene to Recent claystone and marl (Fig. 7D (Ericson 1976). The geohistory curves for Aquarius 1 (Fig. 12C) and Capricorn 1A show similar subsidence patterns. A Cretaceous to middle Oligocene (88-30 Ma BP) slow subsidence phase (20 m/million years) was succeeded by increased subsidence (75 m/million years) until the Middle Miocene (11 Ma BP). Decreased subsidence followed by uplift during the Late Miocene and Early Pliocene was succeeded by a final increased subsidence pulse (75 m/million years) from the middle Pliocene. Our analysis shows that the northeast Australian carbonate platforms have developed within a variety of subsidence regimes. These regimes may be categorised as simple or compound. Simple subsidence is characterised by an initial phase of rapid subsidence, followed by progressively lower subsidence rates. The facies and morphology produced by simple subsidence for a constant sea level are illustrated in Figure 13. During the rapid subsidence phase the carbonate platform may backstep, i.e. the locus of deposition progressively migrates to maintain an approximately constant depth.
During the ensuing slower subsidence phase an aggradational or progradational carbonate platform will develop as sediment supply outstrips subsidence. Compound subsidence is characterised by alternating periods of rapid and slow subsidence. The effect of compound subsidence is to produce alternating backstepped and progradational packages. Plate Motion and Palaeoclimate/ Palaeoceanography Hotspot (Duncan 1981; Wellman 1983) and magneto-stratigraphic studies (Idnurm 1985, 1986) provide a reconstruction of Indian-Australian Plate movement through the Cenozoic. These studies show that since the end of the Eocene, when northeast Australia was located between 29°S and 44°S, the region has moved almost directly northwards to its present location between 9°S and 24°S. On this basis the Cainozoic palaeolatitudes for the northeast Australia region may be determined (Fig. 14). This latitudinal motion would have resulted in profound climatic changes along the east Australian shelf, particularly since plate movement was essentially normal to developing climatic zones. Analysis of the Shelf
facies
Backreef xErn
Reef
facies
facies
•' J i'i'1 ^ j Peri platform V / / / / / A Slope
TIME
facies
facies
23/00/142
Fig 13 Idealised facies geometries illustrating the effects of simple subsidence on a platform margin. Reef backstepping (1-3), corresponding to the initial rapid subsidence phase, is succeeded first by aggradation (3-4) and then by reef progradation (4-6) as the subsidence rate decreases.
The evolution of the carbonate platforms of northeast Australia
Fig 14 Projected latitudinal movement of the northeast Australia region throughout the Cainozoic (modified after Davies et aI 1987). The northern boundary corresponds to Anchor Cay 1 (presently at 9°30 'S) and the southern boundary to Heron Island (presently at 24 °S).
northward plate motion relative to 23.5°S (the Tropic of Capricorn and southern limit of the Great Barrier Reef region) indicates that, assuming present-day climate:
65
(Savin et al 1975; Shackleton & Kennett 1975; Murphy & Kennett 1985), and all data and syntheses relating to the development of thermal gradients (Kennett 1977; Frakes 1979; Murphy & Kennett 1985; Shackleton 1986) and oceanic circulation patterns (Kennett et al 1975; Burns et al 1973). For the Neogene, we placed particular emphasis on oxygen and carbon isotope data from a large number of DSDP cores (Savin et al 1975; Loutit et al 1983; Elmstrom & Kennett 1985; Kennett 1985; Kennett & von der Borch 1985; Savin et al 1985); variations in clay mineralogy indicating desertification (Locker & Martini 1985; Stein & Robert 1985); onshore palynological analyses (Kemp 1978); and global oceanographic events (Burns et al 1973; Mercer 1976; Keany 1978; Hsu et al 1984; Weissert et al 1984; Kennett & von der Borch 1985). The oceanic surface-water temperature curve for northeast Australia compiled from these sources (Fig. 15) allows us to draw the following conclusions:
— the transition from temperate to tropical climate conditions in the northern part of the Great Barrier Reef would have started about 25 Ma BP (Fig. 14). — the southern region has only recently entered the tropics. However the development of more complex climate distribution patterns in the southwest Pacific throughout the Cainozoic (Savin et al 1975; Frakes 1979; Kennett & von der Borch 1985) indicates that a more detailed analysis of climatic factors is required. Since surface-water temperatures are critical to carbonate platform development, we have examined data primarily derived from geochemical and petrographic analyses of DSDP cores from the western Pacific and produced a synthesis describing Cainozoic surface-water temperature variability for the northeast Australian region (see Fig. 15). For the Paleogene, we particularly examined oxygen isotope data from DSDP Sites 167, 277, 592, and 593
Fig 15 Surface-water temperature envelope for the northeast Australian region throughout the Cainozoic, showing periods when temperatures were suitable for reef growth. The Miocene 4 'phosphate spike", which inhibited reef growth, is also shown (see Riggs 1984).
— Temperatures in the earliest Middle Eocene were briefly warm enough for coral reef growth. Corroboration is provided by the identification of early Middle Eocene larger foraminiferids from the northwestern margin of the Queensland Plateau (Chap-
66
P.J. Davies, P.A. Symonds, D.A. Feary & C.J. Pigram
roniere 1984), indicating sea surface temperatures of 18-27°C (Murray 1973). — Temperatures from the late Middle Eocene to the middle Early Miocene were not conducive to tropical carbonate platform development. Climates at palaeolatitudes of 23-46°S were probably temperate or cool temperate, and accordingly there would have been no significant coral reef growth. — During the Early Miocene, the northeast Australia region was bathed in surface waters marginal for supporting coral reefs, i.e. probably comparable to those off northern New South Wales and southern Queensland today. While some reef growth may have been possible in the extreme north, it is most likely that prolific growth throughout much of the northern region began with the initiation of tropical climatic conditions in the early Middle Miocene. — The Late Miocene climatic cooling would have prevented extensive reef growth in the southern part of the region, situated near the subtropical/tropical climatic boundary. — During the Pliocene, temperatures suitable for reef growth extended into the southern parts of the northeast Australian province. The palaeoclimatic and palaeoceanographic data substantiate and refine the major conclusions deduced from plate motion studies. The consequences of this interpretation are that the Great Barrier Reef tropical shelf carbonate facies thin and young to the south and overlie temperate facies (Davies et al 1987); that reefs grew first in the north, probably within the developing foreland basin; that this early reef growth was closely followed by reef growth on the Queensland and Marion Plateaux; and that reefal development occurred later in the central and southern Great Barrier Reef. Facies diachroneity must be a fundamental factor in platform evolution where plate motion has produced movement either towards or away from the tropics.
The above conclusions can be tested by a comparison of present-day facies variations along the east Australian margin with the vertical facies sequence observed in cores from the Gulf of Papua. The present-day sediment distribution on the east Australian outer continental shelf is comprised of three distinct facies (Marshall & Davies 1978), which contain a clear climate-related signature: — tropical carbonate and clastic sediments, dominated by coral and Halimeda debris, north of 24°S; — subtropical rhodolith/encrusting foram/ bryozoan facies between 24°S and 28 °S, with bioherms dominated by this association occurring over large parts of the outer shelf; — temperate, branching bryozoan/foram/ mollusc facies south of 28 °S. A similar facies sequence occurs vertically in the Borabi No 1 drill hole (Fig. 7A) in the Gulf of Papua (Fig. 2). This sequence shows the development from a temperate open shelf in the Eocene and Oligocene; to a subtropical shallow outer shelf in the Early Miocene; to a tropical reef-dominated shelf in the Middle Miocene; and finally to a fluvioclastic-dominated shelf in the Pliocene. The vertical carbonate facies variations mirror those which occur laterally on the present-day shelf and which are clearly climate-related. Horizontal plate motion, with its attendant climatic and oceanographic effects, has therefore exerted a fundamental control on the sedimentary evolution of northeast Australia (Davies et al 1987). Further refinements arise from a consideration of local physical and chemical oceanographic factors. The progressive development of the east Australian current would have intensified from the Early-Middle Miocene (15-20 Ma BP), as the northern edge of the Australian craton began to disrupt the strong equatorial current flow (Kennett et al 1985). Continuing northward plate motion, the elevation of New Guinea, and the closure
The evolution of the carbonate platforms of northeast Australia of the east Indonesian seaway in the Late Miocene would have further restricted westerly current flow and caused diversion of warm tropical waters to the south into the northeast Australia region. Chemical oceanographic factors will also have affected the Neogene development of carbonate platforms in northeast Australia. The late Early Miocene to early Middle Miocene apparently represented a time of increased ocean fertility commensurate with a postulated 2-3 orders of magnitude increase in oceanic phosphate levels (Riggs 1984). This "phosphate spike" (Fig. 15) is thought to have produced extensive phosphatisation of continental margin sediments throughout the world. Phosphatic facies of this approximate age occur on the northern New South Wales outer shelf (Cook & Marshall 1981), immediately south of the northeast Australian region. This event would have had considerable effect on carbonate deposition in northeast Australia, as increased oceanic phosphate levels inhibit A
67
the growth of coral reefs and promote a large increase in biomass production (Kinsey & Davies 1979). This should be reflected in considerably restricted coral reef growth during this period, with the high ocean fertility resulting in high organic carbon production and the consequent formation of petroleum source rocks in selected environments. Sea Level Variation The effects of sea level variation on carbonate platform development have been established by detailed analysis of the nature and distribution of siliciclastic and carbonate facies on the central Great Barrier Reef shelf. High sea level deposition on the central Great Barrier Reef shelf occurred either as progradation of prodeltaic sediments on the inner shelf, primarily concentrated on wavedominated deltas; or as aggradation of the mid to outer shelf as a result of reef growth and inter-reef sedimentation (Fig. 16A).
HIGH SEA LEVEL mixed terrig/carb
delta
biostrome/bioherm
reef
120
-75-200 km
B
LOW SEA LEVEL floodplain
shelf edge/fan rialta
mmm "
deposits ^ '
Fig 16 Schematic sections illustrating high (A) and low (B) sea level control on the structural and sedimentary geometry of shelf facies in the central Great Barrier Reef province. Note the predominance of siliciclastic facies in the low sea level situation.
68
P.J. Davies, P.A. Symonds, D.A. Feary & C.J. Pigram
Reef fades reflect both the high physical energy of the system and the transgressive/ stillstand history of the Quaternary sea level rises (Marshall & Davies 1982, 1984; Davies 1983; Davies & Hopley 1983; Davies et al 1985). The reefs are composite features, comprised of stacked reef facies which grew as a consequence of successive high sea level growth phases, separated by unconformities representing low sea level erosion (Fig. 17). The high physical energy of the reef environment restricted reef expansion to the leeward or backreef direction.
11 •*/[ Coralline cap ^jpjf^ Branching coral *.1| Massive coral Rubble
|.v. ,';.'ij Inter-tidal sand ^ ^ Sub-tidal sand
fc^'j Lagoonal sand pTvyi Antecedent r m surface [l-V/j Caliche / v
IIHII Vadose zone
Fig 17 Schematic models showing high energy reef growth in high (1 & 3) and low (2) sea level phases. Note the leeward progradation reflecting the high energy environment (after Davies et al 1988).
In the inter-reef areas on the mid to outer shelf, high sea level platform aggradation is represented by bioherms (Davies & Marshall 1985), biostromes, and a sediment blanket of varying thickness (<1 m - 10 m) deposited on the previously exposed shelf surface. This sediment blanket is composed of a lower, terrigenous (mud- and quajtz-rich; carbonate-poor), transgressive facies, and an upper, carbonate-rich (less mud; little quartz), stillstand facies (based on studies in progress). At the present time, after 10,000 years of transgression and stillstand, there has been little high sea level progradation of
coastal terrigenous facies onto the inner shelf. It seems likely that the terrigenous/ carbonate facies couplet that occurs over wide areas of the mid to outer shelf is probably representative of high sea level sedimentation on the Great Barrier Reef platform throughout most of the PlioPleistocene. Low sea level sedimentation occurred both as aggradation of fluvial sediments on the mid to outer shelf (Fig. 16B), and as progradational shelf-edge deltas composed of terrigenous sand and sandy mud beneath the outer shelf and upper slope (Fig. 6). Rising and high sea level periods in the central Great Barrier Reef were therefore characterised by both reefal and inter-reef carbonate deposition, with restriction of siliciclastic deposition largely to the inner shelf. In contrast, falling and low sea level periods were characterised by fluvial or shallow marine siliciclastic deposition, with siliciclastic progradation on the present upper slope. The marginal plateaux are essentially isolated from terrigenous input, and accordingly their facies response to sea level variation must have been different. Although high sea level periods in these areas are also marked by carbonate aggradation, low sea level periods are characterised by unconformities representing exposure of the previous reef surfaces. This response to sea level variation can be used to interpret the evolutionary history of the Cainozoic sequences on the marginal plateaux by attributing unconformities within the carbonate platforms to low sea level episodes, and reef sequences to periods of high sea level. In the absence of a specific Cainozoic sea level curve for northeast Australia, the global sea level curve proposed by Haq et al (1987) can be used. On this basis, episodes of reef growth during the early Middle Miocene (QR1, MR1 — see Fig. 8), the Middle to Late Miocene (QR2, MR2), the Plio-Pleistocene (QR3, MR3), and the Quaternary (QR4, MR4) are separated by unconformities representing
The evolution of the carbonate platforms of northeast Australia erosion during the late Middle Miocene (1-2), late Late Miocene (2-3), and the Quaternary (3-4). Collision If, as a result of plate motion, a passive margin moves into a compressional tectonic regime, carbonate platforms developing on that margin will be profoundly affected. The effects of collision on the formation and demise of carbonate platforms may be seen in the Papuan Basin of Papua New Guinea (Fig. 2). The collision between the northern edge of the Australian craton and an island arc complex that initiated the development of the New Guinea orogen had occurred by 25 Ma BP (Pigram & Davies 1987). This event affected a 150-200 km wide shelf on which subtropical/temperate carbonates had accumulated during northward drift in the Paleogene (Fig. 18A). The collision caused the development of a foreland basin with a flexural wavelength of 500-700 km, with the position of the downwarp migrating south throughout the late Cenozoic as the New Guinea orogen evolved. Immediately after collision, the foreland basin consisted of a proximal deep, perhaps 100-200 km across, which was the site of thick ( > 5 km) clastic sedimentation; and a distal, broad, shallow epicontinental margin, some 300-500 km wide, which was ideal for carbonate deposition under the existing tropical conditions (Fig. 18B). The reef complexes that grew on this distal part of the foreland basin developed in two orientations relative to the basin axis: — along the northern edge parallel to the basin axis; — along the eastern margin, on structural trends perpendicular to the basin axis (Borabi Reef Trend; Robertson Research 1984). With continued convergence, the Early Miocene carbonate slope facies and foredeep clastic sediments were incorporated into the foreland fold belt. Clastic sediments filled the proximal deep and started to prograde
69
across the shelf carbonate sequence, causing marked reduction in the area of carbonate deposition. The formerly extensive reef development along the Borabi Reef Trend contracted to a series of pinnacles and the northernmost pinnacles were sequentially buried by clastic detritus (Fig. 18C).
Fig 18 Cainozoic palaeogeography of the Gulf of Papua/northern Great Barrier Reef region, showing the effects of progressive foreland basin development on carbonate platform evolution during the Eocene (A), Early Miocene (B), Late Miocene (C), and Pliocene (D). Schematic sections area oriented approximately northeastsouthwest; approximate palaeolatitudes are shown for each section.
A Pliocene fall in sea level exposed the platform and shallow foreland basin. The clastic sediments derived from the emerging mountains to the northeast spread far to the south, covering the platform. The outpouring of clastic detritus was so great that, even during sea level highstands, carbonate
70
P.J. Davies, P. A. Symonds, D.A. Feary & C.J. Pigram
deposition was not re-established in this area, but was restricted to the area of the <s1 present-day northern Great Barrier Reef (Fig. 18D). This sedimentation regime has Coast• line # continued to the present. The convergence history of the northern edge of the Australian craton illustrates the effects of collision on the gross architecture of a carbonate platform, and the response of reef complexes to increased subsidence arising from foreland basin development. Paradoxically, the initial effect of foreland basin development was to increase the area + ^Collision^+ zone + + + + Collision zone ++ + of carbonate platform deposition. However clastics * this expansion was quickly followed by 1 contraction, demise, and burial of the carbonates by clastic detritus. The response i 1 * I <^^yCoast line fi of reef complexes was dependent on their Coast line initial orientation relative to the axis of flexure. Reef growth parallel to the collision front probably formed a discontinuous tract of thin reefs on the margin of the foredeep. As the basin axis migrated southwards, the locus of reef growth migrated towards the craton (Fig. 19A). The older reefs became progressively engulfed and buried by clastic 19 Schematic diagrams showing the differing detritus derived from the developing orogen. Fig response of reefs to foreland basin development, In contrast, the location of reef growth on dependent on whether the trend of reef growth the Borabi Trend remained fixed along an was parallel (A) or perpendicular (B) to the axis oriented perpendicular to the collision collision zone. zone. In this case, reef growth responded to foreland basin development and concomitOF THE NORTHEAST ant subsidence with accentuated vertical EVOLUTION CARBONATE growth, rather than lateral migration (Fig. AUSTRALIA 19B). The initial barrier reef first contracted PLATFORMS — CONCLUSIONS to a series of pinnacles, before being Carbonate platform evolution in northengulfed by clastic detritus. The eastern east Australia was primarily controlled by margin of the Papuan Platform and the five inter-related controlling factors which northern end of the Great Barrier Reef are have acted upon the continental margin since currently undergoing an evolution compar- the Cretaceous. These factors are: rifting, able to that of the Early to Middle Miocene subsidence, plate motion (with climatic and reefs of the Borabi Reef Trend. Growth on oceanographic consequences), sea level the Portlock-Boot-Ashmore reef complex, variation, and plate collision. These factors east of the northern Great Barrier Reef, has have interacted to give the following now contracted to large isolated pinnacles. evolutionary sequence: Further north, reefs along this trend have 1. Early Cretaceous northwesterly movebeen buried by more than 800 m of prograd- ment of the Pacific Plate may have resulted ing clastic sediments (Davies et al 1988). in pre-rift basin development, perhaps
*
——• ~
HH * #
•
~ '
J
The evolution of the carbonate platforms of northeast Australia
within an oblique wrench zone. This zone formed the site of further rifting during the Late Cretaceous and Paleocene. The western boundary fault of the rift system lay beneath the present mid to outer shelf. This phase of extensional tectonism occurred when northeast Australia was between 28 °S and 43 °S. 2. Temperate, clastic, fluvio-deltaic and carbonate sedimentation developed along the continental margin in the Eocene and Oligocene. These sediments were deposited under a regime of sea surface temperatures which decreased from subtropical/tropical to cool temperate, and sea levels which remained high throughout the early part of the interval, but then dropped markedly during the early and middle Oligocene. Subtropical carbonate deposition dominated towards the north, with temperate fluviodeltaic and carbonate sedimentation along the continental margin further south. Temperate ? carbonate progradation may have occurred along the margins of the Queensland and Marion Plateaux. 3. Late Oligocene to Early Miocene subsidence, coincident with a rise in sea level, led to widespread transgression over parts of all platforms. Initially reef development was prevented by the effects of temperature and ocean chemistry, with the result that red algal bioherms developed on the outer shelf. As northward drift carried the region into the tropics, the first reefs probably formed on red algal bioherms. In the Gulf of Papua, these evolved into a barrier reef complex (the Borabi Reef Trend; Fig. 5B) and a series of pinnacle reefs located on structural highs to the east of the barrier (e.g. Pasca Reef; Fig. 5C). 4. In the far northern part of the Great Barrier Reef and on the Queensland and Marion Plateaux, initiation of reef growth in the early Middle Miocene was a consequence of subsidence, continued northward drift into the tropics, and a marked increase in surface-water temperatures. In the northern region, the increased subsidence resulted
71
from development of the foreland basin, and also caused an initial expansion of shelf carbonate deposition and a later contraction of the earlier barrier reef in the Gulf of Papua to a series of pinnacles. 5. Late Miocene subsidence counteracted the effects of the Late Miocene sea level fall, and resulted in a further, areally more restricted episode of reef growth on the Queensland and Marion Plateaux. Contraction of reef growth and progressive burial of pinnacle reefs continued in the north. Much of the central Great Barrier Reef region, although in the tropics, was either dominated by terrigenous sedimentation or exposed. 6. Progressive foreland basin development during the Pliocene led to burial of the northern reefs. Further subsidence produced substantial contraction of the Queensland Plateau reefs and stepback of the Miocene Marion Plateau carbonate platform to the present position of the Great Barrier Reef. The post-Pliocene evolution of the Great Barrier Reef is a function of sea levelcontrolled fluvio-deltaic deposition and reef growth. The major implications of this evolutionary history are that the Great Barrier Reef tropical carbonate platform thins to the south and overlies a temperate facies; that reefs grew first in the north, probably along the margins of the developing foreland basin; and that the platforms of the Queensland and Marion Plateaux are precursors to reef growth on the central and southern Great Barrier Reef. Although this analysis of the factors controlling carbonate platform development has accounted for much of the variability observed in the northeast Australian carbonate platforms, there remain areas where our understanding of the interactions between the controlling factors are still incomplete. We do not fully understand the factors which controlled reef contraction on the Queensland Plateau, although the interaction between subsidence and sea level is
72
P.J. Davies, P. A. Symonds, D.A. Feary & C.J. Pigram
obviously important. Similarly, we do not understand why reef growth is apparently so restricted during lowstands. Although terrigenous input must be important adjacent to the continental margin, this is clearly not a significant factor on the marginal plateaux. IMPLICATIONS FOR GLOBAL MODELS OF PASSIVE MARGIN CARBONATE PLATFORM EVOLUTION The continental rifting process determines the size, shape, and location of the shelf and marginal plateaux on which the carbonate platforms develop. Carbonate platform development is critically controlled by both long-term (plate motion, subsidence) and short-term (sea level, climatic, oceanographic) factors. In addition, movement of a passive margin carbonate platform into a convergent tectonic setting will ultimately terminate platform growth. Some recent interpretations of the development of passive margin carbonate platforms define an evolutionary morphologic/ A
sedimentologic sequence from pre-rift platform to platform collapse, at least in part controlled by simple subsidence scenarios (e.g. Read 1985). On the basis of our studies in northeast Australia, we believe that these schemes represent only part of the carbonate platform evolutionary spectrum. More complete platform development models can be derived by considering the interaction of the two most significant long-term controlling processes; vertical tectonics (subsidence) and horizontal tectonics (plate motion). The facies sequences produced as a result of both simple and compound subsidence under differing plate movement rates and directions are shown in Figure 20. The facies sequence developed in the central Great Barrier Reef region (Fig. 6) is an example of the situation illustrated in Figure 20B, where subsidence has interacted with plate movement towards the tropics to produce tropical carbonate deposition overlying a temperate clastic sequence. The Neogene carbonates in the Red Sea (El Haddad et al 1984; Scott & Govean 1985) provide an example of the c
B
TIME Temperate clastics & carbonates
TIME Tropical
clastics
TIME Tropical carbonates
prograding
Tropical
backstepping
carbonates
Fig 20 Hypothetical facies sequences produced as a result of different subsidence regimes and plate motion through different climatic zones.
The evolution of the carbonate platforms of northeast Australia development of a tropical carbonate platform as a result of early rift subsidence (Fig. 20C). The most complex and varied carbonate platform sequences will occur as a result of the interaction of compound subsidence and plate motion through different climatic zones over a substantial time period. The evolutionary history of the northeast Australia carbonate platforms represents a relatively complete example of such a situation. This region demonstrates that facies diachroneity is an fundamental characteristic of carbonate platform evolution, as different parts of the same platform may be at different stages in the development sequence at the same time. The extreme case occurs when different parts of the same platform are synchronously in both initiation and demise stages. It is possible for a platform to begin or end its growth anywhere with respect to climate, with the result that either the temperate or tropical stages may not develop. A carbonate platform may not progress past a particular stage, or spend a long time within one stage. For example, the southern Great Barrier Reef has only recently started to develop a tropical carbonate platform, whereas the Papuan Basin in New Guinea has progressed very quickly into a collision setting. The Queensland Plateau may never be affected by collision unless a major reorganisation of plate boundaries occurs, and will therefore remain for a very long time within a tropical oceanographic environment under a slowing subsidence regime. We believe that this may eventually lead to substantial shallow water progradation comparable to that which affected the Queensland Plateau in the Miocene, and which has had such a dominant effect on the Cainozoic development of the Bahama platform (Eberli & Ginsburg 1987). Alternatively, the influence of a further subsidence pulse may lead to major reactivation of reef growth, and possibly even further contraction or stepback. In contrast to the long-term influences of
73
plate motion and subsidence, sea level variation, climatic variation, and physical and chemical oceanographic factors all exert shorter-term controls on carbonate platform development. Although the carbonate platforms of northeast Australia provide evidence of the controlling influence of all these factors, the results of eustatic sea level variation are particularly clear. The differences between low sea level progradational and high sea level aggradational facies, and the stacking of reef facies as a consequence of low sea level erosion and later high sea level re-activation of reef growth, all attest to the importance of this factor. Our work in northeast Australia indicates that, on a broad scale, carbonate platform development will be dependent on whether subsidence is simple or complex; whether plate motion is towards or away from the tropics; and whether movement from one climatic zone to another is slow or rapid. At a more detailed level, the particular facies sequence developed will reflect the influence of additional short-term controls. Although other areas illustrate specific aspects of platform development, the northeast Australian carbonate province provides a range of examples illustrating numerous aspects of platform evolution. This region is an ideal location to further refine our understanding of the factors which control platform evolution, and to seek answers to the major outstanding problems.
ACKNOWLEDGEMENTS The authors wish to thank their colleagues within the Bureau of Mineral resources for discussion on aspects of the work, particularly David Capon, George Chaproniere, Michael Etheridge and John Marshall. We thank the scientific and engineering staff who have helped us in the gathering and processing of the database in northeast Australia, and the Master and crew of the RV Rig Seismic for their patience and
74
P.J. Davies, P. A. Symonds, D.A. Feary & C.J. Pigram
professionalism during four cruises in the tropics. We also thank International Petroleum Corporation for permission to figure newly-acquired (Fig. 5A) and reprocessed (Fig. 5E) seismic data, and the Geological Survey of P a p u a New Guinea for permission to present seismic data f r o m a confidential report (Figs. 5B and C). Other non-BMR seismic data was provided by Geophysical Services International (Fig. 10A) and Australian Gulf Oil Company (Fig. 6B). The perceptive and constructive reviews of an early draft of the manuscript by Andre Droxler (Rice University, Houston), Rick Sarg (Exxon Research and Development Corporation, Houston, Texas) and Noel James (Queens University, Kingston, Ontario) are gratefully acknowledged. Davies also wishes to thank Paul Crevello (Marathon Oil Company, Littleton, Colorado) and Rick Sarg for their encouragement, and the participants at the A A P G S E P M Symposium on Carbonate Platforms for their stimulating contributions. Published with permission of the Director, Bureau of Mineral Resources.
DAVIES P.J. & HOPLEY D. 1983. Growth fabrics and growth rates of Holocene reefs in the Great Barrier Reef. BMR Journal of Australian Geology & Geophysics 8, 237-251. DAVIES P.J. & MARSHALL J.F. 1985. Halimeda bioherms — low energy reefs, northern Great Barrier Reef. Proceedings of the Fifth International Coral Reef Symposium, Tahiti, 5, 1-7. DAVIES P.J., MARSHALL J.F. & HOPLEY D. 1985. Relationships between reef growth and sea level rise in the Great Barrier Reef. Proceedings of the Fifth International Coral Reef Symposium, Tahiti 3, 95-103. DAVIES P.J. & MONTAGGIONI L. 1985. Reef growth and sea level change: the environmental signature. Proceedings of the Fifth International Coral Reef Symposium, Tahiti 3,'477-5J £ DAVIES P.J., SYMONDS P.A. et al 1988. RIG SEISMIC Research Cruises 4 and 5: Northeast Australia post-cruise report. Bureau of Mineral Resources, Australia, Report 281. DAVIES P.J., SYMONDS P.A., FEARY D A . & PIGRAM C.J. 1987. Horizontal plate motion: a key allocyclic factor in the evolution of the Great Barrier Reef. Science 238, 1697-1700.
REFERENCES
DAVIES P.J., SYMONDS P.A., FEARY D.A. & PIGRAM C.J. 1988. Facies models in exploration — the carbonate platforms of northeast Australia. The APEA Journal 28.
AUSTIN J.A. Jr., SCHLAGER W., PALMER A,A. et al 1986. Proceedings of the Ocean Drilling Program 101, Part A — Initial Reports, Bahamas.
DONE T.J. 1982. Patterns in the distributions of coral communities across the central Great Barrier Reef. Coral Reefs 1, 95-108.
BURNS R.E., ANDREWS J.E. et al 1973. Initial Reports of the Deep Sea Drilling Project 21. U.S. Government Printing Office, Washington, DC.
DUNCAN R.A. 1981. Hotspots in the southern oceans — An absolute frame of reference for the motion of the Gondwana continents. In Solomon S.C., van der Roo R, & Chinnery M.A. eds Quantitative Methods of Assessing Plate Motions.
CHAPRONIEIRE G.C.H. 1984. Oligocene and Miocene larger Foraminiferida from Australia and New Zealand. Bureau of Mineral Resources Australia, Bulletin 188. COOK P.J. & MARSHALL J.F. 1981. Geochemistry of iron and phosphorus-rich nodules from the east Australian continental shelf. Marine Geology 41, 205-221. DAVIES P.J. 1977. Modern reef growth. In Barnes D. ed. Perspectives on Coral Reefs, pp. 69-106. Australian Institute of Marine Science, Brian Clouston, Canberra.
EBERLI G.P. & GINSBURG R.N. 1987. Segmentation and coalescence of Cenozoic carbonate platforms, northwestern Great Bahama Bank. Geology 15, 75-79. EL HADDAD A., AISSAOUI D.M. & SOLIMAN M.A. 1984. Mixed carbonate-siliciclastic sedimentation on a Miocene fault-block, Gulf of Suez, Egypt. Sedimentary Geology 37, 185-202. ELMSTROM K.M. & KENNETT J.P.1985. Late Neogene paleoceanographic evolution of Site 590:
The evolution of the carbonate platforms of northeast Australia southwest Pacific. In Kennett J.P., von der Borch C.C. et al, Initial Reports of the Deep Sea Drilling Project XC, 1361-1381. U.S. Government Printing Office, Washington, DC. ERICSON E.K. 1976. The Capricorn Basin. In Leslie R.B., Evans H.J. & Knight C.L. eds. Economic Geology of Australia and Papua New Guinea, volume 3: Petroleum, pp. 464-473. Australasian Institute of Mining and Metallurgy, Monograph 7. E#ING M., HAWKINS L.V. & LUDWIG W.J. 1970. Crustal structure of the Coral Sea. Journal of Geophysical Research 75, 1953-1962. FALVEY D.A. 1972. The nature and origin t marginal plateaux and adjacent ocean basins off northern Australia. Ph.D. Thesis, University of New South Wales (unpublished). FALVEY D.A. & DEIGHTON I. 1982. Recent advances in burial and thermal geohistory analysis. The APEA Journal 22, 65-81. FALVEY D.A. & TAYLOR L.W.H. 1974. Queensland Plateau and Coral Sea Basin: structural and time-stratigraphic patterns. Bulletin of the Australian Society of Exploration Geophysicists 5, 123-126. FRAKES L.A. 1979. Climates throughout Geologic Time. Elsevier, Amsterdam. GARDNER J.F. 1970. Submarine geology of the western Coral Sea. Geological Society of American Bulletin 81, 2599-2614. GINSBURG R.N. & JAMES N.P. 1974. Holocene carbonate sediments of continental shelves. In Burk C.A. & Drake C.L. eds. Continental Margins, pp. 137-514. Springer Verlag, Berlin. HAQ B.U., HARDENBOL J. & VAIL P.R. 1987. Chronology of fluctuating sea levels since the Triassic. Science 235, 1156-1166. HAYES D.E. & RINGIS J. 1973. Seafloor spreading in the Tasman Sea. Nature 243, 454-458. HOLLISTER C.D., EWING J.I. et al 1972. Initial Reports of the Deep Sea Drilling Program XI. U.S. Government Printing Office, Washington, DC. HOPLEY D. 1982. The Geomorphology of the Great Barrier Reef: Quaternary Development of Coral Reefs. Wiley, New York. HSU K.J., McKENZIE J.A., OBERHANSLI H.,
75
WEISSERT H. & WRIGHT R.C. 1984. South Atlantic Cenozoic paleoceanography. In Hsu K.J., LaBrecque J.L. et al, Initial Reports of the Deep Sea Drilling Project 73,771-785. U.S. Government Printing Office, Washington, DC. IDNURM M. 1985. Late Mesozoic and Cenozoic palaeomagnetism of Australia — II. Implications for geomagnetism and true polar wander. Geophysical Journal of the Royal Astronomical Society 86, 277-287. IDNURM M. 1986. Late Mesozoic and Cenozoic palaeomagnetism of Australia — III. Biascorrected pole paths for Australia, Antarctica and India. Geophysical Journal of the Royal Astronomical Society 86, 277-287. JANSA L.F. 1981. Mesozoic carbonate platforms and banks of the eastern North American margin. Marine Geology 44, 97-117. KAUFFMAN E.G. 1984. Paleobiogeography and evolutionary response dynamic in the Cretaceous and Western Interior Seaway of North America. In Westermann G.E.G. ed. Jurassic-Cretaceous Biochronology and Paleogeography of North America, pp. 273-306. Geological Association of Canada Special Paper 27. KEANY J. 1978. Paleoclimatic trends in Early and Middle Pliocene deep-sea sediments of the Antarctic. Marine Micropaleontology 3, 35-49. KEMP E.M. 1978. Tertiary climatic evolution and vegetation history in the southeast Indian Ocean region. Palaeogeography, Palaeoclimatology, Palaeoecology 24, 169-208. KENNETT J.P. 1977. Cenozoic evolution of Antarctic glaciation, the circum-Antarctic Ocean, and their impact on global paleoceanography. Journal of Geophysical Research 82, 3843-3860. KENNETT J.P. 1985. Miocene to early Pliocene oxygen and carbon isotope stratigraphy in the southwest Pacific, Deep Sea Drilling Project leg 90. In Kennett J.P., von der Borch C.C. et al, Initial Reports of the Deep Sea Drilling Project XC, 1383-1411. U.S. Government Printing Office, Washington, DC. KENNETT J.P., HOUTZ R.E., ANDREWS P.B., EDWARDS A.R., GOSTIN V.A., HAJOS M., HAMPTON M., JENKINS D.G., MARGOLIS S.V., OVENSHINE A.T. & PERCH-NIELSON K. 1975. Cenozoic paleoceanography in the southwest Pacific Ocean, Antarctic glaciation, and the
76
P.J. Davies, P. A. Symonds, D.A. Feary & C.J. Pigram
development of the circum-Antarctic current. In Kennett J.P., Houtz R.E. et al, Initial Reports of the Deep Sea Drilling Project XXIX, 1155-1169. U.S. Government Printing Office, Washington, DC. KENNETT J.P., KELLER G. & SRINIVASAN M.S. 1985. Miocene planktonic foraminiferal biogeography and paleoceanographic development of the Indo-Pacific region. In Kennett J.P. ed. The Miocene Ocean: Paleoceanography and Biogeography, pp. 197-236. Geographical Society of America Memoir 163. KENNETT J.P. & VON DER BORCH C.C. 1985. Southwest Pacific Cenozoic paleoceanography. In Kennett J.P., von der Borch C.C. et al, Initial Reports of the Deep Sea Drilling Project XC, 1493-1517. U.S. Government Printing Office, Washington, DC. KINSEY D.W. & DAVIES P.J. 1979. Effects of elevated nitrogen and phosphorus on coral reef growth. Limnology and Oceanography 24,935-940. LLOYD A.R. 1973. Foraminifera of the Great Barrier Reef bores. In Jones O.A. & Endean R. eds. Biology and Geology of Coral Reefs, volume 1: Geology 1, pp. 347-366. Academic Press, New York. LOCKER S. & MARTINI E. 1985. Phytoliths from the southwest Pacific, site 591. In Kennett J.P., von der Borch C.C. et al, Initial Reports of the Deep Sea Drilling Project XC, 1079-1084. U.S. Government Printing Office, Washington, DC. LOUTIT T.S., KENNETT J.P. & SAVIN S.M. 1983. Miocene equatorial and southwest Pacific paleoceanography from stable isotope evidence. Marine Micropaleontology 8, 215-233. MARSHALL J.F. 1977. Marine geology of the Capricorn Channel area. Bureau of Mineral Resources Australia, Bulletin 163. MARSHALL J.F. 1983. The Pleistocene foundations of the Great Barrier Reef. In Baker J.T., Carter R.M., Sammarco P.W. & Stark K.P. eds. Proceedings: Inaugural Great Barrier Reef Conference, pp. 123-128. James Cook University Press, Townsville. MARSHALL J.F. & DAVIES P.J. 1978. Skeletal carbonate variation on the continental shelf of eastern Australia. BMR Journal of Australian Geology & Geophysics 3, 85-92.
MARSHALL J.F. & DAVIES P.J. 1982. Internal structure and Holocene evolution of One Tree Reef, southern Great Barrier Reef. Coral Reefs 1, 21-28. MARSHALL J.F. & DAVIES P.J. 1984. Last interglacial reef growth beneath modern reefs in the southern Great Barrier Reef. Nature 307,44-46. MAXWELL W.G.H. 1968. Atlas of the Great Barrier Reef. Elsevier, Amsterdam. MERCER J.H. 1976. Glacial history of southernmost South America. Quaternary Research 6, 125-166. MURPHY M.G. & KENNETT J.P. 1985. Development of latitudinal thermal gradients during the Oligocene: oxygen-isotope evidence from the southwest Pacific. In Kennett J.P., von der Borch C.C. et al, Initial Reports of the Deep Sea Drilling Project XC, 1347-1360. U.S. Government Printing Office, Washington, DC. MUTTER J.C. 1977. The Queensland Plateau. Bureau of Mineral Resources, Geology and Geophysics Bulletin 179. MUTTER J.C. & KARNER G.D. 1980. The continental margin off northeast Australia. In Henderson R.A. & Stephenson P.J. eds. The Geology and Geophysics of Northeast Australia, pp. 47-69. Geological Society of Australia (Queensland Division), Brisbane. MURRAY J.W. 1973. Distribution and Ecology of Living Benthic Foraminiferids. Heinemann, London. OPPEL T.W. 1969. Tenneco-Signal Anchor Cay Number 1 Offshore Queensland, Well Completion Report. Tenneco Oil Company, Houston (unpublished). ORME G.R. 1977. The Coral Sea Plateau — A major reef province. In Jones O.A. & Endean R. eds. Biology and Geology of Coral Reefs, 4, 267-306. Academic Press, New York. PALMIERIV. 1971. Tertiary subsurface biostratigraphy of the Capricorn Basin. Geological Survey of Queensland Report 52. PALMIERI V. 1974. Correlation and environmental trends of the subsurface Tertiary Capricorn Basin. Geological Survey of Queensland Report 86. PIGRAM C.J. & DAVIES H.L. 1987. Terranes and accretion history of the New Guinea Orogen.
The evolution of the carbonate platforms of northeast Australia
77
BMR Journal of Australian Geology & Geophysics SHAW R.D. 1978. Sea floor spreading in the 10, 193-211. Tasman Sea: a Lord Howe Rise — eastern Australian reconstruction. Australian Society of PINCHIN J. & HUDSPETH J.W. 1975. The Exploration Geophysicists Bulletin 9, 75-81. Queensland Trough: its petroleum potential based on some recent geophysical results. APEA Jour- SHERIDAN R.E., CROSBY J.T., BRYAN G.M. nal 15, 21-31. & STOFFA P.L. 1981. Stratigraphy and structure of southern Blake Plateau, northern Florida Straits, READ J.F. 1985. Carbonate platform facies and northern Bahama Platform from multichannel models. American Association of Petroleum seismic reflection data. American Association of Petroleum Geologists Bulletin 65, 2571-2593. Geologists Bulletin 69, 1-21. RIGGS S.R. 1984. Paleoceanographic model of STEIN R. & ROBERT C. 1985. Siliciclastic Neogene phosphorite deposition, U.S. Atlantic sediments at sites 588, 590 and 591: Neogene and Paleogene evolution in the southwest Pacific and continental margin. Science 223, 123-131. Australian climate. In Kennett J.P., von der Borch ROBERTSON RESEARCH (AUST) PTY LTD C.C. et al, Initial Reports of the Deep Sea Drilling 1984. Petroleum Potential of the Papuan Basin. Project XC, 1437-1455. U.S. Government Printing Geological Survey of Papua New Guinea (unpub- Office, Washington, DC. lished report). SYMONDS P.A. 1983. Relation between continenshelf and margin development — central and SAVIN S.M., ABEL L., BARRERRA E., tal northern Great Barrier Reef. In Baker J.T., Carter HODELL D., KENNETT J.P., MURPHY M., Sammarco P.W. & Stark K.P. eds. ProKELLER G., KILLINGLEY J. & VINCENT E. R.M., ceedings: Inaugural Great Barrier Reef Conference, 1985. The evolution of Miocene surface and near- pp. 115-157. James Cook University Press, surface marine temperatures: oxygen isotopic Townsville. evidence. In Kennett J.P. ed. The Miocene Ocean: Paleoceanography and Biogeography, pp. 49-82. SYMONTS P.A., FRITSCH J. & SCHLUTER Geological Society of America Memoir 163. H.-U. 1984. Continental margin around the western Coral Sea Basin: structural elements, SAVIN S.M., DOUGLAS R.G. & STEHLI F.G. seismic sequences and petroleum geological aspects. 1975. Tertiary marine paleotemperatures. Geolo- In Watson S.T. ed. Transactions of the Third gical Society of America Bulletin 86, 1499-1510. Circum-Pacific Energy and Mineral Resources Conference, Hawaii, pp. 243-252. American SCHLAGER W. & GINSBURG R.N. 1981. Association of Petroleum Geologists, Tulsa. Bahama carbonate platforms — the deep and the past. In Cita M.B. & Ryan W.B.F. eds. Carbonate 1975. Development of the Tertiary Platforms of the Passive-Type Continental TALLIS N.C. Papuan Basin. The APEA Journal 15, Margins, Present and Past. Marine Geology 44, offshore 55-60. 1-24. TANNER J.J. 1969. The ancestral Great Barrier SCOTT R.W. & GOVEAN F.M. 1985. Early Reef in the Gulf of Papua. U.N. Economic Comdepositional history of a rift basin: Miocene in mission for Asia and the Far East, Mineral Western Sinai. Palaeogeography, Palaeo- Resources Development Series 41, 283. climatology, Palaeoecology 52, 143-158. TAYLOR L.W.H. 1975. Depositional and tectonic SHACKLETON N.J. 1986. Paleogene stable patterns in the western Coral Sea. Bulletin of the isotape events. Palaeogeography, Palaeo- Australian Society of Exploration Geophysicists 6, 33-35. climatology, Palaeoecology 57, 91-102. SHACKLETON N.J. & KENNETT J.P. 1975. TAYLOR L.W.H. 1977. The western Coral Sea: Palaeotemperature history of the Cenozoic and the sedimentation and tectonics. Ph.D Thesis, Univerinitiation of Antarctic glaciation: Oxygen and car- sity of Sydney (unpublished). bon isotope analyses in DSDP sites 277, 279 and 281. In Kennett J.P., Houtz R.E. et al, Initial TAYLOR L.W.H. & FALVEY D. 1977. QueensReports of the Deep Sea Drilling Project XXIX, land Plateau and Coral Sea Basin: stratigraphy, pp. 743-755. U.S. Government Printing Office, structure and tectonics. The APEA Journal 17, 13-29. Washington, DC.
78
P.J. Davies, P . A Symonds, D.A. Feary & C.J. Pigram
VAN HINTE J.E. 1978. Geohistory analysis — application of micropalaeontology in exploration geology. American Association of Petroleum Geologists Bulletin 62, 201-222. VEEH H.H. & VEEVERS J.J. 1970. Sea level at — 175m off the Great Barrier Reef 13,600 to 17,000 years ago. Nature 226, 536-637. WEISSEL J.K. & HAYES D.E. 1977. Evolution of the Tasman Sea reappraised. Earth and Planetary Science Letters 36, 77-84. WEISSEL J.K. & WATTS A.B. 1979. Tectonic evolution of the Coral Sea Basin. Journal of Geophysical Research 84, 4572-4582.
WEISSERT H.J. McKENZIE J.A., WRIGHT R.C. CLARK M., OBERHANSLI H. & CASEY M. 1984. Paleoclimatic record of the Pliocene at Deep Sea Drilling Project Sites 519, 521, 522 and 523 (Central South Atlantic). In Hsu K.J., LaBrecque J.L .etaly Initial Reports of the Deep Sea Drilling Project 73, 701-715. U.S. Government Printing Office, Washington, DC. WELLMAN P. 1983. Hotspot volcanism in Australia and New Zealand: Cainozoic and Mesozoic. Tectonophysics 96, 225-243. WILSON J.L. 1975. Carbonate Fades in Geologic History. Springer-Verlag, Berlin.
Maastrichtian and early Cainozoic, southern Australia: planktonic foraminiferal biostratigraphy B. McGOWRAN
Department of Geology and Geophysics, University of Adelaide, Adelaide, South Australia 5001, Australia. The Paleocene and Eocene stratigraphic record in southern Australia is summarised in terms of planktonic foraminiferal biostratigraphy, and the ages of some horizons are revised. The stratigraphic record sorts even more clearly into two parts than was apparent previously: a Late Paleocene to Early Eocene succession of marine ingressions, or short-lived episodes of marine influence; and a later Eocene succession of four transgressions. It is emphasised that in all respects - marine record, terrestrial palynozones, distribution of coals and organic facies - there is a gap of about 10 million years within the Eocene record (late Ypresian Stage and all of the Lutetian Stage) within which firm biostratigraphic dates are lacking on the continental margin. However, a calcareous oceanic section on the Naturaliste Plateau spans that gap. The new data come from successful dredging of the southern continental margin during BMR Survey 66. A much fuller microfaunal characterisation of the Princetown and Burrungule ingressions (Early Eocene, Otway Basin) is suggested by correlation, and there are richer assemblages in the later Middle Eocene to earliest Oligocene than have been available hitherto. However, the most spectacular find was the first planktonic foraminiferal evidence for marine Maastrichtian on the margin of the nascent Southern Ocean. Correlations with allocyclic phenomena, such as putative global sea level changes and major events in the oceanic stable isotope record, are not particularly strong; a three-part tectonic subdivision of the Early Tertiary shows a rather strong correlation. Key words: Eocene, foraminifera, local and global events, Palaeocene, southern Australia, transgressions and ingressions.
economically significant coals and dispersed organic facies. It is as well, too, that we remind ourselves from time to time that locally recognised events in the stratigraphic record will have a local, or autocyclic, component and a regional to global, or allocyclic, component, and so a sea level curve, a tectono-stratigraphic division of the early Tertiary, and major events in recently compiled curves based on oxygen and carbon isotopes are presented in a correlation.
INTRODUCTION
This paper is about biostratigraphic correlations based on planktonic foraminifera. It summarises evidence for recognising five marine horizons, or ingressions, in southern Australia (Fig. 1), plus one from the Perth Basin, and for correlating them with the PZones of lower palaeolatitudes as calibrated geochronologically by Berggren et al (1985). I discuss further the evidence for recognising the dating of four transgressions in the later Eocene (where later Eocene lithostratigraphy may be found). The main new data bearing on these matters come from dredging at the continental margin during the Rig Seismic Cruise 11, BMR Survey 66 (Davies et al 1989). Samples are summarised in the Appendix. Correct or not, such correlations are the basis for scaling the widely used zones based on terrestrial and marine palynomorphs and for dating events in floral evolution, as well as
BIOSTRATIGRAPHIC AND CHRONOSTRATIGRAPHIC FRAMEWORK
79
(i) Local and global units. Since the fossil record does not come in pre-packaged zones waiting to be revealed, different workers in the same group of fossils in essentially the same biogeographic and biofacies regime propose somewhat different zonations, at least
80
B. McGowran
partly as a matter of individual taste and perception. As well, there are different zonations for different major fossil taxa and for different biogeographic and biofacies regimes.
The clutter, even for merely one taxonomic group in one region, can get out of hand, and I abandoned local formal zones accordingly, as discussed elsewhere (McGowran 1986a).
EUCLA and GREAT AUSTRALIAN BIGHT A ST. VINCENT
Later Eocene Transgressions
Agressions
A Aldinga Tu Tuketja To Tortachilla W Wilson Bluff
Burrungule Early B Eocene P Princetown R Rivernook Ra Rivernook-A Late Paleocene PPt Pebble Point Ceduna Maastrichtian C
Fig. 1 Locality map, showing Australia/Antarctica separation and state of seafloor spreading at about the time of geomagnetic Anomaly 19 (Falvey & Mutter 1981); geographic configuration is not changed significantly by revision of geomagnetic configuration (Cande & Mutter 1982). Transgressions and ingressions as discussed in text and in McGowran (1989).
Instead, the P-Zones of the early Tertiary in low-latitude planktonic foraminiferal biofacies are employed as chronozones, in the sense promoted by the International Subcommission on Stratigraphic Classification. That is, the P-Zones are employed as a standard beyond the limits (facies and biogeography of defining species) of their actual, direct recognition - they are employed by correlation, not by identification (McGowran 1986b). Thus, the foraminiferal events and other characteristics of the southern Australian record are shown quite informally in Figures 2 and 3, whilst at the same time, as rigorously as present knowledge allows.
Palynological zones are a different matter, since they are 'local' in their recognition and routine use. Even so, parallel schemes have been proposed for the region (Fig. 2). As plankton biostratigraphy develops both as refined zonations and as cross-correlations between zonations in geomagnetostratigraphic and geochronological frameworks, so (it is a reasonable generalisation) are the classical stages of western Europe (Danian to Rupelian in Fig. 5) being used less and less as part of the global scheme. Although local stages are used routinely in some regions (Paratethys, New Zealand) they are rarely actually used
Planktonic and foraminiferal biostratigraphy Ma
Zones
Foraminifera intervals
Planktonic events
34nO
P18 Subbotina linaperta P17~ -yr- ^ - / T e n u i t e l l a insolita
36 38 40 42 444648 50-] 52 54 H 56 5860
-Pie- - ^ G l o b i g e r i n a t h e k a index Globigerinatheka spp. Pis I Z I Tenuitella aculeata
m
^Turborotalia increbescens ALDINGA ^Hantkenina primitiva
TUKETJA
Acarinina collactea •jTurborotalia increbescenl TORTACHILLA Acarinina primitiva - r - S u b b o t i n a frontosa WILSON BLUFF -^-{Tenuitella aculeata P12 =2=\Chiloguembelina cubensis \ T u r b o r o t a I i a pomeroli Globsgerinatheka index P11 Planorotalites australiformis Guembelitria triseriata x
81
Terrestrial Palynomorphs Gippsland
South Australia
upper Nothofagidites asperus
Sparganiaceae pollenites barunqensis
middle Nothofagidites asperus
Triorites magnificus
lower Nothofagidites asperus
Proteacidites pachypolus
P10 P9 P8
-P7P6 a I— P4
62-
Transgressions Ingressions
3PP1
64
— P2-
66
m
t - Morozovella caucasica ,Pseudohastigerina micra Proteacidites Proteacidites • ^ { A c a r i n i n a primitiva BURRUNGULE Ps. "pseudoiota' asperopolus confragosus _ Morozovella caucasica PI. australiformis u.Malvacipollis Cupanieidites , PRINCETOWN ^Chiloguembelina T j-j—jdi versus -r-—ortnpTeichus_ „ wilcoxensis A. wilcoxensis lower M.diversus Myrtaceiaites ^ M o r o z o v e l l a aequa A.esnaensis.S. patagonica euoeniioides J upper L. balmei Morozovella a c u t a PEBBLE POINT lower Gambierina \Ps.*pseudoiota" — —— rKINGS PARK Lygistepollenites edwardsii Planorotalites australiformis Planorotalites chapman> N balmei Planorotalites pseudomenardii
5I
68-1 MAAST
CEDUNA
Tricolpites longus
Fig. 2 Biostratigraphic framework, Paleocene-Eocene, southern Australia. Composite succession of regional planktonic foraminiferal - biostratigraphic events, obtained by interpolation of scattered sections and samples, is correlated with the low-latitude succession of P-Zones, calibrated geochronologically by Berggren et al (1985). Intervals with characteristic species are additional to the succession of events. Ingressions and transgressions correlated as discussed in text and in McGowran (1989); same for zones based on terrestrial palynomorphs. Ma geomag. foram nanno
P18
cvj
CL
P17
37-
r M
Subbotina linaperta Cassigerinella cnipolensis
a
Turborotalia ampliapertura /Globigerinatheka index * Tenuitella TcniiitPlI insolita Tenuitella aculeata Globigerinatheka spp. [ _
P16
38-
P15
Tenuitella aculeata
ALDINGA -\Chinaman Gully
decline 111 Chiloguemoelina perturbation Globigerinatheka decline 11
UJ Z
LU o
o LLI LU £
TUKETJA . Globigerinatheka decline 1
Acarinina collactea
•
I
43-
< d^ LLI
Halkyardia Linderina
Tenuitella gemma
I I
Guembelitria fluctuations
Hantkenina primitiva Pseudonastigerina micra
39-
40
SuDbotina aflaiporoides Globigenna brevis SuDbotina linaperta Tenuitella aculeata Turborotalia increbescens/ amoiiaoertura
P14
Acarinina primitiva / Cassigerinella \ winniana Tenuitella insolita
Turborotalia increbescens group
Halkyardia Linderina Discocyciina Guembelitria
|
TORTACHILLA LLI W
DW QO P13 Subbotina frontosa
P12
Planorotalites pseudoscitula Turborotalia pomeroli Morozovella aff. spinulosa
LLI
WILSON BLUFF
Fig. 3 Later Eocene foraminiferal biostratigraphy, showing more detail than Figure 2. Globigerinatheka and Chiloguembelina events, from McGowran (1987); Guembelitria and (benthic, tropical-type) HalkyardiaLinderina-Discocyclina horizons, from McGowran and Beecroft (1985), except for late Middle Eocene Guembelitria which is of uncertain existence (see Appendix); other assemblages shown as boxes, as in text and Appendix.
82
B. McGowran
in the Paleocene and Eocene of southern Australia. (ii) Transgressions, ingressions. I have argued (McGowran 1989) that the later Eocene record sorts biostratigraphically into four transgressions. That those transgressions are both 'natural' and important is suggested by the evidence that they are horizons of enhanced overturn of species in benthic foraminiferal faunas (McGowran & Beecroft 1986b). They are also the horizons chosen as zonal boundaries in schemes based on terrestrial and marine palynomorphs (Harris 1985). Thus the four horizons labelled as transgressions in Figures 2, 3, 4 and 5 could equally well be recognised as Oppelzones but with a difference, being based collectively on phytoprotists, zooprotists and terrestrial pollens (McGowran 1986a). That kind of Oppelzone would be more useful than either the local stages (e.g. Lindsay 1985, Fig. 4; McGowran 1989, Fig. 8) or local foraminiMa
Zones
1 _J° o
3840 -
44 LU 2 LU 48 - O
46 '
o
50-
MIDDLE
42
UJ
LATE
36 -
LU
P18 " P17" -P16P15 P14 -P13P12
ALDINGA TUKETJA TORTACHILLA WILSON BLUFF
feral zonation formalised using the events in Figures 2 and 3. It may well be that a revised system of local stages will be based on these 'natural' divisions, which would resemble the 'integrated assemblage zones' of the Paratethys (Steininger 1977). The difference between the later Eocene 'transgressions' and the Maastrichtian-Early Eocene 'ingressions' is merely that the older units are short-lived thrusts by marine facies into an essentially marginal marine or paralic facies. As discussed elsewhere (McGowran 1989) and below (Fig. 5), the difference probably reduces explanatorily to the difference between subdued seafloor spreading before and suddenly accelerated spreading after the time of geomagnetic Anomaly 19. As also outlined below, the ingressions have their own characteristic foraminiferal assemblages and - to some degree at least - distinctive palynomorphic contents, as indicated by palynozones (Fig. 2). It may be that chronostrati-
UPPER CLINTON i COAL LOWER CLINTON COAL
j
r
SEDAN COAL lateritization45+ S
KINGSTON COAL
I
Anglesea floras ANGLESEA "I, Maslin Golden Grove flora JL, flora COAL
t
P11 P10 Channelling 111
52
P9 P8 56 - P7 — P6adb " 58 LLJ - P5 — 60 - UJ2 UJ P4 5 4 --
6 2 --
5 DC < UJ
O
o
LU 64 . _J
6668
£
BURRUNGULE PRINCETQWN RlVEfiNOOK RIVERNQOK-A PEBBLE POINT
< P3-6-
LU
P2
Major microfloral change angiosperms:maximum k evolutionary overturn lateritization 50°S warming
.Channelling 11 _Channelling 1
I I
a
a-b
MAAST
UPPER EASTERN VIEW ORGANIC FACIES LOWER EASTERN VIEW ORGANIC FACIES
CEDUNA
4
Fig. 4 Correlation of some coals and other phenomena. Note how the Early Tertiary record under biostratigraphic control clusters into two parts. Channel-cutting events in Gippsland Basin, from Brown (1986); other events and correlations as discussed in text.
Planktonic and foraminiferal biostratigraphy
graphic units can in due course be based on ingressions, as on the younger transgression.
'Ceduna ingression' after the Ceduna Plateau. The more diverse assemblages include Globotruncanella havanensis/petaloidea, Rugotruncana subpennyi, Pseudoguembelina excolata and a variable assortment of the Rugoglobigerina rugosa group, among several other species (Appendix) and a probably monospecific swarm of high-conical radiolarians. The assemblage is not older than Middle Maastrichtian and probably correlates with the (Late Maastrichtian) Miria Marl in the Carnarvon Basin. The presence of a much less prominent component of Globotruncana (only the arca/linneiana group) than in the Miria Marl is probably a latitudinal effect, together perhaps with a filtering effect of a narrow seaway, distant from the Indian Ocean.
MAASTRICHTIAN: CEDUNA INGRESSION Although oceanic crust was being emplaced slowly between Australia and Antarctica from the Late Cretaceous to the Middle Eocene (Cande & Mutter 1982), the known marine record has lacked a convincing Maastrichtian foraminiferal assemblage. Thus, a cluster of samples dredged from the margin with Maastrichtian plankton and benthos constitute a significant discovery, confirming the long and narrow seaway postulated for that time by Frakes et al (1987). The event is named the
35-
13
P18 C13
P17
-15 C15 P16 16
40-
18
-
45-
P15
I
z
P12
•20
P11
Q Q
I-
cn ut ac
5E
UJ
>
P6a
325
26
Pfi
P4
326 P3
Q
30 330
LATE CRET
P2 UJ _wm •27 C27 P1c £C 28 328 < 65P1b JJJJ 29 P1a UJ 32^ -
Z <
< 0 P7 njO
324 P6b
TECTONIC STAGE III
A KHIRTHAR T TRANSGRESSION
WILSON BLUFF
CAINOZOIC COOLING
D -J
23 323 P8 5 2 m
•25
? stratified ocean
TUKETJA TORTACHILLA
C21 P10
mm) 24
60- a .
• • • CAINOZOIC COOLING U • • ITERMINAL EOCENE EVENT
h-
LATE DCENE SEELAN - IAN
m\
ALDINGA \ CHINAMAN GULLY
z <
Ui -1
-21
-
Transgression Regression
UJ
_• 22 322 P9 55-
Exxon Sea level curve
O O
UJ
C2Q
•
LU
P14 C18 P13 UJ
•19 C19
-
50-
C16
17 C17
EARLY LATE EOCENI OLIG. BARTON [ PRIA - RUPEL 1 BONIAN -IAN -IAN
Anomaly Zone Age Ma Chron
83
STAGE
EARLY EOCENE F WARM PERIOD
BURRUNGULE PRINCETOWTT" RIVERNOQK RIVERNOOK-A PEBBLE POINT KINGS PARK"
TECTONIC • •
I I I
C-13 ^POSITIVE EXCURSION
TECTONIC STAGE
< z < O H 00 <
<
CEDUNA
• • • • K/T C-13 SHIFT • J
• • •
Fig. 5 Ingressions and transgressions in southern Australia, set in a matrix of more wide-ranging and possibly global phenomena. Comprehensive chronology at left from Berggren et al (1985). Sea level curve from Haq et al (1987); note that curve is transferred from their scale to the Berggren et al (1985) scale. Justification for recognising three tectonic stages is in McGowran (1989). For '? stratified ocean' before Terminal Eocene Event, see McGowran (1987). Events and inferences based on carbon and oxygen isotopic data, from Shackleton (1986).
84
B. McGowran
LATE PALEOCENE AND EARLY EOCENE MARINE INGRESSION The earliest Tertiary sediments known from the southern Australian margin are carbonatepoor and show a rather pervasive but weak marine influence demonstrated by the presence (where not oxidised) of marine-type dinoflagellates and the agglutinated benthic foraminifera Cyclammina and Haplophragmoides (Ludbrook 1977). Punctuating this biofacies are horizons with varyingly common glauconite, shelly marine fossils, calcareous benthic foraminifera and planktonic foraminifera. Taylor (in Deighton et al 1976) has identified up to eight of these marine ingressions, or short-lived increases in marine influence, across the northern margin of the nascent and still very narrow Southern Ocean. But 'identified' means accumulating a succession by correlation and interpolation from scattered, mostly subsurface, sections in different sedimentary basins. Here, I consider the five of those ingressions that now can be considered to have a moderately respectable foraminiferal assemblage (at least, in two cases, by correlation with recently dredged samples) plus one (now the oldest known) from the Perth Basin (Fig. 2).
Kings Park Ingression There is nothing to add to previous conclusions (McGowran 1978b) that the association of Planorotalites chapmani, P. pseudomenardii, Morozovella convexa, and Acarinina mckannai indicates correlation with the lower part of Zone P4. Quilty (1978) has shown that the Kings Park Shale spans the biostratigraphic interval from Zone P4 (with P. chapmani) to Zone P6b (equivalent to the Rivernook, herein). It must be noted that the holotype of P. chapmani is not a valvulineriid, as speculated by Blow (1979), but conspecific with the other forms assembled by Toumarkine and Luterbacher (1985, Fig. 12.5-8) (compare also oriented thin sections in McGowran 1968, pi. 4:13-18, 21.
Pebble Point Ingression The dating of the marine horizon in the Pebble Point Formation was always difficult because the planktonic foraminiferal assemblage is very sparse. A somewhat tentative argument ran as follows (McGowran 1965): in the Carnarvon Basin, the morphological variation in large populations of Planorotalites chapmani expanded just before the emergence of P. pseudomenardii, i.e. at the base of Zone P4. The increased morphological range in P. chapmani included the morphotypes ehrenbergi and haunsbergensis. Such forms seemed to agree with the specimens at Pebble Point, which accordingly suggested correlation with uppermost Zone P3. Although the Pebble Point Planorotalites showed a strong similarity to P. australiformis from the Late Paleocene - Middle Eocene of New Zealand with disturbing implications for a Middle Paleocene age (McGowran 1970), that age has not actually been changed (e.g. McGowran 1978b). Meanwhile, the Pebble Point horizon, as Zonule U of D.J. Taylor (in McGowran et al 1971) has slipped down to a level correlated with Zone P2 (e.g. Smith 1986, Fig. 8; Holdgate et al 1986, Fig. 5), apparently in response to Partridge's (1976) correlation of the dinoflagellate Eisenackia crassitabulata Assemblage Zone with Zone P2. And so the Pebble Point Formation and its correlatives, the Rotten Point Sand and Bahgallah Formation, are placed in the Early Paleocene in Thompson's (1986) synthesis of stratigraphic sequences in Victorian sedimentary basins which is much too old, and below the seismicstratigraphic cycle boundary (Vail et al 1977) instead of above it. However, recent comparison by me of the Pebble Point specimens with P. australiformis from the Early Eocene of New Zealand and southern Australia showed no significant differences. It seems clear now that the Pebble Point assemblage postdates Planorotalites pseudomenardii (the total-range nominate species for Zone P4) rather than predates that
Planktonic and foraminiferal biostratigraphy
species, as concluded previously. P. australiformis first appears stratigraphically at about the highest level of P. pseudomenardii in New Zealand (Jenkins 1971). If the Rivernook-A ingression is correlated with Zone P6a (see below), then the Pebble Point ingression should fall somewhere near the Zone P4/P5 boundary. Rivernook-A and Rivernook Ingressions The co-occurrence of Pseudohastigerina wilcoxensis and Morozovella acuta (McGowran 1970) indicates a correlation of Rivernook-A with a level approximating Zone P6a. Containing Morozovella aequa as a prominent species, the Rivernook assemblage is no younger than Zone P6b. The two assemblages have in common Acarinina esnaensis, Acarinina wilcoxensis, and Subbotina patagonica. The last species characterises Early Eocene planktonic assemblages at high northern latitudes. Also present in both assemblages are the Chilogu-embelina wilcoxensis and Ch. midwayensis species groups. Princetown Ingression The microfaunas of the Princetown Member of the Dilwyn Formation and of the underlying Trochocyathus Bed, both outcropping at Princetown, Victoria in the Otway Basin, are very sparse and poorly known. A dredged sample, in contrast, has a relatively diverse planktonic fauna (Appendix). It differs from the Rivernook assemblage especially in: 1) the absence of Morozovella aequa and the replacement of Acarinina esnaensis and A wilcoxensis by Acarinina collactea and A. nitida; 2) numerous Chiloguembelina wilcoxensis but the Ch. midwayensis group is very rare; and 3) higher numbers of Pseudohastigerina wilcoxensis and of Planorotalites together with turborotaliids that anticipate later faunas. The Early Tertiary phase of evolution in Chiloguembelina concludes with Ch. wilcoxensis and Ch. midwayensis in Zone P7 or its equivalents (Beckmann 1957), as does the
85
range of Acarinina nitida (Berggren 1977). Thus, the difference between the Rivernook assemblage and this sample are consistent with correlations respectively with Zones P6b and P7, rather than with some kind of biofacies contrast between coeval assemblages. Thus, too, it seems fairly safe to identify the dredged marine horizon with the Princetown ingressions. The latter has been correlated with Zone P7 since the synthesis by McGowran et al (1971), but never on the basis of hard evidence. That situation is now improved. Burrungule Ingression The Burrungule Member of the Knight Formation (Gambier Embayment of Otway Basin) is the highest of the marine ingressions of the Early Tertiary 'Sequence One' (McGowran 1979). Its correlation has shifted from Zone P10 or equivalents in the early Middle Eocene (Ludbrook & Lindsay 1969; McGowran et al 1971) to Zone P9, late Early Eocene (McGowran 1978b). A sample (DR08A) dredged from the continental margin is, it is suggested here, both coeval with the Burrungule ingression and evidence for correlating the latter with Zone P8. The argument involves the planktonic foraminiferal assemblage of the Princetown ingression and also the oceanic assemblages from DSDP Site 264 on the Naturaliste Plateau. The sample has a diverse planktonic assemblage of subbotinids, acarininids, Planorotalites and Pseudohastigerina (Appendix). That it is a relatively rich assemblage (by southern Australian standards) is important, because biostratigraphic argument relies rather too heavily for comfort on negative evidence. With respect to the Princetown horizon, the sample lacks Chiloguembelina and has a prominent but unidentified turborotaliid. With respect to the late Early Eocene of the Naturaliste Plateau (McGowran 1978b, Table 1) the sample lacks Morozovella caucasica, Acarinina primitiva and convincing A. densa, and contains abundant
86
B. McGowran
Pseudohastigerina wilcoxensis instead of the rare, more micra-like species at Site 264. Accordingly, sample DR08A can be correlated with Zone P8 in that it is sandwiched between the Princetown ingression (Zone P7) and the beginning of the section at Site 264 (Zone P9). This is particularly important in terms of foraminiferal-biostratigraphic datums, because it helps identify the incoming of Acarinina primitiva in southern Australia at an horizon somewhere near the Zone P8/P9 boundary (Fig. 2). The presence in the Burrungule Member of Acarinina collactea without A. primitiva, and of Pseudohastigerina wilcoxensis without Ps. micra, suggests that that horizon should be placed at about Zone P8.
southern Australia and New Zealand (Guembelitria triseriata, Globigerinatheka index, Hantkenina, Tenuitella aculeata, Cassigerinella winniana). iii) Intervals where one or more species are more prominent in foraminiferal assemblages than they are above or below. Some are based on quantified profiles - Chiloguembelina and Globigerinatheka (McGowran 1987); others, though based only on observation without counting, still can be tested. iv) The tropical-type benthic genera Halkyardia, Linderina and Discocyclina occur in discrete intervals which seem to have strong palaeoclimatic significance, as synthesised in an ambitious time-space model (McGowran 1986a, Fig. 4; 1986b, Fig. 11). MIDDLE AND LATE EOCENE Rig Seismic samples from the late Middle BIOSTRATIGRAPHY have very variable assemblages On the basis of biostratigraphic correlation, Eocene (Appendix). It seems likely that the associait was shown that the stratigraphic record on tion of Acarinina primitiva, A. collactea and the southern Australian margin sorted into Turborotalia increbescens is younger than one four transgressions (McGowran 1989). They without T. increbescens; correlating the top have been labelled the Wilson Bluff, Torta- of the latter with top Zone P13 is hardly more chilla, Tuketja and Aldinga transgressions, as than a guess. An horizon with Guembelitria shown on Figures 2, 3, 4 and 5. The biostrati- is new (if not a contamination), but still graphic events (Figs. 2 and 3) are discussed consistent with the thesis that it is a coolerelsewhere (McGowran 1987,1989; McGowran water & Beecroft 1985, 1986a; Lindsay & Fig. 4).indicator (McGowran & Beecroft 1985, McGowran 1986); additional comment is based largely on new data from the Rig Seismic The ESSO Jerboa No. 1 oceanic section in samples. Figures 2 and 3 attempt, firstly, to the Great Australian Bight Basin (Fig. 1) order and arrange and, secondly, to correlate provides an opportunity to confirm in one various kinds of biostratigraphic data, as section a succession of several events which follows: previously had been assembled piecemeal neritic facies. A log of biostratigraphic i) Conventional first and last appearances in events in Jerboa No. 1, as shown in Figure 6, are based on 'local ranges' of taxa. has been used to emphasise parallelism ii) Temporary' first and last appearances between southern Australia and New Zealand are based on sharp disappearances or incom- (McGowran 1986a, Fig. 6). Particularly ings which, even so, are not final; the taxon important is the succession of last appearances returns after a substantial interval of time dur- of Acarinina primitiva, Acarinina collactea ing which it seems to be absent from 'suitable' and Tenuitella aculeata below an horizon with sedimentary facies. McGowran (1986a; 1986b, Hantkenina primitiva - certainly the same as Fig. 13) referred to these disjunct distributions the Hantkenina horizon in the St. Vincent and through time as a version of the Lazarus Otway Basins (Glaessner 1951). The strongly effect, and showed that there was significant disjunct vertical distribution of Tenuitella correlational value in this effect between aculeata confirms the distribution in the Aire
Planktonic and foraminiferal biostratigraphy 87 JERBOA #1: LATE EOCENE BIOSTRATIGRAPHIC LOG
3 1020-
1030-1
*o
.
w Guambalitrla trlseriata
80-
79-
•7*
Pseudohastlgsrlna mlera
IOOOH
,Globlgerlnatheka 9pp
1070-1
Tenultalla gemma
1080-fl
70-
—
\\
T* 1090-
68-
1100-1
66-
1110-1
•9
Tanul talla' aculaat a
1040*1
1050-1
Itirboiotalla Increbescens
Subbotlna llnaparta
81-
90i
Hantkenlna primitive Tenultella aculeata
Acarlnlna collactea
Acarlnlna primitive
1120-1 first <
list tppoiranc*
Incursion
1130H
Fig 6 Events in the planktonic foraminiferal succession in the Jerboa section (which is in oceanic carbonate here but which begins in Middle Eocene inner neritic sands, glauconite and shelly benthos - i.e. the Wilson Bluff transgression; McGowran 1989). SWC - Sidewall Core Number.
District (McGowran 1978b, Table 2), and the two horizons with relatively common specimens of the Turborotalia increbescens group
are entirely consistent with their neritic positions at the Tortachilla and Aldinga transgressions, respectively, where they are associated
88
B. McGowran
with the two Halkyardia - Linderina benthic assemblages. Less consistent are the incoming of Tenuitella gemma above Hantkenina instead of below, and the early final disappearance of Pseudohastigerina micra. The last Globigerinatheka spp. reflects the second of three strong fluctuations in Globigerinatheka, not the third and last (item (i) in Table 1) which is the last G. index in Figure 3. Thus, the composite succession assembled in Figure 3 is presented as a reasonably consistent pattern of later Eocene foraminiferal biostratigraphy in southern Australia, as we understand it at the present time. Its correlation with standard modern scales is another matter: at c. 50°S palaeolatitude our microfaunas were a long way from the tropical standards and from the stage stratotypes in Europe. The Wilson Bluff transgression is placed at the Lutetian/Bartonian boundary (McGowran 1989). If we accept that last Acarinina has the same offset beyond last Morozovella and Planorotalites as elsewhere (Berggren et al 1985), then the Tortachilla transgression is close to the Zone P14/P15 boundary (by correlation, not by zonal identification in this region). The correlation of the top of the assemblage with Planorotalites pseudoscitula (Fig. 3) with top Zone PI3 is more hopeful than rigorous. Top Acarinina primitiva probably is high in Zone P14 equivalents. Shafik (1981) presented an argument based on calcareous nannofossil biostratigraphy for raising the (foraminiferal) Hantkenina ingression to a level well within (foraminiferal) Zone P16. The base of (nannofossil) Zone NP19/20 as shown in Figure 3, from Berggren et al (1985), would support that, because base Isthmolithus recurvus, the defining event, occurs just below the Hantkenina ingression in southern Australia. However, that event is sporadic at low latitudes and probably is diachronous, even to the extent of occurring as low as base Chron 16 at higher latitudes (Backman 1987). Also, the event entered in Figure 3 as top Globigerinatheka spp. low in Zone P16 is probably the same as either top
Globigerinatheka semiinvoluta low in Zone P16 (Pomerol & Premoli Silva 1986) or 'decline in Globigerinathekids' (Keller 1986). In the Aire district, the fully marine section of the Browns Creek Formation (i.e. with calcareous benthos and plankton) begins with the Tortachilla transgression (McGowran 1989). Thompson (1986) shows the Browns Creek Formation and correlatives in the Otway Basin (Narrawaturk Marl) as beginning about 5 Ma too early in the Middle Eocene. Table 1: Events Pertinent to Recognition of Eocene/Oligocene Boundary. Sources: mostly Lindsay & McGowran (1986), McGowran (1987) and references. (ix) T Subbotina linaperta (viii) B Cassigerinella chipolensis (in presence of C. winniana) (vii) T Tenuitella aculeata (sporadic at top of range) (vi) B Guembelitria triseriata (sporadic at base of range) (v) B Turborotalia ampliapertura (iv) T rare Globigerinatheka index T rare Tenuitella insolita (iii) Halkyardia - Linderina - Maslinella benthic assemblage (ii) Chinaman Gully regression (i) T abundant Globigerinatheka index T common Tenuitella insolita T- top; B - base
That brings us to the biostratigraphy of the Terminal Eocene Event' and the biostratigraphic identification of the Eocene/Oligocene boundary (Table 1). Table 1 lists events in the stratigraphic interval within which the Eocene/Oligocene boundary will be identified, depending on one's belief as to correlation and identification of that level. At the base is last common Globigerinatheka index in a quantified profile (shown as top III in Figure 3, from McGowran (1987)) which can be correlated with a pronounced decline in Globigerinatheka near the top of Zone P16 (Pomerol & Premoli Silva 1986). This level,
Planktonic and foraminiferal biostratigraphy
89
which is also the level of last common Tenuitella insolita (McGowran 1978b), could perhaps be coeval with a narrow interval in New Zealand spanning the extinctions of Globigerinatheka index, Pseudohastigerina micra, Subbotina linaperta and Tenuitella insolita (Jenkins 1986). However, Lindsay (1985; also Lindsay & McGowran 1986) has shown that carefully discriminated Subbotina linaperta extends consistently above Globigerinatheka index in New Zealand as well as in southern Australia, and that horizon is at the top of the list of events in Table 1. The stratigraphic offset between G. index and S. linaperta is confirmed here in deepwater facies (Appendix). The last S. linaperta occur close to first Cassigerinella chipolensis, which defines the base of the basal Oligocene Cassigerinella chipolensis/Pseudo-hastigerina micra Zone (Bolli & Saunders 1985; = Zone PI8/19), the last Tenuitella aculeata which occur sporadically (McGowran 1978b; Lindsay & McGowran 1986), and the first common Guembelitria triseriata (McGowran & Beecroft 1985). Any of these four events could be taken as an approximation of the Eocene/ Oligocene boundary as recognised here. In the scheme of Figures 2 and 3, the Chinaman Gully regression is placed at about the Zone PI6/17 boundary and the last Subbotina linaperta near the top of Zone PI7.
If the biostratigraphic arguments for huddling the six marine ingressions together in a seven-million-year interval (Fig. 2) are correct, then the bimodal aspect of the Early Tertiary record is emphasised even more than previously (McGowran 1979). Using marine horizons with foraminifera to correlate palynozones with global scales, we have a gap of eight or ten million years between the Burrungule ingression and the Wilson Bluff transgression in which there is no control currently available - as much as 15% of Cainozoic time. Even in the Gippsland Basin, it could be argued that there are no sediments (of the Latrobe Group) representing the interval between the equivalents of the Burrungule and Wilson Bluff horizons. Partridge (1976) published an undocumented zonation of dinocysts which were correlated against low latitude foraminiferal zonations via dinocyst correlations with New Zealand, since calcareous fossils are very rare in the Latrobe Group. Marshall and Partridge (1988) have demonstrated that there is still considerable doubt about actual palynological coverage of much of the Middle Eocene. At the present time, it remains to be demonstrated where the interfaces between palynozones in the various schemes actually lie, in the interval encompassing the late Early Eocene and most of the Middle Eocene (Fig. 2).
CORRELATION WITH PALYNOMORPHIC SUCCESSIONS
Using the correlations in Figure 2, Figure 4 shows some coals, floras and floral events in southern Australia. Not surprisingly, in view of the suggested gap in the demonstrated stratigraphic record, this pattern, too, is strongly bimodal.
There are two spore/pollen zonal successions and two dinocyst zonal successions in southern Australia (Harris 1971, 1985; Stover & Evans 1973; Stover & Partridge 1973; Partridge 1976). The first comprehensive attempt to relate palynomorphic successions to planktonic foraminiferal biostratigraphy, and thence to the global scales, was that of McGowran et al (1971); all of the works cited above have contributed to that necessary exercise. The pervasive use of palynobiostratigraphy in the more soundly-based studies in petroleum geology (e.g. several papers in Glenie 1986) is reason enough to continue the exercise.
Two major organic facies have been recognised in southeastern Australia (e.g. Smith 1986): the Lower Eastern View Facies (Cretaceous to Early Eocene); and the Upper Eastern View Facies (late Early Eocene to Late Eocene) with the boundary fairly sharply marked through the Bass, Gippsland and Otway Basins, irrespective of sedimentary facies, within the Malvacipollis diversus Zone. The boundary is also near an horizon of major microfloral change documented by
90
B. McGowran
Harris (1971) (now amplified by the correlation of the Burrungule ingression suggested here), and at or near the maximum evolutionary overturn in angiosperms (speciations and extinctions) demonstrated by Truswell (1987) using the microfloral - biostratigraphic record for the Gippsland Basin.
The Sedan coal at the western margin of the Murray Basin is of the same age as the upper Clinton coal (W.K. Harris, pers. comm.).
The Kingston Coal in the Gambier Embayment was correlated with sediments of the Proteacidites confragosus Zone (Wood 1981) which, Wood could show, could be split into two subzones. However, with more knowledge of the assemblages than was available to Wood for his comparisons, it seems that the Kingston Coal might be correlated with the North Maslin Sand in the St. Vincent Basin (W.K. Harris, pers. comm.) which makes it coeval with the Anglesea Coal, assigned to the lower Nothofagidites asperus Zone or alternatively to the Proteacidites pachypolus Zone (Christophel et al 1987). High numbers of Nothofagidites spp. characterise the Anglesea Coal assemblages, whereas Wood emphasised the low numbers in the Kingston Coal, thus supporting its placement below the level of dramatic increase in Nothofagus pollens between the P. asperopolus and lower N. asperus Zones (Partridge 1976). Such problems of biofacies and biostratigraphy are exacerbated by the gap in the calibration of the local Eocene stratigraphic record.
A locally observed stratigraphic phenomenon will have a local explanation - but that explanation often will be incomplete if the possibility of a more wide ranging, even global, component is ignored, and the question becomes, how much is autocyclic, how much is allocyclic? The Chinaman Gully regression (Figs. 3 and 5) can serve as an example of contrasting perceptions. Lindsay (1981, 1985), who has studied the relevant stratigraphy in the St. Vincent Basin in detail, sees a very sharp regressive pulse, with deep scouring of the underlying Blanche Point Formation and a rapid and short-lived but highly influential influx of detrital sediment. McGowran (1978b), having claimed to recognise the regression in the Otway Basin as well, was impressed by evidence for major evolutionary and palaeoceanographic change at that time and suggests that it is an integral component of the 'Terminal Eocene Event' (McGowran & Beecroft 1986b; McGowran 1987).
The coals of the Clinton Formation in the northern St. Vincent Basin are correlated partly with the Blanche Point Formation (i.e. Tuketja transgression) and partly with the Chinaman Gully Formation and possibly the Aldinga Member (i.e. Aldinga transgression) (Meakin 1985). Meakin identified in the lower coals a pronounced short-lived warm spike based on the predominance of 'warm-loving' Haloragacidites harrisii over 'cool-loving' Nothofagidites and correlated it with the Tuketja transgression (cf. the Hantkenina interval), but without ruling out the possibility of correlation with the Tortachilla transgression, which is the age of the floras in clay lenses at Anglesea (Christophel et al 1987).
ALLOCYCLIC SIGNALS AND SOUTHERN AUSTRALIAN RECORD
The marine ingressions and transgressions are put in a wider geohistorical context in Figure 5. The six ingressions are bracketed neatly by the sharp series of sea level fluctuations from Zone P3-P4 to Zone P9-P10. The Exxon sea level curve (Haq et al 1987) shows a rise peaking in the Early Eocene at Zone P7, consistent with the relatively good planktonic foraminiferal faunas of the Rivernook and Princetown ingressions. The strong channelling within the Latrobe Group in the Gippsland Basin (channelling 1-3, Fig. 4) is consistent with falls in sea level at the respective horizons (Fig. 5). The Marlin Channel, in particular, cuts through sediments of the Proteacidites asperopolus Zone and is most likely part of the major global Zone P9 fall in sea level, as concluded by Marshall and Partridge (1988)
Planktonic and foraminiferal biostratigraphy
even though they emphasise the lack of biostratigraphic control in the Middle Eocene, suggesting that initiation of the Marlin Channel could tie to any of the sequence boundaries up to within the equivalents of Zone PI2. The Exxon sea level curve shows a fall from the Early to the Middle Eocene, consistent with the absence of positively identified sediment of Lutetian age in southern Australia, whereas the oceanic carbonate record on the Naturaliste Plateau spans that gap, possibly as a shelf/basin carbonate fractionation effect (McGowran 1978a). Nor is the Wilson Bluff transgression highlighted by the Exxon curve, which is unexpected since it is part of the Indo-Pacific Khirthar transgression. If we adhere to correlations discussed above, then the Chinaman Gully regression is at a small sea level fall, not the larger one at the P17/P18 boundary. On the other hand, the Tortachilla/Tuketja regression is clearly signalled within Zone PI5. There is some evidence for matching with a plate tectonic scenario for the general region of the (present) Indo-Australian plate (McGowran 1989). The narrow interval spanning Anomaly 24 at 55-56 Ma (on this calibration) is the time of spreading termination in the Tasman and Coral Seas and of India/ Asian collision, as well as of events further afield. The even narrower interval of Anomaly 19 (c. 44 Ma) marks a sharp increase in the rate of Australia/Antarctica separation (Cande & Mutter 1982) and rejuvenation of sea floor spreading in the Indian Ocean. Hence, a tectonic division is suggested here, into: Stage I (the 'old' regime, in this context); Stage II ('interregnum', global plate reorganisation); and Stage III ('new' spreading regime). The global tectono-historical boundary between the Laramide and Himalayan global tectonic regimes (Ziegler et al 1985) falls at the Stage II/Stage III boundary (or, more broadly, could be taken to encompass Stage II). The Stage I/Stage II boundary falls within the Malvacipollis diversus Zone (Fig. 2). This is the time of intra-Latrobe Group structural
91
development in the Gippsland Basin, where the youngest truncation is dated as lower M. diversus Zone (Brown 1986). Although the Wilson Bluff transgression does not loom large on the Exxon sea level curve (Fig. 5), it is part of the Khirthar Transgression, a major stratigraphic event in the Indo-Pacific region (Nagappa 1959; McGowran 1977). Its conjunction with the Stage II/Stage III boundary is almost too good to be true as an example of a tectono-eustatic transgression (McGowran 1989). This is probably the level - and the trigger - for the Gurnard Formation in the Gippsland Basin. It is also the time of birth of the St. Vincent Basin and of pronounced rapid subsidence in the Great Australian Bight Basin, where the Jerboa No. 1 section passes from inner neritic to bathyal facies within Zone P14. Shackleton (1986) has presented a composite set of oxygen and carbon isotopic curves for the early Tertiary, distinguished by their rigorous correlation with the geomagnetic time scale. Several events in the carbon curve are shown in Figure 5, such as the well-known shift in S13C at the Cretaceous/Tertiary boundary, and the flanks of the great 513C positive excursion of the Late Paleocene. Shackleton points out the rapidity with which 513C increases at the Zone P2/P3 boundary and decreases in Zone P6b after maximum values in Zone P4/P5. That spike signals a major depletion of S12C in the ocean-atmosphere system, but not obviously by sequestering into black muds, as in the 'Hanoxic events' of the Cretaceous, and it is likely that the coals and carbon-rich sediments found offshore in southern Australia (Glenie 1986) are but part of a global episode of enhanced production and enhanced preservation of peat-forming material at higher palaeolatitudes. Presumably the termination of the spike was caused by the wholesale return of light carbon to the system. Future enlightenment in such problems might begin with the remarkable confluence, within a narrow interval of time (Figs. 4 and 5), of: the Stage I/Stage II tectonic boundary end of 513C positive excur-
92
B. McGowran
sion; maximum evolutionary overturn in terrestrial angiosperms; and pronounced interbasinal change in organic sedimentary facies. As noted by Shackleton (1986) and shown in Figure 5, the first pronounced cooling based on the oxygen isotopic shift at 49.5 Ma (on this calibration) is two million years or more after the major lowering of sea level in Zone P9. It is presumably the time of major evolutionary radiation and expansion of Nothofagus (Partridge 1976), as it is of predicted (McGowran 1978a) and possibly confirmed (Birkenmajer et al 1986) glaciation in Antarctica during the Eocene, but this horizon is within the unlit gap in the southern Australia record. Smith (1986) relates the organic facies change in the Eastern View to this change, but there are two problems with that: the suggested control is some 6-7 Ma too late (compare Figs. 4 and 5); and there is a substantial climatic restoration at the time of the Khirthar Transgression. Seen in several palaeoclimatic parameters but not clearly in modern oxygen isotopic profiles from the open ocean, that restoration is an unresolved problem (McGowran 1989). However, lows in the oceanic benthic profile (Shackleton 1986) correlate neatly with the times between the later Eocene transgressions (McGowran 1987), giving some support to the hypothesis that marine transgression is linked to global warming (as the surface/volume ratio of the global ocean is increased). ACKNOWLEDGEMENTS Samples have been prepared with his customary skill and patience by Brent Bowman. The work has benefitted from extensive research assistance by Amanda Beecroft. Sophia Tsemitsidis prepared the typescript and the figures were drafted by Fleur de Laine. Most of the new foraminiferal data comes from samples recovered during the Rig Seismic BMR Cruise 66 (also known as Southern Margin II) in 1986. I am indebted
to the Chief Scientist, Hugh Davies, and his scientific team and crew for this opportunity. Wayne Harris discussed problems of palyno-stratigraphy and provided opinions on correlations based on unpublished evidence. The manuscript benefitted from criticism by Pat Quilty and an anonymous referee. Alan Partridge and Esso Australia Ltd. kindly provided access to sidewall cores from the Eocene oceanic carbonate section in Jerboa No. 1. Research was supported by Australian Research Grants Scheme Award No. E8015093.
REFERENCES BACKMAN J. 1987. Quantitative calcareous nannofossil biochronology of Middle Eocene through Early Oligocene sediment from DSDP Sites 522 and 523. Abhandlungen der Jeologischen Bundesanstalt 39, 21-32. BECKMANN J.P. 1957. Chiloguembelina Loeblich and Tappan and related foraminifera from the Lower Tertiary of Trinidad, B.W.I. Bulletin United States National Museum 215, 83-95. BERGGREN W.A. 1977. Atlas of Paleogene planktonic foraminifera. Some species of the genera Subbotina, Planorotolites, Morozovella, Acarinina and Truncorotaloides. In Ramsay A.T.S. ed. Oceanic Micropalaeontology, pp. 205-299. Academic Press, London. BERGGREN W.A., KENT D.V. & FLYNN J.J. 1985. Jurassic to Palaeogene: Part II. Palaeogene geochronology and chronostratigraphy. In Snelling N.J. ed. Geochronology and the Geological Record. The Geological Society, Memoir 10, 141-145. BIRKENMAJER K., DELITALA M.C., NAREBSKI W., NICOLETTI H. & PETRUCCIAN C. 1986. Geochronology of Tertiary island-arc volcanics and glacigenic deposits, King George Island, South Shetland Islands (West Antarctica). Bulletin of the Polish Academy of Sciences, Earth Sciences 34, 257-272. BLOW W.H. 1979. The Cainozoic Globigerinida. E.J. Brill, Leide. BOERSMA A., PREMOLI SILVA I. & SHACKLETON N.J. 1987. Atlantic Eocene planktonic foraminiferal paleohydrographic indicators and stable isotopic paleoceanography. Paleoceanography 2, 285-331.
Planktonic and foraminiferal biostratigraphy BOLLI H.M. & SAUNDERS J.B. 1985. Oligocene to Holocene low latitude planktonic foraminifera. In Bolli H.M., Saunders J.B. & Perch-Nielsen K. eds. Plankton Stratigraphy, pp. 155-262. Cambridge University Press, Cambridge. BROWN B.R. 1986. Offshore Gippsland Silver Jubilee. In Glenie R.C. ed. Second South-Eastern Australia Oil Exploration Symposium, pp.29-56. Petroleum Exploration Society of Australia Symposium, Melbourne, 1985. CANDE S.C. & MUTTER J.C. 1982. A revised identification of the oldest seafloor spreading anomalies between Australia and Antarctica. Earth and Planetary Science Letters 58, 151-160. CHRISTOPHEL D., HARRIS W.K. & SYBER A.K. 1987. The Eocene flora of the Angelsea locality, Victoria. Alcheringa 11, 303-323. DAVIES H.L., CLARKE J.D.A., STAGG H.M.J., SHAFIK S., McGOWRAN B., ALLEY N.F. & WILLCOX J.B. 1989. Maastrichtian and younger sediments from the Great Australian Bight, Australia. Bureau of Mineral Resources, Geology and Geophysics, Report 288. DEIGHTON I., FALVEY D.A. & TAYLOR D.J. 1976. Depositional environments and geotectonic framework: southern Australian continental margin. Journal of the Australian Petroleum Exploration Association 16, 25-36. FALVEY D.A. & MUTTER J.C. 1981. Regional plate tectonics and the evolution of Australia's passive continental margins. Bureau of Mineral Resources Journal of Australian Geology and Geophysics 6, 1-29. FRAKES L.A. & 21 CO-AUTHORS 1987. Australian Cretaceous shorelines, stage by stage. Palaeogeography, Palaeoclimatology, Palaeoecology 59, 31-48. GLAESSNER M.F. 1951. Three foraminiferal zones in the Tertiary of Australia. Geological Magazine 88, 273-283. GLENIE R.C. ed. 1986. Second South-Eastern Australia Oil Exploration Symposium. Petroleum Exploration Society of Australia Symposium, Melbourne, 1985. HAQ B.U., HARDENBOL J. & VAIL P.R. 1987. Chronology of fluctuating sea levels since the Triassic. Science 235, 1156-1167. HARRIS W.K. 1971. Tertiary stratigraphic palynology, Otway Basin. In Wopfner H. & Douglas J.G. eds. The Otway Basin of Southeastern Australia, pp. 67-87. Special Bulletin, Geological Surveys South Australia and Victoria.
93
HARRIS W.K. 1985. Middle to Late Eocene depositional cycles and dinoflagellate zones in southern Australia. In Lindsay J.M. ed. Stratigraphy, Palaeontology and Malacology: Essays in honour of N.H. Ludbrook, pp. 133-144. Special Publication, South Australian Department of Mines and Energy 5. HOLDGATE G.R., MACKAY G.H. & SMITH G.C. 1986. The Portland Trough, Otway Basin geology and petroleum potential. In Glenie R.C. ed. Second South-Eastern Australia Oil Exploration Petroleum Exploration Society of Australia Symposium, pp. 219-232. Melbourne, 1985. JENKINS D.G. 1971. New Zealand Cainozoic planktonic foraminifera. New Zealand Geological Survey Palaeontological Bulletin 42, 1-278. JENKINS D.G. 1986. Globorotalia insolita: an important Eocene/Oligocene boundary marker in the Pacific. Geological Society of New Zealand Newsletter 74, 75-76. KELLER G. 1986. Stepwise mass extinctions and impact events: Late Eocene to Early Oligocene. Marine Micropalaeontology 10, 267-294. LINDSAY J.M. 1981. Tertiary stratigraphy and foraminifera of the Adelaide City area, St. Vincent Basin, South Australia. M.Sc. Thesis, 2 volumes, University of Adelaide (unpublished). LINDSAY J.M. 1985. Aspects of South Australian Tertiary foraminiferal biostratigraphy, with emphasis on studies of Massilina and Subbotina. In Lindsay J.M. ed. Stratigraphy, Palaeontology and Malacology: Papers in Honour of N.H. Ludbrook, pp. 187-231. Special Publication, South Australian Department of Mines and Energy 5. LINDSAY J.M. & McGOWRAN B. 1986. Eocene/-01igocene boundary, Adelaide region, South Australia. In Pomerol C. & Premoli Silva I. eds. Geological Events at the Eocene-Oligocene Boundary, pp. 165-173. Elsevier Science Publishers, Amsterdam. LUDBROOK N.H. 1977. Early Tertiary Cyclammina and Haplophragmoides (Foraminiferida: Lituolidae) in southern Australia. Transactions Royal Society South Australia 101, 165-198. LUDBROOK N.H. & LINDSAY J.M. 1969. Tertiary foraminifera zones in South Australia. In Bronnimann P. & Renz H.H. eds. Proceedings of the First International Conference on Planktonic Microfossils, Geneva 1967, Vol. II, 366-374. MARSHALL N.G. & PARTRIDGE A.D. 1988. The Eocene arcitarch Tritonites gen. no v. and the age of the Marlin Channel, Gippsland Basin, southeastern Australia. Memoirs Association Australasian Palaeontologists 5, 239-257.
94
B. McGowran
McGOWRAN B. 1965. Two Paleocene foraminiferal faunas from the Wangerrip Group, Pebble Point coastal section, western Victoria. Proceedings Royal Society Victoria 79, 9-74. McGOWRAN B. 1968. Reclassification of early Tertiary Globorotalia. Micropaleontology 14, 179-198. McGOWRAN B. 1970. Late Paleocene in the Otway Basin: biostratigraphy and age of key microfaunas. Transactions Royal Society of South Australia 94, 1-14. McGOWRAN B. 1977. Maastrichtian to Eocene foraminiferal assemblages in the northern and eastern Indian Ocean region: correlations and historical patterns. In Heirtzler J.R. et al eds. Indian Ocean Geology and Biostratigraphy: Studies following Deep Sea Drilling Legs 22-29, pp. 417-458. American Geophysical Union, Washington, D.C.
Late Eocene, South Australia. Palaeogeography, Palaeoclimatology, Palaeoecology 52, 321-345. McGOWRAN B. & BEECROFT A. 1986b. Neritic, southern extratropical foraminifera and the Terminal Eocene Event. Palaeogeography, Palaeoclimatology, Palaeoecology 55, 23-34. McGOWRAN B. & LINDSAY J.M. 1969. A Middle Eocene planktonic foraminiferal assemblage from the Eucla Basin. Quarterly Geological Notes Geological Survey South Australia 30, 2-10. McGOWRAN B., LINSDAY J.M. & HARRIS W.K. 1971. Attempted reconciliation of Tertiary biostratigraphic systems, Otway Basin. In Wopfner H. & Douglas J.G. eds. The Otway Basin of Southeastern Australia, pp. 273-281. Special Bulletin, Geological Surveys South Australia and Victoria.
McGOWRAN B. 1978a. Stratigraphic record of Early Tertiary oceanic and continental events in the Indian Ocean region. Marine Geology 26, 1-39.
MEAKIN S. 1985. Palynological analysis of the Clinton Coal Measures, northern St. Vincent Basin, South Australia. Honours Thesis, University of Adelaide (unpublished).
McGOWRAN B. 1978b. Early Tertiary foraminiferal biostratigraphy in southern Australia: a progress report. In Belford D.J. & Scheibnerova V. compilers The Crespin Volume: Essays in Honour of Irene Crespin. Bulletin Bureau of Mineral Resources Geology & Geophysics Australia 192, 83-95.
NAGAPPA Y. 1959. Foraminiferal biostratigraphy of the Cretaceous-Eocene succession in the IndiaPakistan-Burma region. Micropaleontology 5, 145-192. PARTRIDGE A. 1976. The geological expression of eustacy in the early Tertiary of the Gippsland Basin. The APEA Journal 1976, 73-79.
McGOWRAN B. 1979. The Tertiary of Australia: foraminiferal overview. Marine Micropaleontology 4, 235-264.
POMEROL C. & PREMOLI SILVA I. 1986. The Eocene-Oligocene transition: events and boundary. In Pomerol C. & Premoli Silva I. eds. Terminal Eocene Events, pp. 1-24. Elsevier, Amsterdam.
McGOWRAN B. 1986a. Cainozoic oceanic events: the Indo-Pacific biostratigraphic record. Palaeogeography, Palaeoclimatology, Palaeoecology 55, 247-265. McGOWRAN B. 1986b. Beyond classical biostratigraphy. Petroleum Exploration Society of Australia Journal 9, 29-41. McGOWRAN B. 1987. Late Eocene perturbations: foraminiferal biofacies and evolutionary overturn, southern Australia. Paleoceanography 2, 715-727. McGOWRAN B. 1989. The later Eocene transgressions in southern Australia. Alcheringa 13, 45-68. McGOWRAN B. & BEECROFT A. 1985. Guembelitria in the Early Tertiary of southern Australia and its palaeoceanographic significance. In Lindsay J.M. ed. Stratigraphy, Palaeontology and Malacology: Essays in Honour ofN.H. Ludbrook. Special Publication, South Australian Department of Mines and Energy 5, 247-261. McGOWRAN B. & BEECROFT A. 1986a. Foraminiferal biofacies in a silica-rich neritic sediment,
QUILTY P.G. 1978. The Late Cretaceous-Tertiary section in Challenger No. 1 (Perth Basin): details and implications. In Belford D.J. & Scheibnerova V. compilers The Crespin Volume: Essays in Honour of Irene Crespin. Bulletin Bureau of Mineral Resources Geology and Geophysics Australia 192, 109-135. SHACKLETON N.J. 1986. Paleogene stable isotope events. In Shackleton N. J. ed. Boundaries and Events in the Paleogene. Paleogeography, Palaeoclimatology, Palaeoecology 57 (1-2), 91-102. SHAFIK S. 1981. Nannofossil biostratigraphy of the Hantkenina (foraminiferid) interval in the Upper Eocene of southern Australia. Bureau of Mineral Resources Journal of Australian Geology and Geophysics 6, 108-116. SMITH G.C. 1986. Bass Basin geology and petroleum exploration. In Glenie R.C. ed. Second SouthEastern Australia Oil Exploration Symposium, pp. 257-284. Petroleum Exploration Society of Australia Symposium, Melbourne, 1985.
Planktonic and foraminiferal biostratigraphy STEININGER F. 1977. Integrated assemblagezone biostratigraphy at marine-nonmarine boundaries: example from the Neogene of central Europe. In Kauffman E.G. & Hazel J.E. eds. Concepts and Methods of Biostratigraphy, pp. 235-256. Dowdon, Hutchinson and Ross, Stroudsberg. STOVER L.E. & EVANS P.R. 1973. Upper Cretaceous - Eocene spore-pollen zonation, offshore Gippsland Basin, Australia. Special Publication, Geological Society Australia 4, 55-72. STOVER L.E. & PARTRIDGE A.D. 1973. Tertiary and Late Cretaceous spores and pollen from the Gippsland Basin, southeastern Australia. Proceedings Royal Society Victoria 85, 237-286. THOMPSON B.R. 1986. The Gippsland Basin development and stratigraphy. In Glenie R.C. ed. Second South-Eastern Australia Oil Exploration Symposium, pp. 57-64. Petroleum Exploration Society of Australia Symposium, Melbourne, 1985. TOUMARKINE M. & LUTERBACHER H. 1985. Paleocene and Eocene planktonic foraminifera. In Bolli H.M., Saunders J.B. & Perch-Nielsen K. eds.
95
Plankton Stratigraphy, pp.87-154. Cambridge University Press, Cambridge. TRUSWELL E.M. 1987. The initial radiation and rise to dominance of the angiosperms. In Campbell K.S.W. & Day M.F. eds. Rates of Evolution, pp. 101-128. Allen and Unwin, London. VAIL P.R., MITCHUM R.M. & THOMPSON S. 1977. Seismic stratigraphy and global changes of sea level. In Payton C.E. ed. Seismic Stratigraphy - Applications to Hydrocarbon Exploration, pp. 83-97. American Association of Petroleum Geologists Memoir 26. WOOD G. 1981. Palynological analysis of Eocene coals in the Gambier Embayment near Kingston. Honours Thesis, University of Adelaide (unpublished). ZIEGLER A.M, ROWLEY D.B., LOTTES A.L., SAHAGIAN D.L., HULVER M.L. & GIERLOWSKI T.C. 1985. Paleogeographic interpretation: with an example from the mid-Cretaceous. Annual Review Earth Planetary Sciences 13, 385-425.
APPENDIX: FORAMINIFERAL BIOSTRATIGRAPHY OF DREDGED SAMPLES, RIG SEISMIC CRUISE 11, EASTERN GREAT AUSTRALIAN BIGHT
Samples add to the biostratigraphic record in two ways: they fill in some of the gaps in the record; and they provide offshore equivalents of the biofacies onshore. The main problems encountered repeatedly in analysing samples dredged from the continental margin concern microfaunal mixing. There is 'downward' contamination not only by the Quaternary that blankets the region but, in some instances, at times during the pre-Quaternary past. A second effect is extensive 'upward' reworking: Maastrichtian species are seen at several Eocene and younger horizons, and Eocene, Oligocene and Miocene species are recycled into the Pliocene and probably the Quaternary. In a mixture of e.g. Maastrichtian and Miocene species, which is the 'correct' age of the sample itself? Data on the samples discussed here are summarised in Table 2.
Ceduna Ingression The best preserved and most diverse assemblage (sample DR03A) includes a fairly diverse array of benthic species and a swarm of high-conical radiolarians together with these planktonics: Rugoglobigerina rugosa, (including highspired forms and others approaching R. hexacamerata), Rugotruncana subpennyi, Rugotruncana aff. circumnodifer, Globotruncanella havanensis/-petaloidea, cf. Globtruncanella intermedia (doubtful), Globotruncana of the arca/linneiana group, Globigerinelloides prairiehillensis/multispinatus and variants, Globigerinelloides subcarinata, Guembelitria (?triseriata not cretacea), Hetero-helix globulosa, Heterohelix glabrans, Gublerina reniformis, Pseudoguembelina excolata.
96
B. McGowran
Table 2: Data on Selected Samples Dredged on Rig Seismic Southern Margin Cruise 11 (BMR Survey 66). Sample Number
Latitude/Longitude
Water Depth
Lithology
Age
DR03A
33 °58.0 'S/128 °36.4 'E
3530m
dark brown mudstone
Maastrichtian: 'Ceduna ingression'
DR01L
close to DR03
3300 m
brown siltstone
Maastrichtian: 'Ceduna ingression'
DR14F
35°58.3 'S/135°13.6 'E
3320 m
dark, calcareous, glauconitic mudstone
Early Eocene, identified as 'Princetown ingression'
DR08A
35°58.3'S/134°26.0'E
2740 m
yellow-brown mudstone and sandstone
Early Eocene, identified as 'Princetown ingression'
DR01E/F
close to DR03
3300 m
silty glauconitic sandstone
late Middle Eocene 'Wilson Bluff transgression'
DR08B
35°40.6'S/134°26.0'E
2740 m
calcareous mudstone
late Middle Eocene
DR10A
36 °00.0'S/135 °00.0'E
3670 m
glauconitic limestone
late Middle Eocene
DR14A
35°58.3 'S/135°13.6 'E
3320 m
limestone with sponge spicules
late Middle Eocene (in part), latest Eocene (in part)
DR15B
36 °20.0'S/135 °40.0 'E
3410 m
brown calcareous siltstone
late Middle Eocene
DR12A, 12B, 12C
35°58.3 'S/135 °05.7 'E
3660 m
fine grained limestone
Early Oligocene (in part), Late Eocene (in part)
DR14D
35°58.3'S/135°13.6'E
3320 m
laminated grey limestone
Late Eocene
DR06A
35°34.1'S/132°54.7'E
2620-2000 m
white chalk with sponge spicules
Early Oligocene
Sample DR01L has a well-preserved though less diverse assemblage. Others in the DR01 series have the more common elements (especially Globigerinelloides, Rugoglobigerina and Hete-rohelix) as well as the radiolarian swarm and similar benthos, but are less well-preserved. Princetown Ingression Planktonic assemblage'in sample DR14F: Pseudohastigerina wilcoxensis (mostly asymmetrical pseudoiota form), Planorotalites australiformis, Planorotalites pseudoscitula, Planorotalites cf. imitata, 'Turborotalia' sp., Acarinina nitida, Acarinina collactea, Subbotina spp. including S. patagonica and S. cf. linaperta, Chiloguembelina wilcoxensis. Burrungule Ingression Planktonic assemblage in sample DR08A:
Pseudohastigerina wilcoxensis (pseudoiota form), Planorotalites australiformis, Planorotalites pseudoscitula, Acarinina coalingensis, Acarinina collactea, Acarinina cf. densa, Acarinina solda-doensis, Acarinina sp. cf. 'pre-quetra', Subbotinapatagonica, Subbotina cf. eocaena, 'Turborotalia9 sp. This sample is more similar in biofacies and lithofacies to the offshore equivalents of the Wilson Bluff Limestone than to the known Maastrichtian - Early Eocene marine ingressions in southern Australia - a noteworthy point, because we have no record of strongly calcareous sediments below the Wilson Bluff transgression in the later Middle Eocene. Sample DR08A has been in the category of 4 suspect' in terms of faunal mixing for most of the duration of the Cruise 11 study, but the above lot is believed tentatively to be 'pure'. The main observation of biostratigraphic significance is the absence of Acarinina
Planktonic and foraminiferal biostratigraphy primitiva from a relatively rich assemblage (thus, negative evidence seems to be acceptable). The most striking aspect otherwise is the Turborotalia group which may well foreshadow the Middle Eocene 'Turborotalia9 griffinae/wilsonae - 'Hastigerina9 bolivariana group (Toumarkine & Luterbacher 1985). Late Middle Eocene: Offshore Equivalents of Wilson Bluff Limestone Poorly preserved assemblages of basal Wilson Bluff aspect (cf. McGowran & Lindsay 1969), approximately equivalent to Zones upper P12-P13, are found in calcareous sediments with milky sponge spicules (i.e. opal-A probably transformed to opal-CT) and radiolarians or glauconitic moulds probably of radiolarians. With the exception of sample DR08A (above) there is no evidence at all of Wilson Bluff Limestone facies older than upper Zone P12 - that is, for a simple model of diachronous transgression across the continental margin. On the other hand, several samples were recovered which can be correlated approximately with Zone P13-P14. Samples with bathyal benthic species include the following generalised planktonic assemblage: Globigerinatheka index, Subbotina linaperta, Chiloguembelina cubensis, Globorotaloides a f f . suteri, Acarinina primitiva, Acarinina densa s.l., Acarinina collactea, with variations among samples in the presence of: Pseudohastigerina micra, Planorotalites pseudoscitula, Tenuitella aculeata, Tenuitella gemma, Tenuitella insolita, Guembelitria triseriata. These variations are attributed to instabilities in a stratified ocean within the equivalent of Zone P14, foreshadowing the stratified ocean of the Late Eocene (Boersma et al 1987; McGowran 1987). However, the following may be an approximate succession in the later Middle Eocene (in descending order): iii) Samples DR15B, DR14A
97
Turborotalia increbescens groups, Tenuitella insolita, Cassigerinella winniana, Guembelitria triseriata (if not Oligocene contaminants). ii) Sample DR08B Planorotalites pseudoscitula, Tenuitella aculeata, Morozovella a f f . crassata, acarininids (more morphological variation than above), Pseudohastigerina micra. i) Sample DR01E/F Subotina aff front osa, Hantkenina sp., Planorotalites pseudoscitula. Sample is correlated with the relatively good assemblages in glauconitic marls at the base of the Wilson Bluff Limestone (McGowran & Lindsay 1969). Higher assemblages in the Wilson Bluff are usually poorly preserved in a cherty, indurated calcareous sediment. Thus the later Middle Eocene samples are a significant addition and will be described in more detail elsewhere. Late Eocene Sample GCOIA: Large, thickly encrusted Globigerinatheka index and G. subconglobata luterbacheri, probably equivalent to upper Zone P15. Sample DR12A(5): Globigerinatheka index, Globorotaloides suteri/testarugosa, Subbotina linaperta, 'Globigerina' brevis, Chiloguembelina cubensis, Tenuitella insolita, Tenuitella gemma. This assemblage is correlated with upper Zone PI6. Samples DR12A(4) and DR14D are less well-preserved but are of about the same age. Latest Eocene to Earliest Oligocene This material differs from the Late Eocene (with Globigerinatheka index) in being much better preserved, indicating that the wellknown plunge in the oceanic calcite compensation depth and in the lysocline from the Late Eocene to the Early Oligocene has been influential, and in having (common to extremely abundant) sponge spicules and radiolarians of
98
B. McGowran
clear and pristine condition (opal-A), whereas older carbonates have milky sponge spicules (opal-CT), except where there is reason to suspect contamination. The presence of abundant biosilica in association with the benthic foraminifer Bolivina in high numbers indicates high organic productivity. Samples with well-preserved assemblages of planktonic foraminifera may be grouped biostratigraphically in an inferred chronological succession, as follows (in descending order): iv) Subbotina angiporoides, Catapsydrax dissimilis, Chiloguembelina cubensis, Globorotaloides testarugosa, Tenuitella gemma, and others: approximately equivalent to Zone PI8, Early Oligocene. This assemblage is found in samples DR06A(l)-(6). iii) Subbotina angiporoides, "Globigerina" brevis (prominent), Chiloguembelina cubensis, Globorotaloides testarugosa, and others: approximately equivalent to Zone PI8, Early Oligocene, as in samples DR12A(l)-(3). ii) Subbotina angiporoides, Subbotina a f f . linaperta, Tenuitella aculeata, Tenuitella
gemma/munda: correlated approximately with Zone P17/P18 boundary, close to Eocene/Oligocene boundary, as in samples DR12B, 12C. This horizon with abundant Tenuitella aculeata may be the same as an horizon at Castle Cove, Aire District (McGowran 1978b) and in the St. Vincent Basin (Lindsay & McGowran 1986), each containing the highest known occurrence of the species. i) Subbotina linaperta, S. angiporoides, Tenuitella aculeata, T. gemma/munda, Turborotalia increbescens/ampliapertura, Guembelitria triseriata, as in samples DR14A(l)-(3), correlated with Zone P17, latest Eocene. Horizon (i) is placed below Horizon (ii) because it has a more convincing array of Subbotina linaperta (see Lindsay 1985), but in that case common Guembelitria triseriata occur distinctly below abundant Tenuitella aculeata - an addition to the neritic record (cf. Lindsay & McGowran 1986, Fig. 6). Horizon (i) is correlated with the sediments of the Aldinga transgression.
Early Tertiary vegetation and climates, Lake Eyre region, northeastern South Australia I.R.K. SLUITER Quantitative pollen analysis of Early Tertiary Eyre Formation samples taken from two cores located in the Lake Eyre region of northeastern South Australia was undertaken with the primary aim of elucidating the vegetation communities and palaeoclimates through the recorded period. Vegetation from the Late Palaeocene to earliest Early Eocene was characterised by Cunoniaceae-dominated simple closed forests which probably contained a significant coniferous component. A major change to Myrtaceae-dominated complex notophyll vine forest occurred in the Early Eocene. The Middle Eocene was again characterised by simple closed forests, although these contained for the first time in the Early Tertiary vegetation record a significant presence of Nothofagus 'brassii\ Also present for the first time was a non-woody swamp vegetation community containing taxa from the families Cyperaceae, Restionaceae/Centrolepidaceae and Sparganiaceae/Typhacea. From the climatic requirements of comparable modern communities and individual taxa it is suggested that annual mean temperatures and mean annual precipitation were about 18-19°C and greater than 1400 mm respectively for the Late Palaeocene to earliest Early Eocene; slightly higher levels for both indices in the Early Eocene; and 17-18 °C and at least 1500 mm for the Middle Eocene. A comparison of Late Palaeocene, Early Eocene and Middle Eocene vegetation from the Lake Eyre region and the Gippsland and Otway Basins indicates the existence of cooler conditions in the latter two southern sites during all three time periods with the gradient perhaps steepest in the Late Palaeocene. The results of the study may provide some support for the Early Tertiary atmospheric circulation model proposed by Kemp (1978). Key words: atmospheric circulation, Early Tertiary, Lake Eyre, palaeoclimates, palynology, vegetation communities.
*Present Address: Department of Conservation, Forests and Lands, Mildura, Victoria 3500, Australia. INTRODUCTION The earliest palynological study of northeastern South Australian Tertiary sediments was of selected samples from borehole Cootabarlow 2, located in the Frome Embayment (Cookson & Pike 1954) (Fig. 1). More detailed systematic studies were performed in the 1960s and 1970s by W.K. Harris whilst employed as a palynologist with the South Australian Department of Mines and Energy (Harris 1965, 1972; Wopfner et al 1974). The latter publication established the name Eyre Formation for those rocks of Early Tertiary age existing within the region. Further work on an Eyre Formation palynostratigraphy has recently been undertaken by Sluiter and Alley (in prep.). This paper adopts the new stratigraphic framework proposed in this
99
latter study, but concentrates on the palaeobotanical and palaeoclimatic aspects, as deduced from the quantitative pollen analysis of samples from two cores: BMR Muloorina 2 and BMR Peachawarinna 2, located in the Lake Eyre region (Fig. 1). The results of this study are compared with those derived from the studies of similar age sediments deposited within the Gippsland and Otway Basins, located on the southeastern margin of the continent. METHODS Pollen samples were taken from the two cores listed above drilled in the Lake Eyre region by the Bureau of Mineral Resources in 1983. The study is restricted to this region because of either a lack of drillholes or a lack of suitable sediments for quantitative pollen
100
I.R.K. Sluiter
Fig. 1 Locality map illustrating wells studied for palynology within the Birdsville Basin.
Vegetation and climates, Lake Eyre region
analysis within drillholes in the other Birdsville Basin depositional regions defined by Wopfner et al (1974). Small subsamples of between 10-20 cm were taken from a number of different lithologies through the Eyre Formation interval occurring in each well. Where some doubt arose as to whether the litho-stratigraphic designation given in the well completion report was correct, additional samples were taken from the overlying and/or underlying strata. Each sample collected was subjected to a standard series of inorganic/organic digestion procedures involving the following chemicals: HF, HCL, HN0 and KOH. Any remaining inorganic residue was removed by heavy liquid (ZnBr - specific gravity 2.0) separation, and large organic fragments (125fi) were removed by sieving. Residues were mounted in glycerine jelly and sealed with Glyceel sealing varnish. Where sufficient residue remained, a total of four slides were prepared, although in some cases pollen recovery was very low and only one or two slides were mounted. Where possible, 150 palynomorphs were counted from one prepared slide from each sample, and then the rest of the slide, along with the others prepared, were scanned for the presence of additional taxa. 3
3
2
THE POLLEN DATA The results of the pollen analyses are portrayed in tabular form for each well in Appendices 1 and 2. Values given are actual percentages for the pollen taxon recorded, whilst + indicates rare presence in the sample, but absence from the count of 150 grains. To facilitate vegetation reconstruction, the relative frequencies of the more important taxa, expressed according to their most likely botanical affinities, are graphically displayed in Figures 2 and 3. The relationship between names on these pollen diagrams and those in Appendices 1 and 2 is shown in Table 1.
101
Table 1 Relationships between taxa included on the pollen diagrams and in Appendices 1 and 2. Pollen diagram taxa Cunoniaceae (tricolpate) Cunoniaceae (dicolpate) Myrtaceae Proteaceae Nothofagus spp Casuarinaceae Australopollis obscurus Sparganiaceae/Typhaceae Cyperaceae Restionaceae/ Centrolepidaceae Cyatheaceae Araucariaceae Cupressaceae/Taxodiaceae Dacrydium (Group B) Lagarostrobos Podocarpus/Dacrydium Microcachrys
Appendices 1 and 2 taxa Cunoniaceae (tricolpate) Cunoniaceae (dicolpate) Myrtaceidites spp Porteacidites spp Nothofagidites spp Haloragacidites harisii Australopollis obscurus Sparganiaceaepollenites barungensis Cyperaceaepollis spp Milfordia homeopunctata Cyathidites spp Aracariacites australis Dilwynites spp Taxodiaceaepollenites hiatus Taxodiaceaepollenites hiatus Phyllocladidites mawsonii Posocarpidites ssp Microcachrydites antarcticus
RECONSTRUCTION OF VEGETATION AND PALAEOCLIMATES Over the past decade, a number of reviews of Australian Tertiary vegetation have been published (Kemp 1978; Martin 1978, 1982; Barlow 1981; Lange 1982). Most of the data on which these have been based have been derived from depositional basins situated near the coast and, even amongst these, there is an overwhelming bias towards the southeastern portion of the mainland. The only study specifically to review the palaeobotanical record of Central Australia was undertaken by Truswell and Harris (1982). In this publication the general paucity of information from the centre of the continent is alluded to, and the importance of establishing a biostratigraphic chronology for terrestrial central Australia is stressed. The detailing of the Eyre Formation palynostratigraphy by Sluiter and Alley (in prep.) will go some way to addressing the latter problem and will provide, for the first time, a framework within which inland Palaeogene vegetation and palaeoclimates can be discussed. For convenience, this section is divided into two parts, the first dealing with the Late Palaeocene to Early Eocene depositional phase, and the second with the Middle Eocene depositional phase.
102
I.R.K. Sluiter
Interpretation of the pollen data in vegetation terms and their palaeoclimatic implications relies heavily on comparisons with modern and late Quaternary pollen assemblages, derived from existing rainforested areas, and a knowledge of the ecology, distribution and environmental controls of major rainforest taxa and community types. Although the majority of taxa that comprised the Early Tertiary vegetation of central Australia are probably now extinct, the ecophysiological characteristics that control the broad climatic responses of the major components of the vegetation are unlikely to have changed greatly through time. Such assumptions are made by other Tertiary palaeontologists, and provide the background on which past climatic estimates can be made and tested against other lines of data (eg. the oceanic temperature records derived from the oxygen isotope analysis of foraminiferal and molluscan shells). The Late Palaeocene to Early Eocene The whole of this period is represented in the BMR Muloorina 2 core, but only the Early Eocene is recorded in the BMR Peachawarinna 2 core. The dominant feature of the Late Palaeocene depositional sequence (see Fig. 2, 41.3 m-34.0 m) is the overwhelming dominance (up to 67% of the pollen sum) of tricolpate Cunoniaceae. This is interesting as the family has not previously been recognised from Australian Palaeocene/Eocene palynological studies, although records do exist for the Oligocene-Miocene of the onshore Gippsland Basin (Kershaw & Sluiter 1982; Sluiter 1984) and northwestern Murray Basin (Truswell et al 1985), and the Oligocene of northeastern Tasmania (Hill & MacPhail 1983). At present, tricolpate members of the family include genera such as Pseudoweinmannia, Pullea, Caldcluvia and Vesselowskya, all of which are important canopy, subcanopy and riparian components of eastern Australian closed forests, and Weinmannia which occupies similar niches in New
Caledonia, New Guinea and New Zealand. The fossil pollen type is quite variable with the smaller specimens (13/i) most similar to Caldcluvia, and the larger specimens (13-18^) most similar to Weinmannia and Vesselowskya. Extant representatives of the less common Cunoniaceae (dicolpate) type include Ceratopetalum and Schizomeria. These have similar climatic ranges to genera producing tricolpate pollen. From modern pollen studies (Powell 1970; Kershaw 1973; Pocknall 1978), the family is considered to have extra-local to regional pollen dispersal, but to be under-represented in comparison to the abundance of parent plants within the vegetation. It is possible that the Early Tertiary dominance of the family may have occurred as a result of the paucity at the time of other regionally dispersed pollen types (excluding the conifers) such as Casuarinaceae and Nothofagus. This, combined with a lack of disturbance indicators such as Macaranga/Mallotus and Urticaceae/ Moraceae which contribute significantly to modern and Quaternary pollen spectra, would further serve to increase the relative importance of the Cunoniaceae. High percentages of tricolpate Cunoniaceae pollen (25-40%) have also been recorded from the Late Quaternary of northeast Queensland by Kershaw (1973, 1985). Their abundance there is taken to indicate an expansion of simple notophyll vine forests at the expense of 'drier' rainforest types such as Araucarian vine forest, in response to an increase in effective precipitation. The possibility, however, of a community type such as simple notophyll vine forest with a common coniferous component existing at certain times is not excluded (Kershaw 1985). Notably, conifers such as Cupressaceae/Taxodiaceae, Araucariaceae and Podocarpus/Dacrydium are important components of the Late Palaeocene vegetation of the Birdsville Basin, with angiosperms, apart from Myrtaceae and Proteaceae, poorly represented. A combination of abundant Cunoniaceae and common conifer and Myrtaceae representation may suggest the presence
Vegetation and climates, Lake Eyre region
103
Unknown Conifers Pteridophytes Angiosperms
Microcachrys
h i
1
i
•
I
•
Podocarpus / Dacrydium _i— Lagarostrobus —^ Dacrydium
I J
L_
_i
L
I I
Cupressaceae/Taxodiaceae Araucariaceae
Cyatheaceae
IE. Q
(Group B)
Australopollis obscurus Casuarinaceae
L
Nothofagus spp.
C E
I
.
,
i
i
E
i
,
I J
L
I
1
I
i i i
I
Proteaceae
_UJJ
Myrtaceae Cunoniaceae (dicolpate)
Mil
Cunoniaceae (tricolpate) Sample Locations Lithological Column Sample Depths Cretaceous
I
I
I
L
J
L
Age Depth (Below K. B.) (metres)
Fig. 2 Relative frequency percentage pollen diagram of major pollen taxa recorded from corehole BMR Muloorina 2.
104
I.R.K.
Sluiter
of both simple closed forests and coniferdominated closed forests, or simple closed forest community types containing conifers. From bioclimatic profiles constructed for extant notophyll closed forests (Nix 1984) and for modern and Late Quaternary pollen assemblages similar to those from the Eyre Basin (Kershaw & Nix 1988), it is proposed that annual mean temperatures during the Late Palaeocene were likely to have been about 18-19°C whilst precipitation would have exceeded 1400 mm per year. The depositional period Late Palaeocene to Early Eocene is again dominated by tricolpate Cunoniaceae, except in the middle of the sequence where there is an increase in the importance of Myrtaceae, Proteaceae and Podocarpus/Dacrydium. Other taxa, with the exception of Australopollis obscurus, whose botanical affinities are unknown, and Cunoniaceae (dicolpate), are poorly recorded. The composition of the vegetation is suggested to have been similar to that of the preceding Late Palaeocene sequence, although a major reduction in Cupressaceae/Taxodiaceae and Araucariaceae pollen is significant and could reflect a slight increase in rainfall. The Early Eocene depositional sequence witnesses a change from dominance by Cunoniaceae (tricolpate) to outright dominance by Myrtaceae. Cunoniaceae (tricolpate) are recorded commonly, with all other taxa recorded either rarely or as isolated, occasional peaks. This change is suggested to indicate a major expansion of more complex closed forest in response to an increase in mean annual temperature of perhaps 1-2°C and possibly also an increase in annual mean precipitation. The Middle Eocene The Middle Eocene depositional sequence is represented in Figure 3. The most important taxa are Myrtaceae, Nothofagus, Casuarinaceae and Restionaceae/Centrolepidaceae, while tricolpate Cunoniaceae are common. Other notable taxa with a rare
to fairly common presence include Proteaceae, Cunoniaceae (Dicolpate), Cyatheaceae, Dacrydium (Group B), Podocarpus/ Dacrydium, Sparganiaceae/Typhaceae and Cyperaceae. There is a single high value for Cupressaceae/Taxodiaceae. The most striking differences when compared to earlier depositional sequences are: a great reduction in the importance of the Cunoniaceae (tricolpate), Myrtaceae and conifers; a significant increase in the importance of both Nothofagus and Casuarinaceae; and the development of a major non-woody swamp vegetation type comprising members of the Restionaceae/ Centrolepidaceae, Sparganiaceae/Typhaceae and the Cyperaceae. The major change in the composition of the woody vegetation community types is interesting and deserves special attention. The increase in the importance of Nothofagus over the preceding depositional sequence is suggested to indicate the development of a new community type containing this genus as an important component, but with major representation also from the Myrtaceae and Cunoniaceae. Of lesser importance may have been taxa such as Quintinia, Sphenostemon and Winteraceae, all of which were present but were recorded in numbers too low to illustrate any trends on Figure 3. Similar assemblages make up simple closed forests at the present day in New Guinea and New Caledonia, and have been postulated to have existed also in the Late Oligocene in the Western Murray Basin (Truswell et al 1985) and the Early to Middle Miocene of the Latrobe Valley (Sluiter 1984). The moderate Nothofagus representation, and the minor presence of Quintinia and Sphenostemon, could imply a drop in mean annual temperatures from the Early Eocene. It is possible that the mean annual precipitation approximated that of the preceding depositional sequence, but was probably more evenly distributed throughout the year, reflecting a decrease in seasonality. Assessment of climatic data from sites where parent plants of Nothofagus 'brassii9 type presently grow
Vegetation and climates; Lake Eyre region
105
Unknown Conifers Pteridophytes Angiosperms C C c c
Microcachrys Podocarpus / Dacrydium Lagarostrobus Dacrydium (Group B) Cupressaceae/Taxodiaceae JL_ Araucariaceae j Cyatheaceae
C C L
i_L C
L
E
_
Restionaceae/CentroJepidaceae Cyperaceae Sparganiaceae/Typhaceae J
L
Australopollis
obscurus
Casuarinaceae
Nothofagus J_
spp.
P rote ace ae
Myrtaceae
Lithological Column 65.6
72.8 75.4
81.1 84.25
MIDDLE EOCENE
96.3 100.3
109.3 112.0
EARLY EOCENE
121.2
Sample Depths Age
Fig. 3 Relative frequency percentage pollen diagram of major pollen taxa recorded from corehole BMR Peachawarinna 2.
106
I.R.K. Sluiter
suggests a mean annual temperature preference of about 17-18 °C. Minimum conditions for Nothofagus growth in New Guinea are a mean annual temperature of about 16°C (G. Hope, pers. comm.) and a mean annual precipitation of 1500-2800 mm (Ash 1982). Of perhaps less climatic significance but no less botanical significance is the development of a low, non-woody swamp vegetation community comprising Restionaceae/Centrolepidaceae, Sparganiaceae/Typhaceae and Cyperaceae. Although the former two taxa were recorded very rarely in the preceding depositional sequence, they were probably restricted to the margins of swamp forests, or riparian situations where sufficient light could reach the ground layer. The reasons for the replacement of at least some of the swamp forest by herbaceous rushes and sedges are difficult to perceive. It is possible that the herbaceous taxa formed a specialised community on particular substrates that were unsuitable for swamp forest establishment and growth. It is equally possible that new herbaceous taxa evolved between the Early and Middle Eocene which were more successful at competing for substrates that would otherwise have been colonised by swamp forest. In any case, as Truswell and Harris (1982) have previously pointed out, these communities certainly developed and grew to prominence earlier in central Australia than they did in areas to the southeast of the continent where swamp forests remained dominant until at least the Miocene (Sluiter 1984). The occurrence of Casuarinaceae values of 5-20% of the pollen sum is also worthy of note. Whilst the more mesic Gymnostomae sections of the family are known constituents of more 'open' rainforests in northern Australia, Fiji, New Caledonia and New Guinea, the family is also known to colonise disturbed sites or soils of low fertility which are generally less favourable for rainforest growth (Paijmans 1976). It is also possible that representatives of the family were components of swamp vegetation as has been noted previously for the Latrobe Valley brown
coals (Sluiter & Kershaw 1982; Kershaw & Sluiter 1982; Sluiter 1984). PALAEOBOTANICAL AND PALAEOCLIMATIC COMPARISONS WITH THE OTWAY AND GIPPSLAND BASINS In this section, the Late Palaeocene, Early Eocene and Middle Eocene vegetation from the Birdsville Basin is compared with similar aged vegetation from the Otway and Gippsland Basins. The Otway Basin data have been taken from studies by Harris (1965, 1971, unpublished data), with the Gippsland Basin information derived from two sources: the Late Palaeocene data have been summarised from an unpublished study of 170 samples from 10 offshore wells by Sluiter and MacPhail (1983 - unpublished data); and the Middle Eocene data come from Stover and Partridge (1973). It is emphasised that such comparisons are attempted cautiously and must be considered broad brush at best, particularly as important controls such as the depositional environment, palynomorph preservation and pollen processing techniques vary with site and workers. With respect to depositional environment, it is stressed that the Eyre Formation fossils have been deposited in an entirely non-marine setting at considerable distance from the palaeoshoreline, whereas both the Otway and Gippsland studies were conducted on nearshore continental to marginal marine deposits. Moreover, palynomorph preservation and recovery can vary with the prevailing syndepositional and post-depositional conditions and the pollen processing techniques utilised. Whilst preservation and recovery were normally good from Eyre Formation samples, the same cannot be said of all the Otway and especially the Gippsland Basin samples. It should also be stressed that certain techniques such as micro-sieving and short spin centrifugation can and probably have removed some of the very small pollen grains such as those produced by the Cunoniaceae, at least in the Gippsland study.
Vegetation and climates, Lake Eyre region POLLEN TAXA
LATE PALAEOCENE Birdsville Gippsland
EARLY EOCENE
Otway
Birdsville
Otway
107
MIDDLE EOCENE Birdsville Gippsland
Otway
Aracaria
1 to 2
1
1
1
1
1
1
1
Dilwynites spp
1
2 to 3
3
1
3 to 4
1
1
1
Cupressaceae/Taxodiaceae
3
Not rec.
Not rec.
1
3 to 4
1
1
1
Dacrydium (Group B)
1
1
3
1
2
2
2
2 2
Lagarostrobus
1
3 to 4
3 to 4
1
1
2
2
Microcachrys
2
1
3
1
1 to 2
<
<
<
Podocarpus/Dacrydium
2 to 3
4
3 to 4
2
3
2
3
3
Pteridophytes
3
3
3
2
3
2
2
2
Australopollis obscurus
1
1
1 to 2
2
1
Absent
Absent
Absent
Casuarinaceae
1
1
1
1
2 to 3
3
3
3
Cunoniaceae
4
1
Not rec.
3 to 4
Not rec.
3
Not rec.
Not rec.
Myrtaceae
3
1
Absent
3 to 4
3
3 to 4
2
2
Nothofagus
1
2
1 to 2
1
1
3 to 4
4
4
Proteaceae
1 to 2
2 to 3
3
2
3
1 to 2
1 to 2
3
1 =Rare (< 1%); 2 = Fairly common (1-5%); 3 = Common (5-20%); 4 = Abundant (>20%); Not rec. =Not recorded.
Table 2 A comparison of relative pollen representation for the Late Palaeocene, Early Eocene and Middle Eocene depositional phases in the Birdsville, Gippsland and Otway Basins.
These problems preclude any close comparison between the three areas, but are not considered greatly to affect comparison at a broad scale. To assist with description of the major differences between the three areas, a comparison of the relative abundances of the major pollen types for the Late Palaeocene, Early Eocene and Middle Eocene is presented on Table 2. No adjustment has been made for the failure to recognise Cunoniaceae in the Otway Basin, and its possible underrepresentation in the Gippsland Basin due to particular processing techniques. During the Late Palaeocene interval, it can be seen that, apart from the rare presence of Microcachrys and Dacrydium (Group B) in the Gippsland Basin and their common
presence in the Otway Basin, differences between the two sites are minimal. The most striking differences between these southern sites and the Birdsville Basin are the presence of common Myrtaceae and rare Lagarostrobos Dilwynites spp. (? Araucariaceae) and Nothofagus in the latter, and the presence of rare Myrtaceae and common to abundant Lagarostrobos, common Dilwynites spp. and fairly common Nothofagus in the former. Whilst to some extent this may be due to vastly different depositional environments, the major cause was probably climatic and the northern site must have been under the influence of mean annual temperatures possibly 2-3 °C warmer than those experienced at the southern sites. In view of the fact that the Birdsville Basin site was located some 9° latitude further north than the two southern
108
I.R.K. Sluiter
sites this may not seem surprising, although it must be remembered that the equator to pole temperature gradient was considered to have been weakly developed in the Palaeocene (Kemp 1978). Unfortunately, the study from the Gippsland Basin by Sluiter and MacPhail failed to analyse sediments of Early Eocene age, so that comparisons of vegetation records of this age are restricted to the Otway and Birdsville Basins. Clearly, pollen representation of Dilwynites sppDacrydium (Group B), Casuarinaceae and to a lesser extent Proteaceae was higher in the Otway Basin, with Myrtaceae and perhaps Cunoniaceae better represented in the Birdsville Basin. The reasons for this are probably the higher temperatures at the northern site. Data for the Middle Eocene depositional sequence are not as good as for the earlier sequences and must be treated carefully. In general terms, though, floras appear quite similar in all three sites, possibly reflecting a weaker equator to pole temperature gradient for this period. The major difference is the greater representation of Myrtaceae in the northern site and the slightly greater representation of Nothofagus in the southern areas. IMPLICATIONS FOR EARLY TERTIARY SOUTHERN ATMOSPHERIC CIRCULATION From a comparison of the major components of the vegetation in the Birdsville, Otway and Gippsland Basins in the Late Palaeocene, Early Eocene and Middle Eocene depositional periods, it is possible to demonstrate that cooler conditions must have existed in the southern sites at each time, although the equator to pole temperature gradient was probably steepest in the Late Palaeocene and weakest in the Middle Eocene. The reasons for this are unclear, but may lie with the relative palaeogeographic position in relation to the prevailing air circulation. It is interesting to note that if the Tertiary palaeoclimatic model developed by Kemp (1978) is accepted, the Palaeocene Birdsville
Basin would have been situated at a palaeolatitude north of the main belt of westerlies influencing latitudes between 60° and 80° south, which would have included the Otway and Gippsland Basin sites. The Birdsville Basin, according to this model, would have been under the influence of a weak and erratic air circulation pattern, with the deep inland penetration of rain-bearing winds from warm sea surfaces commonplace. In the Middle Eocene, with the northward drift of the continent (Crook & Belbin 1978), all three areas would have been situated north of the major belt of westerly circulation, in latitudes experiencing weak and erratic circulation (Kemp 1978). It is possible that the general similarity of the pollen floras from all three areas in the Middle Eocene, and the differences exhibited between the southern and northern sites in the Late Palaeocene, may reflect the scenario anticipated by Kemp (1978), although more detailed quantitative pollen work on Palaeocene and Eocene sites in general is required.
CONCLUSIONS Quantitative pollen analysis of Late Palaeocene, Early Eocene and Middle Eocene sediments from the Lake Eyre region of northeastern South Australia has provided a hitherto unprecedented quantity of information about the nature of the vegetation and palaeoclimates in existence at the time. Late Palaeocene and earliest Early Eocene vegetation was comprised of simple closed forests in which representatives from the predominantly southern hemisphere family Cunoniaceae, and to a lesser extent conifers and the Myrtaceae, were the dominant components. Mean annual temperatures were probably about 18-19 °C, with mean annual precipitation exceeding 1400 mm. In the Early Eocene, a change to Myrtaceae-dominated complex notophyll vine forests occurred in response to an increase in mean annual temperatures to about 20 °C, and increased mean annual precipitation. The Middle Eocene was characterised by simple closed forests composed
Vegetation and climates, Lake Eyre region
mainly of representatives from the Myrtaceae, Cunoniaceae and Nothofagus 'brassii\ The
existence also of an open non-woody swamp community is indicated by the presence of sedge and rush taxa. Mean annual temperatures were probably about 17-18 °C, with annual mean precipitation levels of at least 1500 mm. Comparison with contemporaneous floras from southern margin sites in the Gippsland and Otway Basins reveals the existence of cooler conditions at all times within the latter localities, although the difference was probably most pronounced in the Late Palaeocene and least in the Middle Eocene. The reasons for this may lie with the relative palaeogeographic position of each site in relation to the prevailing air circulation pattern at the time. If so, the results of this study may provide some support for the southern hemisphere Early Tertiary atmospheric circulation model proposed by Kemp (1978). ACKNOWLEDGEMENTS The author gratefully acknowledges the support provided by the Bureau of Mineral Resources and, in particular, Elizabeth Truswell. Thanks are also due to Peter Kershaw, Bob Hill and Mike MacPhail who commented on the manuscript, and Esso Australia Ltd. who granted permission to use the Gippsland Basin data summarised in Table 2. Sue Tomlins and Gary Swinton drafted the figures. REFERENCES
ASH J. 1982. The Nothofagus Blume (Fagaceae) of New Guinea. In Gressitt J.L. ed. Biogeography and Ecology ofNew Guinea, pp.355-380. W. Junk, The Hague. BARLOW B.A. 1981. The Australian flora: its origin and evolution. In Flora of Australia, Vol. 1, pp.25-75. Australian Government Publishing Service, Canberra. COOKSON I.C. & PIKE K.M. 1954. Some dicotyledonous pollen types from Cainozoic deposits in the Australian region. Australian Journal of Botany 2, 197-21
109
CROOK K.A.W. & BELBIN L. 1978. The southwest Pacific area during the last 90 million years. Journal of the Geological Society of Australia 25, 23-40. HARRIS W.K. 1965. Basal Tertiary microfloras from the Princetown area, Victoria, Australia. Palaeontographica Abt. B. 115, 75-106. HARRIS W.K. 1971. Tertiary stratigraphic palynology, Otway Basin. In Wopfner H. & Douglas J.G. eds. The Otway Basin of Southeastern Australia, pp.67-87. Special Publication of the Geological Surveys of South Australia and Victoria, Adelaide. HARRIS W.K. 1972. New form species of pollen from southern Australian Early Tertiary sediments. Transactions of the Royal Society of South Australia 96, 53-65. HILL R.S. & MacPHAIL M.K. 1983. Reconstruction of the Oligocene vegetation at Pioneer, northeast Tasmania. Alcheringa 7, 281-299. KEMP E.M. 1978. Tertiary climatic evolution and vegetation history in the southeast Indian Ocean Region. Palaeogeography, Palaeoclimatology, Palaeoecology 24, 169-208. KERSHAW A.P. 1973. Late Quaternary vegetation history of the Atherton Tableland, north-east Queensland. Ph.D. Thesis, Australian National University, Canberra (unpublished). KERSHAW A.P. 1985. An extended Late Quaternary vegetation record from north-eastern Queensland and its implications for the seasonal tropics of Australia. Proceedings of the Ecological Society of Australia 13, 179-189. KERSHAW A.P. & NIX A.P. 1988. Quantitative palaeoclimatic estimates from pollen data using bioclimatic profiles of extant taxa. Journal of Biogeography 15, 589-602. KERSHAW A.P. & SLUITER I.R.K. 1982. The application of pollen analysis to the elucidation of brown coal depositional environments and stratigraphy. Australian Coal Geology 4, 169-186. LANGE R.T. 1982. Australian Tertiary Vegetation. In Smith J.M.B. ed. A History of Australasian Vegetation, pp.44-89. McGraw-Hill, Sydney. MARTIN H.A. 1978. Evolution of the Australian flora and vegetation through the Tertiary: evidence from pollen. Alcheringa 2, 181-202. MARTIN H.A. 1982. Changing Cainozoic barriers and the Australian palaeobotanical record. Annals of the Missouri Botanical Garden 69, 625-667. NIX H.A. 1984. An environmental analysis of Australian rainforests. In Werren G.L. & Kershaw
110
I.R.K. Sluiter
A.P., eds. Proceedings of a Workshop on the Past, Present and Future of Australian Rainforests, Australian National Rainforest Project Vol. 3, pp.421-425. World Wildlife Fund Australia and Australian Conservation Foundation, Melbourne. PAIJMANS K. 1976. New Guinea Vegetation. CSIRO and Australian National University Press, Canberra. POCKNALL D.T. 1978. Relative pollen representation in relation to vegetation composition, Westland, New Zealand. New Zealand Journal of Botany 16, 379-386. POWELL J.M. 1970. The impact of man on the vegetation of the Mt. Hagen region, New Guinea. PhD Thesis, Australian National University, Canberra (unpublished). SLUITER I.R.K. 1984. Palynology of OligoMiocene brown coal seams, Latrobe Valley, Victoria. PhD Thesis, Monash University, Melbourne (unpublished). SLUITER I.R.K. & ALLEY N.F. (in prep.). Palynology of the Early Tertiary Eyre Formation, Birdsville Basin, northeastern South Australia.
SLUITER I.R.K. & KERSHAW A.P. 1982. The nature of Late Tertiary vegetation in Australia. Alcheringa 6, 211-222. STOVER L.E. & PARTRIDGE A.D. 1973. Tertiary and Late Cretaceous spores and pollen from the Gippsland Basin, southeastern Australia. Proceedings of the Royal Society of Victoria 85, 237-286. TRUSWELL E.M. & HARRIS W.K. 1982. The Cainozoic palaeobotanical record in arid Australia: fossil evidence for the origins of an arid-adapted flora. In Barker W.R. & Greenslade P.J.M. eds. Evolution of the Flora and Fauna of Arid Australia, pp.67-76. Peacock Publications, Adelaide. TRUSWELL E.M., SLUITER I.R.K. & HARRIS W.K. 1985. Palynology of the Oligocene-Miocene sequence in the Oakvale-1 corehole, western Murray Basin, South Australia. Bureau of Mineral Resources Journal of Geology and Geophysics 9, 267-295. WOPFNER H., CALLEN R.A. & HARRIS W.K. 1974. The Lower Tertiary Eyre Formation of the southwestern Great Artesian Basin. Journal of the Geological Society of Australia 21, 17-51.
Vegetation and climates, Lake Eyre region
111
APPENDIX 1 Raw pollen dala derived from core BMR Muloorina 2
PALYNOMORPH TAXA
Depth(m) 22.4 17.0 20.0 24.55 27.6 31.7 34.0 37.38 39.0 40.3 40.7 41.3 49.7 50.6
POLLEN AND SPORES Anacolosidites acutullus Araucariacites australis
+ 1.3
0.7
Arecipites sp.
2
1.3
0.7
2
2.7
+ 1.3
+
+
+
cf. Arecipites sp. Australopollis obscurus
3.3 6
Baculatisporites comaumensis
+
Baculalisporites disconformis
+
+ 0.7
0.7
+ 6.7 + +
Basopollis sp. Beaupreadites elegansiformis
+
2
+
+ 0.7
+ 0.7
0.7
+
+
5.3
0.7
+
0.7
2
2
2.7
4.7
0.7
2.7
2
0.7
5.3
12.7 30
37.7
+ 6
+ +
14
2
+
0.7
+
+
+
+ 0.7
Bliiffopollis scabratus
+
Bysmapollis emaclatus
+
0.7
+ +
Camarozonosporites spp. Concolpites leptos
+ 1.3
+ 0.7 3.3
+
+
+
+ 1.3 + 4 2
Cunoniaceae (dicolpate)
5.3
+ 1.3
6
Cunoniaceae (tricolpate)
28
63
27.3 17
46.7 45.3 42
67
+
+
+
+
0.7
+ 1.3
+ 2
1.3
8
9.3 22
0.7
+
Cupanieidites orthoteichus Cyathidites splendens
+
Cuatjodotes spp.
1.3
1.3
4.7
+
0.7
+
0.7
Cyperaceaepollis sp. Dacrycarpites australiensis
+ +
+
Dilwyriites tuberculatus
1.3
0.7
0.7
+
+ 1.3
4
+
1.3
+
+ +
+
+
Dryptopolienites semilunatus 0.7
Elaeocarpaceae
2
Ephedripites notensis 0.7
+
0.7
+
+
4.7
+
2
+
+
1.3
+
Ericipites scabratus Gleichenidites circinidites
3.3
0.7
+ 2.7
Hatoragacidites harrissii
+
+
+
Herkosporites elliottii
+
+
+
Gephyrapollenites cranwellae
1.3
1.3
2
4.7
1.3
2
+
+
0.7
5.3
+
0.7
+
+
0.7
2
0.7
0.7
+
0.7
2
0.7
£
0.7
llexpollenites spp. Intratriporopollenites notabilis Laevigatosporiles spp.
5.3 10.7
+
Camarozonosporiles bullatus
Ericipites crassiexinus
+
+
Bisaccate conifers (undiff.)
Dilwynites granulatus
7.3
+
+ 1.3
0.7
+
0.7
112
I.R.K. Sluiter PALYNOMORPH TAXA
lLatrobosporites crassus 1 Liliacidites lanceolatus Liliacidites spp. Lycopodiumsporites sp. Lygislepollenites ellipticus Lygistepollenites florinii Malvacipollis diversus Malvacipollis subtilis Microcachrydiies antarcticus M icrofoveolatisporites fromensis Microreticulatosporites validus Milfordia homeopunctata Myrtaceidites spp. Nothofagidites brachyspinulosus Nothofagidites endurus Peremonolites densus Periporopollenites polyoratus Periporopollenites spp. Phyllocladidites mawsonii 1 Phyllocladidites paleogenicus Phyllocladidites reticulosaccatus Phyllocladidites verrucosus Podocarpidites spp. I Podosporites microsaccatus I Polycolporopollenites esobalteus Polypodites jpp. Proteacidites adenanthoides Proteacidites angulatus Proteacidites annularis Proteacidites dilwynensis Proteacidites crassus Proteacidites sp. cf. P. eyrensis Proteacidites fromensis Proteacidites grandis Proteacidites sp. cf. P incutyatus Proteacidites sp. cf. P. kopiensis Proteacidites latrobensis Proteacidites leightonii Proteacidites obscurus
Deptli(m) 22.4 17.0 20.0 24.55 27.6 31.7 34.0 37.38 39.0 40.3 40.7 41.3 49.7 50.6 0.7 + + 0.7 + + 2.7 + + + + + + + + + + 0.7 + 1.3 0.7 0.7 2 + 0.7 + 0.7 + + + + + + + + 3.3 2 3.3 14.7 + + + 0.7 + 0.7 3.3 + 4 + + + 0.7 1.3 0.7 0.7 0.7 + 2.7 + 6 4 11.3 8.7 11.3 9.3 9.3 5.3 1.3 6 5.3 0.7 0.7 + + + 0.7 + + + + 0.7 + + + + 0.7 2 + + + + + + + 1.3 2 2 1.3 3.3 + + + + + + 2 + 0.7 + + 0.7 + 0.7 0.7 0.7 + + + 7.3 0.7 7.3 5.3 2 6.7 4 1.3 4.7 8 2.7 32.6 19.3 + + 3.3 + 3.3 1.3 2 + 2.7 + +
2.7 0.7
+ + + +
+
+ +
4-
+
+
+ +
+
0.7 + +
+ +
+ +
0.7
+ +
+ +
+
+
+ + + +
07
+
+ +
0.7
+ +
+ + +
+
+ + +
+
+
+ +
+ +
+ +
+
+ + +
+ +
+
+ +
Vegetation and climates, Lake Eyre region
75.4
81.1
Depth (m) 84.25 96.3
Polycolporopollenites esobateus
+
+
+
Polyorificites oblatus Polypodidites spp.
PALYNOMORPH TAXA 65.6
72.8
+
100.3 0.7
+
+
+
0.7
+
109.3
112.0 0.7
Propylipollis minimus
121.2
0.7
Proteacidites adenanthoides Proteacidites annularis
113
+ +
+
+
+
+
Proteacidites clintonensis
+
+
Proteacidites dilwynensis
+
+
Proteacidites fromensis
+
Proteacidites grandis
+
Proteacidites asperopolus
+
0.7
+
+
+
+
+
+
0.7
+
+
+
+
+ 0.7
Proteacidites sp. cf. P. incurvatus Proteacidites sp. cf. P. kopiensis
+
Proteacidites latrobensis
+
1.3
+
Proteacidites leightonii
+
+
Proteacidites obscurus
0.7
+
Proteacidites pachypolus
+
+
+
+
Proteacidites sp. cf. P. prodigus
+
Proteacidites rectomarginis
+
Proteacidites sp. cf. P. reflexus
+ 0.7
+
+
Proteacidites similis
0.7
+
Proteacidites sp. cf. P. stipplatus
+
Proteacidites reticulatus
+
+
Proteacidites sp. cf. P. rynthius +
Proteacidites tenuiexinus
+
Proteacidites tripartitus
+
+
Protcacifites sp. cf. P. varius
+
+
Proteacidites wilkatanaensis 0.7
Rhoipites alveola (us
2
0.7
0.7
+
0.7
+
1.3
+
0.7
+
1.3
+
+
0.7
0.7
Rhoipites spp. Rugulatisporites trophus
Schizocolpus marlinensis
+
4
0.7
+ 0.7
0.7
+
+
+
+
+
+
+ +
+
+
+
+
+
Schizosporis reticularis Simplicepollis meridianus
0.7
+
Santalumidites cainozoicus Sapotaceoidaepollenites rotundus
+ +
Quintinia type
Rhoipites sp. cf. R. sphaerica
+
+
Proteacidites sp. cf. P. tortuosus
Proteacidites spp. (undiff)
+
+
+
0.7
+
2
114
I.R.K.
Sluiter
PALYNOMORPH TAXA Sparganiaceaepollenites
65.6
72.8
barungcniss
75.4 1.3
81.1
Depth (m) 84.25 93.6
100.3
109.3
112.0
121.1
+
+
2.7
0.7
+
0.7
+
1.3
1.3
1.3
+
+
0.7
+
2
0.7
+
+
+
+
+
4.7
8.7
+
Sphenostemon type Stereisporites antiquasporites Striacolpites sp.
+
Taxodiaceaepollenites hiatus
16.7
0.7
+
+
+
Striatricolporites spp.
+
2
Teracolporites verrucosus
+
Tricolpites fissilis Tricolpites phillipsii Tricolpites protata
0.7
Tricolpites renmarkensis
0.7
Tricolpites voraginosus
+
0.7
+
+
Tricolpites thomasii
2
0.7
Tricolpites spp. Tricolporiles angurium
0.7
Tricolporites leuros
+
0.7
1.3
+
Tricolporites scabratus 2.7
0.7
Tricolporopollenites endobalteus
0.7
0.7
Trilites tuberculiformis
+
Triorites introlimbatus
+
Tricolporites spp.
1.3
0.7
+
0.7
+
1.3
2
+
+
+
-f +
Thorites minisculus
2.7
3.3
0.7
ALGAE +
Cf. cyst type 69 (van Geel 1976)
5.3
6
Morkallocysta pyramidalis
+
+
Saeptodinium gravattensis
+
+
Botryococcus spp.
+
0.7 +
+
Spirogyra sp. MESOZOIC REWORKING Classopollis sp. Cleistosphaeridium sp.
+ + +
Dinoflagellates spp. (indet.) Kraeuselisporites papillatus
+
+
Vegetation and climates, Lake Eyre region
115
APPENDIX 2 Raw pollen data derived from core BMR2 Peachawarinna 2
PALYNOMORPH TAXA 65.6
72.8
75.4
3.3
+
+
Depth (m) 84.25 96.3
81.1
100.3
109.3
112.0
121.2
POLLEN & S P O R E S Aglaoreidia qualumis Alyxia type
3.3
+
+
Anacolosidites aciitullus
+
Anacolosidites luteoides
+
Araucaria cites australis
2
1.3
+
+
+ +
Australopollis obscurus Beaupreadites elegansiformis
+
2
+
4
3.3
0.7
+
+
2.7
+
cf. Areolipollis sp.
4.7 +
Beaupreadites verrucosus Bisaccate conifers (undiff.)
+
0.7
0.7 +
+
Camarozonosporites bullatus
+
Camarozonosporites spp. 0.7 +
Clavatipollenites glarius
+
0.7
Concolpites leptos cf. Croton type Cunoniaceae (dicolpate) Cunoniaceae (tricolpate)
0.7
2
4
4
12.7
3.3
+
+
Cupanieidites orthoteichus 4.7
2.7
2
2.7
2.7
0.7
2.7
3.3
4
10.7
11.3
18.7
23.3
24
2.7
+
+
0.7
+
+
+
+
+
0.7
1.3
4.7
2
3.3
0.7
0.7
0.7
+
2.7
2.7 2
0.7
Cycadopites sp. Cyperaceaepollis sp.
0.7 4
+
Cyathidiles splendens Cyathidites spp.
3.3
+
Dacrycarpites australiensis
+
5.3
+
+
+
Dilwynites granulatus Dilwynites tuberculatus
+
+ +
+
4.7
0.7
Dtyptopollenites semilunatus Elaeocarpaceae Ephedripites notensis
0.7
0.7
+
Ericipites crassiexinus
+
+ +
+
2
+
0.7 +
Gephyrapollenites cranwellae Gleicheniidites circinidites
1.3
Gothanipollis bassensis
0.7
Graminidites sp.
+
Gyrostemonaceae type
0.7
+
Ericipites scabratus cf. Eugeissona type
0.7
+
24
+
+ +
+
0.7
+
116
I.R.K. Sluiter
PALYNOMORPKITAXA HaJoragacidites harhsii
65.6 16
Helciporites a situs
72.8 13.3
75.4 11.3
+
0.7
81.1 6.7
Depth (m) 84.25 96.3 4.7 0.7
100.3 0.7
109.3 1.3
112.0 2.7
+
I/erkosporites elliottii lntegricorpus antipodus
+
+
+
+
0.7
0.7
+
+
+
0.7
+
1.3
+
+
Intratriporopol lenites notabilis Laevigatosporites spp
2.7
1.3
+
Latrobosporites crassus
+
+
Liliacidiles lanceolatus
1.3 +
0.7
Lycopodiumsporites spp. Lygistepollenites flovinii
1.3
Malvacipollis sub ti lis
5.3
3.3 +
M icrocachrydites antarcticus
4
0.7 +
+
+
1.3
28
6
+
0.7
+
+
+
+
+
7.3
8
+
+
0.7
1.3
1.3
0.7
+ 31.3
72.3
62
12.7
27.3
18
+
1.3
4
14
0.7
0.7
Nothofagidites brachyspinulosus
0.7
+
Nothofagidites deminutus
0.7
0.7
3.3
3.3
3.3
Nothofag idites falcatus
+
6
2
18.7
0.7
Nothofagidites gonialutus
0.7
Nothofagidites endurus
+
+ +
Nothofagidites vansteenisii
1.3
Nuxpollenites sp.
0.7
0.7
+
+ +
Parvisaccites catastus
+
+ +
Peremonolites densus
+
+ 2
Periporopollenites polyoratus 0.7
+
6.7
2
Phyllociad idites ma wson ii
2.7
+
2.7
0.7 +
Phyllociadidites paleogenicus
+
0.7
1.3
3.3
Periporopollenites spp.
0.7
1.3
2
+
+
+
+
4
2.7
0.7
1.3
0.7
0.7
0.7 1.3 1.3
Phyllociadidites verrucosus Pimelia type
+ 1.3
2
Podosporites microsaccatus Polycolpites sp.
+
+
I Phyllociadidites reticulosaccatus
Podocarpidites spp.
+
0.7
7.3
I Nothofagidites heterus
+
+
5.3
Nothofagidites emarcidus
+
+
10
14.7
+
+
+
Nothofagidites asperus
0.7
0.7 +
+
Myrtaceidiies verrcosus Myrtaceidites spp.
1.3
0.7
+
Malvacipollis diversus
Milfordia homeopunctata
+
0.7
Lillacidites bainii Liliacidites spp.
121.2 0.7
+
2
2.7 +
+
0.7
+
1.3 +
Vegetation and climates, Lake Eyre region PALYNOMORPH TAXA Proteacidites sp. cf. P. parvus Proteacidites sp. cf. P.prodigus Proteacidites reticulatus Proteacidites similis Proteacidites tenuiexinus Proteacidites tripartitus Proteacidites sp. cf. P. vatius Proteacidites spp. (undiff.) Rhoipitcs alveola (us Rhoipites spp. Rugulatisporites mallatus Schizocolpiis marlinensis Sch izosporis reticularis Simplicepollis meridianus Stereisporites antiqusporites Stereisporites tripunctisporis Stria tricolporites spp. Taxodiaceaepollenites hiatus Tetracolporites verrucosus Tticolpites fissilis Tricolpites gillii Tricolpites phillipsii Tricolpites prolata Tricolpites sp. cf. T. simatus Tricolpites thomasti Tricolpites spp. Tricolporites spp. Tricolporopollenites endobaiteus Triorites introlimbatus Triorites minisculus ALGAE Bolryococcus spp. Morkallocysta pyramidalis Saeptodinium gravdttensis MESOZOIC REWORKING Actitarch spp. (indet.) Aequitriradites spinulosus Balmeisporites sp. Cibotiumspora juriensis
117
Depth (m) 22.4 17.0 20.0 24.55 27.6 31.7 34.0 37.38 39.0 40.3 40.7 41.3 49.7 50.6 +
+
+
0.7 +
+
+
+
+ +
0.7 +
1.3
3.3 4.7 +
1.3 2
+
+
0.7
+
+
+
2.7 +
4 2
+
0.7 + +
+
+ +
+ +
+ +
0.7 2
0.7 2
+
+
0.7
+
+ + 3.3 0.7 + 0.7 0.7 + + 0.7 1.3 + 1.3 5.3 6.7 9.3 2.7 5.3 7.3 0.7 +
6.7
0.7 +
3.3 2 +
+
10
+
12
+
4
+ + +
10
2
+
+
2
+ +
+
1.3
+
+
0.7 0.7
+ +
+
1.3
+
+
+ +
+
2.7 4
+
+
+
+
4
+
4
+
+ +
+
+
6.7 0.7 + 2 4 3.3 1.3 2.7 0.7
+ +
+
2
+
1.3 0.7
+
+
+
+
+
1.3
+
+
+
3.3
+
+
+
+ +
+
4-
+
4
+
+
6
0.7 +
+
2.7
118
I.R.K. Sluiter
PALYNOMORPH TAXA Cicatricosisporitesaustraliensis Classopollis sp.
Depth (m) 22.4 17.0 20.0 24.55 27.6 31.7 34.0 37.38 39.0 + + + + +
+
+
+
+
+ +
Clavatipollenites sp. (Dettmann) +
Cleistosphaeridium sp.
+
Contignisporites cooksonii Cribropetidinium sp.
40.3 40.7 41.3 49.7 50.6 0.7 +
0.7
+
Diconidinium multispinum
+
Dictyophyllidites harrisii
0.7
Dinoflagellate spp. (indet.)
+
1 Kracuselisporites papillatus
+
+ +
+ +
I Oligosphaeridium sp. +
I Retimonocolpites peroreticulatus +
1 Tticol piles cooksonii 1 Tricolpites minutus Veryhacium sp.
+
+
+
+
+
+
+
Cainozoic shelf sedimentation model for the Tasman Sea margin of southeastern Australia P.S. ROY AND B.G. THOM 1
2
Geological Survey of New South Wales, GPO Box 5288, New South Wales 2000, Australia.
1
department of Geography, University of Sydney, New South Wales 2006, Australia. Cainozoic sediments on the southeast Australian margin form an elongated belt on the shelf and upper slope 1500 km long, 20-30 km wide but less than 600 m thick. Little is known about their geology; the sediments are assumed to comprise mainly fine clastics and cool water carbonates that accumulated under shallow water, wave-dominated conditions. A mathematical/graphical model has been devised using parameters of passive margin subsidence, palaeo-sea level change and local tectonism (uplift and subsidence) related to a migrating hotspot. Using 'reasonable' values for the parameters, the model predicts a complex along-shelf stratigraphy with multiple unconformities (one of which is time transgressive) separating sediment packages that generally are younger in the north than the south. The oldest deposits are indicated to be Middle Oligocene in age - somewhat younger than previously thought. Because of relatively recent uplift and erosion, Early Miocene sediments crop out on the southern shelf. The model suggests that the southeastern corner of Australia has been technically active in the last 8 Ma. In the north the Early Miocene section is blanketed by Late Miocene deposits, themselves disconformably overlain by Quaternary sands; most of the Pliocene sequence appears to be absent. We envisage an allochthonous shelf with a graded sediment regime during the Neogene, changing radically in the Quaternary because of the rapidity of glacio-eustatic sea level movements. Key words: continental shelf, sedimentation model, southeastern Australian margin, Tasman Sea margin.
INTRODUCTION This paper concerns the Cainozoic, and in particular the Tertiary, marine geology of the southeastern Australian margin between the Great Barrier Reef province in Queensland and the Gippsland coast of Victoria in Bass Strait - latitudes 24° to 37 °S. Here the edge of the Australian continent is aligned NNESSW for a distance of 1500 km where it borders the Tasman Sea Basin - a feature that formed by seafloor spreading in Cretaceous to Paleocene times (Fig. 1). Sedimentation on the continental margin is very limited and has attracted little interest for oil exploration. A Tertiary sediment pile, generally less than 500 m thick and 20-30 km wide, mainly occupies the eroded upper surface; in most areas cratonic rocks crop out inshore near the coast and on the continental slope below depths of c. 1000 m (Fig. lb). The gross geological structure of the southeast Australian margin and Tasman Sea Basin
is known from reconnaissance geophysical surveys (Ringis 1972; Davies 1975,1979; Marshall 1979; Falvey & Mutter 1981; Colwell & Coffin 1987; Colwell et al 1988). However, while more detailed geological studies have been carried out in some inner shelf areas (von Stackelburg 1982; Jones & Davies 1979; Roy & Ferland 1987; Roy & Hudson 1987), deep stratigraphic data for most of the upper margin deposits are non-existent. The only exception is a single drill hole on Fraser Island at the northern extremity of the area (lat. 24 °S). Although drilling data exist for the Gippsland Basin in eastern Victoria (Grimes 1982), the tectonic regime here is different to the Tasman Sea margin and correlations may be difficult to sustain (Jenkin 1984; Colwell & Coffin 1987, Colwell et al 1988).
119
In the following, we describe the geometry of the shelf and upper margin deposits presently found at depths of less than 1000 m below present sea level, and postulate an
120
B.G. Thorn & P.S. Roy
Eastern Highlands
DR— D a m p i e r R i d g e / / — a x i s of E a s t e r n / Highlands
Fig. 1 (a) Eastern Australia and the Tasman Sea Basin showing the axis of spreading in the Tasman Sea and the relationship of the Cainozoic volcanic provinces to the Eastern Highlands on the Australian plate. Plate break-up was asymmetric; the lower plate extension zone now underlies the Lord Howe Rise and Dampier Ridge leaving southeastern Australia with a narrow shelf and steep continental slope, (b) Generalised cross section of the Tasman Sea margin showing the distribution of margin sediments on the cratonic basement. The sediment pile discussed here occurs on the drowned upper surface of the craton. The continental slope is a modified detachment fault. The arrow shows the relative position of the northsouth section in Figure 2c. (Based on Ringis 1972; Davies 1975, 1979; Shaw 1978; Jongsma & Mutter 1978; Sutherland 1981; Packham 1983; Colwell & Coffin 1987; Colwell et al 1988).
Cainozoic shelf model for the Tasman Sea margin evolutionary model for their development. Elements of the model include: 1) shallow water sedimentation; 2) margin subsidence; 3) relative sea level changes; and 4) local tectonism related to crustal heating above a hot spot/mantle plume. The model is calibrated using the drilling data, and its veracity is assessed in so far as it replicates known seismic stratigraphic patterns. Physical Setting of the Continental Margin The continental shelf of southeast Australia is narrow (c. 25-50 km wide) with depths at the shelf break ranging from 160 m in the south to less than 100 m in the north; surficial sediments are predominantly quartz sand with varying amounts of temperate - water carbonate (Marshall & Davies 1978; Roy & Thorn 1981a). The continental slope drops steeply over distances of 40-60 km to abyssal depths of 4.5 km in the Tasman Sea Basin; continental rise deposits are absent or poorly developed (Ringis 1972) and cratonic rocks commonly crop out on the slope (Packham 1983) (Fig. lb). The coast is bedrock controlled; quartz sand barriers that occupy embayments between rocky headlands increase in size and stratigraphic complexity towards the north (Roy & Thorn 1981a). The Eastern Highlands, located 50-100 km inland from the coast, form a 500-2000 m high coastal range (Fig. 1) from which generally small coastal rivers drain eastwards. The objective of this study is not to contribute to the debate on the origin of the Eastern Highlands although, as seen below, the results may have some implications in this direction. Rather we accept that a coastal range, broadly similar to the present-day Eastern Highlands, was already in existence at the time shelf sedimentation commenced in the Tertiary. At least over Neogene time-spans, and despite the northward migration of the Australian plate away from Antarctica and into progressively warmer latitudes, gross patterns of rainfall, river discharge and wave climate on this coast are assumed to have remained broadly similar to the present.
121
CONTINENTAL MARGIN DEVELOPMENT AND FORMATION OF THE TASMAN SEA Rocks forming the east Australian craton were laid down in the Tasman Geosyncline in Early to Middle Palaeozoic times (Packham 1969). Subsequent deformation and metamorphism produced, in turn, the Lachlan and New England Fold Belts. Two main sedimentary basins of Late Paleozoic to Mesozoic (Jurassic) age occur within the neocratonic shield: (i) the Sydney Basin, which occupies a north-south trending trough in central eastern New South Wales (NSW); and (ii) the Clarence Moreton Basin within the New England Fold Belt. Mesozoic basin sedimentation was terminated by a succession of tectonic events that eventually produced the existing continental margin configuration. Schools of thought concerning the evolution of the Eastern Highlands are summarised by Bishop (1988). Formation of the Tasman Sea Continental breakup and sea-floor spreading that formed the Tasman Sea commenced in the Cretaceous (Hayes & Ringis 1973). Plate separation was apparently asymmetrical through a process of detachment faulting with little seismic evidence for rifting on the Australian plate (Lister et al 1986, 1988). This largely accounts for the narrowness, by world standards, of the southeastern Australian continental shelf. Sea floor spreading, which occurred over a 20 Ma period and terminated in the Middle Paleocene (c. 60 Ma), operated about a northwest oriented spreading axis and affected southern NSW earlier than the northern part of the state (Hayes & Ringis 1973). Spreading patterns reconstructed by Shaw (1978) suggest that the Dampier Ridge detached last from the Australian plate in the vicinity of latitude 29-30°S. This region is therefore the youngest part of the Australian margin with the shortest subsidence history; it coincides reasonably closely to a (seismic) basement high beneath the shelf in the vicinity of latitude 29°S (Fig. 2c).
122
B.G. Thorn & P.S. Roy SOUTHEAST AUSTRALIAN SHELF QUARTZOSE SAND PROVINCE
(a)
(C)
LAT.TUDE
I
35 PSL
degrees south i
30 i
25
I
Sandy Cape . drill hole N
j
i
shelf edge 200
HP
400 600
800
m
-j
basement
m
Fig. 2 (a) Line drawings of seismic traverses across the mid and outer shelf/upper slope showing internal structure. Vertical scale: ticks indicate 100 milliseconds two-way travel time. Horizontal scale is 10 km long. Data south of 32°S are from Davies (1975); north of this they are from Marshall (1977, 1979). (b) Regional distribution of sub-shelf stratigraphies, (c) Simplified coast-parallel section located at the shelf edge showing the approximate maximum thickness of the sub-shelf sediments, basement morphology and the northward shallowing of the outer shelf surface. The dipping attitude of the unconformity south of 33°S contrasts with its discontinuous pattern (shown diagrammatically) north of 32°S. Details of the Sandy Cape drill hole are given in Figure 4.
Cainozoic shelf model for the Tasman Sea margin
123
After sea floor spreading, subsidence of the continental margin can be explained by a combination of conductive cooling and contraction of the lithosphere towards thermal equilibrium and, to a lesser degree, sediment loading (Deighton et al 1976; Lister et al 1986). Marine shelf sedimentation commenced once the continental edge subsided below sea level, and, it is argued below, was preceded by a period of mainly subaerial erosion. Jones et al (1975), Davies (1975) and Marshall (1979) consider that marine sedimentation started in the Early Tertiary, while Shaw (1978) believes it did not begin until the Miocene. Results of the present modelling study tend to support Shaw's findings.
than 500 m elsewhere (Fig. 2a). Its seismic character has been described by Ringis (1972), Jones et al (1975), Davies (1979) and Marshall (1979); drill hole data off NSW are nonexistent. Usually present are two sediment units separated by a seismically defined unconformity (Si). The lower unit forms a seaward thickening prism that is transgressive over basement, with 'bedding' planes generally paralleling the basement slope. The upper unit, which has a more uniform thickness, comprises flat-lying layers that have aggraded on the erosion surface. However, the attitude of Si and the relationship of the two sediment units differs in the north compared to the south (Fig. 2b).
Seismic Structure of the Shelf and Upper Margin Deposit
North of latitude 33°S the maximum subbottom depth of Si at its outer edge is about - 3 0 0 m. Here bedding above and below Si are often sub-parallel and the unconformity is not clearly defined (Fig. 2). In this sector Si is thought by Marshall (1979) to represent a base level of erosion, possibly corresponding to the Messinian salinity crisis (Adams et al 1977). The absence of stream channelling on Si (A. Albani, pers. comm.) suggests that its present form was the result of plantation during the Pliocene marine transgression (Marshall 1979).
Seismic data from the Tasman Sea margin (Ringis 1972; Davies 1975, 1979; Marshall 1979; Packham 1983; Colwell & Coffin 1987) show the surface of the cratonic basement sloping at c. 1° beneath the shelf sediment wedge, but beneath the continental margin it steepens to 10-20°. The steep zone is interpreted as the original displacement fracture (possibly degraded by erosion) along which Tasman Sea break-up occurred (Fig. lb). The present shelf morphology is largely the result of Tertiary marine deposition and erosion on a subsiding basement. On the inner part of the present shelf the dominant process has been marine abrasion, due to the high energy incident wave regime which is related, in turn, to minimal frictional dissipation of ocean waves as they traverse the narrow shelf at higher sea levels (Wright 1976). Except in bedrock valleys, sediment cover on the inner shelf is thin, bedrock reefs crop out extensively in depths less than about 60 m (Jones & Davies 1979) and much of the shoreline is cliffed, especially south of latitude 33°S (Chapman et al 1982, Fig. 7.12). On the outer shelf and upper slope, Tertiary sediments form a prograded wedge up to 600 m thick off southern NSW but generally less
In contrast, south of latitudes 33° to 35°S, Si defines an angular unconformity which truncates the seaward dipping beds of the lower unit (Davies 1979) (Fig. 2a). In this area the Si surface rises towards the south and, at latitude 35.5°S, it intersects the sea bed. South of this the upper unit is missing and dipping beds of the lower unit appear to crop out at, or just below, the sea floor (Figs. 2 and 3). Figure 2c is a north-south transect through the Cainozoic sediments along the line of the shelf-break. In some areas the transect coincides with a sudden steepening of the basement surface and this accounts for some of the variations in basement depth. The apparent north-south deformation of Si south of latitude 34°S indicates uplift of 150 m at latitude 35°S. The strong angular unconfor-
124
B.G. Thorn & P.S. Roy
mity at the top of the lower sediment unit (Fig. 3) suggests severe erosion (or erosion over a longer period of time) in this area. Other indications of recent uplift in southeastern Australia include: raised river terraces and a + 20 m marine barrier deposit (both of Pliocene age) in East Gippsland, Victoria (Carter 1979); raised terraces with marine deposits of possible Late Tertiary to Early Quaternary age on King and Flinders Islands in Bass Strait (Jennings 1961); and beach ridges of Last Interglacial age at + 20-30 m in Tasmania (Bowden & Colhoun 1984). The Sandy Cape Drill Hole rj,u , ~ . . u Throughout the Quaternary there is .u u * / a c thought to have been a strong tendency for waves to transport littoral sand northwards along the southeast Australian coast (Roy & Thom 1981a). Because of glacio-eustatic oscillations in sea level, virtually the whole (a)
shelf surface has been affected many times by high energy nearshore/surf-zone processes. The end product has been for sand to accumulate in large sand islands off the southern Queensland coast with the largest of these, Fraser Island, extending diagonally across most of the shelf at latitude 25°S (Fig. 2b). Stratigraphic bore hole GSQ Sandy Cape 1-3R was drilled by the Geological Survey of Queensland at the northern tip of the island, 20 km from the shelf edge (Grimes 1982). It penetrated 420 m of Late Tertiary and Quaternary sandy marine shelf deposits, 172 m of Middle Tertiary basaltic volcanics and interbedded deltaic, estuarine and fluvial sediments, and bottomed in 31 m of sandstone , -. T . . a n d, s h'a l ,e ofr probable Jurassic age (Grimes . Figure 4 shows that the uppermost 104 m of the sequence is composed of orthoquartzitic sands similar to those forming the (b)
Fig. 3 Shore-normal (Uniboom) profiles in southern NSW are interpreted as showing finely layered and seaward dipping Tertiary deposits (TM) only thinly veneered by Quaternary outer shelf sediments (OSS) (a) or outcropping on the sea bed (b). The basal units onlap Palaeozoic basement (Br) in the middle shelf (a) and upper layers crop out just over the shelf edge (b). They occasionally contain low angle disconformities (a) but the sequence as a whole is thought to belong to the lower sediment unit beneath the Si unconformity as defined in Figure 2c. Data from Roy and Hudson (1987).
Cainozoic shelf model for the Tasman Sea margin
present-day island. They probably represent a number of barrier complexes (nearshore, beach and dune facies) of Pleistocene age. From 104 to 421m the sediments are less mature and range from shelly quartz-rich to calcareous sands with varying amounts of mud. Grimes (1982) interprets this unit as a shallow marine shelf environment of deposition. Zones with calcreted and cemented layers - the presumed product of subaerial weathering - occur at the top (104 - 125 m) and from 209 to 245 m. Foraminiferal studies by Palmieri (1984) indicate an Early Miocene age for the material below 240 m, and a Middle Miocene age or younger age above this depth. A major time break is represented by the weathered zone from 209 to 245 m with Middle Miocene foraminifera ranging in age from zone N9 to N14. This zone appears to correspond to a seismic reflector (S in Mar3
125
shall 1977) which, based on correlation with a drill hole in the Capricorn Basin 200 km further north (Palmieri 1984), is thought to be of Middle Miocene age. The overlying sequence to 125 m extends from Early to Late Pliocene (zones N19-21) then into an Early Pleistocene assemblage (N22) in the calcreted zone from 109 to 125 m. Here the fauna shows little sign of a hiatus in sedimentation despite the indications of weathering (Grimes 1982). Underlying the shelf sediments are basalts extruded on land and now extensively weathered; samples recovered were unsuitable for dating but are thought to be no older than Middle Oligocene (Grimes 1982). The presence of interbeds of estuarine sediments indicates a coastal setting with relative sea level rising at approximately the same pace as the accumulating lava pile. Foraminiferal ages
24.7 S
GSQ SANDY CAPE DH 1-3R
+2m msl
104 104 125
21 84
209 245 •T So
36
•g~; G>: 176 "a
421 434 v v V V
v V
535 556
V
V
171
qtz. sand calcrete muddy qtz. +calc. sand calcarenite+calcrete
+ calc. sand
basalts + glauconitic sand and carbonaceous s' stone and shale
m
QUA
shallow
marine
7L.MIOCENE-E.PLIOCENE
^ = S3 = M.I
weathered
(?)E.MIOCENE
shallow
terrestrial
marine ©
E.MIOCENE
Q)
E.MIOCENE
and
deltaic/estuarine (S) L.OLIGO
coal measures
TERNARY
weathered
muddy qtz.
592 623
shallow marine aeolian
/E.MIO.
MESOZOIC
Fig. 4 Summary of lithology, depositional environment, and ages of the Sandy Cape drill hole from Grimes (1982). The hole is located at 24.7°S and 153.3°E and is shown on Figure 2b.
126
B.G. Thorn & P.S. Roy
range from Late Oligocene at the base to Early Miocene at the top. The marine incursion at the base is correlated with a global marine transgression in the Late Oligocene about 30 Ma ago (Grimes 1982). The Jurassic rocks at the base of the sequence in Figure 4 are part of the Australian craton, and represent the basement upon which Tertiary sedimentation occurred after formation of the Tasman Sea basin.
CHARACTERISTICS OF THE MODEL A graphical/mathematical model has been devised to predict patterns of Tertiary sedimentation along a coast-parallel (northsouth) traverse on the outer shelf between latitudes 24°S and 38°S. In some respects, the technique is similar to thermal geohistory analysis of oil well data (Falvey & Deighton 1982; Heller et al 1982). Cumulative deposition and erosion trends have been determined at intervals of one degree of latitude for various combinations of values for the parameter. 1) Passive margin subsidence (PMS); 2) Palaeo-sea level change (PSL); and 3) Local tectonism related to the passage of the Australian Plate over a 'hot spot' (LT). We discount sediment loading as a factor in the evolution of this margin; the average thickness of the sediment wedge is only 1-2% of the crustal thickness, which is about 30-50 km thick along the eastern seaboard. Passive Margin Subsidence Initial attempts to evaluate passive subsidence patterns for continental margins by linking them to the thermal contraction and sinking of oceanic crusts (e.g. Sclater et al 1971; Hayes & Pitman 1973) indicated quite high subsidence rates (c. 20-50 m/Ma). More recently, however, thermal history analysis of sediment sequences in deep drill holes suggests that rates for the tectonic (as opposed to the
sediment loading) component of margin subsidence were probably slower (c. 5-15 m/Ma) (e.g. Royden & Keen 1980; Sheridan 1981; Sawyer et al 1982). Figure 5 illustrates a range of theoretical subsidence trends in relation to palaeo-sea levels. For average PMS rates of more than 20 m/Ma, a surface that is now 500 m below present sea level would have first submerged no earlier than the Middle Tertiary. Even at rates as slow as 15 m/Ma it is unlikely that the initial phase of shelf sedimentation would have survived the major global regression of the Middle Oligocene, c. 30 Ma ago (Fig. 5). Very slow rates of PMS (c. 5 m/Ma - Fig. 5) imply that the margin was inundated and shelf sedimentation commenced almost as soon as sea floor spreading ceased - a scenario not entirely consistent with the latest models of passive margin development. These invoke low angle detachment faulting leading to the formation of asymmetrical (upper and lower) plate margins (Lister et al 1986). In the case of the Tasman Sea, its western (Australian) margin is thought to correspond to an upper plate (Lister et al 1988) which, the model predicts, was elevated and underplated during the pre-detachment phase. The Eastern Highlands are seen (at least in part) as a product of the initial uplift phase which later (during the Palaeogene) probably delayed downwarping and submergence at the margin edge. The upper plate is expected to subside in the postextension phase (Lister et al 1988); however the narrowness and lack of multiple rift structures suggests that the behaviour of the Australian margin may have been influenced by the adjacent ocean crust (E. Scheibner, pers. comm.). If so, the relatively fast rates of PMS mentioned above may be applicable. An average PMS rate of about 23 m/Ma is indicated by the first occurrence of estuarine sediments (at -590 m) in the Sandy Cape drill hole at the end of the Oligocene (Fig. 4). For purposes of the model, sedimentation is therefore assumed to have commenced 30 Ma ago even though, at this time, some higher sections of the craton's edge must still have been above sea level.
Cainozoic shelf model for the Tasman Sea margin
127
Fig. 5 A range of possible subsidence histories is represented by sloping lines based on different rates of passive margin subsidence (5,15, 20 and 25 m/Ma). Each subsidence curve leads to the present average sub-shelf basement depth of 500 m bsl. These are superimposed on the palaeo-sea level curve of Haq et al (1987). The curve of Vail et al (1977) is similar but less complex. It shows a deeper recession at c. 30 Ma and generally lower sea levels between 30 and 20 Ma. Relative Sea Levels and Tertiary Shelf Sedimentation It is likely that horizontal migrations of shorelines in the Tertiary were extremely slow and on a much smaller scale than those accompanying glacio-eustatic fluctuations of the Quaternary. We envisage a narrower and shallower 'shelf' zone in the Tertiary than today with a graded, allochthonous sediment regime. Tertiary sedimentation on the gently sloping upper surface of the craton is believed to have been predominantly the result of shallow-water ( < 5 0 m) depositional processes (Davies 1979; Marshall 1979). Accumulation rates are assumed to have been in the order of 0.1 - 1.0+ m/thousand years, similar to rates on the present-day shelf (Kudrass 1982; Colwell & Roy 1983; Roy 1985). This was equal to or faster than vertical rates of
tectono-eustatic sea level change in preQuaternary times (e.g. palaeo-sea level curves of Vail et al 1977; Haq et al 1987). Tertiary sea level changes thus would have governed sediment aggradation in shallow shelf environments (Guidish et al 1984; Orford 1987). This situation contrasts with conditions on the present-day shelf, where the very rapid rise of sea level in postglacial times (c. 10-15 m/thousand years) has far outpaced natural rates of sediment accumulation. Thus in the model we assume that, on the outer shelf surface, deposition and erosion closely followed relative sea level changes; sediments accumulated as relative sea level rose ( + ve) and were eroded as the sea fell (-ve). The model does not apply to sedimentation in deeper water on the continental slop. The onset of Quaternary glacial - interglacial cycles about 2 Ma ago was responsible
128
B.G. Thorn & P.5. Roy
for a sedimentation regime markedly different from the shallow, allochthonous graded shelf of earlier times. Rapid glacio-eustatic sea level oscillations (at least one order of magnitude faster than previously) alternately drowned the shelf then exposed its entire surface to high energy wave reworking as the shoreface repeatedly changed position. The sediment product was predominantly sand, and sediment dispersal was dominated by along-shelf transport systems (currents and littoral drift - Roy & Thorn 1981b). The model therefore does not attempt to measure sediment buildup during the last 2 Ma of the Quaternary.
Volcanicity and Local Tectonism
Northward migration of the Australian lithospheric plate over hotspots or plumes in the upper mantle (Vogt & Conolly 1971) is advocated by Wellman and McDougall (1974) and Wellman (1983) to account for a linear relationship between the age and latitude of central volcanic provinces in eastern Australia (Fig. 6a). The rate at which volcanics become younger towards the south correlates well with rates of separation of the Australian plate from Antarctica (Fig. 6b). The same trend is also shown by the ages of a northerly-trending
20°S
Sandy Cape Drill hole
30°S
35°S
40°S
40°S A
Wellman and McDougall, 1974
O
Spreading rates from Circum- Pacific Plate Tectonics map (AAPG publ.,1981)
150°E
Fig. 6 (a) Ages and distributions of central volcanic provinces in eastern Australia from Wellman and McDougall (1974). Arrows indicate plate motion above sub-crustal hotspots or plumes. Guyots in the Tasman Basin indicate a plate migration of c. 7 cm/yr and the present location of the hotspot is marked by a star (McDougall & Duncan 1988). (b) Rates of northward migration of the Australian plate based on the age and latitude of central volcanoes, supplemented by combined sea floor spreading rates from the southern ocean that measure the movement of the Australian plate away from Antarctica. AAPG - American Association of Petroleum Geologists.
Cainozoic shelf model for the Tasman Sea margin
chain of guyots in the Tasman Sea (Vogt & Conolly 1971; McDougall & Duncan 1988). These are interpreted as a hotspot trace with the present volcanic centre at c. 40°S and 156°E (Fig. 6). Although no central volcanic provinces are recorded between latitudes 34° and 37°S in southern NSW, higher than normal geothermal gradients have been recorded in the far southeast with a maximum centred on Tasmania (Cull 1982), consistent with crustal instability in relatively recent times (Sutherland 1981). Uplift along the southern continental margin would account for the more rugged coastal relief; here the Eastern Highlands approach closer to the coast than elsewhere in the state. Some thermal expansion and uplift (probably associated with underplating) could conceivably have affected this region as recently as 3-8 Ma ago (from Wellman & McDougall 1974, Fig. 8). Average rates of travel of the Australian plate relative to the hotspot are 7-8 cm/yr except between latitudes 31-33°S, where the rate is about 3.5 cm/yr (Fig. 6b). In the latter area, crustal heating and expansion above the hotspot could be expected to increase significantly. Local uplift, based on an existing hotspot theory proposed by Wellman and McDougall (1974), is invoked to explain the dipping nature of Si in the vicinity of 33-36°S; we make no independent contribution to the debate on the origin of hotspot traces (e.g. Pilger 1982; Sutherland 1981). Values for uplift in the model are derived from the attitude of S, (Fig. 2c). It slopes at about 75 m/degree latitude, which represents an uplift rate of c. 50 m/Ma for a plate migrating at 7 cm/yr. If we arbitarily assume that an area of 5° latitude (560 km) in diameter is affected by hotspot heating and uplift, then the total uplift will be about 200 m at a plate migration rate of 7 cm/yr, and 400 m at a slower migration rate of 3.5 cm/yr. In the former case the effect of the hotspot ceases in 8 Ma (4 Ma uplift followed by 4 Ma subsidence); in the latter case the hotspot takes twice as long to pass. We assume that underplating
129
may also occur so that, after the hotspot passes, the crust subsided half as much as it rose. The rate of uplift adopted here is conservative; it is only about one quarter of that indicated by Bowden and Colhoun (1984) to have possibly occurred during the Quaternary in northern Tasmania. MODEL APPLICATION For a given interval of time (2 Ma in the model), net sedimentation trends are calculated at each degree latitude by summing the values for passive margin subsidence (PMS) (+ ve), palaeo-sea level change (PSL) (-ve) and the effect of local tectonism (LT) (uplift -ve/ subsidence+ ve). Since water depth at the outer shelf is assumed to have remained approximately constant whether sediment was accreting or eroding, it is ignored in the model computations. The model can be expressed: Net Accretion/Erosion = PMS ± PSL ± LT. Absolute values are not presently known for any of the three parameters on which the model is based (PMS, PSL and LT). In their absence, 'reasonable' ranges of values have been selected for each parameter. Various combinations of these values have been computed to determine theoretical sedimentation histories for the outer shelf between 24° and 38°S. A typical worksheet in Figure 7a illustrates the method used to determine the depositional history at a single location - in this case 34°S latitude. Column 1 lists geological time at 2 Ma increments between 32 and 0 Ma. Column 2 shows the net change in PSL each 2 Ma and, in this example, is derived from the curve of Vail et al (1977). A constant rate of PMS (25 m/Ma) is shown in column 3. The effect of the hotspot, which is assumed to have induced 200 m uplift followed by 100 m subsidence at 34°S between 12 and 0 Ma ago, is shown in column 4. The net sea bed change (column 5) for each time interval is determined by summing columns 2, 3 and 4. Progressive changes with time are tabulated in column 6 and are shown graphically in Figure 7b. Here accretional shelf
130 B.G. Thorn & P.S. Roy Column
(a)
2
1
J
o a>
E i—
4
5
1E
'ECO "O»—» + a> a> cm co cn • OJ (TJ a> - c o ^ j oo o — +
3
_u 00
CO
S2
a.
-105
+50
-55
+30
+50
+80
+80
+50
+130
+50
+50
+100
-60
+50
-10
+50
+50
+100
+80
+50
+130
+70
+50
+120
-30
+50
+20
13
a> ®
in
-IS r-' 4-> O ctjxj a> o r— a> cn 3 -O c E E fl fl O 3 0) -C 4O «/» O «•-
32 30
-55
28
+25
26
+155
24
+225
22
+215
20
+315
18
+445
16
+565
14
+585 -80
+50
-80
+50
-40
-70
-30
12
+555
10
+485 -50
+50
-130
-130
-30
+50
-30
-10
+135
+50
+15
+200
-135
+50
+65
-20
8
+355
6
+345
4
+545
2
+525 +20
+ve = RSL rise = deposition -ve = RSL fall = erosion
(b)
Tim© (My) 30
(0 CO © c
o
£
i
4-600
10
20
i
i
i
i
i
i
i
r
n
"i—r
+400 20
?
+200
3
0 -200
VW
2/5
yw
6/19.5
vw 22/24.5 26 — 28
30+
L
F i g . 7 ( a ) An example of a work sheet showing how the sedimentation history is determined at a single point (in this case 34°S). Parameter values used in this example are: Vail et al (1977) palaeo-sea level (PSL) curve (column 2); a passive margin subsidence (PMS) rate of 25 m/Ma (column 3); and local tectonism (LT) that causes 200 m of uplift followed by 100 m of subsidence at times according to Figure 6b (column 4). Vertical changes for each parameter are given for 2 Ma time intervals between 30 and 2 Ma BP (column 1). Columns 5 and 6 are explained in text, ( b ) Cumulative sea bed changes (from column 6 in (a), are plotted graphically against time to show accretion and erosion trends. The sedimentation history is represented by a stratigraphic column showing sequences of continuous deposition (with their age structure) separated by erosional events (unconformities) caused by marine regressions.
Cainozoic shelf model for the Tasman Sea margin 131 sequences are seen to be the product of marine (a) transgressions; they suffer erosion during regressions which leave unconformities in the geological record marking minimum positions Cases B A c of sea level low stands. These data are expressed in a stratigraphic column showing Vail et Vail et Paltech Paleo SL al.,1977 depositional sequences, isochrons at 2 Ma al.,1977 1983 intervals and unconformities (Fig. 7b). Figure 8a represents the application of the PMS 15 25 20 model (as outlined in Fig. 7) to three cases (A, (m/Ma) B and C). Each case contains a discrete comA 200 i 200 k 200 LT bination of variables. For instance, cases A (m) and B use the global PSL curve of Vail et al t 100 t 2 0 0 t 100 (1977) and different rates of PMS, 25 and 20 m/Ma respectively. The LT component in both cases involves a total of 200 m of uplift, (b) but in case A the relaxation phase following uplift is only 100 m due to underplating. In 0 case B underplating is assumed not to occur. Case C uses a local PSL curve (Paltech data B - I. Deighton, pers. comm.), PMS rates of 100 15m/Ma and the same LT condition as case A. Data from the much more detailed PSL curve of Haq et al (1987) (Fig. 5) could not 200 be reduced satisfactorily to increments of 2 14 Ma, and to model at a finer time scale is not 300 warranted at this time. Other combinations of variables have been applied but are not illu26 strated in Figure 8. We consider that the three 400 VW cases represented in this figure provide sufficient range of parameter values to demon500 strate the method and to encapsulate the 24 conditions likely to have occurred during the v Tertiary. 23 600 In Figure 8b simplified stratigraphic colm umns representing four combinations of paraSandy Cap© DH meters have been constructed at 25 °S latitude, and compared with the nearby Sandy Cape drill hole using the Pleistocene/Pliocene contact (at -104 m) as datum. Elements of the Sandy Cape Drill hole that are important for Fig. 8 (a) Three cases (A-C) with different comparing the cases include erosional discon- parameter values have been selected to illustrate a tinuities at c. 104, 240 and 592 m and the range of possible stratigraphic patterns, (b) Using depositional intervals in between (Fig. 4). the methodology set out in Figure 7, each set of values have been modelled for conThese are thought to be of regional signi- parameter ditions at 25°S latitude. The resulting theoretical ficance and to reflect relative sea level depositional sequences (A-C) are compared to the changes: phases of semi-continuous sedimen- nearby Sandy Cape drill hole using sequence bountation terminated by long periods of erosion. daries discussed in the text.
I 11 V
V
V
V V
V
V
V
V
V
V
V
v
v
V
V
132
B.G. Thorn & P.S. Roy
In contrast, the lithological changes around 420 m are thought to be of only local significance. The outpouring and build-up of lavas at the coast (represented in the Sandy Cape bore by the interval 592-420 m) only temporarily interrupted a continuous marine transgression during the Early Miocene. Each case reproduces two main sediment units bounded by three erosion surfaces. These have somewhat different ages and thicknesses but can be correlated with similar events. The erosional unconformity at the base of the Tertiary sequence in the Sandy Cape drill hole (c. 590 m) is due to hotspot induced thermal uplift which prolonged erosion associated with a global recession in the Middle Oligocene. The sedimentation that followed began c. 23-36 Ma ago (depending on the case) and extended for more than 6-8 Ma; it represents the combined effect of posthotspot thermal relaxation (subsidence) and a global marine transgression spanning the Late Oligocene and Early Miocene. The erosional event that terminated this depositional cycle is correlated with the Late Miocene regression and is represented by the weathered zone at 209-245 m in the Sandy Cape drill hole. The model suggests that the uppermost depositional unit accumulated during a marine transgression in the Late Miocene, rather than in the Pliocene as determined by Palmieri (1984). It was followed by a global fall in sea level 2-5 Ma ago (the Messinian salinity crisis - Adams et al 1977), which corresponds to the inferred erosional event at the base of the Quaternary sequence in the drill hole (at c. 104 m) and is the datum used in the model. Variations in the three stratigraphies in Figure 8b illustrate some effects of different parameter values. Case A, using a PMS rate of 25 m/Ma, most closely approximates the stratigraphy of the Sandy Cape drill hole although it slightly underestimates the thickness of the lower unit. Even though case B has a lower PMS rate than A, it produces a thicker sediment pile. Presumably the absence here of underplating (LT uplift and
subsidence are equal) allows more sediment to accumulate during the post-hotspot relaxation phase. Case C shows that relatively slow rates of PMS (15 m/Ma) generate a thin lower sediment unit despite the same LT values as case. Simplified whole shelf stratigraphies, as defined by major unconformities, are shown for each case in Figure 9. The datum is a horizontal line that represents the sea bed at the end of the Pliocene; in most areas the model shows it to correspond to an erosional episode between 2 and 5 Ma (Fig. 7b). The dipping Si seismic discontinuity in the vicinity of 33-35°S (from Fig. 2c) has been superimposed on each case, but for the purposes of the modelling, basement morphology has not been included here. The relative 'success' of a particular case is judged by two factors: Cases
\ V
^
A
—
x
1
Sandy Cape DH
w
2 5
8 7
JM
— 1 4 Ane of
1
1
1
1
1
1
I I 17
I I I I I II
HHotsoot otspoT
3
I
6
I
I
9
L_
35°
2 10 4 _26
I I i i 21 23.5
Latitude I I I
30°
Seismic discontinuity S-,
J I 1-
I
I
V
I
I
' 26 L_ 500m
ModeBed unconformities Quaternary
sediments
Fig. 9 Simplified north-south sections modelled according to the parameter values listed in Figure 8a, showing along-shelf sediment units and bounding unconformities. Also shown are the Sandy Cape drill hole sequence and the dipping Si unconformity between 33° and 35°S latitude (from Fig. 2c).
Cainozoic shelf model for the Tasman Sea margin
(i) its ability to approximate the gross stratigraphy of the Sandy Cape drill hole; and (ii) to reproduce a dipping unconformity corresponding to Si. The dipping surfaces in Figure 9 that most closely correspond to Si are due to the combined effect of the main Miocene regression and the passage of the hotspot; the latter produces the inclination and the time-transgressive nature of the unconformity. A second and lower unconformity (cases A and B) is due to an earlier global sea level fall around 24-22 Ma. The effect of underplating in case A is to retard post-hotspot relaxation (subsidence) with the result that old sediments are predicted to crop out on the southern shelf - as in fact they do (see Fig. 3). In the absence of underplating (case B), the erosion surface subsides more quickly allowing Pliocene and Quaternary sediments to build up in the area south of 36°S. In many places in case C, the Neogene sequence produced by a PMS of 15 m/Ma is thinner than actually occurs beneath the outer shelf (cf. Fig. 2c). The basal unconformity in case C represents erosion between about 26 and 40 Ma. Prior to this time Figure 5 shows that, for a PMS rate of 15 m/Ma, the cratonic surface was exposed above contemporary sea level thus precluding time for additional marine sediments to accumulate. Of the three cases shown in Figure 9, A is most successful although this does not preclude other, and hitherto untested, sets of values producing similar results. In Figure 10, the pre-existing basement morphology from Figure 2c (a) is superimposed on the detailed stratigraphy of case A (which is reproduced in detail in (b)). The result is shown in (c), which highlights the overall pattern of Neogene stratigraphy that case A predicts. The model indicates that the dipping Si discontinuity of Davies (1975, 1979) is a timetransgressive erosional event ranging in age from 26-20 Ma at 29°S and 20-6 Ma at 35°S. It is not the same as the semi-conformable erosion surface (Si) of Marshall (1977) in northern NSW and southern Queensland, which
133
apparently is related to a Miocene (rather than Pliocene) regression about 17-8 Ma ago. This unconformity extends as far south as 31°S, but in the zone 31-35°S it is replaced by a sequence of continuous deposition between 18 and 5 Ma (Fig. 10b). This becomes younger towards the south and is presumably related to the much longer period of post-hotspot sedimentation that occurred in the vicinity of latitude 31-33°S, when plate migration slowed down to about half its rate at other times and the crust suffered greater heating and vertical movements. Also shown in Figure 10c (a)
35°S
30°S
25°S
17-8
. unconformities isochrons
Quaternary L. Miocene M. Miocene E. Miocene Oligocene
Fig. 10 The basic stratigraphic field data from Figure 2c(a) is most closely reproduced by case A (from Fig. 9b). This is shown in (b) with predicted isochrons at 2 Ma intervals, (a) and (b) are combined in (c) which shows the composite stratigraphy above cratonic basement. In the last 2 Ma we assume that the southern shelf has continued to erode and sandy Quaternary sediments have accumulated on the northern shelf.
134
B.G. Thorn & P.S. Roy
is the present sea bed morphology superimposed on the Pliocene datum. We assume that, for reasons mentioned earlier (see also Roy & Thom 1981a), there has been a mass northward transfer of sediment throughout the Quaternary. This has led to the pattern shown in Figure 10c of net long-term erosion in the south and, in the north, the build-up of a 100 + m thick pile of sand corresponding to the sequence intersected in the upper part of the Sandy Cape drill hole.
CONCLUSION The degree to which case A of the model approximates what is presently known about the geometry and geology of the sub-shelf deposits in southeastern Australia is encouraging, especially in regard to the role of local tectonism. The exposure of quite old Tertiary sediments on the southern NSW shelf is a direct result of uplift and erosion in the last 8 Ma or so, and it is hard to see how this phenomenon would not also effect the Southern Highlands. Certainly their greater relief and ruggedness (compared to the highlands further north) are features consistent with relatively recent tectonism. However, without more precise data against which to evaluate the model's performance, further refinements of the various parameter values are not warranted at this stage. A Middle to Late Miocene age is indicated by foraminifera in semi-consolidated muds recently dredged from - 450 m at latitude 36°20' S (I. Yasseni, pers. comm.; see also Packham 1983). This is somewhat younger than predicted, but the sample is from an upper slope outcrop seawards and down-dip from the section portrayed in Figure 10. The discrepancy between the model results and the faunal record interpreted by Palmieri (1984) in the zone 125-209 m of the Sandy Cape drill hole may be due to the coarseness of the time increments used in the model or to smoothing of the sea level curve of Vail et al (1977). However, the model results tend to be supported by the more detailed sea level
curve of Haq et al (1987). This shows that marine transgressions (and thus shelf deposition) predominated in the Late Miocene, in contrast to the Pliocene when the reverse was true and the shelf could be expected to be exposed to subaerial weathering. ACKNOWLEDGEMENTS The general concepts underlying this paper were devised with the help of Erwin Scheibner and first presented in 1981 (Roy & Thom 1981b). Comments received at this time from Hugh Jones, John Marshall and Jim Colwell encouraged us to persist with the modelling. We thank Ian Deighton for the use of the Paltech sea level data and John Veevers for his comments. We hope that the model results, which were obtained prior to the most recent advances in passive margin studies, nevertheless provide a useful conceptual framework within which new data from the southeast Australian shelf can be evaluated. The research was supported by the NSW Department of Mineral Resources.
REFERENCES ADAMS C.G., BENSON R.H., KIDD R.B., RYAN W.B.F. & WRIGHT R.C. 1977. The Messinian salinity crisis and evidence of late Miocene eustatic changes in the world ocean. Nature 269, 383-386. BISHOP P. 1988. The Eastern Highlands of Australia: the evolution of an intra-plate highland
belt. Progress in Physical Geography 12, 159-182. BOWDEN A.R. & COLHOUN E.A. 1984. Quaternary emergent shorelines of Tasmania. In
Thom B.G. ed. Coastal Geomorphology in Australia, pp.313-342. Academic Press, Sydney. CARTER A.N. 1979. Pliocene eustasy and the onset of sand barrier formation in Gippsland, Victoria. Nature 280, 131-132. CHAPMAN D.M., GEARY M., ROY P.S. &
THOM B.G. 1982. Coastal Evolution and Coastal Erosion in New South Wales. Coastal Council of New South Wales, Sydney. COLWELL J.B. & COFFIN M.F. 1987. Rig seismic research cruise 13: structure and stratigraphy of the north-east Gippsland Basin and southern New South Wales margin - Initial Report, May
Cainozoic shelf model for the Tasman Sea margin 1987. Division of Marine Geoscience and Petroleum Geology, Bureau of Mineral Resources, Geology and Geophysics, Australia. COLWELL J.B. & ROY P.S. 1983. Description of subsurface sediments from the east Australian continental shelf (Sonne Cruise SO-15). Record 83/21, Bureau of Mineral Resources, Australia (unpublished). COLWELL J.B., COFFIN M.F., PRICHARD T. & SPENCER R. 1988. Structure of southern New South Wales and northeast Gippsland Basin margins - results of Rig seismic research cruise 13. AbstractsNinth Australian Geological Convention. February 1988, University of Queensland, Brisbane. CULL J.P. 1982. An appraisal of Australian heat flow data. Bureau of Mineral Resources Journal Australian Geology and Geophysics 7, 11-21. DAVIES P.J. 1975. Shallow seismic structure of the continental shelf, southeast Australia. Journal of the Geological Society of Australia 22, 345-359. DAVIES P.J. 1979. Marine geology of the continental shelf off southeast Australia. Bulletin No. 195, Bureau of Mineral Resources, Geology and Geophysics, 51. DEIGHTON I., FALVEY D.A. & TAYLOR D.J. 1976. Depositional environments and geotectonic framework: southern Australian continental margin. The APEA Journal 16, 25-36. FALVEY D.A. & DEIGHTON I. 1982. Recent advances in burial and thermal geohistory analysis. The APEA Journal 22, 65-87. FALVEY D.A. & MUTTER J.F. 1981. Regional plate tectonics and the evolution of Australia's passive continental margins. Bureau of Mineral Resources Journal of Australian Geology and Geophysics 6, 1-29. GRIMES K.G. 1982. Stratigraphic drilling report - GSQ Sandy Cape 1-3R. Queensland Government Mining Journal 83, 224-233. GUIDISH T.M., LERCHE I., KENDALL C.G. St.C & O'BRIEN J.J. 1984. Relationship between eustatic sea level change and basement subsidence. American Association of Petroleum Geologists Bulletin 68, 164-177. HAQ B.U., HARDENBOL J. & VAIL P.R. 1987. Chronology of fluctuating sea level since the Triassic. Science 35, 1156-1167. HAYES J.D. & PITMAN W.C. 1973. Lithospheric plate motion, sea level changes and climatic and ecological consequences. Nature 246, 18-22. HAYES D.E. & RINGIS J. 1973. Seafloor spreading in the Tasman Sea. Nature 243, 454-458.
135
HELLER P.L., WENTWORTH C.M. & POAG C.W. 1982. Episodic post-rift subsidence of the United States Atlantic Continental margin. Geological Society ofAmerica Bulletin 93, 379-390. JENKIN J.J. 1984. Evolution of the Australian coast and continental margin. In Thom B.G. ed. Coastal Geomorphology in Australia, pp.23-42. Academic Press, Sydney. JENNINGS J.N. 1961. Sea level changes in King Island, Bass Strait. Zeitschrift fii Geomorphologie Supplementband 3, 80-84. JONES H.A. & DAVIES P.J. 1979. Preliminary studies of offshore placer deposits, eastern Australia. Marine Geology 30, 243-268. JONES H.A., DAVIES P.J. & MARSHALL J.F. 1975. The shelf break off southeast Australia. Journal of the Geographical Society of Australia 22, 71-78. JONGSMA D. & MUTTER J.C. 1978. Nonaxial breaking of a rift valley: evidence from the Lord Howe Rise and the southeastern Australian margin. Earth and Planetary Science Letters 39, 226-234. KUDRASS H.R. 1982. Cores of Holocene and Pleistocene sediments from the east Australian continental shelf (SO-15 cruise 1980) in von Stackelberg, U., Heavy Mineral Exploration of the East Australian Shelf, 'Sonne' Cruise SO-15,1980. Geologisches Jahrbuch Reise D., Heft 56,137-163. LISTER G.S., ETHERDIGE M.A. & SYMONDS P.A. 1986. Detachment faulting and the evolution of passive margins. Geology 14, 246-250. LISTER G.S., ETHERIDGE M.A. & SYMONDS P.A. 1988. Extensional history of the margins of the Tasman Sea. Abstracts, Ninth Australian Geological Convention, pp.252-253. February 1988, University of Queensland, Brisbane. McDOUGALL I. & DUNCAN R.A. 1988. Age progressive volcanism in the Tasman Sea seamount chain, a hotspot trace. Abstracts: Ninth Australian Convention, p.262. February 1982, University of Queensland, Brisbane. MARSHALL J.F. 1977. Marine geology of the Capricorn Channel area. Bureau of Mineral Resources Australia Bulletin 163. MARSHALL J.F. 1979. The development of the continental shelf of northern New South Wales. Bureau of Mineral Resources Journal of Australian Geology and Geophysics 4, 281-288. MARSHALL J.F. & DAVIES P.J. 1978. Skeletal carbonate variation on the continental shelf of eastern Australia. Bureau of Mineral Resources Journal of Australian Geology and Geophysics 3, 85-92.
136
B.G. Thorn & P.S. Roy
ORFORD J. 1987. Coastal processes: the coastal response to sea-level variation. In Devoy R.J.N, ed. Sea Surface Studies - A Global View, pp.415-463. Croom Helm, London. PACKHAM G.H. ed. 1969. The geology of New South Wales. Journal of the Geological Society of Australia 16. PACKHAM G.H. 1983. Morphology and acoustic properties of the NSW slope with special references to the Coffs Harbour - Point Plommer and Montague Island - Green Cape areas. Ocean Sciences Institute Report No. 1 (unpublished), University of Sydney. PALMIERIV. 1984. Neogene foraminiferida from GSQ Sandy Cape 1-3R bore, Queensland: a biostratigraphic appraisal. Palaeogeography, Palaeoclimatology, Palaeoecology 46, 165-183. PILGER R.H. Jr. 1982. The origin of hotspot traces: evidence from eastern Australia. Journal Geophysical Research $7 (B3), 1825-1834. RINGIS J. 1972. The structure and history of the Tasman Sea and the southeast Australian margin. Ph.D. Thesis, School of Applied Geology, University of New South Wales (unpublished). ROY P.S. 1985. Marine sand bodies on the South Sydney shelf, S.E. Australia, Coastal Studies Unit, Technical Report No. 85.1. Department of Geography, University of Sydney. ROY P.S. & FERLAND M.A. 1987. Seismic results from the inner continental shelf of the Shoalhaven/Jervis Bay/Ulladulla region, Southern NSW - a progress report. Geological Survey of New South Wales, Report GS 1987/091 (unpublished). ROY P.S. & HUDSON J.P. 1987. Seismic results from the continental shelf, Southern NSW: Narooma-Montague Island - Bernagul. Geological Survey of New South Wales. GS 1987/094 (unpublished). ROY P.S. & THOM B.G. 1981a. Late Quaternary marine deposition in New South Wales and southern Queensland - an evolutionary model. Journal of the Geological Society of Australia 28, 471-489. ROY P.S. & THOM B.G. 1981b. Late Cainozoic sedimentation patterns on the S.E. Australian margin. Abstracts of Fifth Australian Geological Convention, Perth, August 1981. ROYDEN L. & KEEN C.E. 1980. Rifting process and thermal evolution of the continental margin
of eastern Canada determined from subsidence curves. Earth and Planetary Science Letters 51, 343-361. SAWYER D.S., SWIFT B.A., SCLATER J.G. & TOKSOZ M.N. 1982. Extensional model for the subsidence of the northern United States Atlantic continental margin. Geology 10, 134-140. SCLATER J.G., ANDERSON R.N. & LEEBELL M. 1971. Elevation of ridges and evolution of the central Eastern Pacific. Journal of Geophysical Research 76, 7888-7914. SHAW R.D. 1978. Seafloor spreading in the Tasman Sea: A Lord Howe rise - eastern Australian reconstruction. Bulletin Australian Society of Exploration Geophysics 9, 75-81. SHERIDAN R.E. 1981. Recent research on passive continental margins. Society of Economic Palaentologists and Mineralogists Special Publication 23, 39-55. SUTHERLAND F.L. 1981. Migration in relation to possible tectonic and regional controls in eastern Australian volcanism. Journal of Volcanology and Geothermal Research 9, 181-213. VAIL P.R., MITCHUM R.M. Jr & THOMPSON S. Ill 1977. Seismic stratigraphy and global changes of sea level, Part 4: Global cycles of relative changes of sea level. In Paton C.E. ed. Seismic stratigraphic - applications to hydrocarbon exploration. American Association of Petroleum Geologists, Memoir 26, 516. VOGT P.R. & CONOLLY J.R. 1971. Tasmantid guyots, the age of the Tasman Basin, and motion between the Australian plate and the mantle. Geological Society of America Bulletin 82,257-264. VON STACKELBURG V. ed. 1982. Heavy mineral exploration of the east Australian shelf. 'Sonne' Cruise SO-15, 1980. Geologisches Jahrbuch, Reise D, Heft 56, 215. WELLMAN P. 1983. Hotspot volcanism in Australia and New Zealand: Cainozoic and midMesozoic. Tectonophysics 6, 225-243. WELLMAN P. & McDOUGALL I. 1974. Cainozoic igneous activity in eastern Australia. Tectonophysics 23, 49-65. WRIGHT L.D. 1976. Nearshore wave-power dissipation and the coastal energy regime of the Sydney - Jervis Bay region, New South Wales: a comparison. Australian Journal of Marine and Freshwater Research 27, 633-640.
Oligocene-Miocene marine incursions in the Latrobe Valley depression, onshore Gippsland Basin: evidence, facies relationships and chronology G.R. HOLDGATE1 AND I.R.K. SLUITER2 1
State Electricity Commission of Victoria, Fuel Department, Geo-Engineering Division, Morwell, Victoria 3840, Australia. department of Geography and Environmental Science, Monash University, Clayton, Victoria 3168, Australia. The Latrobe Valley Depression situated on the westerly margin of the onshore Gippsland Basin contains a thick sequence of Tertiary sediment infill which includes the economically important Morwell and Yalloura coal seams. Sedimentation is traditionally considered to have been non-marine, although recently, dinoflagellate and foraminiferal evidence for marine and brackish water incursions as far west as Loy Yang have been discovered. These new fossil finds occur in a series of clay lithofacies which interbed with the Morwell Formation coal seams east from Loy Yang. The clays represent a paralic facies deposited in a complex of littoral environments including estuarine tidal flats, lagoons and lakes, in a manner possibly akin to the present day Gippsland Lakes. Five major interseam events are recognised which relate to the principal coal seam boundaries of the Morwell Formation. More numerous (approximately seventeen) clay partings or incursions of lesser amplitude have been identified by correlation of the clay lithofacies units within drillhole crosssections across the Latrobe Valley Depression. Pollen analysis of Morwell Formation coal seams at Loy Yang by Sluiter (1984) and of basinwide sediments by Partridge (1971) and Stover and Partridge (1973) has provided the framework on which a depositional chronology for the Late Oligocene to Early Miocene is based. Throughout the deposition of the Morwell IB seam (c. 30-23 million years BP), eight marine incursions of varying amplitude are recognisable and correspond to two major interseams and six other partings. The resulting record of eustatic sea level fluctuations is compared with the coastal onlap chronology of Haq et al (1987) and similarities and differences noted. Key words: coal seams, coastal onlap, facies relationships, fossils, Latrobe Valley, pollen analysis, sea level chronology.
INTRODUCTION
marine and brackish water conditions at times within the Latrobe Valley Depression and proposes a dynamic palaeoenvironmental model, related to fluctuations in eustatic sea level, to explain the facies variation. A chronology of palaeoenvironmental change is presented and a comparison made with the coastal onlap chronology for the same depositional period documented by Haq et al (1987).
The Latrobe Valley Coal Measures (Thomas & Baragwanath 1949; Gloe 1960, 1967, 1975) are a sequence of laterally extensive coal seams, clastic sediments and volcanics deposited in the Latrobe Valley Depression (Fig. 1). Apart from the controversial findings of marine foraminifera by Crespin (1945) (Carter 1964; and this paper), and the single record of very rare unidentified dinoflagellates by Partridge (1971) in the Rosedale 1 bore on the easterly or seaward margin of the depression (Fig. 2), no other evidence for either marine or marginal marine sedimentation exists. This paper presents evidence from fossils for the more widespread and common occurrence of marine, marginal
GEOLOGY Regional Setting The Latrobe Valley Depression is situated in the central part of the western flank of the onshore Gippsland Basin. It is bounded to the north by the Eastern Highlands (Fig. 1). The 137
138
I.R.K. Sluiter & G.R. Holdgate
eastern margin merges with the Lake Wellington Depression, with the boundary between them placed at the limit of open marine Tertiary carbonate sedimentation (Hocking et al 1976). 2 Present Address: Department of Conservation, Forests and Lands, Mildura, Victoria 3500, Australia.
The Tertiary infill within the depression comprises brown coals, clays, sands and volcanics up to 700 m thick over a Mesozoic and Palaeozoic basement. On the flanks of the Traralgon Syncline the subcrop of the major coal seams of the Yallourn and Morwel Formations are overlain uncomformably by the Pliocene Haunted Hill Formation and are mainly absent due to erosion on the Baragwanath Anticline (Fig. 2). The most complete EASTERN
sequences occur in the Traralgon Syncline and towards the Latrobe River. The relationship between these formations and the marine Gippsland Limestone and Lakes Entrance Formations is displayed on an east-west cross section (Fig. 3). The thick sand sequences immediately west of the limestone wedge are known as the Balooka Formation, which is considered to represent a stable barrier system which isolated the Morwell and Yallourn coal swamps from marine influence (Thompson 1981). Stratigraphy The sequence of Tertiary strata within the Latrobe Valley Depression comprise the basal Middle Eocene to Early Oligocene Traralgon Formation overlain by the Early Oligocene to
HIGHLANDS
BASIN
BAIRNSDALE
Fig. 1 Locality map of the Latrobe Valley Depression.
Oligocene-Miocene marine incursions, Latrobe Valley
Early Miocene Morwell Formation and the late Early Miocene to Middle Miocene Yallourn Formation (Smith 1982). The dominant features of sedimentation within the Latrobe Valley Depression are seams of brown coal up to 100 m thick with the coal clastic sediment ratio diminishing toward the easterly seaward margin. The Morwell Formation contains the major economic reserves of coal in the Latrobe Valley (18,862 m \ Gloe
139
1980) and is used as a fuel source, for electricity generation, from open cut mines at Loy Yang, Morwell and North Yallourn Extension. It is within the interseam sediments of the Morwell Formation that fossils indicative of marine and marginal marine sedimentation have been found. Consequently, the focus of the ensuing discussion is on this depositional phase.
Fig. 2 Major structures and Yallourn-Morwell Formation subcrop map, onshore Gippsland Basin.
NOT TO SCALE
Fig. 3 Diagrammatic geological section from Thorpdale to Lake Wellington, showing stratigraphic units and their relationships.
140
I.R.K. Sluiter & G.R. Holdgate
Morwell Formation The Morwell Formation is a complex sequence of predominantly thick coal seams and clay sand facies. It is confined to that part of the onshore Gippsland Basin west of the sand barriers of the Balook Formation, which is considered to mark the maximum point of marine transgression for the Gippsland Limestone Formation (Hocking et al 1976). The Morwell Formation extends across the Latrobe Valley Depression and grades as its western end into the Thorpdale Volcanics in the Moe Swamp Basin. It is dated palynologically by the occurrence of the Lower, Middle and Upper Proteacidites tuberculatus spore pollen Zone as Early Oligocene to Early Miocene, with a maximum age independently determined by radiometric (KAr) dating of the basal and interbedded lavas of the Thorpdale volcanics. These latter KAr dates fall into two categories, with six dates in the range 20.7-26.1 Ma, and four dates in the range 85.2-90.6 Ma (McKenzie et al 1984). The latter dates are considered by these authors to be anomalous and lie between the Morwell Formation and Lower Cretaceous basement. Although the 20.7-26.1 Ma Late Oligocene to Early Miocene basalt dates agree fairly closely with those derived from volcanic suites analysed from the Warragul Block in the Southeastern Highlands by Wellman (1974) as 19-24 Ma, the occurrence of several anomalous dates must cast some doubt on the ability of this method to produce reliable maximum dates for the commencement of Morwell Formation sedimentation within the region. Consequently, until the problems with the radiometric dating are resolved, this study adopts the chronostratigraphic framework suggested on palynological grounds. The Morwell Foundation is divided into two major coal seams - the Morwell 1 (Ml) and Morwell 2 (M2) seams, which in the eastern half of the Latrobe Valley Depression are further subdivided into the MIA, M1B, M2A, M2B and M2C seams (Fig. 4). Collectively, over 250 m of continuous coal can occur in some areas, such as immediately west of Loy Yang. Continuously cored sequences from all five
Morwell coal seams and the Yallourn Seam have been quantitatively analysed for palynological content (Sluiter & Kershaw 1982; Kershaw & Sluiter 1982; Sluiter 1984; Kershaw etal in press), with the most detailed information existing for the M1B and MIA seams. A correlation of two cores with continuous sequences of M1B seam coal - LY1275 and LY1276 - situated near Loy Yang, is illustrated in Figure 5. The darkened areas represent periods of increase in pollen of Myrtaceae and Elaeocarpaceae which occur at the expense of the pollen of the normally dominant Nothofagidites form taxa. This has been interpreted by Sluiter (1984, in prep.) to occur during phases of pronounced interseam influence within the Latrobe Valley, in response to an increase in palaeotemperature linked to probable eustatic sea level rises. Eight interseam influence zones (IIZs) have been highlighted on Figure 5, with IIZ1 and IIZ 8 corresponding to the M1B/M2A and M1A/M1B interseams respectively. IZZs 2 (A and B), 3, 4, 5, 6 and 7 are suggested to represent less significant transgressive events. It is believed that eight clay interseam partings in M1B coal seam near the marine Seaspray Group can be traced westwards from this boundary and that they are contemporaneous with the eight interseam influence zones. Hence they are also numbered respectively 1 to 8 on Figure 4. The significance of each of these is outlined later. Interseam sediments of the Morwell Formation vary in style. In the western half of the Latrobe Valley Depression, the dominant lithology is a light-coloured kaolinitic clay sequence up to 100 m thick showing relatively poor bedding or structure. They form both a facies equivalent to, and regional interseams partings between, the major coal seams. Sands are poorly represented except on the major seam boundaries. They form sheets and channel-like sand bodies of medium to coarse sand. The clays are interpreted as deposits of predominantly freshwater lacustrine environments surrounding the coal swamps, with intermittent widespread fluvial incursions during the major interseam periods (Holdgate 1985).
Oligocene-Miocene marine incursions, Latrobe Valley141 In the eastern half of the Latrobe Valley Depression, the style of interseam sedimentation changes. The clays here are readily distinguished both in outcrop and core from those in the west. They are darker grey, siltier, and show pronounced bedding, fine lamination, bioturbation and are more micaceous (Bolger - this volume). Interbedding with the more massive clays are thin bioturbated and massive or planar cross-bedded sand bodies with laminated, cross-bedded, bioturbated silts. Soft sediment deformation, load casting and microfaulting are often present in the clay units. Dinoflagellates, arenaceous foraminifera and uniodid bivalves are present in the more massive clay units particularly east of Loy Yang. Interseams and partings east of Loy Yang are more regional, subdividing the coal seams to a greater extent (Fig. 4). Individual clays thicken rapidly to the east by the progressive inclusion of medium to fine grained sand bodies, as shown on the bore hole section of Figure 4. A typical interseam LOY
east of Loy Yang comprises a 1-5 m thick dark grey clay unit resting with sharp contact upon a coal seam below. The clays then grade up through fine silty clays, silty sands and into medium grained sands over about a 5-25 m interval. The medium grained sands may then grade either into further clay and silty clay units 1-5 m thick which underlie the next seam above, or directly into coal. In the former case root burrows from the overlying coal seam floor extend down into the top of the underlying clay units. In the latter case, the upper sandy beds contain finely disseminated organic matter and grade up through sandy coal into pure coal over a 1-5 m interval. Where the coals pinch out near the marine interface, the sand units coalesce to form a stacked series of sand bodies over 400 m thick, known as the Balook Formation. Thin clay beds separate the sand bodies into approximate 10-60 m thick packages. Both clays and sands grade eastwards into limestones and marls. SALE
ROSEDALE
YANG
SECTION SHOWING F A U E S RELATIONSHIPS B E T W E E N MORWELL FORM A T I O N . BALOOK FORMATION ANO THE S E A S P R A Y GROUP
OmfflSSmLr 0 UTHOFACIES FINE T
*CTE HONS
s S SL , jIKS&Vm'
£"3
Fig. 4. Geological cross section on Figure 1 through the central part of Latrobe Valley Depression, showing facies relationships between the Morwell and Balook Formations and the Seaspray Group.
142
I.R.K. Sluiter & G.R. Holdgate
PALAEONTOLOGY OF THE CLAY LITHOFACIES Examination of cores through the clay lithofacies from the Morwell Formation east of Loy Yang has shown the presence of marine dinoflagellate cysts, arenaceous foraminifera and uniodid bivalves. In this section, the fossils recovered and their environmental significance are outlined. Dinoflagellate Cysts Fossil dinoflagellates are the cysts of microscopic planktonic algae which today and in the geological past occur in a range of aquatic habitats (Dodge 1985). The dinoflagellate cysts found in the Morwell interseam clay lithofacies are typical marine indicators, most of which can be compared with previously described taxa. The best dinoflagellate assemblages have to date been recorded from the following core samples:
Rosedale 324 - 200.0 m Very rare occurrence (< 1%) in a clay parting in the upper part of the MIA seam coal - 3 taxa. Rosedale 324 - 217.2 m Rare presence (1%) in a clay parting within the middle of the MIA seam coal - 4 taxa. Rosedale 324-235.0 m Rare to fairly common presence (2°7o) in a clay parting within the lower part of the MIA seam coal - 3 taxa. Rosedale 324-291.1 m Fairly common presence (4%) in a clay unit at the base of the interseam split separating the MIA and M1B coal seams (IIZ 8) - 4 taxa. LY 220.0-57.3 m Fairly common presence (2-3%) in a silty clay at the base of the interseam split separating the M1B and M2A coal seams (IIZ 1) - 12 taxa. A total of fourteen different taxa have been recorded (Plates 1-5), but unfortunately all are fairly long ranging Tertiary morphotypes with limited stratigraphic value. A full author reference and taxonomic notes on each genus and species can be found in Lentin and Williams (1985).
Fig. 5 Correlated quantitative stratigraphic pollen diagrams of selected taxa and taxon groups irom cores LY 1275 and LY 1276. The darkened areas represent phases of Myratacea and Elaeocarpaceae pollen increase at times of significant interseam influence within the Latrobe Valley Depression.
Oligocene-Miocene marine incursions, Latrobe Valley
143
EXPLANATION OF PLATES Unless otherwise specified, all figures on Plates 1-5 are of marine dinoflagellates at x 870 magnification recorded from a core sample at 57.3 m from drillhole LY 2200.
Plate 1, Figures 1-3. Apteodinium australiense. The specimen illustrated as Figure 2 was recorded from a core sample at 217.2 m from drillhole R 324.
144
I.R.K. Sluiter & G.R. Holdgate
ik^f P$
m
x
i
k* 5a
v »
5b
Plate 2, Figures 1-3. Dapslidinium pastielsii . Figures 3-6. Operculodinium centrocarpum. N.B. Figures 5a and b are single opercula plates 3. The specimen illustrated as Figure 6 was recorded from a core sample at 235.0 m from drillhole R 324.
Oligocene-Miocene marine incursions, Latrobe Valley
Plate 3, Figure 1. Glaphyrocysta sp. Figure 2. Hystrichokolpoma rigaudiae.
146
I.R.K. Sluiter & G.R. Holdgate
Plate 4. Figure 1. Reticulatosphaera stellata. Figure 2. Pterodinium sp. Figure 3. Impagidinium sp. Figure 4. Pentadinium sp. cf P. Iaticinctum. This fossil was photographed at X435 magnification and was recorded in a core sample at 291.1 m from drillhole R 324.
Oligocene-Miocene marine incursions, Latrobe Valley
>
v
\
U l >\
i-
,
:
T
)
4a
4c
4b I »s Jv
Si
Plate 5, Figure 1. Pterodinium cingulatum. Figure 2. Spiniferites microceras. Figure 3. Spiniferites sp. cf 5. ramosus. Figure 4. Spiniferites bulloideus. Figure 5. cf Spiniferites pseudofurcatus.
.
fex
S
I
h
'
" ^ t e ' v
148
I.R.K. Sluiter & G.R.
Holdgate
Plate 6, Figure 1. Numerous specimens of the arenaceous foraminifera Ammodiscusparri in a core sample from drillhole LY 2100 at 148.7 m. Figure 2. Specimens of the mussel bivalve cf Hydridella sp. in core samples from drillhole W 51 at 578.2 m (a) and 653.6 m (b). Figure 5. Specimens of the bivalve cf Corbicula sp. in core samples from drillhole TS 43 at 444.0 m (a) and W 51 at 570.1 m (b). Figure 4. A leaf of Nothofagus sp. in a core sample from drillhole W 51 at 647.2 m.
Oligocene-Miocene marine incursions, Latrobe Valley
Arenaceous Foraminifera East of Loy Yang, foraminiferal tests of Ammodiscusparri (Crespin 1950, Plate 6, Fig. 1) have been found in all the main interseam clay lithofacies. In situ recognition of the tests depends on their degree of preservation which varies from poor to good. The tests usually disintegrate if the sample is washed free of clay, and therefore are best viewed in situ. They tend to concentrate in thin silty clay or clay layers usually less than 0.2 m thick, particularly just above the coal seams. Whilst specimen densities vary, up to 20-30 individuals can be recognised in split bore core 4.5 cm wide. Between Rosedale and Loy Yang, A. parri occurs in five bores in the Ml A-M1B interseam, one bore in the M1B-M2A interseam, five bores in the M2A-M2B interseam, seven bores in the M2B-M2C interseam and two bores in the M2C top Traralgon Formation interseam (Fig. 6). No other foraminiferal species have been found including the species of calcareous planktonic and benthonic foraminifera, Anthozoa and Bryozoa described by Crespin (1945) from Latrobe Valley sediments. To analyse why these species have not since been found, a recent examination of SEC bore records indicated that at Loy Yang, Crespin's sample 'J' comes from the Pliocene Haunted Hill Formation, sample 'L' from the M1A-M2A interseam, and sample 'O' from the M2B-M2C. Of these four, only 'O' contains brackish marine species (Cyclammina sp.) consistent with the ecological range of A. parri, whilst the other three samples contained open marine species unlikely to occur in these sediments. Her samples all came from the Morwell to Boolarra area where clay lithofacies associated with the marine incursions do not occur. These findings created some controversy at the time, and the original material has not been available for examination since Carter (1964). However, her conclusions from these findings that the Morwell and Yallourn Formations were equivalent in age to the Seaspray Group were later substantiated (Partridge 1971). Whilst it is not the present authors'
149
intentions to question Crespin's findings, it remains a mystery to us as to why her species findings have not been reported since. We do, however, believe that other calcareous foraminifera could conceivably be associated with A. parri but may not be preserved due to the action of acidic ground waters. The presence of numerous specimens of A. parri in interseams of the eastern half of the Latrobe Valley Depression is suggested to indicate their deposition under marginal marine to brackish water conditions (C. Abele, pers. comm.). Uniodid Bivalves Species of the mussel bivalve cf. Hydridella sp. (Plate 6, Figs. 2a and 2b) and the bivalve cf Corbicula sp. (Plate 6, Figs. 3a and 3b) have been identified by T. Darragh (National Museum of Victoria) from core of the clay lithofacies. Numerous specimens have been found in bore core from the M2A-M2B and M2B-M2C interseams west of Rosedale. They are most prolific in the clay lithofacies directly underlying the coal seams, but do not occur at the same stratigraphic levels as the dinoflagellates or foraminifera. Specimens of cf. Hydridella have also now been in the M1-M2 interseam at Morwell Open Cut, indicating they are widespread throughout the Latrobe Valley Depression. The presence of both valves indicates their in situ preservation, and in the case of cf Hydridella the shells exhibit post-depositional microcracks due to sediment loading. Specimens range from 1.0 to 4.5 cm in length. Modern Hydridella and Corbicula are freshwater genera and it is possible their presence in the clay lithofacies indicates similar conditions in the Tertiary (T. Darragh, pers. comm.). Very rare unidentifiable shell fragments, possibly of crustacea, also occur in association with the bivalves. SULPHUR IN COAL AND THE CLAY LITHOFACIES East of Loy Yang, where clay interseams and partings interbed with coal seams of the Morwell Formation, the analysed organic sulphur content for the coal seams is higher
150
I.R.K. Sluiter & G.R. Holdgate
:Limi::0K:THtCK: NWTAGT^EAM::
ORWELL
M 1 A - M 1B INTERSEAM FACIES
M1B - M 2 A INTERSEAM FACIES
mm M2A-M2B INTERSEAM FACIES
LEGEND CONTINUOUS COAL SWAMP
NONMARINE
I I
1 1
K
MORWELL
M2B - M2C
®
N
MIXED
THIN PARALIC
M U D AND
SAND
M
INTERSEAM FACIES
FLUVIAL-LACUSTRINE C L A Y S AND S A N D S A R E A S OF NON D E P O S I T I O N OR EROSION
FED
LITH0FACIES
MUD
LITHOFACIES
FACIES
THICK MUD LITHOFACIES SAND
MARINE FACIES
INJJ^
BORE
MORWELL
M2C - TopTraralgon INTERSEAM FACIES
-F
LITHOFACIES
LIMESTONE, MARL
FOSSIL LOCALITIES
AMMODISCUS
PARRI
•
HYDRIDELLA
CF AND
*
DINOFLAGELLATE
SCALE
Fig. 6 Palaeoenvironment maps for Morwell Formation interseam sediments.
L_
C O R B I C U L A CF
SPECIES
Oligocene-Miocene marine incursions, Latrobe Valley in the top several metres of the seam. A typical example occurs in bore LY 1194, where detailed continuous sampling at 0.5 m intervals showed sulphur content increasing from an average value of 0.3% within the M2B, M2A and M1B seams up to 0.97% within the top 3 m of each seam, and that the interseam clays contained up to 6.5% sulphur content.
151
DISCUSSION Vertical Facies Variations
Regionally, sulphur content at the top of each of the Morwell Formation coal seams progressively increases going east from Loy Yang to Rosedale. Composited 3 m interval coal samples show sulphur values in the top 3 m of each coal seam exceeding 3.0% in some cases, whereas sulphur values for the remainder of the coal seams generally do not exceed 0.4%. These sulphur 'kicks' always occur beneath the clay lithofacies which contain fossils, and therefore can be a reliable guide to the existence of an overlying clay lithofacies where interseam core may not be available.
East from Loy Yang, six major interseam events can be recognised which relate to the following principal interseam boundaries: Yallourn - MIA; M1A-M1B; M1B-M2A; M2A-M2B; and M2B-M2C. Their facies distribution is shown on Figure 6. The situation with respect to the M2C - Traralgon interseam is very complicated with several clay lithofacies recognisable, and is generalised in this figure. The significance of this is as yet unknown as palynological studies of this interval are at a preliminary stage only. Numerous other partings and splits of lesser regional extent occur nearer the marine boundary (Fig. 4) and subdivide the coal seams even further. Two of the six major interseams (M1A-M1B and M1B-M2A) and six lesser partings comprise the eight interseam influence zones (see Figs. 4 and 5).
One exception occurs in the M1B coal seam at Loy Yang where a sulphur kick up to 0.80% is not in direct contact with an interseam. However this kick can be traced in analysed coal for 20 km east to a clay lithofacies split. This is shown as a dashed line through the coal and is equivalent to IIZ 5 on Figure 5.
From their fossil content, geometry and facies relationships, the clays for each interseam and parting are interpreted to represent a paralic facies deposited during marine transgressive periods as a complex of littoral environments, including estuarine tidal flats, lagoons and lakes, in a manner possibly akin to the present day Gippsland Lakes.
Increases in organic sulphur in coal have been previously considered indicative of proximity to marine conditions (e.g. Suggate 1959; Home et al 1978). Moreover Kiss et al (1985) considered sulphates derived from marine waters to be the source for the in situ production of reduced sulphur minerals and their subsequent incorporation in the reactive coal matrix. The sulphur kicks at the top of the coal seams may indicate downward sulphur migration from the overlying clay lithofacies, probably at the time of marine transgression over the peat swamp. The sulphur kick (IIZ 5) within the M1B coal seam indicates a marine water incursion onto the peat swamps without the accompanying deposition of a widespread clay lithofacies.
Each clay lithofacies grades seawards, or is overlain by a fine to medium grained sand and lignitic sand lithofacies interpreted to represent a complex of barrier, estuarine, tidal and deltaic environments, deposited at the same time as or shortly after the initial transgression. As these sands can extend for up to 30 km inland, depending on the amplitude of the sea level oscillations, the concept of a barrier system fixed in the one area throughout the Late Oligocene and Early Miocene (Thompson 1981) is no longer tenable. A more dynamic model is proposed where marine to marginal marine transgressive deposits (related to high eustatic sea levels) flooded over 'outer' barrier sands and former coastal swamps up to a distance of 30 km inland. Gradual stabilisation by a series of 'inner'
152
I.R.K. Sluiter & G.R.
Holdgate
sand barriers allowed upward desalinisation and sediment infill of the backbarrier littoral to supralittoral systems, eventually leading to re-establishment of the coastal and near coastal swamp vegetation and the 4 outer' barrier system. This cyclic effect occurred repeatedly (up to 22 times) throughout the depositional period of the Morwell Formation. Regional Palaeoenvironments Figure 6 depicts five palaeoenvironment maps for the major interseams of the Morwell Formation. Similar maps could also be produced for the smaller events. These are based on over 30 fully cored holes in the Latrobe Valley Depression. Deposition of the major facies units and fossil occurrences varies within each interseam, probably dependent on factors such as the amplitude of sea level oscillation, differential compaction of the underlying coastal swamps, and availability and relative proportion of mud and sand to the depositional environment. In stratigraphic order the major interseams comprise the following: (i) The Morwell 2C-Traralgon Interseam. The interseam between M2C and top Traralgon Formation is a complex one including at least two major periods of transgression, both of which extend at least as far as Loy Yang and possibly further west. At Loy Yang the M2C coal is split into a number of subseams (Fig. 4). The palaeoenvironment map depicts a 20-25 km wide zone of sand barriers with thin clay beds, behind which occurs a belt of thick littoral clay lithofacies up to 5 km wide. West of Loy Yang and Traralgon this grades into non-marine fluvio-lacustrine clays and sands which also reoccur in these areas during the subsequent interseam periods. Continuous swamps during this interseam time were restricted to a small area between Traralgon and Yallourn. Non-deposition or erosion, with the exception of the Gormandale Syncline, removed most sediment of this age on the Baragwanath Anticline. Bore fossil localties include two occurrences of foraminifera and one of bivalves.
(ii) The Morwell 2B-2C Interseam. The interseam between M2B and M2C is broadly similar in facies distribution to the M2CTraralgon interseam. Areas of thick clay are largely replaced by mixed sand and clay, possibly derived as deltaic inputs to the littoral systems. Seven foraminifera and two bivalve bore fossil locations have been found. This interseam transgressed about 10 km over the underlying M2C coal swamp. (iii) The Morwell 2A-2B Interseam. The interseam between M2A and M2B shows a major expansion of the thick littoral clays and a corresponding decrease in the sand barrier width. A narrow zone of thin clay facies occurs on the landward side of the littoral system. Mixed sand and mud cover the central-northwestern area. Five foraminifera and three bivalve bore fossil locations are known on the western side of Loy Yang and at Morwell-Yallourn, in an area of predominantly fluvio-lacustrine sedimentation. This interseam transgressed up to 10 km inland over the underlying M2B coal swamp. (iv) The Morwell 1B-2A Interseam. The interseam between M1B and M2A consists mainly of a sand barrier system with a small clay area near Loy Yang. This sand layer constitutes a significant stratigraphic and groundwater marker horizon over the eastern half of the Latrobe Valley Depression. One each of foraminifera and dinoflagellate bore fossil locations are known. This interseam transgressed some 15-20 km inland over the underlying M2A coal swamp. Areas of continuous swamp deposition are restricted to the west of Loy Yang and near Yallourn, in the nonmarine sedimentation areas. This interseam corresponds to IIZ 1. (v) The Morwell 1A-1B Interseam. The interseam between MIA and M1B shows a return to similar conditions as for the M2AM2B, with a widespread distribution of the littoral clays. Uplift on structures in the south Loy Yang and Baragwanath Anticline areas appear to have had some influence on adjacent interseam facies distributions. Six foraminifera and two dinoflagellate bore
Oligocene-Miocene marine incursions, Latrobe Valley
fossil locations are known. This interseam transgressed up to 35 km inland over the underlying M1B coal swamp. Non-marine sedimentation areas occurred throughout the remainder of the Latrobe Valley Depression. This interseam corresponds to IZZ 8. Depositional Chronology of the Morwell Formation CHRONOLOGICAL TIMESCALE DETERMINATION
A chronological timescale for deposition of the Morwell Formation has been determined by the following methods: a) the positioning of the independently dated spore pollen zonation of Stover and Partridge (1973) against the quantitative pollen zonation produced by Sluiter (1984; in prep.); b) the adoption of the geochronometric time boundaries of the pollen zones as tie points within the sequence; e.g., the Oligocene/Miocene boundary coinciding with the Middle Proteacidites tuberculatus Zone/Upper P. tuberculatus Zone boundary; and c) the calculation and positioning of a time scale in millions of years, based on the ratio of the maximum thickness of an individual seam to the total thickness of the Morwell Formation - where coal only forms the complete sedimentary sequence (e.g. at Loy Yang where the M1B seam averages 100 m out of a total Morwell Formation thickness of 250 m). It should be noted that relatively constant moisture contents of 61-62% for Morwell Formation coal at Loy Yang (Gloe 1980) are considered sufficient grounds to assume that the calculated time scale is not significantly affected by differential compaction from the top to the bottom of the formation. From the above methods, the end result has facilitated a record of relative sea level changes through the Late Oligocene and Early Miocene (Fig. 7) which is compared with the
153
coastal onlap chronology of Haq et aI (1987). We have chosen to concentrate on this interval because it is for this period that the best quantitative data exist. The suggested amplitude or relative importance of each of the marine transgressions is reflected by the relative height or 'rise' of the eustatic sea level curve in Figure 7 and has been arbitrarily determined from: a) the lateral and vertical extent of the clay lithofacies unit as portrayed in Figure 4; and b) the relative importance of the observed pollen changes during the interseam influence zones, as portrayed in Figure 5. Description and Comparison with Haq et al (1987) Figure 7 illustrates the eight marine transgressions or, alternatively, interseam influence zones, recognisable during the deposition of the M1B seam, which have been plotted against the geological time scale (in Ma). IZZs 1 and 8 represent major transgressive events which, as has been mentioned, correspond to the deposition of the major M1B-M2A and Ml A-M1B interseams respectively. It is interesting to note that during the corresponding time intervals (third order cycles 4.5 and 1.4) Haq et al (1987) record transgressive phases of 'medium' and 'major' magnitude, respectively. The three third order cycles occurring between these, notably cycles 1.1, 1.2 and 1.3, are considered to represent minor transgressive events, which at first glance do not appear to be totally synchronous with the onshore Gippsland Basin intermediate and minor transgressive phases (IIZs 2-7). It is considered possible, however, to match the transgressive events from the two studies, at least at a broad brush level. A comparative chronology between the two studies is suggested below: Equivalent interseam influence zones Third Order Cycle IIZs 6, 7 & 8 1.4 IIZs 4 & 5 1.3 IIZ 2 1.2 IIZ 1 4.5
154
I.R.K. Sluiter & G.R. Holdgate of each IIZ is considered to be only a poor approximate, taken as it has been from the relative positioning of the boundaries of each IIZ against a chronological timescale (in Ma). In short, the broad timing of each IIZ is considered more important than the intimated duration, which is probably strongly affected by the lithotypic composition of the coal as the different brown coal lithotypes are suggested to have accumulated at differing rates (Luly et al 1980; Sluiter 1984). Over the deposition of an entire seam, however, it is considered the importance of this factor would lessen considerably and the numerical
The obvious difference is the occasional presence of more than one transgressive event (IIZ) in the Gippsland Basin occurring within only one of the third order cycles of Haq et al (1987). It may be that the Gippsland Basin record is more sensitive to sea level rise, located as it would have been on a very low lying surface with a very shallow relief gradient to the palaeoshoreline; alternatively, the time correlation is not sufficiently accurate. Differences also exist between the two studies with the indicated duration of each event. For the Gippsland record, the duration DERIVED
QD
UJ I/)
z:
7holocene V
— o
DI NCRNRFMC
5
z LU LJ o ZJ — — —
-
_ _
OJ CJ
—10
— 15 -
_
<u "O •a
—»
LU Z LU <_J o
ai
—35
N16
LU z LU U ID 1 o
N11 CD N10 NY I/) Nft UJ 1—
I
I
I
50
I
0M
I
I,
L
CsJ CD 1—
-tS CL
< 00 C3 P19 < P20
t
UJ 1—
CJ Q.
c
C U R V E S —
(ThisStudy)
RISE
FALL —
-
I/) C
R
2-3
C
2 '2
I
_
T
/
\
ZD
_ YALL0URN
15-
l_J
(Minor)
CO ZD
^ ^ J ^ M i nor)
1-1
^JMinor)
—
_
(Medium)
CL
oo i!
<LU
M0RWELL 1B ^
£
?
—
*
s
-
25-
*
jU
MORWELL 2A
V-
,„ > rit
- 5 _^
1
o
CL CL
20-
6 CT =7
~
1— 5 LJ
-
£
ZD
(M a j o r)
1-2
J
W
t< —
^—^
(/
O M
CL
z o M 00 t, M0RWELL 1A
\—^
[
O CL
cc LU
\
4-5
10-
H - CD
c
,
-
z LU zl
s C
4-4
0—
5—
2-4
1
LU z: h-
—
3-2
<t* Y—
CJ z:
EUSTATIC
3-3
1-4
P22
R E L A T I V E
»—»_ N <- £CQIU 0< at CJ z > LU o ^ —1 oo t l O 1 CJ CL Q_
3-4
1-5
CD h-
m
LU
c
2-5
N5
P18
3-9 3-a 3-7
2-1
C3
^—
^ ° i-j >- -a C_ oj m 250 200 150 100
2-6
N12
P21
C U R V E S
3-1
N4
— 25 !
E U S T A T I C
3-6 CD 1—
>N
-
-
LU CL ZD OO
N15 N14 N13
N7
LU
_
CL
M
N17
N6
-20
-
N23 N22
<
z:
-
— 30
CL U_CQ
LATE N 21 N20 EARLY N19 NTH
-
-
i l l <go
SUPER! SETS
51
F R O M H A Q e t a_l 1987
2nd order 00 LU LU »_( < UJ —I aj UJ >l_J >- 00"°
I/) LU
CJ
M0RWELL 2I3 MORWELL 2 C
-
_ 35-
Fig. 7. Late Oligocene to Early Miocene sea level fluctuations with the Latrobe Valley Depression (right), and comparison (left) with the coastal onlap chronology of Haq et al (1987).
Oligocene-Miocene marine incursions, Latrobe Valley
time scale applied on the left column in Figure 5 is an acceptable estimate. Implications and Further Work Although not attempted, the potential also exists to apply the method outlined here to the quantitative pollen data existing for the MIA and Yallourn seams produced by Sluiter (1984, in prep.). Increased variability in the pollen representation of the major taxa recorded from these two seams would appreciably complicate any analysis. In particular, the significance of major phases of Lagarostrobus expansion across the Latrobe Valley is poorly understood. If the latter phenomenon occurs in response to a sharp reduction in palaeotemperatures and corresponding drop in eustatic sea level, as anticipated by Sluiter (1984, in prep.), it may be possible to link these phases with major falls in sea level such as occur within the middle Early Miocene and around the Early/Middle Miocene boundary (Haq et al 1987). In addition, better definition of the lesser marine incursions nearer the eastern boundaries through more stratigraphic drilling could resolve the third and fourth order cycles with greater precision. CONCLUSIONS The Latrobe Valley Depression, situated on the westerly flank of the onshore Gippsland Basin, contains approximately 700 m of Tertiary sediment infill. In some instances stacked brown coal seams, individually up to 100 m thick and cumulatively up to 250 m thick, are known to comprise almost the entire sedimentary sequence of individual geological formations (e.g. the Morwell Formation at Loy Yang). Although not lithologically manifested in the cores analysed, detailed quantitative pollen analysis of a continuous sequence of approximately 100 m of MlB seam coal from Loy Yang by Sluiter (1984) has demonstrated the existence and location within the sequence of eight interseam influence zones (IIZs). These IIZs are characterised by a particular pollen assemblage type which expands in response to an increase in palaeotemperature
155
and concomitant eustatic sea level rise (Sluiter 1984). The eight IIZs identified are matched with eight clay lithofacies units recognisable in cross section in Morwell IB seam facies equivalents. These clay lithofacies contain marine dinoflagellate taxa, and arenaceous foraminifera indicative of marginal marine to brackish water conditions, and freshwater bivalves. The latter fossils never occur at the same stratigraphic level as the former two fossil types, which seem to characterise clays immediately overlying the coal seams. By contrast, the freshwater mussels are most commonly found immediately underlying coal seams. From their fossil content, facies relationships and geometry, these eight IIZ clays and many of the partings and interseams in the Morwell Formation east of Loy Yang are interpreted to represent a paralic facies deposited during phases of marine transgression over the eastern half of the Latrobe Valley Depression. During these phases, a complex of littoral environments including tidal flats, lagoons and lakes is postulated to have formed behind a complex of 'inner' sand barriers. Subsequent stabilisation of barrier sands facilitated gradual upward desalinisation and sediment infill of the back-barrier littoral to supralittoral environments. An increase in organic sulphur levels in coal immediately underlying the clay lithofacies units is interpreted to have occurred in response to downward migration of saline waters associated with the initial part of the marine transgressions. The environmentally cyclic pattern of deposition and the repeatability of these clay sand lithofacies units has facilitated the diagrammatic portrayal of regional palaeoenvironments during the major phases of interseam influence within the Latrobe Valley Depression. Numerous other events of smaller magnitude are also recognisable, and for the period representing the deposition of the MlB seam these have been placed in chronological order and fixed against the geological time scale. A broad comparison can be drawn with
156
I.R.K. Sluiter & G.R. Holdgate
the coastal onlap chronology for the Late Oligocene to Early Miocene produced by Haq et al (1987), with considerable potential existing for expanding the study to include the rest of the Early Miocene and part of the Middle Miocene. ACKNOWLEDGEMENTS The authors thank the technical and secretarial staff of the Monash University Geography Department and the SECV Exploration and Geological Division for their help in the preparation of this paper, and to Dr C. Abele (DITR) and Dr T. Darragh (National Museum of Victoria) for their help in identifying the key foraminifera and bivalve species. We also acknowledge the interest shown by the Bureau of Mineral Resources Marine Geology group who provided the impetus to put pen to paper. I.S. acknowledges financial support from the Brown Coal Council of Victoria. G.H. publishes with the permission of the SECV. REFERENCES CARTER A.N. 1964. Tertiary foraminifera from Gippsland, Victoria, and their stratigraphical
GLOE C.S. 1975. Latrobe Valley Coalfields. In Traves D.M. & King D. eds. Economic Geology of Australia and Papua New Guinea: 2. Coal.
Australian Institute of Mining and Metallurgy Monography Series No. 6, 345-359. GLOE C.S. 1980. The Economically Winnable Brown Coal Reserves in the Latrobe Valley. State
Electricity Commission of Victoria, Geological Report 26 (unpublished). HAQ B.U., HARDENBOL J. & VAIL P.R. 1987. Chronology of fluctuating sea levels since the Triassic. Science 235, 1156-1167. HOCKING J.B., GLOE C.S. & THRELFALL W.F. 1976. Gippsland Basin. In Douglas J.G. &
Ferguson J.A. eds. Geology of Victoria, pp. 248-273. Geological Society of Australia Special Publication No. 5. HOLDGATE G.R. 1985. Latrobe Valley Brown Coals, their geometry and facies equivalents as a guide to depositional environment. Australian Coal
Geology 5, 53-68. HORNE J.D., FERN J.D., CURUCCIO F.T. & BAGANG B.P. 1978. Depositional models in coal exploration and mine planning in the Appalachian
Region. American Association of Petroleum Geologists Bulletin 62, 2379-2411. KERSHAW A.P. & SLUITER I.R.K. 1982. The application of pollen analysis to the elucidation of Latrobe Valley brown coal depositional environ-
ments and stratigaphy. Australian Coal Geology 4, 169-186. significance. Memoirs of Geological Survey of Victoria 23. KERSHAW A.P., BOLGER P.F., SLUITER
I.R.K, BAIRD J. & WHITELAW M. (in press). The origin and evolution of brown coal lithotypes in the Latrobe Valley, Victoria, Australia. Special Victoria. Royal Society of Victoria Proceedings 57, Publications of the International Association of 49-56. CRESPIN I. 1945. Note on the age and palaeogeography of the brown coal deposits of Gippsland,
Sedimentologists.
CRESPIN I. 1950. Some Tertiary foraminifera from Victoria, Australia. Contributions to the
Cushman Foundation of Foraminiferal Research 1, 70-75.
DODGE J.D. 1985. Atlas of Dinoflagellates. Farrand Press, London.
KISS L.T., BROCKWAY B.J., GEORGE A.M. & STACY W.O. 1985. The distribution of minerals, inorganics and sulphur in brown coal.
Proceedings of International Conference on Coal Science, Sydney, pp. 589-596.
GLOE C.S. 1960. The geology of the Latrobe
LENTIN J.K. & WILLIAMS G.L. 1989. Fossil dinoflagellates: index to genera and species, 1989
Valley coalfield. Proceedings of the Australian Institute of Mining and Metallurgy 194, 57-125.
edition. American Association of Stratigraphic Palynologists, Contribution Series No. 20, 1-473.
GLOE C.S. 1967. The brown coals of the Latrobe Valley. In McAndrew J. & Marsden M.A.H. eds.
LULY J., SLUITER I.R.K. & KERSHAW A.P. 1980. Pollen studies of Tertiary brown coals: preliminary analyses of lithotypes within the Latrobe Valley, Victoria. Monash Publications in
Geology Excursion Handbook, pp. 195-200. Australian and New Zealand Association for the Advancement of Science, Melbourne.
Geography No. 23.
Oligocene-Miocene marine incursions, Latrobe Valley McKENZIE D.A., NOTT & BOLGER P.F. 1984. Radiometric age determinations. Geological Survey of Victoria Report Number 74 (unpublished).
157
and its control on coal measure sedimentation. Australian Coal Geology 4, 138.
PARTRIDGE A.D. 1971. Stratigraphicpalynology of onshore Tertiary sediments of the Gippsland Basin, Victoria. M.Sc. Thesis, University of New South Wales (unpublished).
STOVER L.E. & PARTRIDGE A.D. 1973. Tertiary and Late Cretaceous spores and pollen from the Gippsland Basin, southeastern Australia. Proceedings of the Royal Society of Victoria 85, 237-286.
SLUITER I.R.K. 1984. Palynology of OligoMiocene brown coal seams, Latrobe Valley, Victoria. Ph.D. Thesis, Monash University (unpublished).
SUGGATE R.P. 1959. New Zealand Coals: Their geological setting and its influence on their properties. New Zealand Department of Scientific and Industrial Research, Bulletin 134.
SLUITER I.R.K. (in prep.). Palynology of Oligocene Miocene brown coal seams, Latrobe Valley, southeastern Australia. (To be submitted to Palaeontographica Abt. B).
THOMAS D.E. & BARAGWANATH W. 1949. Geology of the brown coals of Victoria. Mining and Geological Journal of Victoria 13, 28-55.
SLUITER I.R. & KERSHAW A.P. 1982. The nature of Later Tertiary vegetation in Austalia. Alcheringa 6, 211-222. SMITH G.C. 1982. A review of the Tertiary Cretaceous tectonic history of the Gippsland Basin
THOMPSON B.R. 1981. The Gippsland Sedimentary Basin. Ph.D. Thesis, University of Melbourne (unpublished). WELLMAN P. 1974. Potassium argon ages on the Cainozoic rocks of eastern Victoria, Australia. Journal of the Geological Society of Australia 21, 359-368.
Lithofacies variations as a consequence of Late Cainozoic tectonic and palaeoclimatic events in the onshore Gippsland Basin P.F. BOLGER State Electricity Commission of Victoria, 22 William Street, Melbourne, Victoria 3000, Australia. * Interbedded brown coals, clastic sediments and basalts comprising the Tertiary Latrobe Valley Group are unconformably overlain by an extensive sheet of fine to coarse grained terrigenous sediments known as the Haunted Hill Formation in the Latrobe Valley area of the onshore Gippsland Basin. The Latrobe Valley Group accumulated in predominantly low energy swamp/marsh, lacustrine, meandering river and 'marginal marine' environments. Reducing conditions prevailed during deposition to allow accumulation of coals, preservation of organic matter in clastic sediments, and the formation of authigenic siderite and pyrite. Late Miocene to Pliocene movements along major structures deformed the Latrobe Valley Group, producing anticlinal structures from which erosion of more than 100 m of coals and clastic sediments took place. The overlying Haunted Hill Formation was deposited by much higher energy multiple-channel braided rivers, under oxidising conditions. It contains ferruginous palaeosols and locally abundant haematite cements. The detrital mineralogy of both the Haunted Hill Formation and Latrobe Valley Group indicates a similar source of granitic and sedimentary rocks. However, the change in depositional facies results from increase in run-off and bedload attributable to alteration of the drainage system by Late Miocene to Pliocene tectonic activity both in the Latrobe Valley and in the surrounding highland areas, and a change from a humid, equable climate during coal measure sedimentation to a cooler, more seasonal climate in the Late Miocene to Pliocene. Key words: Gippsland Basin, Haunted Hill Formation, Latrobe Valley Group, lithofacies, palaeoclimates, petrology, stratigraphy, tectonics. •Current address: Rural Water Commission of Victoria, 590 Orrong Road, Armadale, Victoria 3143, Australia.
INTRODUCTION
Latrobe Valley Group (Hocking 1976 a,b). Much of the coal bearing succession occurs subsurface, as it is overlain by a thin mantle of clastic sediments of Pliocene to Pleistocene age called the Haunted Hill Formation (Thomas & Baragwanath 1949).
The Cainozoic succession in the onshore part of the Gippsland Basin in southeast Australia comprises thick terrigenous, carbonaceous and calcareous sediments and subordinate basalts. It ranges from Palaeocene to Recent in age, with localised sedimentation still occurring along major rivers and in coastal lakes at the present time.
Regional cross-sections based on drilling data from across the Latrobe Valley, and exposures in the Yallourn, Morwell, Yallourn North, Yallourn North Extension and Loy Yang open cut mines, reveal a clearly recognisable angular unconformity between the Latrobe Valley Group and Haunted Hill Formation in areas of shallow coal subcrop. However, elsewhere in the Latrobe Valley, in areas of thickest Latrobe Valley Group sedimentation, thick clastic deposits overlie the uppermost coal seam concordantly with no structural evidence to indicate a break in
Thick deposits of brown coal are found in the Latrobe Valley, at the western extremity of the Basin (Fig. 1), where they are extracted using open cut mining techniques by the State Electricity Commission of Victoria to provide the major source of fuel for power generation. The coal seams occur within a Palaeocene to Late Miocene sequence of clastic sediments and subordinate basalt flows comprising the 158
/ IT'!
I 'II
cninnn
QUATERNARY
SEDIMENTS
TERTIARY
SEDIMENTS
TERTIARY
BASALT
E H 3
LOWER
CRETACEOUS
1° O °|
UPPER
PALAEOZOIC
• : ± ]
PALAEOZOIC
O
LOWER
N
SEDIMENTS SEDIMENTS
GRANITES
PALAEOZOIC
SEDIMENTS
*
VOLCANICS
160
P.F. Bolger
deposition between the Latrobe Valley Group and Haunted Hill Formation. This paper documents the changes in lithofacies between the upper parts of the coal-bearing sequence and the overlying sediments above the unconformity. It is based on detailed examination of exposures in the five open cuts, regional field mapping in the Latrobe Valley and surrounding highland areas, and on extensive sub-surface data from the Latrobe Valley. Comparison of the lithofacies assemblages and the boundary relationships of the Oligocene to Miocene units of the Latrobe Valley Group and the overlying sediments enables interpretation of the depositional and tectonic history of the area in the Late Neogene.
REGIONAL SETTING The major Latrobe Valley coal deposits at Yallourn, Morwell and Loy Yang occur within the Latrobe Valley Depression, one of the major structural subdivisions of the onshore part of the Gippsland Basin (Hocking 1976b) (Fig. 2). The Latrobe Valley Depression itself comprises areas of structural highs and lows which have been major influences on the nature of coal accumulation. The four main features referred to here are the 'Yallourn-Morwell high', the Loy Yang Dome, the Traralgon Syncline and the Latrobe Syncline (Fig. 2). The Haunted Hill Block is a major structural unit separating the Latrobe Valley
Fig. 2 Tectonic subdivisions within the on shore Gippsland Basin ( A - A B - B C - C ' on locations of section lines in Figs. 3-5).
Lithofacies variations and Late Cainozoic events, Gippsland Basin 161 Depression from the Moe Swamp Basin. Likewise the Baragwanath Anticline, the northeasterly extension of the Balook Lobe of the Strzelecki Ranges, separates the Latrobe Valley Depression sequence from that of the Seaspray Depression. The Latrobe Valley Group overlies basement rocks of Lower Palaeozoic sandstone, mudstone, shale and minor limestone which outcrop in the Eastern Highlands north of the Latrobe Valley, and Mesozoic (Lower Cretaceous) sandstone, mudstone, minor conglomerate and black coal exposed in the Narracan and Balook Lobes of the Strzelecki Ranges south of the Latrobe Valley Depression and Moe Swamp Basin, and in a small area in the foothills of the Eastern Highlands (Fig. 1). Much of the basement underlying the Latrobe Valley Group in the Latrobe Valley Depression is Lower Cretaceous sediment, although Palaeozoic rocks occur in a number of boreholes.
Table 1 Regional Cainozoic correlation table.
CAINOZOIC STRATIGRAPHY Stratigraphic units within the Latrobe Valley Depression, the Haunted Hill Block and the Moe Swamp Basin are the Traralgon, Morwell, Yallourn and Yarragon Formations, which consist of coal seams, fine to coarse clastic sediments and basalt overlain unconformably by the Haunted Hill Formation (Gloe 1976; Holdgate 1985a; and Table 1). Thickest sedimentation, exceeding 700 m, occurs in the Traralgon and Latrobe Synclines. The succession ranges from Eocene to Oligocene age for the Traralgon Formation (Nothofagus asperus palynological zone, Partridge 1971) to Middle to Late Miocene (Triporopollenites bellus zone) for the Yallourn and Yarragon Formations (Partridge 1971; Hocking 1976b; Partridge in Holdgate 1985a). The uppermost part of the Yallourn Formation in the Traralgon Syncline is the youngest part of the Latrobe Valley Group and it postdates the T. bellus zone (Dawson 1983).
162
P.F. Bolger
Successions in the highland areas are incomplete and dominated by basalts and subordinate clastic sediments comprising the lower parts of the sequence. On the Narracan Lobe of the Strzelecki Ranges, the Warragul Block and the Eastern Highlands, these sequences are represented by the OligoceneMiocene Thorpdale Volcanics and underlying Childers Formation, possible post-basaltic Latrobe Valley Group sediments and the Haunted Hill Formation. The Palaeocene Carrajung Volcanics and the underlying Yarram Formation and the Traralgon Formation occur on the Balook Lobe of the Strzelecki Ranges. These units are interbedded with the Traralgon Formation sub-surface in the Latrobe Valley (Figs. 3, 4 and 5). In the Lake Wellington and Seaspray Depressions, and on the Baragwanath Anticline, limestones, marls and minor clastic sediments comprising the Seaspray Group (Hocking 1972, 1976 a,b) overlay the Traralgon Formation and are laterally equivalent to
-interseam
the Morwell and part of the Yallourn Formations, with a transitional marginal marine unit, the Balook Formation (Thompson 1981), occurring in the Rosedale-Sale area (Fig. 5). Marine strata laterally equivalent to the Balook Formation occur within the Latrobe Valley Group in the Latrobe Valley Depression towards Loy Yang (Holdgate & Sluiter, this volume). Post Seaspray Group strata in the Lake Wellington Depression and on the Lakes Entrance Platform comprise the predominantly clastic Boisdale Formation (Jenkin 1968). LITHOFACIES ASSEMBLAGES AND DEPOSITIONAL ENVIRONMENTS Latrobe Valley Group Rock units within the upper part of the Latrobe Valley Group comprise brown coal seams, basalts and terrigenous clay, silt, sand and gravel. The coals and basalts comprise important marker units for defining the
sediments
T h o r p d a l e Volcanics C h i l d e r s == T r a r a l g o n F o r m a t i o n 1X1
Strzelecki
Group
Fig. 3 Cross-section across the eastern margin of the Narracan Lobe (see Fig. 2 for location).
Lithofacies variations and Late Cainozoic events, Gippsland Basin 163 Latrobe Valley Group stratigraphy and structure. In this paper, only the OligoceneMiocene parts of the sequence are examined. The Thorpdale Volcanics outcropping on the highland areas and occurring subsurface are almost entirely basaltic lava flows with minor associated clastic sediments and rare pyroclastics. North of the Latrobe Valley, the flows fill well-defined, deeply incised channels with relief in excess of 70 m in some areas, while on the Warragul Block, Moe Swamp Basin, Latrobe Valley Depression and Narracan Lobe they form extensive sheets. At Willow Grove north of the Moe Swamp
YARRAM FORMATION
Basin, basalts have flowed onto soft wet sediments forming pillow lavas with load and flame structures squeezed into the base of the basalt. The most significant facies of the Latrobe Valley Group are the economically important brown coal seams. The seams are generally very thick, with individual seams locally exceeding 100 m, and extend laterally for tens of kilometres (Holdgate 1985b). Subfacies known as lithotypes, which possess different maceral and floral constituents and physical and chemical properties, form extensive bands within each seam (George 1975, 1982). Studies
CARRAJUNG VOLCANICS
Fig. 4 Diagrammatic north-south section from the Balook Lobe to Loy Yang (see Fig. 2 for location).
NARRACAN
LOBE LAKE WELLINGTON
DEPRESSION
r _ SEA LEVEL EAST
Fig. 5 Diagrammatic cross-section from Thorpdale tc Lake Wellington showing stratigraphic units and their relationships (see Fig. 2 for location).
164
P.F. Bolger
of the macro- and microfloras of a number of seams suggest that the coal-forming environments range from rainforests and sclerophyll forests growing in situ to minor open water environments (Blackburn 1980; Kershaw & Sluiter 1982; Kershaw et al 1986). Latrobe Valley coals contain very low quantities of inorganic ash-forming materials, which are present as soluble salts as well as discrete detrital particles (Kiss & King 1977, 1979). The low detrital component and low interseam/coal ratio suggests little input of extraneous surface water introducing allochthonous, terrigenous detrital -matter into the peat swamp environment. Clastic sediments occur beneath the basalts and between coal seams in the Latrobe Valley Group. On the Eastern Highlands, pebble and cobble gravel, sand and clay of the Childers Formation comprise restricted channel deposits beneath the valley-filling Thorpdale Volcanics. On the Narracan Lobe and Moe Swamp Basin where the basalts are more laterally extensive, the Childers Formation is finer grained and ranges from pebble and granule gravel to clay, ligneous clay and coal. These sediments extend eastwards into the Latrobe Valley Depression where they underlie the Thorpdale Volcanics and the Morwell 2 Coal Seam (Figs. 3 and 5). The sands range from fine to coarse grained, and comprise linear bodies up to 14 m thick which thin laterally and fine upwards into clays (Holdgate 1985c). Interseam sediments between the Morwell 1 and Morwell 2 seams are exposed near Wilderness Creek (Barton 1971) and are typically trough cross-bedded coarse sand and granule gravel. Sediments underlying basalts in this area are often silicified to silcrete. Yallourn Formation sediments separating the Morwell and Yallourn seams exposed at Morwell Open Cut contain a basal massive and cross-bedded medium to coarse sand and granule gravel 4 m thick, grading up to planarbedded fine sand and interbedded clay with an uppermost unit of laminated to massive clay containing well-preserved plant remains (Fig. 6) (Hall 1981; Bolger 1984). The massive
Fig. 6 Fining upward section in Yallourn Formation, Morwell Open Cut (height of section, approximately 20 m).
clays within the Morwell 1/Yallourn interseam thicken east and north of the open cut and much of the Morwell 1 seam is replaced by thick massive clays and minor sands. These sediments are locally enriched in iron and contain abundant siderite, which often replaces detrital quartz grains in coarser units. Fining upward sequences observed in a number of areas in the Morwell and Yallourn Formation are typical of sequences described in the 'meandering' river model of Allen (1970) and Walker and Cant (1984). The basal sand units are interpreted here as channel and point bar lateral accretion deposits, fining up through lower flow regime sediments of the upper point bar. The clays at the top are muddy vertical accretion deposits. The thickness and lateral extent of the clayey vertical accretion deposits suggests that they probably extend into a lacustrine environment on which the peat swamp flora eventually reestablished, leading to the ultimate development of further thick coal seams with an
Lithofacies variations and Late Cainozoic events, Gippsland Basin underlying 'seat earth'. Deposition of part of the Yallourn and Morwell Formation in the Latrobe Valley Depression in a widespread lake has been proposed by Holdgate (1985b). Clastic sedimentary fades in the Morwell Formation at Loy Yang differ from those in stratigraphically equivalent strata in the Yallourn-Morwell area. The dominant lithology at Loy Yang is laterally extensive, often bioturbated, thinly interbedded and laminated silt and carbonaceous silt and clay (Fig. 7). Small scale ripple lamination, wavy bedding and minor soft sediment deformation are common sedimentary structures. The occurrence of marine to marginal marine dinoflagellates and the arenaceous foraminifera Ammodiscus indicate a marginal -marine environment for these sediments (Holdgate & Sluiter, this volume). Fine sand and coarse silt units up to 30 m thick are widespread east of Loy Yang Open Cut where they wedge into the very thick Balook Formation sands near Rosedale (Holdgate & Sluiter, this volume). These sands display small scale trough crossbedding, bioturbation and soft sediment deformation.
Fig. 7 Horizontally-bedded carbonaceous rich and poor silt and very find sand, Morwell Formation, Loy Yang (bar scale = 1 cm).
165
Haunted Hill Formation and Younger Sediments Haunted Hill Formation sediments comprise an extensive sheet across the Latrobe Valley. The formation is well-exposed in all Latrobe Valley open cuts and in many gravel pits. It consists largely of trough cross-bedded and planar-bedded granule gravel, fine to coarse sand, clayey sand, sandy clay and clay. Lenses of pebble gravel up to 2 m thick (Fig. 8) are also common, particularly in the Moe Swamp Basin and the Yallourn area. Much of the unit is deeply weathered, often ferruginised and mottled. A thin unit of friable unconsolidated grey to white coarse sand and minor pebble gravel occurs at the base of the Haunted Hill Formation at Yallourn Open Cut. Fine grained sediments within the Haunted Hill Formation, particularly in the western part of the Latrobe Valley Depression, are usually thin, laterally discontinuous and sometimes deposited at high angles of repose (Figs. 8 and 9). Some coarse sand units fine upwards to clays which in some areas around Yallourn contain ferruginous weathering profiles at the top of each individual fining upwards unit. At Yallourn Open Cut there is a thin unit of planar-laminated, horizontallybedded clay, clayey silt and fine sand, while in the open cut and in the Haunted Hills restricted occurrences of massive, structureless grey and white clay containing isolated, scattered quartz granules are interbedded with sharp contacts with typical coarse grained units (Bolger 1984). In the Loy Yang Open Cut, beds included in the Haunted Hill Formation contain more clay than elsewhere, although south and east of the open cut area, typical cross-bedded coarse sand is widespread. The typical cross-bedded coarse grained sediments of the Haunted Hill Formation are interpreted to be channel deposits, probably deposited in complex bar systems (Miall 1977; Walker & Cant 1984). The very low percentage and restricted distribution of vertical
166
P.F. Bolger
Fig. 8 Trough cross-bedded very coarse sand and pebble gravels in the Haunted Hill Formation, Moe Swamp Basin.
Fig. 9 Trough cross-bedded coarse sand with thin disrupted clay lenses, capped by strongly mottled clay horizon, Haunted Hill Formation, Yallourn Open Cut (height of section, approximately 12 m).
Lithofacies variations and Late Cainozoic events, Gippsland Basin
167
accretion deposits in the unit suggests deposition by predominantly braided or multiple channel streams (Walker & Cant 1984). In the Traralgon Syncline, the Haunted Hill Formation in the Hazelwood 1470 bore contains a basal 33 m thick interval of clay, clayey fine sands and two thin coarse grained units, and directly overlies Yallourn Formation with a well-developed weathering zone at the contact (Fig. 10). This dominantly fine grained facies is atypical of the Haunted Hill Formation elsewhere in the Latrobe Valley Depression, but wedges into more typical coarse sandy facies around Morwell and towards Loy Yang. It consists of a basal gravel containing well-rounded pebbles of fresh, green lithic arkose derived from the Strzelecki Group, and an associated coarse quartz sand to granule gravel, approximately 0.4 m thick. The overlying clays, some containing organic matter and clayey fine sands, are structureless and vary in colour from brown, orange and dark brown to olive grey and green. This facies comprises minor channel deposits and a dominance of vertical accretion deposits (Fig. 10). It represents deposition by 'meandering rivers' (Allen 1970; Walker & Cant 1984), and may be partly lacustrine. Much of the Haunted Hill Formation at Morwell Open Cut consists of strongly mottled claystone, sandstone and clayey sandstone (all indurated to porcellanite), porcellanite breccia and unconsolidated sand, clayey sand and sandy clay (Bolger 1984). This facies is highly heterogeneous with bedding poorly preserved in most localities. The porcellanites, often jointed to give the false appearance of a breccia (Fig. 11), occur as irregular mounds separated by clays and sands. Elsewhere, the porcellanites are fragmented to breccias with a matrix of coarse sand. They vary from white-grey to pink-red in colour with irregular ferruginisation. Boundaries betE3 EZD ween different lithologies are usually highly E3 n irregular, and mapping of individual lithologies or units is not possible in most parts of the open cut. Angular indurated 10 Post-Yallourn seam stratigraphy in the siltstone/claystone breccia occurs adjacent to Fig. Traralgon Syncline, H1470 (includes spore- pollen red, clayey, coarse quartz sand with a sharp, data from Dawson 1983). W i W W W W ^ W W W W * Ui
168
P.F. Bolger
planar, vertical contact at one locality on the southern batters of the open cut, while on the eastern face there is an irregularly bedded unit containing distorted beds of coarse sand up to 5 m thick interbedded with breccias consisting of angular clasts of porcellanite (Bolger 1984). The heterogeneous, indurated facies of the Haunted Hill Formation is associated with the occurrence of charred coal in which deep depressions known as 'fireholes' have formed at the unconformity surface. The indurated material fills the firehole depressions (Fig. 12). It is best developed at Morwell Open Cut, but also occurs at Yallourn North Extension and is slightly developed at Loy Yang Open Cut.
adjacent to the Morwell River and are of Pleistocene to Recent age (Bolger 1984). The porcellanites and accompanying breccias appear to be predominantly associated with 'fireholes', suggesting a genetic relationship between in situ coal combustion and the development of these unusual lithofacies. It is suggested that the heat generated by coal combustion elevated the groundwater temperatures, producing solutions rich in materials such as silica which occasionally occurs in thin veins and filling cavities. Cementation was accompanied by collapse of the indurated overburden sediments into the space formed by removal of the burnt coal. Laminated clays were deposited in swamps and depressions formed above the collapsed surface. Some of the indurated sediments were reworked, perhaps by mass flow processes, to form local deposits of poorly bedded breccias.
Fig. 11 Indurated claystone porcellanite, jointed to give brecciated appearance, Haunted Hill Formation, Morwell Open Cut.
Planar-laminated carbonaceous clays and minor very thin sands also occur in the deep fireholes at Morwell and Loy Yang Open Cuts. These strata are interbedded with brecciated and indurated Haunted Hill Formation in some fireholes, while in others they overlie brecciated Haunted Hill Formation (Fig. 13) or occasionally directly overlie coal. Palynological dating suggests a Late PliocenePleistocene age for at least one of the firehole fill successions interbedded with Haunted Hill Formation breccias, while others occur in closed drainage basins or small peat swamps
Fig. 12 Irregular top of coal surface in 'firehole', with depression filled with Haunted Hill Formation indurated breccia, Morwell Open Cut.
SEDIMENTARY PETROLOGY Petrological analysis of a range of samples of clastic facies of the Latrobe Valley Group and overlying sediments was undertaken to compare and contrast the mineralogical, chemical and textural characteristics of each unit as well as the gross depositional lithofacies.
Lithofacies variations and Late Cainozoic events, Gippsland Basin 169 Sand samples observed in thin section are usually texturally mature to immature, mostly with grain-supported frameworks. Framework grains are usually equant to rodlike, subangular to sub-rounded, with variable sphericity. Embayed quartz framework grains corroded by the matrix, and closely compacted frameworks with compressed platy minerals and soft lithic clasts, occur in a number of consolidated to over-consolidated sediments from both the Haunted Hill Formation and Latrobe Valley Group. Laminated silts from the Morwell Formation at Loy Yang are usually well-sorted, and consist of angular framework grains often closely packed. Composition Detrital
Fig. 13 Laminated dark-grey clay overlying brecciated Haunted Hill Formation, Firehole No. 2, Loy Yang Open Cut. Texture A wide range of textural features is recognisable in both the Latrobe Valley Group and Haunted Hill Formation clastic sediments, although in general both units show similar characteristics. Coarse gravel lenses in both the Haunted Hill and the Childers Formations consist mostly of pebbles up to 8 cm, although coarse cobbles occur in the Childers Formation in the Eastern Highlands. Quartz pebbles are generally blocky and sub-rounded to rounded, while lithic clasts tend to be more elongate and well-rounded. Granule gravels and very coarse sands which occur in all formations are also sub-rounded to rounded. Grain size analyses of coarse sands and granule gravels indicate that they are poorly sorted with standard deviations 1-2$. However, most of the Haunted Hill Formation coarse sand units are very clayey with a poorly sorted, grain-supported framework and post-depositional clayey binding medium.
Components
No consistent difference in terrigenous detrital components is recognised within the Latrobe Valley Group and younger sequences. Granule gravels and coarse sands are compositionally very mature, compared to the less mature fine to medium sands of both units. The sands consist largely of monocrystalline quartz with undulose to sharp extinction, subordinate composite common quartz, minor vein quartz, reworked sedimentary quartz and polycrystalline recrystallised and stretched metamorphic quartz (Figs. 14 and 15).
Fig. 14 Poorly sorted, haematite-cemented coarse sand, with embayment of large grains by matrix, Haunted Hill Formation, Yallourn Open Cut (width of field of view = 2.1 mm).
170
P.F. Bolger
Fig. 15 Detrital grain showing quartz overgrowth on well-rounded quartz and sedimentary rock fragments, Yallourn Formation, Morwell Open Cut (width of field of view = 0.84 mm).
Sedimentary rock fragments include chert and microquartz, occasional slate fragments and abundant mudstone clasts (Fig. 16). Feldspars with varying degrees of alteration include microcline, perthite, orthoclase and plagioclases ranging from andesine to labradorite (Fig. 16). Feldspar is not common in thin sections of pre-Yallourn seam samples examined here, although it is recognised in weathered hand specimens of the Morwell Formation at Wilderness Creek and Yallourn North. Zircon and tourmaline are the major heavy minerals in both the Haunted Hill Formation and the Latrobe Valley Group, and biotite and muscovite are common. Muscovite is very abundant in the laminated facies of the Morwell Formation at Loy Yang. Distinctive clasts of altered plagioclase and altered fine grained volcanic rock fragments consisting of euhedral plagioclase lathes in a fine grained groundmass (Fig. 17) are common in Haunted Hill Formation sands at Morwell and in the fine grained facies in the Traralgon Syncline, but have only been recognised in the postYallourn seam part (T. bellus zone) of the Latrobe Valley Group in HI470 bore in the Traralgon Syncline.
Fig. 16 Feldspathic wacke containing common quartz, sedimentary rock fragments (S), altered Kfeldspar (K) and fine grained plagioclase (P), Yallourn Formation, H1470 (width of field of view = 0.84 mm).
Fig. 17 Common quartz, sedimentary rock fragments (S), microporphyritic volcanic rock fragments (V), and zircon (Z), Haunted Hill Formation, Morwell Open Cut (width of field of view = 0.84 mm).
Pebble clasts in the Haunted Hill Formation and Childers Formation are usually vein quartz with subordinate quartzite and quartzose-wacke identical to Palaeozoic sandstones outcropping in the Eastern Highlands, rare mudstone clasts including one clast of black shale clearly identifiable as a clast of Lower
Lithofacies variations and Late Cainozoic events, Gippsland Basin
Devonian Wilson Creek Shale, and, locally, clasts. A pebbly granule gravel at the base of the Haunted Hill Formation in HI470 in the Traralgon Syncline contains well-rounded elongate pebbles of green, chlorite-cemented lithic and feldspathic Lower Cretaceous Strzelecki Group arenites. Carbonaceous matter, either as discrete particles of plant tissue (wood, leaves, etc.) and finely dispersed organic matter in ligneous clays or in coal seams, is ubiquitous in the Latrobe Valley Group. The organic component of the Latrobe Valley Group covers a broad spectrum, from lignitic coals with less than 1% ash through to ligneous clays with less than 10% organic matter. Some clastic facies of the Latrobe Valley Group contain little or no organic material. Colour The high organic carbon content of the Latrobe Valley Group sediments imparts a black, brown or pink colour to the clastic sediments. Latrobe Valley Group sediments with low organic carbon contents have buff, grey and olive colours. In contrast, the overlying Haunted Hill Formation is strongly oxidised and mottled to pink, orange, grey and yellow colours. Weathered Latrobe Valley Group sediments exposed in the highland areas also show pronounced iron-staining and mottling at some locations. Authigenic Mineralogy and Secondary Alteration Colour contrasts also coincide with differences in authigenic mineral assemblages. Siderite is diagnostic of the Latrobe Valley Group in the Yallourn Formation in the synclinal areas. In pre-Yallourn seam deposits, it occurs in grey coloured, iron-rich clays as large nodules of siderite microspar. In contrast, the post-Yallourn seam sediments contain smaller globular nodules of sparry siderite also associated with grey-green iron-rich clays. Pyrite is likewise very common in the Latrobe Valley Group, forming a cementing
171
medium in sandy units or occurring as small nodules in mudstones. However, pyrite and/or marcasite is also occasionally recorded from the Haunted Hill Formation, often directly above coal seams. In contrast to the drab coloured, organic-rich units in the Latrobe Valley Group with authigenic siderite and pyrite, the Haunted Hill Formation contains haematite cements and irregular limonite bands associated with orange, yellow and red sediments. Clay Mineralogy Quartz-kaolinite assemblages dominating the clay fraction of mud rocks and the matrix of sands were identified by X-ray diffraction analysis of the < 4fraction of disaggregated samples. Illite, muscovite and varieties of randomly interlayered mixed-layer clays including illite/smectite and possibly illite/vermiculite are subordinate. As with the coarse grained components, no consistent trends or compositional differences could be detected between the Haunted Hill Formation and the Latrobe Valley Group. In samples from the Traralgon Syncline (H1470, H1471), parts of both the upper Yallourn Formation and the fine grained facies of the Haunted Hill Formation contain possible smectite and chlorite as well as the ubiquitous kaolinite, quartz and mixedlayer clays. Geochemistry Whole rock geochemistry of sediments above and below the unconformity shows very little difference in chemical composition in most areas (Tables 2 and 3). Slightly ferruginous Haunted Hill Formation sands in the Yallourn Open Cut show 3.7% Fe oxides, which is greater than most of the Latrobe Valley Group sediments apart from the siderite-bearing iron-rich sediments of the Yallourn Formation in the Traralgon Syncline (Table 2). The oxidation states of the iron have not been determined, but in line with other work on the colour of sediments (McBride 1974; Morad 1983) the drab coloured sediments can be predicted to have
172
P.F. Bolger
dominantly Fe , reflected by the authigenic siderite and pyrite, as opposed to the brighter coloured Haunted Hill Formation which probably contains iron in the Fe form as haematite and limonite. 2+
3+
STRUCTURAL RELATIONSHIPS OF THE LATROBE VALLEY GROUP AND YOUNGER STRATA The Latrobe Valley Group is folded into a series of open folds with general northeastsouthwest or east-west trends, and monoclinal structures associated with major basement faults (Barton 1981). Extensive erosion of the folded strata has removed in excess of 100 m of coals and clastic sediments. In areas of shallow coal subcrop such as at Yallourn, Morwell, Loy Yang and along the Yallourn Monocline, dipping and faulted Latrobe Valley Group coals are overlain by the flatlying Haunted Hill Formation with pronounced angular unconformity (Fig. 4). Erosional relief occurs at the unconformity surface (Fig. 8), with well-defined channels greater than 20 m deep recognised at Loy Yang and Yallourn. Locally the uppermost
part of the coal seams is deeply weathered (Bolger 1985), while at Morwell and Loy Yang Open Cuts extensive in situ combustion of coal has produced deep depressions in the coal surface (Fig. 12). These 'fireholes* can be more than 50 m deep and up to 700 m wide. Porcellanite breccias within the Haunted Hill Formation at Morwell and Yallourn North Extension are associated with the fireholes. In contrast to the areas of shallow coal subcrop, there is no evidence of an angular unconformity in the Traralgon Syncline where nearly 100 m of Yallourn Formation clastic sediments (up to Late Miocene age) conformably overlie the Yallourn seam, and are succeeded by the basal clay facies of the Haunted Hill Formation which is dated as Late Pliocene-Pleistocene. A deeply weathered zone at the top of the Yallourn Formation reflects the break in deposition prior to deposition of the Haunted Hill Formation. A thin basal conglomerate containing clasts of Mesozoic basement rock occurs at the contact (Fig. 10). In the Eastern Highlands, strata are concordant and post-basaltic sediments are not
Table 2 Chemical Analyses of Latrobe Valley Group sediments, Latrobe Valley Depression. (A)
(B)
OD)
(O
(E)
(F)
(G)
(H)
<D
#
Y132 ECS EG6 EG33 EG34 EG44 EG53 EG54" EG42 EG45- EG46* EG49* ECU EG19 E020 EG21 EGZ2 EG23 EG24 EG25 EG26 EG32 Y192 57J) 903 EG27 EG29 EG30 EG31 4
Si02
AI2O3 FcaOj
c*o
633 70.2 65.5 67.6 763 90.9 83.7 73.1 593 82.6 89.0 67.0 723 75.0 75.8 78.0 69.9 683 66.0 1A2 66.7 533 64-2 69.4 74.7 68.9 853 14.2 17.0 193 19-5 123 4.1 7.9 L5.2 193 12 4.7 163 14.8 10.8 12.0 9.6 133 17.0 18.0 142 17.6 19.8 19.2 153 123 16.9 63 a s 1.4 0.8 0.9 1.2 03 0.6 0.9 L5 0.4 0.6 53 23 43 2.9 3.4 5.9 42 3.7 0.9 LI 13 3.9 4.0 22 33 L4 0.7 0.2 0.2 0.2 03 03 0.1 a i 0.4 0.2 0.2 03 0.2 0.1 0.1 0.1 0.1 0.1 0.1 <0.1 <H-1 03 0.2 0.1 0.1 <ai <0.1 031 0.45 0.3 03 0.2 0.1 0.1 02 0.8 0.2 02 0.8 0.7 0.6 0.6 03 03 03 03 0 3 03 a s 0.7 0.7 03 03 02
MgO BaO 0.14 0.12 03 03 03 <005 0.1 02 0.3 <0.05 0.1 12 L7 0.4 0.6 0.8 0.7 03 0.2 0.2 0.1 0.1 0.1 1.6 1.7 0.4 02 NazO L2 1.4 1.6 L7 0.8 0.2 0.3 1.4 7.0 LI 1.4 1.9 3.7 0.9 0.9 0.9 1.6 13 0 3 L4 3.1 1.7 L7 2.0 1.8 0.4 03 KjO LI 12 0.9 0.7 13 <0.1 03 1.1 2.7 0.8 0.8 0.7 0.7 0.9 0.9 0.6' ' 0.7 0.7 1.4 0.9 LO LI 0.9 LO 0.8 0.9 0.8 T1O2 17.6 6.6 10.7 10.1 5.9 22 6.2 72 8.8 4.6 13 6.1 4.7 5.4 43 4.6 6.4 6.7 8.2 7.0 8.7 20.6 9.0 5.6 4.1 72 1 3.8 LOI TOTAL 99.4 98.6 99.8 101.3 99D 98.1 993 99A 1100.3 98.1 983 100.0 101.1 98.6 983 983 993 993 98.6 992 98.8 99.4 99.9 100-2 98.2 98.9 98.6
(A) Post-Yalloum seam, M2390 (B) Yalloum intcrscam base, Morwell Open Cut (C) Morwell Formation above Latrobe Seam, Yalloum North Open Cut (D) Morwell Formation above Latrobe Seam, Yallourn North Extension (E) M1B-M2A interseam, Loy Yang (F) Post-Yalloum Seam, Yalloum Formation, H1470 (G) Sub-Yalloum Seam, Yalloum Formation H1470 (H) Sub-Yalloum Seam Yalloum Formation Y132 (I) Post-Yalloum Seam, Yalloum Formation, H1471 Sand and quartz-rich silt units (EG53,54,46,49) * Interseam probably altered by coal burning adjacent to the sediment # H1471 sequence tentatively referred to Latrobe Valley Group (Yallourn Formation) are deeply weathered +
Lithofacies variations and Late Cainozoic events, Gippsland Basin
173
dated. North of the Yallourn Monocline, the to repeated post-Pliocene movements of the steeply dipping Latrobe Seam coal is uncon- major structures (Barton 1981). formably overlain by Haunted Hill Formation. The coal wedges out to the north where stratigraphically older Thorpdale Volcanics, DISCUSSION AND INTERPRETATION and partly silicified Childers Formation sand Comparison of Depositional Environment and gravel overlain by Haunted Hill FormaSedimentological and petrological diftion, outcrop on hills. This indicates an absence of Miocene section in the highland ferences between the Latrobe Valley Group and the Haunted Hill Formation indicate areas north of the Yallourn Monocline. strong contrasts in depositional environment The major Cainozoic tectonic movements in a changing regional palaeogeographic which folded the Latrobe Valley Group setting. resulted from NNW-SSE compression and The Latrobe Valley Group accumulated in largely predate the unconformity (Barton a low energy depositional environment, par1981). However, the Haunted Hill Formation ticularly in the Oligocene to Late Miocene is tilted on the Yallourn and Morwell Mono- Morwell and Formations. The thick, clines. These dips, as well as minor faults in low ash coalYallourn seams are considered to have the Haunted Hill Formation observed in road accumulated predominantly in raised bogs cuttings west of Loy Yang, are sympathetic swamp environments (Kershaw et al with the direction of major pre-unconformity and 1986), largely free of extraneous surface faults inferred from sub-surface data in the which were deposited contemporLatrobe Valley Group. Further evidence of water, aneously with clayey lake deposits in the post-Haunted Hill Formation movements is Traralgon Syncline during parts of the the filling of joints in coals at Yallourn and Miocene (Holdgate 1985b). Morwell Open Cut by several generations of sand and clay. These joint fills are clearly Intermittent flooding of the swamps by low derived from downward migration of Haun- energy meandering streams and lakes interted Hill Formation overburden, in response rupted peat accumulation, causing deposition Table 3 Chemical Analyses of Haunted Hill Formation sediments, Latrobe Valley Depression. (A) (E) (F) (G) 1 (B> ! <Q 0>) EG7 j EG8 i EG51 | EG55 1 EG9 | EG52 EG43 j EG10 EG50 EG56+ EG41* EG12 EG14 EG47 EG48* EG15 EG16 803 j 57.6 | 88.9 76.6 74.0 963 70.8 69.7 80.2 90.6 68.2 68.8 73/6 81.1 702 64.0 62.2 10.8 j 23.4 j 4.4 12.4 14.7 2.6 18.2 17.8 113 4.8 15.1 18.9 17.6 9-4 163 193 18.6 0.9 | 2.9 1 3.1 1.2 0.8 1.0 0.9 12 1.1 1.0 0.7 2.0 33 0.7 32 4.0 <0.! j <0.10 j 0.1 0.4 <0.1 02 <03 0.2 03 0.2 <0.1 0.3 02 0.1 03 0.4 03 0.16 | 0.9 j <0.5 0.4 032 <0.05 02 039 0.3 <0.05 0.7 0.17 0.02 0.1 0.4 0.7 1.1 ! 0.10 j 0.5 | <0.05 2.0 0.10 <0.05 03 0.20 0.1 <0.05 03 0.18 0.24 0.3 0.6 | 1.7 1.9 1.6 ! 1.9 i 0.1 1.8 1.3 0.1 0.9 1.7 0.6 0.1 1.0 1.4 0.08 0.1 0.6 12 3.8 0.4 0.9 0.7 1.8 i 1.2 j <0.1 0.2 03 1 2 <0.1 0.8 1.6 03 0.9 2.1 23 1.0 2.4 | 10.0 : 3.0 4.8 6.8 6.4 5.8 8.1 72 52 1.5 7.9 5.6 6.8 2.6 83 7.7 983 j 983 i 100.2 101.7 98.0 1013 101.1 98.2 101.2 99.5 98.2 9.97 101.2 98.0 99.6 ! 98.8 100.7 +
Si02 AI2O3
Fe203 CaO MgO Na20 K2O
Ti02 LOI TOTAL
+
3 / 7
(A) Yallourn Open Cut (B) Maryvale (C) Yallourn North Open Cut (D) Yallourn North Extension Open Cut (E) Morwell Open Cut (F) Loy Yang Open Cut (G) HI 470 *EG51, 52, 56 arc sand units * EG41, 48 are Quaternary clays overlying Haunted Hill Formation in fireholes
174
P.F. Bolger
of clays which produced splits in the coal seams and contributing a relocation of the sites of thickest coal accumulation (Holdgate 1985b). Geochemical indicators, including widespread siderite and pyrite and the ubiquitous carbonaceous matter, indicate reducing conditions at the time of Latrobe Valley Group deposition. The Haunted Hill Formation represents a higher energy fluvial environment dominated by multiple channel-braided stream deposits and, except for the locally developed transitional muddy facies at the base of the sequence in the Traralgon Syncline, it contrasts strongly with the low energy environments of the coal-bearing Latrobe Valley Group. The change in channel morphology from 'meandering' or 'braided' can be attributed to an increase in runoff, and in the Latrobe Valley it coincides with the onset of tectonic activity in the basin and its hinterland which led to rejuvenation of source areas and increased stream gradients. A pronounced global cooling at the end of the Miocene (Frakes 1979) is recorded in a number of localities in southeastern Australia (Bowler 1982). In the Latrobe Valley it is represented by a change from a temperate, wet climate supporting dominantly rainforest floras in the Latrobe Valley Group to a more seasonal, drier climate with a dominantly sclerophyll flora (Dawson 1983). This climatic and floral change occurs at the boundary between the Latrobe Valley Group and the Haunted Hill Formation. It is also indicated by a sea level decrease (Mallett 1978) and a corresponding decrease in base level, leading to erosion in the onshore areas. It is concluded that the change in channel morphology and increase in bedload transport in the Haunted Hill Formation is the result of increased stream gradients due to Late Miocene-Pliocene tectonic uplift and concomitant drop in sea level. The more seasonal climate resulting from late Miocene-Pliocene cooling may have also contributed to increased runoff and sediment yield.
The boundary between the Latrobe Valley Group and the Haunted Hill Formation also reflects a change in geochemical environment from reducing to oxidising. Minor occurrences of pink-grey mottled clays, containing vertical rootlike structures filled with Fe-oxides, are possible ancient palaeosols formed on fining upwards units in the restricted fine grained planar-bedded facies of the Haunted Hill Formation (Bolger 1984). They are overlain by further fining upward units which are themselves capped by mottled pink clays. Ferruginous concretions are present in the palaeosols. Each of the ferruginous palaeosols appears to have formed prior to deposition of the overlying fining upward unit, suggesting that oxidising conditions prevailed during deposition of the Haunted Hill Formation. Although the oxidation state of iron in these palaeosols, and in the Haunted Hill Formation generally, has not been determined chemically, the widespread red, yellow and orange pigment and the haematite and limonite cements suggest that it is present in the Fe 3 + form. Some of the mottling and red pigmentation in the Haunted Hill Formation in the surface horizons at Loy Yang, Yallourn and the Moe Swamp Basin is related to weathering and the development of grey podzolic soils during the present weathering cycle. The source of the Fe3+ in the Haunted Hill Formation is not clear. Several processes have been postulated for the enrichment of the F e 3 + in red beds. Petrographic and geochemical investigations by Walker (1967) and Morad (1983) suggest that much of the red pigment in red beds is post-depositional and derived from in situ diagenetic alteration of iron-bearing minerals. The low Fe-concentration of the Haunted Hill Formation (Table 2) may be a reflection of the low concentration of Fe-bearing minerals on the original quartz and kaolinite-rich sediments. Alternatively, or perhaps more likely for the Haunted Hill Formation, the seasonal Pliocene climate proposed by Dawson (1983) probably led to a fluctuating groundwater
Lithofacies variations and Late Cainozoic events, Gippsland Basin
table, which can lead to Fe + deposition by dehydration of detrital ferric-hydroxides (Van Houten 1972; McBride 1974) and/or oxidation of ferrous iron (Besley & Turner 1983; Czynscinski et al 1978.) The large kaolinite component of the Haunted Hill Formation clays is probably largely inherited from the source area, although post-depositional deep weathering under oxidising conditions can also lead to kaolinite formation (Millot 1970; Weaver & Pollard 1975). 3
175
the Latrobe Valley Group and the Haunted Hill Formation. Pebbles of vein quartz and clearly identifiable Palaeozoic sediments are common in both the Haunted Hill and Childers Formations, and clearly indicate sediment derivation from Palaeozoic sedimentary rocks and associated quartz veins which are presently exposed north of the Latrobe Valley. Pebbles of relatively fresh Strzelecki Group rocks at the base of the Haunted Hill Formation in the Traralgon Syncline, coupled with grains of altered plagioclase and possibly altered volcanic rocks in the upper Yallourn Formation and Haunted Hill Formation, suggest a southerly source from the Strzelecki Ranges for this part of the sequence. Further evidence of sedimentary source rocks for both the Haunted Hill Formation and the Latrobe Valley Group is the abundance of chert and mudstone clasts, and the presence of detrital grains consisting of rounded quartz surrounded by quartz overgrowths (Fig. 15).
Palaeogeography and the Source of Terrigenous Detritus Sands within both the Latrobe Valley Group and Haunted Hill Formation are mostly compositionally mature and are dominated by common quartz with subordinate vein and metamorphic quartz, varying amounts of chert and mudstone and minor feldspars (both weathered and fresh), muscovite and biotite. Heavy minerals are almost exclusively tourmaline and zircon. The dominant clay mineral presence of occasional silcrete clasts in is kaolinite with subordinate illite and/or theThe Haunted Hill Formation suggests reworkillite/smectite and possibly illite/vermiculite. ing of pre-existing Tertiary sediments from the Notwithstanding the effects of diagenetic Highlands and/or Strzelecki Ranges. alteration of clays, it is likely that kaolinite Eastern Silcrete pebbles have not been found in the is the major detrital clay. The combined Latrobe Valley Group. Siliceous clasts in a coarse and fine grained detrital mineral assem- basal white sand in the Haunted Hill Formablage is indicative of a mature topography, tion at Yallourn Cut are similar to comprising weathered granitic and sedimen- porcellanites foundOpen at Morwell Open Cut, and tary rocks. perhaps indicate several phases of deposition The presence of granitic pebbles, mono- in the Haunted Hill Formation. Detailed crystalline common quartz with undulose palaeocurrent investigation of the Haunted extinction, and fresh and weathered feldspars, Hill Formation has not been undertaken. including microcline and pert hit e, indicates a However, observations of pebble imbrication, granitic source area for both the Latrobe orientation of troughs and channels in the Valley Group and the Haunted Hill Forma- coarse sand facies, the trend of erosion chantion. The most likely granitic source area com- nels at the unconformity surface and the prises the Gembrook and Baw Baw Batho- overall sediment dispersal pattern suggest a liths, which are presently exposed in the northerly and northwesterly source providing Eastern Highlands north of the Latrobe reworked sedimentary and granitic detritus Valley (Fig. 18) and formed an elevated from the Palaeozoic bedrock, as well as a plateau throughout the Tertiary (Vandenberg southerly source shedding sediment from the 1978). These granites contain abundant zircon Lower Cretaceous rocks in the Strzelecki and tourmaline (Baker 1942), and were prob- Ranges (Fig. 18). Reworking of pre-existing ably the source of the heavy minerals in both Tertiary sediments and silcretes provided
176
P.F. Bolger
Palaeozoic Sediments and Acid Volcanics and Baw Baw Batholiths Wilsons Promontory Granite EH Gembrook Strzslficki Group
Palaeocurrent directions inferred from Petrology J
30 km. i
Cross-bedding Ctv
Channels
3
Imbrication
Fig. 18 Palaeocurrent directions in the Haunted Hill Formation inferred from sedimentary structures and petrographic data (including data of Jenkin 1968; Roberts 1981).
Lithofades variations and Late Cainozoic events, Gippsland Basin
detritus from both areas. The radial pattern of palaeocurrent trends in the Haunted Hill Formation around the Balook Lobe (Jenkin 1968; Roberts 1981) indicates that the Haunted Hill Formation in this area was at least partly derived from reworking of Tertiary sediments on the crest of the Balook Lobe. The source of Latrobe Valley Group sediments in the Latrobe Valley Depression is not clear and requires further detailed investigation. Pebble imbrication in the Yarram Formation sediments on the crest of the Balook Lobe suggests a southward source (Holdgate 1980). The pebbles in these gravels are entirely clasts of Palaeozoic sediments and a coarse grained granite, the most likely source being the Wilsons Promontory Granite. The continuity of the Carrajung Volcanics and the Traralgon Formation across the Carrajung Monocline onto the crest of the Balook Lobe indicates that the Balook Lobe was not elevated in the Eocene, so that part if not all of the Traralgon Formation, at least at Loy Yang, may have been sourced from Palaeozoic rocks from the south. The timing of uplift of the Narracan Lobe is uncertain. The Childers Formation forms a continuous sheet across the entire area, extending from the Narracan Lobe into the Moe Swamp Basin and into the Latrobe Valley Depression where it passes into the Traralgon Formation (Figs. 3 and 5). The lateral continuity of the Childers Formation and its lateral equivalents indicates that the Narracan Lobe was not elevated in the Oligocene, although the apparent increase in pebble gravels in the Childers Formation on the highlands indicates higher energy sedimentation and possible proximity to source area. Similarly, sequences in the Driffield area on the northeast of the Narracan Lobe and on its northern flanks adjacent to the Yarragon Monocline suggest that the Yarragon and Morwell Formations were deposited across the present margins of the Narracan Lobe, implying that there was no appreciable relief at the time. Palaeocurrent measurements of these
111
formations in the Morwell area show no consistent trends to indicate palaeodrainage patterns. Hall (1981) suggested a southerly source for at least part of the Yallourn Formation, while sand isopachs of the Morwell Formation suggest a westerly to southwesterly source area (R.L. Webster, pers. comm.). Holdgate (1985c) identified north-south trending linear channels in the Traralgon Formation at Morwell. Furthermore, there is no petrographic evidence available to indicate whether the Narracan Lobe began to be uplifted during deposition of the Morwell and Yallourn Formations with consequent reworking of the Traralgon and Childers Formations. Although the distribution of thick Morwell and Yallourn seam coals around the margins of the Strzelecki Ranges (Holdgate 1985b) suggests that these highlands may have begun to be uplifted during the Early Miocene, the first appearance of detritus considered to be derived from the Strzelecki Group from the south of the Latrobe Valley is in the Middle to Late Miocene above the Yallourn Seam in the Traralgon Syncline. Lithic clasts in the Childers Formation in the Eastern Highlands, coupled with palaeochannel trends inferred from basalt distributions, indicate a northerly source of Palaeozoic bedrock for at least part of the Childers Formation in the Moe Swamp Basin, and possibly the Traralgon Formation in the Latrobe Valley Depression. The post-basaltic palaeodrainage system in the Eastern Highlands is not clearly understood. As the Latrobe Seam wedges out rapidly at the unconformity north of the Yallourn Monocline, the northern margin of the basin was probably further north than the present distribution of brown coal occurrences. Erosion after Late Miocene uplift removed any post-basaltic Latrobe Valley Group sediments deposited north of the Yallourn Monocline. Subsequent tilting and erosion of the Haunted Hill Formation suggests that the highlands in this area were uplifted during several episodes rather than
178
P.F, Bolger
continuously. Locally, however, the extrusion of basalt flows may have disrupted drainage patterns and the local base level of sedimentation so that post-basaltic sediments were not preserved. The ancestral Thomson River which was filled with a valley flow is now flanked by the twin lateral streams of the Thomson and Aberfeldy Rivers, and suffers a sharp easterly change in direction at the northernmost outcropping basalt to the south of Walhalla (Fig. 1). This suggests that the basalt flows, at least locally, may have diverted the course of at least one major river, thereby starving the Latrobe Valley Depression of one source of coarse clastic detritus. Other major southward trending rivers such as the Tanjil, Tyers and Latrobe show less evidence of river diversion by basalt flows, although twin-lateral streams have developed in their headwaters. CONCLUSIONS Coals and associated clastic sediments comprising the Latrobe Valley Group in the onshore part of the Gippsland Basin were deposited in an essentially low-energy system, dominated by lacustrine, flood basin and peat swamp environments with intermittent influx of coarse detritus by meandering streams. A change in depositional environments occurred at the end of the Miocene in response to a global cooling and drop in sea level, as well as regional NNW-SSE compressional tectonic movements which deformed the Latrobe Valley Group and elevated highland areas. The resulting depositional system was dominated by high energy multiple channel rivers depositing coarse detritus to form the Haunted Hill Formation. In addition, the geochemical environment altered from reducing for the Latrobe Valley Group to an oxidising environment for the Haunted Hill Formation. The climatic change is reflected by vegetational changes, from a rainforest environment indicating a humid climate to a sclerophyll flora reflecting a drier more seasonal climate. Terrigenous detritus introduced to the basin is largely derived from the Palaeozoic sediments and granites in the
Eastern Highlands north of the Latrobe Valley, with input from the south occurring towards the latter part of the Miocene in response to the initial stages of tectonic activity.
ACKNOWLEDGEMENTS This work formed part of an M.Sc. study at Monash University. I would like to thank my supervisor, Larry Frakes, as well as Guy Holdgate, Colin Barton and Ian Sluiter for helpful comments. Alan Drummond and Sue Huggins performed chemical and XRD analyses. Andrew Bell and Frank Webb drafted the diagrams, and the manuscript was typed by Beth Tabart. REFERENCES ALLEN J.R.L. 1970. Studies in fluviatile sedimentation: a comparison of fining-upwards cyclothems, with special reference to coarse-member composition and interpretation. Journal of Sedimentary Petrology 40, 298-323. BAKER G. 1942. The heavy minerals of some Victorian granitic rocks. Proceedings Royal Society of Victoria 54, 196-223. BARTON C.M. 1971. The Morwell interseam "Sands." Journal Geological Society of Australia 17, 191-204. BARTON C.M. 1981. Regional stress and structure in relation to brown coal open cuts of the Latrobe Valley, Victoria. Journal Geological Society of Australia 28, 333-340. BESLEY B.M. & TURNER P. 1983. Origin of red beds in a moist tropical climate (Etruria Formation, Upper Carboniferous, UK). Sedimentology 31, 131-147. BLACKBURN D.T. 1980. Floristic, environmental and lithotypic correlations in the Yallourn Formation, Victoria. In Truswell E.M. & Abell R.S. eds. The Cainozoic Evolution of Continental Southeast Australia. Records Bureau of Mineral Resources Geology and Geophysics Australia 1980/67. BOLGER P.F. 1984. Lithofacies assemblages and boundary relationships of the Tertiary Latrobe Valley Group and overlying strata in the Latrobe Valley, Victoria. M.Sc. Thesis, Monash University (unpublished).
Lithofacies variations and Late Cainozoic events, Gippsland Basin BOLGER P.F. 1985. Review report to September 1985 on the distribution and character of weathered coal in the Loy Yang Open Cut. Coal Research Division, SECV Geological Report No. 34. (unpublished). BOWLER J.M. 1982. Aridity in the late Tertiary and Quaternary of Australia. In W.R. Barker & P. J.M. Greenslade eds. Evolution of the Flora and Fauna of Arid Australia, pp. 35-45. Peacock Publications, Adelaide. CZYNSCINSKI K.S., BYRNES J.B. & DEDLOW G.W. Ill 1978. In situ red bed development by the oxidation of authigenic pyrite in a coastal depositional environment. Palaeogeography, Palaeoclimatology, Palaeoecology 24, 239-246. DAWSON J.R. 1983. Late Neogene vegetation communities and climatic implications ascertained from a study of eight cores from the Latrobe Valley Depression, Southeastern Australia. B.Sc. (Hons) thesis, Monash University (unpublished). FRAKES L.A. 1979. Climates Throughout Geologic Time. Elsevier, Amsterdam. GEORGE A.M. 1975. Brown coal lithotypes in the Latrobe Valley deposits. SECV, Exploration and Geological Division Petrological Report No. 17. GEORGE A.M. 1982. Latrobe Valley Brown Coal - Lithotypes: Macerals: Coal Properties. Australian Coal Geology 4, 111-130. GLOE C.S. 1976. Tertiary: Latrobe Valley Depression and Moe Swamp Basin. In J.G. Douglas & J.A. Ferguson eds. Geology of Victoria, pp. 263-267. Special Publication of the Geological Society of Australia No. 5. HALL J.T. 1981. Depositional environments and biostratigraphy of the Tertiary Latrobe Valley coals and interseams at Morwell, Victoria. B.Sc. (Hons) Thesis, Monash University (unpublished). HOCKING J.B. 1972. Geological evolution and hydrocarbon habitat, Gippsland Basin. Journal Australian Petroleum Exploration Association 12, 132-137. HOCKING J.B. 1976a. Definition and revision of Tertiary stratigraphic units, onshore Gippsland Basin. Report of the Geological Survey of Victoria 1976/1. HOCKING J.B. 1976b. Gippsland Basin. In J.G. Douglas & J.A. Ferguson eds. Geology of Victoria, pp.248-273. Special Publication of the Geological Society of Australia No. 5. HOLDGATE G.R. 1980. Geology of the Holey Plains - Coolungoolun Coal Fields and the WillungMerrimans Creek Area. SECV Exploration and Geology Division Report, July 1980.
179
HOLDGATE G.R. 1985a. Stratigraphy, structure and Brown Coals of the Moe area. Australian Coal Geology 5, 1-12. HOLDGATE G.R. 1985b. Latrobe Valley Brown Coals - their geometry and facies equivalents as a guide to depositional environment. Australian Coal Geology 5, 53-68. HOLDGATE G.R. 1985c. Stratigraphy of the Morwell 2 Aquifer Sands in Sectors 3 and 4 of the Morwell Open Cut. Coal Research Division, SECV Geological Report No. 31. (unpublished). JENKIN J.J. 1968. The geomorphology and Upper Cainozoic geology of southeast Gippsland. Memoirs of the Geological Survey of Victoria 27. KERSHAW A.P. & SLUITER I.R. 1982. The application of pollen analysis to the elucidation of Latrobe Valley Brown Coal depositional environments and stratigraphy. Australian Coal Geology 4, 169-186. KERSHAW A.P., BOLGER P.F., SLUITER I.R., BAIRD J. & WHITELAW M. 1986. The nature and evolution of lithotypes in the Latrobe Valley Coals. Abstracts, 12th International Sedimentology Congress, Canberra, Australia. KISS L.T. & KING T.N. 1977. The expression of coal analysis: the case for Brown Coals. Fuel 56, 340-341. KISS L.T. & KING T.N. 1979. Reporting of low rank coal analysis - The distinction between minerals and inorganics. Fuel 58, 547-549. MALLETT C.W. 1978. Sea level changes in the Neogene of Southern Victoria. Journal Australian Petroleum Exploration Association 18, 64-69. McBRIDE E. 1974. Significance of colour in red, green, purple, olive, brown and grey beds of Difunta Group, Northeastern Mexico. Journal of Sedimentary Petrology 44, 760-773. MIALL A.D. 1977. A review of the braided-river depositional environment. Earth Science Reviews 13, 1-62. MILLOT G. 1970. Geology of Clays. Springer Verlag, New York. MORAD S.D 1983. Diagenesis and geochemistry of the Visingo Group (Upper Proterozoic), Southern Sweden: a clue to the origin of colour differentiation. Journal of Sedimentary Petrology S3, 51-65. PARTRIDGE A.D. 1971. Stratigraphicpalynology of the onshore Tertiary sediments of the Gippsland Basin, Victoria. M.Sc. Thesis, University of New South Wales (unpublished).
180
P.F. Bolger
ROBERTS P.S. 1981. Explanatory notes on the Carrajung and Darriman 1:50,000 Geological Maps. Report of the Geological Survey of Victoria No. 67.
VAN HOUTEN F.B. 1972. Iron and clay in tropical savanna alluvium: a contribution to the origin of red beds. Geological Society of America Bulletin 83, 2761-72.
THOMAS D.E. & BARAGWANATH W.M. 1949. Geology of the Brown Coals of Victoria: Part 1. Mining and Geological Journal of Victoria 3, 28-55.
WALKER R.G. & CANT D.J. 1984. Facies Models 4: Sandy Fluvial Systems. In Walker R.G. ed. Facies Models, pp. 71-89. Geoscience Canada, Reprint Series 1, Second Edition.
THOMPSON B.R. 1981. The Gippsland Sedimentary Basin. Ph.D Thesis, University of Melbourne (unpublished). VANDENBERG A.H.M. 1978. Explanatory Notes on the Warburton 1:250,000 Geological Map. Report of the Geological Survey of Victoria 1977/7.
WALKER T.R. 1967. Formation of red beds in ancient and modern deserts. Geological Society of America Bulletin 78, 353-368. WEAVER C.E. & POLLARD L.D. 1975. The chemistry of clay minerals. Developments in Sedimentology, 15. Elsevier, Amsterdam.
Tertiary stratigraphic palynology and palaeoclimate of the inland river systems in New South Wales H.A. MARTIN School of Biological Science, University of New South Wales, P.O. Box 1, Kensington, New South Wales 2033, Australia. Palynofloras in the Lachlan River region extend from the Late Eocene to Pliocene-Pleistocene and are used to reconstruct existing vegetation. The fire history, as indicated by the carbonised particle count, provides valuable additional evidence of the nature of the environment. The vegetation from Late Eocene to Middle Miocene was rainforest. The Middle Miocene was a time of major change with the disappearance of the brassii type of Nothofagus in inland New South Wales. The Late Miocene and Middle-Late Pliocene Myrtaceae phase, formerly thought to be rainforest, is now interpreted as wet sclerophyll forest in light of the fire history. In the Early Pliocene Nothofagus phase, rainforest makes a brief resurgence but only the fusca and menziesii types of Nothofagus are represented. Climatic interpretations suggest a progressive reduction in precipitation through the recorded period except for a brief increase in the Early Pliocene. The hypothesis that changing sea level, through its influence on precipitation, was the main determinant of rainforest/wet sclerophyll forest representation during the Late Miocene-Pliocene when the climate was marginal for rainforest development is discussed. The palynology of five other major river systems in inland New South Wales is then compared with that of the Lachlan River. These other rivers, like the Lachlan, drain the western slopes of the Eastern Highlands, and during the Late Miocene-Pliocene would have drained into the Murray Basin. The depositional sequence in all of these river valleys is very similar. The Early Pliocene Nothofagus phase is detected in all the valleys in a similar position in the sequence. Similar patterns of climate and vegetation would also have existed, with variation consistent with that seen over the study area today. Key words: changing sea levels, palaeoclimate, palaeovegetation, palynofloras, Tertiary. INTRODUCTION
Tertiary palynofloras are known from numerous bores in New South Wales. Late Eocene to Early Miocene floras are found mainly in the Murray Basin with some isolated occurrences elsewhere. Middle Miocene palynofloras occur in some bores within the Murray Basin but their distribution here is somewhat erratic (Martin 1984a, 1984b, 1986). The Middle Miocene palynofloras occur also in the downstream parts of the river valleys (Martin 1980, 1981). Late Miocene to Pliocene floras are restricted to the river valleys with very few occurrences elsewhere (Martin 1973, 1979, 1987). The location of the Murray Basin and rivers flowing into it are shown in Figure 1. The Lachlan River region has been studied intensively and if the downstream area near Hillston within the Murray Basin is included
181
(Fig. 1), an almost continuous record may be reconstructed for the Late Eocene through Pliocene (Martin 1987). This paper presents a summary of the palynofloras of the Lachlan River region and an explanation for reconstructed palaeovegetation and palaeoclimates. The Late Miocene-Pliocene record of the other river valleys in New South Wales is then compared with that of the Lachlan River Valley. The sediments of this study are totally nonmarine and there is no independent evidence for dating. The sequence from Late Eocene to Middle Miocene has been assigned to the palynological zones of the Gippsland Basin (Stover & Partridge 1973) which have been independently dated on foraminiferal evidence. The Late Miocene-Pliocene sequence is not well-dated, and the ages given here are based on the general geology of the region (Martin
182
H.A.
Martin
1987). Moreover, the age ranges of stratigraphically important pollen species may be different in these inland areas from those of the Gippsland Basin (MacPhail 1987). For these reasons, the absolute chronology should be considered tentative. However, the evidence provides an internally consistent stratigraphic sequence.
PALYNOFLORAS OF THE LACHLAN RIVER REGION Figure 2 summarises the palynological divisions and major pollen groups of the Lachlan River region. From the Late Eocene - Middle Nothofagidites asperus Zone to the Middle Miocene - Triporopollenites bellus Zone, Nothofagus is the major pollen group and the brassii type accounts for most of it (N.B. the
usage of the different pollen types of Nothofagus follows Cookson (1959)). After the Middle Miocene, Nothofagus is replaced by Myrtaceae as the major pollen group. Some Nothofagus reappears in the Early Pliocene, but it consists of the menziesii and fusca types only. Asteraceae and Poaceae form relatively minor components until the Pleistocene. For a more detailed account of the palynofloras, see Martin (1987). The palynofloras dominated by Nothofagus are undoubtedly rainforest. The nature of the myrtaceous palynofloras, however, has long been problematical because of the broad ecological range of the Myrtaceae and difficulties in separating the various myrtaceous groups on pollen morphological variation. The 'eucalypt pollen type' Myrtaceidites eucalyptoides is present, but this type is found
Palynology and palaeoclimate, New South Wales inland river systems I EPOCH
PALYNOLOGICAL DIVISION
PLEIST
Asteraceae/Poaceae
MAJOR POLLEN
183
GROUPS Poaceae
Upper Myrtaceae Nothof ag us / gymno sperm:
Lower Myrtaceae
\ Other types of Nothofagus
T. bellus
P.
LACHLAN
VALLEY
HILLSTON
REGION
tuberculatus
Middle N. asperus 0 increasing
0 Increasing
Fig. 2 Summary diagram of the palynological subdivisions and the major pollen groups for the Late Eocene to Miocene in the Lachlan River region (modified from Martin (1987)). The Pleistocene-Late Miocene palynological divisions follow Martin (1973, 1987) and the Middle Miocene and older subdivisions are from Stover and Partridge (1973) and Partridge (1975), as modified for the Murray Basin (Martin 1984a). amongst Angophora and the bloodwood eucalypt species. Recent work (Chalson & Martin, manuscript) has shown a far greater diversity of pollen types amongst the eucalypts, and it is thought that the proportion of eucalypt pollen in these palynofloras has been underestimated. Some of the pollen in the myrtaceous group closely resembles rainforest taxa, such as Tristania, Syzygium, Backhousia etc. Although some grains are similar to extant genera, the identification of most grains is uncertain and for this reason the pollen count of the family, shown diagrammatically in Figure 2, has not been subdivided. As a number of rainforest taxa listed in Table 1 are consistently present in the myrtaceous palynofloras, the original interpretation of the palynofloras was rainforest (Martin 1978). However, rainforest taxa are not restricted to rainforest vegetation and may
also be found in wet sclerophyll forest. The fire history has an important bearing on this question. Figure 3 shows the carbonised particle content for the Lachlan River region. It is thought that most of these particles would have resulted from burning (Martin 1987). The proportion of carbonised particles is low through the Late Eocene to Middle Miocene. Carbonised particle content increases in the myrtaceous palynofloras of the Late Miocene, but is reduced in the Early Pliocene when Nothofagus reappears. The content increases again in the myrtaceous palynofloras wherever they occur, i.e., in the lower or upper Myrtaceae divisions, which have higher contents of carbonised particles than those palynofloras which are clearly rainforest, viz., the Late Eocene - Middle Miocene and the
184
H.A. Martin
Table 1 Rainforest pollen taxa in the myrtaceous palynofloras (from Martin 1987). Alchornea = Coelebogyne( rare) Cupanieae Elaeocarpus Helicia-Orites Ilex (rare) Macaranga-Mallotus Quintinia Symplocos Tasmannia Rainforest Myrtaceae, e.g. Tristania, Syzygium Dacrydium Dacrycarpus Podocarpus Phyllocladus Araucariaceae
Early Pliocene. The interpretation is that the myrtaceous palynofloras were subjected to more burning than those that are clearly rainforest. Under normal weather conditions, when compared with sclerophyll vegetation, rainforest rarely burns and exceptional drying is required, such as during a drought, before rainforest may be burnt (Webb 1970; Luke & McArthur 1978). Thus the myrtaceous palynofloras are unlikely to have been rainforest. However, "there can be little doubt that fire is an integral part of the environment" of wet sclerophyll forest (Ashton 1981). In wet sclerophyll forest, eucalypts are frequently dominant, the understorey contains some rainforest taxa, and tree ferns (e.g. Cyathea) are common. It is thought that the myrtaceous palynofloras are more likely to represent wet sclerophyll vegetation. More detail on the palaeovegetation and the original data used in forming these interpretations may be found in Martin (1987).
PALAEOCLIMATE
By the use of climatic parameters of the modern vegetation and of as many individual taxa as possible (Table 2), changes in precipitation levels through time have been reconstructed (Fig. 4). No great precision in levels of precipitation is inferred, the trend being more important. A surprising feature of this reconstruction is that there are long periods of relatively little change and short periods of major change. Temperatures are likely to have changed also; sea surface temperatures were probably some 10 °C higher in the Middle Miocene than today (Shackleton & Kennett 1975). Temperatures may be reconstructed from the vegetation but this is not attempted here, for it is thought that precipitation has been the major control of the vegetation. THE IMPACT OF CHANGING SEA LEVELS
The influence of changing sea levels on sedimentary deposition on the continental shelves is well known, but its influence on the areas which were permanently land is rarely considered. The likely impact of changing sea levels on vegetation, hence palynology, through its effect on climate is examined here. At times of high sea level, when the continental shelves are flooded with shallow seas, evaporation from the seas and therefore precipitation on adjacent land are higher. At times of low sea level, with the shoreline at the edge of the continental shelf, the climate of the once coastal land areas is more continental. The seas at the edge of the continental shelf are deeper and colder, hence both evaporation and precipitation are lower. It follows that changes in sea level would affect the climate and therefore the vegetation far from the shoreline. Figure 5 compares the changes in precipitation with those of sea level. The Late Miocene decrease in precipitation corresponds to a low sea level stand, with the increase in the Pliocene occurring at a time of high sea level.
185
Palynology and palaeoclimate, New South Wales inland river systems EPOCH PLEIST UJ Z LU
O
o* 10 -
PALYNOLOGICAL
FIRE HISTORY
DIVISION Aster aceae/Poaceae Upper
Myrtaceae
Nothofagus
Lower
LU LU o o 5
/ gyrnnosperm
Myrtaceae
z
T.
bellus
20-
t
LACHLAN VALLEY
HILLSTON REGION
<cr
C/5
UJ >-
zo
UJ
z
30
oUJ o o
40-
UJ z UJ o o UJ
P.
Middle
tuberculatus
N.
asperus 12
16
20
24
Carbonized particle count Total s p o r e / p o l l e n c o u n t
Fig. 3 Composite profile of the carbonised particle content, most of which is thought to be charcoal. The content is higher in the myrtaceous palaeovegetation. For bores used in this profile, see Martin (1987). Table 2 Climatic parameters used in the reconstruction of palaeoclimate (from Martin 1987). 1. Prominent brassii type Nothofagus of New Guinea. Precipitation ofl500-1800 mm, considerable cloudiness, high humidities (Johns 1982). Absent from areas of regular and sustained water deficit (Ash 1982).
5. Disappearance of rainforest element. Lower precipitation levels of major eucalypt species in west sclerophyll forest (Ashton 1981), about 500-700 mm (Boland et al 1984).
2. Nothofagus moorei, New South Wales. Prominent where precipitation exceeds 1800 mm, usually restricted to sites commonly fog bound (Baur 1957).
6. Limit of subcoastal rainforest pockets across north and northeastern Australia, between 600 mm and 800 mm (Webb & Tracey 1981).
3. Rainforest in New South Wales requires 1500 mm for widespread development (Baur 1957).
7. For regular burning, fuel must dry out regularly, i.e., there must be a well-marked dry period.
4. Wet sclerophyll forest covers large tracts receiving between 1000 mm and 1500 mm (Ashton 1981).
8. Precipitation today: Hillston, 350 mm p.a.; Forbes, 520-535 mm p.a.; Cowra, 610-630 mm p.a.
186
H.A. Martin
Fig. 4 Reconstructions of the changes in precipitation using the climatic parameters of the modern vegetation types (Table 2). There is no great precision in the levels of precipitation, the trend is more important.
The effect of changing sea levels on the vegetation is not always so marked. The Early-Middle Oligocene low sea level appears to have had little impact on the vegetation. It is thought that with the higher precipitation, fluctuations caused by changing sea level were insufficient to become limiting and cause disruption to the vegetation. In the MiocenePliocene, with an overall trend to a drier climate, precipitation was marginal for rainforest so that fluctuations caused by changes
in sea level could tip the balance between rainforest and wet sclerophyll forest. Low sea levels are usually regarded as times of erosion/non-deposition. The bore at Jemalong Gap (Fig. 6) has the most continuous sequence and is the only one to contain both the Nothofagus/gymno^Qim phase and the T. bellus Zone. The Nothofagus/gymnosperm phase, some 5 million years old, occurs at a depth of about 110 m, whereas the
Palynology and palaeoclimate, New South Wales inland river systems T. bellus Zone, some 10 million years older, is found at about 140 m depth, suggesting a hiatus between the two. This evidence thus provides some indication that the Late Miocene low sea level has caused erosion/ non-deposition.
A subsequent review of some 40 bores in the Lachlan River Valley (Martin 1987) shows no clear relationship between the Nothofagus and gymnosperm phases, other than they occur at about the same stratigraphic level, viz., close to the base of the sequence (Fig. 6). A vegetation mosaic within the Early Pliocene rainforest, with Nothofagus in some SEA LEVELS places and gymnosperms elsewhere, best fits r— PRECIPITATION the evidence. If the Myrtaceae phase only is PLEIST present in a bore, it is not possible to place it in the upper or lower phase since there is no distinctive floristic difference between the two (Martin 1987). Both the Nothofagus and gymnosperm phases are associated with the more carz bonaceous clays which are particularly well°o J developed at these stratigraphic levels (Martin 1987), and this is indicative of a wetter, swampier landscape. The nature of the Nothofagus phase changes with distance downstream. Figure 7 mmi / p a shows that the proportion of Nothofagus is Fig. 5 Variations in precipitation compared with highest upstream and probably represents sea level changes for the southern margin of the local stands in the vegetation. At Jemalong Australian continent, from Loutit and Kennett Gap, the furthest downstream site, the pro(1981). The Late Miocene drop in precipitation and portion is much less (2-4%), which may represubsequent rise in the Early Pliocene correspond sent long distance transport with the pollen to the low sea level and subsequent rise respectively. coming from the stands further upstream. As discussed previously, all of the occurrences of Nothofagus are found at the same THE EARLY PLIOCENE NOTHOFAGUS stratigraphic level (Fig. 6). Moreover, the Jemalong Gap bore shows a decrease in carPHASE bonised particles in the Nothofagus phase, as The Nothofagus phase was originally do the bores with higher proportions of described from the Lachlan River Valley Nothofagus further upstream (Martin 1987). (Martin 1973). In the bore of this study, the This supports their position in the Nothofagus Nothofagus phase is overlain by the gymno- phase. sperm phase. The lower Myrtaceae phase underlies the Nothofagus phase and the upper Myrtaceae phase occurs above the gymno- Evidence from Other River Valleys sperm phase as shown in Figure 2. It should Climatic change is unlikely to have occurred be noted that only the menziesii and fusca within the Lachlan River Valley in isolation pollen types are found in the Early Pliocene from surrounding regions. Martin (1986) has Nothofagus phase, which is thus quite distinct summarised the evidence and suggests a from Late Eocene to Middle Miocene palyno- climatic gradient parallel to that of today, i.e. floras with abundant brassii pollen (see drier to the northwest and wetter to the Fig. 2). southeast. Thus the climatic change of the
\
UJ
UJ
1000
187
188
H.A. Martin A' J e m a l o n g Gap
i] Upper M y r t a c e a e phase
PliocenePleistocene
| Gymnosperm phase | Nothofagus
phase
•(Lower M y r t a c e a e phase T. bellus
P.
Zone
tuberculatus Zone
ELEVATED 100m
Approximate scales
Fig. 6 A longitudinal section of the Lachlan River Valley showing the stratigraphic position of the Middle Miocene-Pliocene palynological divisions (modified from Martin (1987)). Bore 14747 was used for the original description of the Nothofagus and Gymnosperm phases, but the relationship of the two phases in this bore is not seen in any other. See text for further discussion. All bore numbers quoted are those of the New South Wales Department of Water Resources.
Depth
SPORE POLLEN C O U N T S
(m)
12423
2
P
IP % of
total
count
h-
14747
™
f
f
21019 14707
36 079
Gymnosperms
Casuarinaceae
Myrtaceae
Nothofagus
Asteraceae Poaceae
J E M A L O N G GAP/
COWRA
Fig. 7 The Nothofagus phase in the Lachlan River Valley, showing that the actual Nothofagus content may vary considerably. C - Cyathea; m - menziesii pollen type of Nothofagus; f - fusca pollen type of Nothofagus (Martin 1987). Bore numbers are those of the New South Wales Department of Water Resources.
Palynology and palaeoclimate, New South Wales inland river systems Lachlan River Valley should be found elsewhere on the western slopes of the Eastern Highlands, although it may be modified in accord with geographic distance and a climatic gradient. The other rivers of the Western Slopes drained into the Murray Basin (Fig. 1) in a similar way to the Lachlan, and should have been subjected to similar influences as those seen in the Lachlan.
189
basement distinguish those places which have been determined palynologically. All bore numbers quoted are those of the New South Wales Department of Water Resources of New South Wales. Namoi River System. (Fig. 8). The T. bellus Zone is found downstream of Narrabri (Fig. 7) with one isolated occurrence further upstream. The Late Miocene-Pliocene sequence is restricted to upstream of Narrabri, the Mooki River and Cox's Creek (Martin 1979, 1980, and unpublished).
In the Lachlan River Valley, the Nothofagus phase is found near the base of the Tertiary alluvial sequence. The pre-Tertiary basement may be determined in one of two ways: palynologically; or, if palynofloras are unavailable from the relevant bore, from the driller's log. The driller detects basement by the change from soft, unconsolidated sediments to hard rock (or its decomposing equivalent). In some of the river valleys the pre-Tertiary basement is soft, unconsolidated Permian or Triassic sediments, and here only palynology can distinguish the pre-Tertiary basement from the Tertiary alluvial fill. Thus where the driller's log is used to determine basement, such determinations may not be reliable. For these reasons, the following diagrams (Figs. 8-12) showing the pre-Tertiary
Sections in the Boggabri and Cox's Creek areas both show an occurrence of the Nothofagus phase near the base of the sequence but not on the pre-Tertiary basement. Only a few percent of Nothofagus is found here but it occurs in a similar stratigraphic position to that of the Lachlan River Valley, viz., well down in the Tertiary sequence. Castlereagh River System (Fig. 9). The T. bellus Zone is found downstream of Gilgandra. The Late Miocene-Pliocene sequence in NARRABRI
B
M •M
3 / GUNNEDAH ,
s)
CO I
•M M
* •M
A*
SEA LEVEL
T. bellus
%
E
x Zone
•M ?®
o m
Myrtaceae phase
® N
Nothofagus
_ L
Basement
^
Basement determined palynologically
phase
•M
Ap proa mate scale
ELEVATED 100m
Fig. 8 The Namoi River and Cox's Creek sections; both show the Nothofagus phase near the base of the sequence. See text for further explanation.
190
H.A. Martin
CM 10 NCO CD CO
o
CO CO CO CO CO
A1
O) o
CO CO CO
CO CO VGILGANDRA
M • M
SEA LEVEL
o M Myrtaceae phase €> N Nothofagus phase
• M ELEVATED 200m m i-o
• M •N
• r
* T
rr
T. bellus
Zone
. Basement
L20 Approximate scale
Fig. 9 The Castlereagh River section, showing one occurrence of the Nothofagus phase close to the base of the sequence. See text for further explanation. o CO CO CO
• M
o ^ A' o
0>
i
00
CO
Is
I "
SEA LEVEL ELEVATED 200m
• A/
o M
• M
© N
Myrtaceae phase Nothofagus phase
*
7". be//us
I -
Basement
Zone
w
Basement determined palynologically
L20 m
Approximate scale
Fig. 10 The Macquarie River system, with several occurrences of the Nothofagus phase.
•
Palynology and palaeoclimate, New South Wales inland river systems
B 00o>
co to co in
CO
m
A'
A
N CO O
CO
$CO
CD
CM
CM
in
•M • M
•M
•M
i)B
N
•P PP
'M
B'
CM
•M
oo co in
CD
o o> in
CM
CM
191
•N •fl
•M P
Pleistocene
p p
Pliocene-Pleistoaene
Approximate scale
-o
•M M
20
• ?r
o M
Myrtaceae phase
® N
Nothofagus
T
• T
, •
OLIGOCENE
T. be 11us -
phase Zone
Basement
lNARRANDERA
OLIQDCENE
OLIGOCENE
SEA LEVEL LATE E O C E N E
Fig. 11 The Murrumbidgee River system, with sections at Narrandera and Wagga. The Nothofagus phase is well developed at Wagga. See text for further explanation.
this region is rather disjointed (Martin 1981) and patterns are not clear-cut. The one occurrence of low frequencies of Nothofagus is close to the base of the sequence, hence the same general pattern is probably found as in the Namoi River system. The Castlereagh River system is somewhat different to the others in that it was not a major tributary (J. Ross, pers. comm.). Macquarie River System (Fig. 10). There is one isolated occurrence of the T. bellus Zone
upstream at Mudgee. The Late MiocenePliocene sequence is found around Dubbo and the Nothofagus phase is well down in the sequence. Nothofagus is found in several bores but in low frequencies here also (Martin, unpublished). Murrumbidgee River System (Fig. 11). At Narrandera, the Late Miocene-Pliocene sequence overlaps the Late Eocene - Middle Miocene sequence (Martin 1984a). The older
192
H.A. Martin
B
M N
• ?r
N
or older • /V
JL* o
m
Myrtaceae phase
® N
Nothofagus
phase
*
T
T. bell us
Zone
^
Basement determined palynologically
Approximate scale
k MULWALA
®
Basement
®B' COROWA
Fig. 12 The Murray River system, with the Nothofagus phase present in all but one of the bores. See text for further explanation.
part of the sequence occurs in a long narrow embayment extending a few kilometres upstream of the edge of the Murray Basin. This embayment is the earliest recognisable stage of the Murrumbidgee River System (Woolley 1978). In the younger sequence, there is a thick interval of sand immediately above the T. bellus Zone from which pollen has not been recovered. The Nothofagus phase has not been found here, but its absence may be the result of unsuitable lithologies for pollen accumulation. At Wagga, the Nothofagus phase is found at the base of the sequence. The Nothofagus content is particularly high, 17-27%, and very high fern spore counts, up to 60%, may be found at the same stratigraphic levels (Martin 1973). Murray River System (Fig. 12). The T. bellus Zone is found near Mulwala. Two sec-
tions here show the Nothofagus phase near the base of the sequence. The assemblage in bore 36351 has 12% Nothofagus whereas all the other occurrences of the Nothofagus phase have a few percent. There is one bore at Albury with the Nothofagus phase (Martin, unpublished). In summary, all of the river systems studied show the Nothofagus phase well down in the Tertiary sequence. The Nothofagus phase is more common and higher percentages of Nothofagus are found more frequently in the southern rivers and within close proximity to the highlands. DISCUSSION The Late Miocene-Pliocene sequence of the Lachlan River Valley has been identified in all of the major river valleys of the Western Slopes of the Eastern Highlands. The Early
Palynology and palaeoclimate, New South Wales inland river systems Pliocene Nothofagus phase is found in all of the river valleys also, in approximately the same stratigraphic position, close to the base of the Tertiary sequence. These river systems must have had similar vegetation, climatic and depositional histories. The Nothofagus phase varies over the extent of its geographic range. Percentages of Nothofagus are higher in the southern rivers and closer to the highlands. It is thought that these regions were wetter, hence more suitable for the growth of Nothofagus if the climatic gradients of the Tertiary paralleled those of today. The patterns observed here suggest that relic stands of Nothofagus were restricted to the wetter climate of the highlands during the Late Miocene. With increased precipitation in the early Pliocene, Nothofagus communities migrated down the river valleys. The presence of low frequencies of Nothofagus pollen is taken to represent long distance transport from stands further upstream in the valley at the same time that Nothofagus migrated into the valley. The variation exhibited within the Nothofagus phase is not considered a problem, and might be expected, given the size of the study area. There is sufficient evidence from the river valleys to support the hypothesis of a drier climate in the Late Miocene, a climate similar to that of the Middle-Late Pliocene. The evidence is not extensive and the sequence is thin, as would be expected during a time of erosion/non-deposition which would accompany a low sea level, and it probably required special and unusually favourable conditions for the evidence to be preserved at all. It is interesting to note that the carbonaceous clays associated with the Nothofagus phase have long been regarded as Pliocene (Williamson 1961) and that this age appears to have been based on the views of Dr. Isabel Cookson who palynologically examined some of these clays. Burbidge (1960) discusses a "swing back to subtropical conditions" (i.e. increased precipitation) in the Pliocene. When asked about the evidence for increased precipitation, Burbidge (pers. comm.) replied
193
that she was influenced by the opinions of others. In the context of her paper, Cookson's views may well have been the basis of these opinions! Thus the palynology of innumerable bores over a period of more than 20 years has produced a greatly elaborated story which, however, is in general accord with the sketchy outline of the early 1960s. It highlights the importance of palynology which presents internally consistent patterns, in spite of tentative dating.
ACKNOWLEDGEMENTS
I am indebted to the Department of Water Resources, New South Wales for assistance financially and with background information for this study. I thank Mr. J. Ross for invaluable assistance.
REFERENCES
ASH J. 1982. The Nothofagus Blume (Fagaceae) of New Guinea. In Gressitt J.L. ed. Biogeography and Ecology of New Guinea, pp. 355-380. Junk, The Hague. ASHTON D.H. 1981. Tall open-forests. In Groves R.H. ed. Australian Vegetation, pp. 121-151. Cambridge University Press, Melbourne. BAUR G.N. 1957. Nature and distribution of rainforests in New South Wales. Australian Journal of Botany 5, 190-233. BOLAND D.J., BROOKER M.I.H., CHIPPENDALE G.M., HALL N., HYLAND B.P.M., JOHNSTON R.D., KLEINIG D.A. & TURNER J.D. 1984. Forest Trees of Australia. NelsonCSIRO, Melbourne. BURBIDGE N.T. 1960. The phytogeography of the Australian region. Australian Journal of Botany 8, 75-212. CHALSON J.M. & MARTIN H A. (manuscript). The pollen morphology of some species of the family Myrtaceae and its use in the identification of dispersed pollen. COOKSON I.C. 1959. Fossil pollen grains of Nothofagus from Australia. Proceedings of the Royal Society of Victoria 71, 25-30. JOHNS R.J. 1982. Plant zonation. In Gressitt J.L. ed. Biogeography and Ecology in New Guinea, pp.309-330. Junk, The Hague.
194
H.A. Martin
LOUTIT T.S. & KENNETT J.P. 1981. Australian Cainozoic sedimentary cycles, global sea level changes and deep sea sedimentary record. Oceanologia Acta S.P. Proceedings 26th International Geological Congress, Geology of Continental Margins Symposium, Paris. July 7-17, 1980, pp. 45-63. LUKE R.H. & McARTHUR A.G. 1978. Bushfires in Australia. Australian Government Publishing Service, Canberra. MacPHAIL M.K. 1987. Palynological analysis BMR Manilla-1 borehole, Murray Basin. Bureau of Mineral Resources, Geology and Geophysics Record 1987/58. MARTIN H.A. 1973. Upper Tertiary palynology in New South Wales. Special Publication of the Geological Society of Australia 4, 35-54. MARTIN H.A. 1978. Evolution of the Australian flora and vegetation through the Tertiary: evidence from pollen. Alcheringa 2, 181-202. MARTIN H.A. 1979. Stratigraphic palynology of the Mooki Valley, New South Wales. Proceedings of the Royal Society of New South Wales 112, 71-78. MARTIN H.A. 1980. Stratigraphic palynology from shallow bores in the Namoi and Gwydir River Valleys, north-central New South Wales. Proceedings of the Royal Society of New South Wales 113, 81-87. MARTIN H.A. 1981. Stratigraphic palynology of the Castlereagh River Valley, New South Wales. Proceedings of the Royal Society of New South Wales 114, 77-84. MARTIN H.A. 1984a. The stratigraphic palynology of the Murray Basin in New South Wales: II. The Murrumbidgee Area. Proceedings of the Royal Society of New South Wales 117, 35-44. MARTIN H.A. 1984b. The stratigraphic palynology of the Murray Basin in New South Wales: III. The Lachlan Area. Proceedings of the Royal Society of New South Wales 117, 45-51.
MARTIN H.A. 1986. Tertiary stratigraphy, vegetation and climate of the Murray Basin in New South Wales. Proceedings of the Royal Society of New South Wales 119, 43-53. MARTIN H.A. 1987. Cainozoic history of the vegetation and climate of the Lachlan River region, New South Wales. Proceedings of the Linnean Society of New South Wales 109, 213-257. PARTRIDGE A.D. 1975. Late Neogene sporepollen zonation. Presented at Victorian Branch of the Geological Society of Australia. Symposium on Bass Strait Geology, 20 November 1975 (unpublished). SHACKLETON N.J. & KENNETT J.P. 1975. Palaeotemperature history of the Cainozoic and the initiation of Antarctic glaciation: Oxygen and carbon isotope analyses in DSDP sites 277, 279 and 281. Initial Report of the Deep Sea Drilling Project 29, 743-755. STOVER L.E. & PARTRIDGE A.D. 1973. Tertiary and Late Cretaceous spores and pollen from the Gippsland Basin, southeastern Australia. Proceedings of the Royal Society of Victoria 85, 237-286. WEBB L.J. 1970. Eastern Australian environments in relation to fire. In Environments to order?" Proceedings of a Symposium, Australian Museum, 8 August 1970, pp. 5-8 (unpublished). WEBB L.J. & TRACEY J.G. 1981. Australian rainforests: patterns of change. In Keast A. ed. Ecological Biogeography of Australia, pp.605-694. Junk, The Hague. WILLIAMSON W.H. 1961. Some aspects of late Cainozoic geology of the Lachlan Valley, New South Wales. Presented at ANZAAS Congress, Brisbane 1961 (unpublished). WOOLLEY D.R. 1978. Cainozoic sedimentation in the Murray Drainage Basin, New South Wales section. Proceedings of the Royal Society of Victoria 90, 61-65. (t
The late Cainozoic magnetostratigraphy and preliminary palynology of Lake George, New South Wales J.R.C. McEWAN MASON Department of Earth Sciences, Monash University, Clayton, Victoria 3168, Australia. Previous magnetostratigraphic investigation of Lake George sediments dated the Lake George Basin as Middle Miocene or older (Singh et al 1981). This magnetostratigraphic study of a single 166 m core, C354, suggests that the basin sediments are considerably younger. Three magnetic chrons, the Brunhes, Matuyama and Gauss, and a number of subchrons, the Jaramillo, Olduvai and Reunion within the Matuyama Chron, and the Kaena and Mammoth within the Gauss Chron, were identified. In the Brunhes Chron, the majority of sediments were found to be magnetically stable, and magnetostratigraphic interpretation is considered to be reliable. The sediments of the Matuyama are a mixture of stable, moderately stable and unstable samples. The Gauss is generally composed of unstable sediments, and hence magnetic interpretation is considered to be unreliable; the Kaena and Mammoth Subchrons are therefore only tentatively recognised. The deepest, most reliable boundary is the Matuyama/Gauss boundary (2.48 Ma) (Harland et al 1982) at 87 m. Palynological analysis of four cores (C353, C354, C355 and C358) in the Lake George Basin reflect two very different types of assemblage: firstly, taxa that have modern day affinities with temperate rainforest communities; and secondly, those that are more typical of open canopied (sclerophyll) communities. In this study the rainforest communities are magnetically dated as early Late Pliocene. In the cores the rainforest assemblage occurs in a narrow band of sediment at different stratigraphic levels, and can be used as a method of core correlation. The open canopied assemblages are magnetically dated as early Late Pliocene to Pleistocene. These assemblages occur intermittently, separated by palynologically barren sediments. Key words: Lake George, magnetostratigraphy, Miocene, palynology, Pleistocene, Pliocene, rainforest, sclerophyll.
INTRODUCTION
The Lake George Basin is a narrow, meridionally trending drainage area located on the southern tablelands of New South Wales about 40 km northeast of Canberra (Fig. 1) (Singh et al 1981). It originated at some time in the Tertiary as a result of faulting, possibly reviving late Paleozoic faulting (Abell 1985). Today, Lake George is 25 km in length and 11 km at its widest point (Singh et al 1981). The lake is located at 35 ° 05 'S and 149 ° 25 'E at an elevation of 674 m above sea level (Abell 1985). In 1982/83 the lake dried out as a result of a severe and prolonged drought, enabling the Bureau of Mineral Resources (BMR) to gain access to the lake bed. A series of twelve cores was drilled through the lake sediments until bedrock was reached. Core C354 was chosen for magnetic analysis because, reaching 166 m, it represented the deepest cored material
available from the basin (Abell 1985). There had also been a good recovery rate of 78.4 percent, and the core contained several sections of dark, fine-grained lithologies suitable for palynological analysis. The reasons for undertaking magnetic analysis of C354 were: to confirm and extend the palaeomagnetic dating of earlier work carried out by Opdyke, as described in Singh et al (1981), by using the deepest sediments (166 m) available from the basin; and to establish an independent chronology for comparison with stratigraphicpalynological information. The locations of core C354 and the ANU cores are shown on Figure 1. MAGNETOSTRATIGRAPHY Methods
Two hundred and ten samples were extracted for magnetic analysis from core C354. The sample interval was not greater than one 195
196
J.R.C. McEwan Mason
Fig. 1 Location of cores C354, LG4 and C4 in the Lake George Basin.
Magnetostratigraphy and palynology, Lake George, New South Wales metre except in six sections where core was missing. Four of the sections (64.9 - 66.2 m, 72.4 - 74.3 m, 78.2 - 79.5 m and 83.4 - 84.7 m) had no core recovery, probably as a result of the coarse nature of the sediments. Two other sections, 46.6 - 48.6 m and 54.3 - 57.2 m, had been recovered but were missing from the Fyshwick Core Laboratory at the time of the study. In most cases the sample interval was between 60-80 cms. The sample depths were measured from the top of each core section. Depths are accurate where the core recovery was good (90 - 100%). However, they are less accurate where core recovery was less than 90%, and are perhaps as much as 20-30 cms out of place in those samples. Each sample was collected using a square section tubular punch, mounted on a drill press. After extraction from the main core, each sample was placed in a 7.4 cc P and A plastic pot. The excess sediment was removed, and the pot was sealed with a plastic lid, the arrow on the pot pointing towards the top of the core to indicate orientation. For all measurements orientation was related to the top and the base of the core. In the absence of other orientation information, only inclination analysis was undertaken. Declination within each sample could have been measured but, as the core was rotary drilled, the measurements could not have been related to geographical coordinates. Magnetic intensity and susceptibility are not affected by core rotation and do provide insight into the magnetic reliability of the sediments. In most magnetic studies of this nature, more than one sample per depth interval is extracted to enable orientation data to be compared. For this reason, cores are usually halved longitudinally and samples are taken adjacent to each other from the halves. An alternative method is to extract enough sediment per depth interval to completely fill two pots. In the case of C354, only one sample per depth was taken, as the core had not been halved, and the pots were too large (7.4 cc) for two samples to be taken from each depth. A third method was tried to overcome this problem.
197
A sample was extracted from one side of the core; the core was then inverted and a second sample was taken. However, because of the hole made by extraction of the first sample, the sediment deformed, destroying the orientation of the second sample. Susceptibility and cryogenic measurements were taken for 210 samples, using the Australian National University built susceptibility bridge described by Collinson and Molyneaux (1967) and the cryogenic magnetometer at the ANU/BMR Black Mountain Laboratory, ACT. After measuring the natural remanent magnetism (NRM) of each sample, each was put through a series of alternating field (AF) demagnetisation steps. For the majority of samples (132) the treatment began at 5 milliteslas (mT) peak field. A second set of samples (78) was measured initially at 2.5 mT. Thereafter, both sets of samples were subjected to 'AF' treatments, which were increased in increments of 2.5 mT until 20 mT was attained. Increments were then changed to steps of 5 mT until 50 mT. Between each 'AF' treatment and subsequent cryogenic measurement, samples were stored in a box made of Mu-metal for protection from the earth's magnetic field. Data were analysed using programs designed by the BMR palaeomagnetist Gidding (1986). The information was plotted in the form of stereoplots (equal angle), orthogonal diagrams (Zijderveld diagrams) and intensity histograms. Susceptibility, intensity and Q ratios (intensity divided by susceptibility) together with inclinations were plotted against core lithology (Fig. 2). Palaeomagnetic Sample Stability In order to assess the quality of magnetic data in C354, it was necessary to evaluate the magnetic stability of every sample. This was accomplished with the aid of demagnetisation curves, orthogonal plots and stereoplots. Four categories of stability were determined: stable, moderately stable, unstable and very unstable. A sample is said to be stable if the direction of magnetisation remains unchanged over a
J.R.C. McEwan Mason
198
MAGNETOSTRATIGRAPHY
LI T H O L O G Y
WEATHERING
INCLINATION -90
+90
INTENSITY 0.0
SUSCEPTABILITY 100.0
LITHOLOGY Sandy silt | -*--".- j
Pino to medium sarid
fV®v]
Coarse sand
10
• j/Vj'j
Kaolinitic
^saaj
Black Clay
iH
SiN Sandy clay
MAGNETOS! RATIGRAPHY |
Normal polarity
^J
Reversed polarity
£++4
Erratic
• • •
Formation boundaries
70
(B / M) Brunhes / Matuyama Boundary
(M / G) Matuyama / Gauss Boundary
Fig. 2 Lithology, weathering and magnetic characteristics of Lake George core C354.
Magnetostratigraphy and palynology, Lake George, New South Wales
101
199
116
100 1 80I O 2
10
20
10
30
23
20
30
40
50
20
30
40
50
302 120-
*
-80
10
20
30
40
50 -40-
-160-
-240 H
10 AF(mT)
AF(mT)
Fig. 3 Variations of magnetic stability as depicted in four demagnetisation curves from core C354.
200
J.R.C. McEwan Mason
long period of geological time (Zijderveld 1967). The reverse situation applies to unstable samples. Each sample in the core was placed in one of these groups after examination of its individual diagrams. For the purpose of illustration, four samples, representing one of each of the four degrees of magnetic stability, were selected (Fig. 3). In the 166 m of sediment in C354, a number of magnetic reversals were recognised relating to the Brunhes, Matuyama and Gauss
Chrons. The magnetic stability varied substantially between these chrons as depicted in Figure 4. In the Brunhes Chron the majority of samples (67.6%) were magnetically stable; this compared with 25.3% in the Matuyama and 2.2% in the Gauss. Moderately stable samples in the Brunhes Chron comprise 29.4%. They dominate the samples in the Matuyama, reaching 43.7%, but are significantly less (15.7%) in the Gauss. Unstable samples constitute 2.9%, 23.0% and 12.4% in the Brunhes, Matuyama and Gauss Chrons
70
60
50 C/) LU
40
cn< O 30
DC UJ CD
20 =) z: 10
BRUNHES
MATUYAMA
STABLE
UNSTABLE
GAUSS
MODERATELY STABLE
II
VERY UNSTABLE
Fig. 4 Variation in magnetic stability between the Brunhes, Matuyama and Gauss Chrons in core C354.
Magnetostratigraphy and palynology, Lake George, New South Wales respectively. The Brunhes Chron does not contain any very unstable samples. This contrasts with 8% in the Matuyama and the majority of samples in the Gauss Chron. These magnetic differences are related to lithology and weathering patterns within the sediment. Core C354 is divided lithologically into the Gearys Gap, Ondyong Point and Bungendore Formations. The Bungendore and the greater part of the Ondyong Point Formations are equivalent to the Brunhes and the Matuyama magnetic Chrons, which contain intermittent ferruginous weathering horizons. In contrast the deeply weathered lower portion of the Ondyong Point and the Gearys Gap Formations, which correlate with the Gauss magnetic Chron, contain ferruginous, ferruginous and kaolinitic, and kaolinitic horizons. It is therefore appropriate to place less reliance on the inclination values and subsequent magnetostratigraphic interpretation of C354 samples taken from the Gearys Gap Formation than on those from the overlying Ondyong Point and Bungendore Formations. Magnetostratigraphic Interpretation The palaeomagnetic analysis and subsequent interpretation of inclination values obtained from C354 have resulted in the identification of several changes between negative (normal) and positive (reversed) polarity. The upper 18.70/18.93 m of core correspond to negative inclinations with the exception of a single positive inclination value at 17.38 m. The sediments between 0 and 18.70/18.93 m were deposited during the Brunhes magnetic Chron. According to Harland et al (1982), the Brunhes/Matuyama boundary is dated at 0.73 Ma. Therefore, the sediments in C354 at 18.70/18.93 are 0.73 Ma. As the sediments are magnetically stable in this part of the core, this interpretation can be made with confidence. The sediments between 18.70/18.93 m and 87.70/87.85 m are dominated by positive inclination values and correspond with the Matuyama Chron. Three subchrons were also identified within this chron. The Jaramillo Subchron is located at a depth of between
201
21.04/21.19 m and 28.15/28.45 m. The second subchron corresponds to the Olduvai and is found between 54.26/58.90 m and 62.36/62.51 m. The upper boundary may coincide with the formation boundary which separates the lower Ondyong Point Formation from the younger Bungendore Formation. Unfortunately, the sediments between 54.30 m and 57.20 m are missing from C354, so the boundary could not be identified more precisely. The base of the Olduvai is more clearly defined and lays between 62.36 m and 62.51 m. The Reunion Subchron appears in C354 at a depth of 67.66/67.81 m and continues to a depth of 68.58/68.90 m. This subchron is characterised by Harland et al (1982) as two short lived negative events. The Reunion in C354 appears to be a single event. The inclination values of both the upper and lower boundaries are well-defined and demonstrate the transitions associated with changes in polarity. The Matuyama/Gauss boundary is also marked by a well-defined transition series of inclinations at a depth of 87.70/87.75 m. The sediments above this are dominated by samples which are magnetically stable or moderately stable, so interpretation is reliable. The same cannot be said for the sediments below the Matuyama/Gauss boundary. However, two possible polarity reversals corresponding to the Kaena and Mammoth Subchrons were identified, if only tentatively. From 115.60/115.80 m to 117.82/117.97 m the sediments have positive inclination values. These probably represent the Kaena Subchron. If this interpretation is correct, the sediment at this depth dates between 2.92-3.01 Ma. Another set of positive inclination values between 123.78/124.08 m and 129.32/129.57 m may be attributed to the Mammoth Subchron. These would therefore date the sediments between 3.05-3.15 Ma. But this event, as with the Kaena, is only tentative because of the magnetically unstable nature of the sediments. Below this the inclination values are extremely erratic and are of little interpretative use.
202
J.R.C. McEwan Mason
Sedimentation Rates and Linear Relationships: Confirmation of the Assigned Magnetostratigraphic Interpretation Some assessment of the reliability of the proposed magnetostratigraphic interpretation can be determined from a consideration of inferred sedimentation rates. As a basis for comparison, the magnetostratigraphy of C354 is plotted against the magnetic time scale of Harland et al (1982) (Fig. 5). Lines from the boundaries of both the magnetic time scale and the chrons and subchrons identified in C354 converge, eventually intersecting each other. These intersections are then joined by a line of best fit. In this particular figure, the line is not straight but deviates twice from its original direction, simulating changes in the sedimentation rate within the sequence. The average sedimentation rate from 0 to the basal boundary of the Olduvai (62.36 m) is 3.3 cm/1000 yr. From the basal boundary of the Olduvai (66.36 m) to the Matuyama/Gauss magnetic boundary (87.70 m), the sedimentation rate increases to 4.2 cm/1000 yr. A third change in the sedimentation rate (6.2 cm/1000 yr) is detected from 87.70 m to the base of the Mammoth Subchron (129.32 m), after which the magnetic content is too unstable to justify any interpretation (Table 1). The average sedimentation rate based on the linear relationship increases towards the bottom of the Lake George sequence, supporting the actual sedimentation rate calculated for the Brunhes and Matuyama Chrons. The anomalies arising between the actual sedimentation rates for the subchrons and the average rates may be due partially to inaccurate boundary placements which might have occurred because of missing sections of core or unsampled horizons. The higher than average sedimentation rate for the Jaramillo Subchron poses a particularly difficult problem. According to the line of best fit, the upper boundary should fall at approximately 25 m rather than at 21.19 m as the magnetostratigraphy suggests. This
would reduce the sedimentation rate from 13.92 cm/1000 yr to 0.08 cm/1000 yr. Given that the sediments in this part of the sequence are fine-grained clays deposited in a lacustrine environment, the higher sedimentation rate for the Jaramillo is difficult to understand. The magnetic data between 21.19 m and 25 m are either magnetically stable or moderately stable, reinforcing the original placement of the boundary at 21.19 m. However, the low Q ratios from 19 m to 28 m may indicate that the magnetic properties in the sediments are unfavourable. No conclusion is forthcoming. A second discrepancy occurs with the upper boundary of the Olduvai. The magnetic boundary falls below that postulated by the line of best fit, 58.90 m, compared to 56.50 m. This may be because 2.9 m of sediment (54.30 m to 57.20 m) are missing from the core. Under these circumstances sampling was impossible, and the true magnetic boundary was unattainable. From the base of the Olduvai magnetic boundary to the Matuyama/Gauss boundary, the sedimentation rate increases from 3.3 to 4.2 cm/1000 yr. The line of best fit between these two points intersects with the upper boundary of the proposed Reunion Subchron at 67.81 m, supporting the existence of the boundary at that depth. The lower boundary is placed at 68.58 m by magnetic interpretation but does not plot directly on the line of best fit, which suggests that it should be placed at 71 m. The sediments between 68.58 m and 70.95 m were extensively sampled, but most of the magnetic data was either unstable or very unstable as shown in Q ratios, Zijderveld projections, stereoplots and demagnetisation histograms. The positive inclination assigned to these particular sediments is, therefore, questionable. Between 70.95 m and 74.3 m the sediments were unsampled, partially due to a 1.9 m (72.4 m to 74.3 m) section of missing core. Unfortunately, as the extensive sampling did not extend beyond 70.95 m, sediment at 71 m, predicted by the line of best fit, was not sampled.
Magnetostratigraphy and palynology, Lake George, New South Wales
203
Age (Millions of Years)
Brunhes
Matuyama s Jaramlllo
C M IC7> O) oo
I
Gauss Olduval Reunion
Kaena Mammoth
cm t- qm^ in «
o> q
CM CO
CO CO
^
z
o cc UJ DC
8
Z LU O z u
CO
40
50
missing
missing
60
Z o
<D Q
80
90
H00I
\\30l Q. <
e> w > QC < UJ a 160 L
Fig. 5 Magnetostratigraphy of core C354 plotted against the magnetic time scale of Harland et al (1982). Black, white and crossed sections represent normal, reversed and unstable, and very unstable (erratic) magnetic directions respectively.
204
J.R.C. McEwan Mason
Table 1 Calculated sedimentation rates for the chrons and subchrons identified in C354. Depth (m) of chron or subchron
Boundary ages (Ma)
Sedimentation rate in cm/1000 yr
Brunhes Oto 18.70
0 to 0.73
2.5
Jaramillo 21.19 to 28.15
0.92 to 0.97
13.9
Olduvia 58.90 to 62.36
1.67 to 1.87
1.7
Reunion 67.81 to 68.58
2.01 to 2.14
0.5
Matuyama 18.93 to 87.70
0.73 to 2.48
3.9
Kaena 115.80 to 117.82
2.92 to 3.01
2.2
Mammoth 124.08 to 129.32
3.05 to 3.15
5.2
The sedimentation rate increased again from 4.2 to 6.2 cm/1000 yr between the Matuyama/Gauss boundary and the base of the Mammoth Subchron. The assigned depths of the Kaena and Mammoth Subchrons seem generally to plot in their predicted places, but it must be reiterated that the sediments in this part of the core are very unstable, and uncertainty is paramount. It is possible that the three major different rates of deposition suggested by the linear relationship are related to the sedimentary formations identified in the basin sediments (Abell 1985). The fluvial sands and gravel with minor clay and silt horizons, making up the Gearys Gap Formation, and the fluvial sands in the lower portion of the Ondyong Point Formation were probably deposited rapidly, as they would be in a similar situation today. The average sedimentation rate (6.2 cm/1000 yr) calculated for these sediments is, therefore, in agreement with the type of lithology identified and its often rapid mode of deposition. Tectonic uplift of the Lake George Range blocked headwaters of the Yass River system, altering the pattern of sedimentation from fluvial to
lacustrine, although this was not instantaneous. The sedimentation rate decreased from 6.2 to 4.2 cm/1000 yr. As the lake became a dominant feature, clays and silts of the Bungendore Formation were deposited. Sedimentation during this phase decreased to an average of 3.3 cm/1000 yr. MAGNETOSTRATIGRAPHIC CORE COMPARISON BETWEEN C354 AND LG4
The magnetostratigraphy of LG4 was carried out in 1977 on a 36 m core by Opdyke, as described in Singh et al (1981). The palaeomagnetic analysis identified three major chrons, Brunhes, Matuyama and Gauss. A 72 m core, from the same site but with incomplete recovery, was dated by extrapolation to between 4.2 to 7 Ma, the range being attributed to different estimates of the rates of sedimentation. Deeper sediments extending to an estimated depth of 134 m (Polak & Kevi 1964), based again on extrapolation of available magnetic information, suggested that the Lake George Basin formed in the Middle Miocene or even earlier. The magnetostratigraphic patterns of C354 and LG4 correlate well in regard to both depth and age in the upper sections of the Bungendore Formation (Fig. 6). In LG4, the Brunhes/Matuyama boundary occurs at a depth of 17.4 m while in C354 it occurs between 18.70 and 18.93 m. In both cores, a shallow positive inclination value appears just above this boundary. In LG4 it occurs at 15.25 m; in C354 at 17.38 m. Opdyke, as described in Singh et al (1981), suggested that this positive value was probably due to sedimentary disturbance. This would have had to occur on a relatively large scale to be recorded in both cores as the drill sites are eight kilometres apart. Alternatively, it may represent a localised transition. Whatever the cause, it seems to be a reliable correlative correlation horizon between the two cores. In the Matuyama Chron, the Jaramillo normal polarity occurs at a depth of 22 m in LG4 and between 21.19 and 28.15 m in C354. The
205
Magnetostratigraphy and palynology, Lake George, New South Wales
C 354
LG 4
DEEPEST BASIN SEDIMENTS
C4
0
% %
%O.
Magnetostratigraphical Timescale (McDougall, 1978)
^
4.2 to 7 Ma \ \
%
J 0 R K M
•
TOO
•
ERRATIC
S
J-166m
Magnetostratigraphical Timescale (Harland, et al., 1982)
MS US B M G
Jaramillo Olduvai Reunion Subchrons Kaena Mammoth Normal polarity Reversed polarity Magnetically stable Moderately magnetic \ Magnetically unstable Brunhes Chron Matuyama Chron Gauss Chron
Fig. 6 Correlation and comparison between cores C354, LG4 and C4.
Mid Miocene or older
134 m
206
J.R.C. McEwan Mason
second normal subchron, the Olduvai, appears at 27 m in LG4 but, surprisingly, at a much greater depth of between 58.90 to 62.36 m in C354. According to Opdyke (Singh et al 1981), the sedimentation rate below the Jaramillo decreased from 4 gm/cm /1000 yrs to 1.1 gm/cm /1000 yrs. In C354, the sedimentation rate remains constant below the Jaramillo until the base of the Olduvai. Unfortunately, the sedimentation rates used by Singh et al (1981) (gm/cmVlOOO yr) are not comparable with those used in this study (cm/1000 yr). Regardless of the actual rates, Singh etal (1981) postulated that the sedimentation rate increased up-sequence, whereas this study suggests that the rate decreased up-sequence. The Reunion normal reversal is absent from LG4. This may be due to unsuitable lithologies. In C354, it appears between 67.81 and 68.85 m. The Matuyama/Gauss boundary occurs at a depth of 35.5 m in LG4. The same boundary is identified in the sediments of C354 at a depth of 87.70/87.85 m. The sedimentation rate remained constant in LG4 from the base of the Jaramillo, whereas sedimentation rates in C354 increased from the base of the Olduvai Subchron to the Matuyama/Gauss boundary (3.3 to 4.2 cm/1000 yr). In LG4 m two positive reversals near 32 and 33 m were identified by Opdyke as being equivalent to the Kaena and Mammoth Subchrons. These also appear in C354 at depths of 115.80 to 117.82 m and 124.08 to 129.32 m. Caution is necessary in both cases, however, as the sediments are magnetically unstable rendering identification tentative. The differences in depths at which these subchrons occur is again the result of differences in sedimentation rate across the basin. In LG4 the rate continued to be constant, but in C354 it increased again to 6.2 cm/1000 yr. The sediments below 36 m in LG4 were not sampled. In C354 sampling continued to a depth of 166.80 m, but little can be concluded from the lower sediments because of the lack of magnetic stability. The differences 2
2
encountered between the two Lake George cores, C354 and LG4, have important implications concerning the use of extrapolation and hence past estimates of age. The deepest reliable magnetic boundary identified in C354 was the Matuyama/Gauss boundary at 87.70/87.85 m, which dates the sediments at this depth at 2.48 Ma using the time-scale devised by Harland et al (1982). The Kaena and Mammoth Subchrons, although identified only tentatively, suggest that the sediments to a depth of 129.32 m are of the order of 3.15 Ma. Thirty-seven metres of sediment remain undated in C354; however, the sediments are not (at this stage) considered to be older than Pliocene. The possibility of a relatively large hiatus, as evidenced by the extreme weathering profile associated with the Gearys Gap Formation, may indicate that the deepest lake sediments are in fact slightly older than Pliocene. However, this is far younger than the estimated age of Middle Miocene or older for the inception of the lake by Singh et al (1981). PALYNOLOGY The palynological biostratigraphic zonation of the Plio-Pleistocene in Australia has been largely neglected in comparison with that of other epochs of geological time. This is due primarily to the rarity of terrestrial deposits of this age in which palynomorphs have been preserved. However, several workers, particularly Martin (1973 a, b and c, 1978, 1979, 1980, 1981, 1982, 1984 a, b and c) have contributed much to the palynological knowledge of these epochs. The boreholes from which Martin's biostratigraphic phases were established were drilled by the Water Resources Commission of NSW in an extensive drilling programme in the Lachlan River Valley. Prior to Martin's extensive studies, Stover and Partridge (1973) compiled a late Cretaceous and Tertiary biostratigraphy for the Gippsland Basin, southeastern Australia. Unfortunately, this palynological zonation scheme stops abruptly in the Late Miocene Triporopollenites bellus Zone. Partridge has
Magnetostratigraphy and palynology, Lake George, New South Wales
207
since divided the latest Neogene (Late Miocene-Pliocene and Quaternary) into informal palynological zones: Cingulatisporites bifurcatus, Meyeripollis lipsis and Subulifloridites pleistocenicus, but these are as yet unpublished.
a terrestrial Pliocene/Quaternary sedimentary sequence in Australia which has also been dated magnetically. It therefore provides a unique opportunity to test the biostratigraphical schemes erected for this period of geological time.
Hill and MacPhail (1985), working on a Pliocene-Pleistocene assemblage in Tasmania, and Bint (1981), working on Early Pliocene assemblages in Western Australia, added valuable information to the informal scheme established by Partridge.
A series of 42 samples, distinct from those used for magnetic analysis, was extracted from the cored sediment of C354 for palynological investigation. Twenty of these contained taxa enabling the sediments to be dated using the previously erected biostratigraphical and abundance data schemes. As in the preliminary study of Truswell (1985), the palynomorphs were in two distinct groups. Taxa recovered from sediments between the depths of 110.20 and 108.10 m, were associated with present day temperate rainforest species, and averaged 27% Nothofagus, 20.8% Casuarina, 19% Myrtaceae and 9.1% Gymnosperms. Asteraceae and Chenopodiaceae were negligible at 0.25% and 0.125% respectively. Poaceae were absent. This narrow band of rainforest is dated to early Late Pliocene by the magnetostratigraphical analysis.
A preliminary study of C354 was undertaken by Truswell (1985) to determine the age of the sediments deposited in Lake George. Two distinct types of vegetation assemblage were identified. Assemblage B, the deepest assemblage, yielded palynomorphs indicative of temperate rainforest taxa. The assemblage was dated as Late Miocene solely on the basis of selected palynormorphs, including Symplocoipollenites austellus, Proteacidites symphonemoides and Tubulifloridites antipodica. These taxa enabled direct correlation with the Triporopollenites bellus Zone of the Gippsland Basin erected by Stover and Partridge (1973). The second assemblage, Assemblage A, was separated from Assemblage B by 20 m of palynologically barren sediment. The former was dominated by pollen of Casuarina and herbaceous taxa. The abundant rainforest taxa associated with Assemblage B were absent. Truswell (1985) dated Assemblage A as Late Pliocene or Early Pleistocene based on the presence of Monotoca and high frequencies of Asteraceae and Poaceae, which according to Martin (1977) are indicative of a Pleistocene age. However, this date remains tentative, as the sequence lacks confirmation from absolute methods of time control. THE CURRENT STUDY With the exception of a study by Singh et al (1981) involving the Late Quaternary sediments from Lake George, this study represents the first palynological investigation of
The open canopied assemblage (99.90 to 48.60 m) was dominated by Asteraceae (46.4%), Casuarina (18.2%), Poaceae (9.8%), Chenopodiaceae (4.5%), Myrtaceae (3.4%) and Gymnosperms (0.8%). No Nothofagus was recorded. The magnetostratigraphical interpretation of the sediments indicates that the assemblage is early Late Pliocene to Pleistocene. CONCLUSION The magnetostratigraphy of core C354 provides revised estimates of the age of Lake George and its sedimentary units. These estimates, in conjunction with the palynology, have given further insight into the timing of the decline of temperate rainforest taxa in the Lake George region and the emergence of more open canopied vegetation. The dramatic vegetation change took place in a relatively short period in the early Late Pliocene. Unfortunately, the sediments between these very
208
J.R.C. McEwan Mason
different assemblages were palynologically barren, preventing elucidation of the nature of the vegetation change.
ACKNOWLEDGEMENTS
The following are gratefully acknowledged for their assistance in this study: Bureau of Mineral Resources (access to cored material); the ANU (access to cryogenic equipment); Mart Idnurm (magnetic guidance and patience); Charles Barton (susceptibility, intensity and Q ratio plots); John Giddings (magnetic data programmes); Pat Rich (constructive critique of the text); Draga Gelt (Monash drafting); and Joan Dawson (editing).
REFERENCES
ABELL R.S. 1985. Geology of the Lake George Basin, NSW. Bureau of Mineral Resources, Geology & Geophysics Record 1985/4, 1-57. BINT A.N. 1981. An Early Pliocene pollen assemblage from Lake Tay, south-western Australia, and its phytogeographic implications. Australian Journal of Botany 29, 277-291. COLLINSON D.W. & MOLYNEAUX L. 1967. An instrument for the measurement of isotopic initial susceptibility of rock samples. In Collinson D.W., Cress R.M. & Runcorn S.U. eds Methods in Palaeomagnetism, pp.368-371. Elsevier, Amsterdam. GIDDING J. 1986. Handbook of Palaeomagnetism Group Programs. Bureau of Mineral Resources, March 1986. HARLAND W.B., COX A.V., LLEWELLYN P.G., PICKTON C.A.G., SMITH A.G. & WALTERS R. 1982. A Geologic Time Scale. Cambridge University Press. HILL R.S. & MacPHAIL M.K. 1985. A fossil flora from rafted Plio-Pleistocene mudstones at Regatta Point, Tasmania. Australian Journal of Botany 33, 497-517. McDOUGALL I. 1978. The present status of the geomagnetic polarity time scale. In McElhinney M. W. The Earth: Its Origin, Structure and Evolution, pp.543-566. Academic Press, London. MARTIN H.A. 1973a. The palynology of some Tertiary Pleistocene deposits, Lachlan River valley, New South Wales. Australian Journal of Botany 33, 497-517.
MARTIN H.A. 1973b. Palynology and historical ecology of some cave excavations in the Australian Nullarbor. Australian Journal of Botany 21, 288-316. MARTIN H.A. 1973c. Upper Tertiary palynology in southern New South Wales. Journal of the Geological Society of Australia Special Publication 4, 35-44. MARTIN H.A. 1977. The Tertiary stratigraphic palynology of the Murray Basin in New South Wales: I. The Hay and Balranald-Wokool Districts. Journal and Proceedings of the Royal Society of New South Wales 110, 41-47. MARTIN H.A. 1978. Evolution of the Australian flora and vegetation through the Tertiary: evidence from pollen. Alcheringa 2, 181-202. MARTIN H.A. 1979. Stratigraphic palynology of the Mooki Valley, NSW. Journal and Proceedings of the Royal Society of New South Wales 112, 71-78. MARTIN H.A. 1980. Stratigraphic palynology from shallow bores in the Namoi River and Gwydir River Valleys, north central NSW. Journal and Proceedings of the Royal Society of New South Wales 113, 81-87. MARTIN H.A. 1981. Stratigraphic palynology of the Castlereagh River Valley, NSW. Journal and Proceedings of the Royal Society of New South Wales 114, 77-84. MARTIN H.A. 1982. Changing Cainozoic barriers and the Australian palaeobotanical record. Annals of Missouri Botanical Gardens 69, 625-667. MARTIN H.A. 1984a. The use of quantitative relationships and palaeoecology in stratigraphic palynology of the Murray basin in New South Wales. Alcheringa 8, 253-272. MARTIN H.A. 1984b. The stratigraphic palynology of the Murray Basin in New South Wales: II. The Murrumbidgee area. Journal and Proceedings of the Royal Society of New South Wales 117, 35-44. MARTIN H.A. 1984c. The stratigraphic palynology of the Murray Basin in New South Wales: III. The Lachlan area. Journal and Proceedings of the Royal Society of New South Wales 117, 45-51. POLAK G.J. & KEVI L. 1964. Lake George seismic survey, NSW. Bureau of Mineral Resources, Geology & Geophysics Record 1964/118. SINGH G., OPDYKE N.D. & BOWLER J.M. 1981. Late Cainozoic stratigraphy, palaeomagnetic chronology and vegetational history from Lake
Magnetostratigraphy and palynology, Lake George, New South Wales George, NSW. Journal of the Geological Society of Australia 28, 435-452. STOVER L.E. & PARTRIDGE A.D. 1973. Tertiary and late Cretaceous spores and pollen from the Gippsland Basin, southeastern Australia. Proceedings of the Royal Society of Victoria 85, 237-447. TRUSWELL E.M. 1985. Preliminary palynology
209
of deep sediments in the Lake George Basin. In Geology of the Lake George Basin, NSW. Bureau of Mineral Resources, Geology & Geophysics Record 1985/4, 52-57. ZIJDERVELD J.D.A. 1967. A.C. Demagnetisation of rocks: analysis of results. In Collinson D.W., Crear K.M. & Runcorn S.K eds. Development of Solid Earth Geophysics 3, Methods in Palaeomagnetism. Elsevier, Amsterdam.
The geomorphology of the Buchan Karst - implications for the landscape history of the Southeastern Highlands of Australia J.A. WEBB1, B.L. FINLAYSON2, D. FABEL2 AND M. ELLAWAY2 1 Department of Geology, La Trobe University, Bundoora, Victoria 3083, Australia. department of Geography, Melbourne University, Parkville, Victoria 3052, Australia.
The densely cavernous karst at Buchan in eastern Victoria contains considerable evidence relating to the Tertiary history of the landscape in terms of preserved surface features, levels of cave development and datable speleothems. Prior to basalt eruptions about 40 Ma ago, the ancestral BuchanTimbarra and Murrindal-Snowy Rivers occupied broad valleys running approximately north-south. The highest level caves at Buchan formed as phreatic systems along vertical joints below the water table associated with these ancestral rivers. The Late Eocene basalt flows which filled both valleys caused development of twin lateral streams in each ancestral valley. Uplift, possibly concomitant with the basalt eruptions, resulted in extensive stream diversion and valley incision, draining the pre-existing phreatic caves. The Buchan, Murrindal and Snowy Rivers were all deflected to the east, and the Timbarra was diverted to the west. A period of stillstand then ensued, with the development of a broad river valley along the Buchan. Extensive phreatic cave systems formed along joints in the limestone beneath the river and its tributaries. This period of stillstand may correspond to the maximum onlap of the sea in the Gippsland Basin during the Early-Middle Miocene. More recently, there has been another period of downcutting. This was followed by another stillstand, which resulted in the development of river terraces along the Buchan and the formation of extensive horizontal epiphreatic caves, largely along the strike of the limestone. Uranium series speleothem dates indicate that the lower level caves were formed at least 99,000 years ago (and probably over 350,000 years ago). A final minor episode of downcutting has incised vadose canyons in the caves. Key words: cave development, karst geomorphology, Southeastern Highlands, uplift. INTRODUCTION
Limestone areas can be of considerable significance in studies of landscape evolution, because the caves beneath the land surface frequently contain information that is lacking in non-limestone terrains (the 'karst immunity' of Jennings 1985). Passage shapes and levels, secondary calcite deposits (speleothems) and sediments within the caves can all be used to infer the history of cave development, particularly if the speleothems or cave sediments can be dated, e.g. by radiometric, palaeomagnetic or palynological techniques. This information can sometimes be linked with the development of surface features like river channels and terraces to provide a detailed history of the karst landscape evolution (e.g. Atkinson et al 1978; Gascoyne & Latham 1981; Williams 1982; Ford et al 1983; Goede & Harmon 1983; Palmer 1989). However, it has proved difficult to push back the history of cave development beyond about 2 Ma (e.g. Schmidt 1982; Worthington & Ford 1984). 210
The Buchan area is well placed for an integrated study of karst geomorphology and landscape history. There are extensive outcrops of densely cavernous limestone, with several levels and types of cave development, and abundant speleothem and sediment deposits within the caves. Furthermore, surface features like ancestral river valleys and river terraces are well-preserved within the area, and can be related to the formation of the caves. There have been few previous studies on the geomorphology of this region, and most have been relatively brief descriptions of the karst features (e.g. Teichert & Talent 1958; Mill et al 1980; Vandenberg & O'Shea 1981; McRaeWilliams et al 1981; Mill 1987). Only Sweeting (1960) discussed the geomorphic evolution of the Buchan area in any detail. She believed that cave development was relatively recent, and related it to the Late Cainozoic Kosciusko Uplift, which formed the Eastern Highlands.
The geomorphology of the Buchan Karst However, a reassessment of her work is necessary, as the initial uplift of the highlands is now thought to be Early Cainozoic or older (e.g. Wellman 1979, 1987; Bishop & Young 1980; Jones & Veevers 1984; Moore et al 1986; Lambeck & Stephenson 1986), and so the caves are also likely to be older. Karst studies elsewhere in southeastern Australia have begun to exploit the potential of limestone terrains in understanding the evolution of the Eastern Highlands (e.g. Jennings et al 1972; Nicoll 1977; Osborne 1978; Jennings et al 1982), and some workers (e.g. Connolly & Francis 1979; Household 1983) have successfully used correlations between river terraces and horizontal cave levels to infer stillstands in the regional base level. However, the timing of events and the detailed relationships between uplift and cave development have proved difficult to determine, and additional information from outside the karst areas is necessary. At Buchan this extra information is available in the Late Mesozoic-Cainozoic sedimentary history of the Gippsland Basin. Jones and Veevers (1984) correlated the uplift history of the Southeastern Highlands with changes in sedimentation in the Gippsland Basin. The karst development at Buchan must be correlated with both the uplift and sedimentation if the overall landscape history of the area is to emerge, and a detailed study of the Buchan karst has allowed this to be attempted. GEOLOGICAL SETTING Palaeozoic The Buchan area, some 350 km east of Melbourne in eastern Victoria, comprises a large synclinorium of Early Devonian limestones and mudstones (Buchan Group) disconformably overlying the rhyolitic, largely ignimbritic, Snowy River Volcanics (Fig. 1). In addition, there are small fault blocks of Buchan Group limestone elsewhere in the area (Vandenberg & O'Shea 1981). The Buchan Group comprises three formations, the Buchan Caves Limestone, the Tara-
211
vale Formation and the Murrindal Limestone (Teichert & Talent 1958; Vandenberg & O'Shea 1981). All are Emsian (Mawson 1987) and represent interfingering facies equivalents. The Buchan Caves Limestone reaches a maximum thickness of 420 m just south of Buchan (Cockbain 1970). At its base is a thin unit, the Spring Creek Member, which consists of volcanic breccia and interbedded sandstone and mudstone. Overlying these clastics are 140 m of poorly fossiliferous dolomite and dolomitic limestone, which grade into fairly pure limestone containing abundant fossils, including blue-green algae (Teichert & Talent 1958; Pilapil 1987). The insoluble content of both limestone and dolomite rarely exceeds 5% (Jenkin & Baxter 1969). The Pyramids Marlstone, the lower member of the Taravale Formation, overlies the Buchan Caves Limestone throughout most of the Buchan area and consists of thin beds of calcareous mudstone and fossiliferous calcareous nodules (100 m thick at Buchan). The upper part of the Taravale Formation (800 m thick at Buchan) is a sequence of easily eroded mudstones, shales and occasional impure limestones and occupies most of the southern part of the Buchan Synclinorium (Fig. 1). In the northern part of the synclinorium, the Taravale Formation interfingers with the Murrindal Limestone, which consists of two members. The McLarty Member comprises 60-190 m of well-bedded dark grey limestone, while the Rocky Camp Member consists of 60-100 m of light grey limestone with abundant well preserved fossils, particularly corals and stromatoporoids. In the Middle Devonian, the Buchan Group and underlying volcanics were deformed by the Tabberabberan Orogeny (Vandenberg & O'Shea 1981). This formed the Buchan Synclinorium in the Buchan area and downfaulted small blocks of limestone into the volcanics elsewhere in eastern Victoria. The Buchan Synclinorium trends north-south and plunges gently south. The eastern limb dips at a shallow angle to the west, but the western
212
J.A. Webb, B.L. Finlayson, D. Fabel & M. Ellaway
<JA
a U^
A^
A
Gillingal
New vGuineaE
Murrindal/
•Wf
m km m,
w
'Jackson \ Crossing
.
The Basin
Alluvial flats and terraces
RECENT
Sand and gravel
h
TERTIARY
rx
i</>
Older Volcanics 1 ; I ; I Murrindal Limestone EARLY DEVONIAN"
I
| Taravale Formation Buchan Caves Limestone Snowy River Volcanics
SILURIAN
^ran|tee' 9ranodiorite<
O R D O V I C I A N - r / / X Sediments (frequentSILURIAN Y / / J ly metamorphosed), sandstone, siltstone, slate, shale, hornfels.
Fault
+ + +
^
5 km.
Fig. 1 Geology of the Buchan area (from the Bairnsdale 1:250,000 geological map).
Map location
The geomorphology of the Buchan Karst limb dips more steeply and contains a number of small anticlines and synclines, as well as two high-angle dip-slip faults with less than 150 m of displacement (see Fig. 8). Cainozoic Basalts and High Level Gravels Late Palaeozoic and Mesozoic sediments are absent in the Buchan area, but small outcrops of Tertiary sediments and volcanics are widespread. The locations of these outcrops can be used to reconstruct the Tertiary drainage systems of the area in some detail. Late Eocene basalts (38-42 Ma) occur as discontinuous outcrops to the north and west of Buchan (Fig. 1), and represent remnants of valley-filling flows (Wellman 1974). The locations of these outcrops indicate clearly that the lavas flowed down two separate valleys, representing the courses of the ancestral Murrindal-Snowy (to the east) and BuchanTimbarra Rivers. (The double names are used because each ancestral river later split into two lateral streams, as explained below). Remnants of the channel gravels from these rivers are preserved in the Buchan area, both underlying the basalts and as thin deposits on concordant ridge tops beyond the extent of the basalts (Figs. 1 and 4). These gravels are composed mainly of pebbles and cobbles of Snowy River Volcanics (the dominant bedrock in the catchment). Approximately 2 km southwest of Buchan, thicker deposits of coarse-grained fluvial cross-bedded quartz sands and gravels are present immediately adjacent to the most southerly outcrop of basalt (Fig. 1); these continue for at least 10 km along the present-day course of Tea Tree Creek (Fig. 2). The evidence from the basalts and sediments clearly shows that the ancestral Murrindal-Snowy River flowed more or less northeast-southwest through the Buchan area towards the sea (Fig. 3). In the Early Tertiary the coastline was at least 30 km offshore of its present position (Blake 1986). Just southwest of Buchan township the ancestral Murrindal-Snowy met the ancestral BuchanTimbarra River; the latter flowed north-south
213
for much of its course (Fig. 3). Straight-line gradients calculated for both of these rivers, using the remnant channel gravel outcrops that are separated by the greatest distances, give values of 0.023 for the Buchan-Timbarra, 0.010 for the Murrindal-Snowy upstream of its junction with the Buchan-Timbarra, and 0.011 for its gradient downstream of this junction. These gradients are probably overestimates. Both rivers are likely to have had sinuous courses, particularly the ancestral Murrindal-Snowy in its broad valley, so the true gradients may have been only half the calculated values. Nevertheless, these gradients indicate that the Murrindal-Snowy River was the dominant drainage course at the time; the BuchanTimbarra was a major tributary with a steeper gradient. The ancestral Murrindal-Snowy River valley reached a maximum width of several kilometres (Fig. 4), both across the centre of the Buchan Synclinorium, where the easily eroded Taravale Formation was present, and to the south, where the bed-rock is the resistant Snowy River Volcanics (Fig. 5). The ancestral Buchan-Timbarra River flowed down a somewhat narrower valley, cut almost entirely in the resistant Snowy River Volcanics. The narrowness of this valley helps to explain why the basalt lavas flowed 15 km further down the Buchan Timbarra than down the valley of the Murrindal Snowy River. The basalts at the headwaters of the ancestral Buchan-Timbarra River, near Nunniong, are now at an elevation of 1100-1200 m, whereas the lowest basalt outcrops in the same ancestral valley at South Buchan are around 250 m above sea level (see Figs. 1 and 3). This indicates a maximum relief of the Late Eocene landscape of about 900 m, although the true figure could be less if there has been differential uplift between the two localities.
Cainozoic - Lower Level Gravels Remnant gravel deposits also occur at lower elevations in the landscape around Buchan.
214
J.A. Webb, B.L. Finlayson,
Fabel & M. Ellaway
Fig. 2 Surface drainage and cave locations in the Buchan area.
Along the Buchan River at East Buchan (Fig. 2), there are flat-topped spurs 120-140 m above sea level (70-90 m above present river level; Fig. 6). These are capped with gravels and small patches of calcareous or siliceous ferricrete (yellow or red goethite-rich massive or vesicular duricrust). The spurs mark a
broad former valley of the Buchan, which followed much the same course as at present. It is likely that the valley was eroded mostly in the soft Taravale Formation, and this would partially account for its width; the present-day Buchan River, with its narrow, steep-sided valley (Fig. 6), is entrenched into
The geomorphology of the Buchan Karst the much more resistant Buchan Caves Limestone. As ferricrete typically is associated with areas of impeded drainage, e.g. swamps (Bourman et al 1987), the ferricretes at East Buchan probably represent backswamp areas on the floodplain beside the old watercourse. A small patch of gravel on top of Moons
215
Hill (Fig. 2), about 100 m above present river level (see Fig. 9), probably represents the same former course of the Buchan River as that preserved at East Buchan. The gradient between the two sites is about 0.008, very similar to the present gradient of the Buchan (0.007).
Fig. 3 Eocene (left) and present (right) drainage systems in the Buchan area; existing areas of basalt outlined and shown by "v" symbols. Note that the courses of the ancestral rivers were probably quite sinuous. Cross-section lines of Figures 4, 5 and 6 are shown on the right hand diagram.
Fig. 4 East-west cross-sections across the northern part of the Buchan Synclinorium (see Fig. 3 for locations). All labels on the diagram refer to section (a). Note the concordant summits at about 300 m at the 11 km mark, representing the floor of the ancestral Murrindal-Snowy River, and the basalt on the Buchan-Timbarra divide, indicating the bed of the ancestral Buchan-Timbarra River (the present Buchan and Timbarra Rivers are twin lateral streams developed on either side of the basalt filling the ancestral river valley.
216
J.A. Webb, B.L. Finlayson, D. Fabel & M. Ellaway
is covered with thin deposits of river gravel, less than 5 m thick (Pilapil 1987).
Fig. 5 East-west cross-section across Tea Tree Creek (see Fig. 3 for location). The present creek is obviously an under fit stream.
In addition, there are remnants of other terraces. For example, 1 km north of Buchan there are two erosional terraces cut into bedrock (Seehusens Terraces; McRaeWilliams et al 1981). These may be swing rather than paired terraces (Schumm 1977), as the lower terrace in particular has a distinct riverward slope. Further study is at present being undertaken to determine the exact number of terraces along the Buchan, and to positively identify which of these are paired and which are swing terraces. Slope-wash deposits and small colluvial fans are present throughout the area; cleared slopes underlain by the Taravale Formation are particularly prone to slumping.
BUCHAN KARST GEOMORPHOLOGY
Fig. 6 Northeast-southwest cross-section of the Buchan River at East Buchan (see Fig. 3 for location). Note the broad high level valley compared to the present narrow one.
The Buchan River today flows across a terraced flood plain up to 2 km wide (Fig. 1). This maximum width is reached only in the centre of the Buchan Synclinorium, which is underlain by the easily eroded Taravale Formation. Elsewhere, particularly in the Snowy River Volcanics but also in the Buchan Caves Limestone, the Buchan River occupies a narrow, steep-sided, V-shaped valley. River terrace remnants occur either side of the Buchan River wherever the flood plain is wide enough, and Sweeting (1960) recognised three levels. Recent surveys, carried out as part of the present study, indicate that three main levels of paired river terraces are probably present, at heights of 4-5 m, 10 m and 28 m above the present river. Geophysical (resistivity) studies show that the lower terrace
The Buchan Synclinorium represents one of the largest outcrops of cave- and karstforming limestone in southeastern Australia, and approximately 300 caves, sinks and karst related features have been recognised (Matthews 1985). Small-scale surface features such as rillenkarren and solution pans are widespread but not abundant; the ribs between rillenkarren are generally low and rounded. Larger scale karst landforms, particularly dolines, are well developed. An area on the Murrindal Limestone known as the Potholes (Fig. 2) contains over 50 closely spaced dolines, up to 20 m deep and 50 m across, and they are common elsewhere on limestone outcrops. Cave passages which extend underneath the dolines are frequently characterised by rockfall. This indicates that many of these dolines are underlain by collapse rubble, and are therefore at least partially of collapse origin. A surface network of normally dry valleys has developed on the limestone (Finlayson & Ellaway 1987). Tributaries of the Buchan River such as Fairy Creek and Scrubby Creek
The geomorphology of the Buchan Karst
(Fig. 1) sink where they flow from the Snowy River Volcanics onto the limestone. However, these tributaries persist as surface streams at high flows, after heavy rain. Most stream sinks are diffuse, and the water seeps gradually into the stream bed gravels over some distance. Well-developed blind valleys, where the entire surface flow is diverted underground, are uncommon. Only at East Buchan has underground drainage begun to extensively reorganise the surface drainage. Here one valley has been almost completely reduced to a series of small blind valleys leading to dolines, most of which appear to divert the surface flow under a divide into the adjacent perennial creek (Wilson Creek; Fig. 2). The Buchan area is well known for its extensive cave development, and Buchan tourist caves receive over 90,000 visitors a year. Caves have formed in both the Murrindal Limestone (in the central northern part of the Buchan Synclinorium) and the Buchan Caves Limestone (on both eastern and western edges of the Synclinorium). The caves can be broadly subdivided into two categories: pot-holes which are vertical caves, developed along joints and sometimes forming mazes, and horizontal systems, which are often parallel to the strike of the limestone (Mill et al 1980; Mill 1987; Fabel 1987). Pot-holes are the more common cave type. They are found throughout the Buchan area, and in the Murrindal Limestone only potholes are present (Fig. 7). These caves vary from simple shafts and rifts to complex jointcontrolled mazes of narrow passages with high ceilings, opening occasionally into large internal chambers, shafts and avens. The most extensive of the caves (Exponential Pot; Fig. 7) contains over 2 km of passage. Roofs and walls of the pot-holes are characterised by pendants, large irregular wall scalloping and occasional spongework. These features all attest to a nothephreatic mode of origin for these caves, i.e. they were formed by very slowly moving groundwater, probably well
217
below the watertable (see Jennings 1985). The depth of the pot-holes in the Murrindal Limestone is governed by the thickness of the limestone, which is underlain by the insoluble shales of the Taravale Formation. The alignment of the deepest points of the Murrindal caves shown on Figure 7 corresponds with the base of the limestone. The horizontal caves at Buchan are present only in the Buchan Caves Limestone, round the edge of the synclinorium, and many of them have developed adjacent to surface gullies, which are often dry as a result of underground diversion of the drainage through sinks. For example, the Murrindal River at the Pyramids (Fig. 2) flows underground for approximately 1 km through a horizontal cave system. Active streams are present in many of these caves, and emerge on the surface as springs, some of which have deposited extensive tufa terraces. Several of the springs are perennial with quite substantial flows (4-5 1/sec), and flow even during extended droughts (Ellaway & Finlayson 1984). These springs must be maintained by large volumes of water stored in the limestone. The horizontal cave systems have usually developed parallel to the strike of the limestone beds (Fig. 8). The longest cave of this type, the Dukes (B4) - Federal (B7) - Royal (B6) - Fairy (B5) tourist system, has over 5 km of passage, generally 1-2 m high and several metres wide. Passage roofs are often flat and cut across the bedding, which dips at 30-40°. These flat roofs represent the position of the watertable when the cave was forming. The extensive development of flat-roofed passages shows clearly that these caves are epiphreatic, i.e. they formed just below the watertable. During nothephreatic cave development, groundwater moves very slowly, and all cave passages develop almost equally. However, if there is sufficient head to drive the water through the cave system at reasonable speeds (i.e. a dynamic phreatic system), one cave passage will grow at the expense of the others (Jennings 1985; Ford & Ewers 1978). This effect is self-promoting; as the passage gets
218
J.A. Webb, B.L. Finlayson, £>. Fabel & M. Ellaway
I
M 54
100i
Q)
E
M 12
50-
M 14
M 29
1—I—i—i—
50
M 55 M 56
—100 — ri
metres M63o
N A
Baby Berger Cave
M 14
OM9
Baby Pierre Cave M12^ M29fi^
oM 50
M 113 o o M 112
1^125^, Exponential Pot M 120 M 124
Razor Cave ' 4
M97^ Y^y^Stirling's Cave M130
lan's Hat Cave M 54t
>M 118
M4U. Honeycomb ijSmfK^
metres
i i 50i i i i i—100 j
M 56
Oo/ite't&g Cave
oM 117 M116o
U/I48
Jampot
©M55
oM 115
Fig. 7 Plan and projected east-west section of the Potholes area (see Fig. 2 for location); not all caves on the plan are shown on the cross-section. The vertical scale uses an arbitrary datum. From McRaeWilliams et al (1981).
The geomorphology of the Buchan Karst
219
Fig. 8 Plan of the Buchan tourist caves (see Fig. 2 for location). Bl-Spring Creek Cave, B2 - Moons Cave, B4 - Dukes Cave, B5 (and B64) - Fairy Cave, B6 (and B65) - Royal Cave, B7 - Federal Cave. Note the along-strike development of the major cave systems.
220
J.A. Webb, B.L. Finlayson, Z>. Fabel & M. Ellaway
larger, the water discharge increases, which enhances solution and enlarges the passage further. In addition, the region just below the watertable is particularly effective for cave formation, because of the increased solution resulting from groundwater mixing. Dynamic phreatic cave passages often develop preferentially along this level, i.e. they are epiphreatic. Ford and Ewers (1978) pointed out that fissure frequency increases with passage of time after the onset of karstification. It is noteworthy in this context that all the epiphreatic systems preserved at Buchan are low in the landscape and would therefore have been subjected to a long period of preparation prior to major cave development. Sweeting (1960) proposed that the horizontal cave systems at Buchan resulted from vadose incision by actively downcutting streams. As discussed above, these caves are epiphreatic in origin, but some passages have been modified by stream incision. The lowest level of the tourist caves consists of narrow canyon-like passages up to several metres high; these are slightly below, and therefore postdate, the epiphreatic passages. In general, vadose modification to the caves is confined to these low level passages, and only a small amount of downcutting has occurred since the caves were formed (a few metres at most). Many of the horizontal epiphreatic passages intersect vertical nothephreatic caves; the latter are usually enlarged joints which extend high above the roof of the epiphreatic system. The vertical caves predate the horizontal, as the nothephreatic features are cleanly trimmed off by the epiphreatic passages. Furthermore, the flat roofs and speleothems of the epiphreatic systems show no sign of the re-solution that would be expected if they had been flooded during formation of the higher level nothephreatic caves. Areas of breakdown are present in many of the horizontal stream caves, sometimes as large chambers with spectacular bedding plane hanging walls. This collapse probably resulted from the undercutting and weakening of wall sections during the epiphreatic and vadose
periods of cave development. Collapse is less common in the vertical caves, but areas of rock fall characterise the entrance sections of many of these caves developed beside or underneath dolines. Most of the vertical and horizontal caves at Buchan contain secondary calcite deposits (speleothems); stalactites, stalagmites, shawls, flowstone and gours are common, and shields and helicites are present in a few caves. Most of the speleothems are banded, indicating fluctuations in the water supply which deposited them. False floors, which occur in a number of the Buchan caves, form when sediments are covered by flowstone. Subsequent removal of the sediment leaves the flowstone behind as a false floor, which may be the only record of the former infill. Uranium series dates have been obtained for a number of speleothem samples from caves around Buchan, mainly from the horizontal systems (Table 1). Lilly Pilly Cave (Fig. 2) is a horizontal epiphreatic system with a well developed vadose stream canyon; the entrance is at the present level of the Murrindal River. Two flowstone samples collected in this cave from sites 10 and 20 m above present river level both gave ages beyond the limit of uranium series dating (350,000 years). In Spring Creek Cave (B-l; Figs. 8 and 9), flowstone from the upper of two levels of false floors gave a similar age; this cave is a vertical phreatic maze, and the dated false floor is only about 20 m above present-day local base level in Fairy Creek. These dates indicate that even the lowest level caves now enterable may have been drained over 350,000 years ago. Younger speleothem ages have been obtained from other caves. In Moons Cave (B2; Fig. 8), flowstone about 2 m above present stream level gave an age of 99,000 ± 5000 years, and a stalagmite less than 30 cm above the stream was dated at 12,000 ± 1000 years. Stalactite and false floor samples from Vincents Cave (Fig. 2) both yielded ages of around 60,000 years. These dates all indicate only that deposition of flowstone and
The geomorphology of the Buchan Karst
221
Table 1. Speleothem dates from Buchan Caves. Note that ages have not been corrected for detrital Th, and are therefore maximum ages. Determinations by Terry Hamilton and David Smith, Department of Chemistry, University of Melbourne. U(ppm)
Th(ppm)
" 4 U/ 238 U activity ratio
23oTh/232TH activity ratio
"°Th/ 234 U activity ratio
Age (ky)
flowstone Spring Creek Cave
0.90 ±0.04
<0.01
1.04 ±0.01
>200
0.98 ±0.05
>350
high level flowstone Lilly Pilly Cave
0.38 ±0.01
0.047 ±0.002
1.07 ±0.02
17.9±0.8
1.07 ±0.04
>350
low level flowstone Lilly Pilly Cave
0.51 ±0.05
0.020 ±0.003
1.16±0.0
90 ±14
1.02 ±0.1
>350
false floor Vincents Cave
0.32 ±0.01
0.090 ±0.006
1.40 ±0.04
6.5 ±0.5
0.43 ±0.02
59 ± 4
stalactite Vincents Cave
0.27 ±0.01
0.05 ±0.01
1.21 ±0.03
8.8±0.9
0.440 ±0.022
61 ± 4
flowstone Moons Cave
0.097 ±0.003
<0.005
1.18 ±0.03
47 ± 7
0.61 ±0.02
99 ± 5
flowstone Moons Cave
0.14±0.01
0.045 ±0.005
1.79 ±0.05
1.8±0.2
0.11 ±0.01
12± 1
SAMPLE
LEGEND:
Fig. 9 Long profile of Fairy Creek (see Fig. 8 for plan view), showing vertical and horizontal extent of the cave systems along the creek.
222
J.A. Webb, B.L. Finlayson, D. Fabel & M. Ellaway
stalactites has continued from the time the caves were drained until the present. Many of the caves at Buchan contain sediment deposits. These have been examined only briefly, and more detailed studies are in progress. The sediment infill in the vertical nothephreatic caves, particularly those in the Potholes, tends to be dominantly brownishred clay, sometimes over 1 m thick and apparently derived from surface soil material above the cave. Rubble from breakdown of the cave walls may also be present. Sand and gravel are very uncommon. By contrast, the sediments in the horizontal systems are sometimes several metres thick, and typically consist predominantly of basal gravels, often partially cemented by calcite, overlain by a thin sequence of unlithified bedded sands and laminated clays. These sediments are light to dark brown, sometimes with a reddish tint. In most cases the sediments have been largely removed by stream action. This erosion occurred when the lowlevel canyon-like passages within some caves were incised (see above). The vadose parts of the caves show no signs of the sediment infill, and the channels cut through the sediments continue directly into the vadose passages. Relating periods of sediment infill and removal within caves to changes in regional base level may be complex and fraught with uncertainty (Jennings 1985). For example, the false floor in Vincents Cave is about 60,000 years old (Table 1), yet it lies some 60 m above local base level (the Buchan River); lower level caves contain much older speleothems, as discussed previously. Thus the removal of the sediment from beneath the false floor in Vincents Cave cannot be related to a regional lowering of base level less than 60,000 years ago, because the evidence from the other caves shows that base level was well below Vincents Cave over 350,000 years ago. Opening of an exit to the cave by some fortuitous event, due entirely to local causes, must have allowed the sediment to be removed, leaving behind a false floor. Thus dating false floors does not
necessarily yield information related to changes in the regional base level. Attempts to date Buchan cave sediments palynologically have proved unsuccessful. Clay samples from two low level epiphreatic systems (Federal Cave (B7; Fig. 8) and Lilly Pilly Cave (Fig. 2)) contained small to moderate amounts of woody material and charcoal, but spores and pollen were virtually absent (M.K. MacPhail, pers. comm.). Mammal and bird bones of Pleistocene and Holocene age have been recovered from sediments in several caves in the Buchan area (Wakefield 1960; Rich & van Tets 1982). Cloggs Cave, at East Buchan, contains a human occupation deposit which includes bone and stone tools and a rich faunal assemblage. Aboriginal use of the cave dates back to 17,720 ±840 years BP (Flood 1974). UPLIFT HISTORY OF THE BUCHAN AREA Because the Buchan Synclinorium is an impounded karst (or karst barre), its geomorphological evolution has been controlled by the level at which the karst waters flow over the impermeable rock barrier downstream of the limestone. The Buchan area is relatively close to the coast (at present only 40 km away), so any large scale, long-term rises or falls in regional base level, resulting from tectonism or sea level changes, will be transmitted upstream to the limestone, there to be recorded as both underground and surface features. Given the large outcrop area of the Buchan Group limestones, and the numerous, extensive caves, the chances of preserving a relatively complete record of the longer term variations in regional base level are high. However, if a base level change is relatively rapid, there may be insufficient time for its effect to migrate upstream to the Buchan limestone, before a subsequent change reverses the effect. Thus the rapid sea level oscillations of the Pleistocene might not be recorded in the Buchan karst. Of the eastern Australian areas of karst,
The geomorphology of the Buchan Karst those that are east of the Great Divide are almost all at greater elevations than Buchan, as well as being further from the coast. As a result these areas are less likely to have been affected by the regional base level changes, and indeed the information they contain has so far proved difficult to correlate with events outside the karst areas (e.g. Jennings 1982). Those limestone areas closer to the coast, e.g. Yessabah in northern New South Wales, are much smaller than Buchan and have much more limited underground development. Interpretation of the karst geomorphology at Buchan is simplified by the fact that this area of limestone does not appear to have been exposed to erosion until the Tertiary (see discussion below). As a result, the Buchan area lacks the very early periods of cave development and infill that are apparently recorded in many of the New South Wales karst regions close to the Great Divide, e.g. Jenolan and Timor (Osborne 1984). These areas may have first been exposed to erosion in the Late Palaeozoic. Thus the karst features of the Buchan area should preserve a record of the Tertiary changes in base level of this portion of the Southeastern Highlands. It should be possible to correlate these changes with the tectonic and sedimentary history of the adjacent Gippsland Basin (Jones & Veevers 1984; Carter 1979; this volume), and eustatic sea level changes (Haq et al 1987), and determine the relative uplift history of this area in terms of regional and global effects.
223
Early Tertiary (Bishop & Young 1980; Taylor et al 1985; Young & McDougall 1985). Lambeck and Stephenson (1986) postulated that the Eastern Highlands date back to the Late Palaeozoic - Early Mesozoic (200-300 Ma ago), and are a residual of the Palaeozoic Lachlan Fold Belt. They believed that uplift of the highlands has occurred by isostatic rebound due to erosional unloading. On the other hand, Jones and Veevers (1984) suggested initiation of the highlands 95 Ma ago based on changes in sedimentation patterns within the adjacent basins. Karner and Weissel (1984) and Moore et al (1986) proposed that the Eastern Highlands were formed by a short-term intense event related to the Tasman Sea rifting at about 80 Ma ago (Late Cretaceous). The fission track evidence of Moore et al (1986) indicates that uplift was rapid, forming a major escarpment which retreated as a result of very high initial rates of erosion. This hypothesis of rapid uplift accords well with recent ideas regarding rift tectonics (Lister et al 1986), whereby one margin of a developing rift undergoes major irreversible uplift as a result of magmatic underplating. Late Eocene Drainage of the Buchan Region
Initial Uplift of the Southeastern Highlands
As previously discussed, by the Late Eocene a stable drainage system had developed in the Buchan region. This can be reconstructed in some detail (Fig. 3), using both the Late Eocene basalts that partially filled the major river valleys of the area, and remnants of river channel sands and gravels preserved on concordant ridge tops beyond the extent of the basalts.
Many theories have been proposed to explain the formation of the Eastern Highlands (Wellman 1987). Early ideas of a major uplift in the Late Cainozoic (the Kosciusko Uplift; Andrews 1911; Browne 1969) have given way to hypotheses of a much earlier origin (e.g. Wellman 1979), as more and more evidence has shown that there has been little landscape evolution in many areas since the
The major river system at this time was the ancestral Murrindal-Snowy, which flowed more or less northeast-southwest through the Buchan area (Fig. 3), in a valley that reached a maximum width of several kilometres and had a gradient of less than 0.010. To the west was a major tributary, the ancestral BuchanTimbarra (Fig. 3), which flowed more or less north-south down a somewhat narrower,
224
J.A. Webb, B.L. Finlayson, D. Fabel & M. Ellaway
steeper ( < 0.023) valley than that of the Murrindal-Snowy, cut almost entirely in Snowy River Volcanics. The valleys of both rivers were floored with thin deposits of wellrounded river gravel; downstream of the junction of the ancestral rivers the channel sediments became thicker and finer grained (mostly coarse sand). The gradients of the present rivers in the area (Buchan - 0.007; Murrindal - 0.008) are probably similar to those in the Late Eocene, but the present-day valleys are narrower. The ancestral Murrindal-Snowy River had a valley about 3 km wide south of Buchan (Fig. 5), eroded in Snowy River Volcanics; all presentday rivers in the area have V-shaped valleys where they flow through this very resistant rock unit. Furthermore, the maximum width of the Buchan River valley today where it meanders across the Taravale Formation is only 1-2 km (Fig. 1), compared to 3-4 km where the Murrindal-Snowy flowed across this formation in the Late Eocene (Fig. 4). Thus the ancestral Eocene drainage pattern must have represented the end result* • of a long period of stability following the initial uplift of the Southeastern Highlands. Since the Late Eocene, there has been no corresponding extended period of stability, and the rivers in the area have been unable to erode valleys of comparable width. By contrast, to the north in New South Wales, there is abundant evidence that there has been little landscape evolution since the Early Tertiary, even on the coastal plain (e.g. Young & McDougall 1985). The evidence at Buchan of post-Eocene landscape rejuvenation indicates that uplift of the Southeastern Highlands in this area was not uniformly slow and steady. Where the ancestral Murrindal-Snowy River flowed across the Murrindal and Buchan Caves Limestones, caves developed beneath the watertable. Joint systems within the limestone were gradually enlarged by very slowly moving groundwater, resulting in the formation of vertical nothephreatic caves, often maze-like in plan (Fig. 7). Caves that formed at this time are widespread within
limestone that lay underneath or alongside the course of the ancestral Murrindal-Snowy, particularly in the northern portion of the Buchan Synclinorium. Most of the caves that developed in the southern part of the synclinorium have since been removed by erosion. Similar caves formed in the small patches of limestone beneath the ancestral Buchan-Timbarra, e.g. at Gillingal (Fig. 1). Late Eocene Volcanism and Uplift The stability of the Buchan area, which had lasted since probably the Early Tertiary, was disrupted by volcanic activity in the Late Eocene. Basalts of the Gelantipy Province were erupted north of Buchan between about 38 and 42 Ma ago (Wellman 1974), and flowed down both the ancestral BuchanTimbarra and Murrindal-Snowy Rivers. The basalt in the narrower ancestral BuchanTimbarra valley reached almost to the junction with the Murrindal-Snowy, whereas the flows down the broader valley of the latter river apparently stopped some 15 km north of this junction (Fig. 3). The eruption points have not been located, but from the distribution of basalt there must have been at least three, spread over 40 km along the crest of the Great Divide about 50 km north and northwest of Buchan. The effects of these valley flows were dramatic. In the valley of the ancestral Buchan-Timbarra River, twin lateral streams formed (the Timbarra and Buchan Rivers), as new watercourses developed along both edges of the basalt flow, against the walls of the valley (Fig. 4). The Timbarra River still preserves to some extent the broad S-shape of the ancestral Buchan-Timbarra north of Buchan (Fig. 3). Similarly, twin lateral streams developed along the MurrindalSnowy valley. The Murrindal River was deflected to the western wall of the ancestral Murrindal-Snowy valley by the valley-filling basalt (Fig. 3). However, it appears that the bulk of the flow of the ancestral MurrindalSnowy River was diverted to the eastern side
The geomorphology of the Buchan Karst
225
of the valley, giving rise to the present Snowy River system (Fig. 3).
fall in base level, and river capture can be ruled out as a cause.
Extensive stream diversion occurred at around this time, so that the broad valley downstream of the junction between the ancestral Buchan-Timbarra and MurrindalSnowy Rivers was abandoned. This valley is now occupied by Tea Tree Creek, which is obviously an underfit stream (Fig. 5). Of the twin lateral streams that developed after the basalt flows filled the valleys, the Timbarra River was deflected over 10 km towards the southwest, whereas the Buchan, Murrindal and Snowy Rivers were diverted a similar distance towards the east and southeast. The Murrindal River flows to the western side of the northern part of the ancestral MurrindalSnowy valley, but to the east of the southern portion of the same valley (Figs. 3 and 4). The Snowy now lies well to the east of the ancestral drainage system (Fig. 5). The Buchan, whose course would have been expected to parallel that of the Timbarra, instead flowed eastwards into the Snowy, and in the vicinity of Buchan township itself drainage reversal occurred. Whereas the ancestral MurrindalSnowy flowed southwest at this locality, the present-day tributaries of the Buchan River flow approximately north (Fig. 3).
Lava flows have been known to block streams and divert them across shallow interfluves into adjacent valleys (e.g. Yim, this volume). However, this mechanism cannot explain why the valley downstream of the junction between the ancestral BuchanTimbarra and Murrindal-Snowy Rivers should have been abandoned. The newly developed Buchan River could only have been diverted eastwards by basalt damming into the valley of the Murrindal-Snowy. It would then still have flowed southwards down the valley now occupied by Tea Tree Creek, yet it was diverted to the southeast, abandoning the latter valley altogether. A similar argument applies to the Murrindal River, which could only have been diverted westwards by basalt damming of the ancestral Murrindal-Snowy River into the Buchan-Timbarra valley, and should therefore have continued to flow down the Tea Tree valley. Thus another factor must be invoked to explain the drainage diversions, and tectonic uplift of the area is the most likely possibility. The pattern of stream diversions is almost radial in nature, indicating that the centre of the uplift could have been located south of Buchan township. In this regard, it is interesting to note the strongly radial drainage around Mt Tara, south of Buchan (Fig. 2); there is no apparent lithological reason for this pattern (Fig. 1). The uplift was apparently domal in nature, as there are no visible fault scarps.
It is unlikely that either river capture by headward erosion or damming of the valleys by basalt could have been responsible for these river diversions. With regard to the first possibility, a fall in base level, as a result of uplift or a drop in sea level, would have resulted in the headward migration of knickpoints up the rivers. If these had migrated faster in adjacent valleys than in the abandoned valley now occupied by Tea Tree Creek, river capture might have been possible. However, headward erosion of knickpoints could not have proceeded in nearby valleys without occurring in the Tea Tree valley also, particularly as the latter was the major drainage course at the time. As the Tea Tree valley shows no evidence of incision, the drainage diversions must have preceded any
The timing of the uplift is uncertain, but it may have been concomitant with or soon after the volcanic activity. All the major river valleys in the area show evidence of extensive incision, which probably occurred in the Oligocene-Early Miocene, for reasons discussed in more detail later. As previously mentioned, the valley of Tea Tree Creek shows none of this downcutting (compare Figs. 4 and 5), so it was presumably abandoned before this phase of the area's history, probably in the Late Eocene - Early Oligocene.
226
J.A. Webb, B.L. Finlayson, D. Fabel & M. Ellaway
The tectonic activity responsible for the river diversions may have been related to Middle Tertiary block faulting which occurred to the northwest of Buchan, along the crest of the Great Divide about 25 km west of the westernmost basalts (Vandenberg & O'Shea 1981). This faulting caused extensive drainage diversion, due to the creation of fault scarps which are still visible. Wellman (1987) noted that at least part of the uplift of the Eastern Highlands could have been the result of Cainozoic volcanism, which caused crustal underplating. At several localities in Queensland and New South Wales localised warping or doming is present around volcanic centres, and might have been concomitant with the volcanism. The Buchan area probably represents another example of the spatial and temporal association between uplift and volcanic activity along the highland.
Jones and Veevers (1984) interpreted the Cainozoic history of the Eastern Highlands in terms of recurrent cycles of activity; each cycle commenced with uplift of the highlands and concomitant volcanism. Using the radiometric ages of basalts and the sedimentary history of basins adjacent to the highlands, they defined four such cycles (Fig. 10). The second of these (Cycle X) is Late Eocene - Early Oligocene in age, and 4'probably correlates with a poorlydefined peak" in the basalt age histogram (Jones & Veevers 1984, 118). The Late Eocene - Early Oligocene history of the Buchan area indicates that there may have been a link between volcanism and uplift in the Southeastern Highlands at about this time, but if so, the effects were localised. The fact that the uplift around Buchan was confined to a relatively small area probably explains why Cycle X is difficult to recognise in the sedimentary record of the Gippsland Basin to
Fig. 10 Sedimentary history of the Otway and Gippsland Basins (L - land, non-marine; M - mixed nonmarine and shallow marine; S - shallow marine), correlated with the histogram of basalt ages from the Eastern Highlands, and subdivided into 4 transgression/regression/lacuna cycles. Lacunae (non-deposition) designated by vertical lines. From Jones and Veevers (1984).
The geomorphology of the Buchan Karst the south (see Fig. 10). If, in fact, uplift and volcanism are related to migration of the Australian Plate over underlying mantle hot spots, as suggested by Sutherland (1985; this volume), then widespread synchronous uplift of the Eastern Highlands at particular times might be the exception rather than the rule. It should also be noted that other authors (e.g. Wellman 1987) have proposed that at least some of the sedimentary cycles recognised by Jones and Veevers (1984) are eustatic in origin. Oligocene-Miocene Incision and Stillstand Following the stream diversions and the abandonment of the valley now occupied by Tea Tree Creek, there was active incision in all the major rivers, i.e. Timbarra, Buchan, Murrindal and Snowy Rivers. This downcutting undoubtedly proceeded as the headward erosion of knickpoints, but the overall long term effect was incision over the whole length of the rivers. Remnants of the river gravels marking the floor of the ancestral MurrindalSnowy were left perched on limestone ridges in the Murrindal area. The downcutting of the Buchan and Murrindal Rivers eroded much of the Buchan Caves Limestone in the southern part of the synclinorium, so that most of the nothephreatic cave systems which had developed there under the ancestral Murrindal-Snowy River were destroyed. However, many of the caves in the Murrindal area were preserved (Fig. 7). These caves must have continued to form underneath the Murrindal River, until headward erosion of the knickpoint up the river lowered the watertable and drained the caves, probably in the Late Eocene or Oligocene, leaving them 'high and dry'. None of the caves display any horizontal development, so there were no significant stillstands in base level as the caves were drained. This implies that the downcutting of the adjacent rivers was rapid and continuous, resulting in over 70 m of local relief (the maximum depth of the caves in this area is 70 m). Extensive secondary calcite deposits (speleothems) have subsequently precipitated in the cave passages, but only small amounts of cave
227
sediment (largely surface soil) have accumulated, due to the limited surface catchments of the caves. Vadose seepage of rainwater down the cave walls may have enlarged some of the shafts and fissures in the caves (see Jennings 1985). Presumably the uplift responsible for the drainage diversions also helped to cause the incision along the rivers. There may also have been a component resulting from isostatic rebound of the highlands following erosional unloading (Lambeck & Stephenson 1986): this uplift is presumed to be relatively slow and continuous (5 m/Ma). In addition, it is necessary to consider the changes in sea level, as recorded by sedimentation within the Gippsland Basin to the south of Buchan. In the Early Oligocene there was a major transgression onto the northern margin of the Gippsland Basin, the Lakes Entrance Platform (Fig. 11), due to subsidence of this area at the same time as a rise in eustatic sea level (Fig. 12). The shoreline advanced at least 30 km landward during the 10 Ma period from the Late Eocene to the Early Oligocene (Blake 1986). Despite the transgression, and hence rise in relative base level, the rivers around Buchan show no evidence of extensive aggradation. This is most easily explained if the overall tectonic uplift in the area was sufficient to override the effect of the rising sea level. If this was indeed the case, it indicates that the uplift must have occurred in the Late Eocerie - Early Oligocene, i.e. concomitant with or soon after the volcanic activity. In this regard it is interesting to note that Jones and Veevers (1984) proposed that uplift of highland areas could take place at the same time as subsidence of adjacent sedimentary basins. The later fall in eustatic sea level, from the Early to Late Oligocene (Fig. 12), was insufficient to cause extensive shoreline retreat, due to the on-going subsidence within the Gippsland Basin, but might have contributed to continuing incision of the Buchan rivers. This period of downcutting was followed by a stillstand in the Buchan region, that allowed the development of a fairly broad
SERIES
CHRONO-
J.A. Webb, B.L. Finlayson, £>. Fabel & M. Ellaway STRATIGRAPHY
228
EUSTATIC CURVES
200 HOLOCENE? 250 . i
150 i
PLEISTOCENE LU
2
LU
UPPER
CJ
o
LOWER
UPPER LONG TERM
100 i
50
0M i _ i
t X Ij
/ e 13 / cjzr^
\
LU
MIDDLE
z
, ^
LU
SHORT TERM
CJ
o
LOWER
^ UPPER LU
z
CJ
v
cL
o
(3 o
Fig. 11 Sedimentary history of the Lakes Entrance Platform, the northern margin of the Gippsland Basin. Sale Group (heavy shading) - predominantly non-marine fluvial sediments; Seaspray Group (diagonal shading) - shallow marine; vertical shading - non-deposition. From Abele et al (1976).
EOCENE
LOWER
UPPER
MIDDLE
Fig. 12 Post-Eocene eustatic sea level curves, from Haq et al (1987).
The geomorphology of the Buchan Karst river following much the same course as the present Buchan, and with much the same gradient. As previously discussed, the presence of this river can be identified using the river gravels capping Moons Hill (Fig. 9) and the ferricretes and gravels on the flattopped spurs at East Buchan (Fig. 6). During the period of stillstand, and probably also during the time of incision that preceded it, nothephreatic cave systems developed in the Buchan Caves Limestone underneath the Buchan and Murrindal Rivers. No cave formation occurred in the Murrindal Limestone, which stratigraphically overlies the Buchan Caves Limestone; the previous period of incision had left this unit perched well above the watertable. The caves formed at this time are similar to those that developed during the previous period of nothephreatic cave formation, i.e. they are predominantly vertical, representing enlarged joint systems (southern caves on Fig. 8), and show roof and wall pendants, large scale scalloping and occasional spongework. These caves are best preserved in the Tourist Caves area (Figs. 8 and 9), but are also present elsewhere in the synclinorium, e.g. along the Murrindal River and at East Buchan. The stillstand may represent the time of maximum transgression within the Gippsland Basin, in the Early-Middle Miocene, when regional base level was highest (Fig. 11), probably as a result of the combination of a period of subsidence with a time of high eustatic sea levels (Fig. 12). The shoreline was at this time 10-15 km inland of its present position (Thompson 1986), and about 50 m above present sea level. The effect of this stillstand was to stabilise base level. As a result, the rivers in the Buchan area, which prior to this were actively downcutting, could incise no further. Their profiles were graded to the stillstand base level, and broad valleys developed. Late Tertiary - Quaternary Incision and Stillstand Following the Early-Middle Miocene still-
229
stand, the rivers in the Buchan karst underwent another period of incision, resulting in the V-shape of the Buchan valley still clearly visible at East Buchan (Fig. 6). This period of incision destroyed some of the nothephreatic caves that had formed previously, and drained those that were preserved. It is possible that some of the caves were deepened by continuing nothephreatic development beneath the watertable as the rivers incised downwards. Vadose seepage may have enlarged some of the shafts and avens. Speleothems and sediment, particularly clay from surface soil horizons, were deposited in the caves once they had been drained. This downcutting of the rivers continued until another period of stillstand occurred, represented by the development of river terraces on the narrow flood plain along the Buchan River where it meanders through the Taravale Formation (Fig. 1). As previously described, three main levels of paired aggradational terraces appear to be present, approximately 28 m, 10 m and 4-5 m above the present river, and there are remnants of other swing terraces eroded in bedrock. The formation of the extensive horizontal epiphreatic caves (Figs. 8 and 9) probably occurred at the same time as the development of the river terraces. As previously discussed, epiphreatic cave development involves the enlargement of pre-existing cavities just below the water table by dynamic flow. Thus for epiphreatic systems to form, a relatively high surface gradient (to provide sufficient hydraulic head) must be present over already developed caves. At Buchan these conditions have been most frequently provided by those tributary streams to the Buchan River which flow over limestone containing pre-existing nothephreatic cavities. These streams have considerably higher gradients than the Buchan itself. Once a dynamic phreatic system has formed underneath such a surface stream, continual enlargement of the passages will eventually allow the entire surface flow to be captured and diverted underground, provided downcutting causes the watertable to fall
230
J.A. Webb, B.L. Finlayson,
Fabel & M. Ellaway
below the level of the surface stream. This is the process which appears to have formed the tourist cave system at Buchan. These caves can be seen to cross-cut pre-existing nothephreatic caves, and have formed subparallel to the present course of Fairy Creek, which has its entire flow diverted underground except during floods (Figs. 8 and 9). The longest epiphreatic system, the Buchan tourist cave system, is largely developed at one level (Fig. 9), and could only have formed while the water table was stable in this position for a considerable period of time. This level shows little relation to the minor terrace development along Fairy Creek (Fabel 1987), but may correspond to the middle set of terraces along the Buchan, rather than the lower set, as suggested by Sweeting (1960). However, the exact correlation between terrace and cave levels has yet to be established, and further surveying is being carried out at present to elucidate this. At Moons Hill, the downcutting between the ?Early-Middle Miocene stillstand (represented by the gravels capping the hill) and the epiphreatic cave systems is of the order of 90-100 m (Fig. 9). It is not necessary to invoke tectonic uplift to explain this incision, which could reflect the regression that occurred in the Gippsland Basin between the Middle Miocene and Early Pliocene (Figs. 11 and 12), probably at least partially due to a major fall in eustatic sea level between the Middle and Late Miocene (Fig. 12). If this explanation of the downcutting is correct, then the epiphreatic systems might have developed in the Late Miocene or Early Pliocene. Uranium series dates on speleothems from the epiphreatic systems indicate only that caves 10-20 m above present river level were drained more than 350,000 years ago, and passages within 5 m of river level contain flowstone around 100,000 years old (Table 1; see previous discussion). Thus the caves could be as old as Pliocene or Miocene, but further work is necessary to confirm or deny this possibility. The next event to be recorded following the formation of the epiphreatic systems was their
infilling by sediment, mainly gravel, with a capping of sand and clay. The gravel-filling episode may have been the result of valley aggradation or blocking of the caves by roof collapse. Possible causes for the rise in base level implied by the aggradation include a eustatic sea level increase (e.g. from the Late Miocene to the Early Pliocene; Fig. 12) or climatic changes (e.g. during the Pleistocene glaciations). At present the age of the sediment is unknown, despite attempts to date it palynologically, so further discussion is unwarranted. The final, relatively minor period of downcutting by the Buchan River incised into the river terraces, eroded vadose canyons in the epiphreatic systems and partially removed the sediment filling many of the cave passages. This small-scale episode of river incision could have been due to sea level fall or uplift. With regard to the latter possibility, it should be noted that the Haunted Hill Formation, a coarse terrigenous unit in the onshore Gippsland Basin, is of Pliocene age (Fig. 11), and is believed to have been deposited as a result of tectonic uplift (the Kosciusko Uplift) in the adjacent highland areas (Jenkin 1976; Bolger, this volume). The Haunted Hill Formation thins from over 100 m in the west to less than 20 m south of Buchan. If this is an indication of the amount of tectonism responsible for its formation, then only small-scale uplift has occurred in the east, and this could be represented by the minor incision recorded at Buchan. Thus the Late Pliocene Kosciusko Uplift, once believed to be largely responsible for the formation of the Eastern Highlands (e.g. Browne 1969) and used by Sweeting (1960) to account for all the uplift of the Buchan karst, had at most only a minor role in the development of this area. The other possible cause for the final period of river incision at Buchan is a fall in sea level during the Pleistocene, due to the glaciations; several phases of entrenchment and alluviation are recorded in the Pleistocene terraces of the Gippsland Coastal Plain to the south (Jenkin 1976). The fact that only minor downcutting could have occurred at Buchan during
The geomorphology of the Buchan Karst the Pleistocene, despite the large fluctuations in sea level (100 m), indicates that the sea level changes were too rapid to have much effect as far upstream as Buchan. CONCLUSIONS This study has shown that the landscape of any area of the Southeastern Highlands is likely to have resulted from a complex interplay of factors: tectonic uplift, isostatic uplift, subsidence in nearby sedimentary basins, volcanism, sea level changes and bedrock lithologies. At Buchan the large amount of information available, particularly from the karst geomorphology, has enabled the relative effects of these factors to be ascertained so that the evolution of the landscape can now be understood in some detail. In addition, there are a number of specific conclusions that can be made with relevance to other areas of the highlands. Firstly, Wellman (1987) argued that, following the initial Cretaceous uplift of the Eastern Highlands, there were additional periods of tectonic uplift related to Cainozoic volcanism. The Buchan area seems to verify this hypothesis, as it has apparently undergone two periods of tectonic uplift. The earlier, regional uplift was followed by a probably Late Eocene event, localised in extent, that is likely to have occurred at much the same time as the volcanic activity in the area. Wellman (1987) also postulated that river downcutting after each period of tectonic uplift was rapid. Two lines of evidence suggest that this was the case in the Buchan area. The very broad valley of the ancestral Murrindal-Snowy River must have developed during a long period of stable base level, when there was considerable lateral erosion within the valley. This indicates that initial downcutting by the rivers was rapid, following the Cretaceous uplift, so that the river profiles were soon graded to the regional base level allowing a long period of stability. The second tectonic uplift at Buchan was also followed by rapid river incision, as shown by the high level caves at Buchan. These were drained so
231
quickly by downcutting that there was no time for any horizontal cave development. Finally, the antiquity of cave development at Buchan has been demonstrated. The oldest caves in the area were probably drained in the Late Eocene or soon after, and were forming for a considerable time prior to this. Even older caves apparently exist along the crest of the highlands in New South Wales (Osborne 1984). By contrast, caves in the Northern Hemisphere are generally believed to be Pliocene or younger. Either the ancient landscapes and cave systems of Australia have no analogue in the Northern Hemisphere, or the present ideas on the age of the northern caves need to be reassessed. ACKNOWLEDGEMENTS Many people have assisted with this project. Members of the Victorian Speleological Association, particularly Tom Whitehouse, Lloyd Mill, Peter Matthews, Rudy Frank and Peter Ackroyd have mapped many of the underground and surface features at Buchan, and their maps have proved invaluable. In addition, many club members provided useful information on the caves. Staff at the Buchan Caves Reserve, particularly Alan Costigan and Graham Parkes, cheerfully allowed access to the caves under their control. Rob Bartlett assisted with the surface surveying and drafted the figures, and Nella Cerra typed the manuscript. Terry Hamilton and David Smith (Department of Chemistry, Melbourne University) carried out the uranium series age determinations. Mike MacPhail (Sydney) processed several cave sediment samples in a fruitless search for palynomorphs. REFERENCES ABELE C. et al 1976. Tertiary. In Douglas J.G. & Ferguson J. A. eds. Geology of Victoria, Geological Society of Australia, Special Publication 5, 177-274. ANDREWS E.G. 1911. Geographical unity of eastern Australia in Late and post Tertiary time, with applications to biological problems. Journal and Proceedings of the Royal Society of New South Wales 44, 420-480.
232
J.A. Webb, B.L. Finlayson, D. Fabel & M. Ellaway
ATKINSON T.C., HARMON R.S., SMART P.L. & WALTHAM A.C. 1978. Palaeoclimatic and geomorphic implications of 230Th/234U dates on speleothems from Britain. Nature 272, 24-28. BISHOP P. & YOUNG R.W. 1980. Discussion: on the Cainozoic uplift of the southeastern Australian highlands. Journal of the Geological Society of Australia 27, 117-119. BLAKE R. 1986. Seismic-stratigraphic interpretation of coastal barrier systems of Late Eocene age, offshore Gippsland Basin. In Elenie R.C. ed. Second South-Eastern Australia Oil Exploration Symposium, pp. 159-169. Petroleum Exploration Society of Australia, Melbourne. BOURMAN R.P., MILNES A.R. & OADES J.M. 1987. Investigation of ferricretes and related surficial ferruginous materials in parts of southern and eastern Australia. Zeitschrift fur Geomorphologie, Supplementband 64, 1-24. BROWNE W.R. 1969. General notes. In Packham G.H. ed. The Geology of New South Wales. Journal of the Geological Society of Australia 16, 559-569. CARTER A.N. 1979. Pliocene eustasy and the onset of sand barrier formation in Gippsland, Victoria. Nature 280, 131-132. COCKBAIN A.E. 1970. Milton No. 1 - well completion report. Ashburton Oil Exploration Report (unpublished).
Peak district, Derbyshire. Transactions of the British Cave Research Association 10, 103-115. GASCOYNE M. & LATHAM A.G. 1981. The antiquity of Castleguard Cave as established by uranium-series dating of speleothems. Proceedings of the Eighth International Speleological Congress, 101-103. GOEDE A. & HARMON R.S. 1983. Radiometric dating of Tasmanian speleothems - evidence of cave evolution and climatic change. Journal of the Geological Society of Australia 30, 89-100. HAQ B.U., HARDENBOL J. & VAIL P.R. 1987. Chronology of fluctuating sea levels since the Triassic. Science 235, 1156-1166. HOUSEHOLD I. 1983. Relationships between karst and valley fill features at Limestone Creek, northeastern Victoria. BA Honours Thesis, Department of Geography, University of Melbourne (unpublished). JENKIN J.J. 1976. Western Port and southern Gippsland. In Douglas J.G. & Ferguson J.A. eds. Geology of Victoria. Geological Society of Australia, Special Publication 5, 315-325. JENKIN J.J. & BAXTER G.W. 1969. Limestones and dolomites of the Buchan-Murrindal area. B.H.P. Exploration Department Report 744 (unpublished). JENNINGS J.N. 1982. Principles and problems of reconstructing karst history. Helictite 20, 37-52.
CONNOLLY M.R. & FRANCIS G. 1979. Cave and landscape evolution at Isaacs Creek, New South Wales. Helictite 17, 5-24.
JENNINGS J.N. 1985. Karst Geomorphology. Blackwell, Oxford.
ELLAWAY M. & FINLAYSON B.L. 1984. A preliminary survey of water chemistry in the limestones of the Buchan area under low flow conditions. Helictite 22, 11-20.
JENNINGS J.N., JAMES J.M., COUNSELL W.J. & WHAITE T.M. 1972. Geomorphology of Bungonia caves and gorge. Bungonia Caves. Sydney Speleological Society Occasional Paper 4, 113-143.
FABEL F.G. 1987. Post-Eocene karst development at Buchan: implications for theories of uplift of the Southeastern Highlands. BA Honours Thesis, Department of Geography, University of Melbourne (unpublished).
JENNINGS J.N., JAMES J.M. & MONTGOMERY N.R. 1982. The origin and evolution of the caves. Wombeyan Caves. Sydney Speleological Society Occasional Paper 8, 83-120.
FINLAYSON B.L. & ELLAWAY M. 1987. Observations on the Buchan karst during high flow conditions. Helictite 25, 21-29. FLOOD J. 1974. Pleistocene man at Cloggs Cave: his tool kit and environment. Mankind 9, 175-188.
JONES J.G. & VEEVERS J.J. 1984. Morphotectonics of the platform regions, focused on the highlands - Eastern Highlands. In Veevers J. J. ed. Phanerozoic Earth History of Australia, pp. 115-124. Clarendon Press, Oxford.
FORD D.C. & EWERS R.D. 1978. The development of limestone cave systems in the dimensions of length and depth. Canadian Journal of Earth Sciences 15, 1783-1798.
KARNER G.D. & WEISSEL J.K. 1984. Thermally induced uplift and lithospheric flexural readjustment of the Eastern Australian Highlands. Geological Society of Australia, Abstract Series 12, 293-294.
FORD T.D., GASCOYNE M. & BECK J.S. 1983. Speleothem dates and Pleistocene chronology in the
LAMBECK K. & STEPHENSON R. 1986. The post-Palaeozoic uplift history of southeastern
The geomorphology of the Buchan Karst Australia. Australian Journal of Earth Science 33, 253-270. LISTER G.S., ETHERIDGE M.A. & SYMONDS P.A. 1986. Detachment faulting and the evolution of passive continental margins. Geology 14, 246-250. MATTHEWS P.G. 1985. Australian Karst Index 1985. Australian Speleological Federation Inc., Melbourne. MAWSON R. 1987. Early Devonian conodont faunas from Buchan and Bindi, Victoria, Australia. Palaeontology 30, 251-297. McRAE-WILLIAMS M.S., ROSENGREN N.J. & KRAEMERS S.M. 1981. Sites of geological and geomorphological significance in East Gippsland, Victoria. Ministry for Conservation, Victoria, Environmental Studies Series 320, 1-641. MILL L. 1987. The Buchan Caves Reserve. In Mackey P.J. ed. Proceedings of the 13th Biennial Conference, Australian Speleological Federation, 1980, 13-20. MILL L., WHITE S. & MACKEY P.J. 1980. Victorian Caves and Karst. Victorian Speleological Association, Melbourne. MOORE M.E., GLEADOW A.J.W. & LOVERING J.F. 1986. Thermal evolution of rifted continental margins: new evidence from fission tracks in basement apatites from southeastern Australia. Earth and Planetary Science Letters 78, 255-270. NICOLL R.S. 1977. Preliminary report on drainage modification in the Deep Creek - Eagles Nest basins, Yarrangobilly, N.S.W. Proceedings of the 11th Biennial Conference, Australian Speleological Federation, 1976, 96-103. OSBORNE R.A.L. 1978. Structure, sediments and speleogenesis at Cliefden Caves, New South Wales. Helictite 16, 3-32. OSBORNE R.A.L. 1984. Multiple karstification in the Lachlan Fold Belt in New South Wales: reconnaissance evidence. Journal and Proceedings of the Royal Society of New South Wales 117, 15-34. PALMER A. 1989. Geomorphic history of the Mammoth Cave System. In White W.B. & White E.L. eds. Karst Hydrology - Concepts from the Mammoth Cave Area, pp.317-337. Van Nostrand Reinhold, New York. PILAPIL L. 1987. The geology and geophysics of the northern part of the Buchan Synclinorium in East Gippsland, Victoria. BA Honours Thesis, Department of Geology, La Trobe University (unpublished).
233
RICH P.V. & van TETS G.F. 1982. Fossil birds of Australia and New Guinea: their biogenographic, phylogenetic and biostratigraphic significance. In Rich P.V. & Thompson E.M. eds. The Fossil Vertebrate Record of Australasia, pp.235-384. SCHMIDT V.A. 1982. Magnetostratigraphy of sediments in Mammoth Cave, Kentucky. Science 217, 827-829. SCHUMM S.A. 1977. The Fluvial System. John Wiley, New York. SUTHERLAND F.L. 1985. Regional controls in eastern Australian volcanism. Publications of the Geological Society of Australia, N.S. W. Division, 1, 13-32. SWEETING M.M. 1960. The caves of the Buchan area, Victoria, Australia. Zeitschrift fur Geomorphologie, Supplementband 2, 81-91. TAYLOR G., TAYLOR G.R., BINK M., FONDOULIS C., GORDON I., HEDSTROM J., MINELLO J. & WHIPPY F. 1985. Pre-basaltic topography of the northern Monaro and its implications. Australian Journal of Earth Science 32, 65-71. TEICHERT C. & TALENT J.A. 1958. Geology of the Buchan area, East Gippsland. Geological Survey of Victoria, Memoir 21, 1-56. THOMPSON B.R. 1986. The Gippsland Basin development and stratigraphy. In Elenie R.C. ed. Second South Eastern Australia Oil Exploration Symposium, pp.57-64. Petroleum Exploration Society of Australia, Melbourne. VANDENBERG A.H.M. & O'SHEA P.J. 1981. Explanatory notes on the Bairnsdale 1:250,000 geological map. Geological Survey of Victoria, Report 65, 1-61. WAKEFIELD N. 1960. Recent mammal bones in the Buchan district. Victorian Naturalist 77, 164-178. WELLMAN P. 1974. Potassium-argon ages on the Cainozoic volcanic rocks of eastern Victoria, Australia. Journal of the Geological Society of Australia 21, 359-376. WELLMAN P. 1979. On the Cainozoic uplift of the southeastern Australian highlands. Journal of the Geological Society of Australia 26, 1-9. WELLMAN P. 1987. Eastern Highlands of Australia; their uplift and erosion. BMR Journal of Australian Geology and Geophysics 10, 277-286. WILLIAMS P.W. 1982. Speleothem dates, Quaternary terraces and uplift rates in New Zealand. Nature 298, 257-260.
234
J.A. Webb, B.L. Finlayson, Z>. Fabel & M. Ellaway
WORTHINGTON S.R.H. & FORD D.C. 1984. Pattern and antiquity of sinkholes along an alluviated karstified valley: Friars Hole, West Virginia. In Beck B.F. ed. Sinkholes: Their Geology, Engineering and Environmental Impact, pp.93-96. A.A. Balkema, Rotterdam.
YOUNG R.W. & McDOUGALL I. 1985. The age, extent and geomorphological significance of the Sassafras basalt, southern New South Wales. Australian Journal of Earth Science 32, 323-331.
Tin placer genesis in northeastern Tasmania W.W.-S. YIM Department of Geography and Geology, University of Hong Kong, Hong Kong.
A heavy mineral provenance study of tin placers in northeastern Tasmania reveals that they were formed by episodic recycling dating back at least to the Permian. Heavy mineral species demonstrably derived from granitic and basaltic source rocks are used to identify placer formation events. Deep leads such as Briseis and Pioneer were stratigraphically confined within the Middle Eocene (c. 47 Ma) and Middle Miocene (c. 16 Ma) basaltic episodes. This is supported by both fission track dating and electron spin resonance (ESR) studies of alluvial zircons. Comparatively shallow leads of younger ages occur as bedrock channels or hiatuses above the rock basement. The latter were long enough to cause heavy mineral enrichment and assist in the stratigraphic correlation of placer sequences. Quaternary placers occur in fluvial terrace deposits along the lower Ringarooma valley. Their formation appears to be related to the seasonal thawing of snow fields on high ground during glacial periods. In the present study, stratigraphic control is possible through an examination of heavy mineral provenance, aided by volcanic and duricrust formations and by lithologic and palynofloral characteristics. The selective removal of light minerals by winnowing and drainage evolution during 'long' periods of geologic time played an important part in the genesis of the placers in northeastern Tasmania. The conclusions drawn are in general agreement with Cainozoic sea surface palaeotemperatures obtained from oxygen isotope studies of Deep Sea Drilling Project cores collected from waters adjacent to Tasmania. Key words: heavy mineral provenance, northeastern Tasmania, tin placer deposits, sedimentology, stratigraphy. INTRODUCTION
Placers are defined as surficial mineral deposits formed by the mechanical concentration of mineral particles from unaltered debris (Bates & Jackson 1984). In eastern Australia, placers of mainly fluvial origin containing economic quantities of tin, gold and sapphire are widespread and are often referred to as 'leads' or 'deep leads'. Both terms are used for ancient stream valleys cut either into bedrock or older sediments, but to the author's knowledge, the depth of separation between the two types has not been specified in any previous work. In northeastern Tasmania, Nye (1925) used the term 'leads' specifically in connection with valleys infilled with sediments of Lower Tertiary age. However, it is generally agreed that 'deep leads' occur at greater depths below ground surface than 'leads', and in cases may occur beneath basaltic lava flows of Upper Tertiary age. Since a lithological marker is provided by the base of the basalts, this was used by Spry 235
(1962) to separate Tertiary deposits into subbasaltic and post-basaltic types. This paper describes the genesis of tin placers associated with the Ringarooma and Boobyalla river systems, northeastern Tasmania (Fig. 1). The area of study contains: 1) a major tin placer field with extensive bedrock mineralisation; 2) a diverse heavy mineral assemblage derived from multiple source rocks; 3) availability of good exposures in mine workings, and data from exploration boreholes and documentary records; and 4) the presence of datable stratigraphic markers in the placer sequence. Unlike some tin belts in the world, northeastern Tasmania and other parts of eastern Australia are characterised by widespread and well-dated basaltic volcanism during the Cainozoic Era (Wellman & McDougall 1974a,
236
W.W.-S.
Yim
Fig. 1 Location map of northeastern Tasmania showing the zircon localities selected for fission track dating by Yim et al (1985) and ESR study.
Tin placer genesis in northeastern Tasmania
1974b; Wellman 1974; Sutherland & Wellman 1986). Furthermore, high to moderate pressure inclusions in alkali basaltic volcanic rocks have yielded the distinctive 'zircospilic' suite of heavy minerals (Hollis 1984), comprising zircon (zir), corundum (co), spinel (sp) and ilmenite (il). Therefore a heavy mineral provenance study is likely to be particularly rewarding.
237
known age. However, only the last reason is relevant here. Good exposures of Tertiary and Quaternary deposits may be found in alluvial tin workings particularly when mines are in operation. The main difficulty is in the age determination of these deposits, because sedimentological characteristics alone are inadequate due mainly to the discontinuity of exposures. Tertiary basalts in northeastern Tasmania GEOLOGICAL SETTING provide datable lithological markers for the Detailed accounts of the geology of north- placer deposits. Two ages were identified on eastern Tasmania may be found in Groves et grounds (Nye 1925; Nye & al (1977) and McClenahan et al (1982), but physiographic Blake 1938; Edwards 1939). The younger only aspects relevant to placer genesis are Winnaleah-Ringarooma basalts differ from outlined here. the older basalts at Weldborough Pass and Grays Hill near Black Creek (Fig. 1) in their A geological map of the area of study is shown in Figure 2. The Palaeozoic Mathinna lower elevation and greater freshness. K-Ar Beds were folded and cleaved prior to the dating of the basalts gave ages of c. 16 Ma emplacement of the granitic Blue Tier and (Brown 1977) and c. 47 Ma (Sutherland & Scottsdale Batholiths. A co-genetic origin for Wellman 1986) respectively. In addition, fisthe two batholiths was confirmed by K-Ar and sion track dating of coarse anhedral zircons Rb-Sr age determinations (McDougall & occurring in leads and deep leads derived from Leggo 1965) with ages of around 370 Ma. On older basalts (Yim et al 1985) gave ages of the 1:50,000 Ringarooma geological map between 46.3 ±1.8 and 47.1 ±1.4 Ma, which sheet (Tasmania Department of Mines 1977), are in agreement to within experimental error an outcrop of conglomerate near Blue Tier with the K-Ar ages obtained by Sutherland (Fig. 2) was attributed to the Parmeener and Wellman (1986). Super-group of Permo-Triassic age (Banks Studies on palynoflora are consistent with 1973). This stratigraphic relationship implies Miocene to Late Oligocene age that the mineralised granitic rocks were aforpre-Middle northeastern Tasmanian deep leads exposed subaerially prior to its deposition. (Harris 1965b, 1968; MacPhail in Although cassiterite has not yet been found Morrison1965a, Forsyth 1982; Hill & Macin the conglomerates, the release of cassiterite Phail 1983;1980; Hill 1983). The high proportion from granitic rocks must have dated back to of Nothofagus-tyve pollen, especially of N. at least the Permian. A 'long' geological brassi, and the occurrence of Cyatheacidites history involving major climatic changes and annulatus at Pioneer (MacPhail in Morrison variable conditions has played a part in the confirm a Late Oligocene to Early recycling of heavy minerals, leading to their 1980) Miocene time period (J.A. Owen, pers. enrichment in superficial deposits. comm.). A reconstruction of the Oligocene In mapping the non-marine Tertiary sedi- vegetation at Pioneer (Hill & MacPhail 1983) ments of the 1:50,000 Ringarooma and showed a closed temperate rainforest which Boobyalla geological map sheets, Brown, was floristically more complex than modern Moore and Baillie in McClenahan et al (1982) Tasmania. Based on close similarity to palyfound difficulties in poor exposures, lack of noflora in Oligocene sediments in onshore and datable material and lithological marker beds, offshore Gippsland Basin, there was little as well as the occurrence of lag deposits of regional differentiation in southeastern uncertain age in areas marginal to those of Australia at that time.
238
W. W.-S. Yim
Fig. 2 Simplified geological map of northeastern Tasmania. Based on Tasmania Department of Mines (1975).
Tin placer genesis in northeastern Tasmania Sub-basaltic deep lead sediments containing economic values of tin were visualised as segments of shallow alluvial cones formed at the break in stream gradient near the front of the Blue Tier and Mount Cameron Massifs (Jennings 1975). At the Pioneer Mine, the only operating deep lead mine during the author's fieldwork, a fining upward sequence of pre-Middle Miocene alluvial deposits was divisible into two parts (Morrison 1980). The upper sequence is tin-depleted and between 30 to 40 m in thickness. It consists of trough cross-bedded sands and gravels, and large bodies of kaolinitic clay representing mainly a low energy floodplain facies. The lower sequence is tin-bearing, up to 6 m in thickness, consisting of stratified gravels, trough crossbedded granules, and lenticular bodies of peat and associated clay. The main type of deposit represented is a high energy river channel facies. Extensive duricrust outcrops including ferricrete and silcrete are shown on the 1:50,000 Ringarooma geological map sheet (Tasmania Department of Mines 1977). In the Winnaleah area, ferricrete underlying basalt and overlying Tertiary sediment was recognised by Brown in McClenahan et al (1982). He suggested that the ferricrete lag overlying Tertiary sediment in other localities could be useful as a criterion for the basalt-sediment interface. The release of iron and silica from the weathering and erosion of basalt would be a favourable source for ferricrete and silcrete respectively. Based on this, a definite field relationship between basalt, ferricrete and silcrete outcrops must exist. Therefore, the ferricrete cappings above Tertiary sediments on flat-topped hills may be used to indicate the former extent of basaltic flows, as well as providing a stratigraphic marker for pre-basaltic sediments and topography. Quaternary deposits are generally not wellrecognised with the possible exception of those occurring near to the coast studied by Bowden (1981) and Baillie et al (1985). At least part of the alluvial and slope deposits are likely to be of Quaternary age. The former
239
occurs in the present day floodplain of the major rivers but their boundaries with Tertiary deposits are not clear. METHODS In situ samples from natural and mine exposures, sluiced heavy mineral concentrates, mine tailings, stream sediments and borehole samples were collected for the identification of heavy mineral provenance. A flow chart of the preliminary sample treatment procedures and the mineralogical examination methods used are shown in Figure 3. Heavy liquid and magnetic separations were aimed at facilitating the identification of heavy minerals based on specific gravity and magnetic property. Details of the fission track dating method and the particle size measurement of heavy mineral grains using a Zeiss TGA 10 particle size analyser are presented in Yim et al (1985) and Yim (1986) respectively. The method used in the ESR studies of alluvial zircons is given in the Appendix.
HEAVY MINERAL PROVENANCE The results of the distribution of trace elements in cassiterite to assist provenance determination will be reported elsewhere. Table 1 provides a summary of the specific gravity, frequency and probable provenance of the heavy minerals found in northeastern Tasmania. The stability and frequency of heavy mineral occurrence according to Milner (1962) is also shown for comparison. Although four categories of heavy mineral frequencies were used by Milner and in the present study, a Very common' category is preferred over the 'local' category because it is considered to be more appropriate in a regional study. The heavy minerals present are attributed to five main types of source rocks, including: 1) a granitic suite with cassiterite, fine euhedral zircon, tourmaline, manganese-rich ilmenite, monazite and spessartine;
240
fV.fV.-S, Yim sample sample volume estimated from pan pan volume - 5.5 litres
pan concentrate
2 mm
2 mm sieve
weigh
2 mm riffle
weigh
tetra-bromo-ethane separation SG 2.96
kept for reference
-2.96 fraction mainly feldspar, quartz, mica
weigh
2.96-3.32 fraction mainly maflcs, tourmaline
weigh
3.32-4.2 fraction mainly topaz, spinel
weigh
+2.96 fraction weigh selected sample
mineralogical examination
selected sample
methylene Iodide separation SG 3.32 +3.32 fraction weigh Clerlcl's solution separation SG 4.2 +4.2 fraction weigh selected sample magnetic separation with Boxmag magnet full-on non-magnetics cassiterite, rutlle, zircon, gold
weak magnetics - monazlte
half-on moderate magnetics - garnet, ilmenite, hematite, chrome-spinel spinel
off strong magnetics titano-magnetlte, magnetite
weigh
Fig. 3 Flow chart of sample treatment procedures used for heavy mineral provenance study.
Tin placer genesis in northeastern Tasmania MINERAL NAME
SG
AFTER MILNER (1962) Frequency R L
Stability S S
241
PRESENT STUDY Frequency R VC
Probable provenance quartz veins in Mathinna Beds greisens, pegmatites pneumatolytic veins near granite Scheelite 5.9-6.1 U L VR contacts with country rock Magnetite 5.2 S R R Tertiary basalts Hematite 5.1 M C C ferricretes Monazite 5.0-5.3 S R C accessory mineral in granitic rocks authigenic mineral in Cainozoic Pyrite 5.0 M C VC sediments; accessory mineral in granitic rocks authigenic mineral in Cainozoic Marcasite 4.9 M L C sediments Mg-rich-megacrysts, xenocrysts and accessory grains in Tertiary basalts; Ilmenite Mn-rich-inclusions in biotite and 4.7-4.8 M C VC overgrowths on alkali feldspars in granitic rocks Molybdenite 4.7-4.8 M L VR pegmatites Ulvospinel/Titanom agnetite 4.6-4.8 R Tertiary basalts fine euhedral - accessory mineral in granitic rocks; coarse anhedral Zircon 4.6-4.7 S C VC megacrysts and xenocrysts in older Tertiary basalts Xenotime 4.4-4.6 S VR R accessory mineral in granitic rocks Chromite 4.3-4.6 s VR VR Jurassic dolerite Rutile 4.2 s C R rutiliated quartz in pegmitites Garnet-Almandine 4.1-4.3 s C R aureoles of thermal metamorphism Spessartine s VR R pegmatites weathering product of iron-bearing 4.0-4.4 Goethite M L VC minerals megacrysts, xenocrysts and xenoliths Corundum 4.0 s R C in older Tertiary basalts megacrysts, xenocrysts and xenoliths Chrome-spinel 3.8-4.2 R in Tertiary basalts alteration product of sphene and VR Anatase 3.8-4.0 s C ilmenite megacrysts, xenocrysts and xenoliths M 3.7-3.9 R Pleonaste/Hercynite C in older Tertiary basalts Limonite s VC ferricretes 3.6-4.0 C greisens, pegmatites, aplites Topaz s C VC 3.6 VR R pegmatites Chrysoberyl 3.5-3.8 s Tertiary basalts R R 3.4-3.5 Pyroxene VR Tertiary basalts R 3.3-3.4 u Olivine veins, pegmatites C VC s 3.1-3.3 Tourmaline S - stable; M - moderately stable; U - unstable; VC - very common; C - common; L - local; R - rare; VR - very rare. Gold Cassiterite
19.3 6.9-7.1
-
-
-
-
Table 1. Summary of specific gravity, frequency and probable provenance of heavy minerals found in tin placers in northeastern Tasmania. For comparison, the stability and frequency of the heavy minerals according to Milner (1962) are also shown.
242
W. IV.-S. Yim
2) a Mathinna Beds suite with gold derived from quartz veins, and almandine, a low manganese garnet found associated with aureoles of metamorphism; 3) a Jurassic dolerite suite with the stable heavy mineral chromite; 4) an older Tertiary basalt suite including the 'zircospilic* heavy minerals. In this suite, zircon and ilmenite differ from the granitic suite in that the former is coarse anhedral and the latter is magnesium-rich. The spinel varieties present include pleonaste, hercynite, chrome-spinel and ulvospinel; and 5) a younger Tertiary basalt suite, differing from (4) in that coarse anhedral zircon and corundum are absent while olivine is present locally. On the basis of the heavy minerals present in northeastern Tasmania, three heavy mineral associations were recognised using
two types of zircons and the occurrence of gold (Yim 1980). The three heavy mineral associations are: 1) a cassiterite-garnet-spinel-corundumtopaz-zircon (both types) association which may occur in deep leads below the WinnaleahRingarooma basalts. Localities include Briseis, Pioneer and Endurance (Fig. 1); 2) a cassiterite-topaz-fine euhedral zircon association in the creeks north and south of Mount Cameron, such as at Clifton Creek and Sextus Creek (Fig. 1). There is no corundum or spinel, and Tertiary basalt does not occur at these localities; and 3) a cassiterite-gold-spinel-corundum-topazzircon (both types) association largely restricted to the present day floodplain of the Ringarooma River. The fine euhedral zircons from Weld River shows appreciably stronger ESR signals, in
Fig. 4 ESR signals for three fission track dated alluvial zircons from northeastern Tasmania. Instrumental conditions used include radio frequency 9.26, field 3305.5 + 25G, sweep time 4 minutes, modulation 100 KHz 2 x 1G, amplitude 3.2 x 10, and response 0.3. The differences in scale used for the fine euhedral and coarse anhedral zircons are as indicated, while the fission track ages shown are from Yim et al (1985).
Tin placer genesis in northeastern Tasmania contrast to the coarse anhedral zircons from Mutual Mine and Weld River respectively (Fig. 4). This is in spite of a scale over three times greater than that used for the fine euhedral zircons. The distribution found is in agreement with the granitic and basaltic derivation and is consistent with the fission track dates of c. 367 Ma and c. 47 Ma respectively (Yim et al 1985). ESR signals obtained for coarse anhedral zircons from other localities are shown in Figure 5. With the possible exception of the Bells Plain sample, all the signals found are essentially similar to each other and to the fission track dated coarse anhedral zircons from Mutual Mine and Weld River (Fig. 4). Therefore it is concluded that these zircons are all c. 47 Ma in age and have been derived from the older basalt. The weaker signal of the Bells Plain sample may be explained by younger zircons with a derivation from Grays Hill. I 10
1
-8
1
1
-6
1
1
-4
1
1
1 -2
1
243
However, minor variations shown by individual samples are not well understood at present and require follow-up investigation. Nevertheless, by using zircon samples dated previously by the fission track method, it is possible to calibrate the ESR signals and correlate them with other ESR measurements on alluvial zircons. Further details of zircon ESR will be published elsewhere. DISTANCE OF CASSITERITE TRANSPORT Since the particle size of both monomineralic and composite cassiterite grains are expected to increase towards the source rock, their distribution may provide information on placer genesis. However, the maximum size of these two types of grains is governed mainly by the available size in the source rock. The distributions of maximum diameter of monomineralic and composite cassiterite grains 1 0
r
1 2
1
1 4
1
1 6
1
1 8
1
1 10
Fig. 5 ESR signals for coarse anhedral zircons from miscellaneous localities of northeastern Tasmania shown in Figure 1. Instrumental conditions used are the same as in Figure 4. All signals are shown on the same scale.
244
W.W.-S. Yim
found in the present study, and probable former drainage extension of streams from the Blue Tier Massif into the Boobyalla catchment prior to diversion by the Winnaleah-Ringarooma basalts. Present river gorge sections along the Ringarooma River and a former extension of the Great Mussel Roe catchment are also shown.
Tin placer genesis in northeastern Tasmania
245
GAP EXCEEDING 10 M
150
-
100
SAMPLE NUMBER < 5
5
CJ — 1X1 oKc -J< w CJ 0 > CO
BASEMENT TOPOGRAPHV 2.2 2.8 3.2 2.1 8.0 3.0 3.0
1.0 1.5 2.0
1.0 1.5
5.0 6.5
SAMPLE SPACING M (NOT TO SCALE )
Fig. 7 Cross-section of the Pioneer deep lead, showing the weight distribution of SG + 2.96 heavy minerals immediately above the granite rock basement.
246
W.W.-S. Yim
found in the present study are shown in Figures 6 and 7 respectively. Because the dimensions found are all in excess of 2 mm, the grains may be considered as nuggets which have travelled only short distances from the point of bedrock liberation. Furthermore, since a general decrease in particle size of mono-mineralic and composite cassiterite grains in a downstream direction of leads is not discernible from the figures, local sources of input from an extensive area of bedrock tin mineralisation is the most likely explanation. The distance of cassiterite transport indicated is appreciably less than the median distance of transport from bedrock source for economic tin placer deposits of 8 km suggested by Emery and Noakes (1968). With the exception of mass flow deposits, it is doubtful whether cassiterite grains of coarse sand and gravel size are able to travel distances in excess of 100 m. This is in agreement with the Indonesian kaksa placers reviewed by Aleva (1985), where fluvial transport of cassiterite does not occur over distances in excess of 500 m. All cassiterite grains larger than 0.07 mm could be caught in the mildly erosive environment of lag gravels within that distance. DISTRIBUTION OF TIN IN PLACERS It is difficult to determine the true tin distribution in placer deposits because large sampling errors are possible. However, tin enrichment in a placer depends on: 1) the nature of primary tin mineralisation; 2) the topography of the bedrock gradient; 3) the selective concentration processes of heavy minerals; and 4) the time factor, including the duration of time for tin liberation from the mineralised bedrock and for (3) to operate. The maximum grain size of both monomineralic and composite cassiterite grains found in the study area (Fig. 6 ) suggests the existence of an extensive area of primary tin mineralisation in northeastern Tasmania.
Based on the coarse grain size, only a short distance of transport from the source rock is possible. In order to determine the control of rock basement topography on tin distribution, a sampling traverse was carried out in the pit exposure of the Pioneer Mine. One pan volume of sediment was collected immediately above rock basement at an average spacing of 3 to 4 m. The weight of heavy minerals exceeding SG + 2.96 per pan was determined. The results, presented in Figure 7, indicate that heavy mineral enrichment is greatest in depressions in bedrock where reworking processes had been the most active. Sample number 12, with the highest heavy mineral content of 160 g per pan, is about ten times the concentration of adjacent samples. The high concentration of heavy minerals at this site is attributed to the reworking of channel fill deposits, and is shown by younger channel deposits truncating older channel fill deposits. This permitted the selective removal of light minerals by winnowing and the enrichment of heavy minerals including cassiterite. The Briseis deep lead at Derby (Fig. 1), with a total tin production of close to 30,000 tonnes of concentrate, is by far the richest in northeastern Tasmania. An assessment of the ore reserves, based on boreholes at about 30 m intervals along lines of about 100 m spacing by Braithwaite (1964) (Fig. 8), provided information on tin distribution in the deep lead (Fig. 9). With the exception of section 1, all the sections show that the bulk of the tin occurs within 10 m of the rock basement. Section 1, which is located at the upstream end of the lead, has comparatively uniform tin distribution because it is nearest to the tin source which is transported via the Cascade River. Tin enrichment can be seen to occur at three elevations: the rock basement at about 550 ft (c. 168 m), at about 670 ft (c. 204 m), and at 760 ft (c. 232 m) above mean sea level, respectively. Because tin enrichment was caused by selective concentration of high density cassiterite grains, this is accomplished mainly through erosion. Therefore the tin enrichment layers are interpreted as hiatuses or erosional surfaces. The planar nature of the
Tin placer genesis in northeastern Tasmania RINGAROOMA BAY GLADSTONE
Key-
247
Borehole sections Probable Mathinna Beds/ granite contact
INSET
Fig. 8 Location map of borehole sections across the Briseis (Cascade) deep lead. Redrawn from Braithwaite (1964).
248
W.W.-S. Yim
Eocene to Middle Miocene. Furthermore, since the level of tin enrichment is the highest immediately adjacent to the rock basement level of 550 ft (c. 168 m) above mean sea level, it is explained by the longest of the three nondeposition gaps. Because these hiatuses are sufficiently long to cause heavy mineral enrichment, they warrant attention in the stratigraphic correlation of placer sequences from different localities.
tin enrichment levels which can be traced in the sections (Fig. 9) is indicative of the episodic nature of deep lead deposition. The three tin enrichment levels represented three periods of non-deposition between the Middle SECTION 6
STRATIGRAPHIC CONTROL OF DEEP LEADS Stratigraphic control of deep leads in northeastern Tasmania is based on: 1) K-Ar dating of Tertiary basalts; 2) fission track dating of alluvial zircons; 3) ESR dating of alluvial zircons; 4) palynoflora occurring within deep leads; and 5) duricrusts including laterites and silcretes which are post-Middle Miocene (c. 16 Ma) in age. NB NB Deep leads including Briseis and Pioneer are urlace __—• > stratigraphically confined by the (c. 16 and c. SECTION 2 T^ 47 Ma) periods of basaltic volcanic activity. At the Briseis Mine, the deep lead sequence containing the zircospilic suite of heavy minerals deriving from the older basalts of Weldborough Pass is overlain by a sequence of younger basalts comprising three lava flows (Nye 1925). At the Pioneer Mine, Morrison .71 -185 (1980) considered that the sequence of TerNB fvjB • .31 tiary sediments is overlain by the younger Average .21 1.7 4*1 2.9 2.5 ' ' basalts. Fission track dating and ESR dating KEY + Granite Ore grade at 1.5m intervals of alluvial zircons and palynoflora occurring Mathinna Beds (kg per cubic metre) within the deep lead sequence at Pioneer are TS Tertiary sediment consistent with the same age of formation. v Basalt I Boreholes Based on the similar ESR signals obtained for NB Not bottomed the coarse anhedral zircons at the miscel- Tin enrichment levels laneous localities (Fig. 5) to the Mutual Mine Fig. 9 Distribution of tin ore grade in borehole sec- and Weld River (Fig. 4), these zircons are contions shown in Figure 8. Redrawn from Braithwaite sidered to be of the same age and provenance. (1964). Tin enrichment levels representing hiatuses Therefore the occurrence of such zircons in at about 168, 204 and 232 m above mean sea level deep leads provides a maximum age limit for are also indicated. s
u
:
i
-
2 5 0
1 8 5
rj?i rtitsi
31
. 3 . 6
I-
6 -
I —
. 5 9
-
2 . 9
3 - 5 . 9
1 1 . 9
> 1 1 . 9
?
- 2 5 0
LLJ
Tin placer genesis in northeastern Tasmania the placer formation event. This is also supported by the Early Miocene to Late Oligocene age of the palynoflora at the Pioneer Mine (Hill & MacPhail 1983). In the South Mount Cameron Basin (Fig. 10) where a cover of younger basalt is absent, the former extension of basaltic flows may be indicated by present day ferricrete (Brown 1977) and silcrete outcrops. Although the origin for the latter is unclear and lacks consensus (Langford-Smith 1978), silica liberated from the weathering of a former more extensive cover of basalts is a favourable source of silica for the silcretes. Because of the closed shape of the basin, it may have formed a sump for weathering products to accumulate in the manner pointed out by Oilier (1978). The close association of ferricretes and silcretes with basalt is further supported by the identifica-
249
tion of bauxitic nodules in the topsoil at localities 1 and 2 (Fig. 10). Microscopic examination of these nodules revealed basaltic texture preserved in variable degrees while the bauxitic composition is confirmed by electron probe microanalysis. Consequently, deep lead sequences occurring beneath duricrusts are stratigraphically confined by the 'lower level' basalts now largely removed by the later erosion and lateritisation. GEOLOGICAL HISTORY AND PLACER GENESIS Based on the stratigraphic control of deep leads and information obtained from heavy mineral provenance, it is possible to identify important events in placer genesis in northeastern Tasmania. The following sequence of
Fig. 10 Simplified geological map of the South Mount Cameron Basin, showing silcrete and ferricrete outcrops, and possible former extension of the Winnaleah-Ringarooma basalts.
250
W.W.-S. Yim
events modified after Yim et al (1985) is considered appropriate in accounting for the tin placers: 1) Pre-Permo-Triassic erosion and unroofing of the Upper Devonian to Lower Carboniferous Blue Tier and Scottsdale Batholiths resulting in the liberation of cassiterites from the source rock. This is shown by the lithified conglomerate of Parmeener Super-group resting unconformably on mineralised granitic rocks on the Blue Tier (Fig. 2). However, probably because of the erratic distribution of cassiterite in sediments, no cassiterite grains have so far been identified in the conglomerate specimens examined in the present study. These rocks rest on an essentially flatlying erosional surface (Groves et al 1977) at an elevation of more than 600 m. Based on the lithology of poorly-sorted conglomerate with sub-rounded quartz pebbles of 60 mm described by McClenahan et al (1982), the sedimentary environment is a fluvial channel fill with high to moderate energy. Since glacial-marine rocks with dropstones of the Parmeener Super-group crop out in the Great Northern Plain (Fig. 1), climatic conditions at the time are thought to be cold. Glacial erosion on land cannot be ruled out and may assist cassiterite liberation from source rock. 2) Intrusion of Jurassic dolerite sheets probably accompanied by uplift followed by extensive erosion. This is supported by the identification of the Boobyalla Sub-basin by Moore et al (1984), which forms an onshore continuation of the Bass Basin. These workers concluded that northeastern Tasmania was the major sediment source for the Eastern Coal Measures of the southeastern sector of the Bass Basin. The Late Cretaceous palaeogeography was suggested by matrix supported conglomerates with a great range of clast sizes to be laid down near a fault scarp probably by debris flow and sheet flood. Palynological evidence for the Palaeocene suggested that the extreme southeastern coast of Australia, including northeastern Tasmania, was a region with rainfall high enough to support rainforest cover with warm temperatures
(Kemp 1978). Because warm and humid conditions are favourable to deep weathering, this would fit well as a preparation stage of the bedrock for heavy mineral liberation. 3) Middle Eocene (c. 47 Ma) basaltic volcanic activity on the Blue Tier. Because the older basalts are deeply dissected, they indicate considerable erosion to form the present day relief features (Yim et al 1985). Uplift associated with basaltic volcanic activity would help to account for the considerable degree of erosion and cannot be ruled out. 4) Post-Middle Eocene period of rapid erosion indicated by the widespread occurrence of the zircospilic suite of heavy minerals in basal sediments of deep leads. Pre-Middle Eocene placers with a granitic suite of heavy minerals were reworked and mixed with the older Tertiary basaltic suite of heavy minerals. Episodic recycling of heavy minerals is evident from the two hiatuses associated with heavy mineral enrichment well above the rock basement level in the Briseis deep lead sequence. 5) Middle Miocene (c. 16 Ma) basaltic volcanic activity with extensive lava flows including the Winnaleah-Ringarooma basalts. These cause diversions of the northwestflowing streams originating from the Blue Tier Massif to be captured by the Ringarooma River (Fig. 6). The streams, including Black Creek, Cascade River, Main Creek, Weld River and Wyniford River, were formerly linked to the Boobyalla drainage system and are evident today as northerly or northwesterly flowing sub-basaltic deep leads. This is confirmed by the occurrence of the zircospilic suite of heavy minerals at the Banca Mine (Fig. 1). A total catchment area estimated to be in excess of 450 sq km was lost by the former Boobyalla drainage system during this event, causing streams too small in size for their channels to remain within its present day catchment. Furthermore, reversal of flow directions in some of the river gorge sections occurring along the present Ringarooma River (Fig. 6) are likely to have taken place.
Tin placer genesis in northeastern Tasmania
6) The capture of waters of the Blue Tier Massif. These initially drained into the Mount Cameron Basin forming a shallow lake before the lake level was sufficiently high to find an outlet into the sea via Garfield Creek and the Great Mussel Roe River (Fig. 6). 7) Post-Oligocene lateritisation and silcrete formation associated with the weathering and erosion of the younger basalts. The c. 16 Ma age of the Winnaleah-Ringarooma basalts compared to the c. 26 Ma age of the Moriarty Basalt (Baillie 1986) from the Devonport-Port Sorell area, northwestern Tasmania, would help to explain why the latter is more deeply lateritised (Yim et al 1985). 8) Formation of the present day Ringarooma River through the capture of the tributary of the Great Mussel Roe River referred to in (6). 9) Reworking of alluvial deposits along the course of the Ringarooma River associated with periods of high discharge in the Quaternary. During glacial periods, seasonal thawing of snow fields which had accumulated on high ground may lead to formation of Quaternary placers along the Ringarooma River through the reworking of palaeoplacers with shallow overburden. The sequence of events identified is consistent with the Cainozoic sea surface palaeotemperatures determined from oxygen isotope data for planktonic foraminifera at Deep Sea Drilling Project sites 277, 279 and 281, which are located to the south of Tasmania (Shackleton & Kennett 1975) (Fig. 11). Warm temperatures approaching 20 °C and sufficient rainfall to cause rainforest to occur (Kemp 1978) in the Early Eocene were favourable for deep weathering to prepare the source rocks for cassiterite liberation. The period of deep lead burial between Late Oligocene to Early Miocene is shown by the palaeotemperature curve to be marked by relative climatic stability, which is supported by the floristic complexity of the palynoflora (Hill & MacPhail 1983). On the other hand, the comparatively rapid lowering of palaeotemperatures from
251
Early Eocene to Early Oligocene and from Early Miocene to Pleistocene are suggestive of dominantly erosive conditions for the enrichment of heavy minerals through recycling. FURTHER DISCUSSION The distribution pattern of heavy minerals in northeastern Tasmania is found to reflect episodic recycling of cassiterite. Table 2 summarises the Molis' scale of hardness, cleavage, transportation resistance and distribution characteristics of selected heavy minerals. The three heavy mineral associations identified may be explained by differences in source rock for some of the heavy minerals and also in their transportation resistance in comparison to hematite (Freise 1931). Cassiterite possesses only a moderate transportation resistance of 360 but because of its brittle nature, high specific gravity and great chemical stability, it is invariably found close to the source rock. In contrast to this, corundum, a mineral in the zircospilic suite of heavy minerals, because of its greater hardness and lower specific gravity is widespread in distribution because of long distances of transport. On the other hand, topaz, in spite of its greater hardness than cassiterite, decreases rapidly in particle size away from the source rock as a result of its inherent weakness caused by the perfect basal cleavage. Thus, the two heavy mineral associations with cassiterite and zircospilic minerals indicate recycling of cassiterite postdating the Middle Eocene basalts. Similarly, gold in one of the heavy mineral associations indicates its availability from the Mathinna Beds at a particular time. Since gold is found mainly in shallow leads, the gold-bearing Mathinna Beds may not have been exposed in most areas until after the Middle Miocene basalt. Tin placer genesis in northeastern Tasmania shows a long and complicated geological history. The placers found are testament to the antiquity of the landscape, in agreement with Oilier (1979) that the Australian landscape incorporates old elements. From the
252
W.W.-S. Yim
time of exposure of the Blue Tier and Scottsdale Batholiths to subaerial processes of weathering and erosion at least since the Permo-Triassic, recycling of cassiterite occurred periodically until their preservation during the Cainozoic Era. Because of the conGEOCHRDNDLDGIC UNITS STANDARD AGES
siderable time involved, episodic recycling is suggested to have played an important part in the enrichment of heavy minerals in placers. Stable heavy minerals such as cassiterite are progressively enriched in surficial sediments by selective concentration through the
SURFACE TEMPERATURE VALUES FROM •XYGEN ISOTCIPE DATA FDR PLANKTONIC FDRAMINIFERA AT DEEP SEA DRILLING PROJECT SITES 277, 279 AND 281 (a)
RELATIVE CHANGES IN SEA L E V E L (b) 1 1 I I Itid-:
EVENTS
CALABRIAN PIACENZIAN Post-Middle Miocene lateritization
MESSINIAN TORTONIAN
WINNALEAHRINGARQOMA BASALTS
SERRAVAL- a z i/i < LIAN
BURDIGA-
L a t e Oligocene t o E a r l y Miocene burial stage o f d e e p leads; palynof lora including
LIAN AQUITANIAN
CHATTIAN
Cyatheacidites annul at us present
MAXIMUM TIME SPAN •F DEEP LEAD DEPOSITION
RUPELIAN Middle E o c e n e t o L a t e Oligocene erosional phase with h e a v y nineral concentration
PRIABDNIAN
BARTDNIAN
LUTETIAN
YPRESIAN
PLATEAU RELATIVE CLIMATIC STABILITY SUPPORTED BY FLORISTIC COMPLEXITY
Permian t o E a r l y Eocene recycling of cassiterite under warn to glacial conditions
THANETIAN
DANIAN
(a) A f t e r Shackleton & Kennett <1975) <b> A f t e r Vail et al. (1977)
in 11
15 °C 1 0 10 0.5 o Fig.ll Possible relationship between Cainozoic sea surface palaeotemperatures, reconstructed from oxygen isotope data for planktonic foraminifera at Deep Sea Drilling Project sites 277, 279 and 281, Cainozoic global changes in sea level and terrestrial events in northeastern Tasmania.
Tin placer genesis in northeastern Tasmania
253
Table 2. Summary of Mohs' scale of hardness, cleavage, transportation resistance and distribution characteristics of selected heavy minerals in northeastern Tasmania. The transportation resistance is obtained by comparison between the heavy minerals with compact hematite (100), after Freise (1931). Hardness
Cleavage
Monazite
5
moderate
Transportation resistance 105-300
Olivine
6 / -7
none
250
usually well-rounded, restricted to near the source rock
Zircon
IVI
imperfect
265
resistant to rounding, basaltic zircons may however be rounded by magmatic processes (J.D. Hollis, pers. comm.)
Chrysoberyl
81/2
poor
300
found rounded in spite of hardness
Ilmenite
5-6
none
325
widespread moderately resistant mineral
Mineral Name
1
2
Distribution characteristics commonly egg-shaped, fairly widespread
Cassiterite
6-7
poor
360
brittle very dense mineral, found close to the source rock
Almandine
6 /2-7 /2
5Vi-6VI
none none
375 380
widespread resistant mineral uncommon
8
perfect
390
widespread mineral, decreases rapidly in grain size away from the source uncommon
Magnetite
1
,
Topaz Rutile Pleonaste
7 /2-8
perfect none
Chrome-spinel
71/2-8
none
455 550 680
Corundum
9
none
750
6-6I/2 j
removal of light minerals by winnowing. In deep leads such as Briseis and Pioneer, at least three major periods of recycling were involved: 1) Permo-Triassic; 2) Late Cretaceous; and 3) Middle Eocene to Late Oligocene. The long time scale involved in the formation of tin placers in northeastern Tasmania, as far as the author is aware, is greater than that of any unconsolidated tin placers in the world. For example, Batchelor (1979) concluded that tin placers within the Older Sedimentary Cover of Malaysia and Indonesia were Late Pliocene to Early Pleistocene in age, and Aleva (1985) suggested that the history of the Indonesian fluvial tin placers may extend back to Miocene and Pliocene times even though the upper limit may be within the limit of radiocarbon dating. However, the study of tin placers in southeast Asia lacked the stratigraphic control available in northeastern Tasmania. Thus, the ages suggested for the
widespread resistant mineral widespread resistant mineral widespread extremely resistant mineral
formation are likely to be minimum ages. In the present study, stratigraphic control on the genesis of tin placers would not be possible without: 1) availability of geological maps with sufficient details by the Tasmania Department of Mines (1977, 1978); 2) availability of knowledge on the Bass Basin (Robinson 1974; Brown 1976; Davidson et al 1984; and others) and the Boobyalla Sub-basin (Moore et al 1984) to the north of the study area; 3) the existence of datable younger and older basalts, and the zircospilic suite of heavy minerals, for confining the deep leads and delineating other leads stratigraphically. 4) availability of abundant palynofloral evidence within the study area; 5) availability of sea surface palaeotemperatures for most of the Cainozoic Era through oxygen studies of planktonic foraminifera in cores of the Deep Sea Drilling Project (Shackleton & Kennett 1975); and
254
W.W.-S. Yim
6) occurrence of duricrusts post-dating the younger basalt. Because of the agreement of the different lines of evidence found in the present study, tin placers must be essentially a product reflecting the antiquity of the landscape. Although deep leads in northeastern Tasmania are stratigraphically confined within the Middle Eocene and Middle Miocene basalts due to changes in the drainage system over 'long' geological time, placer deposits of other ages are also possible. For example, during stages of uplift in the Late Cretaceous and Palaeocene, ancestral streams originating from the Blue Tier Massif into the Boobyalla Sub-basin (Moore et al 1984) would have caused recycling of Permo-Triassic deposits. The northwest-flowing streams on the Blue Tier Massif including the Cascade, Weld and Wyniford have maintained a similar course at least from the Middle Eocene to the present day. Post-Middle Eocene deep leads may be distinguished by zircospilic heavy minerals, but it is possible for placers along some stream courses to be reworked episodically since the Middle Eocene. Furthermore, adjacent to the present course of the Ringarooma River such as at Riverside and the Great Northern Plain (Fig. 1), reworking of palaeoplacers during the Quaternary period is evident. Such reworking is likely during glacial times through the seasonal thawing of snow fields which accumulated on high ground. Consequently, it is possible to have tin placers of a complete spectrum of ages from the pre-Middle Eocene to the present day. However, in the area of study, the bulk of the tin production to date was derived from deep lead mines. This differs from the general conclusion of Sutherland (1985) that the Quaternary was important in producing the alternation between erosional and depositional conditions suitable for placer formation. Quaternary events are only of minor importance in the formation of major placer deposits because of their relatively short time scale.
In the study of Indonesian fluvial cassiterite placers, Aleva (1985) considered that the liberation of cassiterite from bedrock requires a period of deep subaerial alteration and saprolite formation, which must occur prior to any period of cassiterite concentration and deposition. In northeastern Tasmania, because the Parmeener Super-group of probably fluvioglacial origin rests unconformably on mineralised granite, it is suggested here that fluvioglacial processes may also have played a part in the liberation of cassiterite. Conditions for deep weathering are known in the Late Cretaceous to Early Eocene and would be favourable for the preparation of further source rock for cassiterite liberation. The age of saprolite weathering in northeastern Tasmania is more precisely known than in Indonesia. CONCLUSIONS 1) A 'long' geological history spanning at least from the Permo-Triassic to the present day was involved in tin placer genesis in northeastern Tasmania. 2) This study demonstrates the importance of stratigraphic control in the study of tin placer genesis. Deep leads yielding the bulk of the tin production to date in northeastern Tasmania are stratigraphically confined within the Middle Eocene (c. 47 Ma) and Middle Miocene (c. 16 Ma) basalts. Post-Middle Miocene economic placers only make a small contribution to tin production in comparison to deep leads. However, placer deposits of pre-Middle Eocene age lacking zircospilic heavy minerals also exist, but are not wellrecognised in the present study because of poor stratigraphic control. 3) Future work on pre-Middle Eocene and post-Middle Miocene tin placers is particularly desirable to provide better stratigraphic control on these deposits. 4) Three main heavy mineral associations reflecting differences in source rock and episodic recycling are present in northeastern Tasmania. They include:
Tin placer genesis in northeastern Tasmania
i) Cassiterite-spinel-corundum-topazzircon (both types) association; ii) Cassiterite-topaz-fine euhedral zircon association; and iii) Cassiterite-gold-spinel-corundumtopaz-zircon (both types) association. 5) Studies on particle size distribution of mono-mineralic and composite cassiterite mineral grains have revealed an extensive area of bedrock mineralisation in northeastern Tasmania. Apart from mass flow deposits, transport of cassiterite to form economic placers does not normally exceed 500 m. 6) Electron spin resonance study of zircons is a promising rapid semi-quantitative method for dating zircons as well as for identifying zircons from multiple sources. 7) Because of poor stratigraphic control on tin placer deposits in Malaysia and Indonesia, the ages determined by previous workers are likely to be minimum ages. Future investigations of these placer deposits should focus on providing a better stratigraphic control. ACKNOWLEDGEMENTS This study formed part of a Ph.D project carried out at the University of Tasmania. This paper was critically reviewed by F.L. Sutherland and C.D. Oilier. I am particularly grateful to J.C. van Moort, M.R. Banks, the late R.J. Ford, A.J.W. Gleadow, D.J. Jennings and Lisa Nam for their valuable assistance. Financial support for this work was provided by Amdex Mining Limited, the Hui Oi Chow Trust and the University of Hong Kong. Part of this work was carried out while I was on study leave from the University of Hong Kong. REFERENCES ALEVA G.J.J. 1985. Indonesian fluvial cassiterite placers and their genetic environment. Journal of the Geological Society of London 142, 815-836. BAILLIE P. 1986. A radiometric age for the
255
Moriarty Basalt, north-western Tasmania. Unpublished report, Tasmania Department of Mines 1986/38. BAILLIE P., TURNER E. & QUILTY P.G. 1985. Late Pleistocene marine sediments and fossils from Mussel Roe Bay, northeastern Tasmania. Papers and Proceedings of the Royal Society of Tasmania 119, 83-87. BANKS M.R. 1973. General geology. In Banks M.R. ed. The Lake Country of Tasmania, pp.25-34. Royal Society of Tasmania, Hobart. BATCHELOR B.C. 1979. Discontinuously rising late Cainozoic eustatic sea-levels with special reference to Sundaland, southeast Asia. Geologie en Mijnbouw 58, 1-20. BATES R.L. & JACKSON J.A. eds. 1984. Dictionary of Geological Terms. American Geological Institute, Anchor Press, New York. BOWDEN A.R. 1981. Coastal Sands of Northeastern Tasmania: Geomorphology and Groundwater Hydrology. Ph.D. thesis, University of Tasmania (unpublished). BRAITHWAITE J.B. 1964. Ore reserves in the Cascade deep lead. Technical Report Tasmania Department of Mines 9, 132-142. BROWN A.V. 1977. Preliminary report on age determination of basalt samples from Ringarooma 1:50,000 sheet. Unpublished report, Tasmania Department of Mines 1977/25. BROWN B.R. 1976. Bass Basin - some aspects of the petroleum geology. Monograph Series of the Australian Institution of Mining and Metallurgy 7, 67-82. DAVIDSON J.K., BLACKBURN G.J. & MORRISON K. 1984. Bass and Gippsland Basins: a comparison. Australian Petroleum Exploration Association Journal 24, 101-109. EDWARDS A.B. 1939. The age and physiographic relationships of some Cainozoic basalts in central and eastern Tasmania. Papers and Proceedings of the Royal Society of Tasmania (1938), 175-200. EMERY K.O. & NOAKES L.C. 1968. Economic placer deposits of the continental shelf. Technical Bulletin of the Committee for Co-ordination of Joint Prospecting for Mineral Resources in Asian Offshore Areas 1, 95-111. FORSYTH S.M. 1982. Preliminary palynological investigation of Boobyalla DDH 1, 1977-1979, northeast Tasmania groundwater investigation. Bulletin of the Geological Survey of Tasmania 61, 192-198.
256
W.W.-S.
Yim
FREISE F.W. 1931. Untersuchung von Mineralen auf Abnutzbarkeit bei Verfrachtung im Wasser. Mineralogische und Petrographische Mitteilungen 41, 1-7. GROVES D.I., COCKER J.D. & JENNINGS D.J. 1977. The Blue Tier Batholith. Bulletin of the Geological Survey of Tasmania 55. HARRIS W.K. 1965a. Palynological examination of samples from the tin leads of northeast Tasmania for Utah Development Company. Unpublished Report, South Australia Department of Mines 60/15. HARRIS W.K. 1965b. Palynological examination of samples from northeast Tasmania, Cape Barren and Flinders Island. Unpublished Report, South Australia Department of Mines 60/115. HARRIS W.K. 1968. Tasmanian Tertiary and Quaternary microflora summary report. Unpublished Report, South Australia Department of Mines 67/43. HILL R.S. 1983. Nothofagus macrofossils in the Tertiary of Tasmania. Alcheringa 7, 169-183. HILL R.S. & MacPHAIL M.K. 1983. Reconstruction of the Oligocene vegetation at Pioneer, northeast Tasmania. Alcheringa 7, 281-299. HOLLIS J.D. 1984. Volcanism and upper mantlelower mantle relationships: evidence from inclusions from alkali basaltic rocks. Publication of the Geological Society of Australia, New South Wales Division 1, 33-47. JENNINGS D.J. 1975. Alluvial tin deposits of Tasmania. In Knight C.L. ed. Economic Geology of Australia and Papua New Guinea: L Metals, pp. 1053-1054. Monograph Series 5, The Australasian Institute of Mining and Metallurgy. KEMP E.M. 1978. Tertiary climatic evolution and vegetation history in the southeast Indian Ocean region. Palaeogeography, Palaeoclimatology, Palaeoecology 24, 169-208. LANGFORD-SMITH T. 1978. Silcrete in Australia. Department of Geography, University of New England. McCLENAHAN M.P., TURNER N.J., BAILLIE P.W., BROWN A.V., WILLIAMS P.R. & MOORE W.R. 1982. Geology of the RingaroomaBoobyalla area. Bulletin of the Geological Survey of Tasmania 61. McDOUGALL I. & LEGGO P.J. 1965. Isotope age determinations on granitic rocks from Tasmania. Journal of the Geological Society of Australia 12, 295-332.
MILNER H.B. 1962. Sedimentary Petrography Volume 1: Methods in Sedimentary Petrography. 4th edition, George Allen and Unwin, London. MOORE W.R., BAILLIE P.W., FORSYTH S.M., HUDSPETH J.W., RICHARDSON R.G. & TURNER N.J. 1984. Boobyalla Sub-basin: a Cretaceous onshore extension of the southern edge of the Bass Basin. Australian Petroleum Exploration Association Journal 24, 110-117. MORRISON K.C. 1980. Sedimentology of the Pioneer Placer Deposit. Bachelor of Science Honours thesis, Department of Geology, University of Tasmania. NYE P.B. 1925. The sub-basaltic tin deposits of the Ringarooma valley. Bulletin of the Geological Survey of Tasmania 35. NYE P.B. & BLAKE J. 1938. The geology and mineral deposits of Tasmania. Bulletin of the Geological Survey of Tasmania 44. OLLIER C.D. 1978. Silcrete and weathering. In Langford-Smith T. ed. Silcrete in Australia pp. 13-17. Department of Geography, University of New England. OLLIER C.D. 1979. Evolutionary geomorphology of Australia and Papua-New Guinea. Transactions of the Institute of British Geographers New Series 4, 516-539. ROBINSON V.A. 1974. Geological history of the Bass Basin. Australian Petroleum Exploration Association Journal 14, 45-49. SHACKLETON N.J. & KENNETT J.P. 1975. Palaeotemperature history of the Cenozoic and the initiation of Antarctic glaciation: oxygen and carbon isotope analyses in DSDP sites 277,279 and 281. In Kennett J.P. et al eds. Initial Reports of the Deep Sea Drilling Project 29, pp.743-755. United States Government Printing Office, Washington. SPRY A. 1962. Igneous activity. Journal of the Geological Society of Australia 9, 255-284. SUTHERLAND D.G. 1985. Geomorphological controls on the distribution of placer deposits. Journal of the Geological Society of London 142, 727-737. SUTHERLAND F.L. & WELLMAN P. 1986. Potassium-argon ages of Tertiary volcanic rocks, Tasmania. Papers and Proceedings of the Royal Society of Tasmania 120, 77-86. TAGUCHI S., HARAYAMA M. & HAYASHI M. 1985. ESR signal of zircon and geologic age. In Ikeya M. & Miki T. eds. ESR Dating and Dosimetry, pp. 191-196. Ionics, Tokyo.
Tin placer genesis in northeastern Tasmania TASMANIA DEPARTMENT OF MINES 1975. Geological Atlas 1: 250,000 Series Launceston. TASMANIA DEPARTMENT OF MINES 1977. Geological Atlas I: 50,000 Series Ringarooma. TASMANIA DEPARTMENT OF MINES 1978. Geological Atlas 1: 50,000 Series Booby alia. VAIL P.R., MITCHUM Jr. R.M. & THOMPSON III S. 1977. Seismic stratigraphy and global changes of sea level, Part 4: global cycles of relative changes of sea level. In Payton C.E. ed. Seismic Stratigraphy - Applications to Hydrocarbon Exploration, pp.83-97. American Association of Petroleum Geologists Memoir 26. WELLMAN P. 1974. Potassium-argon ages on the Cainozoic volcanic rocks of eastern Victoria, Australia. Journal of the Geological Society of Australia 21, 359-376. WELLMAN P. & McDOUGALL I. 1974a. Cainozoic igneous activity in eastern Australia. Tectonophysics 23, 49-65. WELLMAN P. & McDOUGALL I. 1974b. Potassium-argon ages on the Cainozoic volcanic rocks of New South Wales. Journal of the Geological
257
Society of Australia 21, 247-272. YIM W.W.-S. 1980. Heavy mineral studies of stanniferous deep leads, northeast Tasmania. Bureau of Mineral Resources, Geology and Geophysics Australia Record 1980/67, 81. YIM. W.W.-S. 1986. Application of the Zeiss TGA 10 particle-size analyzer in the exploration of stanniferous placers. Bulletin of the Geological Society of Malaysia 20, 619-625. YIM W.W.-S., GLEADOW A.J.W. & van MOORT J.C. 1985. Fission track dating of alluvial zircons and heavy mineral provenance in northeast Tasmania. Journal of the Geological Society of London 142, 351-356. ZELLER E.J. 1968. Use of electron spin resonance for measurement of natural radiation damage. In MacDougall D.J. ed. Thermoluminescence of Geological Materials, pp.271-279. Academic Press, London. ZELLER E.J., LEVY P.W. & MATTERN P.L. 1967. Geologic dating by electron spin resonance. Proceedings of the Symposium on Radioactive Dating and Low Level Counting, pp.531-540. International Atomic Energy Authority, Vienna.
APPENDIX ELECTRON SPIN RESONANCE STUDY OF ZIRCONS Previous investigations by Zeller et al (1967) and Zeller (1968) concluded that zircon should be of little use for age determination by ESR. However, a recent study by Taguchi et al (1985) suggested that the age of pre-Pleistocene zircons may be determined. There are two objectives in carrying out an ESR study on zircons: firstly, to obtain further information on the provenance of zircons, and secondly, to use it as a semi-quantitative method of dating. Since the ESR signal measured from zircon is caused by radioactive damage as a result of substantial amounts of radioactive impurities in the crystal structures, the amount of damage is approximately proportional to age. Therefore old zircons are expected to show stronger signal responses compared to young zircons. Consequently, ESR is a possible means for dating zircons as well as provenance determination. Because the coarse anhedral zircons were released from the older basalt, the ESR age of these zircons and the basalt should be identical. For this work, the zircon concentrates previously fission track dated by Yim et al (1985) together with a number of coarse anhedral zircons from other localities were selected. About 0.5 g of the pure zircon concentrate was handground in an agate pestle and mortar. 0.09 g of the ground sample was placed into a precision quartz tube for measurement using a Joel model JES-FE3X ESR spectrometer with 100 KHz field modulation at room temperature. ESR signals were recorded on graph paper to permit comparison of peak heights between samples which had been dated by the fission track method.
Episodic fluviatile, lacustrine and aeolian sedimentation in a late Quaternary desert margin system, central western New South Wales M.A.J. WILLIAMS , P. De DECKKER , D.A. ADAMSON AND M.R. TALBOT 1
2
3
4
department of Geography and Environmental Science, Monash University, Clayton, Victoria 3168, Australia. Department of Geology, The Faculties, Australian National University, GPO Box 4, Canberra, ACT 2601, Australia. School of Biological Sciences, Macquarie University, North Ryde, NSW 2109, Australia. Geologisk Institutt Avd. A., Universitetet i Bergen, Allegt 41, 5014 Bergen, Norway. 2
3
4
Throughout the late Quaternary, the central west of New South Wales functioned as a low gradient desert margin system characterised by episodic aeolian, alluvial and lacustrine sedimentation. Aeolian accessions of calcareous dust are reflected in successive episodes of calcium carbonate precipitation within quartz-rich dune, palaeochannel, lake-margin and alluvial fan deposits. The most recent phases of soil formation and calcium carbonate segregation have been radiocarbon dated to 13-16 ka and 21- 33 ka, although this latter phase may comprise at least three distinct sub-phases. Soil formation was followed by erosion and truncation, and was preceded by the accumulation of widespread fluvio-aeolian quartz-rich mantles. During the last glacial maximum (16-18 ka) gypseous lunettes formed locally as a result of deflation from the margins of small closed lake basins which probably operated as regional groundwater windows. The second half of the Holocene saw the widespread formation and reworking of source-bordering linear dunes downwind of seasonal stream channels, and partial burial of the Pleistocene sand plains and dunes by their Holocene successors. Gully incision during the last hundred years may reflect the impact of European settlement and associated changes in fire regime, but could equally be related to changes in drought frequency and the seasonal incidence of rainfall. Key words: Aeolian dust, alluvial, calcareous palaeosol, central west of NSW, desert margin system, gypseous lunettes, Quaternary climates, source-bordering dunes. INTRODUCTION
This paper builds on the pioneering work of R.J. Wasson (1969, 1975, 1976) and deals with the depositional legacy of formerly more active river, lake and dune systems in what is now the semi-arid central west of New South Wales. The time range is from late Pleistocene to present, and spans roughly the last forty thousand years of late Quaternary time. As such, it encompasses both the cold, dry, last glacial maximum of 18 ± 3 ka, and the warm, wet 'climatic optimum" of 7 ± 2 ka (Williams 1984; De Deckker et al 1988). Our results stem from a long-term programme of detailed stratigraphic mapping, seismic surveys, levelling, sediment analysis, radiometric dating, and palaeomagnetic sampling, the essence of which we summarise here. 4
258
Before launching into the stratigraphy it is useful to consider why the Quaternary is significant. It is, after all, a mere 1.6 Ma, or a minute fraction of the geological record. Earlier papers in this volume have already shown the relevance of Cainozoic studies to an appreciation of how and why the Australian environment evolved into what it is today. What is easily forgotten is that the magnitude and frequency of Quaternary climatic fluctuations were without precedent relative to the 65 Ma of the Tertiary. Within a time interval of only ten thousand or so years, mean annual near-surface temperatures changed by as much as 5-10 °C. These were extraordinarily rapid temperature changes, and were associated with correspondingly rapid changes in ice sheet melting, sea level
A late Quaternary desert margin system, New South Wales
259
rise and global atmospheric carbon dioxide concentration (Barnola et al 1987; Genthon et al 1987), as well as with more local changes in the amount and incidence of seasonal precipitation and the strength and direction of prevailing winds, all of which led to changes in plant cover, river regime, lake level, and dune activity. Within Australia, prehistoric human occupation coincided with the environmental vicissitudes of the late Quaternary (quite the reverse of "an unchanging people in an unchanging land"), just as European settlement coincided with the waning phases of the Little Ice Age and the onset of a warmer climate.
sandplains and salt lakes of the arid interior. Similar reasons also provided the rationale for a considerable body of earlier work on the palaeochannels situated south of the present River Murray. To quote Bowler once more: "Lying between the margin of the semi-arid zone to the west and the more humid highlands to the southeast, the Riverine Plain provides a link connecting the two both in terms of spatial relationships and geomorphic histories" (Bowler 1978 p. 70). We elaborate on some of the implications of this geographical location in the section which follows.
Choice of study area
A DESERT MARGIN ENVIRONMENT
Many of Australia's characteristic landforms are inherited from the Cainozoic. In fact, roughly two-fifths of the land area of the continent are mantled by Cainozoic formations, some of which are volcanic, but most of which are sedimentary. These alluvial, lacustrine and aeolian deposits also contain a generous slice of Southern Hemisphere Cainozoic climatic history - a record which is both more complete and vastly more informative than the patchy legacy of past denudational events preserved in isolated erosion surfaces and stratigraphic unconformities. Nor are studies of modern geomorphic processes of much help in understanding this landscape. As Bowler noted in discussing the depositional chronology of the Riverine Plain in southeastern Australia: "In an environment where longevity is the rule rather than the exception, modern process studies are of limited relevance in understanding landforms formed under past environments unless that influence can be defined" (Bowler 1978 p. 72).
Deserts and their semi-arid margins are invaluable repositories of palaeoclimatic data. One reason for this is the very aridity to which they owe their origin - an aridity which is also conducive to preserving the depositional legacy and fossil evidence of climates which were previously both wetter and drier than that of today. As the deserts alternately expanded and contracted in response to the climatic changes associated with the waxing and waning of the great continental ice-caps of the Quaternary, an interdigitating sequence of aeolian and fluvio-lacustrine sediments progressively accumulated in the transitional zone between arid interior and humid periphery.
Our choice of semi-arid west central New South Wales as an appropriate study area with which to illustrate the twin themes of landform inheritance and climatically-induced changes in depositional style and tempo is not accidental. This region lies mid-way between the well-watered Eastern Highlands with their sporadic relicts of former glacial and periglacial climates, and the desert dunefields,
In the case of southeastern Australia, the climatic contrast was accentuated by the difference in elevation between the arid inland plains and the more maritime Eastern Highlands. As a result of these geographical differences, the uplands are cooler and more perennially humid, with a climate lacking the seasonal temperature extremes of the dry continental interior. Palaeoclimatic reconstruction: local and regional factors The rivers which flow down from the Eastern Highlands and contribute to the Murray-Darling drainage system between them drain much of the southeastern corner
260
M.A.J. Williams, P. De Deckker, D.A. Adamson & M.R. Talbot
of mainland Australia. Their alluvial history is recorded in the depositional plains of the lower Darling, Lachlan, Murrumbidgee, Murray and other great rivers of the southeast. In their distal reaches there are chains of now dry or ephemeral lakes, such as the Willandra Lakes system downstream of Willandra Creek, a distributary channel of the lower Lachlan (Fig. 1). The Willandra Lakes have provided one of the best documented late Quaternary lake histories in Australia. The chronology is based on over a hundred radiocarbon dates of shell, charcoal and hearth samples. And yet, despite
the considerable effort devoted to refining our knowledge of lake level fluctuations in this area, we still have very little direct knowledge of the local climatic fluctuations in this particular desert margin environment. There are four main reasons for this somewhat paradoxical state of affairs. The first reason relates to the fact that certain types of lake are inherently sensitive to local climatic oscillations whereas other types of lake are the reverse. During the twenty thousand or more years when the Willandra Lakes overflowed south into the Murray between c.45 ka and c.25 ka ago, they
Figure 1 Map of west central New South Wales showing the location of Belarabon Range, Sandy Creek and Nulchara Lake in the now semi-arid region between Cobar, Ivanhoe and Wilcannia. The shaded areas are isolated ranges or hills over 200 m in elevation.
A late Quaternary desert margin system, New South Wales operated very much as "reservoir" lakes (Street 1980). Such lakes are akin to beads on a necklace and represent locally enlarged portions of a continuous river channel system. ''Reservoir" lakes are inherently insensitive to local hydrological and climatic conditions, but fluctuate in response to allochthonous inputs of water from much further upstream. Once the amount of water entering these 'reservoir" lakes becomes curtailed so that they cease to overflow, they may change into "amplifier" lakes which are considerably more sensitive to regional changes in runoff, precipitation and evaporation than during their previous "reservoir" stage. The Willandra Lakes seem to have ceased being "reservoir" lakes about 25 ka ago. If Bowler's model of clay lunette genesis is reasonably correct (Bowler 1973, 1976), then the laminated, grey-green, saline clays of the Zanci Formation along the eastern margin of Pleistocene Lake Mungo are indicative of a seasonally-fluctuating lake towards 18-17 ka ago. 4
However, there is a second reason why these lakes were not particularly reliable as late Pleistocene rain-gauges even when they had become "amplifier" lakes. They were, of course, still responding to runoff events in the Eastern Highlands which had originated in the Lachlan headwaters nearly a thousand kilometres further upstream. Variations in the efficiency of water transmission downstream, related to antecedent runoff events, losses from seepage, and local perched water-table effects, can all lead to sizeable variations in downstream flow (Baxter 1989). Such variations may have little to do with local climate. A third problem concerns the unresolved role of local groundwater fluctuations which may respond with lags of several thousand years to regional recharge events. If the lakes were operating at any stage as groundwater windows, it is likely that they would not have been particularly responsive to local runoff conditions in this part of western New South Wales.
261
A fourth and final impediment limiting the local palaeoclimatic value of lakes fed mainly from allochthonous inputs of runoff is the ever-present possibility of physical diversion of water from the parent feeder stream. For instance, there is circumstantial evidence from morphometric analysis of stream traces on airphotos that the Lachlan may have captured and diverted a significant proportion of the former discharge of Willandra Creek at some time in the late Pleistocene after about 30 ka but certainly prior to the Holocene (Williams et al 1986; Adamson et al 1987). Diversion by river piracy or by avulsion may or may not be linked to regional changes in climate, but will certainly affect the transmission efficiency of both pirate and pirated stream channels. Any combination of the four factors just discussed can lead to fluctuations in lake level which have little or nothing to do with climatic and other environmental fluctuations in the desert margin landscape in which the lakes are located. If we wish to reconstruct a more accurate picture of regional environmental changes in semi-arid Australia during the late Quaternary, it is crucial that we also select study areas capable of providing worthwhile information about local depositional and hydrological events, rather than ones which very largely resonate with distant echoes of hydrological events much further afield. Nature of the study area The region drained by Sandy Creek (a local synonym for Crowl Creek) and roughly equidistant from Wilcannia, Cobar and Ivanhoe seems to fulfil this requirement (Fig. 1). It lies between Willandra Creek to the south and the Darling River to the north and west, at 32°S and 145 °E (Figs. 2 and 3). Apart from a few prominent rocky hills and strike ridges of Middle to Upper Devonian conglomerate, quartzose sandstone and orthoquartzite (Brunker 1969; Wasson 1975, 1976), which rise above 200 metres, much of the area is a gently undulating lowland plain covered
262
M.A.J. Williams, P. De Deckker, £>.,4. Adamson & M.R. Talbot
Quartzite Alluvial Wooded
or sandstone
+ aeolian sands + low
dunes
dunefields
Incised ephemeral Aggraded
strike-ridge
stream
channel
palaeochannel
Playa lake + aeolian
day/sand
lunette
Figure 2 Location of gully sections 1 to 4 on the slopes of Belarabon Range and of stratigraphic sections A to D in the vicinity of Bunda Playa Lake.
A late Quaternary desert margin system, New South Wales
263
4 to Sandy 5 Creek
BELARABON/
fc
R Fan Dunes
B© GRAVEL IN MOTTLED SANDY CLAY
V- /. Dunes '/
.
.
BUNDA LAKE
C O M P O S I T E S T R A T I G R A P H I C SECTION, BUNDA LAKE
RED SAND LATE HOLOCENE DUNES
COMPACTED RED G CALCAREOUS STONY SANDY CLAY CARBONATE//LAKE CLAY
CARBONATE OLDER DUNESOLDER LAKE CLAYS
Figure 3 Generalised stratigraphic section from the eastern piedmont of Belarabon Range (la) across Bunda Playa Lake to the dunefields east of the lake (lb). The inset map (top right) locates the section which is c. 4 km long with a much exaggerated vertical scale. The dashed lines represent drainage channels and gullies. The fan apex lies 32.7 m above the western shoreline of the lake. The block diagram (top left) gives a simplified three-dimensional perspective of the eastern piedmont geomorphology and stratigraphy as seen from the north.
in vegetated sand dunes (Fig. 2). The dunes are aligned roughly E-W, and westerly winds are still the dominant sand-moving winds during times of prolonged drought. Sandy Creek is a very ephemeral channel today, and has flowed for a few days or weeks on about six occasions since 1969. There are no perennial rivers in the entire 80,000 km2 bounded by a line running south of Bourke to the Lachlan in the east and extending west to the Darling (Fig. 1). Precipitation is evenly distributed throughout the year, but over the last hundred years there have been signs of an increased incidence of summer rainfall, at least in the far west of the region. Rainfall decreases from 500 mm a year in the east of Figure 1 to less than 300 mm along the Darling, but there is considerable interannual variability. In April 1983, Sandy
Creek flowed strongly for several weeks as a result of unprecedented heavy rains throughout the area. For the first time in the memory of local graziers it flowed across the main highway linking Cobar to Wilcannia, and for a few days became a tributary of the Talyawalka Anabranch of the Darling (R. Houghton, pers. comm., May 1983). During the extreme floods on the Talyawalka Anabranch of the lower Darling, which lasted from 26 June 1983 until 28 January 1984 (Water Resources Commission of NSW, pers. comm.), Sandy Creek contained water but apparently did not again succeed in reaching this far. The 1983 flooding by Sandy Creek came at the end of the 1982-83 drought and El Nino year. This drought severely affected the eastern half of Australia, and was the worst
264
M.A.J. Williams, P. De Deckker, D.A. Adamson & M.R. Talbot
recorded in the last two hundred years. Both the Darling and the Lachlan are strongly influenced by the Southern Oscillation (Whetton 6 Baxter 1989). In El Nino years, when the Southern Oscillation Index (which is a measure of the atmospheric pressure difference between Darwin and Tahiti), is strongly negative, droughts are prevalent across eastern and northern Australia, as in 1982-83. During El Nina years, when the SOI is strongly positive, the reverse is true and exceptional floods are the norm (Whetton et al 1990). With no extensive wetlands or base-flow to buffer these effects, the lakes and ephemeral streams of the semi-arid central west of New South Wales will tend to amplify the climatic signals of the Southern Oscillation, resulting in a highly variable interannual climatic regime of episodic floods and droughts. The temperature regime is more predictable and does not vary much from year to year. Winters are cold and frosty, with up to 50 days liable to frost between May and July. Summers are hot, with January temperatures of 40° to 45° common in mid-afternoon. Apart from episodic gully erosion, sheetflow, slopewash, and local deflation of sand and dust during dry years or after bushfires, morphogenesis has not been particularly active over the past twenty years. Neither erosional nor depositional processes operating at their present cadence seem capable of producing the suite of aeolian, alluvial and lacustrine features illustrated in Figs. 2 to 6. We will now describe these features and their ages, origins and stratigraphy, focussing upon three local examples. These are the dunefield-lunette-alluvial fan complex at Bunda Playa Lake (Figs. 2, 3 and 4), the alluvial fans and piedmont dunes of the Belarabon Range (Figs. 2, 3 and 5), and the gypseous lunette complex at Lake Nulchara (Figs. 1 and 6). In the final section of this paper we consider the question of historic gully erosion along the Belarabon Range and whether it might be related to human, climatic or other causes (Figs. 2 and 7 to 12).
GEOMORPHOLOGY AND LATE QUATERNARY STRATIGRAPHY The dunefield-lunette-alluvial fan complex at Bunda Playa Lake Bunda Playa Lake is a clay-floored playa which occasionally floods to depths of 20-40 cm but is usually dry and covered in tall canegrass. We have augered by hand to depths of 14 m in the lake floor, and apart from the sporadic presence of fine to medium (1-10 mm) authigenic gypsum crystals at depth, the brown clay is of uniform colour and texture throughout the profile. Shallow seismic surveys by Dr. S.J. Riley (work in preparation) suggest a considerable depth of clay beneath the playa surface, possibly well in excess of 50 metres. We have augered extensively all around the lake and have dug over thirty trial trenches to depths of 1-2 metres to add to the stratigraphic information gleaned from well over a hundred boreholes. Three geomorphic features are illustrated on Figure 3 and between them they epitomise the landforms and the pattern of late Quaternary sedimentation characteristic of this area. The present playa lake is surrounded by wooded dunes. A low arcuate dune (or lunette) up to 3 metres high forms the eastern boundary to the playa. The stratigraphy of the lunette and of the dunes immediately adjacent to the playa is similar and is comparatively simple (Figs. 3 and 4). A loose red to redbrown quartz sand unit overlies a compact and sometimes indurated clayey sand of paler red-brown hue (the "hardpan" of Fig. 4) which in turn mantles a brown clay. The clay is lacustrine and can be traced at depth for up to 800 metres west and east of the present margins of the playa. From this we infer that Pleistocene Lake Bunda was considerably larger than the modern playa lake prior to deposition of the "hardpan" unit and of the overlying red sands. The lunette grades eastwards into a wooded and gently undulating plain consisting of low sand dunes of late Holocene age which rest unconformably upon the eroded stumps of
A late Quaternary desert margin system, New SouthWales 265 BUNDA LAKE: STRATIGRAPHY RED SAND WSW
WESTERN SHORE
SSW
EASTERN SHORE NNE
SSW
Lake edge SOUTHERN SHORE
Figure 4 Stratigraphic sections west, east and southwest of Bunda Lake. For location of A, B, C and D see Figures 2 and 3. Vertical exaggeration x 10 for A and B; x 5 for C and D.
266
M.A.J. Williams, P. De Deckker, D.A. Adamson & M.R. Talbot
carbonate-cemented late Pleistocene dunes and the subdued remnants of clay-rich dunes and swales of late Pleistocene age or older. West of Bunda Playa Lake an apron of coalescent alluvial fans extends from the eastern footslopes of the Belarabon Range (Fig. 3). Gullies entrenched into these fans and apron provide continuous, well-exposed stratigraphic sections along their near vertical walls. Three main stratigraphic units may be traced from the toe of the fan apron upstream to the fan apex. The youngest unit is a loose reddish-brown sand up to 1.5 m thick which is virtually devoid of sedimentary structures except for occasional lenses of gravel from the adjacent sandstone ridges. Beneath this unit is a compact and massive red-brown clayey sand, locally with rare to abundant pedogenic calcium carbonate concretions and carbonate coatings along vertical cracks. Underlying this unit is a mottled and occasionally calcareous grey and brown sandy clay with abundant sandstone clasts. The clasts decrease in size and abundance downslope. This unit appears to grade laterally into the brown lacustrine clays of Pleistocene Lake Bunda (Fig. 3). A dense layer of massive calcrete was evident in auger holes located in the floor of the channel roughly 700 m from the western margin of the playa. We were unable to drill manually through this unit, which may represent the now buried zone of groundwater seepage from the toe of the fan into the formerly more extensive playa lake. Near the apex of the fan there are fragmentary remains of a gleyed and locally calcareous gravelly sandy clay which may be the proximal stratigraphic equivalent of the distal buried calcrete and Pleistocene lake clay. This discontinuous grey stony sandy clay is invariably underlain by the Devonian sandstone bedrock. The presence of calcium carbonate within some of the late Quaternary units shown on Figure 3 is of interest and presupposes periodic accessions of calcareous wind-blown dust during accumulation of the Quaternary formations. A local bedrock source can
almost certainly be ruled out. All of the sandstone hills in this area belong to the basal unit of the Mulga Downs Group (Brunker 1969). This 300 m thick unit (the Meadows Tank Conglomerate) consists of cross-bedded quartzose sandstones, orthoquartzites and quartz pebble conglomerates. The quartz grains are tightly interlocking and break with an angular fracture. No likely clay or carbonate source was ever found locally within these quartzose sandstones and conglomerates, despite prolonged and extensive searches. The nearest possible candidate was at Mount Doris, an isolated conglomerate plateau situated 80 km east of Bunda Playa Lake. In a small valley cut into the western margin of this plateau the Devonian conglomerates unconformably overlie shallow marine siltstones and shaly sandstones, in which one of us discovered some fossil brachiopods (M.A.J. Williams, 4 September 1980). There are calcite skins along the sandstone and siltstone bedding planes, but the presence of these post-depositional calcite skins does not in itself preclude precipitation from a calcareous dust blown from further west. We return to the question of aeolian dust in the next section, when we discuss chronology and depositional environments.
The alluvial fans and piedmont dunes of the Belarabon Range Several deeply entrenched gullies provide good exposures through the alluvial fans and source-bordering dunes which are a feature of the western slopes of the Belarabon Range (Fig. 2). Wasson (1969, 1976) was the first to describe and date these features and we concur with his stratigraphic interpretations. We have independently described, sampled and dated a number of sections in the gullies first examined by Wasson (Fig. 5) and we have retained his field locality names for the gullies and their small valleys labelled by us 2, 3 and 4 on Figures 2 and 5. Three sections (one from each valley) are shown in Figure 5; each is broadly representative of the upper and middle fan reaches.
A late Quaternary desert margin system, New South Wales Metres
267
c s
Metres On
C Si FS CS G
iI9
1,840 ± 50 B.P. Loamy, fine-medium red sands
Palaeosol
• o • •%o
•v: 2 -
Low angle planar cross-bedding dipping downstream
•i
' 5,470 ± 140 B.P.
14,500 ± 110 B.P. Large rhizocretions
3-
Crude horizontal bedding
! 2 L ? )
• s
°
? Top of calcic unit ?
§ 12A: Belarabon Gully ©
Cobbles Sandy clay
Red clayey sand + green mottles
§7: Dillon Valley
o ° o §5B: Bronzewing Valley ©
Figure 5 Representative stratigraphic sections from the gullied western piedmont of Belarabon Range. For location of alluvial fan channels 2, 3 and 4 see Figure 2. The block diagram gives a simplified threedimensional perspective of the western piedmont geomorphology and stratigraphy as seen from the north, and should be compared with its counterpart in Figure 3.
The youngest major unit beneath sporadic recent slopewash sands is a loose red quartz sand. These sands are well-sorted fine to medium sands identical to those which comprise the E-W aligned source-bordering dunes derived from the point-bars and channel-bed of Sandy Creek. These dunes were blown eastwards and up the piedmont slope (Fig. 5, block diagram), eventually overtopping the range to become spread extensively across the eastern piedmont slopes as a reworked colluvial-alluvial mantle (Fig. 3). Scattered throughout this unit are fragments of late Holocene charcoal and thin bands and lenses
of sandstone pebbles. This unit is stratigraphically equivalent to the youngest unit depicted in Figures 3 and 4 for the Playa Lake area, which also contains charcoal fragments of similar age, as well as prehistoric hearths located in situ by caesiummagnetometer surveys and archaeological excavation (Stanley & Green 1976; Stanley 1982; Bonhomme 1983). A second sand unit underlies the first. It contains slightly more gravel than the uppermost sand unit, as well as occasional signs of weakly developed soil structures. Most of the
268
M.A.J. Williams, P. De Deckker, £>.,4. Adamson & M.R. Talbot
original sedimentary structures have been destroyed by bioturbation, especially ant activity, which is rampant everywhere and particularly noticeable just after rain. However, occasional structures are preserved which indicate considerable reworking of the original piedmont dunes, as for instance in the downstream-dipping, low angle planar cross-beds in section 12 A of Belarabon Gully (Fig. 5). Two older units crop out in gully banks. The youngest is a slightly mottled sandy clay which may grade upwards to clayey sand. It contains abundant small to large carbonate rhizocretions in the upper metre or so. This unit is often truncated at the top, and rests abruptly and unconformably on the unit below. It seems to be stratigraphically equivalent to the mottled sandy clay which forms part of the colluvial-alluvial mantle of the eastern piedmont of the Belarabon Range west of the playa (Fig. 3). The oldest unit observed at the head of the gullies cut into these alluvial fans is clearly exposed in section 5 B of Bronzewing Valley (Fig. 5). It is a gravelly red-brown clayey sand with green mottles indicative of former waterlogging and gleying. This unit has large (10-50 cm) sub-rounded to sub-angular sandstone clasts at the base, and abundant large carbonate rhizocretions in the upper 50 cm. As noted above, the top of this unit is almost invariably eroded and truncated, and it is likely that up to a metre or more of sediment (or topsoil) had been removed before the overlying layer was deposited. Stratigraphically, this unit seems to be the counterpart of the gleyed stony clay exposed in the upper reaches of fans west of Bunda Playa Lake (Fig. 3). The gypseous lunette complex at Lake Nulchara Lake Nulchara lies c. 30 km north of Belarabon Range (Fig. 1). An ephemeral stream flows into the northwest margin of the lake, which is a kidney-shaped, clay-floored playa lake of comparable size to Bunda Playa Lake. Like the latter, it is bounded on all sides
by dunes, and has a well-defined lunette along its eastern margin. However, in contrast to the Bunda lunette, the Nulchara lunette is much higher (up to 15 m high) and is almost entirely composed of wind-blown gypseous sand. The gypsum discs are 1-3 mm long, and in their upper 30-40 cm have been dissolved and reprecipitated to form a hard white surface crust known locally as kopi or copi, from the regional Aboriginal term for this white microcrystalline gypsum. Aeolian crossbedding is still evident in the upper two metres of the lunette beneath the gypcrete capping, but frequent rabbit burrows have destroyed some of the original stratification. Interstratified with the gypseous sand are concentrations of charophyte oogonia. (These were first recognised by Michaela Abraham when a student at Macquarie University in 1978). Very fine quartz sand and silt, usually red-brown but sometimes pale yellow, is intimately mixed with the gypsum discs, indicating synchronous deposition of locallyderived coarse gypsum sand and allochthonous fine desert sand. The evolution of this remarkable lunette is discussed in the next section and is summarised in Figure 6.
CHRONOLOGY AND DEPOSITIONAL ENVIRONMENT The dunefield-lunette-alluvial fan complex at Bunda Playa Lake and Belarabon Range There are three quite different types of material in the vicinity of Bunda Playa Lake which are capable of being dated by the radiocarbon method. These are prehistoric hearths, charcoal fragments, and pedogenic calcium carbonate concretions. The geomorphic contexts and inherent dating problems associated with each of the three materials are quite different, so that we will discuss each one separately. Primary data are given in Tables 1 to 4. A detailed account of possible dating errors, micro- stratigraphy and grainsize analysis will be given elsewhere. Our aim here is to present an overview of major depositional events.
A late Quaternary desert margin system, New South Wales
269
quartz lunette consisting of quartz sand & freshwater organisms accumulating along lake shore
© <16.
WA pools with charophytes, gastropods & ostracods carbonate nodules
M m
©
c
B
WIND
desert sand + interstitial CaS0 4
f/w pool where charophytes grow
©
f/w interstitial sediment gypsum from as lens groundwater
^
w/s
yzrzz EPHEMERAL RIVER marninfll
gullying + pedogenesis
erosion during high water levels swamp facies mixed with no gypsum slope mat
capping gyp-rock
©
w Water (lake)
level
¥
w/s Water — sediment i
Turbidite
— fan
interface
Lamination Desiccation ~
Ostracods
charophyte charophyte
(living)
Fish o
features
Living Fertile
deposit 777^ •
Gypsum
discs
(interstitial)
Cross-bedding Carbonate
nodules 0 Charophyte oogonia \ Carbonate tubes Figure 6 Successive stages in the late Quaternary history of Nulchara Lake. Approximate ages for each stage are c. 40 to c. 25 ka for stage 1; c. 25 to c. 20 ka for stage 2; c. 20 to c. 12 ka for stage 3; and c. 12 ka to present for stage 4.
270
M.A.J. Williams, P. De Deckker, D.A. Adamson & M.R. Talbot
Table 1 Radiocarbon age determinations from prehistoric hearths adjacent to Bunda Playa Lake Age (Years BP)
Lab. No.
Material
Event Dated
Reference
390 ± 80
ANU - 2200
(A)
Recent loose aeolian sand
(1)
760 ± 70
SUA -1672
(B)
Aeolian sand deposition
(2)
940 ± 80
SUA - 1625
(A)
Aeolian sand deposition
(2)
1020 ± 70
SUA - 1626
(C)
Aeolian sand deposition
(2)
1800 ± 140
SUA - 1628
(A)
Aeolian sand deposition
(2)
3830 ± 110
SUA - 1948
(A)
Aeolian sand deposition
(2)
Material: (A) Charcoal Hearth. (B) Sandstone mound hearth. (C) Termite nest hearth. Reference: (1) R.J. Wasson (unpublished date). (2) Bonhomme (1983), with later revisions (Dr M. Barbetti, pers. comm., June 1990).
HOLOCENE CHRONOLOGY The dated prehistoric hearths (Table 1) were situated immediately north and east of the playa. All were in primary context, and were buried beneath 20-50 cm of compact redbrown sand and clayey sand. They were invisible from the ground surface, and except for ANU - 2200 were located by caesium magnetometer survey conducted by Dr. J. Stanley and T. Bonhomme in 1981. Archaeological excavations under a NSW National Park and Wildlife Service permit were conducted by Williams, and sampling for palaeomagnetic analysis by Dr. M. Barbetti. This latter work provided an additional check upon whether or not the remains of the hearths had been disturbed after being finally abandoned. Since most hearths occupy shallow pits excavated on the original ground surface, they would be somewhat younger than the sediments in which they are found. Other hearths functioned as earth ovens, and were built of lumps of termite nest prised from subterranean Drepanotermes perniger nests which are still common here today. The hearth dates therefore provide a minimum age or terminus ante quern for the red clayey sand in which they occur, and must of course postdate the sand immediately beneath. The dates show that the dunes immediately east of Bunda Playa accumulated here between at least 400 and at most 3800 years BP (0.4 3.8 ka). These dunes are therefore of late
Holocene age, and are contemporary with the late Holocene source-bordering longitudinal dunes west of Belarabon Range which were first described and dated by Wasson (1969, 1976). Charcoal concentrations found scattered through the red-brown sands mantling the alluvial fans and piedmont fan apron on the western and eastern slopes of Belarabon Range provide some additional information (Table 2). In two adjoining valleys (Belarabon Fan and Dillon Fan (Fig. 2), charcoal collected from the base of overbank and slopewash sediments (Wasson's 1976 Kulwin Unit) immediately above the main red-brown sand unit (termed the Belarabon Unit by Wasson 1976) indicate a phase of erosion which began towards 0.6 ka, and continued, probably intermittently, until at least 0.3 ka. Deposition of the main red-brown sand unit (and associated linear dunes from which the red sandy slope mantles were derived) was more or less continuous from at least 5500 BP until about 640 BP (5.5 - 0.6 ka). We conclude that Sandy Creek was able to feed sediment to its daughter source-bordering dunes throughout much of the middle and late Holocene, but certainly from at least 5.5 ka until about 0.6 ka. The dunes were blown eastwards along and up the slopes of nearby hills (including Belarabon Range), where they were continuously subject to partial or total
A late Quaternary desert margin system, New South Wales
271
Table 2 Radiocarbon age determinations from charcoal collected from alluvial fan deposits on the western and eastern slopes of Belarabon Range. Age (Years BP)
Lab. No.
Locality
Stratigraphic Unit
260 ± 90
SUA - 326
(D)
I
(1)
620 ± 80
Beta - 19120
(B)
I
(1)
640 ± 110
SUA - 329
(C)
I
(2)
1890 ± 50
Beta - 7289
(B)
II
(2)
2450 ± 110
SUA - 327
(C)
II
(1)
2800 ± 90
Beta -19121
(A)
II
(2)
3060 ± 90
ANU - 2198
(A)
II
(3)
3580 ± 90
Beta - 7287
(C)
II
(2)
3670 ± 80
Beta - 7286
(C)
II
(2)
4450 ± 220
Beta -19118
(B)
II
(2)
4560 ± 95
SUA -166
(C)
II
(1)
4830 ± 160
Beta -19119
(B)
II
(1)
5470 ± 140
Beta - 7285
(D)
II
(1)
Reference
Reference: (1) Wasson (1976). (2) This work. (3) R.J. Wasson (unpublished date). Locality: (A) is Fan 1. (B) is Fan 2 or Belarabon Fan. (C) is Fan 3 or Dillon Fan. (D) is Fan 4 or Bronzewing Fan. (See Figs. 2, 3 and 5 for locations). Stratigraphic Unit: (I) Recent slope wash sands (Wasson's 1976 Kulwin Unit). (II) Reworked red-brown aeolian sands (Wasson's 1976 Belarabon Unit).
reworking by rainsplash, slopewash and wind. There are three main prerequisites for sourcebordering dunes to form (Williams 1985). One is a regular replenishment of channel-bed and point-bar sands, probably as a result of seasonal flow. The second is a strong and at least seasonally unidirectional wind. The third is a lack of dense riparian vegetation capable of impeding sand movement. Linear dunes are not forming today; existing dunes are vegetated and stable. We therefore consider that in this general area the rainfall regime, plant cover and wind regime were not identical to their present-day counterparts, and probably have no exact modern analogue. We speculate that there may have been more rainfall during the winter months, enabling Sandy Creek to ferry a bed-load of sand downstream during the months of winter flow, but that the summers were very hot, very dry, and very
windy, thus allowing deflation of sand from the channel and the creation of sourcebordering linear dunes. The presence of charcoal from episodic bushfires is consistent with such an interpretation. Also worthy of comment is the remarkable absence of early Holocene dates. There are several reasons for the lack of datable early Holocene material in the study area (Tables 1 to 4). Erosion may have removed all but a few isolated remains of early Holocene deposition. Erosion may have been the norm during this time, or there may have been a widespread erosional event immediately prior to deposition of the red-brown sands about 5.5 ka ago. The former possibility seems the more likely of the two. It is also possible that rainfall was more evenly distributed throughout the year, and that Sandy Creek
272
M.A.J. Williams, P. De Deckker, D.A. Adamson & M.R. Talbot
either did not carry much sand, or that its banks were too thickly vegetated and/or wind velocities were too low to allow the deflation of enough sand to blanket the hillslopes. At all events, the climate prevailing here during the first half of the Holocene was probably very different to the highly seasonal climate which we envisage was probably dominant during much of the latter half of the Holocene. We referred earlier to the Talyawalka Anabranch of the Darling. A spillover channel from this anabranch leads into a string of lakes which are shown (but not named) on Figure 1. At the distal end lies Lake Boola Boolka. Here both we (Adamson and Williams) and others (J. Balme and J. Hope) have independently dated a shell-bearing and very distinct high strandline. Our dates bracket this final transgression to 7.1 - 7.5 ka (7,100 ± 120, Beta - 5386; 7,360 ± 90, Beta - 5385; 7,560 ± 100, SUA-2003). There is no evidence that any later lake transgression reached as high as this shoreline, which must represent the terminal phase of a major transgression. An early Holocene high shoreline of similar age has been dated on the opposite side of the Darling at Lake Tandou (Hope et al 1983; Balme & Hope in press). The riparian lakes along the Darling trap and retain flood waters during episodes of extreme flow. The lack of late Holocene high strandlines suggests that the Darling had a significantly greater flood discharge during the earlier Holocene than later, but we cannot exclude the possibility that the main channel has become more entrenched since 7 ka. Clarification of the precise nature of the differences between early and late Holocene climates must await the outcome of future detailed microfossil, traceelement and stable isotope studies from former lakes, swamps and channel cutoffs in this area, along the lines pursued by De Deckker and colleagues 600 km further south (see De Deckker et al 1988 for a summary). PLEISTOCENE CHRONOLOGY The third and most problematic type of material dated in this area is pedogenic
calcium carbonate (Table 3). There are useful accounts of the problems involved in radiocarbon dating of calcareous desert palaeosols and of pedogenic carbonate in the arid interior of Australia, but the conclusions remain somewhat equivocal. Williams and Polach (1971) concluded that such dates could be from 500 to 7,000 radiocarbon years too old. The opposite conclusion was advanced by Callen et al (1983), who considered that pedogenic carbonate from the Strzelecki Desert gave radiocarbon ages that were several thousand radiocarbon years too young. We will eschew further comment other than to note that carbonate dates are especially prone to geochemical contamination from both younger and older sources of carbon, so that they are unlikely to be particularly accurate dates of the events or materials they purport to date. Granted all this, they are nonetheless useful at a relatively coarse level of chronology, pending alternative dating by uranium series analysis, which has elsewhere revealed that apparently finite radiocarbon dates on soil carbonate may be an order of magnitude older (Fontes & Gasse 1989). In order to ascertain the stratigraphic reliability of the soil carbonate dates, we tried three simple tests. In a trench dug c. 1 km east of Bunda Playa Lake, we dated both the inner and the outer portion of two large, hard and relatively impermeable carbonate nodules, one from a depth of 0.7 - 0.8 m, the other from 1.1 - 1.2 m depth (Table 3, SUA 1308 A and B, SUA 1309 A and B). The two inner dates were identical (32,500 ± 1100 BP), and the two outer dates were statistically indistinguishable at one standard deviation (31,200 ± 900 BP and 30,900 ± 900 BP). At two standard deviations, there was no statistically significant difference between any of the four dates, indicating that the true radiocarbon age of the carbonate at 0.7 -1.2 m depth is very probably within the range 34.7 - 29.1 ka. This carbonate was part of the massive Bca or K horizon of a palaeosol developed within a late Pleistocene dune (Gile et al 1965). The palaeosol had subsequently been truncated, and buried beneath late
A late Quaternary desert margin system, New South Wales
273
Holocene aeolian sands. Such polygenic dunes are common in the area and indeed are widespread features of the deserts and desert margins in Australia (Churchward 1963; Bowler & Magee 1978; Wasson 1983; Bowler 1986).
of a dune capped by late Holocene sands investigated by Wasson north-east of Belarabon homestead (ANU - 2529). It is tempting to infer that there was widespread carbonate precipitation in a variety of depositional settings towards 13 - 16 ka.
The remaining carbonate dates all come from differing locations and geomorphic contexts. Beta - 7452 is from the fourth oldest stratigraphic unit exposed in Belarabon Gully (Figs. 2 and 5), the youngest being the recent slopewash deposits which are discussed in more detail in the final section of this paper. It is of roughly similar age to the pedogenic carbonate collected by R.J. Wasson from the sandy prior stream alluvium near Belarabon homestead shearers' quarters (ANU - 2281), the pedogenic rhizocretions in the red-brown clayey sand unit in Fan 1 just west of Bunda Playa (Beta -19122 and Fig. 2), and the pedogenic carbonate within the Bca horizon
The other dates are also intriguing. Two (Beta -19116 and 19117) came from small and irregular concretionary layers denoting the final stages of drying out of Wooley Playa Lake 3 km NNE of Bunda Lake. The younger sample (21,180 ± 220 BP) is from the 5 cmthick horizon immediately above the older sample (25,030 ± 480 BP), so that the age difference between them of nearly 4,000 radiocarbon years is curious. Perhaps deposition was very slow, or perhaps carbonate segregation was spread out over a long time. Wasson (1976) has discussed the 23.9 ka and 28.1 ka dates for soft and hard variants of what he termed the Dillon Carbonate, an
Table 3 Radiocarbon age determinations from calcium carbonate concretions collected near Bunda Playa Lake, Belarabon Range, and the surrounding region. Age (Years BP)
Lab. No.
Site
13370 ± 120
Beta - 19122
(A)
In situ rhizocretions in reworked aeolian sand (depth 1.8 - 2.0 m).
(1)
13600 ± 200
ANU - 2281
(B)
Pedogenic C0 3 in prior stream alluvium.
(2)
14500 ± 110
Beta - 7452
(C)
In situ rhizocretions in reworked aeolian sand.
(1)
15570 ± 710
ANU - 2529
(D)
Pedogenic C0 3 in dune sand.
(2)
21180 ± 220
Beta - 19116
(E)
Pedogenic C0 3 in brown lacustrine sandy clay (depth 65 - 70 cm).
(1)
25030 ± 480
Beta - 19117
(E)
Pedogenic C0 3 in brown lacustrine sandy clay (depth 70 - 75 cm).
(1)
23930 ± 470
SUA - 328
(F)
Soft diffuse ped coatings in lower unit of alluvial fan sands.
(3)
28100 ± 900
SUA - 279
(F)
Hard C0 3 nodules in lower unit of alluvial fan sands.
(3)
Comments
Reference
(25040 ± 330)
Beta - 19115
(G)
In situ rhizocretions in clayey fine sand over fluviatile gravelly sands.
(1)
30900 ± 900
SUA - 1309A
(H)
Outer part of pedogenic C0 3 in dune sand (depth 110-120 cm).
(1)
32500 ± 1100
SUA - 1309B
(H)
Inner part of pedogenic C0 3 in dune sand (depth 70 - 80 cm).
(1)
31200 ± 900
SUA - 1308A
(H)
Outer layer of C0 3 nodule in dune sand (depth 70 - 80 cm)
(1)
32500 ± 1100
SUA - 1308B
(H)
Inner portion of C0 3 nodule in dune sand (depth 70 - 80 cm).
(1)
Site: (A) Fan 1 west of Bunda Playa Lake. (B) Prior stream channel near shearers' quarters, Belarabon homestead. (C) Belarabon Gully (Figs. 2 and 5). (D) Dune northeast of Belarabon homestead. (E) Dry floor of Woolly Lake next to spit-like feature on southwest. (F) Dillon Fan (Figs. 2 and 5). (G) Sand and gravel quarry near Mossgiel. (H) Dunefield c. 1.0 km east of Bunda Playa Lake and 10 km northwest of Belarabon homestead. Reference: (1) This work. (2) R.J. Wasson (unpublished date). (3) Wasson (1976).
274
M.A.J. Williams, P. De Deckker, D.A. Adamson & M.R. Talbot
entity to which he gave unit stratigraphic status. We disagree with this procedure, on the grounds that post-depositional precipitation of calcium carbonate can easily transgress across prior lithological boundaries. Pedogenic carbonate, unlike primary airfall volcanic ash, is not an unambiguous chronostratigraphic marker, and is only an approximate guide to the age of the deposit or stratigraphic unit in which it occurs. The rhizocretion sample from the sand and gravel quarry near Mossgiel (Beta - 19115, shown in bracket in Table 3) has a radiocarbon age of 25,040 ± 330 BP, which is statistically identical to the Woolly Lake sample Beta - 19117 (25,030 ± 480 BP). The quarry is 120 km SSW of Belarabon homestead, 17 km due south of Willandra Creek, and 56 km north-west of the Lachlan River. The rhizocretions were collected from 50 cm below the top of a massive mottled grey and red-brown clayey fine sand c. 2 m thick which is capped by 0.3 m of pedal red-brown fine sandy clay and is underlain by at least 5 m of cross-bedded, gravelly coarse sand. These coarse fluviatile sands represent transport by a braided river capable of carrying much coarser sediments than the small, sinuous, muddy and very underfit streams that occupy these plains today. If the 25 ka date is even approximately close to the real age, then the depositional events of the late Pleistocene have been unequalled during at least the last 10,000 years, a conclusion also reached by Bowler (1978) from his study of palaeochannels further south in the Riverine Plain. What do the pedogenic carbonate ages really mean? They cluster into two very broad age groups: 13 - 16 ka and 21 - 33 ka. The latter group may include at least three discrete sub-phases of carbonate segregation within the B horizons of the developing Pleistocene soils - an early one towards 30 - 33 ka, a later episode towards 25 ka, and a final one towards 21 ka, but this may be entirely illusory. Until several other independent methods of dating, (such as thermoluminescence and uranium- thorium dating) are applied to these
sites, our answer to the question we posed must remain conjectural. Assuming that calcareous dust was accumulating across the landscape at intervals during the late Pleistocene, presumably from sources further west or south-west (?continental shelf, Nullarbor Plain, playa floors, calcareous desert soils), there is no reason why solution and reprecipitation of the calcium carbonate component of the dust could not proceed fairly rapidly (?0.1-1.0 ka) after initial dust deposition. Segregation of large rhizocretions and nodules within the soil profile is probably a cumulative process, and many thousands of years may be involved in the development of thick Bca and more massive K horizons (Gile et al 1965, 1966), by lateral throughflow as well as by vertical percolation and precipitation around tree roots and as ped coatings along cracks. It seems intuitively plausible that the radiocarbon ages of soil carbonates will be younger than the parent sediments in which they occur (Bowler & Polach 1971), but as Callen et al (1983) and Fontes & Gasse (1989) remind us, this is not necessarily always so. We therefore believe that our only option is to leave the question of the true age of these soil carbonates open until it can be dealt with by thorough and systematic chronological work. Such work is still in its infancy worldwide. We turn now to the gypseous lunette 30 km north of Belarabon Range. The gypseous lunette complex at Lake Nulchara The sequence of events depicted in Figure 6 is based on detailed field levelling supplemented by five trenches and over twenty deep auger holes. Table 4 shows that aeolian deposition of the gypsum discs that make up the bulk of the gypseous lunette coincided at least in part with last glacial maximum (17 ± 2 ka). Within the main body of the lunette there are several layers rich in charophyte oogonia. In a gullied col at the northern end of the gypseous lunette, a metre of aeolian quartz sand overlies 15 cm of charophyte sand dated by the thermoluminescence (TL)
A late Quaternary desert margin system, New South Wales
275
Table 4 Radiocarbon and thermoluminescence age determinations from Lake Nulchara lunnette Age (Years BP)
Lab. No.
17,000 + 1300 - 1100
SUA - 1522
Charcoal fragments in cross-bedded aeolian sands of gypsum discs and very fine quartz sand. Depth 1.4 m. (Radiocarbon age).
17,200 ± 1500 (20,850 ± 2900)
Alpha - 2624
TL age of charophyte sand 35 cm above truncated palaeosol in gully just north of gypseous lunette.
41,400 ± 3000 (47,400 ± 7500
Alpha - 2623
TL age of aeolian quartz sand 70 cm beneath truncated calcareous palaeosol.
Comments
Note: The TL ages shown in brackets assume a water content amounting to 50% of lab. measured saturation (Dr. J.J. Stipp, pers. comm., Feb. 1986). The unbracketed TL ages are based on initial water content at time of sample collection which we consider to be probably more representative of the average moisture value over the period of time involved.
method to about 17.2 ka (or 20.8 ka if 50% soil saturation prevailed, which is improbable). Beneath this charophyte sand are a further 30 cm of aeolian quartz sands which rest unconformably upon an eroded palaeosol with carbonate rhizocretions up to 40 cm long. These belong to the calcareous B horizon (Bca) of a soil developed on at least 90 cm of wind-blown quartz sand. A sample collected from 0.7 m below the truncated top of the Bca horizon has yielded a TL date of 41.4 ka (or 47.4 ka if 50% soil saturation is assumed). The age of soil formation and carbonate segregation is therefore pre-17 ka and post-41 ka, so that it could be coeval with any of the 21 - 33 ka cluster of carbonate ages discussed earlier. In appearance, these rhizocretions resemble those collected from site E at Woolly Lake and site G at Mossgiel (Table 3), all of which date to about 21 - 25 ka. They certainly do not resemble the massive calcrete at site H in the buried dune c. 1.0 km east of Bunda Lake with radiocarbon ages of 30 - 33 ka. The late Quaternary history of the gypseous lunette at Nulchara Playa Lake (Fig. 6) is of special interest because it illustrates very effectively certain key features of the desert margin environment of the central west of New South Wales. There is a close link between the aeolian, fluvial and lacustrine systems throughout the area. Some aeolian features (lunettes) are closely linked with a lake system; others (source-bordering dunes) with either a lake or a fluvial system. Material is easily transported
from one system to another so that it becomes reworked within another system. As a result of this continuous sorting of sediment, there is often no distinct lithology which is diagnostic of one particular system. The gypsum discs at Nulchara are a partial exception to this generalisation. They originated within sedimentary interstices in the lake bed, but eventually were reworked by wind to accumulate as a lunette whence they will, ultimately, be washed back down to the playa depression. A second feature is the importance of the groundwater system. Seasonal fluctuations in groundwater may be responsible for activating (or re-activating) deflation of sediment from the lake margin (Bowler 1973). Groundwater was essential to produce the gypsum discs. These discs form interstitially and are quite different from the elongated crystals formed by evaporation at the lake surface (Teller et al 1982; Bowler & Teller 1986). Such lakes as this probably functioned as 4'groundwater windows" at intervals throughout the Quaternary (Warren 1982; Jacobsen et al 1988; Chen et al 1990). If the system was a "flowthrough" system with a continuous flow through the "window" during periods when the regional water table was high, a huge supply of gypsum discs can be thrown onto the landscape, producing daughter dunes or lunettes which at first seem incongruously large relative to their parent playa lakes. The co-occurrence of charophytes and gypsum discs is of interest. Charophytes can tolerate fairly saline waters, including water
276
M.A.J. Williams, P. De Deckker, D.A. Adamson & M.R. Talbot
rich in dissolved sulphates. The charophyte gyrogonites can easily be washed into the lake from inflowing streams, as at Nulchara (Fig. 6), to become mixed with the gypsum discs. Once formed, many aeolian features such as gypseous dunes may remain as comparatively enduring features of the landscape as a result of the ensuing development of resistant crusts or caprocks of gypcrete (Coque 1962; Watson 1979; Jacobson etal 1988; Chen 1989). Such fossil landforms bear witness to past hydrological and aeolian events which are out of harmony with the present-day climate, and are useful Quaternary palaeoclimatic and palaeohydrological indicators. Finally, in contrast to the semi-arid desert margins of northwestern China and the southwestern U.S.A., western New South
Wales is devoid of high relief. High mountain ranges are therefore neither essential for the development of a full range of aeolian, lacustrine and fluvial landforms nor for the integration of all three systems - aeolian, lacustrine, fluviatile - within the one landscape. We believe that the late Quaternary low gradient desert margin system which we have described is broadly representative of much of central western New South Wales. We further predict that this landscape may have close analogues in some of the Permian and Triassic landscapes of the Northern Hemisphere, a possibility we will explore elsewhere (Talbot & Williams in prep.). Figure 7 is a highly generalised and very diagrammatic summary of the late Quaternary stratigraphy and major erosional, depositional
Years Before Present
0
400-3,800
Aboriginal fires (5)
Alluvial and aeolian sands (9)
5,500
7,100-7,500
High lake levels (3)
Pedogenic carbonate (3)
13,500-15,500
Calcareous dust
Alluvial and aeolian sands
16,000-18,000
Gypseous lunette (1)
Pedogenic carbonate (6)
24,000-32,000
Calcareous dust
Alluvial and aeolian sands
Figure 7 Generalised late Quaternary piedmont stratigraphy in the Belarabon-Nulchara Lake region, showing major phases of aeolian dust influx to the area. The numbers in brackets denote numbers of samples dated, and includes both radiocarbon and thermoluminescence dates.
A late Quaternary desert margin system, New South Wales and pedogenic events in the study area. Excluding the three dates from the 7.1 - 7.5 ka high strandline at Lake Boola Boolka, and the single date of 25 ka from the gravel quarry at Mossgiel, both of which reflect depositional events associated with hydrological changes external to the study area, the remaining 31 radiocarbon and two TL dates range from accurate (charcoal and hearth dates, 0.4 - 5.5 ka) to less accurate (charcoal and TL dates, 16 - 18 ka; TL date, 38 - 44 ka) to probably unreliable (all carbonate dates, 13 -16 ka and 21 - 33 ka). We now turn to the question of more or less contemporary erosion and sedimentation - a question which has evoked considerable attention in the semi-arid south-west of the United States (Bryan 1925a, 1925b; Schumm & Hadley 1957; Tuan 1966; Cooke & Reeves 1976). Contemporary erosion and sedimentation The most recent changes to the landscape of the study area have occurred within the lifetime of still living trees. A modern phase of erosion and deposition, widespread on the plains west and south of Cobar is well illustrated in Belarabon gully. This gully contains a minor but typical ephemeral tributary of Sandy Creek and flows northwards in a steepsided valley between Devonian sandstone strike ridges (Figs. 2 and 8). At the downstream end of the valley a recent sand splay mantles a former soil surface and partly fills the former stream channel (Figs. 8, 9 and 10). The present stream and a network of shallow gullies have incised both the splay and the former surface. Good evidence exists for the timing of these events based on partial burial of the trunks and stumps of Cypress Pine trees (Callitris glaucophylla Thomson and Johnson). Cypress Pines produce large lateral roots beginning about 0.1 to 0.15 m below the soil surface. Cork developed in contact with the atmosphere differs in appearance from that produced below ground. Along transect AB the deeply buried lateral roots and the cork
277
characteristics on the lower stem show deposition of up to 0.5 m of loose red sand since the trees became established. The longevity of pines is unknown but ages of 100 to 200 years are reasonable. Location C (Fig. 10) shows the stump of an axe-felled pine, the stump being virtually buried by the sand splay before exposure by the incised stream. The felling of this tree pre-dated deposition of the sand splay but post-dated European settlement. This tree was probably logged, along with many others, for the building of fences, yards and the Paddington Woolshed after about 1871 (see Fig. 8). Since then the presumably younger trees on transect AB have matured, the broad shallow sand splay was deposited, and the previously broad shallow stream has shifted course and become incised and gullied. Upstream at Site D, exposure of tree roots by the newly incised stream is well-illustrated. These roots locate precisely the position, shallow depth and gently sloping banks of the former channel. Further upstream (Sites E and F) the channel is deeply incised, migrating laterally and actively eroding the concave banks to create vertical gully walls up to 4 m in height. At Site E, Figs. 12 and Plate 1 show how living trees locate precisely the former stream channel. It was shallow, dish-shaped in cross-section, and abutted trees without signs of erosion around their bases (see also Fig. 11). The former channel is preserved intact and abandoned where the present incised channel has shifted sideways (Fig. 12). The presence of large living roots of Bimble Box (Eucalyptus populnea F. Muell) spanning high above the modern incised stream channel, but conforming closely to the inferred original soil surface (Figs. 12 and Plate 1), is direct evidence for the youth of the modern channel. In its upper reaches the stream bed has incised to expose bars of bedrock and carbonate-cemented cobbles. At Site F (Fig. 13) the buried cobble layer in the gully wall of the stream can be traced upslope at right angles to the long axis of the valley with the help of exposures in the walls of tributary
278
M.A.J.
Williams, P. De Deckker, D.A. Adamson & M.R. Talbot
Sand plain Sand mantle on slopes of Devonian ridges Minor creek (gullied) >77777rr- Ridge (Devonian sandstone) =
=
=
Roa(j
W A Approx. extent of ^ modern outwashed v sand (inset map)
Figure 8 Map of the northeastern margin of Belarabon Range where it abuts Sandy Creek showing location of Belarabon Gully and of sites A to F along the channel.
A late Quaternary desert margin system, New South Wales
279
Figure 9 Transect A-B in Belarabon Gully showing modern gully entrenched into formerly wider palaeochannel.
gullies. Sufficient exposures exist to reveal that the buried cobble layer is extensive beneath the sedimentary fill. Above the fill the cobble layer becomes a surface lag until the steeper bedrock slopes are reached. We infer that the cobble layer forms a sloping surface above which fluvial erosion periodically strips part or all of the sediment that accumulates above it. At present, gully erosion is stripping sediment accumulated above the cobble layer. Gully heads coincide with the junction of the 12° and 8° slopes. Evidence described above suggests the following interpretation. The sand plain along Sandy Creek to the west of the Belarabon Range provided abundant sand and finer sediment to be blown eastwards as the dunes and sandy mantle climbed the western slopes of the range (Figs. 3, 5 and 8). Sand and finer
sediment blown across the main ridge was deposited in the north-south valley containing Belarabon gully. Slopewash helped concentrate the wind-blown sediment on the lower slopes of the valley as a substantial fill (Fig. 13). Occasionally scouring of the fill allowed formation of the probably discontinuous cobble lags, the cobbles being derived from bedrock and from the steep sandstone ridges above. Episodes of scouring may have been triggered by progressive accumulation of fill, by periods of reduced vegetation cover, or by both factors. Long-term climatic deterioration or a rare coincidence of catastrophic events involving drought and fire could so reduce vegetation cover as to cross a threshold from net sediment accumulation to net erosion. As noted earlier in this paper, more than one episode of scouring and accumulation is indicated by the stratigraphy of
280
M.A.J. Williams, P. De Deckker, D.A. Adamson & M.R. Talbot
A • • » I lV » *• >
J
Sandy bed of present stream
1m m
Modern outwash sand Sandy valley fill Former surface ^
Callitris
glaucophylla
Figure 10 Cross-sections at sites A, B and C in Belarabon Gully showing modern incision and sedimentation.
the gully walls where loose red sand can overlie mottled clay sands (Figs. 5 and 7). Given the antiquity of landforms in inland Australia, there was plenty of time for repeated episodes of accumulation and erosion, but only the last few episodes are well preserved in the piedmont gullies (Figs. 5 and 7). The most recent and the presently active period of net erosion was initiated during the life of still living pine and eucalypt trees at a time when their root systems already extended up to 9 m laterally. Logging of pine preceded deposition of a sand splay at the mouth of Belarabon valley and the concomitant erosion that produced the sediment. Since then the meandering ephemeral stream has incised and migrated laterally throughout its length. During the current episode of erosion the stream channel has changed from a stable shallow dish-shaped profile with presumably
a stable bed to an entrenched gully with a mobile sandy bed and vertical to undercut walls on one or both banks. Networks of active tributary gullies are common. Gullying is confined to the sandy sedimentary fill in the valley. The switch to the current erosional phase seems to be firmly linked to about the time of arrival of the pastoral industry late last century. Vegetation depletion, soil structural breakdown, and channelling of water along sheep tracks were probably important in triggering erosion. Alternatively, the onset of the modern phase of net erosion could be explained by a combination of climate-fire events and by accumulation of fill to unstable levels without the necessary intervention of the pastoral industry. However, to dismiss the role of sheep is to ignore the nearly coincident timing between the inception of very active erosion and modern settlement. Further, the
A late Quaternary desert margin system, New South Wales
f\ vg) Callitris
281
glaucophylla
Figure 11 Cross-section at site D in Belarabon Gully showing present-day and former channel cross-section.
evidence along Belarabon gully suggests that the pastoralists arrived in the area just before the sand splay and the incised stream channel formed. Erosion thus appears to have been subsequent to settlement in this area, increasing the probability that it was consequent on pastoralism. On balance, we consider that the
presence of relatively thick deposits of fill, extreme but not improbable climatic events and stocking by sheep were the three factors involved in initiating the modern phase of gully erosion - the latter two factors controlling the precise timing. Although gullying and mobilisation of sandy sediment is now very
282
M.A.J. Williams, P. De Deckker, D.A. Adamson & M.R. Talbot
B Q l ^ r-L •:/
l^LJ
m -
Site E Sand bed of present stream
B Bimble box (Eucalyptus
populnea)
Cliffed edge of gully cut by stream
P Cypress pine (Callitris
glaucophylla)
Sheep track Former stream channel
|
Location and direction of photo Person in photo
Figure 12 Site E in Belarabon Gully showing position of present-day and of immediately-previous stream channel.
A late Quaternary desert margin system, New South Wales
283
/ / / V 20 8°
West ^
12°
y/East
zone of modern lateral gullies
8° 10m 0m
VMDevonian sandstone
t
Cobble layer as surface lag, or buried by fill W0/M Fill
M
f Sand bed of present stream — F o r m e r surface 4° Hill slope (degrees)
Figure 13 Valley cross-section at site F in Belarabon Gully showing partial burial of surface lag gravel by a mantle of fluvio-aeolian sands.
Plate 1 Site E in Belarabon Gully showing recent exposure of Bimble Box (Eucalyptus populnea) roots on right of channel and of Cypress Pine (Callitris glaucophylla) roots on left of channel. See Figure 12 for location and direction of photograph, and location of person.
284
M.A.J. Williams, P. De Deckker, D.A. Adamson & M.R. Talbot
visible, we have not yet identified any large new depositional centres in the Belarabon area. Small thin sand splays occur, as at the downstream end of Belarabon gully, the creeks carry mobile sand and Sandy Creek is now a sand-clogged stream, but the quantity of newly mobilised sand being carried by the streams is apparently not yet enough in this region to produce thick or extensive deposits. However, the period involved is extremely short relative to the time scale of former landscape evolution. In the hilly parts of the Cobar plateau, the outcome of the present phase of stream incision and erosion, initiated about 100 years ago, is far from worked out. Future land use can modulate its outcome in a predictable way only when the past events are well-understood. SUMMARY AND CONCLUSION The region bounded by a rough triangle extending between Wilcannia, Cobar and Ivanhoe and centred around Belarabon Range and the adjacent reaches of Sandy Creek is a low gradient desert margin environment typical of the internally drained areas of central western New South Wales. Characteristic of this region is a suite of aeolian, lacustrine and alluvial landforms and sediments. The close links between aeolian, fluvial and lacustrine systems are such that there is a continuous transfer of sediment between all three systems. As a consequence of this reworking, lithology is often a poor index of depositional environment. Two additional factors which influenced sediment properties at intervals during the late Quaternary were episodic accessions of calcareous wind-blown dust, and precipitation of gypsum crystals interstitially within the lacustrine clays of certain small depressions which periodically functioned as local groundwater windows when regional water tables were high. Based upon lithostratigraphic mapping at three environmentally distinct localities (playa lake; piedmont fans; gypseous dune) we have reconstructed a history of late Quaternary erosion and deposition which is also partially
dated by radiocarbon and thermoluminescence techniques. Deposition of aeolian quartz sands around 45 ka was followed by an influx of calcareous dust and development of calcareous soils. Alluvial fan accumulation in piedmont localities was an episodic process, with periodic accessions of calcareous dust during the late Pleistocene, probably on at least two occasions. Solution and re-precipitation of the carbonate is radiocarbon dated to c. 33 - 21 ka and 16 -13 ka, and was responsible for the development of massive calcretes and calcareous Bca soil horizons in a variety of prior sediments, including alluvial fans, dunes, lake margin clays and palaeochannel alluvium. Deflation was active during last glacial maximum, resulting in the local construction at Lake Nulchara of an unusually high lunette composed of wind-blown discs of gypsum, fine quartz sand and minor concentrations of charophyte oogonia towards 18 - 16 ka. Erosion seems to have been widely prevalent thereafter until about 5.5 ka, when strong unidirectional winds, sparse riparian vegetation, and a steady supply of channel sands in Sandy Creek resulted in the formation of linear source-bordering dunes. Mid to late Holocene dune development continued more or less continuously until about 0.6 ka, after which the supply of quartz sand was curtailed, and erosion of pre-existing dunes and sandsheets began. Dunes in this area are polygenic features, and often consist of an inner core of truncated late Pleistocene dunes cemented by calcium carbonate beneath 1 - 2 m of loose red-brown aeolian quartz sand of late Holocene age. During the last hundred or so years, many previously shallow channels have become deeply incised by narrow, steep-walled gullies. This episode of vertical erosion coincided with the advent of European settlement in the region, and may be genetically linked to early pastoralism and associated clearing of native trees and a change in fire regime. Equally, it may reflect a change in drought frequency, or
A late Quaternary desert margin system, New South Wales
in the seasonal incidence of rainfall. It is perhaps worth remembering that the initial European occupation of Australia also coincided with the waning phase of the Little Ice Age. The possible impact of the Little Ice Age upon the Australian landscape remains unknown. Until it is resolved, we will be poorly equipped to evaluate accurately the net impact of European settlement upon the desert margin systems of Australia.
ACKNOWLEDGMENTS M.A.J. Williams extends particular thanks to Bob Wasson for introducing him to this superb region in 1969; to Dick and Jill Houghton, formerly of Belarabon Station, for help, hospitality and many kindnesses over the years; to his colleagues Mike Clarke and Steve Riley for sterling support in the field; and to many former Macquarie Earth Sciences students, whom he inducted into this field area, and from whom he always learned more. Our appreciation goes to ARGS/ARC, Macquarie and Monash Universities for generous financial support with field and laboratory work. M.R. Talbot thanks Macquarie for the travel scholarship which made possible his 1983 visit. We thank Kron Nicholas and John Holmfield for permission to work on Belarabon Station in 1986. Special thanks go to Gary Swinton and Tony Miller (Monash, Geography & Environmental Science) for their help with the figures, and to Lyn McMullen and Maureen Upston for their care with the manuscript.
REFERENCES ADAMSON D., WILLIAMS M A . J . & BAXTER J.T. 1987. Complex late Quaternary alluvial history in the Nile, Murray-Darling, and Ganges basins: three river systems presently linked to the Southern Oscillation. In Gardiner V. ed. International Geomorphology 1986, Part II, pp. 875-887. John Wiley, Chichester. BALME J. & HOPE J. (in press) Radiocarbon dates from midden sites in the lower Darling River area of western New South Wales. Archaeology in Oceania.
285
BARNOLA J.M., RAYNAUD D., KOROTKEVICH Y.S. & LORIUS C. 1987. Vostok ice core provides 160,000-year record of atmospheric C0 2 . Nature 329, 408-414. BAXTER J.T. 1989. Hydrologic models of the Willandra Lakes and the Lachlan River: implications for palaeohydrology. In Donnelly T.H. and Wasson R.J. eds. CLIMANZ 3, Proceedings of the Third Symposium on the Late Quaternary Climatic History of Australasia, Melbourne 1987, pp. 70-77. CSIRO Division of Water Resources, Canberra. BONHOMME T. 1983. Bunda Lake - a study in site location. BA (Hons) thesis, Macquarie University (unpubl.). BOWLER J.M. 1973. Clay dunes: their occurrence, formation and environmental significance. Earth-Science Reviews 9, 315-338. BOWLER J.M. 1976. Aridity in Australia: age, origins and expression in aeolian landforms and sediments. Earth-Science Reviews 12, 279-310. BOWLER J.M. 1978. Quaternary climate and tectonics in the evolution of the Riverine Plain, southeastern Australia. In Davies J.L. and Williams M.A.J, eds. Landform Evolution in Australasia, pp. 70-112. Australian National University Press, Canberra. BOWLER J.M. 1986. Quaternary landform evolution. In Jeans D.N. ed. Australia - A Geography. Vol. I. The Natural Environment, pp. 117-147. Sydney University Press, Sydney. BOWLER J.M. & MAGEE J.W. 1978. Geomorphology of the Mallee Region in semi-arid northern Victoria and western New South Wales. Royal Society of Victoria Proceedings 90, 5-20. BOWLER J.M. & POLACH H.A. 1971. Radiocarbon analyses of soil carbonates: an evaluation from paleosols in southeastern Australia. In Yaalon D.H. ed. Paleopedology. Origin, Nature and Dating of Paleosols, pp. 97-108. International Society of Soil Science and Israel Universities Press, Jerusalem. BOWLER J.M. & TELLER J.T. 1986. Quaternary evaporites and hydrological changes, Lake Tyrrell, north-west Victoria. Australian Journal of Earth Sciences 33, 43-63. BRUNKER R.L. 1969. 1:250,000 Geological Series, Explanatory Notes, Cobar, pp. 1-31 and sheet SH/55-14 Australian National Grid. Department of Mines, Geological Survey of New South Wales. BRYAN K. 1925a. Date of channel trenching (arroyo cutting) in the arid Southwest. Science 62, 338-344.
286
M.A.J. Williams, P. De Deckker, D.A. Adamson & M.R. Talbot
BRYAN K. 1925b. The Papago country, Arizona. United States Geological Survey Water-Supply Paper 449. CALLEN R.A., WASSON R.J. & GILLESPIE R. 1983. Reliability of radiocarbon dating of pedogenic carbonate in the Australian arid zone. Sedimentary Geology 35, 1-14. CHEN X.Y. 1989. Lake Amadeus, Central Australia: Modern processes and evolution. PhD thesis, Australian National University, Canberra (unpubl.). CHEN X.Y., PRESCOTT J.R. & HUTTON J.T. 1990. Thermoluminescence dating on gypseous dunes of Lake Amadeus, central Australia. Australian Journal of Earth Sciences 37, 93-101. CHURCHWARD H.M. 1963. Soil studies at Swan Hill, Victoria, Australia. II. Dune moulding and parna formation. Australian Journal of Soil Research 1, 103-116. COOKE R.U. & REEVES R.R. 1976. Arroyos and Environmental Change in the American South-West. Clarendon Press, Oxford. COQUE R. 1962. La Tunisiepresaharienne: Etude geomorphologique. Armand Colin, Paris. De DECKKER P., KERSHAW A.P. & WILLIAMS M.A.J. 1988. Past environmental analogues. In Pearman G.I. ed. Greenhouse: Planning for Environmental Change, pp. 473-488. E.J. Brill, Leiden and CSIRO, Melbourne. FONTES J.C. & GASSE F. 1989. On the ages of humid Holocene and Late Pleistocene phases in North Africa - remarks on Late Quaternary climatic reconstruction for the Maghreb (North Africa)'' by P. Rognon. Palaeogeography, Palaeoclimatology, Palaeoecology 70, 393-398. GENTHON C., BARNOLA J.M., RAYNAUD D., LORIUS C., JOUZEL J., BARKOV N.I., KOROTKEVICH Y.S. & KOLTYAKOV V.M. 1987. Vostok ice core: climatic response to C0 and orbital forcing changes over the last climatic cycle. Nature 329, 414-418. GILE L.H., PETERSON F.F. & GROSSMAN R.R. 1965. The K. Horizon: a master soil horizon of carbonate accumulation. Soil Science 99,74-82. GILE L.H., PETERSON F.F. & GROSSMAN R.B. 1966. Morphological and genetic sequences of carbonate accumulation in desert soils. Soil Science 101, 347-360. HOPE J.H., DARE-EDWARDS A. & McINTYRE M.L. (1983). Middens and megafauna: stratigraphy and dating of the Lake Tandon lunette, western New South Wales. Archaeology in Oceania 18, 45-53. 44
2
JACOBSEN G., ARAKEL A.V. & CHEN Y. 1988. The central Australian groundwater discharge zone: Evolution of associated calcrete and gypcrete deposits. Australian Journal of Earth Sciences 35, 549-565. SCHUMM S.A. & HADLEY R.F. 1957. Arroyos and the semiarid cycle of erosion. American Journal of Science 225, 161-174. STANLEY J.M. 1982. New magnetometer technology and its application to archaeological exploration. In Ambrose W. and Duerden P. eds. Archaeometry: an Australasian Perspective, pp. 151-155. Australian National University Press, Canberra. STANLEY J. & GREEN R. 1976. Ultra-rapid magnetic surveying in archaeology. Geo-exploration 14, 51-56. STREET F.A. 1980. The relative importance of climate and local hydrogeological factors in influencing lake-level fluctuations. Palaeoecology of Africa 12, 137-158. TALBOT M.R. & WILLIAMS M.A.J, (in prep.) Sedimentation in low gradient desert margin systems: the Late Quaternary of western New South Wales (Australia) and the Late Triassic of northwest Somerset (England). TELLER J.T., BOWLER J.M. & MACUMBER P.G. 1982. Modern sedimentation in Lake Tyrrell, Victoria, Australia. Journal of the Geological Society of Australia 29, 159-175. TUAN Y.F. 1966. New Mexican gullies: a critical review and some recent observations. Annals of the Association ofAmerican Geographers 56, 573-597. WARREN J.K. 1982. The hydrological setting, occurrence and significance of gypsum in late Quaternary salt lakes in South Australia. Sedimentology 29, 609-637. WASSON R.J. 1969. Aeolian landforms in the surficial stratigraphy of the Belarabon area, south west of Cobar, N.S. W. BA (Hons) thesis, University of Sydney (unpubl.). WASSON R.J. 1975. Evolution of alluvial fans in two areas of south-eastern Australia. PhD thesis, Macquarie University (unpubl.). WASSON R.J. 1976. Holocene aeolian landforms in the Belarabon area, S.W. of Cobar, N.S.W. Journal and Proceedings, Royal Society of New South Wales 109, 91-101. WASSON R.J. 1983. The Cainozoic history of the Strzelecki and Simpson dunefields (Australia), and the origin of the desert dunes. Zeitschrift fur Geomorphologie N.F., Supplementband 45, 85-115.
A late Quaternary desert margin, New South Wales WATSON A. 1979. Gypsum crusts in deserts. Journal of Arid Environments 2, 3-20. WHETTON P.H. & BAXTER J.T. 1989. The Southern Oscillation and river behaviour in southeastern Australia. In Donnelly T.H. and Wasson R.J. eds. CLIMANZ 3, Proceedings of the Third Symposium on the Late Quaternary Climatic History of Australasia, Melbourne 1987, pp. 62-69. CSIRO Division of Water Resources, Canberra. WHETTON P., ADAMSON D. & WILLIAMS M. 1990. Rainfall and river flow variability in Africa, Australia and East Asia linked to El Nino - Southern Oscillation events. In Bishop P. ed. Lessons for Human Survival: Nature's Record from the Quaternary. Geological Society of Australia Symposium Proceedings 1, 71-82.
287
WILLIAMS G.E. & POLACH H.A. 1971. Radiocarbon dating of arid-zone calcareous paleosols. Geological Society of America Bulletin 82, 3069-3086. WILLIAMS M.A.J. 1984. Quaternary environments. In Veevers J.J. ed. Phanerozoic Earth History of Australia, pp. 42-47. Clarendon Press, Oxford. WILLIAMS M.A.J. 1985. Pleistocene aridity in tropical Africa, Australia and Asia. In Douglas I. and Spencer T. eds. Environmental Change and Tropical Geomorphology, pp. 219- 233. George Allen and Unwin, London. WILLIAMS M.A.J., ADAMSON D.A. & BAXTER J.T. 1986. Late Quaternary environments in the Nile and Darling basins. Australian Geographical Studies 24, 128-144.
A comparison of long Quaternary pollen records from the Atherton and Western Plains volcanic provinces, Australia A.P. KERSHAW , J.G. BAIRD , D.M. D'COSTA , P.A. EDNEY , J.A. PETERSON AND K.M. STRICKLAND 1
2
1
1
1
1
1
Department of Geography and Environmental Science and Department of Earth Sciences, Monash University, Clayton, Victoria 3168, Australia. 2
The existence of lake and swamp sediments within volcanic maars of similar size and age on the Atherton Tableland of northeastern Queensland and on the Western Plains of Victoria has allowed the reconstruction of long pollen records that invite comparison between tropical and temperate parts of eastern Australia. Two records from each area that extend well into the Pleistocene have been prepared. They show major changes in local depositional environments and in surrounding dry land vegetation compatible with expected broad palaeoclimatic change. The records are readily interpreted in terms of change in effective precipitation, while there is also evidence of sustained vegetation changes most likely resulting from increased burning through the activities of Aboriginal people. Correlations are complicated by differential sediment accumulation rates including missing and non-polleniferous sections, marked spatial variation in pollen assemblages and a lack of reliable absolute dates for older sediments. However, it has proven possible to construct a relatively consistent stratigraphy for at least the last 100,000 years that can be compared with the deep sea core stratigraphy. Key words: Atherton Tableland, biostratigraphy, palynology, Quaternary, western Victoria. INTRODUCTION
Over much of the world's land surface, the Quaternary has been characterised by erosion rather than deposition. Consequently there has been little opportunity for the development of long continuous terrestrial sequences to allow reconstruction of vegetation and environments well into the past. In Australia, little of which has suffered the direct effects of glaciation, a number of long pollen records has been produced (see Fig. 1). These include one from Lake George, a large tectonic basin (Singh & Geissler 1985), two from peat and artesian spring deposits (Pulbeena Swamp: Colhoun et al 1982, and Mowbray Swamp: van de Geer et al 1986), one from a coastal interdune deposit (Wyrie Swamp: Dodson 1977) and two from volcanic craters (Lake Leake: Dodson 1975, and Lynch's Crater: Kershaw 1976, 1986). Most of these sequences are very condensed, with only the volcanic crater sediments having an average accumulation rate of greater than 10 cm per 1000 years. Consequently, it is likely that many of the records contain gaps due to 288
cessation of deposition or to episodes of erosion. It is also possible that the Lake Leake record is not as complete as it could be, because the core analysed was extracted from the lake margins rather than the centre. Local marginal effects may have therefore complicated interpretation of the regional vegetation history. By contrast, the Lynch's Crater record is from the centre of the site. It has an average accumulation rate of 30 cm per 1000 years, and has been readily interpretable in regional vegetation and environmental terms. Recently, three other records have been prepared or are in the process of construction from similar environments to Lynch's Crater. One of these sites is from the same volcanic province as Lynch's Crater, in northeastern Australia, while the other two are from a southeastern Australian volcanic province. THE SITES AND THEIR REGIONAL SETTINGS
Lynch's and Strenekoff's craters are located on the southeastern margins of the Atherton
Pollen records from the Atherton and Western Plains provinces
289
Fig. 1 Location of pollen analytical sites in Australia in relation to major vegetation types.
Tableland, about 6 km from each other (Fig. 1) and between the 2500-3000 mm isohyets. Precipitation is concentrated in the summer months but there is sufficient drizzle during the winter to maintain moist conditions throughout the year. The main source of precipitation is the southeasterly trade winds that blow over the Central Highlands before reaching the Tableland. Natural vegetation
cover was complex mesophyll vine forest (tropical rainforest) that has largely been cleared for dairy pastures. The region as a whole still supports the largest area of rainforest on the Australian mainland. High topographic, edaphic and climatic variation is responsible for high rainforest diversity, but rainforest in general gives way to sclerophyll forest and woodland towards the drier west.
290
A.P. Kershaw, J.G. Baird, D.M. D*Costa, P.A. Edney, /.v4. Peterson & KM. Strickland
Precipitation at the two southern sites, Lake Wangoom and Lake Terang, is about 750 mm per annum and shows a slight winter maximum. It is largely derived from easterly moving depressions. Native vegetation was probably open eucalypt woodland with a continuous grassy understorey (Willis 1964). Although climatically the area is capable of supporting forest, the heavy volcanic soils appear to inhibit the development of a more continuous tree cover (Dodson 1974). In relation to eastern Australia as a whole, both volcanic provinces are close to the coast and receive relatively high precipitation. There is a gradual change from vine forest, through open forest and woodland to grassland or shrubland, with decreased precipitation from the coast inland. Eucalypts tend to dominate the open forests and woodlands and, along with acacias, the open shrublands. Casuarina and Callitris are the only other two tree genera with substantial woody canopy representation. All sites are well-marked craters less than about 1 km in diameter that have accumulated sediment to maximum attainable levels or have been recently drained. The lack of surface water allowed the use of drilling rigs to collect long cores from the centre of each site. In both volcanic provinces, a number of sites have been examined (Fig. 1). They provide consistent regional pictures of vegetation and environments through the last few thousand years which are not clearly or fully represented in the longer records. The younger crater sites also assist interpretation of past assemblages from the older sites when they were at similar stages of development. THE POLLEN DIAGRAMS Major features of the pollen diagrams are presented on Figures 2 to 5. Due to their regional importance, emphasis has been placed on major dryland pollen taxa. Changes in abundance of these taxa has been used as the basis for independent subdivision of each diagram. Radiocarbon dates provide some
control on sedimentation rates, either directly, as in the upper parts of the cores, or indirectly, by extrapolation. Lynch's Crater The diagram on Figure 2 is very similar to that presented in Kershaw (1986). The marked vegetation changes can be explained largely in terms of precipitation variation, with fire becoming important within the last 40,000 years or so. The estimated time scale is based on radiocarbon dates within dating range and extrapolation, taking into account moisture levels in the relatively homogeneous sediments beyond this time (Kershaw 1980). The most complex vegetation assemblages (mesophyll vine forest) existed under precipitation and temperature levels at least as high as those of today, and are recognised in phases Lll, L8 and LI by high values for rainforest angiosperms, in particular Cunoniaceae and Elaeocarpus. Peaks of Palmae cf. Archontophoenix accompany the earlier two phases. Somewhat lower climatic values are inferred by slightly higher sclerophyll taxon and rainforest gymnosperm values in phases L10 and L7. These were probably dominated by notophyll vine forest. Phase L6 is transitional between the two vine forest types but it, and adjacent phase L7, are characterised by consistently high values for the palm, Orania, and the conifer, Dacrydium. Much lower precipitation levels can be inferred for phases L9 and L3-5, where rainforest angiosperms and sclerophyll taxa have very high representation. Phase L4 is separated on slightly higher angiosperm values including a peak in Elaeocarpus. Araucaria dominated rainforest probably occurred around the site during all these phases. Open sclerophyll woodlands gradually replaced the araucarian forests between about 38,000 and 26,000 years ago and then maintained dominance until about 9,000 BP. Although precipitation may have been at its lowest for the record at this time, the change corresponds with a sharp increase in charcoal levels, and the preferred explanation for
Pollen records from the Atherton and Western Plains provinces
291
ESTIMATED DATES (yrs B P.) DEPTH (m) RAINFOREST GYMNOSPERMS RAINFOREST ANGIOSPERMS SCLEROPHYLL TAXA
Palmae cf. A rchontophovnix Cunoniaceae
Eucalyptus type
8 r± §
SUGGESTED MEAN ANNUAL PRECIPITATION (mm)
Ui
RANGE BEST ESTIMATE
CHARCOAL PARTICLES per cm 3 (1 000's) ^VAvV EXAGGERATION »10
SUGGESTED PREDOMINANT VEGETATION TYPE IN VICINITY OF SITE
Fig. 2 Selected attributes of the Lynch's Crater pollen diagram. Values for all taxa are expressed as percentages of total dry land pollen for the appropriate sample.
292
A.P. Kershaw, J.G. Baird, Z>.M D'Costa, P.A. Edney, J.A. Peterson & K.M. Strickland
sclerophyll expansion is an increase in burning probably resulting from the activities of Aboriginal people (Kershaw 1978, 1986). This burning was likely to have caused the replacement of substantial areas of drier vine forests in northeastern Queensland by sclerophyll vegetation and the extinction of many taxa including the palynologically visible Dacrydium (Kershaw 1984). Strenekoff's Crater The complex stratigraphy at this site precludes extrapolation of a realistic time scale from the few radiocarbon dates available. Laminated lake sediments, suggesting the presence of deep water, together with domination of dry land vegetation by rainforest angiosperms, indicate high precipitation levels during phase S6. A change to peaty sediments and expansion of sclerophyll and rainforest gymnosperm taxa at the base of phase S5 provide clear evidence for reduced precipitation levels. A gradual increase in aquatic taxa through this phase demonstrates the expansion of vegetation over the site as sediments accumulated within the shallow lake basin. Subsequently, in phase S4, rainforest angiosperms with a similar composition to those in phase S6 expand again, but without a concomitant change in lake sediments. It is likely that accumulation of sediments almost up to the site outlet prevented re-establishment of deep, open water. However, a sharp reduction in aquatic taxa signals a return to shallow lake conditions. Extremely high pollen concentrations during this and the subsequent phase probably result from a combination of pollen being washed into the lake and very slow sediment accumulation. Evidence for a major gymnosperm period with Dacrydium as a major contributor is found in phase S3, before the sclerophyll dominated phase S2. Aquatic taxon values are generally higher again after phase S4, supporting the dry land pollen evidence for a reduction in precipitation, but the condensed nature
I "CHARCOAL CONCENTRATIONS > 1000)
J',igrains/cmJ
POLLEN CONCENTRATIONS (grains/cm 1 • 1000)
Palinae cl Archoniophoenix Araucnnai
RAINFOREST ANGIOSPERMS
RAINFOREST GYMNOSPERMS
Fig. 3 Selected attributes of the Strenekoff's Crater pollen diagram. Values for all taxa are expressed as percentages of total dry land pollen for the appropriate sample.
Pollen records from the Atherton and Western Plains provinces
293
of the record and lack of samples containing pollen prohibits any detailed interpretation. A narrow gypsum evaporite band within the sclerophyll phase indicates that conditions must have become very dry within phase S2, about 23,000 years ago.
places (most likely due to oxidation) suggest low and perhaps very variable precipitation as well as lower temperatures. Slightly higher pollen values of woody taxa and higher organic levels in phase W4 could indicate some climatic amelioration.
A return to wetter conditions is marked by a sharp increase in rainforest angiosperms, including Cunoniaceae, in phase SI, but unfortunately there is only one polleniferous sample. It is most likely that pollen in the overlying alluvial fan material has been oxidised.
Phase W6 is intermediate in character. There is variation in both the abundance and composition of woody and herbaceous taxa as well as in the sediments, but variations are not sufficiently consistent to allow any subdivision of the phase.
Charcoal is absent from much of the core but achieves consistently high values in the sclerophyll phase.
Lake Wangoom The major variation in dry land vegetation is between open herbaceous and woodland or forest communities. High proportions of pollen from woody plants together with high pollen concentrations and high dryland pollen diversity in phases W7, W2 and W1 indicate relatively dense tree covers in the vicinity of the site, probably under precipitation levels similar to those of today. Similar conditions are suggested by the organic nature of the sediments that would have accumulated under high lake levels. These three phases can be separated on their relative proportions of Casuarina and Eucalyptus, with the former dominating phase W2, the latter, W7, and the proportions being approximately equal in phase Wl. By contrast, high values for herbaceous taxa including Asteraceae that could have derived from either herb or small shrub taxa, low pollen concentrations and dry land diversity in phases W5-W2 indicate open herbaceous vegetation existing under harsh climatic conditions. High carbonate levels in the core, as a result of frequent drying or near drying of the lake, and the absence of pollen in many
Superimposed on the cyclical pattern of climatically induced changes is a gradual increase in Poaceae relative to Asteraceae. Within the latter taxon, Asteraceae B, a morphological form that is difficult to relate to any extant taxon (Martin 1986), undergoes the most marked decline and is not recorded at all in the most recent samples. Charcoal concentrations also appear to vary independently of climatic changes, and increase markedly at the base of phase W3. It is tempting to advocate Aboriginal people's activities as the cause of increased burning, as it is likely that they were present in the region by this time, and to consider that this burning may have had a major impact on the composition of the herbaceous vegetation. Finite radiocarbon dates extend through the core, but they are not of sufficient internal consistency to allow construction of a reliable time scale.
Lake Terang This sequence has been only partially analysed and little attempt has yet been made to examine those sections with very low pollen concentrations or the later part of the Holocene. Consequently, the diagram is subdivided largely on the presence or absence of data. On the assumption that low pollen concentrations indicate open herbaceous vegetation, as appeared to be the case at Lake
294
A.P. Kershaw, J.G. Baird, DM. D'Costa, P.A. Edney, J.A. Peterson & KM. Strickland
I Asteraceae B
I Astraceae A
I Poaceae
I Casuarina >28/x
I Eucalyptus Herbaceous Taxa Woody Taxa Organic Matter I Carbonate Inorganic Matter —i—i—i—i—i—i—i i—i—i—i—i—i—i—i—i—i—i—n '8 I § I § § § § I 1 § I § I § § § § § § Depth (m) i i i i i t i i £ 8 8 8 8 S §§ §8 Radiocarbon Dates 5 £ +1 3 +i +1 +g' +7 (years B.P.) 8 to S ii ^ S s s a1" s s S s §
Fig. 4 Selected attributes of the Lake Wangoom pollen diagram. Values for all taxa are expressed as percentages of total dry land pollen for the appropriate sample.
Pollen records from the Atherton and Western Plains provinces 295 in
to
PHASES
3
Pollen Concentration (cm 3 x 1,000)
rvi c iW^fh
_o No. Dryland Taxa
d
r-rT>rn
C
Asteraceae B
i l
L
_ Asteraceae A
Poaceae a
Casuarina <23n
PrTWTTTi
EH iM lib 8-j
5-
Casuarina >28/u
cA
- Eucalyptus
ffTTtWlVh
8 B Herbaceous Taxa
S i
Woody Taxa
°
™
Depth (m) Radiocarbon Dates (years B.P.)
Fig. 5 Selected attributes of the Lake Terang pollen diagram. Values for all taxa are expressed as percentages of total dry land pollen for the appropriate sample.
296
A.P. Kershaw, J.G. Baird, DM. D'Costa, P.A. Edney, J.A. Peterson & K.M. Strickland
Wangoom, four major oscillations in vegetation and presumably climate are recorded. Of the four polleniferous phases, only phase T3 shows a preponderance of woody taxon pollen, largely Eucalyptus. It is likely though, from a knowledge of all other diagrams in the region, that this phase will be similar to the unsampled later part of the Holocene. Only occasional samples of phases T7 and T5 show significant woody taxa representation, and these result from high values of Casuarina rather than Eucalyptus. They do not achieve the diversity levels of phase T3. Poaceae percentages are high in all analysed spectra but values for the other major herbaceous taxon, Asteraceae, generally decrease from phase T7 to Tl. Phase T1 is further characterised by an almost total absence of Asteraceae B while phase T7 is the only phase with significant levels of Casuarina 23 ^m, which is a morphological type with no known present day parent species (Singh & Geissler 1985; Dodson 1975). Radiocarbon dates show clearly that phase Tl is early Holocene in age while sediments below about 7 m depth are beyond the radiocarbon dating limit (Barton et al 1987). A number of dates within phase T3 fall between about 30,000 and 38,000 years BP (C. Radnell, pers. comm.), but these are not in an age sequence and therefore do not allow determination of a time scale for the core.
DATING AND COMPARISON OF SITE RECORDS There is a number of methods available for aging and stratigraphically comparing the records. These include biostratigraphic matching of pollen assemblages and indicator taxa, the use of absolute dates, comparison with more firmly-dated records of broad regional significance such as those from deep sea cores, and assessment of the status of phases in relation to formal Quaternary periods.
Biostratigraphic Correlation It was considered initially that correlation between sites lying close to each other within similar vegetation types should be relatively easy. However, it appears that there has been substantial spatial as well as temporal variation in vegetation. In the comparison of Strenekoff's and Lynch's Crater records, the sclerophyll dominated vegetation with high Casuarina, Eucalyptus and charcoal concentrations can be identified as phases S2 and L2 respectively, and presumably the adjacent phases SI and S3 from Strenekoff's can be correlated, at least in part, with phases LI and L3 in the Lynch's Crater diagram. A difficulty arises, though, with correlation of older phases. Is phase S4 equivalent to phase L4? If it is, then phase S5 can be correlated with phase L5 and phase S6 with phase L6. However, phase S4, with its high levels of Orania and Cunoniaceae, has much more in common with phase L6. The high levels of Palmae cf. Archontophoenix also indicate similarity with phase L8. It is clear then that there is no exact equivalent of phase S4. Because this phase portrays a much wetter vegetation assemblage than phase L4, and from the high pollen concentrations appears to have lasted for a longer period of time, the preferred temporal equivalent is the whole of the period represented by phases L6 to L8. In this case, phase S5 would broadly correlate with phase L9 and phase S6 with L10 and L l l . It is interesting to note, with this latter correlation, that both Orania and Palmae cf. Archontophoenix have high values at Strenekoff's Crater, while only Palmae cf. Archontophoenix is significantly represented at Lynch's Crater. It is difficult to understand why these two palm taxa should occur together at one site and appear to be mutually exclusive at the other. Perhaps they belong to different community types that are both well-represented around water bodies. Either both communities occurred around Strenekoff's Crater, but in different places, or water transport from significant inlet streams at this site was bringing pollen of one
Pollen records from the Atherton and Western Plains provinces of the taxa from a more distant streamside source. In the Western Plains diagrams, there is sufficient correspondence between phases T1 and W2 to indicate that they represent approximately the same time period. The next oldest phase with significant pollen representation at Lake Terang (T3) is very like phase W7, with a very high pollen component from woody taxa (mainly eucalypts), high pollen diversity and pollen concentrations and relatively low Asteraceae percentages. The higher Poaceae values in the Terang diagram are typical of the core as a whole. On the assumption that these correlations are correct, virtually the whole of phases W2 to W6 are not represented in the Terang core; either sediment did not accumulate or there have been major phases of erosion of accumulated sediments. It is not clear where the two pollen samples of phase T2 fit into the sequence, but they most likely belong to a period equivalent to phase W6 or W4. Phases T4 to T8 are likely to be beyond the sequence represented at Lake Wangoom. If it is assumed that accumulation rates decreased through time as the Terang basin became filled with sediment, the Terang record would still have covered at least twice the period represented in Lake Wangoom. The decline of Casuarina (23 /on) is a potential stratigraphic marker. At Lake George, an equivalent grain is the dominant woody pollen type during wet intervals until an estimated 200,000 years ago. Its decline could correspond with the reduction at the end of phase T7. On the other hand, the taxon attains high values until a much later time at Lake Leake (Dodson 1975) so that its decline is likely to have been markedly time transgressive. Radiocarbon dating The only absolute ages for the records are derived from radiocarbon dating. Dates from Lynch's and Strenekoff's Craters are consistent with correlations proposed on pollen grounds for the later parts of the sequences.
297
With the Western Plains sites, the dates strongly support the correlation between the Holocene phases T1 and W2 and the much older age for the Terang core. However, there is some conflict between the date of 43,000 years BP from the end of phase W7 and the dating range of 30,000 to 38,000 BP for phase T3, correlated on pollen data. It is possible but unlikely that all these dates are correct and that phase T3 does correspond with the part of phase W6 just before the date of 38,000 BP. The 15,300 year date on the Lake Wangoom record is obviously incorrect. The Late Pleistocene dates provide a means of correlating the Atherton and Western Plains sites. All Pleistocene dates younger than 26,000 years BP from Lynch's and Strenekoff's Craters fall into the sclerophyll period where climatic conditions are considered to have been most extreme. Similarly the date of 20,450 BP from Lake Wangoom is from within the latest Pleistocene dry phase. The older date of 22,130 BP, however, falls within a period of slightly wetter conditions. It could be that either the event did not occur in North Queensland or was of insufficient magnitude to produce any noticeable change in the regional vegetation. Alternatively, the date could be too young, as dates from a number of sites in the southeastern part of the continent suggest that the last dry period began between about 26,000 and 22,000 years ago (Kershaw 1987). Any belief that this date is too young will affect interpretations based on the older dates from this sequence. Comparisons with the Deep Sea Core Stratigraphy Oxygen isotope records from ocean sediments have been used in a number of studies to help date and interpret long terrestrial pollen sequences. It is considered that, for many parts of the globe, changes in sea level and sea surface temperatures evidenced in deep sea core records have had parallels on land in terms of air temperatures and precipitation levels. Consequently, it is valuable to compare inferred climatic changes from land
298
A.P. Kershaw, J.G. Baird, D.M. D'Cost a, P. A. Edney, J. A. Peterson & K.M. Strickland
records with those deduced from deep sea cores. In northeastern Queensland, the close relationship between ocean and land conditions was proposed by climatic modelling (Nix & Kalma 1972), and correlations were strongly supported by independent dating of the Lynch's Crater record. It is inferred that this record extends back to the penultimate interglacial period. From the nature of the Strenekoff's record, it is quite likely that this sequence extends back at least as far. In southeastern Australia, a close correspondence has been proposed between the deep sea core records and the record from Lake George (Singh & Geissler 1985). This correlation is supported in general terms by results from palaeomagnetic analyses. The Lake Wangoom record is clearly cyclical and could embrace the last glacial - interglacial cycle. Phase W7 could correspond with oxygen isotope stage 5e, the height of the last interglacial, with phase W6 equivalent to the remainder of stage 5. This cannot be further differentiated. Phase W4 could be equivalent to the major interstadial of stage 3 separating the earlier part of the glacial (phase W5 or stage 4) from the later part of the glacial (phase 3 or stage 2). Phases W1 and W2 clearly correlate with the present interglacial. An alternative scenario is that phase W7 is an interstadial within the last glacial period and that there is no obvious equivalent of phase W4 in the more condensed deep sea records. As with Lake Wangoom, the phases of high pollen concentration in the Lake Terang sequence could represent interstadials or interglacials; in the latter case the record could extend as far back as stage 10 that occurred around 350,000 - 400,000 years ago. Definition of 'Interglacials' and 'Interstadials' A major problem in the establishment of chronologies and correlations with deep sea cores is the determination of the status of phases close to or beyond the limit of radiocarbon dating that exhibit peaks in vegetation development and climatic amelioration. Are
these equivalent to 'interglacials' or 'interstadials'? There has been much debate about the definition of these terms (e.g. McGlone 1985; Suggate 1965; West 1961, 1984; Zagwijn 1957), but some consensus that an interglacial phase is one in which climate ameliorated and vegetation developed to at least the levels achieved during the Holocene, while an interstadial is too short or climatic amelioration is insufficient to allow full expression of Holocene vegetation. From the southeastern Australian records it appears that phases W7 and T3 would qualify as interglacials while phases T5 and T7, with lower values for woody plants and relatively low taxon diversity, are more likely to be regarded as interstadials. In northeastern Australia, the very high rainforest angiosperm values in phases S4, S6, L8 and Lll would probably also qualify as interglacials. However, the evidence for amelioration is based largely on precipitation levels in all records, while temperature is the critical parameter for definition of these periods in traditional areas of investigation that have experienced glaciation. Furthermore, there are marked differences in the composition of inferred vegetation between the Holocene and earlier periods of suggested similar status in some records. This is particularly true of Lake Wangoom, where the understorey of the last 'interglacial' vegetation was dominated by Asteraceae while the Holocene had a predominantly grassy understorey. The explanation for this difference may be climatic; alternatively it may have resulted from the increased burning, possibly anthropogenic, that occurred between the two periods. GENERAL DISCUSSION AND CONCLUSIONS All records show marked changes in the distribution of vegetation as a result of climatic variation through the recorded periods. However, correlations are made difficult by increasingly condensed and intermittent records for some sites, as sediments
Pollen records from the Atherton and Western Plains provinces accumulated towards maximum attainable levels, and by spatial variation in pollen assemblages. With Lake Wangoom, it is difficult to determine whether the record extends back to the last interglacial or to a major interstadial within the last glacial period. Resolution of this dilemma depends basically on a belief either in older radiocarbon dates or in comparison with deep sea core records. There is a close relationship between patterns of change in deep sea core records and precipitation levels inferred from sites from the southern margins of Australia for the Late Quaternary. Dry land conditions around the height of the last glacial, when sea surface temperatures and sea levels would have been at their lowest, were very dry while the Holocene, with higher sea surface temperatures and sea levels, became progressively more humid during the post-glacial marine transgression. For the earlier part of the last glacial - interglacial cycle though, the continuation of such a clear relationship has yet to be demonstrated. Indeed, Singh and Geissler (1985) consider for Lake George that the maximum extent of mesic vegetation and therefore highest effective precipitation for the last glacial - interglacial cycle was during a major inter stadial and not during the present or last interglacial periods. However, the whole dating of the Lake George sequence has come under question (Wright 1986), and prior to the last interglacial Singh and Geissler are happy to assume a simple cyclical pattern of wet interglacials and dry glacials. Colhoun et al (1977, 1982) and van de Geer et al (1986) faced a similar dilemma in interpreting the very condensed northwestern Tasmanian records as we faced in interpreting the Lake Wangoom record. With Pulbeena Swamp, they originally opted for a long time scale (Colhoun et al 1977), but subsequently changed it from about 140,000 to about 65,000 years BP after the receipt of additional enriched dates. However, the final estimation of the age of the sequence appears to have had little to do with the radiocarbon dates, many
299
of which are considered to have been contaminated and are stratigraphically inverted. Even with the sedimentological record at Lake Mungo in western New South Wales (Bowler 1973), one of the most heavily dated sequences in the world, it is now considered that the radiocarbon timescale is an underestimate of the true age of the sequence (Bowler 1987). Similar concerns have been expressed about the dating of long pollen sequences in New Zealand by Moar and Suggate (1979) and McGlone (1985, pers. comm.) who feel that all finite dates beyond about 25,000 years BP must be treated with great caution. Here, it is much easier than it is in Australia to separate interglacial and inter stadial periods, because there is a clearer response of vegetation to temperature variations and there is no evidence for the presence of people during the 'climatic optimum' of the Holocene to complicate comparisons of the vegetation of this period with that of early phases of amelioration. In addition, independent dating controls are provided by direct relationships to sea level in coastal sites, as well as the presence of tephra bands and application of the amino acid racemisation dating. A further problem with Australian sites is assessment of the degree to which records may be incomplete, particularly those that are very condensed. Soil horizons have been identified in the Lake George core but these have not been considered to represent significant hiatuses in sediment accumulation (Singh et al 1981). A comparison of the Lake Wangoom and Lake Terang cores does illustrate the marked differences that can occur in net sediment accumulation, even in basins with very similar characteristics and apparent age. Here it is considered that phase T2, covering about 3 m, is equivalent to phases W6 - W3 that cover some 16 m. Based on this discussion, the preferred relationships of phases from each of the diagrams are shown in relation to the deep sea core stratigraphy on Table 1. Phases T5-T8 of Lake Terang are excluded from this summary, as their possible status is particularly difficult to determine at the present stage of analysis.
300
A.P. Kershaw, J.G. Baird, D.M. D'Costa, P.A. Edney, / . A Peterson & KM. Strickland
Deep sea core stratigraphy (stages)
1
2
3
4
5a-d
5e
6
7
Lynch's Crater (phases)
LI
L2-3
L4
L5
L6-7
L8
L9-10
Lll
Strenekoff's Crater (phases)
SI Wl-2
S2-3
S3
S5
S6
W3
W4
Lake Wangoom (phases) — option 1 Lake Terang (phases) — option 1
T1
Lake Wangoom (phases) — option 2
Wl-2
W3-6
W7
Lake Terang (phases) — option 2
T1
T2
T3
S4 W5 T2
W6
W7 T3
T4
T4
Table 1 Relationships between phases of the pollen diagrams from the Atherton and Western Plains volcanic provinces and the deep sea core stratigraphy. ACKNOWLEDGEMENTS We thank Eric Colhoun and Geoff Hope for very helpful criticisms on an earlier version of the manuscript, and Gary Swinton and Sue Tomlins for drafting the figures. REFERENCES BARTON C.E., CHIVAS A.R. & COWLEY J. 1987. Palaeomagnetism of cores from Lake Terang. SLEADS Workshop 87. Arid Zone Hydrology, Geochemistry, Stratigraphy and Palaeoenvironments. Australian National University. BOWLER J.M. 1973. Clay dunes: their occurrence, formation and environmental significance. Earth Science Reviews 9, 315-338. BOWLER J.M. 1987. Late Pleistocene high rainfall: dating and seasonality implications. CLIMANZ III Extended Abtracts. Melbourne University. COLHOUN E.A., VAN DE GEER G. & MOOK W.G. 1977. Pulbeena Swamp, northwestern Tasmania: stratigraphy and pollen analysis. X INQUA Congress Abstracts. Birmingham. COLHOUN E.A., VAN DE GEER G. & MOOK W.G. 1982. Stratigraphy, pollen analysis, and paleoclimatic interpretation of Pulbeena Swamp, northwestern Tasmania. Quaternary Research 18, 108-126. DODSON J.R. 1974. Vegetation and climatic history near Lake Keilambete, Western Victoria. Australian Journal of Botany 22, 709-717. DODSON J.R. 1975. Vegetation history and water level fluctuations at Lake Leake, southeastern
South Australia: II. 50,000 to 10,000 BP. Australian Journal of Botany 23, 815-831. DODSON J.R. 1977. Late Quaternary palaeoecology of Wyrie Swamp, southeastern South Australia. Quaternary Research 8, 97-114. KERSHAW A.P. 1976. A late Pleistocene and Holocene pollen diagram from Lynch's Crater, northeastern Queensland, Australia. New Phytologist 77, 469-498. KERSHAW A.P. 1978. Record of last interglacialglacial cycle from northeastern Queensland. Nature 112 159-161. KERSHAW A.P. 1980. An extension of the late Quaternary vegetation record from northeastern Australia. 4th Palynology Conference, Lucknow 3, 28-35. KERSHAW A.P. 1984. Late Cainozoic plant extinctions in Australia. In Martin P.S. & Klein R.G. eds. Quaternary Extinctions: A Prehistoric Revolution, pp. 691-707. University of Arizona Press, Tucson. KERSHAW A.P. 1986. The last two glacialinterglacial cycles from northeastern Australia: implications for climatic change and Aboriginal burning. Nature 322, 47-49. KERSHAW A.P. 1987. A comparative history of the vegetation of southeastern Australia and New Zealand. In Conacher A. ed. Readings in Australian Geography, pp. 433-445. Institute of Australian Geographers and Department of Geography, University of Western Australia, Perth. MARTIN A.R.H. 1986. Late glacial and Holocene alpine pollen diagrams from the Kosciusko National Park, New South Wales, Australia. Reviews of Palaeobotany and Palynology 41, 367-409. y
Pollen records from the Atherton and Western Plains provinces
301
McGLONE M.S. 1985. Biostratigraphy of the last interglacial-glacial cycle, southern North Island, New Zealand. In Pillans B. ed. Proceedings of the Second CLIMANZ Conference, pp. 17-31. Geology Department, Victoria, University of Wellington.
SUGGATE R.P. 1965. The definition of interglacial'. Journal of Geology 73, 619-626.
MOAR N.T. & SUGGATE R.P. 1979. Contributions to the Quaternary history of the New Zealand flora 8. Interglacial and glacial vegetation in the Westport District, South Island. New Zealand Journal of Botany 17, 361-387.
VAN DE GEER G., COLHOUN E.A. & MOOK W.G. 1986. Stratigraphy, pollen analysis and palaeoclimatic interpretation of Mowbray and Broadmeadows Swamps, northeastern Tasmania. Australian Geographic 17, 121-133.
NIX H.A. & KALMA J.D. 1972. Climate as a dominant control in the biogeography of northern Australia and New Guinea. In Walker D. ed. Bridge and Barrier: the Natural and Cultural History of Torres Strait, pp. 61-92. Department of Biogeography and Geomorphology Publication BG/3, Australian National University, Canberra.
WEST R.G. 1961. Interglacial and interstadial vegetation in England. Proceedings of the Linnean Society of London 172, 81-89.
SINGH G. & GEISSLER E.A. 1985. Late Cainozoic history of vegetation, fire, lake levels and climate at Lake George, New South Wales, Australia. Philosophical Transactions of the Royal Society of London B, 311-447. SINGH G., OPDYKE N.D. & BOWLER J.M. 1981. Late Cainozoic stratigraphy, palaeomagnetic
chronology and vegetation history from Lake George, Australia. Journal of the Geological Society of Australia 28, 435-452.
WEST R.G. 1984. Interglacial, interstadial and oxygen isotope stages. Dissertatienes Botanicae 72. (Festschrift Welten), 345-357. WILLIS J.H. 1964. Vegetation of the basalt plains in Western Victoria. Proceedings of the Royal Society of Victoria 77, 397-418. WRIGHT R. 1986. How old is Lake George? Archaeology in Oceania 21, 138-139. ZAGWIJN W.H. 1957. Vegetation, climate and time - correlations in the early Pleistocene of Europe. Geologie en Mijnbouw 19, 233-244.
Pleistocene dates for volcanic activity in Western Victoria and implications for Aboriginal occupation L. HEAD , D. D* COSTA AND P. EDNEY 1
2
2
department of Geography, University of Wollongong, P.O. Box 1144, Wollongong, New South Wales 2500, Australia. Department of Geography and Environmental Science, Monash University, Clayton, Victoria 3168, Australia.
2
The eruptions of Tower Hill and Mt Eccles have long been thought to date the most recent phase of volcanic activity in Victoria. That may still be the case, but the presumed Holocene dates for these events have now been shown to be too young. The Mt Eccles lava flow had blocked drainage in Darlot Creek by 27,000 BP and volcanic activity at Tower Hill had ceased by around 20,000 BP. We explore some preliminary implications of this information for the prehistory of the area, including the reconsideration of several sites associated with the volcanic deposits. Key words: archaeological sites, radiocarbon dating, volcano, western Victoria. INTRODUCTION
The eruptions of Tower Hill and Mt Eccles have long been thought to date the most recent phase of volcanic activity in Victoria. Separate projects in which we are involved have demonstrated that the presumed Holocene dates for each of the sites are too young. In this paper we review previous dating and demonstrate that more reliable dating indicates Late Pleistocene eruptions. We discuss the implications for archaeological sites thought to be associated with the volcanic deposits. The paper concludes with a general examination of the positive and negative outcomes of volcanic activity for the Aboriginal inhabitants of the area. MT ECCLES Previous Dates
The Lake Condah/Condah Swamp system has been a focus of interest for evidence it offers of volcanic activity associated with nearby Mt Eccles and Mt Napier, as well as the complex of Aboriginal fish traps and stone houses around the lake margins (Coutts et al 1978; Wesson 1981). A major aim of a stratigraphic and palynological study now in progress is to examine conditions leading up to and following establishment of the traps. 302
In the process, new light is being shed on the age of the system as a whole. In 1969, Gill and Gibbons reported a date of 6,235 ± 120 BP on peaty sediments overlying basalt in Condah Swamp. Together with a date of 7,240 ± 140 BP for basal peat in Buckleys Swamp, east of Mt Napier (Gill & Elmore 1973), this was interpreted as evidence of Mt Napier and Mt Eccles having erupted around the same time (Gill 1978). Gill and Gibbons (1969) did not give the location of the Condah sample with any precision, but Gill later described it as from "Condah Swamp at Breakaway Creek" (1978, 56). He was not sure whether the basalt underlying this particular sample had flowed north from Mt Eccles or west and south from Mt Napier, but considered the former more likely due to the high gas/lava ratio. In a postscript to the 1978 paper, Gill reported a new date from Ettrick, further south, where basalt was found to overlie a river bed dated at 19,300 BP. He summarised the implications of this as indicating three ages of volcanic materials (Gill 1979): 1) About 19,000 BP, lava from Mt Eccles flowed out onto the then dry continental shelf.
Pleistocene dates for volcanic activity in Western Victoria 2) An (unexplained) maghemite date on tuff near Macarthur suggests that a vent ejected volcanic ash over the Mt Eccles-Macarthur district at about 15,000 BP. 3) About 7,000 BP, Mt Napier extruded lava that ran down the Harman Valley to Condah Swamp. The scoria cone of Mt Eccles was built about the same time. Oilier (1981) confirmed the earlier eruption with a minimum date of 19,750 BP and 'apparent' age of 28,750 + 11,700 - 4,600 BP for a buried soil in the Mt Eccles quarry. He ventured two possible explanations: (i) that there was one main eruption around 20,000 BP, the younger dates being spurious or requiring a more complex explanation; or (ii) there could have been two main periods of eruption, at about 20,000 and 7,000 years ago. He argued that: Mt Eccles itself, that is the large scoria cone, is older than Mt Napier. Little Mt Eccles and the upper part of the Tyrendarra flow could be younger (Oilier 1981, 199). The fish traps themselves, like similar systems elsewhere, offer little in the way of dateable material. Most hypotheses have rested on the presumed age of their geomorphological setting, and/or correlation with social changes thought to be associated with fish trap use. Coutts et al (1978, 34) argued that, since the Condah structures are free of ash, they 4 'must post-date the eruption of Mt Eccles during the Late Pleistocene or possibly even more recently." They also suggested that the absence of inland western Victorian sites older than 3,500 BP might provide a maximum age, and that since many are well-preserved, they may be of late prehistoric origin. New Dates In January and February 1986, cores were taken from eleven sites in the Condah system (Fig. 1), using a combination of the Missen
303
hydraulic sampler (Missen 1986) and a Dsection hand corer. The stratigraphy is not discussed in detail here, since radiocarbon dating is not yet complete and it is the basal dates which are of greatest relevance. The topography of the underlying basalt is quite variable, resulting in accumulated sediment with a range of depths. In Condah Swamp, several metres of clayey lake mud are overlain by about a metre of peat. In several cores the transition to peat is dated to between 8-9,000 BP. The oldest date for Condah Swamp proper is at CS5, where near-basal (450-470 cm) lake muds date at 26,240 ±480 BP (SUA-2587). In Whittlebury Swamp (WS1), a semifibrous peat layer underneath lake mud gives a date of 27,510 ± 240 BP (SUA-2583) at 340-350 cm. The pattern of sedimentation within the Lake Condah embayment also indicates clayey lake muds undergoing a (more gradual) transition to peat, but the dating is quite different. Near-basal sediments from LClb (250-258 cm) are dated at 8,110 ± 470 BP (SUA-2506). These dates negate the suggestion of an Eccles eruption around 7,000 BP and lend support to the first of Ollier's (1981) hypotheses, namely, one main eruption sometime before 20,000 BP. There appears to be a drainage divide between the swamp and the lake which was not breached until shortly before 8,000 BP, at which time sediments began to accumulate in the lake. Gill and Gibbon's 6,000 BP date for Breakaway Creek is not surprising given the unevenness of the underlying basalt (sediment depth varies by at least 4 m between sites quite close to each other) but it is clearly not representative of the whole system. TOWER HILL Previous Dates Coutts (1981) and Edney et al (1985) review the Holocene dates associated with ash
304
L. Head, D. D'Costa & P. Edney
Fig. 1 Condah area and location of core sites.
Pleistocene dates for volcanic activity in Western Victoria
presumed to be derived from Tower Hill, 12 km west of Warrnambool. Despite several other disputed dates, it was widely accepted that the volcano erupted between about 6,600 and 8,700 BP. This is based on Gill's dates of 6,500 ± 200 BP from marine shells of the Pertobe Coquina, all overlying tuff (Gill 1967; Coutts 1981). A laminated mammillary calcrete, dated by Gill at 8,700 BP at Dennington, was presumed to be the same age as calcrete underlying the tuff (Coutts 1981). Thermoluminescence dates on the scoria from the Tower Hill cone complex do suggest an older age for volcanic activity (Mortlock 1977), but these have not been regarded as reliable because they make the scoria appear to predate the ash and this is inconsistent with the geological evidence (Coutts 1981). (Edney et al 1985, 302.) One of the questionable dates, on bone from Bushfield (Gill 1953,1967; Coutts 1981), is of interest here not because of its age (the date of 6,605 ± 190 BP was considered
unreliable by both Gill and Coutts) but because it was said to come from an archaeological site below the tuff. Gill (1953) reports two exposures of stone tools in association with a faunal suite including dingo, both mixed with tuff and overlain by several feet of it. New Dates Coring in the main maar lake and the scoria cone craters has been undertaken in recent years by members of the Monash Geography Department. A major focus of this work has been palaeoecological (including pollen, ostracod and diatom) analyses, and individual references should be consulted for the results of this work. Only radiocarbon dates are discussed here. The first attempts at direct dating of Tower Hill were made by Edney (1984). Sediments overlying dolomite in the main maar lake dated at 11,400 ± 200 BP (ARL-159) (Fig. 2). Doubts about contamination from carbonates were resolved by pollen analysis of the core
18,330
Roads Spring
±260bp
•
on organic fraction
Core sites
23,260 ±2540bp on carbonate fraction
11.400 ± 200bp
9980 ±140bp
Fig. 2 Tower Hill area and location of core sites.
305
Contour interval 25m. 0
1
500m.
1
306
L. Heady D. D'Costa & P. Edney
which indicated a characteristically open Pleistocene vegetation at the base, and a date of 9,980 ± 140 BP (Beta - 9902) on organic sediments from Yatt Mirng Crater (Edney et al 1985). D'Costa (1986) presented dates on the organic and carbonate fractions of North West Crater sediments of 18,330 ± 260 BP (Beta 16156) and 23,260 ± 2,540 BP (Beta 16155) respectively. Edney et al (1985, 303) concluded that 'final volcanic activity - scoria cone formation - was completed by the beginning of the Holocene period." They saw the younger dates as the result of contamination by young carbonates, or as associated with reworked rather than in situ tuff. 4
The North West Crater dates permit the further conclusion that final volcanic activity was in fact complete by about 20,000 BP, since scoria cone formation would take place over a period of weeks or months rather than thousands of years (B. Joyce, pers. comm.). In this context, the 11.4 ka and 9.9 ka dates represent the later onset of organic sedimentation rather than minimum dates for later volcanic activity. IMPLICATIONS FOR PREHISTORY Ultimately the implications of this evidence for interpretations of the archaeological record must be assessed at the level of individual sites. Volcanic activity generally, and that of these two areas in particular, has ramifications that can be positive and negative over a range of timescales for the Aboriginal inhabitants, and we outline these in conclusion. A number of archaeological sites, lying above or below the Tower Hill tuff, have been used in conjunction with the geological evidence to define the temporal limits of the eruption. While the limitations of those dates have been discussed above, the more specific implication here is the considerably greater antiquity that can now be given to sites unequivocally in or below the tuff.
The sites mentioned below do not fulfill that criterion but, as they were first reported a number of decades ago, they may warrant reexamination. However, the possibilities of reworked tuff, re-deposited archaeological material and incorrect faunal identifications must all be considered. At Bushfield, Gill (1953) reported stone and bone artefacts coming from in or under the tuff, as well as a faunal suite supposed to include dingo (Canis familiaris). He also reported archaeological deposits around Lake Colongulac, associated with tuffs considered to be older than Tower Hill. Wider Implications Evidence of increasing numbers of archaeological sites in the Late Holocene, and associated inferences of population increase and social change (e.g. Lourandos 1983; Ross 1985; Williams 1987), have been widely treated with caution due to the possibilities of erosion, burial or other destruction of earlier sites over time. While site destruction must still be taken into account, it is clear that the land surface in at least the Eccles - Tower Hill region, and possibly more widely, is older than has been thought. Support is lent to the idea that the lack of early Holocene sites is a real phenomenon. Since the disparity between Pleistocene and Holocene environments is exacerbated by placing volcanic activity into the former, some contributing factors to the apparent dearth of Latest Pleistocene - Early Holocene sites also emerge. Not only was the Pleistocene cold and dry by comparison with the warmer wetter Holocene, but substantial areas would have been disturbed, if only temporarily, by ash falls and lava flows. In this respect it is necessary to differentiate between the lava flow of Mt Eccles, forming stony rise country, and the ash deposits of Tower Hill, on which soil development would have been more rapid and fertile. Reestablishment of plant and animal communities would have been much quicker on
Pleistocene dates for volcanic activity in Western Victoria
the latter, although on both surfaces it would be slower under the harsh Pleistocene conditions than later. Pollen evidence from Tower Hill indicates very open vegetation until about 11,000 BP, when woody taxa increased substantially (Edney 1984; D'Costa 1986). Nevertheless, the implications are not all negative. If the Aboriginal economy was geared to open conditions anyway, such as through focusing on herbivorous megafauna, the effects of volcanic activity may have been localised and short-term. The extent of such dependence in Australia is still a matter of debate, with little clear evidence of large animals having been important food sources. More importantly, Pleistocene volcanism created a new landscape that set the scene for the warmer, wetter conditions of the Holocene. Over large areas of western Victoria, the Condah system providing perhaps the most spectacular example, drainage systems were blocked by volcanic deposits, creating extensive and resource-rich wetlands. Many of the most interesting archaeological sites in the region, including the fish traps, canals and earth mounds, are focused around these wetlands, and the dating of their establishment is crucial to understanding the resource management strategies that were adopted at various times. ACKNOWLEDGEMENTS The Condah work is being carried out with financial support from ARGS and the AIAS. We thank John King and family for assistance at Lake Condah, and the Department of Conservation, Forests and Lands for access to Tower Hill. We thank many members of the Monash Geography Department for assistance of various kinds, particularly Peter Kershaw, Jim Peterson, Peter Gell, Jenny Baird and Jack Missen. Participants in the 1987 Cainozoic conference, particularly Bernie Joyce, provided valuable discussions. Richard Miller prepared the diagrams and Hilde Shaw typed the text.
307
REFERENCES COUTTS P.J.F. 1981. Coastal archaeology in Victoria; Part 2: Adaptation, technology and volcanism. Royal Society of Victoria Proceedings 93, 15-22. COUTTS P.J.F., FRANK R. & HUGHES P. 1978. Aboriginal engineers of the Western District. Records of the Victorian Archaeological Survey 7. D'COSTA D.M. 1986. Local and regional palaeoenvironments from Tower Hill, western Victoria. B.A. (Hons) thesis, Department of Geography, Monash University, Melbourne (unpublished). EDNEY P.A. 1984. A palaeoenvironmentalstudy of Tower Hill, western Victoria. B.A. (Hons) Thesis, Department of Geography, Monash University, Melbourne (unpublished). EDNEY P., KERSHAW A.P., PETERSON J.A. & COUTTS P.J.F. 1985. Evidence of a Pleistocene age for Tower Hill, western Victoria. Search 16, 302-303. GILL E.D. 1953. Geological evidence in western Victoria relative to the antiquity of the Australian aborigines. Memoirs of the National Museum of Victoria 18, 25-92. GILL E.D. 1967. Evolution of the Warrnambool - Port Fairy coast and the Tower Hill eruption, western Victoria. In Jennings J.N. & Mabbutt J.A. eds. Landform Studies from Australia and New Guinea, pp.340-64. Australian National University Press, Canberra. GILL E.D. 1978. Radiocarbon dating of the volcanoes of western Victoria, Australia. Victorian Naturalist 95, 152-158. GILL E.D. 1979. The Tyrendarra lava flow, western Victoria, Australia. Victorian Naturalist 96, 227-229. GILL E.D. & ELMORE L.K.M. 1973. Radiocarbon dating of Mt Napier eruption, western Victoria, Australia. Victorian Naturalist 90, 304-306. GILL E.D. & GIBBONS F.R. 1969. Radiocarbon date related to vulcanism and lake deposits in western Victoria. Australian Journal of Science 32, 109-110. LOURANDOS H. 1983. Intensification: a late Pleistocene-Holocene archaeological sequence from southwestern Victoria. Archaeology in Oceania 18, 81-97. MISSEN J. 1986. A portable device for continuous sampling in soft sediments. Working Paper No. 22,
308
L. Head, D. D'Costa & P. Edney
Department of Geography, Monash University, Melbourne. MORTLOCK A.J. 1977. Progress in thermoluminescence dating. Memoirs of the Victorian Archaeological Survey 1, 10-17. OLLIER C.D. 1981. A buried soil at Mt Eccles, western Victoria, and the date of eruption. Victorian Naturalist 98, 195-199. ROSS A. 1985. Archaeological evidence for
population change in the middle to late Holocene in southeastern Australia. Archaeology Oceania 20, 81-89. WESSON J.P. 1981. Excavations of stone structures in the Condah area, western Victoria. MA (Prelim.) Thesis, Division of Prehistory, LaTrobe University, Melbourne (unpublished). WILLIAMS E. 1987. Complex hunter-gatherers: a view from Australia. Antiquity 61, 310-321.
The geology and geochemistry of Mt Napier and Mt Rouse, western Victoria P.W. WHITEHEAD Department of Geology, James Cook University, Townsville, Queensland 4811, Australia. Mt Napier and Mt Rouse are two volcanic centres of Holocene and Pleistocene age respectively, situated about 250 km west of Melbourne, and are part of the Newer Volcanics of Victoria. They are very well-preserved, which has enabled a correlation to be made between the geochemical characteristics of their flows and their relative chronology, based on the stratigraphic succession of the flows. Tumuli, lateral barriers, lava caves and tunnels, spatter ramparts and cinder cones are particularly well-developed and preserved around Mt Napier. The Mt Napier volcanics consist of a co-magmatic series of alkalic flows that are related by crystal fractionation. Crystal fractionation models show that the latest eruptives can be derived by the fractionation of 6% olivine, 5°/o clinopyroxene and 0.5% magnetite from the melts represented by the earliest flows. The Mt Rouse volcanics are from a more heterogeneous source and have been produced by a combination of varying amounts of partial melting and crystal fractionation. The resulting trends in major and trace elements are opposite to those of Mt Napier for the earlier flows, but the later flows have similar trends to the Mt Napier samples. Geochemical and isotopic evidence indicates that the earliest flows from Mt Rouse are transitional between the tholeiitic plains basalts and the later alkalic flows surrounding Mt Rouse. Key words: fractionation, Mt Napier, Mt Rouse, Newer Volcanics, partial melting, volcanic landforms.
INTRODUCTION The Newer Volcanics of western Victoria cover over 15,000 km (Fig. 1). Volcanic activity was of the areal type, with numerous, small, short-lived central type volcanoes of basaltic composition. Eruption centres are numerous, with around 400 centres of eruption having been recorded. Some of these eruption centres have small parasitic vents associated with them. The Newer Volcanics include some of Australia's most recently active volcanism, with several centres having been dated as late Quaternary (Gill 1978; Head et al, this volume). Mt Napier and Mt Rouse are of Holocene and Pleistocene ages respectively. The young ages of these centres, and consequent good preservation of their flows has enabled the determination of a flow succession for each centre. This sequence was then compared to the geochemical characteristics of the flows to assess the evolution of the magmas. Both
volcanoes are of geomorphological interest, with Mt Napier, in particular, showing welldeveloped and preserved volcanic landforms.
2
309
MT NAPIER Volcanic Landforms The main scoria cone of Mt Napier rises 150 m above the surrounding plains, at an average slope of approximately 35 Its summit altitude of 440 m makes it the highest point on the Western District Plains. The main crater at the summit is about 50 m in diameter and 20 m deep, with a small hump in the centre, and is breached to the northwest. Several less well-defined overlapping craters, slightly smaller in size, occur to the north and east of the main crater. On the western rim of the main crater is an excellently preserved spatter rampart. This is about 30 m long and 5 m high, and consists of small scoriaceous fragments up to 15 cm
310
P.W. Whitehead
across welded by smaller blobs of spatter. On the crater side of the spatter rampart, flow structures show the spatter flowing back into the crater, indicating the relatively low viscosity of this material. Several smaller cones less than 30 m high surround the main scoria cone. These generally consist of low circular mounds of scoria enclosing a crater 20-30 m in diameter that descends to the level of the surrounding basalt/scoria. Brief descriptions and locations of the many interesting volcanic features immediately surrounding Mt Napier are given by Gill and Elmore (1974). To the west of Mt Napier, lava flowed for over 15 km down the Harman Valley and many features associated with the flow of pahoehoe lavas can be observed in this flow. The flow is over 30 m thick (Oilier & Brown 1964). No surface streams have developed on the flow, and no lateral streams have
developed at the edges of the flow. This is partly due to the fact that the Mt Napier eruptions apparently occurred only 7240 years BP (Gill & Elmore 1973), and partly to the fact that the bulk of the Mt Napier volcanics have blocked the main drainage into the valley. Spectacular tumuli and lava caves occur along the flow and are described by Oilier (1964) and Oilier and Brown (1964). Two types of pressure ridges have been described on the Harman Valley flow. Lateral barriers are elongate ridges running parallel to the direction of the lava flow. They are considered to have been formed by: (i) central lava flow pressure buckling the semi-molten edges of the lava flow; and (ii) central lava withdrawal leading to the sagging of the edges (Oilier 1967). Lateral barriers are thus often found in pairs representing the edges of individual lava flows. The lateral barriers of the Harman Valley flow are around 100 m long
Fig. 1 Distribution of the Newer Volcanics of western Victoria, showing the extent of the Mt Napier and Mt Rouse flows.
Geology and geochemistry, Mt Napier and Mt Rouse
and rise to about 3-6 m above the level of the flow. They are invariably breached at the top, as a result of fracturing of the lava layers during buckling of the barriers. A transverse barrier, known as The Great Barrier', has also been described (Skeats & James 1937). Its formation was originally attributed to the solidification of the front of a flow prior to lava escaping from the base at the front of a flow. Subsequent references to this feature have accepted this explanation (Oilier & Joyce 1964; Oilier 1967). The 'Great Barrier' resembles a lateral barrier, but runs across the valley for some 300 m rather than parallel to it, and is associated with a large depression some 140 m wide and 15 m deep. The barrier is curved downstream (westwards) and is situated where the broad flows surrounding Mt Napier become restricted to the Harman Valley (Fig. 2). Rather than a transverse barrier representing the toe of a flow, the 'Great Barrier' is here believed to be a
311
lateral barrier formed when a lava flow from the east turned abruptly south to flow down the Harman Valley, exerting pressure on the western edge of the flow as it did so. This explanation would account for: the tapering of the barrier in the north-east to the level of the surrounding basalts; the western slopes of the depression being considerably steeper than the eastern slopes; the lack of a barrier to the east; and for the abrupt bend and termination of the barrier to the south. Relative Stratigraphy The flows surrounding Mt Napier can be subdivided into three main groups (Fig. 3): (i) pahoehoe flows; (ii) stony rise flows; and (iii) plagioclase-rich flows. Pahoehoe flows occur around the edges of the basaltic apron surrounding Mt Napier and are the oldest of the Mt Napier volcanics. Surface features are well-preserved in many places, and fine-scaled pahoehoe textures with
Fig. 2a Sketch map of the 'Great Barrier' showing its position in relation to the Harman valley and the associated lava caves. Dotted arrows indicate the proposed direction of flow of the lava that formed the barrier.
312
P.W. Whitehead
Fig. 2b Approximate cross-section through the 'Great Barrier* at the position indicated in Figure 2a. Vertical scale in metres above or below the level of the Harman Valley basalt flows.
Fig. 3 Distribution of the three groups of flows that were distinguished at Mt Napier.
Geology and geochemistry, Mt Napier and Mt Rouse
ropy ridges 1-2 mm high can occasionally be found. Lineated vesicles are frequent and attest to the fluid nature of the flows. The pahoehoe flows attain their greatest extent along a SW-NE trend, where they occupy palaeo-drainage channels. Where the flows have not been restricted to pre-existing valleys, they grade into the surrounding plains, rather than ending in an abrupt flow-edge scarp as is common elsewhere around both Mt Napier and Mt Rouse. The stony rise flows overlie the pahoehoe flows, and form well-defined ridges that are limited to a radius of about 5 km from the central cone of Mt Napier. In some places, an 'aa' structure is preserved with outcrops being comprised of small, clinker-like blocks. It appears that these flows result from lavas that had lost volatiles, or that flowed at lower temperatures and were thus more viscous than the pahoehoe flows and covered a relatively limited area. The plagioclase-rich flows are the youngest of the Mt Napier basalts. They are characterised by the presence of small plagioclase laths 1 mm to 3 mm long. These flows are restricted to basaltic layers found adjacent to the scoria cones and to flows that can be traced back to the breach of the summit crater of Mt Napier. The plagioclase-rich flows generally form quite well-defined ridges that can be easily traced in the field or on aerial photographs. The development of such ridges away from the vents suggests that these are 'aa' flows, and may indicate lower temperatures or lower volatile contents after volatiles had been lost around the scoria cones. A thin but extensive scoriaceous cover overlies much of the plagioclase-rich flows particularly in the vicinity of the main scoria cone of Mt Napier, and indicates the explosive escape of volatiles from within the flows of the latest eruptions. Petrography Thin-section studies of the Mt Napier basalts show an orderly change in the types of phenocrysts present, with the relative age of the flows. In the older pahoehoe flows,
313
olivine is the sole phenocryst; they are generally a prominent yellowish green in hand specimens, up to 2 mm across, and are largely unaltered. In the stony rise flows, olivine is the dominant phenocryst, but clinopyroxenes are occasionally present. In the plagioclaserich flows, olivine is again the most abundant phenocryst, but large clusters of clinopyroxene up to 2.5 mm across are also common, and plagioclase is prevalent as phenocrysts up to 3 mm long. Thus a sequence in the successive appearance of olivine - clinopyroxene - plagioclase may be observed through the volcanic pile. Geochemistry Analyses of eight samples from the Mt Napier flows are given in Table 1. Geochemically, the Mt Napier volcanics are defined as hawaiites, bordering on alkali basalts. Geochemical analyses show that the Mt Napier basalts have been derived by crystal fractionation from a single, homogeneous parental magma. On a plot of the Mg-values (100 Mg/Mg + Fe 2 + ) against the differentiation indices (D.I. = normative qz + ab + or + ne + lc), a clear trend can be seen from the earliest pahoehoe flows with high Mg-values to the late, more differentiated plagioclaserich flows with low Mg-values (Fig. 4). Linear trends can also be seen in plots of major and trace elements (Figs. 5a,b), progressing from the earliest flows to the latest flows. Thus, the chemical data are consistent with the later flows having been derived by crystal fractionation from a melt represented by the composition of the earlier flows. A series of fractional crystallisation models based on major element contents was computed using a 'least squares' mixing model. The presumed parental magma was represented by a sample from the pahoehoe flows. The chemical compositions used to represent the fractionating minerals were obtained by electron microprobe analysis of the earliest crystallising phases. Models were tested by comparing the predicted and actual Rb and Sr contents of the daughters. The models
P.W. Whitehead
314
Pahoehoe Flows 8340 LTU Number 8339 48.99 (wt%) Si02 48.95 1.98 2.03 Ti02 13.77 13.73 AO2O3 2.70 2.87 Fe203 8.30 8.35 FeO 0.16 0.16 MnO 9.44 9.54 MgO 8.56 8.65 CaO 3.37 3.58 Na 0 1.12 1.03 K0 0.43 0.45 P2O5 0.67 0.36 H 0 0.20 0.07 H2O" 0.11 0.06 CO2 00 2
2
2
TOTAL
+
(ppm) Rb Sr Pb Th U Zr Nb Y Ga +87s /86sr Mg-value Diff. Index r
99.82 16 456 2 3 1 137 27 19 19 0.70386 65.04 35.14
99.81 21 498 4 2 -
144 29 21 19 0.70388 64.60 36.59
Stony Rises 8349 8348 49.24 49.39 2.16 2.09 14.27 13.89 2.64 2.55 8.28 8.29 0.17 0.16 9.24 8.30 8.72 8.52 3.53 3.58 1.36 1.40 0.49 0.49 0.20 0.34 0.11 0.20 0.05 0.05 100.16 26 564 1 3 -
173 34 22 18 0.70405 64.59 37.37
99.55 22 542 2 3 1 174 33 22 19 0.70399 62.25 38.86
8346 49.45 2.23 14.96 10.05 1.03 0.18 6.76 8.56 3.68 1.46 0.51 0.42 0.27 0.24
Plagioclase-rich Flows 8352 8351 8347 50.08 50.10 49.92 2.26 2.31 2.28 15.24 15.04 15.20 2.05 4.36 4.35 8.46 6.38 6.33 0.16 0.16 0.16 6.64 6.76 7.11 8.44 8.24 8.19 4.(X) 3.94 3.77 1.44 1.43 1.47 0.51 0.52 0.52 0.40 0.43 0.38 0.07 0.15 0.13 0.04 0.06 0.08
99.81 26 576 3 3 1 184 34 23 18 0.70400 58.53 40.61
99.73 25 585 3 3 1 188 33 23 19 0.70398 58.13 42.46
* Sr/ Sr are relative to a value of 0.7102 ± 2 (± 2 a mean) for the NBS987 SrCC>3 standard 87
R6
Table 1 Major and some trace element analyses for Mt Napier.
99.94 22 572 2 6 2 188 34 23 22 0.70393 59.21 40.81
99.89 23 576 2 2 -
190 35 23 21 0.70390 57.55 45.52
Geology and geochemistry, Mt Napier and Mt Rouse
show that the stony rise flows can be gener200ated by the fractionation of 3% olivine, 2.2% 190 clinopyroxene and 0.2% magnetite (Er = 1800.1132; where r < 1 represents the difference between the actual and the computed oxide 170Zr (ppm) contents of the parental magma, and where 160£r represents 'an excellent fit' (Baker et al ISO1977)). A further similar degree of fractionaMO— tion, totalling 6°7o olivine, 5% clinopyroxene and 0.5% magnetite, can generate the plagio130 clase-rich flows from the pahoehoe flows (Er = 0.3358).
315
2
o
O
2
Ti0 2 (wt%)
2
Fig. 5b Zr against Ti0 for Mt Napier basalts. Key as for Figure 4. 2
Differentiation Index
Fig. 4 Plot of Mg-value against differentiation index for Mt Napier basalts. Key: squares = pahoehoe flow; diamonds = stony rise flows; triangles = plagioclase-rich flows.
a i 2 o 3 (wt%)
48.8
"1——I—' —I——I—*—I——I—«49.2 49.4 49.6 49.8 50.0 50.2
49.0
1
1
1
Si0 2 (wt%)
Fig. 5a Si0 against A1 0 for Mt Napier basalts. Key as for Figure 4. 2
2
3
MT ROUSE Volcanic Landforms Mt Rouse is a complex volcano rising about 100 m above the level of the surrounding plains at an angle of around 20° to an elevation of 370 m. The main crater consists of two circular craters that overlap to form an elongate crater running approximately eastwest, and breached to the west. Adjoining the main peak to the south is a low scoria cone with a circular crater rimmed by basalt. This crater drops steeply about 30 m to a permanent lake that is below the level of the surrounding land. The dip of scoria in a quarry on the eastern flanks of Mt Rouse indicates that the low scoria cone may originally have been around 130 m higher than its present level. A spatter rampart is present on the top of the northern section of the main scoria cone. The rampart consists of a ridge about 5 m high and extending for approximately 35 m, that has been broken up into boulders averaging slightly over 2 m in diameter. The boulders are comprised of small scoriaceous fragments 1-2 cm across that have been flattened on impact and welded together. The ridge is extensively weathered. Geochemical and isotopic data show the spatter rampart to have
316
P.W. Whitehead
been generated from a source that is quite different from those of the rest of the Mt Rouse volcanics. A basanite dome 15 m high and 40 m in diameter occurs 6 km to the southwest of Mt Rouse. Large boulders up to 1.5 m across are prominent on the eastern and western flanks, but the central section has a much poorer outcrop of smaller rocks averaging about 10 cm in diameter. Vesicle trails in the boulders follow the slope of the dome, with trails close to the central section having a near-vertical alignment. The dome is thought to represent an eruption point along a small north-south fissure, with basalt in the central section being fractured by subsequent eruptions. Relative Stratigraphy In absolute age, Mt Rouse is considerably older than Mt Napier. K-Ar dating has been done by McDougall and Gill (1975), who obtained ages ranging from 0.309 Ma to 0.450 Ma for four samples from flows that ran to the south, and by Oilier (1985), who obtained an age of 1.82 Ma for a sample from the base of Mt Rouse. The discrepancy between these two sets of ages cannot be reconciled with the geographic and stratigraphic relationships of the flows, and indicates an error in some of the dating. The older age of Mt Rouse makes the fine resolution of the relative stratigraphy more difficult than for Mt Napier. Nevertheless, groups of flows can be assigned to a chronological framework and, in some groups, individual flows can be placed in a sequence of eruption. Of the Mt Rouse flows that were studied in detail, three main groups were recognised where a chronological framework could be assigned (Fig. 6): (i) western flows; (ii) stony rises; and (iii) evolved flows. The western flows cover an area of about 40 km2 to the west of Mt Rouse. There are two major flows within this region, with distinct flow fronts up to 7 m high that can be traced for over 6 km. Both flows have twin parallel ridges, with the intervening depression
representing areas of collapse. Similar but smaller ridges are common throughout the region. Stratigraphically, the western flows are the oldest of the prominently outcropping Mt Rouse basalts and have some affinities with the surrounding plains basalts. Geochemically, three out of six analysed samples of surrounding plains basalts could be regarded as being equivalent to the western flows (Whitehead 1986). 87Sr/86Sr ratios of the western flows, averaging 0.70411, are also similar to those of the surrounding plains. One of the three similar samples was collected over 40 km to the west, and cannot be related to the Mt Rouse volcanics. However, the geochemical and isotopic similarities between the samples suggest that the flows represent a gradation between the dominantly alkalic cones and the tholeiitic plains that they overlie. The stony rises form a group of flows immediately surrounding Mt Rouse. Individual flows cannot be followed for more than around 100 m before merging into the surrounding basalts. On a regional scale, the stony rises form a lava shield rising towards Mt Rouse, and must have been erupted relatively late in its history. The evolved flows consist of a small number of flows on the periphery of the stony rises. There are indications on the aerial photographs that these flows may be traced back through the stony rises to the southern crater of Mt Rouse, making them the most recent of the Mt Rouse flows. The stony rises are of such an undulating nature that the tracing flows through them must be regarded with some caution. It is also likely that these flows would have emerged from tubes within the stony rises, rather than flowing over the stony rise surface. Petrography The Mt Rouse basalts are generally nonporphyritic and do not show any consistent variations between the various groups. Thus a crystallisation sequence, based on the appearance of phenocrysts, such as that
Geology and geochemistry, Mt Napier and Mt Rouse
Eruption Points
'
/
Evolved Flows
317
Western Flows Ungrouped Flows
Stony Rises
B
Basanite Dome
MT ROUSE
N
Fig. 6 Distribution of the flows emanating from Mt Rouse.
derived for Mt Napier, is not possible for Mt Rouse. In thin section, plagioclase is the most abundant mineral, comprising about 50% of the rock, and occurs both as laths (An = An ) and interstitially. Clinopyroxenes make up around 25% of the sample and are disseminated throughout. Olivines account for about 15% of the rock. The remainder is composed of magnetite and lesser ilmenite, with a small proportion of apatite. Geochemist Analyses of fourteen samples from the Mt Rouse flows are given in Table 2. Geochemically, the Mt Rouse volcanics are predominantly alkali basalts. On variation diagrams involving the major elements that constitute over 5% of the bulk rock composition, there 40
55
exists a general trend from the most primitive of the western flows, through the more differentiated western flows and stony rises, to the evolved flows (Fig. 7). This appears to be in agreement with the stratigraphic relationships of the flows and suggests a fractional crystallisation sequence. For incompatible trace elements, such as Zr and P 0 , there is again an apparent linear trend, but the most primitive of the western flows plot close to the evolved flows (Fig. 8). Furthermore, the trend from the most primitive to the more evolved western flows is the opposite to that expected if crystal fractionation were the dominant process affecting the evolution of the basalts, as the amounts of incompatible elements decrease with the alleged increasing degrees of differentiation. An alternative, proposed here, 2
5
H
oi-t P CL OC/3 3a Po
<T>
a P P
Basanite LTU Number 8360 (wt%)Si02 46.89 2.12 T1O2 13.36 AO2O3 2.05 FC2O3 FeO 9.45 MnO 0.18 MgO 10.48 CaO 9.22 N^O 339 1.46 K2O 0.52 P2O5 038 HO 0.13 H O* 0.05 co S 99.68 TOTAL (ppm) Rb 28 Sr 611 Pb 4 Th 4 2
+
2
2
Oc
U 1 Zr 169
Nb
Y Ga * Sr/ Sr 87
8&
Mg-value
Diff. Index
39 21 19 0.70393 66.13 33.15
Western Flows 8363 46.39 2.03 13.10 3.00 8.63 0.18 10.75 9.26 3.20 134 0..49 0.60 0.34 0.18 -
99.49 26 653 3 3 -
165 39 21 18 0.70411 66.6 31.96
8364 49.10 1.96 13.59 2.78 8.13 0.16 9.40 8.69 3.32 1.11 0.40 036 0.19
0.11 -
993 19 517 4 3 -
142 26 21 19 0.70416 65.04 35.26
Stony Rises
8365 49.63 1.99 13.80 3.94 7.17 0.16 8.45 8.90 3.43 1.06 0.38 038 0.24 030
8366 4839 2.11 13.34 2.92 8.27 0.17 9.79 8.71 3.09 1.18 0.46 0.60 0.30 0.09
100.03 19 488 3
99.62 20 553 3
-
-
I
138 26 20 18 0.70411 62.41 35.78
-
1
155 32 22 19 0.70407 6539 33.72
8367 4833 221 1338 3.95 7.40 0.17 9.17 8.95 3.18 120 0.48 033 031 0.10 -
8355 49.88 2.13 13.90 331 737 0.16 8.67 8.87 3.48 1.15 0.42 0.47 0.16 0.14 -
86
8357 49.40 2.15 13.85 520 5.90 0.16 835 8.70 3.47 1.14 0.42 0.40 029 0.08 -
99.76 21 578 4 3
100.31 16 515 2 4
99.64 18 514 3 2
9932 16 506 1 3
162 33 20 20 0.70411 63.79 3438
164 28 21 19 0.70396 6335 3635
160 28 21 20 0.70383 62.61 37.13
165 28 21 20 0.70383 6339 36.79
1
1
* Sr/ Sr are relative to a value of 0.71027 ± 2 (± a mean) for the NBS987 SrC03 standard 87
8356 49.47 2.13 13.77 4.77 631 0.16 8.44 8.74 330 1.17 0.41 035 023 0.19
1
-
Evolved Flows
8354 4933 2.03 13.65 2.98 7.77 0.16 923 8.76 337 1.07 0.40 031 0.15 0.06
8362 4934 231 14.64 2.88 7.80 0.16 737 8.92 337 123 031 037 022 0.06
99.63 18 512
9938 22 653 3 4
99.84 21 545 6 5
99.67 15 507 1 4
173 33 21 19 0.70405 6031 38.05
178 33 24 22 0.70381 58.91 38.85
158 25 20 20 0.70377 65.01 3536
-
158 31 21 20 0.70395 63.34 3636
-
I
8359 3935 235 14.35 535 5.97 0.17 7.35 8.61 3.63 1.27 033 034 0.19 0.18
Ungrouped Spatter Flow Rampart
8358 49.36 2.12 13.67 3.49 735 0.17 8.78 8.72 3.41 1.17 0.43 035 0.16 0.05
-
1
-
1
8345 43.87 2.74 14.38 7.49 5.06 0.25 830 7.94 2.89 134 1.05 2.15 0.61 0.18 0.01 99.66 18 1028
1
7 2 370 72 30 20 0.70446 60.22 34.66
i I
Geology and geochemistry, Mt Napier and Mt Rouse is that the western flows were derived by differing amounts of partial melting, with greater amounts of partial melting leading to lower abundances of incompatible elements. Later crystal fractionation of the melts led to some subsequent increase in these elements.
319
increasing degrees of olivine fractionation. The abundances of incompatible elements will decrease with greater degrees of partial melting but increase with greater degrees of olivine fractionation. For the western flows, the more differentiated samples have lower abundances of incompatible elements, showing their evolution to be primarily controlled by increased degrees of partial melting. Subsequent crystal fractionation of the melts decreased the Mg-value and increased the abundances of incompatible elements, leading to the production of the highly differentiated, evolved flows that have similar abundances of incompatible elements to the early, more primitive western flows.
A l 2 0 3 (wt%) 180
Fig. 7 MgO against A1203 for Mt Rouse basalts. Key: squares = western flows; diamonds = stony rises; triangles = evolved flows; 1 = most primitive sample from the western flows; 2 = most differentiated sample from the western flows; B = sample from basanite dome.
170 160-
Zr(ppm) 150-
180-
140
170
130 Mg-value
Zr (ppm) 150-
Fig. 9 Zr against Mg-value for Mt Rouse basalts. Key as for Figure 7. Arrow on dotted line indicates the effect of increasing levels of partial melting. Arrows on continuous lines indicate the effect of increasing fractionation.
140 130' P 2 0 5 (wt%)
Fig. 8 Zr against P 2 0 5 for Mt Rouse basalts. Key as for Figure 7.
The relative effects of partial melting and crystal fractionation may best be demonstrated on variation diagrams involving an incompatible element, such as Zr, plotted against Mg-values (Fig. 9). Original Mg-values are likely to be similar with differing degrees of partial melting, so that on such diagrams, decreasing Mg-values are taken to represent
Thus, the Mt Rouse volcanics had a somewhat more complex evolution than those of Mt Napier. The details of melt evolution can only be obtained when consideration is given to the field relationships of each sample and its position with respect to a relative chronology. An incorrect evolution might have been interpreted by plotting the samples as a whole, without due regard to the field relationships.
320
P. W. Whitehead
ACKNOWLEDGEMENTS This work is primarily the result of honours work undertaken at La Trobe University, and the assistance of Dr. R.C. Price and the staff of the Geology Department of La Trobe University is gratefully acknowledged. Thanks are also extended to P r o f . P . J . Stephenson and Dr. E.B. Joyce for their constructive criticisms of this paper. Geochemical analyses of samples LTU8339 and LTU8340 were done by Mr. B. Mackie. 87 Sr/ 86 Sr measurements were done by Mr. D. Steele and Mr. B. Mackie under the supervision of Dr. C.M. Gray, and are included by kind permission of Dr. R.C. Price and Dr. C.M. Gray.
REFERENCES BAKER B.H., GOLES G.G., LEEMAN W.P. & LINDSTROM M.M. 1977. Geochemistry and petrogenesis of a basalt-benmoreite-trachyte suite from the southern part of the Gregory Rift, Kenya. Contributions to Mineralogy and Petrology 64, 303-332. GILL E.D. 1978. Radiocarbon dating of the volcanoes of Western Victoria, Australia. Victorian Naturalist 95, 152-158. GILL E.D. & ELMORE L.K.M. 1973. Radiocarbon dating of Mount Napier eruption, Western Victoria, Australia. Victorian Naturalist 90, 304-306.
GILL E.D. & ELMORE L.K.M. 1974. Importance of the Mount Napier volcanic complex near Hamilton, Victoria. Victorian Naturalist 91, 167-174. McDOUGALL I. & GILL E.D. 1975. Potassium - Argon ages from the Quaternary succession in the Warrnambool - Port Fairy area, Victoria, Australia. Royal Society of Victoria Proceedings 87, 175-178. OLLIER C.D. 1964. Tumuli and lava blisters of Victoria, Australia. Nature 202, 1284-1286. OLLIER C.D. 1967. Landforms of the Newer Volcanic Province of Victoria. In Jennings J.N. & Mabbutt J.A. eds. Landform Studies from Australia and New Guinea. Australian National University Press, Canberra. OLLIER C.D. 1985. Lava flows of Mount Rouse, Western Victoria. Royal Society of Victoria Proceedings 97, 167-174. OLLIER C.D. & BROWN M.C. 1964. The Byaduk lava caves. Victorian Naturalist 80, 279-290. OLLIER C.D. & JOYCE E.B. 1964. Volcanic physiography of the Western Plains of Victoria. Royal Society of Victoria Proceedings 77, 357-376. SKEATS E.W. & JAMES A.V.G. 1937. Basaltic barriers and other surface features of the Newer Basalts of Western Victoria. Royal Society of Victoria Proceedings 49, 245-278. WHITEHEAD P.W. 1986. The geology and geochemistry of the Mt Rouse and Mt Napier volcanic centres, Western Victoria. B.Sc. Hons. Thesis (unpublished), Geology Department, La Trobe University, Melbourne.
Pleistocene shell beds of the Hopkins River, Warrnambool, Victoria: estuarine sediments or Aboriginal middens? E.D. GILL (deceased), J.E. SHERWOOD1, J.H. CANN2, P.J. COUTTS3 AND C.J. MAGILTON1 'Faculty of Applied Science and Technology, Warrnambool Institute of Advanced Education, Warrnambool, Victoria 3280, Australia. 2
School of Pure and Applied Sciences, Salisbury Campus of South Australian College of Advanced Education, Salisbury East, South Australia 5109, Australia. 3
GPO Box 6602, Central, Hong Kong.
Shell beds outcropping up to 7 m above present sea level have been located at three sites in the Hopkins River estuary at Warrnambool, Victoria. Their similar elevations and ESR analysis suggest that the beds were deposited during the same interglacial. The two downstream sites have fossil faunas and other features expected of a low energy estuarine environment. Sediments outcropping at the third upstream site have both an unusual fossil fauna dominated by barnacles, and sedimentary features uncharacteristic of a low energy estuarine environment. Some features of the upstream site gave rise to an hypothesis that the site was of human origin, with concomitant ramifications for the Aboriginal settlement of Australia. Investigating this hypothesis proved to be a challenging and difficult problem. Eventually it was demonstrated that typical estuarine foraminifera occur abundantly throughout the site's shell beds, indicating that they are naturally deposited estuarine sediments. It is thought that deposition occurred in a small protected embayment during intermittent flood events. Key words: Ammonia beccarii, Balanus variegatus, barnacles, foraminifera, Hopkins River, interglacial, middens, sea level, sediments, shell beds, Warrnambool.
INTRODUCTION
for at least 600 ka (Gill 1981). The Warrnambool district does not appear to have undergone significant epeirogenic movement during the Late Quaternary (Gill 1971).
The Hopkins River estuary at Warrnambool, Victoria is a waterway c. 200 m wide. It is mostly bounded by steep cliffs, c. 10 m high, of Tertiary calcarenite (the Port Campbell Limestone, Baker 1944). Normal tidal fluctuations average about 0.3 m, though local storm surges may cause rises of up to 1 m. Freshwater flooding may raise water levels by as much as 3 m. Tidal influence extends upstream 9.5 km to rapids at Tooram Stones (Pleistocene Woodbine Basalt, Gill 1971), thus defining the length of the estuary (Fig. 1).
Outcrops of shelly sediments, deposited during an interglacial high sea level stand, occur at three identified sites on the southern banks of the Hopkins estuary (Fig. 1). The two downstream sites (A and B) exhibit no unusual faunal or sedimentological features and have been correlated with the Last Interglacial Port Fairy Calcarenite (Gill 1971). Such Last Interglacial sediments occur widely around the coast of southern Australia (e.g. Glanville Formation of South Australia; Cann 1978; Belperio et al 1984).
Though existing as a water body only at interglacial times of high sea level (e.g. Last Interglacial c. 125 ka; Holocene), the estuary is believed to have been a geomorphic feature
Site C, the most upstream site, exhibits some unusual characteristics which originally 321
322
E.D. Gill, J.E. Sherwood, J.H. Cann, P.J. Coutts & C.J. Magilton
Fig. 1 Locality map of the Hopkins River estuary. The present tidal limit is at Tooram Stones. Positions of the three shell beds described in this paper are indicated.
led some observers to postulate a human origin for its formation. If such had been the case, it would have been the oldest known cultural site in Australia, with significant ramifications for the settlement of the Australian continent (Bowler 1976; Pearce & Barbetti 1981; Groube et al 1986). Considerable attention was therefore focussed on Site C with the aim of determining whether it was of human or natural origin. This proved to be a difficult problem. Here we describe the three sites and consider the processes responsible for their origin. In this context we have documented the procedures and techniques adopted to prove a natural origin for Site C. Contributions by the senior author (deceased) are derived from his personal note books, at present in the care of
one of the authors (J. Sherwood) but later to be curated at the State Library of Victoria. SITE DESCRIPTIONS Site A When this site was first examined by the senior author, some time between 1946 and 1948 (Notebook #57, 252-254), the surface outcrop had been exposed down to normal water level by an unusually severe flood. Today, however, much of the lower part of the section is covered by colluvium (Fig. 2a). Identified by Gill as Port Fairy Calcarenite, the deposit outcrops above the colluvium as a coarse, shelly sand (Fig. 2b). Gastropods and bivalves are abundant (Table 1). Some of
Pleistocene shell beds of the Hopkins River, Warrnambool
323
Fig. 2 SITE A 2(a) General view of upper part of the shell bed showing overlying Tower Hill Tuff. The elevation of the tuff-shell bed contact has been surveyed at 4.97 m AHD. 2(b) Detail of the exposed shell bed section; the upper part is heavily calcreted; lowermost exposed sediment is sandy, semi-cemented and contains numerous rhizomorphs. 2(c) Details of fossil molluscs; many bivalves disarticulated and some convex upwards.
324
E.D. Gill, J.E. Sherwood, / . / / . Cto/i/i, P./. Cowtt? <£ C./. Magilton
the latter consist of paired valves, and others occur as disarticulated valves, frequently convex upwards (Fig. 2c). Shells from both estuarine and open marine habitats occur in this deposit, indicating its proximity to the palaeoestuary mouth. Parts of the outcrop are heavily cemented and Munsell colours range from very pale brown to reddish yellow and white (Notebook #21, 144). A terra rossa palaeosol distinctively colours the uppermost 0.2-0.25 m. The unit is overlain by about 1 m of evenly layered, grey, basaltic Tower Hill Tuff (Gill 1971) which in turn is covered by more than 1 m of black soil. The base of the terra rossa palaeosol was professionally surveyed at 4.85 m, and the base of the tuff at 4.97 m above AHD (Australian Height Datum).
Site B Much of this site is also covered by colluvium (Fig. 3a). Occasionally, outcrop can be traced to present beach level. The uppermost sediment (5 m AHD) is highly fossiliferous and was the focus of this study. It is overlain by aeolianite. Abundant gastropods and bivalves, paired and unpaired, occur in a matrix of white, coarse, shelly sand (Fig. 3b). Gravels (plus some pebbles and cobbles) occur in the lower horizons (Fig. 3c). The gravels cannot indicate a high energy environment because they are intimately associated with fossil, paired, articulated bivalves. They appear therefore to have become incorporated into the deposit as talus, with sediment accumulating steadily around and between the larger calcarenite clasts. A modern analogue of this situation can be observed today at the base of the cliff at Site B (Fig. 3d).
Table 1 Shell Species Found at Site A. PHYLUM
SPECIES
HABITAT +
Crustacea
Balanus variegatus
estuarine
Mollusca
Nassarius burchardi
estuarine
Velacumantus australis
estuarine
Notospisula trigonella
estuarine
Solatellina donacioides
estuarine
Tellina deltoidalis
estuarine
Corbula stolata*
estuarine
Mytilus sp.*
estuarine/rocky coast
Katelysia sp.*
estuarine
Anadara trapezia*
estuarine
Plebidonax deltoidalis*
sandy coast
Ninella torquata*
rocky coast
Turbo undulatus*
rocky coast
* Not observed in presently exposed upper part of the section but recorded by Gill (Notebook #21, 144), presumably from the now inaccessible lower part of it. +
Marine Research Group of Victoria (1984); MacPherson and Gabriel (1962).
Pleistocene shell beds of the Hopkins River, Warrnambool
325
Fig. 3 SITE B 3(a) General view of the outcrop; top of cliff is 8-9 m above estuary water level. 3(b) Detail of the upper part of the exposed shell bed section, 6 m above estuary water level. 3(c) Detail of fossil molluscs; some entire (paired) bivalves intimately mixed with rounded clasts of calcarenite. 3(d) Estuary beach below outcrop showing numerous clasts. This provides a present day analogue for the sedimentary palaeoenvironment of the shell bed.
326
E.D. Gill, J.E. Sherwood, J.H. Cann, P./. Cowtfs <£ C.7. Magilton
The shelly deposit apparently dips at 12-18° westward. Its maximum elevation was surveyed as 6.94 m AHD. Immediately to the east of the deposit is a cliff of Port Campbell Limestone. The shell beds occupy a small embayment downstream of this. Site C The shell beds at Site C have several unusual features which originally led some of us to postulate that it was an Aboriginal midden (Notebooks #57, #59 and #60). Consequently, because of the presumed antiquity of the site, it became the focus of our investigation. When excavated (Fig. 4a), a 10-12 m section revealed shell beds 4-5 m thick in which the remains of mussels and barnacles predominated (Fig. 4b). Shell abundance decreases eastwards. Horizontal auger holes (Fig. 4a) show that the horizontal extent of the shell beds, presumed to rest against the Port Campbell Limestone, is 1 m throughout. Thin veneers of similar shell material occur intermittently up to 30 m west of the main exposure, both on in situ Port Campbell Limestone and on large fallen blocks. To the east of the exposure, a carbonate-quartz aeolianite drapes over the front of the cliff of which the shell beds are part. Various components of the site have been identified, viz., a basal conglomerate, shelly sediments, calcrete and a carbonate - quartz aeolianite. The stratigraphic relationships of these components are summarised in the interpretive section (Fig. 5). (i) Basal Conglomerate. At the base of the section there are numerous sub-rounded cobbles and boulders of Port Campbell Limestone (up to 0.25 m diameter) between which shell material occurs (Fig. 4c). Barnacles are attached to some of these clasts, which also occur as isolated blocks higher in the section (Fig. 4d). Even distribution of barnacle attachment scars over whole surfaces of some of the blocks shows that the submarine orientation of the clasts altered from time to time.
(ii) Shelly Sediments. The shelly sediments are mostly loosely cemented so that washing leads to a high degree of separation of bioclasts from matrix, though some cemented clumps remain. The millimetre fraction consists of orange-brown to grey silty mud which contains fine vegetable detritus. Charcoal and pollen were absent from all samples examined. The degree of compaction and cementation is sufficient to maintain the face as excavated, and the uppermost 0.5 m calcreted horizon is solidly cemented. Shells from two distinct facies are represented. Species inhabitating a rocky or hard substrate with a strong marine influence comprise Mytilus edulis planulatus (the mussel), Irus crenatus and Balanus variegatus (the barnacle). Species characteristic of muddy estuarine environments include Tellina deltoidalis, Solatellina donacioides and Notospisula trigonella. Relative abundance data for these species are presented later in Table 2. The lowest and westernmost material consists almost entirely of mussels and barnacles. In contrast, the easternmost sediment has a lower abundance of these, with approximately 40% of individuals being mud-facies species. Between these two 'extremes' there are no distinct boundaries, and the deposit is therefore divided into two diffuse zones - a mussel/ barnacle zone and a mud facies/barnacle zone. Within these zones Munsell colour is variable, ranging over grey, white, yellowishbrown, reddish-brown and reddish-yellow. Variations of colour in poorly-defined bands are suggestive of bedding. Molluscan bioclasts consist of broken and, rarely, entire shells of mostly mature mussels and other bivalves. Very rarely, paired bivalve shells have been found. Gastropods are also rare (three specimens of Velacumantus australis in addition to those of Table 2). Mussel shells are mostly fragmented and sharp edged. In some instances the pieces of broken shell lie in positions of fit and occasional shells lie with beaks in close proximity, suggesting pairing (Fig. 4e). Most other shells and shell
Pleistocene shell beds of the Hopkins River, Warrnambool
327
328
E.D. Gill, J.E. Sherwood, J.H. Cann, P.J. Coutts & C.J. Magilton
Fig. 4 SITE C 4(a) General view of the outcrop during clearing of surficial soil. Holes, indicated by arrows, are sites of horizontal augering to determine the lateral extent of the deposit. The top of the cliff is approximately 5 m above estuary water level and is heavily calcreted. 4(b) Detail of the mussel/barnacle association of the lower western end. Note whole clumps of barnacles and imbrication of fragmented mussel valves. 4(c) Basal conglomerate of Port Campbell Limestone clasts intimately mixed with shelly sediment. 4(d) Rounded clast of Port Campbell Limestone showing barnacle scars (arrows). This clast is about 2 m above the exposed base of section. 4(e) Paired almost entire mussel valves, showing fragmentation due to compaction.
Pleistocene shell beds of the Hopkins River, Warrnambool
329
Table 2 Percentage distribution of Mullusca and Crustacea by mass and number at Sites B and C.
PERCENTAGE DISTRIBUTION SPECIES #
Balanus
BY
Wt
SITE
SITE C SAMPLE
B
1
2
3
4
5
6
7
8
9
21.2
86.9
92.8
73.7
90.1
94.8
96.8
98.1
92.5
87.8
variegatus
N
7.4
95.2
74.2
87.9
64.6
79.5
90.5
83.9
67.4
52.0
Mytilus edulis
Wt
15.2
13.1
4.8
26.0
4.7
1.2
0.4
0.1
3.8
0.4
planulatus
N
1.4
4.8
3.2
10.3
1.5
0.8
0.6
1.6
2.1
2.0
Irus
Wt
9.5
0.7
1.0
1.5
<0.1
<0.1
0.1
4.4
crenatus
N
3.1
3.2
3.1
3.9
0.6
1.6
0.7
4.0
Nassarius
Wt
5.9
0.3
*
(Plicarcularia)
N
42.2
12.3
*
*
0.1 4.0
burchardi Pseudoliota
Wt
1.7
micans
N
9.1
Bembicium
Wt
3.8
melanostomum
N
2.0 22.3
Velacumantus
Wt
australis
N
8.8
Notospisula
Wt
9.2
0.3
0.6
0.3
<0.1
0.1
0.3
0.8
trigonella
N
17.6
16.1
9.2
7.1
3.9
8.1
19.1
22.0
Tellina
Wt
11.0
1.2
0.2
3.3
2.1
2.4
1.4
3.3
6.5
(Macomona)
N
8.2
3.2
1.7
9.2
7.1
4.5
4.8
10.6
16.0
Solatellina
Wt
0.2
donacioides
N
0.3
deltoidalis <0.1 0.8
TOTAL MNI +
353
42
31
58
65
127
179
62
141
50
Minimum % shell by mass
43.9
39.1
28.5
26.0
39.2
37.7
46.0
27.9
60.0
16.1
* Present in the fine sieve fractions - %s are for the coarse and medium fractions only. # Fragments of an unidentified crustacean, probably crab, were found in Site C samples 4, 5 and 6. + Minimum number of individuals.
330
E.D. Gill, J.E. Sherwood, J.H. Cann, P.J. Coutts & C.J. Magilton
fragments are randomly packed but, less commonly, are imbricated with occasional alignments of shell being suggestive of bedding. Measured dips of shell alignments range from 24-30°, generally towards north or east (Notebooks #59, 178; #57, 353). Barnacles occur as both disarticulated plates and as whole and clustered individuals. About 50% of the disarticulated plates are blackened, unlike shells or fragments of other species. In some whole barnacles the opercular valves are still present, indicating that these individuals died in situ or suffered minimum transportation after death. They are the dominant shell in the deposit, both by mass and population (Table 2). Several mussel shells have been observed to have barnacle scars. (iii) Calcrete. Calcrete blankets the deposit and extends dyke-like feeders downwards into the shelly sediment (Fig. 5). There are local variations in the colour and hardness of the calcrete. In places it is uniformly white and earthy in appearance, with an interior soft enough to be penetrated by a finger nail. Elsewhere it is harder and denser with a banded appearance. Munsell colour varies between light yellowish-brown, reddish-brown, strong brown and grey (Notebook #60, 189). A fine layer of shell 'hash* occurs intermittently in its base (Notebook #59, 193). Examination of thin-sections reveals it to be composed of fine particles up to 0.2 mm diameter, in places poorly cemented and rather porous. The microstructure suggests accumulation under sub-aerial conditions and it is interpreted as a calcareous loess. (iv) Aeolianite. An aeolian calcarenite blankets the cliff east of the shell bed and is exposed at estuary beach level for 36 m. It consists of two sub-units, numbered 1 and 2. 'Aeolianite V forms a low bench, 16 m long, 1-1.25 m above the beach. Weathering of the yellow-brown rock has produced a very uneven surface due to varying degrees of solution and cementation. An auger hole 16 m offshore encountered similar textured material at
a depth of 1.4 - 2.1 m below water level, interpreted as a submarine extension of 'aeolianite 1\ Quartz grains are angular to rounded and up to 1.1 mm diameter (Notebooks #59, 35; #60, 240.). Four species of terrestrial snail occur as fossils in this aeolianite: Magilaoma penolensis; Paralaoma caputspinulae; Pernagera sp.; and Dentherona sp. Today, all live in dry woodland, and all except Dentherona have been found in a dune sand habitat. Both Magilaoma and Paralaoma are common in many coastal situations. Rising to the south of 'aeolianite V is a finer-grained deposit, 'aeolianite 2'. It reaches a height of 2.5 m above the beach and extends 20 m further eastwards than 'aeolianite 1*. Obvious red mottling and an absence of fossils distinguishes it from 'aeolianite 1'. The aeolianites are interpreted as dune sediments, originally draped over the shell bed. They may have formed when sea level dropped, exposing river-floor sediments. Alternatively they may be the remains of clifftop dunes. The present coast is approximately 2 km away (Fig. 1). LABORATORY METHODS Macrofossil Abundance Nine samples, c. 5 kg each, were collected from the shell beds of Site C at positions indicated in Fig. 5. The samples were dried in an oven at approximately 105°C for a minimum of 14 hours and weighed. Approximately half of each sample was soaked, washed and passed through 19 mm, 4 mm and 1.2 mm sieves. Each fraction was dried at 105°C for a minimum period of 14 hours and then weighed. The medium (4 mm) and coarse (19 mm) fractions were sorted into components - mollusca, crustacea, rock and residue. These were weighed, and in the case of the biological mat^ial, the numbers of whole specimens not^d. The fine fraction was examined, but the degree of fragmentation was so great that total speciation was not possible. Only major
c t
Pleistocene shell beds of the Hopkins River, Warrnambool components were noted. Finally, the minimum number of individuals (MNIs) for each species was estimated by dividing their total weights by the average weight of one specimen, or by determining the frequency of occurrence of an appropriate part of the shell. The average weight of one specimen was determined by weighing the total collection of whole shells of that species from the corresponding or adjacent layers. A sample was also collected from Site B, at the site shown in Fig. 3b. It was processed in the same way as samples from Site C. The degree of cementation precluded a similar analysis for Site A. This method of treating samples results in data being biased towards the larger and tougher shells. Many of the thin-walled shells of Tellina and Solatellina are preserved only as fragments in the deposit. Sieving further breaks these down. Much of the aragonitic shell material was extremely fragile. For example, the inner layer of Mytilus shells disintegrated very easily leaving only the brown calcitic portion. This fine material escaped through the 4 mm sieve. Species composition observed in the fine fractions was
•
331
similar to that in the medium and coarse fractions, however, except that some of the small species occurred more frequently. Foraminifera Abundances Single samples were collected near the top of Sites A and B. At Site C, five samples were taken at approximately 1 m intervals along a vertical transect from the base of the deposit (Fig. 5). Samples ranged from friable to moderately cemented. In the laboratory, samples were allowed to soak in fresh water for 24 hours to facilitate disaggregation. Subsequently, samples were wet-sieved and the sand size fractions (0.063 - 2.00 mm) retained. Fractions 2.00 mm generally contained many lumps of consolidated shelly sediment which could not easily be disaggregated. The retained sand fractions were dried and then dry-sieved into phi grain size fractions for microscopic analysis. Using standard micropalaeontological procedures, approximately 1 g of the sediment size fraction (0.25 - 0.50 mm) was examined for each sample. Individual foraminifera were removed from
B a r n a c l e s & Mud Facies Shells
Fig. 5 Schematic block section of Site C (not to scale). Numbers show the position of macrofaunal abundance samples (see Table 2) and arrows the vertical transect used for microfossil samples (Table 3).
332
E.D. Gill, J.E. Sherwood, / . / / . Cann, P.J. Coutts & C.J. Magilton
the picking tray for identification and counting. Age Determinations Radiocarbon dating was carried out at the Macintosh Centre for Quaternary Dating, Sydney University. This laboratory was responsible for all sample treatment. Electron Spin Resonance (ESR) analysis of shells was carried out by Mr. Albert Goede, University of Tasmania. The technique used is described elsewhere (Goede and Hitchman 1987; Goede 1989). RESULTS Macrofossil Abundances Results of quantitative analyses of macrofaunal abundances of one sample from Site B, and nine samples from Site C, are presented in Table 2. These data clearly highlight the greater diversity of the fossil fauna at Site B compared to that of Site C. For Site C it is apparent that there was, at the time of deposition, an intimate mixing of shells of mud facies fauna with those more characteristic of hard or rocky substrates. Foraminifera Abundances Samples from all sites contained significant numbers of the foraminifera Ammonia beccarii and, to a lesser extent, Elphidium
articulatum. Most specimens showed some evidence of carbonate cementation, but this was not sufficient to infill chambers nor cause problems of identification. In contrast, a small number of other species, including Elphidium cf. crispum, Cibicides sp. and various planktonic forms were infilled with carbonate cement and showed signs of attrition. These latter forms are presumed to have been reworked from the adjacent Tertiary limestones, which are essentially of bioclastic origin. Numbers of individuals of A. beccarii and E. articulatum per gram of sediment (size fraction 0.25 - 0.50 mm) are shown in Table 3. Their abundances are similar near the tops of all three sites (5-6 m AHD) and at Site C the numbers of Ammonia beccarii increase upwards through the deposit, an indication that conditions more favourable to the species developed over the period of deposition. Age of the Shell Beds Eustatic high stands of sea level similar to the present are known to have occurred at about 125 ka, 220 ka and 400 ka (Chappell 1983; Gill 1987). Radiocarbon dating of shells has produced what are believed to be minimum ages in the range 40-50 ka (Table 4). ESR analysis of shells from Sites B and C (Table 5) gave similar equivalent dose (ED) readings, indicating a similar age for both sites. Comparison of these ED values with
Table 3 Foraminiferal abundances in three fossil shell beds of the Hopkins Estuary. E A.
beccarii+
E E. articulatum +
Site
Sample
A
1
116
0
B
1
348
0
C
aW
53
2
b
81
12 8
c
91
d
117
3
e
225
4
+ Numbers represent individuals per gram of sediment of size fraction 0.50-0.25 mm. (1) Samples equally spaced from bottom (a) to top (e) of deposit.
Pleistocene shell beds of the Hopkins River, Warrnambool those obtained for a number of other shell beds in the Warrnambool area indicates an age most probably in excess of 125 ka. Uranium analysis of shells indicated no enrichment, which could lead to spurious results (Goede 1989). Work is in progress using other techniques (U/Th, amino acid racemisation) in an effort to clarify the age of the shell beds. Table 4 Radiocarbon ages for shells at site C. Sample
Age (ka)
Ref.
+ 3.2 Mytilus edulis planulatus
41.0
SUA 2204 -2.3
>51
SUA 2405* + 2.4
Balanus variegatus
40.4
SUA 2233 -1.9 + 2.2
47.8
SUA 2513* -1.7
* These measurements were made using a counter with reduced background radiation levels (M. Barbetti, pers. comm.).
DISCUSSION Comparison of the Shell Beds Sites A and B exhibit many of the features expected in a low energy estuarine shell bed. Shells are mostly entire, with many paired bivalves present. Layers are horizontal to gently dipping with a diverse macrofaunal assemblage. If these deposits are taken as typical of estuarine sedimentation they show quite marked differences to Site C. At Site C the sediment matrix is mud and clay, whereas it is sand at Sites A and B. Site C has a more restricted macrofaunal assemblage (Tables 1 and 2). Pairing of bivalves is rare at Site C as are whole valves. The ratio of whole shells to MNI for Site B is 97.7%
333
(based on the coarse and medium sieve fractions only) and is only 4°7o for the pooled data from all samples of Site C. Gastropods are also rare. The fabric of the bioclastic components at Site C differs from that of Sites A and B, reflecting greatly different modes of sedimentation. In particular, the greater degree of fragmentation, the random orientation of fragments and steeper dips are not expected in a low energy estuarine environment. The Human Midden Hypothesis for Site C While Sites A and B show clear evidence for sub-aqueous deposition, this is not obviously the case for Site C. This site was originally interpreted as a sub-aerial deposit ( a talus slope) and as a midden. The restricted macrofaunal species diversity was suggested as due to selection of species by a predator, and the blackening of many of the barnacle plates suggested that they had been heated. The problem of determining whether shell deposits are the result of natural processes or are of human origin has received scant attention in the literature, possibly because the majority of human-derived deposits (middens) are self-evident (Coutts 1966; Gill 1951; Hughes & Sullivan 1974). Characteristics of middens and marine or estuarine shell beds reported by these workers are listed in Table 6. Those of deposits at Sites B and C are compared with them. For comparative purposes, the late prehistoric coastal midden sites of Thunder Point at Warrnambool (a site situated on a high energy coastline) and an estuarine base camp at Mallacoota (Coutts et al 1984) have been included. On the balance of evidence, Site B is a marine shell bed but Site C remains enigmatic. Site C shell deposits have less than 50% of the midden characteristics, far fewer than typical Holocene middens. Initially this was not considered remarkable because of the difficulty of comparing such recent middens with shell deposits of Site C's antiquity. Similarly, the predominance of barnacles at this site, indicating it would have to have been
334
E.D. Gill, J.E. Sherwood, J.H. Cann, P.J. Coutts & C.J. Magilton
Table 5 Equivalent doses measured during ESR analysis of shells from Sites B and C (A Goede 1989). 95% CONFIDENCE LIMITS
SHELL SPECIES
LOCATION
EQUIVALENT DOSE (Gray)
Mytilus edulis planulatus
Site B
295
228-402
Site C
304
232-425
Irus crenatus
Site B
353
316-397
Site C
719
492-1299
a target species, was also unknown in recent middens. Other species present, Tellina, Irus and Mytilus, are known to have been collected regularly by Aborigines over the last few thousand years. The ratio of flesh volume to body weight for Balanus (0.2 cc/g) is comparable to values for other shellfish favoured by Aborigines. Elsewhere in the world, barnacles were exploited from time to time. In New Zealand the barnacle Epopella plicata occurs in a number of middens in Northland (B.A. Forster, pers. comm.). These appear to have been collected specifically as the associated shellfish derive from different habitats. Again, much larger species of barnacles (up to 60 mm in height) are still collected on the west coast of South America (G. Mason, pers. comm.) and, as in Australia, they tend to occur in small quantities in middens. They also occur in Aboriginal middens in Peru, but it is not clear whether they were deliberately or incidentally collected, (e.g. Table 1 in Pozorski & Pozorski 1979, 360). Evidence suggesting that the deposits of shell could have been formed by humans came from the barnacles themselves. Initial inspection of the shells and barnacle plates indicated that many of the latter were blackened, unlike the mollusc shells. This species of barnacle does not naturally show this kind of colouration (D.T. Anderson, pers. comm.). Hence it appeared as if the barnacles had been selectively burnt. There are, however, a number of other ways the barnacle plates could have been blackened. Organic, manganese or iron sulphide staining are the most obvious ones. Determining the cause of blackening of the barnacle plates has proved difficult, and
research is continuing. Charcoal has not been found at the site and artefacts or human skeletal material are also absent. The presence of large boulders with barnacle scars is not expected in a human site. The midden hypothesis is clearly controversial because none of the evidence discussed so far can conclusively confirm or refute it.
An Estuarine Sedimentary Origin for Site C Foraminiferal abundances at equivalent horizons in all three sites are similar (Table 3). We believe this evidence makes a midden hypothesis untenable. Ammonia beccarii and Elphidium articulatum are both typical of an estuarine faunal assemblage. For example, in the upper Onkaparinga estuary in South Australia both species are abundant (J.H. Cann, unpublished data). Thus the presence of these species in the shelly sediments at Sites A, B and C is a clear indication of deposition under estuarine conditions. Shells from two environments are represented in the deposit - a rocky or hard substrate fauna and a mud facies fauna. The proportion of these components changes through the deposit, with rocky facies species, particularly Mytilus, decreasing in abundance towards the east and top of the deposit. Mud facies shells show the reverse trend (Table 2). A change of this type is attributed to a gradual infilling of the estuary by sediment during the transgressive phase of an interglacial. This would also be consistent with the changes in Ammonia beccarii abundance through the deposit (Table 3).
Pleistocene shell beds of the Hopkins River, Warrnambool
335
Table 6 Characteristics of Middens and Marine Shell Deposits. CHARACTERISTICS
MARINE SITEC THUNDER POINT MALLACOOTA MIDDENS SHELL BEDS SITE B SAMPLES 1-9 (High Energy) (Estuarine) 1
1
MIDDENS Charcoal present
X
Artefacts present
X
Hearth stones present
X
Animal bones present
X
Exoskeletons of edible crustacea +
X
X X
X
X X
X
X
X
X
Evidence of burnt shell and/or crustacea*
X
X
X
X
Evidence of burnt bone
X
Edible shells predominant
X
X
X
X
Evidence of size selection present in edible shells
X
X
X
Evidence of species selection
X
X
X
X
No evidence of internal stratification
X
X
X
X
MARINE SHELL DEPOSITS Well-stratified, sedimentary features of water laid deposits
X
X
Waterworn pebbles/boulders
X
X
X
Varied shell species
X
X
X
- edible species
X
X
- nonedible species
X
No evidence of species selection
X
Forms of marine life (other than mollusca) not used by Aborigines
X
Shells often worn due to water transport
X
Full range of shell sizes S X X
X
KEY: Coastal midden sites; S Wide size range available for some species; + Other than Balanus, e.g. crab, crayfish; * including Balanus 1
The presence of a muddy/clay matrix at of the Hopkins River is a basaltic plain. Basalt Site C, rather than a sandy matrix as found contains little quartz and weathering produces at Sites A and B, can be explained by reference mainly clay minerals. Thus upstream in the to the present estuary. Much of the catchment estuary, river transported mud predominates.
336
E.D. Gill, J.E. Sherwood, J.H. Cann, P.J. Coutts & C.J. Magilton
At the mouth, however, calcareous sand is carried into the estuary from the coast, forming a flood tide delta. Presently these sandy deposits extend about 1 km upstream. At times of higher sea level, they may have extended upstream as far as Site B, approximately 3 km from the present estuary mouth. Origin of Barnacle Bioclasts Banks of disarticulated barnacle plates are not unknown in older geological contexts (e.g. in the upper Pliocene Te Aute Limestone deposits in New Zealand, Buckeridge 1983), but the mixed deposit at Site C is unique in the authors' experience. Balanus is gregarious, colonising the intertidal and subtidal zones and occurs in immense numbers (Dakin 1960). Balanus variegatus, in particular, is a species adapted to estuarine conditions and attaches itself to any solid substrate. Several mechanisms can be envisaged by which barnacles could be dislodged from their substrates in tens of thousands: (i) At times of maximum glaciation and consequent low sea level the present Hopkins estuary would have been a terrestrial stream valley. Under such conditions, trees would have grown down to the margins of the stream. Subsequent flooding during an interglacial marine incursion created estuarine conditions in which sessile organisms such as barnacles and mussels opportunistically settled on submerged trees. In time submerged trees decomposed, so releasing shelly material into the estuarine transport system. It is also possible that mangroves provided attachment sites (e.g. Dakin 1960, 209). At present the western limit of mangroves (Avicennia marina) in Victoria is at the Barwon River estuary, Geelong, approximately 160 km east of Warrnambool. Under different palaeoclimatic conditions they may have existed in the Hopkins River estuary. (ii) At the base of present-day cliffs along the estuary, boulders occur in both subtidal and intertidal environments. Presumably such was the case in previous times of high sea
level. These provide an excellent substrate for attachment of sessile organisms. The presence of barnacle scars over all surfaces of limestone clasts in the basal conglomerate shows these boulders were tumbled after colonisation by barnacles. This could also have provided a source of barnacle plates.
Formation of Site C Such mechanisms can explain the presence of mussels and barnacles as bioclastic components of sediments at all three sites. They do not explain their concentration at Site C. Rounding of boulders, their rotation and transport, as well as the fragmentation and random orientation of shells in fairly steeply dipping beds requires higher energy than that normally associated with estuaries. Sources of this energy could be river floods, tides and winds. Floods are the most likely means of moving boulders along the estuary. Site C occurs in an embayment to the east of a headland of Tertiary limestone. It is on the outside of a bend (Fig. 1), and has probably had this configuration in the past because of the alignment of the Tertiary limestone cliffs in this part of the estuary. Boulders would have been trapped in the embayment along with shells which were sorted from their muddy substrate and concentrated in random orientation. During normal lower energy periods, finer sediment infiltrated this coarse material as matrix. Wind-generated wave energy appears to have reworked the resultant deposit to create beach face bedding, dipping at 24-30° to the north and east. Winds from this direction would have a fetch of about 1.5 km, but are considered unlikely to generate waves of sufficient energy to shift boulders of the sizes observed in the deposit. Tidal currents are slight on this micro-tidal coast (maximum 'Springs' range = 1 m). They are unlikely to have been sources of sufficient energy to transport the materials observed in the deposit.
Pleistocene shell beds of the Hopkins River, Warrnambool Floods were infrequently occurring events superimposed on the low energy environment as the estuary, slowly infilled during the transgression. At the present time, larger floods completely flush all salt water from the estuary, providing a modern analogue for the conditions which may have prevailed (Sherwood 1985). Reworking of the estuary floor by floods or waves would continue to contribute shells to the deposit. It is possible that the blackened barnacle plates are reworked from estuarine reducing muds. The presence of some paired bivalves and whole barnacles with valves intact shows that some animals were deposited on the beach either alive or soon after death. With falling sea level during a Late Pleistocene glacial episode, fluvial erosion of the estuarine sediments undermined the shell beds at Site C. Gravitational slumping caused fissures which became filled with calcareous blown sand and silt to form the two dyke-like calcretes. This calcareous loess also covered the top surface of the deposit, sealing it and forming the present cliff top. Sand was blown up, possibly from the bared river floor, forming a dune deposit over the shell bed.
CONCLUSION This paper has explored two themes, one dealing with the criteria by which human occupation sites can be distinguished from shell beds of 'natural' or 'non-predator' origin, and the other with the variable nature of natural estuarine shell beds. Based on its foraminiferal abundances, Site C has been shown to be a natural shell bed and not a midden. Use of microfossil abundances to help distinguish predator from naturally derived shell beds has not previously been described. The worth of the technique has been clearly demonstrated in this study and may prove to be a valuable tool for archaeologists. Clear differences, both faunal and sedimentological, between Site C and Sites A and B imply an unusual estuarine environment for emplacement of the former. Mechanisms have
337
been postulated to explain both the predominance of barnacles and high energy sedimentological features at Site C. All three shell beds are at least Last Interglacial in age. ACKNOWLEDGEMENTS Mr. J. Henry, Warrnambool drew our attention to Site C. A research grant for radiocarbon dating was provided by Warrnambool Institute of Advanced Education. The research was aided by many people. Dr. M. Barbetti assisted with analysis and interpretation of radiocarbon dates. Dr. E.R. Segnit, Division of Mineral Chemistry, CSIRO, Melbourne cut and interpreted calcrete thin sections from Site C. Ms. S. Boyd, Museum of Victoria identified many of the molluscs. Dr. J.S. Buckeridge, Carrington Technical Institute, Auckland and Dr. B.A. Forster, University of Auckland, NZ identified the barnacles and provided much useful advice. Dr. B.F. Teach and G. Mason, University of Otago, Dunedin, NZ, Dr. G. Poore, Museum of Victoria and Prof. D.T. Anderson, Sydney University provided advice on barnacles. Dr. J.A. Lewis, Materials Research Laboratory, Maribyrnong provided the shell/body weight data for Balanus. Dr. M. Sullivan, Ms. R.K. Barz and Dr. J. Hall gave information on the distribution of barnacles in middens. Mr. A. Goede, University of Tasmania carried out ESR analysis of shells. Mr. R.C. Kershaw, Launceston identified terrestrial snails at Site C. Dr. R. Clark, University of Liverpool, U.K. and Dr. G. Singh, Australian National University examined samples for charcoal and pollen. Mr. Don Hough, Victoria Archaeological Survey provided much useful discussion. SACAE financially supported the field and laboratory work of John Cann. Sue Dowie typed the manuscript. David Brittan drafted Figure 1. We thank Dr. A. Belperio, Dr. V. Gostin and the paper's referees for critically reviewing the manuscript. They suggested several changes in structure and content which we adopted for publication. Many other colleagues have inspected these sites, particularly Site C. Their comments and support have been much appreciated.
338
E.D. Gill, J.E. Sherwood, J.H. Cann, P.J. Coutts & C.J. Magilton
REFERENCES
BAKER G. 1944. The geology of the Port Campbell district. Proceedings of the Royal Society of Victoria 56, 77-111. BELPERIO A.P., SMITH B.W., POLACH H.A., NITTROUER C.A., DEMASTER D.J., PRESCOTT J.R., HAILS J.R. & GOSTIN V.A. 1984. Chronological studies of the Quaternary marine sediments of northern Spencer Gulf, South Australia. Marine Geology 61, 265-296. BOWLER J.M. 1976. Recent developments in reconstructing late Quaternary environments in Australia. In Kirk R.L. & Thorne A.G. eds. The Origin of the Australians, pp.55-77. Australian Institute of Aboriginal Studies, Canberra. BUCKERIDGE J.S. 1983. Fossil barnacles (Cirripedia: Thoracica) of New Zealand and Australia. New Zealand Geological Survey Paleontological Bulletin 50, 113-114. CANN J.H. 1978. An exposed reference section of the Glanville Formation. Quarterly Geological Notes, Geological Survey of South Australia 65, 2-4. CHAPPELL J. 1983. A revised sea level record for the last 300,000 years from Papua-New Guinea. Search 14, 99-101. COUTTS P.J.F. 1966. Features of prehistoric campsites in Australia. Mankind 6, 338-346. COUTTS P.J.F., APLIN K. & TAYLOR N. 1984. Archaeological investigations at Captains Point, Mallacoota. In Coutts P.J.F. ed. Coastal Archaeology in South-eastern Victoria, pp. 1-114. Records of the Victorian Archaeological Survey, No. 14, Melbourne. DAKIN W.J. 1960. Australian Seashores. Angus and Robertson, Melbourne. GILL E.D. 1951. Aboriginal kitchen middens and marine shell beds. Mankind 4, 249-254. GILL E.D. 1971. Evolution of the Warrnambool - Port Fairy coast and the Tower Hill eruption, Western Victoria. In Jennings J.N. & Mabbutt J.A. eds. Landform Studies from Australia and New Guinea, pp.340-364. Australian National University, Canberra.
GILL E.D. 1981. Potassium/Argon age of basalt in floor of Hopkins River, Allansford, S.W. Victoria, Australia. Victorian Naturalist 98, 188-190. GILL E.D. 1987. Sea level changes in the Quaternary indicated by evidence from Western Victoria, Australia. In Yoshikawa T. ed. Inventory of Quaternary Shorelines - Pacific and Indian Oceans Region, pp. 115-117. NODAI Research Institute, Tokyo. GOEDE A. 1989. Electron spin resonance - a relative dating technique for Quaternary sediments near Warrnambool, Victoria. Australian Geographical Studies 27, 14-30. GOEDE A. & HITCHMAN M.A. 1987. Electron spin resonance analysis of marine gastropods from coastal archaeological sites in Southern Africa. Archaeometry 29, 163-174. GROUBE L., CHAPPELL J., MUKE J. & PRICE D. 1986. A 40,000 year old human occupation site at Huon Peninsula, Papua New Guinea. Nature 324, 453-455. HUGHES P.J. & SULLIVAN M.E. 1974. The redeposition of midden material by storm waves. Journal and Proceedings of the Royal Society of New South Wales 107, 6-10. MacPHERSON J.H. & GABRIEL C.J. 1962. Marine Molluscs of Victoria. Melbourne University Press, Melbourne. MARINE RESEARCH GROUP OF VICTORIA 1984. Coastal Invertebrates of Victoria. Museum of Victoria, Melbourne. PEARCE R.H. & BARBETTI M. 1981. A 38,000 year old archaeological site at Upper Swan, Western Australia. Archaeology in Oceania 16, 173-178. POZORSKI S. & POZORSKI T. 1979. Alto Salaverry: A Peruvian coastal preceramic site. Annals of the Carnegie Museum 48, 337-375. SHERWOOD J.E. 1985. Hydrodynamics of South- West Victorian Estuaries. Faculty of Applied Science and Technology, Warrnambool Institute of Advanced Education. Research Report 85,1-27.
Human dispersal from Wallacea to Sahul: a re-appraisal J.A. PETERSON Department of Geography and Environmental Science, Monash University, Clayton, Victoria 3168, Australia. In the absence of archaeological data from glacial low sea level occupation sites on the continental shelf, debate about the nature and antiquity of human dispersal to and within Sahul (Greater Australia) is tied to models. Both 'dreamtime' and archaeological models assume initial migration from across the sea. These are here dubbed 'water-gap* models and include those based on archaeological arguments, all of which, to date, have regarded water-craft as mandatory. However the ethnographic record and associated experiments upon which the models are based leave them severely constrained. The debate has therefore been held to 'shortest hop' routes, glacial low sea level times, and tiny founding populations. It is argued here that the comparatively rare but well-documented occurrences of floating islands provide scope for widening the debate about how, when and where humans crossed the water-gaps within and east of Wallacea, leading to the peopling of Sahul. Key words: dispersal models, floating islands, founding populations, Greater Australia, human migration, Sahul, Wallacea.
INTRODUCTION.
ethnographic record may document an inferior water-craft to that used during the crossing of Wallacea (e.g. White & O'Connell 1979). Even during the time of lowest glacioeustatic sea level, the crossing route made up mostly of short (deliberate?) stages and with the least number of long (eg. 10 km) voyages culminates in a crossing of 90 km. The total time needed for humans to colonise Wallacea is increased by the need for such chance crossings. Nevertheless water-craft are always invoked so the models may be dubbed 'watercraft' models.
Models purporting to explain the first human colonisation of Sahul include some which will be very hard to test and might be grouped as 'dreamtime models' (reviewed briefly in Flood 1983), and some which will be hard but should not be impossible to test and which acknowledge (as do some dreamtime models) that the first humans arrived from across the water ('water-gap' models). So far, all archaeologically-based water-gap models (e.g. Jones 1979) assume that it was by deliberate voyages of small founding populations probably (but not necessarily) during times of glacial low sea level. All possible migration routes (Fig. 1) include watergaps demanding 'over-the-horizon' journeys, and are generally regarded as including 'accidental' segments that must have been very dangerous for the participants (White & O'Connell 1982) especially if the only skill and 'boats' they had were those known from the ethnographic record (excluding Melanesianinspired outriggers; see Rowland 1987). Experiments by Jones (1977) suggest that journeys over 10 km would have been particularly hazardous in such circumstances, although others have suggested that the
The 'water-craft' model is perhaps most compatible with Birdsell's (1977) migration routes which favour times of glacial low sea level, and so, much of the discussion is centred on the 'lows' of the glacio-eustatic sea level curve (inset Fig. 1) and confined to the consideration of most likely routes at that time (Fig. 1). A water-craft crossing to Sahul is usually assumed or invoked, and inevitably there have been debates about the nature and number of 'founders' required to explain the peopling of Sahul. Floating islands are generally bigger than canoes and dugouts, and could carry large groups of people if they 339
J.A. Peterson
340
happen to find themselves 'aboard' at the appropriate time. It is argued here that the comparatively rare but well-documented occurrences of mobile floating islands provide scope for an alternative to the 'water-craft' model, serving to J20°E
widen the debate about how and when humans might have crossed the water-gaps of Wallacea and the gaps separating Wallacea from Sahul, and (especially as water-craft models favour 'shortest hop' stages and landfalls in the northwest), subsequently dispersed within Greater Australia.
-150G -100CQ_VJ"a> > X -50CCajOTJ 0~ 0 03
Age(kyr)
160
200
New Ireland > ®
^^>Matenkupkum
Huon Peninsula
30°S-
a Archaeological sites referred to in text. © see Cosgrove, (in press) Glacial low sea level ® see Smith, 1987 coast (Greater Australia) ® see Groube etal., 1987 Interglacial (present) coastline ® see Allen et a/., 1988
320 640
— —
Kilometres
Florentine River 150°E
Fig. 1 Modern and Greater Wallacea and adjacent regions, showing land and sea distribution during glacio-eustatic high and low sea levels (discounting tectonic influences). Migration routes from Birdsell (1977) and glacio-eustatic sea level curve from Chappell and Shackleton (1986).
Human dispersal from Wallacea to Sahul: a reappraisal
Floating Islands Natural floating mats are recorded from many parts of the world (Burns et al 1985), from lakes (e.g. Beadle 1974, 246; Heusser 1983), rivers (Boughey 1963; Junk 1970) and the open sea (Smithsonian Institute 1970). They can form in various ways: landslides of (usually vegetated) peaty soils into lakes (D.A. Adamson, pers. comm.) or seawater (G.E. Wilford, pers. comm.); in situ growth of vegetation mats (Miller et al 1981; Mitchell et al 1980); or flotation of peat soils (usually bound by roots of woody vegetation) after storm surges, river floods or lake level risings (Peterson 1987). In all cases buoyancy is a prerequisite. Given this, durability is a function of structural integrity which, in turn, is determined by the capacity of the living part of the island to maintain its equilibrium in the face of destructive forces, such as fire, wave attack, or hogging and sagging while riding sea or swell waves. In general, ocean-going floating islands are most likely to be shortlived; wave wash-over would gradually eliminate enough of the island's lens of fresh water to deplete soil air and kill vegetation around the edges, thus hastening erosion and diminishing buoyancy and horizontal mobility. The forces acting on a floating island determine the speed and direction of movement and are analogous to those acting on mobile lake ice (Peterson 1965) during the partialopen-water season. In contrast to such ice rafts, many floating islands carry vegetation, perhaps including trees, which act as sails. Burns et al (1985, Appendix A) examined the forces acting and concluded that comparatively low wind velocities are required to mobilise free-floating islands with vegetation standing 2 m or more tall. Greater island width athwart the wind gathers more momentum so that, for instance, an island of 30 m width and 3-4 m tall will move 17 km in a day if subject to a persistent wind of 18 km per hour. Such an island would hold a lens of fresh water to sustain passengers during the 5-6 days needed at this rate to cross a 100 km water-gap. But are there any modern
341
analogues that would support a 'floating island' model for the migration of the first Sahulians across Wallacea? Modern Analogues The sighting of floating islands at sea is a rare event; such a thing is unscheduled, shortlived and usually undocumented. Two examples will be cited here. i) The Windward Passage Floating Island (Smithsonian Institute 1970): On July 4th, 1969, an island some 15 m in diameter bearing 10-15 trees 10-12 m tall was included in the daily notice to mariners as posing a navigation hazard between Cuba and Haiti (Fig. 2). The island was described as looking 4'as though it were held together by a mangrove-type matting; there could be some earth on it but looked kind of bushy around the bottom, like there was dead foliage, grasslike material or something on the island itself. The trees were coming up out of that. It looked like the trees came right out of the surface brown layer. No roots were visible." (Lieut. M. McWhirter, 12th July 1969) By the 14th of July the island had apparently broken up and the parts had partially submerged so that only the upper tree trunks were above the water. By July 19th, no trace of the island was found after an intensive six hour search (Smithsonian Institute 1970). ii) The Aldabra Floating Island: During work at the Royal Society research station in Aldabra in 1973, Dr. R. Hnatiuk (pers. comm.) sighted a half-submerged bamboo thicket carrying live fauna (e.g. crabs) accompanied by a large area of floating and submerged flotsam. Its nature, passengers, trajectory and position suggested that it came from Madagascar, or possibly the African mainland, rather than from any nearby islands. The half-submerged condition of the island is not surprising in that a minimum migration of 400 km is indicated (Fig. 3).
342
J.A. Peterson
Fig. 2 Reported sightings of the Windward Passage Floating Island.
When expedition results are published, attention may be drawn to the fact that the terrestrial environmental record at Aldabra has been completely interrupted several times by submergence, and that subsequent ecesis following emergence seems, from the palaeoenvironmental record, to have been uninhibited. Clearly, floating islands have withstood the stresses of mobility, wind and waves at sea for ten days or so. After such a period moving in the one direction before an 18 km/h wind, an island 4 m tall (and moving at 0.2 m/s or 0.72 km/h; see Burns et al 1985, Fig. 9) would cross a gap of about 173 km. The Windward Passage floating island (more than twice as tall) was travelling at five times this speed during part of its journey. The less well-documented Aldabra example was probably afloat for longer than ten days.
Either of these islands could have transported a founding human population. There is no reason to suppose that floating islands could not have occurred any time, including those that saw human dispersal across water-gaps. The period in question includes more than one post-glacial marine transgression, a process that no doubt dismembered many peaty coastal deposits and riparian swamps, modern counterparts for which include examples with abundant peat accumulations at the coast (Anderson 1964). The Comparative Viability of the Water-Gap Models During any stage of Late-Cainozoic sea level history, the dispersal from Sunda to Sahul involved crossing water gaps in the island-studded region known biogeographically as Wallacea (but see Simpson 1977).
Human dispersal from Wallacea to Sahul: a reappraisal
Fossils from terrestrial deposits in modern Wallacea may not fully represent the biogeography of Greater Wallacea, but even if they did some puzzles would still remain. Mice and rats may have crossed the Wallacean water-gaps clinging to logs (Calaby 1976) or vegetation rafts (Calaby 1978) but surely not founding populations of larger animals. The
343
Timor Stegadons are thought to have arrived there by swimming across water-gaps (Johnson 1980). For human dispersal, watercraft more sophisticated than encountered in Australia by early European explorers is invoked (e.g. Jones 1979,448). The earlier the first human invasion turns out to be (e.g. Singh et al 1981; Singh & Geissler 1985) the
344
J.A. Peterson
more remarkable the supposed water-craft must be regarded. The putative swimming distances are equally impressive. A floating island model offers an alternative explanation. Conceptual and technical demands of water-craft are not required. Shelter, fresh water and some food for a handful of people is provided, even if embarkation was unwitting and departure unscheduled (nocturnal?). Slow but steady progress could have been made during the peak of the northwest monsoon season. Migration this way is not tied to glacial low sea level, nor are routes tied to 'shortest hops'. Instead, seasons and trajectories for the most persistent winds, and times of shoreline disturbance, or of landslides above coastlines become more important as determining factor. Sahulian Dispersal Models Early 1980s models representing hypotheses for the peopling of Australia (included in Figure 4, after Flood 1983) need updating because there is now archaeological evidence that humans did not necessarily first enter Australia from the northwest. Earliest occupation for eastern New Guinea and adjacent islands (Groube 1986; Allen et al 1988; Allen 1989) no longer post-date those found in Australia. Moreover, within Australia, patterns of dispersal represented in Figures 4a, 4b and 4c must now be viewed in the light of evidence from a number of sites (e.g. Smith 1987; see Fig. 1).
The addition of 4d to Figure 4 seems appropriate. The peopling of Greater Australia from Wallacea can have occurred after landfall anywhere between Waigeo and the Timor Gap. Migration from the northern fringes of Greater Australia may have occurred anywhere across the Arafura plains or around the shores of Lake (or Gulf of) Carpentaria (Jones & Torgensen 1988). Thus the coastal colonisation model can be modified to envisage migration along the northern coast of New Guinea (where glacial low sea level features have been preserved from much marine erosion by tectonic uplift) and along the shores of the Coral Sea to Cape York, or alternatively over the Arafura Plains across the rivers draining south from the ranges of Irian Jaya. SUMMARY A new 'water-gap' model is proposed that does not depend on cultural 'water-craft', but instead is based on a geomorphic analogue documented from modern records. In contrast to the 'water-craft' model, it does not constrain hypothesis generation to favour 'shortest hop' routes and glacial low sea level times. ACKNOWLEDGEMENTS Many helpful comments were offered on the conference paper from which the present work was developed, and accordingly I would
Fig. 4 Models for the dispersal of the first Australians (partly from Flood 1983): a-d, left to right.
Human dispersal from Wallacea to Sahul: a reappraisal like to thank Associate Professor D. Adamson, Dr. P. Davies, Dr. F. Gasse, Dr. G. Nanson (who drew my attention to the Windward Passage Floating Island), Mr. C. Pigram, Dr. L. Sutherland and Dr. G. Wilford. I would like to thank Professor M.A.J. Williams and Dr. P. Rich and an anonymous referee for their comments on the manuscript, which was prepared by Mrs. M.C. Price. Mr. G. Swinton and Ms. S. Tomlins prepared the figures. REFERENCES ALLEN J. 1989. When did humans first colonise Australia? Search 20, 149-154. ALLEN J., GODSEN C., JONES R. & WHITE P.J. 1988. Pleistocene dates for the human occupation of New Ireland. Nature 331, 707-709. ANDERSON J.A.R. 1964. The structure and development of peat swamps of Sarawak and Brunei. Journal of Tropical Geography 19, 7-15. BEADLE L.C. 1974. The Inland Waters of Tropical Africa. Longman, London. BIRDSELL J.B. 1977. The recalibration of a paradigm for the first peopling of Greater Australia. In Allen J., Golson J. & Jones R. eds. Sunda and Sahul, pp. 113-67. Academic Press, London. BOUGHEY A.S. 1963. The explosive development of a floating weed vegetation on Lake Kariba. Adansonia 3, 49-61. BURNS F.L., MORESBY J.F. & PETERSON J.A. 1985. The floating islands of Pirron Yallock, Victoria. Australian Society of Limnology Bulletin 10, 15-32. CALABY J.H. 1976. Some biogeographical factors relevant to the Pleistocene movement of man in Australasia. In Kirk R. & Thorne A. eds. The Origin of the Australians, pp.23-28. Australian Institute of Aboriginal Studies, Canberra. CALABY J.H. 1978. Dispersal and establishment of animals. In Walker D. & Guppy J.C. eds. Biology and Quaternary Environments, pp. 185-194. Australian Academy of Sciences, Canberra. CHAPPELL J.M.A. & SHACKLETON N. 1986. Oxygen isotopes and sea level. Nature 324,137-140.
345
FLOOD J. 1983. Archaeology of the Dreamtime. Collins, Sydney. GROUBE L. 1986. A 40,000 year old human occupation site at Huon Peninsula, PNG. Nature 324, 453-455. HEUSSER C.J. 1983. Quaternary pollen record from Laguna de Tagua, Tagua, Chile. Science 219, 1429-1432. JOHNSON D.L. 1980. Problems in the land vertebrate zoogeography of certain lands, and the swimming power of elephants. Journal of Biogeography 7, 383-398. JONES M.R. & TORGENSEN T. 1988. Late Quaternary evolution of Lake Carpentaria on the Australian - New Guinea continental shelf Australian Journal of Earth Science 35, 313-324. JONES R. 1977. Man as an element of a continental fauna: the case of the sundering of the Bassian bridge. In Allen J., Golson J. & Jones R. eds. Sunda and Sahul, pp.317-86. Academic Press, London. JONES R. 1979. The fifth continent: problems concerning the human colonisation of Australia. Annual Review of Anthropology 8, 445-66. JUNK W. 1970. Investigations on the ecology and productivity-biology of the 'floating meadows' (Paspalo-Echinochloetum) on the middle Amazon: Pt. 1. The floating vegetation and its ecology. Amazoniana 2, 449-495 (see especially Plates 12 and 13). MILLER I.L., NEMOSTOTHY L. & PICKERING S.E. 1981. Mimosa pigra in the Northern Territory. Department of Primary Industry, Darwin, Northern Territory, Technical Report 51. MITCHELL D.S., PETR T. & VINER A.B. 1980. The water fern Salvina molesta in the Sepik River, Papua New Guinea. Environmental Conservation 7, 115-122. PETERSON J.A. 1965. Ice-push ramparts in the George River Basin, Labrador-Ungava. Arctic 19, 189-193. PETERSON J.A. 1987. The floating islands of Pirron Yallock. Australian Geographic 7, 18. ROWLAND M.J. 1987. The distribution of Aboriginal water-craft on the east coast of Queensland: implications for cultural contact. Australian Aboriginal Studies 2, 38-44.
346
J.A. Peterson
SIMPSON G.G. 1977. Too many lines: the limits eds. Fire and the Australian Biota. Australian of the Oriental and Australian zoogeographic Academy of Science, Canberra. regions. Proceedings of the American Philosophical SINGH G. & GEISSLER E.A. 1985. Late Society 121, 107-120. Cainozoic history of vegetation, fire lake levels and SMITHSONIAN INSTITUTE 1970. Annual climate at Lake George, New South Wales, Report 1969, Smithsonian Institute Centre for Australia. Philosophical Transactions of the Royal Short-lived Phenomena. Smithsonian Institute, Society, London B311, 379-447. Cambridge, Massachusetts. WHITE J.P. & O'CONNELL J.F. 1979. SMITH M.A. 1987. Pleistocene occupation of arid Australian prehistory: new aspects of antiquity. Central Australia. Nature 328, 710-11. Science 203, 21-28. SINGH G., KERSHAW A.P. & CLARK R. 1981. Quarternary vegetation and fire history in Australia. In Gill A.M., Groves R.H. & Noble I.R.
WHITE J.P. & O'CONNELL J.F. 1982. A Prehistory of Australia, New Guinea and Sahul. Academic Press, Sydney.