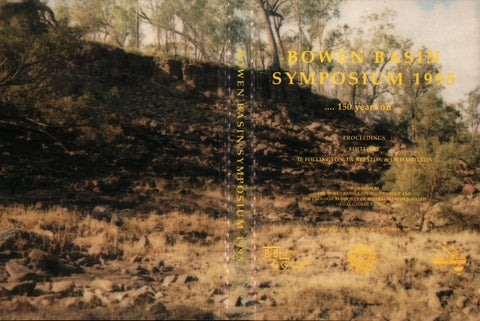
BOWEN BASIN SYMPOSIUM 1995 .... 150 years on •••• PROCEEDINGS EDITED BY IL FOLLINGTON, JW BEESTON & LH HAMILTON
ORGANISED BY THE BOWEN BASIN GEOLOGISTS GROUP AND THE GEOLOGICAL SOCIETY OF AUSTRALIA INCORPORATED COAL GEOLOGY GROUP
MACKAY, QUEENSLAND, 1- 3 OCTOBER, 1995
Organised by: Bowen Basin Geologists Group and GSA Inc Coal Geology Group Organising Committee: M Biggs - Chairman K Preston - Secretary C Pattison - Treasurer J Beeston A Davies I Follington D Green L Grimstone R Haines L Hamilton P Hatherly S Hayes B McKavanagh S Matheson K O'Reilly B Saunders C Shekhar C Wallin Proceedings prepared by: JW & SA Beeston Desktop Publishing Services Proceedings published by: GSA Inc Coal Geology Group © Geological Society of Australia Inc ISBN 0-909869-98-7 Issued October 1995 Printed by: Merino Lithographies Pty Ltd COVER PHOTO: A coal outcrop believed to be the one discovered by Leichhardt 150 years ago . The outcrop lies in the western bank of the Mackenzie River about 23.5km north-north-east of Comet. The seam is about 6m thick and contains numerous tuff, stony coal and carbonaceous shale bands. It occurs in the Fair Hill Formation. Don King in his paper "A History of Coal at Blackwater" refers to Leichhardt's observation of a coal outcrop "on the banks of the Mackenzie River 17 miles north-west of the present location of Blackwater". King describes the outcrop as "a thick seam of carbonaceous shale with laminations of coal ... still to be seen in the west bank of the River at the site of Leichhardt's discovery". This location and description of the seam match the site at which the photo was taken. Photo supplied by courtesy of David Broome, Curragh Queensland Mining Ltd.
CONTENTS
REGIONAL GEOLOGY AND EXPLORATION 1 An overview of recent exploration activity in the Bowen Basin............ ........ .......... .. . Matheson 7
Revised palaeogeographic maps for the Bowen Basin, Central Queensland. . . ................. .. . . ..... . . . ........... Fielding, Stephens, Kassan & Holcombe 17 Cyclothermic motifs in the Upper Permian Moranbah Coal Measures. . .... . . . ................ Michaelsen 27 Structural events and deformational styles in the Bowen Basin. ....... . . ........... ... Korsch & Totterdell 37 Geology of the Nebo West Anthracite Deposit. . . ................. ..... .. .... O'Reilly, Buz.acott & Quinn 47 Exploration for the Newlands underground mine ........................... Francis, Seedsman & Whitby EXPLORATION TECHNIQUES SS The Potential of surface and down-hole seismic in multi-layer basalts.................... Evans & Urosevic 65 Integi:ation of computer modelling processes into coal exploration in the Calhde Coal Measures Basin.... .. . .... ... ........ ....................... .. ... . . . .. Jorgensen & Biggs COAL QUALITY AND UTILISATION 81 Geological inputs and plant design for utilisation of Queensland coals in AUST A Electric power stations......... ............ ........................... .. ... Hutton & Turner 89 Use of coal in cement industry........................... ........................... ........ Caldwell 93 Classification of humic coals for resource characterisation (Draft ISO Standard) .... ........................... ..................... . ..... Quinn, Esterle & Bailey MINING GEOLOGY AND GEOMECHANICS 99 A comparison between the borehole image processing system and logging of oriented drill-core in determining fracture characteristics within coal seams. . ................. Choi & Saul 109 The University of NSW pillar design approach and its application to underground mine design issues in the Bowen Basin. . ........................... .Galvin & Hebblewhite 117 Seismic monitoring for mapping of longwall caving at Gordonstone Mine .. ..... ...... ... .............. .. ....... Hatherly, Luo, McKavanagh, Dixon & Devey 127 Geological factors which impact on the viability and effectiveness of highwall mining in the Bowen Basin. . . . . . . . . . . . . . . . . . . . . . . . . . . . . . . . . . . . . . . . . . . . . . . . . . . . . . . Follington 137 Material characterisation for open pit mining geomechanics.... ... . . ..... ... . ... ... Simmons & McManus 147 Information from geology: imJ)lications for soil formation and rehabilitation in the post coalmining environment, Bowen Basin, Queensland. . ............... .... Spain, Esterle & McLennan COAL QUALITY 157 !he appli~ation of SIRO1:0G to predicting coal quality variations in situ, . m a steaming coal operation. . ........................... ....... . .... ..... ......... . . ...... .... Biggs 173 An improved ash-fusion test. ............ ..... ... . ...... ..... ........... Coin, Kahraman & Reifenstein 183 Practical coal quality evaluation of export coals....................... .. ....................... Juniper EXPLORATION 191 Geotechnical investigations and pit wall design in faulted ground at Eastern Creek South. . ...... ........................... ............... .. . Seedsman, Cameron & Peou 197 3D visualisation of borehole sedimentology data ............... ................ Poulsen, Esterle & Meyer 201 Inseam drilling for exploration - where are we and where are we going? ......................... Hanes COAL SEAM GAS 205 Hydrocarbon generation in Permian coals of Queensland, Australia: source of coalseam gases. . ....... ..... Glikson, Golding, Lawrie, Sz.abo, Fong, Baublys, Saxby & Chatsfield 217 Nature and origin of fractures in permian coals from the Bowen Basin and the relationship with in situ reservoir permeability. . ........ Pattison, Fielding, McWatters & Hamilton 235 Gas sorption dynamics of Bowen Basin coals. . ................ . ............ . ....... Beamish & Crosdale UNPRESENTED PAPERS 239 Analysis of mining conditions by integration of highwall mapping and geological modelling techniques. . ................. ....... ........................... Godfrey & Thrift 247 Basin phases and sequence stratigraphy of the Bowen Basin.......... Totterdell, Brakel, Wells & Hoffmann 257 Location of coal subcrop at Callide Coalfields using the TSIM geophysical method ................. Nichols
CONTENTS
POSTER PAPERS 265
The Blair Athol Coal Mine . . . . . . . . . . . . . . . . . . . . . . . . . . . . . . . . . . . . . . . . . . . . . . . . . . . . . . . Pacific Coal Pty Ltd
271
Collinsville Coal Mine . . ............ . .. ..... ....... ................ Collinsville Coal Company Pty Ltd
275
The Daunia Coal Deposit . . . . . . . . . . . . . . . . . . . . . . . . . . . . . . . . . . . . . . . . . . . . . . . . . BHP Australia Coal Pty Ltd
283
The Ensham Coal Mine ..... . .. ... ........................... .... . ........ Ensham Resources Pty Ltd
289
Goonyella/Riverside Mine ..... .. ..... ................. .................. BHP Australia Coal Pty Ltd
299
Gordonstone Mine ............. ... ......... . ..... ..... ....... Gordonstone Coal Management Pty Ltd
303
The Grosvenor Coal Deposit (EPC552) ....... . ......... . ............ The Shell Company of Australia Ltd
309
The Hail Creek Coal Deposit . . . . . . . . . . . . . . . . . . . . . . . . . . . . . . . . . . . . . . . . . . . . . . . . . . . . . Pacific Coal Pty Ltd
315
The Jellinbah Station Coal Deposit .... ........................... ........ . .... ...... .. AUST A Electric
321
The Meandu Coal Mine, Tarong Basin ........................... ..... .. ........ .. Pacific Coal Pty Ltd
329
The Meteor Park Coal Deposit ........ ...... ............. .. ........... .... . .. ... Mount Isa Mines Ltd
335
The Minerva Coal Deposit ........................... ...... ....... ........ New Hope Corporation Ltd
343
Moranbah North Coal Deposit ........................... .......... The Shell Company of Australia Ltd
351
The Moranbah South Coal Project .................. . ........................... Iscor Australia Pty Ltd
359
Newlands-Eastem Creek Area . . ............ . ..... . ........................... Newlands Coal Pty Ltd
369
Norwich Park Coal Mine ............ . .. .. ............ ........... . .... .... BHP Australia Coal Pty Ltd
377
The Peak Downs Mine .................. . ............. . ........ . . ..... . .. BHP Australia Coal Pty Ltd
385
The Pipeline Coal Deposit ........... . .......... •.................... ... . .. ...... Mount Isa Mines Ltd
389
The Poitrel Coal Deposit . . . . . . . . . . . . . . . . . . . . . . . . . . . . . . . . . . . . . . . . . . . . . . . . . BHP Australia Coal Pty Ltd
393
Saraji Mine . . . . . . . . . . . . . . . . . . . . . . . . . . . . . . . . . . . . . . . . . . . . . . . . . . . . . . . . . . . . . BHP Australia Coal Pty Ltd
401
South Blackwater Coal Mine .. ......... . ....... . ......................... . . South Blackwater Coal Ltd
409
The South Walker Creek Coal Deposit .. . ..... .......... ................... BHP Australia Coal Pty Ltd
417
The Suttor Creek Coal Deposit .... .................. ... ......................... Mount Isa Mines Ltd
423
The Theodore North Deposit ........................... ........... The Shell Company of Australia Ltd
431
The Theodore South Deposit. ........................... ........... The Shell Company of Australia Ltd
439
The Togara North Coal Project ........................... ....................... Savage Resources Ltd
445
The Valeria Coalfield . . . . . . . . . . . . . . . . . . . . . . . . . . . . . . . . . . . . . . . . . . . . . . . . . . . . . . . . . . . Pacific Coal Pty Ltd
453
The Winchester South Coal Deposit .. .. . . .. . . .. .. .. .. .. . . .. . . .. .. .. . . .. . . . . .. .. .. Pacific Coal Pty Ltd
459
The Wolfang Coal Deposit .......... ........... ..... .. ........................... Pacific Coal Pty Ltd
463
Yarrabee Coal Mine . ........................... .......................... JB Mining Services Pty Ltd
467
Yarrabee South Coal Deposit - MDLA 160 ........................... ....... JB Mining Services Pty Ltd
TRADE EXHIBITORS
BOREHOLE IMAGE PROCESSING SYSTEM For precision borehole imaging and mapping! - Oriented, real-time, colour, digital, high resolution (0.5mm) images which are permanently archivable. - Sedimentary structures, fractures, mineral veins/zones, dips and strikes, aperture width, fracture frequencies. - Most cost-effective geological survey of the boreholes.
Raax Australia Pty Ltd 6 Mann Place, Higgins, ACT 2615 Tel. (06) 254 409 Fax (06) 254 7891
6/21 Fitzroy Street Cleveland, Qld 4163 Tel & Fax (ITT) 821 4364 Mobile phone: 015486617 3 -dimensignol imo11~ -.::o:::o:::::i:::::i::i=
GEOSCIENCE ASSOCIATES AUSTRALIA PTY. LTD.
P.C. based digital acquisition systems and software Instrument sales and service A.P.I. calibrated Customised logging units
PROBING THE DEPTHS PHONE: (08) 391-2865 FAX: (08) 398-2411 20 Oborn Road, Mt. Barker, S.A. P.O. Box 697, Mt. Barker, S.A., 5251 Offices in Queensland and Indonesia AUSTRALIA"S OWN PROFESSIONAL WELL LOGGING SERVICE
TRADE EXHIBITORS
ENHANCING QUEENSLAND'$ THERMAL COAL INDUSTRY
Exa-Min Computer Services
ACIRL Coal Research & Consultants
FIRST IN COAL TECHNOLOGY WORLDWIDE ACIRL Provides a comprehensive coal consultancy Service that supplies the Industry with the WORLD'S BEST ADVICE on
Maptek Austex Supply
• Productivity & systems engineering studies • Mine planning & risk analysis • Directional in-seam drilling • Pre-mining geotechnical assessment • Long.vall support design & monitoring • Pillar extraction methods • Subsidence assessment • Computer-aided reclamation design
Ultramag Geophysics
• 3D Dragtine simulation • Dragtine bucket & rigging design • Coal quality assessment & testing • • • •
Greenfield resource assessment New clean coal products Pulverised coal combustion Cokemaking & coke in the blast furnace For more information on Coal Technology & related topics contact ACIRL Ud A.C.N. 000 513 888
BHP Engineering
14 Delhi Rd, North Ryde NSW 2113 Tel: +612 887 3777 Fax: +61 2 888 9912
TRADE EXHIBITORS
METS: Radio Imaging Method (RIM) to identify geology, hazards, optimum roadway. MECO McCALLUM: Leaders in underground conveyor technology. AUSTRALIAN LONGWALL: No-one has more experience in hi-tech underground mining.
Three strong links in the chain of underground roadway development
Meta Pty. Ud. Meco Mc:Callum Ply. Limited and Australian l..ongwall Pty Limited are all members of the Longwall lntemational group of companies
GEOPHYSICAL LOGGING SPECIALISTS COMMITTED TO THE ADVANCEMENT OF TECHNOLOGY * * *
PORTABLE, COMPUTERISED AND ANALOG EQUIPMENT SALES, RENTAL, SERVICE AND UPGRADES FULL RANGE OF DOWNHOLE TOOLS NEW TOOLS, TECHNIQUES AND SOFTWARE UNDER CONTINUAL DEVELOPMENT
*
CONT ACT: Bill Smith
*
(07) 376 5188 or FAX: (07) 376 6626
[ : . ] SLIMLINE SERVICES
Brisbane:
Roland Turner } Dennis Mylrea Emerald:
25 YEARS Continuous Service
Tony Redding
Ph: (07) 3881 1969 Fax: (07) 3881 0005 Ph/Fax: (079) 823 822
Newcastle:
to the Australian Coal Industry
CS I RO AUSTRALIA
Colin Mullen Perth:
Ph/Fax: (049) 546 116
Andrew Lees
Ph: (09) 356 2078 Fax: (09) 353 4025
Queensland Centre for Advanced Technologies 2643 Moggill Road, Pinjarra Hills, Queensland, Australia (Postal Address: PO Box 883, Kenmore, Qld 4069, Australia) TELEPHONE: (07) 212 4444i FACSIMILE: (07) 212 4455
TRADE EXHIBITORS
GEOPHYSICAL INSTRUMENTS AND SOFI'W ARE HELICOPTER SURVEYS For Resources Assessment, Mine Planning and Development
SALES • • • • • • • • • •
SERVICE
RENTAL
Magnetics SIROTEM Seismic Refraction & Reflection Borehole Logging Resistivity & IP Equipment Radiometrics Ground Probing Radar Magnetic Susceptibility Meters Gravity Meters Software for Mapping and Geophysical Applications
GEO INSTRUMENTS Pty. Ltd.
YOUR CHOICE MADE EASY
348 Rocky Point Road, RAMSGATE NSW 2219 AUSTRALIA.
Ph: 02 529 2355 Fx: 02 529 9726
1
An overview of recent exploration activity in the Bowen Basin
Stephen Matheson Department of Minerals and Energy, Queensland
Ludwig Leichhardt discovered coal 150 years ago on the banks of the McKenzie River 17 miles north-west of the present location of the town of Blackwater in 1845. Early attempts to mine coal in the region at Tolmies west of Blackwater in 1892 were not particularly successful but by 1901 coal was being mined near Jellinbah Station and in 1902 the Mammoth mine was opened (King, 1969). Coal was also discovered on the western side of the Bowen Basin at Blair Athol in 1864 and mined there from 1889 (Whitmore, 1985). During the early 1900s underground mines progressively developed in many parts of the Basin to supply the railways, local industries and power stations.
After Authorities to Prospect (ATP) were introduced in 1964 the numbers of current ATPs rose steadily to around 55 in 1973, jumping to 80 in 1974 before declining to 60 in 1977. Numbers increased dramatically to 160 in 1981, before quickly decreasing to between 50 and 60; a level maintained until the early 1990s (Balfe, 1988). The change in numbers of ATPs appears to have been directly related to the price of oil, because coal has long been regarded as a clear substitute for oil in power stations and industrial boilers. It is however worthwhile to note that in the Bowen Basin itself, these trends were not apparent due to the restrictions placed on exploration by RA55.
Although opencut mining was introduced at Blair Athol in 1936 and Callide in 1944 it was not until after the Second World War that systematic regional exploration for coal expanded significantly throughout the State (King, 1975). In 1949 Powell Duffryn Technical Services detailed all previous coal exploration work in Queensland and made a number of important recommendations. During this same post war period the Queensland Coal Board was appointed (in 1948) and in 1950 the Geological Survey of Queensland introduced a dedicated Coal Section and the Drilling Branch of the Department of Mines was expanded. Over the next 40 years the Geological Survey conducted exploration throughout Queensland to identify coal resources and improve the understanding of the coal bearing basins. Over 8000 coal boreholes and one million metres of core were drilled in that period (Department of Minerals and Energy, 1991).
RECENT EXPLORATION ACTIVITY LEVELS
In the 1950s land was generally made available for coal exploration or mining through small mining leases or proclamation areas but a number of companies were given larger areas for exploration under special legislation. In 1964, in order to simply administration of company coal exploration the concept of larger areas was provided in general legislation with the introduction of Authorities to Prospect and Special Coal Mining Leases. It was not until 1963 that underground mining commenced at Moura which lead to the development of a coking coal export industry from the basin. The introduction of these tenures and the prospects of an export industry saw exploration boom and in the interests of orderly exploration and development a Departmental reserve (55D) was proclaimed in 1971 over an area lying between 20° 30'5 and 25 • 30' S. This reserve was subsequently revoked in 1975 and a new restricted area proclaimed over a smaller area.
After the relevant constant levels of exploration in the late 1980s and early 1990s exploration levels have continued to rise in 1994/95 following on from the rapid increase in 1993/94. The number of Exploration Permits current as of 1/7 /95 was 77 (with 7 additional applications outstanding) compared with 69 on 1 /7 /94 (Figure 1). Exploration Permits granted in 1993 /94 (18) and 1994/95 (23) exceeded by far the average of seven granted in each of the previous four years (Figure 2). Figure l
Number ofEPCs Current 1 July (1988 - 1995) ~
90
~ 80 + - - - - - - - - - - - - - ~%?. 'Ii 70 + - - - - - - - - - - - ~ 60...__ _ _ __
~ 50
,......
~ 40 I ~ 30 I
I I 0 I
_x 20 ~ 10
z
I I I I I
.---i I I I I I I I I I I
r7 I I I I I
I I I I I
l!I Applications ■ Current
1988 1989 1990 1991 1992 1993 1994 1995 Year
These numbers are expected to decrease in 1995/96 as many of the EPCs will be converted to Mineral Development Licences (MDLs). The number of MDL applications have risen dramatically in 1994/95 principally due to the requirement of the Mineral Resources Act for the total term of an EPC not exceed 5 years, but also because of the greatly
Bowen Basin 1995 - Symposium
2
Figure 2
Number of EPCs Granted (Fiscal Years 1988/89 to 1994/95)
.
26-.--------------- __.,.,__
~
ii: ~
20 -+------------'H I-
~
..,
~ 16 - + - - - - - - - - - - -
5:
t'.)>-10+-.a---
o..
w
o
6
~
~
z
0
88/89 89190 90191
91192 92193 93194 94196 Year
reduced rental rates for MDLs which were introduced in November 1994. In 1994/ 95 36 applications were received compared with 13 for the previous 5 years combined (Figure 3). Figure 3
Number of MDL Applications Received (Fiscal Years 1989/90 - 1994/95) ., 40 . . - - - - - - - - - - - - - - - - ~ -
ii
30 - + - - - - - - - - - - - - -
25 - + - - - - - - - - - - - - E 20 - + - - - - - - - - - - - - :lie 0 15 - + - - - - - - - - - - - - 1: 10 - + - - - - - - - - - ~ - - ~
z~
90/91
91/92
92/93
93/94
94/96
Increase in Coal Price
Year
According to Australian Bureau of Statistics figures, the amount spent on coal exploration in Queensland increased from $16.7 million in 1993/94 to approximately $26 million in 1994/95 (Figure 4). Figure4
Coal Exploration Expenditure (Fiscal Years 1988/89 to 1994/95) ;;;
30 . . - - - - - - - - - - - - - - - - - - - = 2 - : - 6 - •
---------------' . + -+--------------~
25
~ 20 11
~
~ ~
~
i
10 6 0 89/90
90/91
91/92 Year
92/93
93/94
In the negotiations held in March 1995 for 1995 Australian thermal coal producers won a $US5.95 ($A7.93) per tonne or 17.3% price increase from the Japanese power utilities (Japanese fiscal year coal prices). The price increase increased the benchmark thermal coal price from $US34.35 to $US40.30 per tonne ($A53.73). This was the first thermal coal price rise in four years. Negotiations were also reached on a coking coal price increase. Hard coking coal prices increased by an average $US5.35 per tonne (12 .4%). New prices will range from $US51.10 for Goonyella to $US46.20 per tonne for Blackwater, however in association with this increase volumes were cut with BHP for example losing 1.2 mtpa in this agreement. Projected increased demand for thermal coal
15 ................,.._
88/89
This Queensland Government initiative lifted restrictions on exploration in the area known as Restricted Area 55 (RA55 ) which covered the entire Bowen Basin. This release took place in 3 stages over 18 months. The Stage I release on 1 March 1993 revoked RA55 but put in place 13 new restricted areas (RA 278-290) over specific coal deposits. The Stage II release was conducted using a modified cash bid tender process for 12 of the restricted areas (RA 278-289). Tenders closed on 4 January 1994 and 17 bids were received for seven of the twelve areas. The seven successful tenders paid approximately $13 million for the areas and committed in excess of $20 million for exploration over the 5 year terms of their exploration permits. In Stage III of the release restrictions were removed from four of the five areas not taken in Stage II, with the land being made available for exploration from 1 August 1994. One area was taken up at this time (Peak Downs East). Subsequently one other area has also been applied for (Rugby) .
Options regarding the future of the Cullin-la-ringo area (RA 279) are presently being considered while the other remaining restricted area at Taroborah (RA 290) is required for a joint Department of Minerals and Energy /NEDO research program.
s-~-----89/90
Central Queensland Coal Exploration Land Release
In all, a total of 43 EPCs were taken up during the period of the release from 1 March 1993 to September 1994 (Department of Minerals and Energy, 1994).
.2,;; 35 - + - - - - - - - - - - - - .!:!
The increase in the number of Exploration Permits and greater intensity of exploration activity in general over the last 2 years is largely due to three significant factors:
94/96
•estimated
Major increases in power demand from Asian countries are expected over the next 10 years as these countries growth rates exceed 5 %. Australian is well positioned to be able to take advantage of this increased need for energy and it is expected that Australian thermal coal exports will increase to 110 mtpa by the year 2000. Queensland has traditionally been considered as a coking coal
Bowen Basin 1995 - Symposium
3
exporter but actually one third of its current coal exports are thermal coals and with vast resources of identified thermal coal that can been easily extracted in the future, Queensland is well placed to meet this demand. In the Bowen Basin alone there is over l l.7Bt of identified thermal coal resources although approximately 25% of this is of a low volatile nature not widely sought in the current market place. In the Moreton and Surat Basins there are approximately 6Bt of high volatile coal resources amenable to opencut mining methods. The QTHERM program (Queensland Thermal Coal Development Program) has been set up by the Queensland Government to increase the opportunities for exploration and development of Queenslands thermal coal resources. The program will increase the knowledge base of these resources and help to disseminate that information to potential users, investors and developers. The Program will also identify impediments to coal resource development and formulate strategies to reduce or remove them. Activities will concentrate in the areas of infrastructure, coal quality and utilisation and the effects of changing technology.
SUMMARY OF EXPLORATION AREAS AND ACTIVITY There are a number of coal deposits that are actively being explored at present. A list of the status of these projects is summarised in Table 1.
Kemmis Walker EPC 567 (Over ML 4750) BHP Mitsui Coal have delineated an area within the South Walker portion of the deposit where a 12 m seam has been delineated suitable for extraction of a large bulk sample. Over 200 holes have recently been drilled to define the Lox line at the proposed bulk sample site. The company hopes that trials of the coal to potential customers may lead to development of a mine.
Lake Vermont Queensland Coal Mine Management have been exploring an area in the southern part of the Lake Vermont deposit. A revised feasibility study on this area is expected to be completed by the end of the year. Development of a small open cut mine is possible if economics are favoq.rable and markets can be secured. The company is currently considering options before making any commitments to the project.
Minerva Following a successful bid in the Stage II RA55 release New Hope Corporation and Nissho Iwai have been exploring the Reids Dome beds in the Minerva/Cindie area. After an initial drilling program of 26 holes confirmed Departmental indications of possible opencut resources in the Lexington Dome area, a potential opencut resource in the order of 30Mt of coal (free of basalt cover and intrusions) has now been defined. The company is proposing to take a bulk sample in mid 1996, for testing with potential customers.
Existing Deposits
Moranbah North
Burton Downs
This area adjoins the southern end of the Goonyella mining lease and is approximately 15 km north of Moranbah. Shell have recently completed an exploration program of over 60 holes to examine coal quality, structure and geotechnical conditions. Both gas desorption and hydrological testing were undertaken and evaluation of the geological and geotechnical data acquired is continuing. The company proposes to construct a trail drift and shaft to investigate underground mining conditions during 1996. If conditions are favourable mining could commence in 1997.
During the past two years Portman Mining Pty Ltd have been undertaking detailed geological and geotechnical evaluation of the thick Burton seam which dips at up to 25 • to the east and is amenable to opencut mining. A lease application is current over the area (ML 70109) and compensation is presently being negotiated with landowners. Studies to date have suggested that a 800,000 to 1.3 million tonne per annum (mtpa) mine that develops along strike will be economically viable. Thiess Contractors will operate the mine and have taken a 5% share in the project.
Daunia - EPC 575 (Over ML1781) BHP on behalf of the CQCA Joint Venturers are proposing to take a large bulk sample at Daunia to gain coal for testing in the market place with a view to future mine development if the product is well received. Exploration has been extensive over the last 6 months with subcrop and Lox line drilling. Eleven 125mm cores were also taken to confirm coal quality in the bulk sample site area. Additional surface area has been applied for on the current lease (ML 1781) and further Mining Lease applications have been made for infrastructure and overburden areas.
Moranbah South Iscor have commenced a staged program of fully cored holes to investigate the Moranbah Coal Measures seams north east of the BHP operated Peak Downs mining leases. A total of 42 holes have been completed to date and work will continue through 1995.
Nebo West BHP have been actively exploring this structurally complex area over the last 9 months with the drilling of over 400 holes. More than 800 holes have now been drilled in the area. A major geological report is now being prepared which will then be used as the basis for a prefeasibility study. Further
Bowen Basin 1995 - Symposium
TABLE I: STATUS OF CURRENT COAL PROJECT DEVELOPMENTS IN THE BOWEN BASIN rJ{~ :
:oi~~.:
: W:Xr&.: ,·.··
Burton
Portman Mining
open cut coking coal
Initial output of 830,000 tpa is planned. Anticipated full scale production of 1. 75 milliontpa.
ML application made December 1994. Portman are still to finalise Joint Venturers to raise finance for the project.
It is proposed lo commence construction of infrastructure in late 1995. Full commitment to the project will need finalisation of finance/joint venturers.
Clermont
Pacific Coal
opencut thermal coal
Production would reach 10-13 mtpa.
Joint Venture legalities being examined with regard to Blair Athol Joint Venture agreements.
Construction could commence 2000, with production from 2004 (replacing Blair Athol production).
Daunia
BHP
open cul thermal coal
Could produce up to 3 million tpa.
Company proposes to take a 100,000t bulk sample in late 1995 or early 1996 to test the coal in the market place.
Development is dependant on market acceptance of low volatile coal. If sales can be confirmed, mine development would proceed quickly.
=s
Gordonstone West
ARCO
underground thermal coal
4.0 mtpa with full longwall development.
Mining Lease application anticipated in September 1995.
No commitment to proceed. has been made but construction could commence by 1997/98.
DI
Hail Creek
Pacific Coal
open cut coking and low volatile thermal coal
No definite mine plans at this stage, but has potential to production large toMages.
Mining feasibility studies have been done. No plans for development at this stage.
Medium to long term prospect, depending on market acceptability of low volatile coal.
Lake Vermont
QCMM
open cut thermal coal with minor coking fraction
Initial operation of 500,000 tpa is proposed, with future expansion to 1 million tpa being considered.
EMOS is currently being drafted and additional feasibility studies being undertaken.
QCMM hope to begin mine construction in late 1996, but have not yet made any commitment to this project.
Minerva
New Hope Collieries
opencut thermal coal
0.5 mlpa.
Resources of 30 mt have been delineated. Bulk sampling is proposed for 1996.
Joint venturers are keen to develop this resource. Development is dependent on market acceptance of Reids Dome type coals
Moranbah North
Shell
underground coking coal
Will reach 3 million tpa when longwall fully operational.
Mining Warden has recommended grant of ML, subject to compensation. Development of trial drift and shaft to commence late 1995.
Has been committed to by Shell. Coal production could commence late 1996.
South Walker
BHP
open cut thermal coal
Could produce up to 3 million tpa.
Company proposes to take a 100,000t bulk sample in late 1995 or early 1996 to test the coal in the market place.
Development is dependant on market acceptance of low volatile coal. If sales can be confirmed mine development would proceed quickly.
Togara North
Janmex
underground thermal coal
3.0mtpa
Resource assessment is currently well under way. Feasibility study is plaMed for early 1996.
Joint Venturers very keen to proceed. Construction could commence 1997 with mining by 1999.
Togara South
lngwe (Trans Natal)
underground thermal coal
not determined
Resource is currently being explored. No active mine plans at this time.
Mining possible in 2000 or later.
Valeria Stage I
Pacific Coal
opencut thermal coal
2.0mtpa
Mining Feasibility study has been recently completed. Development depend on results of marketing study.
Development likely if joint venture legalities can be resolved.
Wards Well/ Lancewood
BHP
underground coking coal
Potential for 2 or 3 longwall mines existing in these areas (3-4 million tpa capacity each).
Extensive exploration has been conducted and feasibility study is plaMed. Production will replace Riverside coal.
Development is likely to follow that at Daunia and Walker Creek and will linked to decline in Riverside production.
=
1
:=:.::.·.J.r ::':.::,o ::::.'.::.:,r .:,:.:t ,::,:,:,:.:,:...·•··
·,•:•·,•,·,···,··
0
~
n>
=
{/I
....
=s
~
1,0 1,0
U1
rJl
'<
!3
~
0 {/I
....
c
!3
5
drilling may be undertaken if it appears mining could be economic.
Red Hill/Goonyella BHP Australia Coal are investigating seams from the Moranbah Coal down dip from the Goonyella Mine. Approximately 20 holes have been drilled to test the quality and thickness of seams as well as the general sequence stratigraphy. BHP are also evaluating potential for longwall mining within the current Goonyella mining lease, down dip of the present opencut operations. Over 250 holes have been drilled examining the Goonyella Middle seam.
Togara North Geological investigations currently being undertaken by consultants for the Joint Venturers are well advanced. Approximately 65 holes were drilled in the first year following the grant of EPC 550 and around 70 of the planned 150 holes have been completed in the current field season. Drilling is being concentrated in the southern portion of the EPC where a 6m thick seam is present. The Joint Venturers are keen to progress the evaluation of deposit as quickly as possible to be able to take advantage of opportunities for increased demand for thermal coal. Mining is proposed by underground longwall methods and operations could be commenced by the late 1999 (construction by 1997) if conditions are favourable.
Togara South Trans Natal have been exploring the Togara South area and have targeted the Pollux seam in with the drilling of 20 holes in the first year (1994). The Stage II drilling program in 1995 comprises over 80 holes and is 60% complete. Approximately 8km of reflection surface seismic has also been run and in seam seismic between bore holes is currently being undertaken.
Wards Well EPC 555 (Over ML 1790) BHP Mitsui Coal are investigating the Goonyella Upper, Middle and Lower seams from the Moranbah Coal Measures in this area to evaluation resources capable of being mined by underground longwall methods to supplement future supplies of coal from the Riverside Mine. An intensive drilling program has been conducted to close the drill hole spacing over the deposit to less than 400m and surface and in seam seismic studies have been undertaken. A comprehensive geological report of this recent exploration will be completed by December 1995 and a feasibility study is planned to be completed by the middle of 1996. New areas
Exploration is also being conducted in areas of the Bowen Basin that have previously been poorly explored or not explored at all. These include Dingo, Clermont, Coppabella and Box Creek.
At Dingo New Hope Cooperation are exploring equivalents of the Rangal Coal Measures and although coal seams have been intersected at shallow depths more drilling is required in this structurally complex area. Further drilling is planned for November 1995. Pacific Coal Pty Ltd are continuing to investigate the Clermont district using a combination of geophysical surveys and drilling, with the hope of discovering additional coal bearing sub-basins along the western side of the Basin in the vicinity of the Blair Athol and Clermont deposits. After some promising results in EPC 524 a new Exploration Permit (EPC 574) has been applied for north west of EPC 524. In the Coppabella area potential upthrow blocks of the Moranbah Coal Measures are being investigated by Queensland Coal Pty Ltd within EPC 531. A total of 10 holes were drilled in 1994, further drilling is planned for 1995. CRA Exploration have recently been granted EPC 587 Box Creek, west of the Gindie/Minerva area to investigate potential coal seam development in the Reids Dome beds/ Aldeberan Sandstone in a graben structure delineated by earlier petroleum seismic surveys.
RECENT AND PLANNED MINE DEVELOPMENTS As well as the marked increase in exploration of existing deposits and more traditional 'grassroots' exploration there has been a considerable amount of exploration, related evaluation and feasibility studies at existing mining operations aimed <Jt accessing additional coal resources to maintain or increase current production levels (Table 2). New operations such as Gordonstone, Crinum and Kenmare will be increasing production levels until they reach optimum operational levels. Both Crinum and Kenmare are undertaking gateroad development prior to installation of proposed longwall equipment. Gordonstone underground mine now has two longwall units located underground which offers considerable flexibility and productivity advantages, although only one is fully operational at any one time. Eventually if development work can be increased both machines may work at full capacity simultaneously. The Ensham mine has now commenced operations in the main mining leases covering the majority of the open cut resources, south of the initial Yongala operation. Initial production at Yongala was at 900 000 tpa but production levels are expected to increase rapidly with the new operations in the main Ensham leases. The Blair Athol mine is planning to increase production from 10.5 to 13 million tpa. New underground mines are being planned at Newlands and German Creek (Grasstrees), these mines will help to maintain production from existing operations.
Bowen Basin 1995 - Symposium
6
TABLE 2. STATUS OF MINE DEVELOPMENTS/EXPANSIONS BOWEN BASIN
Blair Athol expansion
Pacific Coal Pty Ltd
Opencut thermal coal
Planned to increase from 10.5 to 13 mtpa
Overburden ratio will increase and further capital expenditure required but planned to commence from 1996
Crinum
Gregory Joint Venture
Underground coking coal
2.5 mtpa in 1996
Coal now being produced from development roads. Largely replacement capacity for existing opencut operation at Gregory
Ensham expansion
Idemitsu
Opencut thermal coal
0.8 mtpa in 1994 3.0 mtpa in 1997
Committed and currently being developed
Goonyella underground
BHP Coal Australia
Underground coking coal
3 million tpa
Exploration and evaluation continues. Development on hold until required as replacement capacity for Goonyella
Gordonstone expansion
ARCO
Underground coking and thermal coal
3.2 mtpa in 1994 4.2 mtpa in 1995 4.8 mtpa in 1997
2 longwall machines now installed (only 1 fully operation at any one time)
Grasstrees
German Creek
Underground coking coal
Kenmare
QCT Resources Ltd (South Blackwater)
Underground coking and thermal coal
Newlands U /G
NCAJoint Venture
Underground thermal coal
Portals constructed, development of initial drifts to be undertaken by contractors
Highwall mining is being utilised in an increasing number of mines. At Oakey Creek a continuous highwall miner has been operating since April 1994 and now extracts coal at distances up to 350m from the highwall face. Augur mining is also being conducted at Oakey Creek. BHP are proposing to trail highwall continuous mining at Moura after several years research into the hybrid mining technology. The trail will concentrate on establis.h ing suitable techniques to access the typically more steeply dipping seams found at Moura. Highwall mining techniques have also been used at German Creek, South Blackwater and Collinsville.
DEPARTMENT OF MINERAL AND ENERGY, 1991: Departmental c.oal exploration - open file results in record series. Queensland Government Mining Journal, 92, 468-474.
FUTURE DIRECTIONS Exploration levels in terms of expenditure and activity are likely to remain high in 1996 as companies continue to re-examine known deposits in light of new market opportunities. The number EPCs current is likely to drop however as many older tenures are surrendered in favour of Minerals Development Licences. Opportunities and incentives to conduct more 'grassroots' type exploration will remain limited until issues of infrastructure and market limitations on certain coal types are addressed.
REFERENCES BALFE, P. E., 1988: The Allocation of Mineral and Petroleum Exploration Rights: Theory and Practice in Queensland. MBA Research Report, University of Queensland .
Will replace dwindling production from O/C and U/G mines 2.5 mtpa in 1996
Committed and currently under construction. Largely replacement capacity for South Blackwater opencut operation
DEPARTMENT OF MINERALS AND ENERGY, 1994: Land Release sparks exploration rush. Queensland Coal (September/October), supplement to the Queensland Government Mining Journal, 95 (1113), 30-38. KING, D., 1969: A history of coal at Blackwater. Queensland Government Mining Journal, 70, 185-194. KING, D., 1975: History of Exploration and Development. In TRAVES, D. M. & KING, D., (Editors): Economic Geology of Australia and Papua New Guinea, 2 -Coal. Australasian Institute of Mining and Metallurgy, Monograph, 6, 5-24. MATHESON, S. G., BALFE P. & COFFEY, D., 1993: Coal exploration and development opportunities in Queensland - Central Queensland Coal Exploration Land release. In Beeston, J.W., (Editor): New Developments in Coal Geology - a Symposium, GSA Coal Geology Group, Brisbane, November 1993, 3-11. MATHESON, S. G., 1994: An overview of coal exploration developments in Queensland. In Department of Minerals and Energy, Abstracts of Queensland Exploration Potential Symposium, Brisbane, 29-30 November, 1994, 46. MENGEL, D. C., BALFE, P. E. & COFFEY, D.,-1990: A history of coal exploration and mining in Queensland. In Glasson, K. R. & Rattigan, J. H. (Editors): Geological aspects of the discovery of some important mineral deposits in Australia. Australasian Institute of Mining and Metallurgy, Monograph, 17, 317-345. WHITMORE, R. L., 1985: Coal In Queensland -The late nineteenth Century 1875 to 1900. University of Queensland Press.
Bowen Basin 1995 - Symposium
7
Revised palaeogeogral!..hic maps for the Bowen Basin, Central ~ueenslana Christopher R Fielding, Christopher J Stephens, Jochen Kassan & Rodney J Holcombe Department of Earth Sciences, The University of Queensland
This paper presents a series of revised palaeogeographic maps summarising the Permo-Triassic history of the exposed portion of the Bowen Basin in central Queensland (Figure 1). This revision is in the light of recent research, in particular dedicated to the definition of the eastern basin margin. Fielding & others (1990a) presented a series of palaeogeographic maps for the Bowen Basin, which summarised the understanding of basin evolution at that time. Many of the data on which those maps were based, and further new data were subsequently published in more detailed papers (Kassan· & Fielding, 1991; Fielding & Mcloughlin, 1992; Falkner & Fielding, 1993a, b; Fielding & others, 1993; John & Fielding, 1993; Baker & others, 1993; Fielding & others, in press; Esterle & Fielding, this volume) and in theses at the University of Queensland (Belcher, 1990; Paterson, 1991; Miller, 1992; John, 1992; Kassan, 1993; Crossley, 1994; Bloomer, 1994).
N
A
21)"$
100
0
200
kilometres
Coral Sea
24-S
Springsure -=:.:-·.
~~
i::,
'_.\
I l I
~l, Crae<?W \ 1 ;;,C g\~ - , ";l- I • ·" \
In the five years since the last Bowen Basin I t~' \ !gf Symposium, however, research by the authors, l \ "" their colleagues and students has led to some \ I (\ revision of ideas on the geological development of , Axisof \ the Bowen Basin during the Permian and Triassic. Some of the critical new results, summarised below, 1" Taroom Trough ' -( IJ necessitate revision of the Fielding and others' zs-s (1990a) palaeogeographic maps. The interpretations t;;;;;;,..;..__ _~_ _..__......._ _ _...._ _ _..___;;;;1 presented here adopt the stratigraphic schemes of Draper & others (1990) and Briggs (1993). Figure 1. Tectonic elements of the Bowen Basin and New
!
+
By way of introduction, we note some confusion among geoscientists as to the meaning of the term Bowen Basin. This confusion has been brought about by the widespread inconsistent use of the term "Bowen Basin" even in some of the earliest literature, with it being used apparently interchangeably as both the name of the original basin feature and as the presently preserved structural feature. In the following discussion, we shall restrict the term Bowen Basin to the named structural feature, and use the term "basin" in reference to the original depositional entity. Definition of the eastern basin margin, and regional stratigraphic problems
Early investigations in the Bowen Basin (Reid, 1924) identified that the eastern margin is a structural margin coincident with the western edge of an uplifted igneous complex (the Connors-Auburn Arch of Day & others, 1978). Malone & others (1969) noted that marine Permian rocks (the Back Creek Group) and overlying non-marine sediments
England Fold Belt in eastern Queensland. Thick dashed line shows the commonly-recognised structural margin of the Bowen Basin, and shading exposures of Permian strata.
(Boomer Formation) continued uninterrupted across the southern end of the Connors Arch into the Strathmuir Synclinorium. The underlying Early Permian Lizzie Creek Volcanics and Carmila Beds were interpreted to be laterally equivalent units that formed much of the exposure of the southern Connors Arch. The early history of the basin was illustrated by Dickens & Malone (1973) in a series of palaeogeographic maps, based principally on stratigraphic analysis, showing development in terms of Early Permian volcanic provinces and volcano-sedimentary sub-basins (the Reids Dome Beds in the southwest, the Lizzie Creek Volcanics and Carmila Beds in the north, and the Camboon Andesite in the southeast) overlain by marine sedimentary rocks (Back Creek Group) that, in the
Bowen Basin 1995 - Symposium
8
north, were deposited across the Connors Arch and as far east as the present coastline. The Lizzie Creek Volcanics and Carmila Beds were interpreted to initially be deposited in separate long narrow troughs with sediment sourced from the intervening terrane and volcanism from vents near the centre of these troughs. Gradual subsidence was accompanied by decreased volcanic activity and reduction of the inter-trough terrane through to the time of the marine transgression. The Camboon Volcanics were regarded as a succession that was terrestrial to the west, becoming marine northward and laterally equivalent to or overlain by the Rannes Beds further east. The Rannes Beds and Rookwood Volcanics were interpreted as equivalent, and formed within the dominantly marine Grantleigh Trough (Kirkegaard & others, 1970). Day & others (1978) showed the Bowen Basin as developing during the Early to mid-Permian "to the west of the Camboon Volcanic Arc". This arc· was developed along the site of the present Connors-Auburn Arch with a deep trough (the Grantleigh Trough) developed east of the arc. The model of Day & others (1978) marks a significant change from the earlier history outlined by Dickens and Malone (1973) in that: 1) volcanism during the early history of the basin was sourced from a continental-margin, volcanic arc positioned along the Connors-Auburn Arch, implying the presence of a significant constructive edifice that should reasonably have supplied abundant primary and reworked volcanic detritus to the basin, 2) descriptions of the volcanics occurring east and west of the Connors and Auburn Arches gave the impression that the eastern margin of the basin was coincident with the western margin of the Connors and Auburn Arches, and 3) the Grantleigh Trough was isolated as a separate elongate basin formed east of the arc. Day & others (1983) further stated that the main marine depositional trough of the basin was along the presently-defined northeastern structural margin, associating the deposition with local formation names (Gebbie and Blenheim Sub-groups). They also emphasised the distinction of the Grantleigh Trough as a deep-water trough containing "flysch-type sediments" and spilitic pillow basalts "with gross features typical of ocean floor basalts". Subsequent interpretations of the geological evolution of the eastern Bowen Basin and northern New England Fold Belt (Henderson, 1980; Harrington & Korsch 1985; Murray & others, 1987; Hammond, 1987; Fergusson & Leitch, 1993) have not significantly challenged the palaeogeographic implications of the Day & others model for the Permian. Fergusson (1991) developed the first wellconstrained model for the crustal architecture beneath the southern Connors Arch as a structural
culmination developed during the latest Permian to Middle Triassic contractional deformation that closed the basin (the Hunter-Bowen orogeny). Our research also suggests that the north-northwest trend of the Connors Arch may be a consequence of WSW-directed thrusting which, in addition to producing the intense deformation within the Gogango Overfolded Zone, may have imposed a regional structural fabric that does not reflect the original orientation of the basin margin. Sedimentological data summarised here suggests that the present eastern limit of exposed basin rocks was not the original eastern boundary (Fielding & others, 1994), in general agreement with Dickens and Malone & others (1973). Importantly, facies within all stratigraphically equivalent units on either side of the Connors Arch are identical, and palaeocurrent data gathered from these units indicate predominantly westward-directed sediment dispersal throughout basin formation. On this basis, we propose that at least until foreland closure of the basin, the basin extended for some distance to the east of the present position of the Connors Arch and extended uninterrupted across the Grantleigh Trough. Given the intensity and nature of deformation associated with closure of the basin during the Hunter-Bowen Orogeny, the original margin may be only locally preserved within onshore Queensland, and its position remains speculative.
RECOGNITION OF MAJOR STRATIGRAPHIC SEQUENCES Previous research (including Ziolkowski & Taylor, 1985; Murray, 1990) has established three major phases of basin-forming activity in the Bowen Basin: 1) an Early Permian phase of limited crustal extension, which led to the formation of a series of areally restricted, north-south elongate grabens and half-grabens, 2) a late Early to early Late Permian period of mainly passive, thermal subsidence during which a ragged blanket of sediments accumulated across a wide area, and 3) a Late Permian to Middle Triassic interval dominated by foreland thrust loading. Fielding & others (1990b) provided a review of earlier research, and interpreted the Permo-Triassic stratigraphy of the Bowen Basin in terms of these three periods of basin development. Each major interval is recognisable in terms of a distinct cross-sectional geometry, as well as in terms of distinct facies assemblages, sediment composition and palaeocurrent distributions. Basement
In current interpretations of Bowen Basin stratigraphy, the early extensional phase has been assumed to be coeval with volcanic activity associated with the Camboon Volcanic Arc. Our (as
Bowen Basin 1995 - Symposium
9
ISO"E
t52•E
ISO"E
20'5
a) Early Permian
b) late Early Permian
Reids Dome Beds, Upper Lizzie Creek Volcanics & Upper Carmila , • Beds, Youlambie Conglomerate, Beserker Beds
, •
Cattle Creek, Buttel, Yarrol & Tiverton Fms., Rookwood & Owl Gully Volcanics, upper Beserker Beds
22•5
-2._
--
I
- ?
-
·1 - -
--
-/ - -
/ '
J 24°5
-
/ /_
I I-
-
?
-·
152°E
20°5
20"5
..
c) latest Early Permian
d) earliest Late Permian
Lower Aldebaran Sandstone Collinsville & Blair Athol Coal Measures
Collinsville Coal Measures Upper Aldebaran Sandstone Oxtrack and Freitag Fms. Undiff. Back Creek Group
22°5
22"5
-..L \ - -
,/
""'f17
--
-I_
1 r_,.r.:Lc.\.
0-
-.
- - ;I. --~- ,
24°5
-
- _,__- - -\ /L
·- I
:r
·- I -
'L
Alluvial & coastal plains Lakes Wetlands Coarse-grained alluvium
Marine shelf Coastal and shallow marine carbonate
Figure 2 Continued with legend overleaf/
Bowen Basin 1995 - Symposium
10
yet mostly unpublished) research suggests that this is not the case, rather that along either side of the Connors-Auburn Arch Late Carboniferous to Early Permian volcanic rocks of uncertain tectonic context are overlain (locally unconformably) by a mixed sedimentary and igneous rock suite related to later Early Permian extension. We find no evidence to suggest that the older volcanic succession is related to Bowen Basin formation .
widespread, uniform sheet across the basin suggests this period is best interpreted as recording slowing of subsidence within the latter part of the extensional phase, rather than as part of a passive thermal subsidence phase as previously suggested (Fielding & others, 1990). Evidence of mainly local compression during this time has also been recorded from seismic records in the Denison Trough (Ziolkowski & Taylor, 1985).
The two suites of rocks are clearly separable in most areas, as the older unit comprises predominantly subaerial volcanic and coarse volcaniclastic rocks of varied igneous composition with minor, mainly coarse-grained volcanic sediments, whereas the younger, extensional suite consists mainly of sedimentary rocks of varied, but predominantly fine-grained, character with locally important subaqueous basaltic volcanics, felsic ignimbrite and intrusive rocks of silicic and mafic composition (McPhie, Stephens, Fielding, unpublished data). Despite this clear contrast, there may not be a significant time gap between the two units. The older volcanic suite (comprising the Connors, Camboon and Bulgonnuna Volcanics, the lower part of the Lizzie Creek Volcanics and of the Carmila Beds, and possibly part of the Berserker Beds), is regarded here as basement to the basin.
Phase 2 - Passive thermal subsidence
Phase 1 - Extension
In contrast to underlying strata, the cross-sectional geometry of the Late Permian to Middle Triassic section in the basin is strongly asymmetric, with a NNW-trending, elongate depocentre (the Taroom Trough) located close to the present eastern basin margin. The change from a sheet-like to asymmetric profile coincides with significant changes in sedimentary environment and provenance (Baker & others, 1993). Recent identification of unstable marine slope deposits (slide blocks, slumps, debris and turbidity flow deposits) within the early Late Permian Barfield Formation and Moah Creek Beds may indicate the earliest surface effects of thrust loading (see also Kirkegaard & others, 1970), although the effects were not recorded until Peawaddy Formation time in the west. Further evidence from the distribution of conglomerate bodies along the eastern basin margin suggests that the thrusting developed in a pulsed fashion with the final, Middle to early Late Triassic pulse causing uplift and thrust deformation of the entire basin.
The early extensional phase was first recognised in the Denison Trough area in the west (Paten & others, 1979;.Ziolkowski & Taylor, 1985; Draper & Beeston, 1985), where a thick, lithologically varied, sedimentary succession (Reids Dome beds) has been shown by seismic reflection surveys to occupy fault-bounded grabens and half-grabens. A comparable suite of rocks displaying similar abrupt thickness variations and evidence of accumulation under tectonically active conditions can be recognised around the present northern apex of the basin near Collinsville. This suite comprises the upper part of the Lizzie Creek Volcanics and of the Carmila Beds either side of the Connors-Auburn Arch, and the Youlambie Conglomerate further south. Elliott & Brown (1988) suggested that similar, early sub-basins may be deeply buried beneath the axis of the Taroom Trough. The early extensional topography was filled in an irregular fashion, and a strongly diachronous but basin-wide, marine incursion occurred. Biostratigraphic data suggests that this incursion was earlier in the east than in the west. A patchwork of mainly fine-grained, marine sediments accumulated in some remnant extensional basins, while other areas remained non-marine. Locally, subaqueous basaltic volcanism similar to that associated with the extensional phase continued, forming the locally voluminous Rookwood Volcanics (sediments within which have recently been dated as Artinskian by V. Palmieri, personal communication, 1995) and correlatives. The fact that these rocks are still largely confined to areas of extensional sub-basins and do not form a
Ultimately, a blanket of mainly fine-grained, marine shelf sediments accumulated across the entire basin in the early Late Permian, representing the greatest areal development of the basin. We suggest that this widespread transgression, rather than the earlier marine incursions discussed above, records the onset of passive thermal subsidence. The stratigraphic reinterpretation presented here implies that this period was short-lived, and terminated by the onset of foreland thrust loading (see below). A basin-wide unconformity at ~260Ma did not terminate this sag phase, but is synchronous with an uplift event recorded in the New England Fold Belt to the southeast (Holcombe & others, 1993). Phase 3 - Foreland thrust loading
Geometry of the Bowen Basin The present geometry of the Bowen Basin is north-south elongate in the southern half, becoming more NNW-trending in the north. Structural analysis indicates that the north- eastern margin was influenced by WSW-directed thrusting in Late Permian to early Late Triassic times, and that the Connors Arch, Gogango Overfolded Zone, Marlborough Block and other elements of the northern New England Fold Belt may have been translated westward by 50km or more from their original positions. This interpretation also suggests that much of the Urannah Batholith may be allochthonous, and that the present northern apex
Bowen Basin 1995 - Symposium
11
t52°E
150-E
150°E
20'$
20"$
f) Late Permian
e) early Late Permian
•.I
lngelara, German Creek, Crocker & Barfield Fms. , Catherine Sandstone, Moah Creek Beds, Undiff. Back Creek Group
Peawaddy & Flat Top Fms., Moranbah Coal Measures
I 22' $
22'$
..
. /
I
_,
✓-
L
c;, ,:.__:Li; ;...1... \ - .L ' /
I
··-
·J...-.
•
\. \ . - . - ·-- - ·- -
/ _ -/ I
24'$
I t52"E
150-E
20' $
g) latest Permian
h) Early Triassic
Blackwater Group
Lower Rewan Group (Sagittarius Sandstone)
.. I
..1
22'$
-
.
-
-
\ / -
' / I
-... -
- ....
-
✓,✓,/\/\
--
- --
-
\/\/\/I /
-
-
·-
-
\
,,,L.,
\
/
-
-
·-
24'5
-
---- - -- - - - - - --
-
\/I/I/\
--
\ /\/\ /I/\ /
-
-
I / \ / I / I / I / --
-
-
\_ ~
/
--
\
- - -..L -. - - - . .L •.. · , ✓ 1 /1/1/1°
-
-
- ·- -
-
\/\/\/I/\/ '
-
-
Large scale drainage patterns Small scale drainage patterns Faults, downthrow shown dashed where inferred Mountain range
-
-
-
-
-
Explosive volcanic activity Subaqueous, predominantly basaltic eruptions Unstable slope deposits
Figure 2 Continued from previous page and overleaf/
Bowen Basin 1995 - Symposium
12
of the basin near Collinsville is an artefact of the Hunter-Bowen thrusting and of erosion. Isolated, structurally deformed remnants of Permian and Triassic sedimentary rocks preserved in north Queensland (eg. Mount Mulligan) may once have been contiguous with the basin. The present western margin of the basin is relatively unaffected by the Hunter-Bowen contraction, although some inversion of earlier extensional structures has been noted (Brown & others, 1983; Ziolkowski & Taylor, 1985; Korsch & others, 1992). The north-south orientation of the western margin is considered to reflect accurately the original, east-west extensional trend. Basin-marginal deposits have in places been removed by erosion, or preserved in faulted inliers such as the Moorlands Basin (Sorby & Scott, 1988). Revised palaeogeographic maps A series of twelve palaeogeographic maps is presented as Figure 2. AU show the limits of the structurally defined Bowen Basin (see above). No attempt has been made to restore the original Permo-Triassic structural configuration, although an icon on Figure 2a indicates the degree of rotation or offset by faulting that may have been imposed on eastern elements of the basin during Hunter-Bowen contraction. A recurrent problem in this respect is the incomplete preservation of the Permo-Triassic record in the New England Fold Belt. All maps are schematic, but an attempt has been made to infer the actual distribution of depositional systems as far as is possible. Figure 2a illustrates the early extensional phase of the basin. A series of originally north-south elongate, partly fault-bounded sub-basins filled by continental, alluvial and lacustrine deposits, with some associated volcanic activity, is shown. The Reids Dome Beds occupy the well-defined sub-basins in the southwest (Denison Trough), the Youlambie Conglomerate those in the southeast, the Berserker Beds the coastal area in the east, and the upper Lizzie Creek Volcanics and upper Carmila Beds those in the northeast. All are considered broadly time-equivalent. Figure 2b depicts the palaeogeography envisaged during the slowing of extensional subsidence in late Early Permian times. Much of the original extensional topography had been filled and a marine transgression was slowly flooding the basin. Locally, sediments and volcanics accumulated in restricted, marine sub-basins in the east (the Rookwood and Owl Gully Volcanics, and possibly Berserker Beds), and shallow marine limestone formed in some areas. The marine environment was tidal, and hence had open access to the palaeo-Pacific Ocean. Figure 2c shows quiescence over the extensional volcanic provinces and a region of no sediment preservation over at least the eastern half of the basin; this period coincides with the 260Ma crustal contraction identified in the New England Fold Belt to the east. Sediment accumulation continued
unabated in the western part of the basin with major deltaic complexes (Cattle Creek Formation, Collinsville Coal Measures) sourced from the Australian craton to the west. Figure 2d illustrates the onset of basin-wide, uniform subsidence during middle Permian times, which may represent a short-lived thermal subsidence phase. Marine conditions covered much of the basin; carbonates accumulated over some slowly subsiding remnant basement highs in the east while deltaic and coastal coarse elastic sediments continued to accumulate in the west. Figure 2e shows the maximum known extent of marine conditions over the basin in the early Late Permian. Further deltaic wedges formed in the west (Catherine Sandstone, German Creek Formation and Collinsville Coal Measures), while mainly fine-grained sediments were deposited elsewhere. By this time, unstable marine slope conditions were being established at least locally along the eastern part of the basin, leading to the formation of slumps and sediment gravity flow deposits. This instability may have been related to the onset of thrust loading from the east. In Figure 2£, a tectonically and volcanically active hinterland to the east (and particularly the NE) of the basin was supplying large volumes of coarse, volcanic lithic detritus westward into the basin, leading to the establishment of a major southerly-prograding delta complex (Moranbah Coal Measures, Peawaddy Formation). Tidal circulation was shut off by the rising orogen, and sediment began to spill westward across the Springsure shelf. The deltas changed from the arcuate, wave-tide-fluvial interactive style typical of Figure 2b-e to more elongate shapes indicative of outflow dominance. Figure 2g records the complete filling of the marine basin by latest Permian times, and the basin-wide establishment of alluvial/ coastal plain conditions which gave rise to the Rangal Coal Measures and equivalents. By this time, the developing orogen was encroaching on the presently preserved Basin, as evidenced by the occurrence of coarse alluvial fan conglomerates in the east. In Figures 2h and 2i, alluvial conditions deposited the earliest Triassic Rewan Group but in this case on dominantly well-drained landscapes which did not allow preservation of coal. Rewan alluvium shows widespread primary reddening. Large closed lakes may have existed in the southern part of the basin at times. Transverse drainage from both west and east converged into major south-draining axial fluvial systems. In Figure 2j, the Clematis Group marks a temporary return to sediment supply dominantly from the west (the craton, rather than the orogen) to form once again a major, southerly draining axial flu vial system. Figure 2k illustrates a major lacustrine interlude (the Snake Creek flooding event) which ponded the Clematis drainage network in the latest Early Triassic, and which may
Bowen Basin 1995 - Symposium
13
150"£
150"£
152°£
20•5
i) Early Triassic
j) late Early Triassic
Upper Rewan Group (Arcadia Formation)
Clematis Group
I
I
22•5
- ~~ , ~~ ~~ ~ ~~
24•5
/-~
\/\
- ..._._ -
...
.... ' \
....
/
\
/\/\/ ._._
- -
--
... /
\
/
\
-
/
\
/
I
, 150°£
150"£
152°E
20•5
20•5
k) latest Early Triassic
I) Middle Triassic
Basal Moolayember Formation (Snake Creek Mudstone)
Moolayember Formation
.. 22"5
22•5
24°5
\
,
I
Figure 2 Continued from previous page/
Bowen Basin 1995 - Symposium
14
have been tectonically driven. Finally, Figure 21 shows a return to the fluvial drainage pattern of earlier Triassic units in the Moolayember Formation, the youngest preserved formation in the basin. As with some previous units, drainage at least periodically spilled westward across the Springsure Shelf towards the Galilee Basin.
REFERENCES BAKER, J.C., FIELDING, C.R., DE CARITAT, P. & WILKINSON, M.M., 1993: Permian evolution of sandstone composition in a complex back-arc extensional to foreland basin: the Bowen Basin, eastern Australia. Journal of Sedimentary Petrology, 63, 881-893. BELCHER, C. E .. 1990: The sedimentology, diagenesis and reservoir potential of the Peawaddy Formation in the northern Denison Trough, central Queensland. Master of Applied Science thesis, University of Queensland. BLOOMER, J.J ., 1994: Stratigraphy of the Calen district . BSc Honours thesis, University of Queensland. BRIGGS, D.J.C. 1993: Time control in the Permian of the New England Orogen. In : Flood, P.G. & Aitchison, J.C. (Editors): New England Orogen, eastern Australia, University of New England, Armidale, 283-291. BROWN, R.S., ELLIOTT, L.G. & MOLLAH, R.J., 1983: Recent exploration and petroleum discoveries in the Denison Trough, Queensland. Australian Petroleum Exploration Association Journal, 23, 120-135. CROSSLEY, J.M., 1994: Geology of the Newlands - Eastern Creek South area, central Queensland. BSc Honours thesis, University of Queensland.
FALKNER, A.J. & FIELDING, C.R., 1993a: Geometrical facies analysis of a mixed-influence deltaic system the Late Permian German Creek Formation, Bowen Basin, Australia. In: Marzo, M. & Puigdefabregas, C. (Editors: Alluvial Sedimentation, International Association of Sedimentologists Special Publication 17, 195-209. FALKNER, A.J. & FIELDING, C.R., 1993b: Quantitative facies analysis of coal-bearing sequences in the Bowen Basin, Australia: applications to reservoir description. In : Flint, S.S. & Bryant, I.D. (Editors): The geological modelling of hydrocarbon reservoirs and outcrop analogues, International Association of Sedimentologists Special Publication 15, 81-97. FERGUSSON, C.L., 1991: Thin-skinned thrusting in the northern New England Orogen, central Queensland, Australia. Tectonics, 10, 797-806. FERGUSSON, C.L. & LEITCH, E.C., 1993: Late Carboniferous to Early Triassic tectonics of the New England Fold Belt, eastern Australia. In: Flood, P.G. & Aitchison, J.C. (editors): New England Orogen, eastern Australia, University of New England, Armidale, 53-59. FERGUSSON, C.L., HENDERSON, R.A. & LEITCH, E.C., 1994: Tectonics of the New England Fold Belt in the Rockhampton Gladstone region, central Queensland. In: Holcombe, R.J., Stephens, C.J. & Fielding, C.R. (Editors): 1994 Field Conference, Capricorn Region, Central Coastal Queensland, Geological Society of Australia Queensland Division, Brisbane, 1-16. FIELDING, C.R., FALKNER, A.J., KASSAN, J. & DRAPER, J.J., 1990a: Permian and Triassic depositional systems in the Bowen Basin. In: Bowen Basin Symposium 1990, Proceedings, Geological Society of Australia (Queensland Division), Brisbane, 21-25.
DAY, R.W., MURRAY, C.G. & WHITAKER, W.G., 1978: The eastern part of the Tasman Orogenic Zone. In: Scheibner, E. (Editor): The Phanerozoic structure of Australia and variations in tectonic style. Tectonophysics, 48, 327-364.
FIELDING, C.R., GRAY, A.R.G., HARRIS, G.I., & SALOMON, J.A., 1990b: The Bowen Basin and overlying Surat Basin. In: Finlayson, D.M. (Editor): The Eromanga - Brisbane Geoscience Transect: a guide to basin development across Phanerozoic Australia in southern Queensland, Bureau of Mineral Resources, Geology and Geophysics Bulletin, 232, 105-116.
DAY, R.W., WHITAKER, W.G ., MURRAY, C.G., WILSON, I.H. & GRIMES, K.G., 1983: Queensland Geology. Geological Survey of Queensland Publication, 383.
FIELDING, C.R. & McLOUGHLIN, S., 1992: Sedimentology and palynostratigraphy of Permian rocks exposed at Fairbairn Dam, central Queensland. Australian Journal of Earth Sciences, 39, 631-649.
DICKINS, J.M . & MALONE, E.J., 1973: Geology of the Bowen Basin, Queensland. Bureau of Mineral Resources, Geology and Geophysics Bulletin, 130.
FIELDING, C.R., FALKNER, A.J. & SCOTT, S.G., 1993: Pluvial response to foreland basin overfilling: the Late Permian Rangal Coal Measures in the Bowen Basin, Queensland, Australia. Sedimentary Geology, 85, 475-497.
DRAPER, J.J . & BEESTON, J.W., 1985: Depositional aspects of the Reids Dome Beds, Denison Trough. Queensland Government Mining Journal, 86, 200-210. DRAPER,J.J., PALMIERI, V., PRICE, P.L., BRIGGS, D.J.C. & PARFREY, S.M. 1990. A biostratigraphic framework for the Bowen Basin. In: Bowen Basin Symposium 1990, Proceedings, Geological Society of Australia (Queensland Division), Brisbane, 26-35. ELLIOTT, L.G. & BROWN, R.S., 1988: The Surat and Bowen Basins - a historical review. In: Petroleum in Australia, the first century. Australian Petroleum Exploration Association, 120-138. ESTERLE, J.S. & FIELDING, C.R., this volume: Sedimentology of the Goonyella Middle Seam goafing interval.
FIELDING, C.R., HOLCOMBE, R.J. & STEPHENS, C.J., 1994: A critical evaluation of the Grantleigh Trough, east-central Queensland. Jn: Holcombe, R.J., Stephens, C.J. & Fielding, C.R. (Editors): 1994 Field Conference, Capricorn Region, Central Coastal Queensland. Geological Society of Australia, Queensland Division, 17-30. FIELDING, C.R., KASSAN, J. & DRAPER, J.J (in press): Geology of the Bowen and Surat Basins, eastern Australia a field guide. Australasian Sedimentologists Group Field Guide Series. HAMMOND, R., 1987: The Bowen Basin, Queensland, Australia: an upper crustal extension model for its early history. Bureau of Mineral Resources Geology and Geophysics, Record, 1987/51, 131-142.
Bowen Basin 1995 - Symposium
15
HARRINGTON, H.J. & KORSCH, R.J., 1985: Tectonic model for the Devonian to middle Permian of the New England Orogen. Australian Journal of Earth Sciences, 32, 163-179.
KORSCH, R.J ., WAKE-OYSTER, K.D. &JOHNSTONE, D.W., 1992: Seismic imaging of Late Palaeozoic - Early Mesozoic extensional and contractional structures in the Bowen and Surat Basins, eastern Australia. Tectonophysics, 215, 273- 294.
HENDERSON, R.A., 1980: Structural outline and summary geological history for northeastern Australia. In: Henderson, R.A. & Stephenson, P.J. (Editors):Geology and Geophysics of Northeastern Australia; Geological Society of Australia Queensland Division, Brisbane, 1-26.
MALONE, E.J., OLGERS, F. & KIRKEGAARD, A.G ., 1969: The geology of the Duaringa and Saint Lawrence 1:250,000 sheet areas, Queensland . Bureau of Mineral Resources Geology and Geophysics Report, 121.
HOLCOMBE, R.J., LITTLE, T.A., SLIWA, R. & FIELDING, C.R., 1993: Tectonic elements and evolution of SE Queensland during the Late Palaeozoic to Early Mesozoic. In: Flood, P.G. & Aitchison, J.C. (Editors): New England Orogen, eastern Australia, University of New England, Armidale, 517-527. JOHN, B.H., 1992: Sedimentology and stratigraphy of the Catherine Sandstone, Denison Trough, east-central Queensland. Master of Science thesis, University of Queensland.
JOHN, B.H. & FIELDING, C.R., 1993: Reservoir potential of the Catherine Sandstone, Denison Trough, east-central Queensland. Australian Petroleum Exploration Association Journal, 33, 176- 187. KASSAN, J., 1993: Basin analysis of the Triassic section in the Bowen Basin, Queensland . PhD thesis, University of Queensland. KASSAN, J. & FIELDING, C.R., 1991 : Triassic depositional environments in the southwest Bowen Basin. Jn : Advances in the Study of the Sydney Basin, Proceedings of the 25th Newcastle Symposium, University of Newcastle, Newcastle, 154-161.
KIRKEGAARD, A.G., SHAW, R.D & MURRAY, C.G., 1970: Geology of the Rockhampton and Port Clinton 1 :250,000 sheet areas . Geological Survey of Queensland Report, 38 .
MILLER, D.E., 1992: Geology of the southern Moura Mine and Malakoff Range, southeast Bowen Basin, central Queensland. BSc Honours thesis, University of Queensland.
MURRAY, C.G., 1990: Tectonic evolution and metallogenesis of the Bowen Basin. In: Beeston, J.W. (Compiler): Proceedings of the Bowen Basin Symposium 1990, Geological Society of Australia (Queensland Division), Brisbane, 201 - 212. MURRAY, C.G., FERGUSSON, C.L., FLOOD, P.G., WHITAKER, W.G. & KORSCH, R.J ., 1987: Plate tectonic model for the Carboniferous evolution of the New England Fold Belt. Australian Journal of Earth Sciences, 34, 213-236. PATEN, R.J., BROWN, R.S. & GROVES, R.D., 1979: Stratigraphic concepts and petroleum potential of the Denison Trough, Queensland. Australian Petroleum Exploration Association Journal, 19, 43-52. PATERSON, T.A., 1991 : Geology of the Minerva Hills area, Denison Trough, central Queensland . BSc Honours thesis, University of Queensland . REID, J.H., 1924: Geology of the Bowen River coalfield . Queensland Government Mining Journal, 25, 451-466. SORBY, L.A. & SCOTT, S.G., 1988: Geology and coal resources: The Moorlands Basin, Queensland. Queensland Government Mining Journal, 89, 347-360. ZIOLKOWSKI, V. & TAYLOR, R., 1985: Regiona-1 structure of the north Denison Trough. In: Bowen Basin Coal Symposiu. Geological Society of Australia Abstracts, 17, 129-135.
Bowen Basin 1995 - Symposium
16
Bowen Basin 1995 - Symposium
17
Upper Permian Cyclothemic motifs in the es
Moranbah Coal Measur
Per Michaelsen Coalseam Gas Research Institute, Department of Earth Sciences, James Cook University
The Permian system is globally known as a period of climatic instability. New lithostratigraphic data from detailed logging of selected key drill cores may reflect climatic forcing of the sedimentary processes in the markedly cyclic Upper Permian Moranbah Coal Measures. Hosting considerable economic accumulations of coal and coalseam gas, the Moranbah Coal Measures are one of the most intensively explored basin infill systems in the Bowen Basin. However, previous work was conducted prior to the application of sequence stratigraphy to coal-bearing successions. Detailed fades analysis shows the Moranbah Coal Measures is characterised by six recurring lithofacies associations: fossiliferous and bioturbated sandstone (i); carbonaceous mudstone (ii); lithic-rich sandstone (iii); bioturbated interbedded sandstone/siltston e heteroliths (iv); rhythmically laminated-interbe dded sandstone/ siltstone heteroliths and siltstone (v) and coal (vi). These lithofacies associations are interpreted to correspond to six depositional systems: shallow marine, lacustrine, fluvial, estuarine, overbank and peat-mires. Vertical lithofacies successions follow an overall regular cyclothemic pattern within the Moranbah Coal Measures, and preliminary subdivision into eight cyclothems has been made. The eight cyclothems are each comprised of four distinct sedimentary packages: (i) thick, lateral extensive coal seams; (ii) thin and laterally restricted coals, siltstone and fine-sandstone/sil tstone heteroliths, fossiliferous, bioturbated sandstone; (iii) stacked sandstone channel infill (up to 26m thick); and (iv) carbonaceous mudstone, fine-sandstone/sil tstone heteroliths and siltstone. The alluvial plain deposits that characterise the Moranbah Coal Measures are interrupted by two fossiliferous and strongly bioturbated shallow-marine transgressive units in the upper part of the succession. The P-tuff, which is present in all drillcores, is distributed basin-wide and plays two fundamental important roles: (i) as a chrono-stratigraphic marker horizon; and (ii) it provides a detailed regional snap-shot of the fades mosaic, at the time of the volcanic eruption.
was defined as the 259m thick interval 152.4 411. lm in drill hole Grosvenor NS 14, located on the western side of the basin. The base of the Moranbah Coal Measures is characterised by the thick and laterally extensive Goonyella Lower Dysart - German Creek coal seam. This overlies the Kazanian, dominantly marine, Blenheim Formation to the north and the German Creek Formation to the south. The top of the coal-bearing strata is bounded by the Fort Cooper Coal Measures, characterised by abundant tuff beds. Johnson & White (1988) concluded the Moranbah Coal Measures are the most extensive coal measures in the northern basin, and contain thick, laterally extensive, clean coals of medium to low volatile bituminous rank. The thickness of the MCM on the western margin is relatively uniform (250-300m; Figure 1), but increases eastwards (Figure 2) to 480m at Exmoor and 760 m at Kemmis Creek (Johnson & White, 1988; Mallett & others, 1995). The MCM contain up to 17 coal bearing horizons with a maximum coal thickness of 24m in the west.
INTRODUCTI ON
METHODOLO GY
In a review of the stratigraphy of the Upper Permian succession in the northern Bowen Basin (here defined as north of latitude 23 • S), Koppe (1978) introduced the Moranbah Coal Measures (MCM) as a new formation. The MCM type section
Detailed re-logging undertaken on six selected key drill holes (Figures 1 and 2) provides the basis for the lithofacies and sequence stratigraphic analysis presented here. This study has has also drawn on limited outcrop data, previously published and
Koppe (1978) concluded that the dominantly terrestrial Moranbah Coal Measures were deposited when the sea had withdrawn to the south-east, with a north-easterly trending shoreline passing through the Comet area. One or possibly two brief marine incursions, following deposition of the P-tuff bed, were recognised, resulting in the deposition of the partly marine MacMillan Formation in the northern Bowen Basin. The fundamental importance of the P-tuff as a chronostratigraphi c marker bed was recognised by Koppe (1978) and Johnson (1984). The P-tuff is 0.5-2 m thick, rhyo-dacitic in composition, and characterised by abundant bronze-coloured biotite grains. It has been traced over 300km from the north of the basin to the northern Denison Trough (Koppe, 1978; Draper & Balfe, 1985; Mallett & others, 1995). Johnson (1984) concluded the P-tuff represents a single eruption. Prior to this study no sequence stratigraphic analysis has been conducted on the dominantly continental to restricted marine sediments comprising the Moranbah Coal Measures.
Bowen Basin 1995 - Symposium
PHILLIPS CREEK 1 n,.•..,....,. . ,,..n·1u- ...
MORANBAH2
11,,.,
.._.
_______ _
Cyclothem 8 Cyclothem 7
LEGEND BED CONTACTS
L:::J::-............ p- ....,,._ LITHOLOCIES
RIPSTONE 1 JJU' )fr .... . 14ttTUrlMI
-...... ......_ _ .------. ---
= a - . , . _ . ...........
---
- '· ••: ,. :- - - - Moran bah Coal Measures
MacMillan Formation
...
---
;.
,
,l......... ~
•Ill
o-..•-------...... ....._... _,,_,.,_.__
........
.......... _...,.
1-
1t c.. """'............. _....,...._,
,....,._
m
....=
, , ___ -a_
,_
1.0 1.0 VI
M... 0-
SEDIMENTARY STRUCTURES
MacMillan Formation
Cyclothem 5
---
.,_,_
~==
BIOTURBATION AB UNDANCE
Cyclothem 4
IJ)
'<
a
"O 0
...
Cyclothem 3
r:,,
s::
a o, .... .,,., , _ , _
o,....,...,., ,_._
Cyciothem 2
0 , . - -, -
°"""'.....,1_,_ a,.-.._,,_,_
Cyclothem 1 Location of cored section~
UPPER PERMIAN Figure 1. Correlation diagram of the Moranbah Coal Measures (north-south).
NORTHERN BOWEN BASIN
19
MORANBAH COAL MEASURES CORRELATION DIAGRAM West
East
c. 50km
-
SOUTH KEMMIS CREEK I TEVIOT BROOK I NORTH MORANBAH 1
Cyclothem 8
---
---
Cyclothem 6
Cyclothem S
Cyclothem 4
---
--
Cyclothem 3
Cyclothem 1
LEGEND
Cyclothem 2
8£0 CONTACTS
e=---~ - -..·-____ . ..... umoLOC•ES
....
:·J::".:._
SEDIMENTARY STRUCTURES
.1- - -
... --_ _
50km i...........,
-~ -~
" _, ' ..,- -
.... ,_ .......... I
I
._,......,._,.
C...__..,_._,
IIOTIJR8ATION AIIIU1'0AP.:CE
Location of cored sections in the northern Bowen Basin
~~
Figure 2. Correlation diagram of the Moranbah Coal Measures (east-west).
Bowen Basin 1995 - Symposium
20
unpublished reports, as well as interpretation of a new comprehensive seismic database, (R. Clare, personal communication, 1995).
LITHOFACIES ASSOCIATIONS Six lithofacies associations have been differentiated (Table 1). These represent a variety of restricted marine and terrestrial depositional systems. Lithofacies association 1: Shallow marine
Lithofacies association 1 comprises a shellbed and strongly bioturbateded well to moderately sorted, quartz-poor, fine-sandstone. The shellbed is matrix supported, conformably interbedded with bioturbated fine-sandstone, and characterised by robust, slightly abraded, disarticulated brachiopod valves. Biogenic structures comprise a fairly high diversity of horizontal, vertical and inclined ichnofossils generated by organisms from the Skolithos and Cruziana ichnofacies associations. These include traces generated by suspension and mobile deposit feeding taxa: Skolithos, Palaeophycus, ?Psilonichnus and large Rosselia. In drill hole Phillips Creek 1, interval 312 - 325.8m, three major cycles of increasing ichnofossil size were identified. The base of the cycles are characterised by abundant tiny horizontal infilled burrows, which increase in diversity and size upwards with the top of the unit consisting of robust (up to 18cm long) sand-filled Skolithos shafts and large (up to 8cm long) funnel-shaped Rosselia burrows. The marine deposits can be correlated in drill holes in the southern part of the Northern Bowen Basin (Figure 1) and are interpreted to represent shore face deposits generated during the highstand phase of the eustatic cycle. The two marine incursions resulted in an interfingering of the MCM with the partly marine MacMillan Formation (Figure 1). The shellbed is interpreted to represent a sedimentologic episode in which wave-generated winnowing resulted in relatively undegraded bioclastic material being left as a gravel lag at the sediment surface. A shoreface or very shallow subtidal environment is inferred.
bedding planes. Such sand bodies are up to 26m thick, and are dominantly massive but show sporadic cross-bedding. These thick sandstone units are bounded by overbank deposits and are characterised by sharp irregular and often erosive basal contacts. Type (3b) fades are composed of well sorted, fine-medium, lithic-rich sandstone often overlain by a thin siltstone unit. This fades has a maximum thickness of some 3m. Sedimentary structures include ripple trough- and planar laminate cross bedding. Type (3c) lithofacies is only developed on the eastern basin margin and subdivided into two groups. Subdivision (3c1) comprises well-sorted, rounded, multi-volcanolithic conglomerate units (up to llm thick), and (3c2) consists of shallow fining-up cycles of basal conglomerate abruptly overlain by fine-coarse Ii tharenite. The thick, type (3a) sandstone units are interpreted to represent stacked incised fluvial channel-fill packages deposited during early base-level rise (late lowstand - early transgressive phases of the eustatic cycle). The inferred channel-fill packages bear a strong similarity to similar deposits documented by Aitken & Flint (1995), who described identical stacked fluvial bodies deposited in a similar (foreland) basin setting. Aitken & Flint (1995) interpreted such packages as reflecting an increase in the rate of fluvial aggradation and accommodation space, and concluded that the major sandstone bodies represent stacked incised valley fills. Type (3b) fades are interpreted to represent deposits of shallow ?meandering channels, probably restricted to the transgressive and highstand phases. The 3c1 /3c2 units are interpreted to represent deposition during a phase of tectonic uplift, in a braided fluvial depositional environment proximal to the source of immature, heterogeneous, volcanolithic material shed from the Eungela-Cracow Mobile Belt. Lithofacies association 4: Estuarine
Lithofacies association 2: Lacustrine
Lithofacies association 2 is characterised by carbonaceous mudstone deposits up to Sm thick. The relatively thick mudstones are dominantly bounded by siltstone and coal seams. The mudstones are characterised by planar lamination, often with abundant plant material on bedding planes. The stratigraphic position of the mudstones suggest that they developed as lacustrine/shallow pond deposits during base-level rise. Lithofacies association 3: Fluvial
Lithofacies association 3 comprises three distinct lithofacies: Type (3a) consists of well sorted, fine-coarse, but dominantly medium grained, feldspar and lithic-rich sandstone with common rounded, often elongated, intra-formational, ripped-up silt pebbles and coarse plant material on
Lithofacies association 4 comprises disturbed laminated and interbedded siltstone and fine sandstone couplets. Sedimentary structures include abundant trace fossils, wavy, flaser and parallel bedding. The biogenic structures produced by benthic organisms are characterised by a low diversity assemblage of deep protective suspension feeding Skolithos, Teichichnus, and inclined ?Psilonichnus traces. The ichnofossils increase in size upwards, but undergo a size reduction towards the very top of the unit. Coupled with integrated lithostratigraphic data, ichnofossils provide important environmental information. The deep (up to 10cm) horizontal robust Skolithos shafts are interpreted to reflect burrowing by infaunal suspension feeding organisms as an adaption to radical tidal-induced changes in salinity levels in an estuarine depositional system.
Bowen Basin 1995 - Symposium
=
0
LITHOFACIES ASSOCIATIONS
LITHOLOGY
SEDIMENTARY STRUCTURES
TH IC KN ESS
FOSSILS
DEPOSITIONAL ENVIRONMENT
1a. She IIbed
Matrix (fine-sandstone) supported shellbed
None
22 cm
Heavy-shelled brachiopods
Shallow marine
1b. Bioturbated sandstone
Well-moderately sorted fine litharenite.
Disturbed bedding
Upto 4m
lchnofossils (inclined, horizontal, deep protective Skolithos and funnel-shaped Rosselia burrows).
Shallow marine
2. Carbonaceous mudstone
Fissile dar1< greyish carbonaceous mudstone.
Laminated
UptoS m
Fine plant fragments
Lacustrine
3a. Sandstone
Well sorted fine-coarse litharenite. Common ripped-up mud pebbles. Sharp irregular & often erosive basal contacts.
Dominantly massive, common cross bedding.
Up to 26m
Fine-coarse plant fragments.
Stacked incised fluvial channel-fi II
3b. Sandstone
Very well sorted fine-medium litharenite. Occasional mica on bedding plane.
Massive, ripple- and trough cross-bedding
Up to 3m
Fine plant fragments
Shallow fluvial channels
3c. Conglomerate
Clas! supported multi-volcanolithic conglomerate with sharp basal contacts.
None
Upto11m
None
Braided fluvial system
4. Heterolith
lnterbedded fine-sandstone & siltstone couplets.
Wavy, flaser, parallel , and disturbed bedding
Up to 3m
Inclined and deep protective Skolithos ichnofossi Is.
Estuarine system
Sa Heterolith
lnterlaminated - interbedded couplets of fine-sandstone and siltstone.
Wavy, parallel & slumped bedding
Up to 1Sm
Fine plant fragments of Sphenopteris, Gangamopteris and Glossopteris.
Overbank
Sb. Siltstone
Very well sorted siltstone. Mica on bedding planes.
Parallel lamination and occasional poorly developed bedding.
Up to 14m
Fine plant fragments of Sphenopteris, Gangamopteris and Glossopteris.
Overbank
6a. Coal
Clean, low ash coal. Occasionally interbedded with thin luffs & tonsteins. Laterally extensive.
Flat lamination
Upto 9m
Plant fragments.
Peat mire
6b. Coal
Dirty and low ash coal seams. Commonly interbedded with carbonaceous mudstone. Laterally restricted.
Flat lamination
Upto 1m
Plant fragments.
Peat mire
~ fll
= = ... = .... 11,1
(II
1,0 1,0
U1
rJ'J
'<
!3
"C 0
...
(II
s::
!3
Table 1. SUMMARY OF THE SIX LITHOFACIES ASSOCIATIONS IN THE UPPER PERMIAN MORANBAH COAL MEASURES
22
Lithofacies association 5: Overbank Lithofacies association 5 comprises packages, up to 15m thick, of fine-sand/silt heteroliths, interbedded fine-sand/silt couplets, siltstone and carbonaceous mudstone. These deposits are mainly bounded below by thick massive sand packages (lithofacies association 3). The siltstone units lie conformably beneath and above coalseams, and siltsone and mudstone commonly occurs as thin beds within coalseams. Such siltstone is characterised by abundant well-preserved leaf imprints of Gangamopteris, Glossopteris and Sphenopteris on bedding planes, as well as coarser plant material. Sedimentary structures comprises wavy and parallel-lamination and slump structures. Beds may be massive with poorly-developed bedding planes. These sediments are interpreted to represent proximal to distal crevasse splay deposits, dominantly associated with the transgressive highstand phases of the eustatic cycle. Lithofacies association 6: Peat mires
Lithofacies association 6 is composed of coal seams with occasional interbedded thin pale, yellow brown tuff, tonstein, siltstone and carbonaceous mudstone. It is dominantly bounded by overbank deposits (lithofacies 5). Two types of coal seams are recognised: Type (6a) comprised of three to eight (Devey, 1983) low ash, relatively thick (up to 9m) seams which can be correlated on a regional scale (for example the Goonyella Lower-Dysart-German Creek coal seam which can be correlated over a distance of 200km (Mallett & others, 1995) and the Goononyella Middle-Harrow Creek Seam tracable over 250km along the western basin margin (Johnson & White, 1988). Type (6b) comprises relatively thin (<lm), often dirty coals of limited lateral distribution. McCabe (1984) concluded that relatively low ash contents within thick, laterally continuous coals suggests development in long-lived, laterally extensive raised peat mires on abandoned sections of a delta plain when base level was sufficiently high to raise the water table to ground level (Aitken & Flint, 1995). For the Sydney Basin, Arditto (1991) found that thick laterally extensive transgressive cycle coal seams, similar to type (6a), can be correlated over large distances and hence have basin-wide significance, whereas thin dirty discontinuous coal deposits, similar to type (6b), associated with the highstand phase of the eustatic cycle, cannot be correlated over any significant distance in the basin. The thick and laterally extensive type (6a) coal seams are likely to have been generated as a consequence of water table rise coupled to coastal ponding and elastic sediment starvation. In a sequence stratigraphic context the relatively thin, dirty and laterally restricted type (6b) coal seams are thus ihterpreted to represent the highstand phase of the eustatic cycle.
SEQUENCE STRATIGRAPHY OF COAL-BEARING STRATA The revolutionary conceptual framework of the sequence stratigraphic model developed by researchers at the Exxon Production Research Company (Vail & others, 1977; Posamentier & others, 1988; Vail & others, in press) is a powerful technique which interprets the geological record in terms of relative sea level changes. The sequence stratigraphy interpretation process develops a global chronostratigraphic framework of cyclic, genetically related strata bounded by surfaces of stratal discontinuity created by erosion or by non-deposition or by their correlative conformities (Vail & others, in press). Arditto (1991) reinterpreted the Late Permian succession in the Sydney Basin using the sequence stratigraphic concept. Results indicated that six major Permian eustatic cycles controlled sedimentation. Arditto (1991) reported that depositional sequences corresponding to the eustatic cycles were initiated and terminated by rapid forced regressions. Resulting unconformity surfaces which bound the sequences in the Sydney Basin extend over significant areas, and Arditto concluded that these sequence boundaries may be recognised in adjacent areas such as the Bowen Basin, as well as having a global significance. Deltaic depositional models for the accumulation of laterally extensive coals were advocated by Horne et al. (1978) and later Ryer (1981) and McCabe (1984). However, as Arditto (1991) pointed out, these models fall far short of explaining the occurrence of thick, laterally extensive coal deposits. Coal genesis by coastal ponding during the early phase of transgression as described by Arditto (1991) may explain the basin-wide extent of some coal deposits in the Sydney Basin and may be used to explain the occurrence of the thick, laterally extensive coal deposits in the northern Bowen Basin. Wells & others (1993) identified several sequence boundaries within the Permo-Triassic strata in the southern Bowen Basin. However, no systems tracts were identified, because most of the succession preserved in the region is non-marine, and the marine portion is relatively thin. Further more, the authors found it difficult to discriminate between systems tracts in non-marine strata and concluded that terrestrial sequences may be closely coupled to tectonics and sediment supply rather than forced sea-level fluctuations. Wells & others (1993) undertook an analysis of the southern Bowen Basin based exclusively on seismic data. The sequence stratigraphic framework recognised by Wells et al. were probably 3rd-order cycles of sea-level fluctuations, similar to the cycles documented by Arditto (1991), whereas the eight cyclothems described in this study may represent higher-resolution 4th-order (?400ka) base-level changes.
Bowen Basin 1995 - Symposium
23
Surlyk & others (1995) point out that sequence stratigraphic interpretation of dominantly continental to restricted marine successions, such as the Moranbah Coal Measures, is not a straightforward task. An example of this can be shown by the difficulties involved in recognising the difference between: (i) a localised erosional boundary, generated by channel scour and due to autocyclic mechanisms, and (ii) a significant regional/global sequence boundary generated as a result of forced regression. Nevertheless, application of sequence stratigraphy to coal-bearing successions, as developed by Arditto (1991), Flint (1993), Boyd & Diessel (1994) and Aitken & Flint (1995) can provide new insight into sedimentary systems and the fundamental controls on their accumulation. The cyclicity apparent in the Moranbah Coal Measures encourages an analysis based on sequence stratigraphic methodology.
ARCHITECTURE OF THE MCM CYCLOTHEMIC MOTIF Vertical facies successions follow an overall regular cyclothemic pattern within the Moranbah Coal Measures which has been preliminary divided into eight cyclothems. An idealised cyclothemic motif (Figure 3) can be subdivided into four distinct sedimentary packages: (i) stacked fluvial, well sorted fine-medium, massive sandstone bodies (up to 26m thick); (ii) minor channel sandstone-fill (up to 3m thick), siltstone, heterolithic fine-sandstone/ siltstone overbank deposits, and lacustrine carbonaceous mud (up to Sm thick); (iii) thick (up to 9m) and lateral extensive low ash, coal seams. (iv) minor channel sandstone boddies (up to 3m thick), fossiliferous and bioturbated shallow marine sandstone, and bioturbated estuarine heteroliths. This fourfold subdivision corresponds to the assemblage predicted by the sequence stratigraphic models: (i) lowstand systems tract (LST) deposits; (ii) transgressive systems tract (TST); (iii) Aitken & Flint's (1995) maximum flooding zone (MFZ), and (iv) highstand systems tract (HST). Obvious variations in thickness and lithology exist in the cyclothemic motif (Figures 1, 2 and 3) of the Moranbah Coal Measures. The basic stratigraphic architecture related to fluctuations in sea-level was therefore influenced by other controls, such as overprinting by autocyclic processes, periods of tectonic uplift of the eastern volcanic source area, migration of depositional centres, variations in sediment supply, cyclic variation in precipitation rates as well as a variation in the magnitude and rate of base-level changes.
DEPOSITIONAL MODEL Preliminary results from detailed lithofacies analysis of this study show the Moranbah Coal Measures are dominated by lithic-rich sandstone and rhythmically laminated-interbedded sandstone/siltstone couplets, with subordinate
conglomerate, siltstone, carbonaceous mudstone and coal. The Upper Permian sedimentation occurred in six depositional systems: fluvial, overbank, lacustrine, peat-mires, estuarine and restricted marine. The fluvial-dominated alluvial plain deposits are interrupted by two fossiliferous and strongly bioturbated shallow-marine incursions in the upper part of the succession. Petrological analysis of rounded intra-formational cobble clasts in sandstone units by Falkner (1993), suggests substantial channel incision during the accumulation of the MCM. Falkner (1993) concluded that abundant first-cycle feldspar and volcanic rock fragments indicates the volcanic arc to the east of the Bowen Basin was the dominant source area during the deposition of the MCM. This concurs with Jensen (1968, 1975) who concluded that deposition of the MCM related to southflowing streams, with northern and eastern margins providing mainly immature volcanic material from the Eungela-Cracow Mobile Belt. Falkner & Fielding (1990) postulated an upper delta plain setting for the MCM based on its lateral equivalence with the German Creek Formation which were interpreted, by Falkner & Fielding (1990), to be of lower delta plain origin. However, as Diessel (1992) pointed out, this setting for the German Creek Formation falls far short of explaining (i) the occurrence of thick laterally extensive coal seams; (ii) the lack of lobate delta front sands; (iii) the occurrence of lagoonal sediments and (iv) texturally mature sandstones with beach lamination in the floors of some coal seams. Diessel (1992) suggests that some of the stratigraphically lower German Creek Formation coals might have been generated in a strand-plain depositional system, which both landward and upwiird graded into a river-dominated alluvial plain setting. The variations in the vertical lithofacies successions (Figures 1, 2, and 3) indicate deposition of the MCM resulted from complex interactions of allocyclic and autocyclic processes, periods of tectonic uplift of the eastern volcanic source area, movements of depositional centres, variations in sediment supply, cyclic variation in precipitation rates as well as a variation in the magnitude and rate of base-level changes.
CONCLUSIONS 1) The Moran bah Coal Measures comprise six lithofacies associations: fossiliferous and bioturbated sandstone (i); carbonaceous mudstone (ii); lithic-rich sandstone (iii); bioturbated interbedded sandstone/ siltstone heteroliths (iv); rhythmically laminated-interbedded sandstone/ siltstone heteroliths and siltstone (v) and coal (vi). These lithofacies are interpreted to represent six depositional systems: shallow marine, lacustrine, fluvial, estuarine, overbank and peat-mires.
Bowen Basin 1995 - Symposium
24
UPPER PERMIAN CYCLOTHEMS NORTHERN BOWEN BASIN, AUSTRALIA SEQU~NCE STRATIGRAPHY
LITHOFACIES ASSOCIATION/ DEPOSITIONAL ENVIRONMENT
LST ?Sequence boundary
HST Lithofacies association 3b/5b. Lithic-rich medium-fine, fining-up sandstone units. Well TST . _ _ _ _ soned siltstone with mica and abundant fine plant material on bedding planes. Interpreted as shallow fluvial channels and crevasse splay deposits.
Maximum Flooding Zone
-...... . . . -- .... - . . ... . . · · · · ·· · -- .. ..... ....... . ·•• ·•••· .. ···•··• ••···· .
. . ........... . .. . . .... . . •-----------o•-
LST .... ◄t-----
. . . .. ... .. .. .... . . - . .. .. ... . ...... .. .. . .... ...
~
.. ... - . . . . . . . . ..... . .. .
Lithofacies association 3a. Well sorted, finecoarse, but dominantly medium grained, feldspar and lithic-rich sandstone with common rounded, often elongated, intra-fonnational, ripped-up silt pebbles on bedding planes. Such sand bodies are up to 26m thick and characterised by sharp irregular and often erosive basal contacts. Interpreted to represent stacked incised fluvial channel-fill .
Sequence boundary
HST ...,. ◄t---
Maximum Flooding Zone
Lithofacies association 3b/5b. Lithic-rich finesandstone unit fining-up into well sorted siltstone with mica and abundant fine plant material on bedding planes. Interpreted as a crevasse splay deposit.
TST Lithofacies association 6a. Clean. low ash coal seam. Interbedded with thin pale, yellow brown tuffs. Relatively thick and laterally extensive. Interpreted as a long-lived peat mire deposit LST LEGEND BED CONT AC T S
LITIIOLOGI ES
10 m
Figure 3. Idealised cyclothemic motif in the Moranbah Coal Measures.
Bowen Basin 1995 - Symposium
25
2) Sequence stratigraphic analysis of the dominantly continental deposits of the Moranbah Coal Measures is a far from simple exercise. However, application of sequence stratigraphy to coal-bearing successions can be applied to the markedly cyclic Moranbah Coal Measures. Eight cyclothems were identified. Each cyclothem comprises four distinct sedimentary packages: (i) thick, lateral extensive coal seams; (ii) thin and laterally restricted coals, heterolithic and siltstone overbank deposits, fossiliferous, bioturbated sandstone and bioturbated heteroliths; (iii) stacked sandstone channel infill (up to 26m thick); and (iv) carbonaceous mudstone, heteroliths and siltstone. This fourfold subdh'.ision corresponds to the sequence stratigraphic models lowstand systems tract deposits (i); transgressive systems tract (ii); Aitken & Flint's (1995) maximum flooding zone (iii), and highstand systems tract (iv). 3) In a stratigraphic context it is of importance to improve coal seam nomenclature. Some nomenclature appears superfluous, as thick, lateral continuous coal seams have different names in different coal mines. 4) Variations in thickness and lithology exist in the cyclothemic motif of the Moranbah Coal Measures. The basic stratigraphic architecture related to fluctuations in sea-level was therefore influenced by other controls, such as overprinting by autocyclic processes, periods of tectonic uplift of the eastern volcanic source area, migration of depositional centres, variations in sediment supply, cyclic variation in precipitation rates as well as a variation in the magnitude and rate of base-level changes. 5) The P-tuff plays two fundamental roles: (i) as a chrono-stratigraphic marker horizon, and (ii) providing invaluable fades mosaic information at the time of the air-fall burial. Comprehensive re-logging of drillcore above and below the tuff bed will give a detailed regional snap shot of the fades mosaic at the time of the volcanic eruption.
ACKNOWLEDGEMENTS This paper presents early results from a PhD study carried out at the Coalseam Gas Research Institute, Department of Earth Sciences, James Cook University. I thank MGC Resources Australia, Shell Australia, and BHP Australia Coal for generous help and access to company data.
REFERENCES AITKEN, J.F. & FLINT, S.S., 1995: The application of high-resolution sequence stratigraphy to fluvial systems: a case study from the Upper Carboniferous Breathitt Group, eastern Kentucky, USA . Sedimentology, 42, 3-30.
ARDITTO, P.A., 1991 : A sequence stratigraphic analysis of the Late Permian succession in the Southern Coalfield, Sydney Basin, New South Wales. Australian Journal of Earth Sciences, 38, 125-137. BOYD, R. & DIESSEL, C.F.K., 1994: Sequence stratigraphy and its application to coal geology . Department of Geology, University of Newcastle. DEVEY, D.M., 1983: THe influence of structure on the development of underground coal mines in the western Bowen Basin. In, Proceedings of a symposium on the Permian Geology of Geology of Queensland, Geological Society of Australia (Qld Division), Brisbane, 73-80. DIESSEL, C.F.K., 1992: Coal -Bearing Depositional Systems . Springer Verlag. DRAPER, J.J. & BALFE, P.E. 1985: Late Permian stratigraphy - western Bowen Basin, Queensland. Proceedings, 19th Symposium on Advances in the Study of the Sydney Basin, Department of Geology, University of Newcastle, 106-109. FALKNER, A. & FIELDING, C.R., 1990: German Creek Formation and Moranbah Coal Measures: a transition from marine shelf to upper delta plain. Proceedings of the 24th Newcastle Symposium on Advances in the Study of the Sydney Basin, 41-48. FALKNER, A. 1993: Sedimentological analysis of ATP 364P for MGC Resources. FLINT, S.S. 1993: The application of sequence stratigraphy to ancient fluvial successions. In Yu, B. & Fielding, C.R., (Editors): Modern and ancient rivers their importance to mankind. Keynote Addresses & Abstracts of the 5th International Conference on Fluvial Sedimentology, Brisbane, July 1993, K22-K32. HORNE, J.C., FERM, J.C., CARUCCIO, F.T. & BAGANZ, B.P., 1978: Depositional models in coal exploration and mine planning in Appalachian Region. American Association of Petroleum Geology Bulletin, 62 (12), 2379-2411. JENSEN, A.R. 1968: Upper Permian and Lower Triassic sedimentation in part of the Bowen Basin, Queensland. Bureau of Mineral Resources Geology and Geophysics Record, 1968/55. JENSEN, A.R. 1975: Permo-Triassic stratigraphy and sedimentation in the Bowen Basin, Queensland. Bureau of Mineral Resources Geology and Geophysics Bulletin, 154. JOHNSON, D.P. 1984: Development of Permian fluvial coal measures, Goonyella, Australia. International Association of Sedimentologists Special Publication, 7, 149-162. JOHNSON, D.P. & WHITE, M .G.J., 1988: Geological assessment of natural gas from coal seams in the northern Bowen Basin, Australia. Department of Geology, James Cook University of North Queensland. KOPPE, W.H., 1978: Review of the stratigraphy of the upper part of the Permian succession in the northern Bowen Basin. Queensland Government Mining Journal, 79, 35-45. McCABE, P.J., 1984: Depositional models of coal and coal-bearing strata. In : Rahmani, R.A. & Flores, R.M. (Editors): Sedimentology of Coal and Coal-bearing Sequences. International Association of Sedimentologists, Special Publication, 7, 13- 42.
Bowen Basin 1995 - Symposium
26
MALLETT, C.W., PATTISON, P., McLENNAN, C., BALFE, P. & SULLIVAN, D., 1995: Bowen Basin. In : Ward, C.R., Harrington, H.J., Mallett, C.W. & Beeston, J.W. (Editors): Geology of Australian Coal Basins. Geological Society of Australian Incorporated Coal Geology Group Special Publication, 1, 299-339. POSAMENTIER, H.W. & VAIL, P.R., 1988: Eustatic controls on elastic deposition 2 - sequence and systems tract models. In: Wilgus, C.K. (Editor): Sea-level changes: an integrated approach. S.E.P.M . Special Publication, 42. RYER, T.A., 1981 : Deltaic coals of Ferron Sandstone Member of Mancos Shale: Predictive model for Cretaceous coal-bearing strata of Western Interior. Americal Association of Petroleum Geologists Bulletin, 65 (11), 2323-2340.
SURLYK, F., ARNDORFF, L., HAMANN, N.-E., HAMBERG, L. JOHANNESSEN, P.N., KOPPELHUS, E.B., NIELSEN, L.H., NOE-NYGAARD, N., PEDERSEN, G.K. & PETERSEN, H.J., 1995: High-resolution sequence stratigraphy of a Hettangian-Sinemurian paralic succession, Bornholm, Denmark. Sedimentology, 42, 323-354. VAIL, P.R., MITCHUM, R.M . & THOMSON, S., 1977: Seismic stratigraphy and global changes of sea level, part 4; Global cycles of relative changes of sea level. American Association of Petroleum Geologists, Memoir, 26, 83-97. VAIL, P.R., BOWMAN, S.A. & VAIL, A. (in press): The techniques of sequence stratigraphy (shelfal accommodation space and types of stratigraphic cycles). WELLS, A.T., BRAKEL, A.T., TOTTERDELL, J.M., KORSCH, R.J. & NICOLL, M.G., 1993: Sequence stratigraphic interpretation of seismic data north of 26 degree S, Bowen and Surat Basins, Queensland. AGSO Records, 51.
Bowen Basin 1995 - Symposium
27
Struc tural events and deformational styles
in the Bowen Basin
Russell J Korsch & Jennifer M Totterdell Marine, Petroleum & Sedimentary Resources Division, Australian Geological Survey Organisation
Sedimentary basins are sensitive indicators of tectonic events that occur in adjacent orogens. The Bowen Basin in eastern Australia developed in a backarc tectonic setting behind an active convergent plate margin, and a series of intraplate deformationa l events in the basin can be related to similar events in the New England Orogen. These intraplate deformationa l events include initiation of the basin by an extensional event in the Early Permian, several contractional events (mid-Permian; Early Triassic; Middle-Late Triassic; early Late Cretaceous), and finally another, minor, extensional event in the Eocene. These events were probably due to plate interactions, including the accretion of terranes, at the ancient active plate margin located to the present east of the basin. The reactivation of earlier structures played a very important role in the structural development of the Bowen Basin during the extensional and contractional events. KEYWORDS: Deformation, extension, contraction, Bowen Basin, New England Orogen.
INTRODUC TION Principally because of palaeontologic al time control, sedimentary basins are sensitive indicators of tectonic events that may be occurring in adjacent orogenic areas. The Early Permian-Midd le Triassic Bowen Basin is inboard of the New England Orogen and is, in part, covered by the Early Jurassic-Early Cretaceous Surat Basin. These basins evolved in a back-arc tectonic setting, and structures in them preserve a record of the responses of the basins to the tectonic events that occurred in the orogen to the east. This paper documents the timing and style of the main structural events in the Bowen Basin and, where applicable, in the Surat Basin. It supports and extends the deformational scheme developed by Elliott (1993), but presents a reinterpretatio n of the structural styles and the relative significance of the events compared with that of Elliott. The Permian and Mesozoic deformational events observed in the Bowen Basin resulted from interplate and intraplate tectonic events at a subduction-re lated Gondwanan plate margin located to the east of the present New England Orogen. The results are based on the interpretation of about 1000 seismic lines (~15 000 line km of data) by the Australian Geological Survey Organisation and the
Geological Survey of Queensland as part of the National Geoscience Mapping Accord (NGMA) project "Sedimentary Basins of Eastern Australia".
BOWEN BASIN Totterdell & Korsch (1992) used tectonic subsidence curves to subdivide the Bowen Basin into several basinal phases. In the western part of the basin, in the Denison Trough (Figure 1), initial rapid subsidence in the Early Permian was due to mechanical extension and formation of a series of half graben (phase 1). At the same time in the eastern part of the basin, the Taroom Trough, there was the eruption of a thick volcanic pile, probably also in an extensional environment (Murray, 1990). The axis of the Taroom Trough is followed by a north-south gravity high, termed the Meandarra Gravity Ridge by Lonsdale (1965). Two-dimensio nal modelling of the gravity ridge on several east-west traverses by Krassay & others (in prep.) supports a previous model across the ridge in the Sydney Basin by Qureshi (1984) in suggesting that the gravity anomaly can be explained by an asymmetric pile of mafic volcanics beneath the Permian sedimentary pile. This implies that a large magmatic-dom inated extensional system was operating to the east of, and simultaneousl y with, the much smaller, non-magmatic extensional half graben in the Denison Trough. These extensional events were followed by a second basin phase (phase 2) with slower subsidence rates driven by thermal relaxation of the lithosphere. This phase was then interrupted in the Late Permian by the onset of rapid subsidence in the Taroom Trough, interpreted as foreland loading (phase 3) due to thrusting and crustal thickening in the New England Orogen to the east. The foreland loading phase was diachronous across the basin, being earlier in the east than in the west. Eventually, in the Middle Triassic, the thrust front in the New England Orogen propagated westwards into the basin, effectively terminating sedimentation . This, combined with erosion in the Late Triassic, produced a peneplain surface on which the Surat Basin was deposited. The break between the Bowen and Surat basins represents a phase of uplift and erosion (phase 4), is a significant unconformity in terms of time (about 35 m.y.), and is markedly angular in places. Subsidence of the Surat Basin was again driven by
Bowen Basin 1995 - Symposium
28
150"
20° 0
200km
PACIFIC OCEAN
24°
________,
QlO
NSW
SURAT
20° /
BASIN
32"
TASMAN SEA
Early Tertiary, and shortening during the mid-Permian, Early Triassic, Middle-Late Triassic and post-Early Cretaceous (see also Elliott, 1993). Several other unconformities are recognised in the sedimentary succession but are sequence boundaries that are probably not related to structural events (Totterdell & others, 1995). Palynological data, combined with ongoing SHRIMP dating of tuffs in the succession, provide constraints for the ages of the events in the Bowen Basin, but attempts to correlate these events with events to the east in the New England Orogen are less certain because of the increased deformational overprint, higher metamorphic grade and the paucity of well constrained, high quality, isotopic ages in the orogen. From the mid-Permian onwards, the New England Orogen was a major foreland thrust belt that developed in a back-arc setting behind the convergent plate margin that had migrated to the east. The orogen is a classic example of a doubly-vergent orogen (Willett & others, 1993), with west-dipping subduction in the east and the predominantly east-dipping thrusts in the west (Fergusson, 1991; Korsch & others, 1993).The thrust. front propagated westwards towards the Bowen Basin, with subsidence starting to be driven by foreland loading in the Late Permian. In the southern part of the Bowen Basin, the thrusts propagated to the present basin margin by the Middle Triassic, with older sediments of the Bowen Basin being uplifted and cannabilised. However, in the Blackwater area in the central part of the basin, the thrusts had propagated well into the basin by this time (Korsch & others, 1990). The foreland thrust belt existed for about 40 m.y., which is typical of foreland thrust belts elsewhere in the world .
16/A/296
EARLY PERMIAN EXTENSION Jurassic-Cretaceous sediments Permian-Triassic sediments Concealed margin of Permo-Triassic sediments
Figure 1. Map of eastern Australia showing locations of the Bowen Basin, Surat Basin and New England Orogen. Also shown are the locations of the seismic sections shown in Figures 2 to 5, and correspondingly labelled 2 to 5.
thermal relaxation of the lithosphere (phase 5). 1:hus the subsidence history of the Bowen Basin is complicated, involving volcanism, mechanical extension, thermal cooling and thrust-related flexuring of the lithosphere during foreland loading. The main structural events within the basins involved extension during the Early Permian and
Evidence for this phase is best seen in the Denison Trough, on the western side of the Bowen Basin (Figure 1 ). Here, Early Permian extensional faults bound several discrete half-graben (e.g. Figure 2) which contain up to 4000m of syn-rift non-marine sedimentary fill. The main half graben are bounded on the west by east-dipping extensional faults (e.g. Meri vale Fault), and there is rapid growth of the rift fill towards the fault. There are, however, half graben with the opposite polarity, being bounded on the east by west-dipping faults (e.g. Figure 2), but these tend to be smaller is size. Both polarities show bounding fault displacements that were greatest near the centre of the fault, decreasing towards both ends of the fault, with zero d isplacement at the fault tips, typical of fault growth models for extensional basins (e.g. Schlische, 1991). Smaller half graben that formed at the same time as the half graben in the Denison Trough constitute the Arbroath and Bogong Troughs further to the
Bowen Basin 1995 - Symposium
29 0
1km
0.3
B70
~~-#!t!-:~~.~~-:; :__✓~
-
~
- -'
• •
:
B50
---
S . ~ --
---=-~--.- - -
-·S:~.. .-.-::::·-=--· '
- --· - · --···
B45
.,,..--.~.·
B40
!".:~':"'-.
B31
26/A/54
Figure 2. Seismic line AD91-03 showing the geometry of one half graben in the northern part of the Denison Trough. Horizons labelled by a letter and number on this and the other seismic sections refer to sequence boundaries (Figure 6) described by Totterdell & others (1995). The rift fill, deposited during the active extensional phase, is bounded by the B15 and B31 sequence boundaries. This section is a typical geometry for the half graben, and also shows the later reactivation of the bounding fault, with inversion of the rift fill and formation of a fault-propagation fold above the thrust.
south in Queensland, and also the Collarenebri Graben (in reality a half graben) in New South Wales (Bamberry & others, 1995). There have been two main models proposed for this extensional phase. Hammond (1988) postulated that inferred north-east-trending transfer faults partitioned the basin into several extensional compartments. The inference was that the extension direction was NE-SW. Elliott (1993) proposed that the half graben of the Denison Trough were bounded by two fault sets: extensional faults with a north-south orientation and transfer faults oriented towards the southeast. This implies a NW-SE extension direction, essentially perpendicular to that proposed by Hammond (1988). Mapping of the faults during our seismic interpretation has shown a fault pattern that is very similar pattern to that proposed by Elliott; we have found no evidence for the NE trending transfer faults postulated by Hammond. Some of the extensional faults have been reactivated as thrusts during the later contractional events. In an attempt to determine the extension direction we have undertaken a dip analysis using the method of Scott & others (1994). Dip analysis is independent of the fault geometries, and can be used to infer the kinematics of extensional fault systems because the dip direction of the hanging wall block is parallel to the direction of tectonic transport. We used only those dip directions which showed no evidence of later reactivation. The results are consistent between the Denison and Arbroath Troughs and indicate an
east-northeast extension direction. Thus for the Early Permian extension, we have found a fault pattern similar to that mapped by Elliott (1993), but an extension direction similar to that proposed by Hammond (1988). This extensional event also affected the New England Orogen, with several Early Permian structural blocks within the orogen being interpreted as remnants of extensional basins, some of which may have been part of a single much larger basin system (e.g. Barnard Basin of Leitch, 1988), but because of the strong deformation that the blocks have sufferred, it is diffficult to determine their original geometries.
MID-PERMIAN CONTRACTION This event is best seen in seismic data from the Denison Trough, where it is equivalent to the unconformity in the middle of the Aldebaran Sandstone. In places, many of the extensional faults bounding the half graben have reactivated as thrust faults during this event, leading to partial inversion of the sedimentary pile, with the lower Aldebaran Sandstone below the unconformity being uplifted and partially eroded. In seismic section BMR78-02 (see Totterdell & others, 1995, figure 3), for example, the lower Aldebaran Sandstone has been totally removed adjacent to the fault, resulting in about 250m of erosion. The amount of erosion decreases away from the fault to essentially zero at several kilometres away from the fault.
Bowen Basin 1995 - Symposium
30
0
1 km
S10
B70
-;:_ 2 ro
;;: 6 ;;:
B30
f-
3
26/A/57
Figure 3. Seismic line BSl-02 showing the geometry of the Burunga Fault, with the development of the Burunga Anticline above the thrust as a fault-propagation fold.
In the Taroom Trough, the event is represented by the significant time break between the Buffel and Oxtrack Formations. This event is important in eastern Australia as it marks the start of the development of the foreland thrust belt in the mid-Permian, and in the New England Orogen it is represented by a major mid-Permian deformational event, which was termed the Hunter-Bowen Orogeny by early workers (e.g. Carey & Browne, 1938). It is marked by a major angular unconformity between intensely deformed Early Permian and older rocks and weakly deformed to essentially subhorizontal Late Permian and younger rocks. The foreland thrust belt in the orogen was initiated at this time by a collisional event at the convergent plate margin farther to the east, and it was also the main time of major oroclinal bending in the New England Orogen (Korsch & Harrington, 1987).
EARLY TRIASSIC CONTRACTION A contractional event in the Early Triassic produced some deformation in the sediment pile prior to the deposition of the Clematis Group, resulting in a significant regional unconformity. Evidence for this event is best seen in the Denison Trough and on the western side of the Taroom Trough. The response of the rocks to this event has been different in the two areas. In the Denison Trough, earlier faults have been reactivated, resulting in inversion of the sedimentary succession. Uplift due to the inversion, and subsequent erosion, removed a few hundred metres of mainly Early Triassic Rewan Group. On the western margin of the Taroom Trough, broad regional uplift produced an unconformity with a very low angular relationship between the Rewan Group and the overlying Clematis Group
(see seismic section C83-T-04, in Totterdell & others, 1995, figure 4). Evidence for the event is also seen in the southern Taroom Trough where the Showgrounds Sandstone unconformably overlies the Rewan Group or Permian units. Here the hiatus was longer than in the north, and the lower Clematis Group was not deposited. Elliott (1993) considered that this contractional event was dominated by thrusting and that it was the most important deformational event within the basin system. He provided several figures of interpreted seismic sections to support his notion that all the faults active at this time extended up to, but stopped at, the base of the Clematis Group. Our interpretations, however, suggest that the fault tips stop at different stratigraphic levels in different seismic sections, and that much of the deformation thought by Elliott to be Early Triasssic is Middle-Late Triassic. Therefore, as discussed below, we consider that the Middle-Late Triassic contractional event was a magnitude greater in size than the Early Triassic one, and was more important in terms of the tectonic development of the region.
MIDDLE-LATE TRIASSIC CONTRACTION The Middle-Late Triassic contractional event deformed the youngest unit of the Bowen Basin, the Moolayember Formation, and older sediments prior to deposition of the Surat Basin succession. This event was complex and produced significantly different geometries in different parts of the basin. It was not a simple folding event as proposed by Elliott (1993). In the Denison Trough, the Early Permian extensional faults were again reactivated as thrusts. These faults propagated upwards into the younger
Bowen Basin 1995 - Symposium
31 0
1 km
26/IV55
Figure 4. Seismic line A82-LT-24 showing typical geometry of the Moonie Fault to the north of Moonie Oil Field.The predominant movement is on a low-angle thrust fault with a flat-ramp geometry. There is also a frontal (short cut) thrust and an out-of-sequence thrust, both with limited displacement. The section shows a typical fault-bend fold geometry. Major movement on this thrust occurred after deposition ceased in the Bowen Basin, but prior to commencement of deposition in the Surat Basin, that is, in Mid-Late Triassic time. The succession in the anticline above the thrust fault has been eroded so that the Surat succession sits directly on a basement of Tamworth Belt immediately east of the fault.
part of the Bowen Basin, with the shortening being accommodated by thrusting at depth, and by folding in the upper levels of the pile. This produced fault-propagation folds, with the amount of displacement on the thrust faults decreasing upwards (Figure 2). New thrusts and backthrusts also developed. As shown by seismic section AD91-03 (Figure 2), the amount of shortening on the fault decreases upwards, with the shortening being accommodated by the growth of the anticline above the fault. The total amount of shortening in the section remains the same, but at depth it is totally accommodated by thrusting, at the top of the section it is totally accommodated by folding, and in between it is accommodated by a combination of thrusting and folding. Also, significant compaction of rift fill leads to a thicker succession immediately above rift fill (B31-B40) compared with that deposited on the footwall above basement where there was no compaction. In this case, inversion has resulted in the B31 sequence boundary in the hanging wall being returned to the similar depth it occupies in the footwall. For comparison, in seismic section BMR78-02 (Totterdell & others, 1995, figure 3) B31 shows significant uplift in the hangingwall compared to the footwall. The eastern margin of the Bowen Basin has generally been regarded as a faulted margin, defined by the meridional Goondiwindi-Moo nieLeichhardt-Burung a fault system (Figure 1). The
northern segment, the Burunga Fault, is a west-dipping backthrust (Figure 3) associated with a basement duplex to the east (Totterdell & Korsch, 1992; Elliott, 1993). The Burunga Anticline, above the thrust, is a fault propagation fold, similar to that shown from the Denison Trough in Figure 2. The main difference is that the Burunga Fault appears to be a new fault that formed during the contractional event and not an earlier extensional fault that was reactivated. Timing of the thrusting is post deposition of the Moolayember Formation but prior to the deposition of the Precipice Sandstone of the Surat Basin, that is, Middle-Late Triassic. At its southern end, a displacement transfer zone separates the Burunga Fault, by en echelon overlap, from an east-dipping thrust, the Leichhardt Fault. Farther south, the Moonie Fault consists predominantly of a low-angle thrust fault with a flat-ramp geometry (Figure 4), showing a typical fault-bend fold style. The major movement on this thrust occurred after deposition ceased in the Bowen Basin, but prior to commencement of deposition in the Surat Basin, that is, in Middle-Late Triassic time. The succession in the anticline above the thrust fault has been eroded so that the Surat Basin succession sits directly on a basement of Tamworth Belt immediately southeast of the fault, but with a remnant of the Bowen Basin occurring farther to the southeast. Frontal or short
Bowen Basin 1995 - Symposium
32
w
83-M231
DENISON TROUGH
0
1 km
E
0--,----------------------- --------------------~
26/A/58
Figure 5. Seismic line 83-M231 from the central part of the Denison Trough, showing development of a fault-propagation fold in the Bowen Basin succession. Note the three main seismic packages defined by the different seismic reflection characteristics: 1, Basement, interpreted to be Drummond Basin, seen as well-defined reflections that lack extensive lateral continuity; 2, Permian rocks of the Bowen Basin, seen as strong, laterally continuous reflections (the very strong reflections at the top of the Permian are the Late Permian coal measures succession), and, 3, Triassic rocks of the Bowen Basin, represented by poorly to non-reflective units. Note also the classic angular unconformity between the Drummond and Bowen basins.
cut thrusts with limited displacement commonly occur. Thus, the present eastern margin of the Bowen Basin is an erosional remnant located to the east of the thrust faults. In the Blackwater area, away from the eastern margin, in the northernmost part of our study area, a series of low angle thrusts forming an imbricate fan complex have developed (Korsch & others, 1990). Here, the thrust front that initiated in the New England Orogen to the east has propagated a long way into the basin, a characteristic not seen elsewhere in the basin to the south. As mentioned above, there is some debate over the importance of the contractional events. During the development of fault-propagation folds, the fault tips propagate upwards through the sedimentary succession as the displacement increases. In three of the seismic sections illustrated (Figures 2, 3 and 5) the fault tips stop at different horizons within the succession even though the deformation occurred during the same contractional event. In line 83-M231, the fault tip is blind in the Late Permian near the base of the coal measures
(Figure 5), in line AD91-03 it is also blind at about the contact between the Late Permian coal measures and the Rewan Group (B70 horizon on Figure 2), and in line B81-02 (Figure 3) it appears to have reached the surface or was exposed by erosion prior to deposition of the Surat Basin. We consider that all of these folds were predominantly formed during the Middle-Late Triassic contractional event. Although Elliott (1993) stressed the importance of the Early Triassic event, we consider that there has been a magnitude more uplift in the Late Triassic, particularly along the eastern margin of the basin where, in places, there has been uplift and erosion of at least 4km of the stratigraphic succession. Harrington & Korsch (1985) speculated that the deformation was caused by the arrival, docking and suturing of the Gympie Terrane to the New England Orogen. At this time, however, deformation was widespread across Australia (e.g. Etheridge & O'Brien, 1994). This widespread deformation implies that a more global plate tectonic event is probably necessary. This is a time of active global tectonism, with accretion and collision of terranes in Asia, extension prior to
Bowen Basin 1995 - Symposium
33
sea-floor spreading in the Atlantic, and collision of Wrangellia with North America. There is also a very sharp bend in the North American apparent polar wander path at this time (the Jl cusp) indicating a major change in plate relationships at this time.
POST-EARLY CRETACEOUS CONTRACTIO N Following deposition of the Early Jurassic-Early Cretaceous Surat Basin, another contractional deformation reactivated many of the earlier structures in the Bowen Basin and in the basement. Renewed thrusting on these faults led to the propagation of some of the faults up into the Surat Basin succession (e.g. Figure 4) but, more commonly, the deformation in the Surat Basin was principally by folding and uplift of the Surat succession above a reactivated thrust fault at depth. This reactivation was important because many of the structures in the Triassic part of the Bowen Basin and in the Surat Basin that now reservoir oil or gas were formed by this event. The lack of deformation in the Eocene sediments (see below) constrains the age of the post-Surat deformation to being post-Albian to pre-Eocene. Apatite fission track dating by A. Raza (unpublished data) of samples from several wells in the eastern Bowen and Surat basins indicates that cooling occurred in the early Late Cretaceous due to erosion of overlying sediments. The erosion was induced by rapid uplift that we consider was associated with this contractional event. Eastern Australia was affected by extension in the Cretaceous during breakup and fragmentation of the Gondwana supercontinent. Continental extension commenced in the Early Cretaceous and culminated in the Late Cretaceous with the opening of the Tasman Sea (?96-55.5 Ma, Veevers & others, 1991) and the rifting of continental fragments such as New Zealand and New Caledonia from Australia. Within this extensional regime, a major contractional event occurred in the early Late Cretaceous, and is best seen in coastal Queensland and in the offshore part of the Maryborough Basin where it is strongest in intensity (e.g. Hill, 1991). We correlate this event with the post-Surat Basin contractional event.
EOCENE EXTENSION In the Eocene, a second significant period of extension, probably related to strike-slip faulting, formed the Duaringa Basin above rocks of the eastern Bowen Basin. This, and related Eocene basins farther to the east, contain significant oil shale deposits. Deep seismic profiling across the Duaringa Basin shows that it has an asymmetric geometry typical of half graben (Korsch & others, 1990).
A maximum of about 1300m of sediment was rapidly deposited during this extensional event. During the Eocene (at about 43 Ma) there was a major plate reorganisation, as documented in the northern Pacific Ocean by the change in direction of the Emporer seamount chain to the Hawaiian seamount chain. We consider that the extension to produce these oil shale basins was related to this plate reorganisation.
IMPORTANCE OF REACTIVATIO N OF OLDER STRUCTURES We have discussed several extensional and contractional events that have influenced the evolution of the Bowen basin. A common element in these deformational events is the reactivation of older fault structures, although new faults also formed during these events. In places it is possible to document that at least some of the structures were present in the basement prior to the initiation of the Bowen Basin. For example, seismic line 83-M231 from the central part of the Denison Trough (Figure 5), shows the development of a fault-propagation fold in the Bowen Basin succession. There is a classic angular unconformity between the Drummond and Bowen basins, indicating that the Drummond Basin had been extensively deformed prior to initiation of the Bowen Basin. The deformation of the Bowen Basin succession occurred during the Middle-Late Triassic contractional event. If the base of the Permian succession is restored to horizontal, then the ramp-flat geometry within the Drummond Basin is only partially removed, indicating that this geometry was present in the Drummond Basin prior to the deposition of the Bowen Basin. That is, the deformation of the Drummond Basin was related to this thrust fault, and occurred presumably during the Middle Carboniferous Kanimblan (Alice Springs) Orogeny. It is interesting to note that the fault was not reactivated during the Early Permian extension, but that it was mainly reactivated during the Middle-Late Triassic contraction, when the fault tip propagated upwards into, but remained blind within, the Permian succession. Reactivation of basement structures in the southwest part of the Bowen Basin, where the succession is relatively thin, has been important during the Late Cretaceous contraction because it produced the traps for oil and gas in the Triassic Showgrounds Sandstone as well as in the Jurassic Precipice Sandstone. There has also been significant reactivation of the extensional faults in Denison Trough, with inversion of the sedimentary succession. The reactivation during the Middle-Late Triassic contraction tended to occur on the north-south striking faults but not on faults striking south-east or south-southeast, implying that the movement direction during the inversion was towards the north-west or north-northwest. During
Bowen Basin 1995 - Symposium
34
TAROOM TROUGH
DENISON TROUGH
lnjune Creek Group
lnjune Creek Group 0
en
en
< cc
::, "")
S35 S30
Westgrove Ironstone Mbr ] S25 -------------------Evergreen Formation S20 Precipice Sandstone S10
[ Westgrove Ironstone Mbr ------------------Evergreen Formation Precipice Sandstone
B95 - - - - - - - - - - Moolayember Fm
- - - - - - - - - Moolayember Fm 0
en en
:! cc
Hutton Sandstone
Hutton Sandstone
B90
- - ------- --------Showgrounds Sandstone B85 - - - - - - - - - - - - Clematis Gp
Clematis Group
B80
t-
Rewan Group Bandanna Formation
----- -- . ----------
B?s-- - - - - - - - - - - - Rewan Group
B70
Baralaba Coal Measures
B65
:i
Black Alley Shale Burunga Formation :E B61 - - - - - - - - - - - . - - - --? B60 - - - - - - - - - - - - - - - - - cc Peawaddy Formation Scotia Member
~B~ - - - - - - - - - - - - - - - - - ? ~ 5 - - - - - - - - - - - - - - - - --
w
t-
lngelara Formation
- - - - - -- - - - - -- -
5 B~ - - - -Freitag Formation ------------- ? Aldebaran
-B45 - - - - - - - - - - - - - - - - - ?
•
?
Banana Formation Flat Top Formation Barfield Formation ? --- -- ---------- --Oxtrack Formation
?
, . , . , . , . , , ., u L , u u u . , c , u u ~ u , , u ~ u w u ~ L , u u , ~ u , , . , . , . ,
Sandstone z B40-- - - - -- - - - - - - - ? :!!; Cattle Creek Formation Buttel Formation :E B31 - - - - - - - - - - - - - - - - - ? B30 - - - - - - - - - - - - - - - - - ffi Reids Dome Camboon Volcanics a.. B25- - - - - - - - - - - - - - - - > beds ..J B15 . n n n n ,, n n n n , , n n , u u , , . , . , u u , , . n n , " ' , . , . , " " ' , . , .
cc < w
basement
- -- -- Maximum flooding surface - - - - Sequence boundary Other boundary ('f'Y'('f'l Major unconformity Correlation between columns uncertain ?
11/0/68
Figure 6. Sequence boundaries (e.g. B30) and stratigraphy in the Denison Trough and Taroom Trough, Bowen and Surat basins, Queensland (after Totterdell & others, 1995).
the inversion, growth of the anticlinal structures produced the traps that now house the commercial gas fields of the Denison Trough.
CONCLUSION The Bowen Basin in eastern Australia developed in a backarc tectonic setting behind an active convergent plate margin. A series of intraplate
deformational events in the basin can be related to similar events in the New England Orogen and were probably due to plate interactions, including the accretion of terranes, at the ancient active plate margin. The basin was initiated by an extensional event in the Early Permian, which was followed by several contractional events, and finally another, minor, extensional event in the Eocene. The reactivation of earlier structures played a very
Bowen Basin 1995 - Symposium
35
important role in the structural development of the Bowen Basin during the extensional and contractional events.
ACKNOWLEDGEMENTS We wish to thank other members of the NGMA project from both AGSO and GSQ for their useful discussions during the project. We thank B.J. Drummond and K.D. Wake-Oyster for reviewing the manuscript and the Cartographic Services Unit, AGSO, for drafting the figures.
REFERENCES BAMBERRY, W.J ., CLARK, N.R. & SINELNIKOV, A.V., 1995: Basement morphology and structure - Surat Basin in New South Wales. In Advances in the Study of the Sydney Basin, Proceedings of the Twenty Ninth Newcastle, University of Newcastle, Department of Geology, Publication, 657, 253-260.
CAREY, S.W. & BROWNE, W.R., 1938: Review of the Carboniferous stratigraphy, tectonics and palaeogeography of New South Wales and Queensland. Journal and Proceedings of the Linnean Society of New South Wales, 71, 591-614. ELLIOTT, L.G., 1993: Post-Carboniferous tectonic evolution of eastern Australia. The APEA Journal, 33, 215-236. ETHERIDGE, M.A. & O'BRIEN, G.W., 1994: Structural and tectonic evolution of the Western Australian marginal basin system. PESA Journal, 22, 45-63.
KORSCH, R.J.,. WAKE-OYSTER, K.D. & JOHNSTONE, D.W., 1990: Deep seismic profiling across the Bowen Basin. In BEESTON, J.W. (Compiler) : Bowen Basin Symposium 1990 Proceedings. Geological Society of Australia (Queensland Division), 10-14.
KORSCH, R.J., WAKE-OYSTER, K.D. & JOHNSTONE, D.W., 1993: The Gunnedah Basin-New England Orogen deep seismic reflection profile: implications for New England tectonics. In Flood, P.G. & Aitchison, J.A. (Editors): New England Orogen, eastern Australia, University of New England, Armidale, 85-100. KRASSA Y, A.A., KORSCH, R.J. & DRUMMOND, B.J., in preparation: The Meandarra Gravity Ridge: Symmetry of the gravity anomaly and its relationship to the Bowen-Gunnedah-Sydney basin system. Australian Geological Survey Organisation. LEITCH, E.C., 1988: The Barnard Basin and the early Permian development of the southern part of the New England Fold Belt. In Kleeman, J.D. (Editor): New England Oro$en - tectonics and metallogenesis, University of New England, Armidale, 134-140.
LONSDALE, G.F., 1965: Southern Queensland contract reconnaissance gravity survey using helicopters, 1964. Australian Bureau of Mineral Resources, Record, 1965/251 .
MURRAY, C.G., 1990: Tectonic evolution and metallogenesis of the Bowen Basin. In Beeston, J.W. (Compiler) : Bowen Basin Symposium 1990 Proceedings . Geological Society of Australia (Queensland Division),
201-212. QURESHI, I.R., 1984: Wollondilly-Blue Mountains Gravity Gradient and its bearing on the ori~in of the Sydney Basin. Australian Journa[ of Earth Sciences, 31, 293-302.
FERGUSSON, C.L., 1991: Thin-skinned thrusting in the northern New England Orogen, central Queensland, Australia. Tectonics, 10, 797-806.
SCHLISCHE, R.W ., 1991 : Half-graben basin filling models: new constraints on continental extensional basin development. Basin Research, 3, 123-141.
HAMMOND, R.L., 1988: The geological structure of the Bowen Basin. In Mallett, C.W., Hammond, R.L., Leach, J.H.J ., Enever, J.R. & Mengel,D.C. (Editors) : Bowen Basin - stress, structure and mining conditions: assessment for mine planning. CSIRO Division of Geomechanics, NERDDC Project No. 901, Final Report, 10-43.
SCOTT, D.L., BRAUN, J. & ETHERIDGE, M.A., 1994: Dip analysis as a tool for estimating regional kinematics in extensional terranes. Journal of Structural Geology, 16, 393-401.
HARRINGTON, H .J. & KORSCH, R.J., 1985: Deformation associated with the accretion of the Gym pie terrane in eastern Australia. Geological Society of Australia, Abstracts, 14, 104-108. HILL, P.J., 1991: Maryborough and Capricorn Basins new geophysical data. In Muir, W.F. (Editor), Queensland 1990 Exploration and Development. 12th Annual PESA(Qld) - ODCAA - SPE Petroleum Symposium, Brisbane, 70-82.
KORSCH, R.J . & HARRINGTON, H .J., 1987: Oroclinal bending, fragmentation and deformation of terranes in the New England orogen, eastern Australia. American Geophysical Union, Geodynamics Series, 19, 129-139.
TOTTERDELL, J.M. & KORSCH, R.J., 1992: Structural configuration and tectonic development of the Bowen and Surat basins in the Taroom region . Australian Bureau of Mineral Resources, Record, 1991/102, 35-52. TOTTERDELL, J.M., BRAKEL, A.T., WELLS, A.T. & HOFFMANN, K.L., 1995: Basin phases and sequence stratigraphy of the Bowen Basin, Queensland. This volume.
VEEVERS, J.J., POWELL C.McA. & ROOTS, S.R., 1991: Review of seafloor spreading around Australia. I. Synthesis of the patterns of spreading. Australian Journal of Earth Sciences, 38, 373-389. WILLETT, S., BEAUMONT, C. & FULLSACK, P., 1993: Mechanical model for the tectonics of doubly vergent compressional orogens. Geology, 21, 371-374.
Bowen Basin 1995 - Symposium
36
Bowen Basin 1995 - Symposium
37
Geoloxv of the Nebo West Anthracite
Depostr-
KW O'Reilly, R Buzacott & GW Quinn BHP Australia Coal Pty Ltd.
The Nebo West anthracite deposit, the only potentially economic anthracite deposit so far discovered in Australia (Callc-ott, 1990) has been explored by BHP Mitsui Coal Pty Ltd over the past seven years under Exploration Permits 446C and 532C. Potentially economic resources of coal occur within the late Permian Moranbah Coal Measures, which are strongly folded and characterised by steep dips and multiple subcrops.
part of the EPC. The term of the EPC was extended for two years in 1991 and again in 1993. Results from the 1988-90 phase of exploration indicated that the target MCM extended outside the existing EPC into the area between the Kemmis-Walker Creek Mining Lease to the west and the Bee Creek Mining Lease to the north; apparently in an anticlinal structure, plunging towards the north-west.
The main seams at Nebo West have been tentatively correlated with the major economic seams from the western side of the Bowen Basin on the basis of their stratigraphic location relative to the P Tuff and their geophysical signatures.
BHPM commissioned a photo-interpretation over that area, which supported the structural analysis and then applied for an additional area known as Nebo West Extended which encompassed the inferred extension of anthracite resources. The area was granted as EPC 532 in March, 1993.
INTRODUCTION
EXPLORATION
Coal of anthracite rank is described in the Australian Standard as having 8% or less volatile matter (d.a.f.) or a mean maximum reflectance of vitrinite measured in oil of 2.5% or more. International standards are in general agreement with these criteria.
The first record of anthracite at Nebo West is attributed to Colton (1970) who reported the occurrence of thick,clean coal seams of anthracite rank whilst exploring for coking coal on behalf of Thiess Peabody Mitsui Pty Ltd (now BHPM). The seams were steeply dipping (45 °) and non-coking.
Coals of anthracite rank are rare in Australia at strippable depths but it was shown by Beeston (1981) that anthracite could be expected to occur within the Moranbah Coal Measures (MCM) on the eastern limb of the northern Bowen Basin south of the Nebo-Glenden road (Figure 1).
When EPC 446 was granted to BHPM in 1988, initial exploration commenced on the sites of known anthracite occurrence and subsequently extended to the north and south.
In mid 1987 the Exploration Group of BHP Mitsui Coal Pty Ltd (BHPM) was advised that a niche existed in the export market for 0.5-lMt per annum of lump anthracite. As a result, BHPM revived interest in the MCM on the eastern flank of the Bowen Basin north of the Peak Downs Highway, where thick, low ash seams of anthracite had been identified in 1970 during regional exploration for coking coal. The area had previously been relinquished by BHPM in 1977 because the steep dips, high rank, extensive surface basalts and major faulting rendered it unattractive at that time for existing or foreseeable export markets. Exploration Permit 446 (Nebo West) is located approximately 120km south-west of Mackay (Figure 1) and was granted to BHPM for a term of three years in 1988. The area was partly explored by drilling in 1988 and resources of anthracite were proven by concentrated drilling in the southern
Following initial reconnaissance drilling along six widely spaced traverses over a 40km strike length from the Peak Downs Highway in the south to Mt Robert in the north, exploration was 2 concentrated in a highly prospective 10km area located between 6.5 and 13.5km north of the Peak Downs Highway (Figure 2). This programme defined Measured and Indicated Resources of 38Mt to 70m depth and indicated the potential for large additional resources in folded strata to the west of the defined resources. It also showed that the strike of the folded strata swung north-west outside the western boundary of the EPC. This phase of exploration continued until mid 1990. Subsequently, semi-anthracite resources north of the Nebo-Glenden road were relinquished and following the grant of EPC 532 in 1993, significant exploration was carried out in EPC 532 and EPC 446, initially to determine the areal extent of
Bowen Basin 1995 - Symposium
38 w
✓----
EPC 446 NEBO WEST ML 4751 '~EE CREE
.. ..........._
__
I )
\ A
(
0_
100 __ J kms
0
2
4
6
8
Kilometres
6BHP NW01004.CDR
Figure 1.
Bowen Basin 1995 - S ympos1um •
39
============--- -==--V V
V
V
//
V // V
II
//
V
V
0
2
3 Kms
V
V V
Basalt
759500JmN
Acidic lntrusives Reserves under present Mine Plan
A BLOCK V
V
V V
V V V V
V V V V
V
V
V V
V V
S BLOCK V V V V
V
V
V V V V
75850Cl0mN V V V V
V V
6BHP
EAK D
AY y HIGHWA 5 · V NW14001 .CDR
Figure 2. • 1995 _ Symposium Bowen Basin
40
shallow anthracite resources; and subsequently to evaluate the size of the resource. Drilling Traverse spacing over the main resource blocks is now 1km. Hole spacing along the traverses is 100m or less (Figure 3). Resource areas have been divided into blocks. The main blocks of economic significance are termed Tootoolah, Alameda, Walker Creek and Strathfield.
STRATIGRAPHY The Nebo West deposit occurs on the eastern limb of the Bowen Basin within the Moran bah Coal Measures (MCM), the lowermost formation of the Blackwater group in the Taroom Trough (Figure 4). The MCM formation is conformably overlain by the Fort Cooper Coal Measures (FCCM) formation which contains many thick, poor quality, tuff-banded coal seams. The MCM formation conformably overlies the predominantly marine Exmoor Formation (Kappe, 1974) a transitional marine facies containing thin, relatively high sulphur coal seams. In the area under discussion, the thickness of the MCM is not accurately known due to the generally complex structure. However, the formation is considerably thicker than in the type section near Moranbah (259m). A stratigraphic interval of 400-650m has been intersected, with the top of the formation placed at the base of T95, the lowest tuff-banded seam in the FCCM. The lower boundary is herein considered to be the top of the uppermost high sulphur seam, T30, below which the sediments change from typically lithic terrestrial, to quartzose, bioturbated, micaceous, transitional-marine facies. The sediments of the MCM comprise light grey, lithofeldspathic sandstones, grey and dark grey siltstones and mudstones and numerous coal seams (Figure 5). Two brown tuffs are used locally as marker beds. One of these occurs about 50m above the most prospective seam, TSO, and has a distinctive character on natural gamma logs. The other occurs below seam T85, contains euhedral bronze micas and is visually identical to the "P Tuff" of the western Bowen Basin. As a consequence, seams at Nebo West can now be tentatively correlated with seams in the Goonyella - Peak Downs area.
STRUCTURE Regional strike is north-north-west within EPC 446 and regional dip is to the west-south-west, although folds of varying amplitude and with axes parallel to strike, result in frequent dip reversals (Figure 6). The strata extend into EPC 532 in a multiple folded, antiformal structure plunging gently north-north-west. As a result, significant surface expression of the MCM is unlikely north of the Strathfield block. The easternmost north-west to
south-east trending structural domain boundary proposed by Snodin (1991), appears to truncate the zcme of folding in the coal measures. To the north and east of this boundary, the strata form a simple monocline, dipping to the west at 40-45°. Within the zone of folding, deformation is greatest in stratigraphic intervals where the seams are thicker and the sediments are finer grained, suggesting that these less competent strata took up most of the strain during deformation. Limited drilling in the more competent Exmoor Formation indicates only gentle, low amplitude folding, whilst the finer grained, coal rich sequence between seams T40 and T90 is strongly folded. The folded structure, allied with the present er.osional surface, has resulted in up to seven subcrops of the major seams. Significant faulting has not beef\ encountered but large faults are inferred from air-photo lineament interpretation. Repetition of seams in several drill holes has confirmed the presence of small to medium displacement, thrust faults.
IGNEOUS ACTIVITY Igneous intrusive bodies form the major topographic highs throughout Nebo West. Mt Fort Cooper and Mt Travers, in the centre of the area are Tertiary plugs of basic composition. The Peak and the "Bee Creek Intrusions" respectively located at the extreme northern and southern ends of Nebo West, are Cretaceous acid intrusives. The "Bee Creek Intrusions" have been interpreted as a large folded sill (Snodin, 1991). At least three coal seams have been intruded over significant area by acid sills similar in composition and texture to the "Bee Creek Intrusions". Tertiary basalt cover is widespread over the monoclinal part of EPC 446 in the area between the Peak and Mt Fort Cooper. Although surface basalt is widespread in the south-east, it is generally located east of the prospective coal resources. Seventeen significant coal seams, from l.5-7m true thickness, occur in the Exmoor Formation and in the MCM at Nebo West; several of which are splits of thicker seams. Because of the complex geology and the large area to be investigated, only the most economically attractive seams have been tested in any detail. Correlation of some minor seams remains uncertain due to the separation of drill traverses, variable dips, seam splitting and uncertain structure. Seam correlation is generally based on location relative to the P Tuff or TSO as well as geophysical signature. Seams have been temporarily named from T0S to T99 in ascending stratigraphic order, in steps of ten; allowing for further seams or seam splits to be inserted between known seams as they are identified during exploration. Once the stratigraphy has been clarified, seams will be named on a more formal basis.
Bowen Basin 1995 - Symposium
.-------------------r-------------------41
NEBO WEST EXTENDED
.
--
NEBO WEST
59800W
----~······
0 560E.
...... ....
~-....... . .,
.'
.,,-r-
•
._,. MTTRAVERS (\
i70
-
sooo
... . .
.,·
.
...... ....
.,.
..
..-
,r11• • •
\
LEGEND _,... •
Existing Drilling
--
Proposed Future Drilling
_,
_,,,,,. Target Resource Area
.BHP NW13005.CDR
Figure 3. Bowen Basin 1995 - Symposium
42
.BHP REFERENCE Onlap contact between major tectonic units Faulted contact between major tectonic units Boundary between structural subdivisions within the Bowen Basin SURAT BASIN: Jurassic-Cretaceous overlies Bowen Basin
~
FOLD
)),
BOWEN BASIN EASTERN AREA: Taroom rzzl trough BOWEN BASIN AREA: Collinsville D:J Shelf and CometCENTRAL Shelf BOWEN BASIN WESTERN AREA: Springsure E3 Shelf and Denison Trough
0
50
100
150
Kilometres
SURAT
BASIN WESTERN AREA l:=---cENTRAL AREA --""----EASTERN AREA~ - - - - Clermont Stable Block Taroom Trough Deniso~ Comet-.i-Collinsville Nebo --1,.--Mimosa Trough • Ridge I Shelf Synctinorium I Syncline
_JU _R _A _S_S_IC_
Precirm
~rr
T ••
TRIASSIC Rewan Bandanna Fm :
Rangal Coal Measures
PERMIAN Catherine Sst Crocker Fm
>-----Carnangarra Fm , MacMillan Fm Moranbah C an Creek Formation
Barfield Formation
Source: Modttied from Beeston, 1986
NEW ENGLAND FOLD BELT
O
10
20 Kms
GENERALISED CROSS-SECTION
Old Dept of Minerals and Energy,1988 Bowen Basin Solid Geology
NW19007.CDR
Figure 4.
Bowen Basin 1995 - Symposium
- - - - - - - 7 3 Southern Boundary of EPC Orn
Homevale Mt Travers The Peak
100m
FORT COOPER C.M.
Alameda
200m
300m
MORANBAH COAL MEASURES
. • .... .. .- .-.:.·.
400m
·-
·.·.·.·.~·
500m
. .. .-.·....
600m
700m
-:-·.·.·.·.·
___.__ _ ? Marine
·.·.·~.·- ·
"· EXMOOR FM
LEGEND
aoom
~ Coal
Marine
t=. •.-3 Siltstone t=. •.-3 Carbonaceous Siltstone tt ~ zj Tuffaceous Shale 900m
1:-:-:-:-:-:1 Sandstone 1:-~:-~::I Conglomerate ~ Intrusive
.BHP NW23001 .CDR
Figure 5.
Bowen Basin 1995 - Symposium
44
V
TFORT COOPER V V V \ VVV\
:-1.<...v V \ \, V S
yv,
/,/ V \
/v V ' vvv V V '
LEGEND
I
Basalt Acidic lntrusives
L - ------.---
_/
I
~ Moranbah Coal Measures
CJ Quaternary TSO Seam Subcrop T90 Seam Subcrop
~
PEAK DOWNS HIGHWAY ~
~ --
0
5 Kilometres
NW14002.CI
Figure 6. Bowen Basin 1 995 - Sym P osium
45
Seams TOS, T10 and T30 occur within the marine influenced Exmoor Formation. Although they comprise clean, bright coal and are relatively flat lying, they are thin, high in sulfur and phosphorus and have limited commercial potential at present.
temperatures and very low concentration s of trace elements by world standards. It is composed mainly of vitrinite (75%) with subordinate semi-fusinite (15%). Mean maximum reflectance of vitrinite averages 3.2%.
Seam T4O is a clean 2-2.Sm thick seam of bright coal with minor shale banding and occurs near the boundary of the MCM and Exmoor Formation. Although it contains marginally higher sulfur and phosphorus than overlying seams it is clearly terrestrial in nature. For this reason it has been nominated as the basal seam of the MCM . T40 is too thin to have significant economic potential.
CONCLUS ION
The economic MCM seams occur within the interval from Seam TSO to T90. The most important (commercially and/ or stratigraphica lly) seams within this sequence are described below. Seam TSO comprises 6m of predominantl y bright coal. One dark grey mudstone band, up to 10cm thick, occurs within the upper metre of the seam and two other (6-8cm thick) mudstone bands occur in the bottom half of the seam. TSO is the main exploration target because of its thickness, lateral continuity, low inherent ash and high yield. It occurs below the seam tentatively correlated with the Goonyella Lower seam and, hence, has no named correlative on the western side of the basin. Seam T63 is 3-6m thick and contains three distil}ct coal plies separated by two 0.l-0.4m thick, brown mudstone beds. The coal has high inherent ash and the middle ply is heavily stone-banded. The seam has only minor economic potential but has been tentatively correlated with the Goonyella Lower seam on the basis of its stratigraphic position in relation to the P Tuff and its similar geophysical signature. Seam TSO is a 4m thick seam of clean, bright coal and has been tentatively correlated with the Goonyella Middle seam. Seam T84 and T85 occur in close association with the P Tuff. They have limited economic potential but are considered correlatives of the P seams on the western side of the basin. Seam T9O comprises 3-4m of clean, bright coal of similar quality to TSO. It is tentatively correlated with the Goonyella Upper /Q seam on the western side of the basin.
COAL QUALITY Typical product coal from Nebo West could be expected to have 6% or 12% ash, 6.5-7% volatile matter, 1.65% Nitrogen (daf), 0.6-0.7% sulphur, 0.05% phosphorus, S.E (daf) of 7800Kcal/kg (6% ash) or 7250Kcal/kg (12% ash), high ash fusion
The Nebo West anthracite deposit has been extensively evaluated over the past seven years. Exploration over the past two years has concentrated on defining resources in a strongly deformed sequence of MCM strata located between two structural lineaments interpreted from airphotos. The deformation has resulted in a series of asymmetric anticlines and synclines displaying steeply dipping eastern limbs and flatter (though still steep by normal Bowen Basin standards) western limbs. The fold axes strike north-north-w est and are gently undulating. Potentially economic coal seams occur within the MCM. The most prospective seams have been tentatively correlated with the major economic seams from the western side of the Bowen Basin on the basis of their stratigraphic location relative to the P Tuff (which has been positively identified at Nebo West) and their geophysical signatures. A comprehensiv e report on the geology, coal quality and resources of the Nebo West deposit, recently completed by BHPAC's Exploration Section, is currently being evaluated by the Development Section. If the results of the preliminary feasibility study are positive, a final phase of exploration is planned for late 1995 / early 1996 to raise resources to Measured status; after which it is planned to apply for a Mineral Development Licence over all economic resources. Nebo West may ultimately be developed as a satellite deposit sharing infrastructure with the adjacent South Walker Creek semi-anthraci te deposit which has the same ~wnership.
REFERENCES BEESTON, J. W., 1981 : Coal Rank Variation in the Bowen Basin. Geological Survey of Queensland, Record, 1981/85. CALCOTI, T.G., 1989: Anthracites and West Nebo Coal. Queensland Government Mining Journal, 91, 409-415. COLTON, H., 1970: Fairhill Reconnaissance - Nebo Area. TPM Coal Pty Ltd Internal Report. KOPPE, W.H., 1974: The Exmoor Formation - an addition to the stratigraphic nomenclature in the Northern Bowen Basin. Queensland Government Mining Journal , 75, 280- 285. SNODIN, S., 1991 : Photogeologica l Study of the Bee Creek - Kemmis Creek Area, West of Nebo, Queensland. Internal report to BHP Australia Coal Pty Ltd by Australian Photogeologica l Consultants.
Bowen Basin 1995 - Symposium
46
Bowen Basin 1995 - Symposiu m
47
E::rploration for the Newlands Underground
Mine
2
Terry Francis 1, Ross Seedsman & Kerry Whitb/ 1. MIM Holdings Limited 2. Coffey Partners International Ltd 3. McElroy Bryan Geological Services Pty Ltd
INTRODUCTION The Newlands Coal Pty Ltd open cut coal mining operations are located approximately 200km by road west of Mackay, in Central Queensland (Figure 1). The operation currently produces 4.SMt of washed steaming coal annually for export markets from a single seam, the Upper Newlands Seam (UNS) in the Rangal Coal Measures. The Newlands Mine began in 1983 in low strip ratio coal in the Main Pit and has since progressed downdip to an average overburden depth of approximately 55m. Currently, mining operations at Newlands are concentrated in the Newlands Main Deposit and Eastern Creek South, a small satellite deposit approximately 14km east of the Main Deposit. Two major issues are critical to Newlands current operations: •
•
increasing depth of overburden and limited overburden (prestrip - truck and shovel) removal capacity, and coal quality, particularly its impact on yield.
Both issues impact the operational costs and future strategies of the mine. The longer term future of Newlands is dependent on the viability of an underground mine downdip in the main deposit. Feasibility plans for a longwall mine at Newlands date back to 1986. The initial concept was to mine the bottom 4.Sm of the seam and leave a coal roof. In 1988 through to mid 1990 Newlands hosted the NERDDC Thick Seam Mining Research Project entitled "Single Pass Longwall Mining of Thick Seams". During this two and a half years, the Queensland Coal Association's (QCA) Thick Seam Committee concluded that such a venture was technically possible and would more than likely succeed. In 1992 MIM/Newlands management determined that a longwall mine, with at least 3Mt run of mine production was required from 1998 to supplement declining open cut production. In mid 1992 the first of four exploration programs commenced and the last program was completed during 1994. A detailed surface exploration program, supported by underground exploration using a continuous miner was needed to sufficiently improve the confidence
in the underground reserves being amenable to longwall mining before a decision could be made to proceed. The 1992-94 exploration work, along with market economics, concluded that a longwall extracting a working section of between 3 and 3.Sm was possible. The 3.Sm working section decision was predominantly driven by coal quality considerations. During 1994 preparations were made to invite tenders for the underground exploration driveage. Six companies bid for the work with Thiess Contractors being awarded the job. This paper discusses the exploration programs and how the geological and geotechnical issues have been incorporated into the mine plan.
EXPLORATION Exploration History
Exploration commenced in 1969 with Griffin Queensland NL drilling in both the open cut and underground areas at Newlands. In 1977 MIM Holdings Limited acquired the lease from Griffin and subsequently began exploration drilling to define the open cut mine. Newlands Coal Pty Ltd was formed in 1979 and up until 1989 most drilling was confined to the open cut mine area, although some drilling was undertaken further to the east in the deeper coal resources. In 1989, as part of the NERDDC funded study, a small number of holes was drilled and added to the database. This exploration was managed by ACIRL as a contractor for the QCAs Thick Seam Committee. Exploration drilling supervised by Newlands geologists continued on a regular basis concentrating on open cut operations although some drilling in the deeper underground areas was also carried out. In 1992 McElroy Bryan Geological Services (MBGS) was commissioned to review the geology of the Newlands deposit and make recommendations regarding future exploration requirements particularly in relation to the feasibility of establishing an underground mining operation at Newlands. A four stage program of exploration which extended until December 1994, was initiated
Bowen Basin 1995 - Symposium
48
MAP AREA
q t - - - ----"'-
" ' ' " ' ~L,_ _
BRISBANE
SYDNEY
MELBOURNE• ~HOBART
21°00'
\ ·,.':fay Point/Dalrymple Bay '_:_..._.
-----
W
0
100 k /1 o metres
-----1W
RIVERSI GOONYE
22°00 '
EAST
23°00' RDONSTONE INIAH
Blackwater lEICHHARDT 'i' BLACKWATER
•
SOUTH llACKWATER
I
'i' COOK
.
U) 0
ROllESTON
... 'f , 'i' ' 'ii
~
Open cut mine: operating & non-operating: prospect u_nder investigation Underground mine: operating & non-operating: prospect under investigation Export port
/NEWlANDSJ
NCA Project Leases
!SUTTOR CREEK!
MIM Leases
Rgure 1
NEWLANOS COAL PTY LTD LOCALITY MAP EASTERN CREEK SOUTH
Prepared by McElroy Bryan Geological Services Ply Ltd
Figure 1. Locality map Eastern Creek South.
Bowen Basin 1995 - Symposium
March, 1993
49
and was supervised throughout by MBGS geologists on behalf of Newlands Coal. Recent Underground Exploration
The Stage 1 exploration program (1992) acquired geological, geotechnical and coal quality data to broadly characterise two potential underground mine areas (northern and southern) at Newlands. A total of 42 holes were completed, comprising 3 fully cored holes, 33 partially diamond cored holes (roof, seam and floor core) on 1km centres and 6 non-core holes. A high resolution ground magnetics survey was conducted by the Geophysical Research Institute to investigate the likelihood of dykes intruding the underground areas. Drilling in Stage 1 aggregated 8490m of which 1392m were cored. Stage 2 exploration (1993) involved a core and non core drilling programme within the southern underground area and was designed to enhance the level of knowledge in retation to: •
location of the proposed mine entries
•
coal quality of the UNS
•
major geological structures likely to influence mine design and development
•
geotechnical conditions of the UNS and its immediate roof and floor strata
•
seam gas content in the UNS and Lower Newlands seam (LNS) and in the overlying Newlands Rider seams (NRl and NR2).
Drilling comprised 70 non-core holes and 45 partially cored holes aggregating 18 415m of which 1083m was cored. At the conclusion of Stage 2, core hole spacing was 500m over the majority of the area. At the completion of the Stage 3 program, a geological review and comprehensive study of the underground geological database, comprising more than 500 holes, was undertaken. Several structural anomalies were still unable to be resolved conclusively without further drilling. Stage 4 exploration (1994) was initiated to investigate the outstanding structural anomalies and to delineate the Powerline Thrust Fault system, currently the eastern limit of underground mine planning. Stage 4 drilling comprised 65 non-core holes, aggregating 11 491m. Geological down hole data collected by MBGS was input into the geological data software PRO-LOG which interfaced with the VULCAN software at Newlands. Through each of the four stages of underground exploration, all holes were geophysically logged by BPB Instruments (Australia) Pty Ltd. The log suite generally included gamma, caliper, long and short spaced density, multi channel sonic and neutron.
Geotechnical Data Acquisition and Compilation
A comprehensive geotechnical logging and geomechanical testing program was carried out during all phases of core drilling and over 280 core samples of roof, coal and floor strata were subjected to laboratory testing including uniaxial compressive strength, Young's modulus and Poisson's ratio. Tests performed in the field included point load testing of each sedimentological/ geotechnical unit, slaking and clay dispersion testing of immediate floor strata and in-seam stone bands, airlift groundwater flow measurements, groundwater analyses and seam gas desorption. Integration of lithological, geotechnical, geophysical and geomechanical test data led to the establishment of geotechnical models of roof and floor strata in each proposed underground mine area. UNS overburden stratigraphy and the thickness of individual geotechnical units varied considerably in the northern underground area due largely to the location of the Newlands Rider 1 and 2 seam splits in relation to the UNS. Nine distinct roof types (Type A to H) have been identified in the northern underground area compared with only three roof types (Type A to C) in the southern area, where the interval between the UNS and the two rider seams tends to be relatively consistent. In both cases coal forms the immediate UNS working section roof. The UNS floor in the southern underground area ranged from weak claystone (<10 MPa) to moderately strong siltstone (>30 MPa). In the northern underground area, the floor material is similar, although the weaker claystone floor which occurs in the southern area, is not present in the northern area. Stress relaxation tests of selected UNS overburden strata were undertaken by the CSIRO during the Stage 3 program. These tests enabled the drill core to be oriented on the basis-of remnant palaeomagnetism, then the change in cross sectional shape of the drill core in response to stress release was measured, using a laser micrometer. Results indicated a north-south oriented principal stress direction at depths less than 150m, similar to that obtained earlier by hydraulic fracturing. Structural Model
Regional structural features in the vicinity of the Newlands mine appear to be influenced primarily by post-Permian regional thrusting from the north-east. The major structural feature in the area is the Burton Range Fault Zone which strikes approximately north-north-west with a vertical displacement of several hundred metres. Structural features in the Newlands area include: monoclinal folds; trending north-west and locally increasing the UNS dip up to 11 • broad anticlinal and synclinal folds, trending west north-west.
Bowen Basin 1995 - Symposium
50
normal faults; trending north-east and generally downthrown to the north with seam displacement generally in the order of 6m, although in some cases up to 20m. Normal faults may have a linear extent of several kilometres. •
thrust faults; trending north-north-west and overthrust to the south-west with seam displacement generally in the order of 20m. The thrust fault zones can be up to 5km along strike (Figure 2).
MINING CONSTRAINTS AND GENERAL DESIGN ASPECTS Preferred Working Section The UNS working section which satisfied the requirements of coal quality, working section height and suitable roof and floor conditions varies throughout the potential underground area. In the southern underground area two working sections are likely. Working Section 1 (plies UNS A+B+C+D) is approximately 3.Sm thick and occurs throughout most of the area and includes the tuffaceous claystone band, ply UNSD at the top of the section. It is considered unlikely that the band would remain attached to the roof during mining. Working Section 2 (plies A+B) which has a thickness of approximately 3m is preferred in the south and east of the southern underground area and excludes ply UNSC because its ash content generally exceeds 20%. (Figure 3). In the northern area, the basal UNSA and UNSB plies constitute the preferred working section which is generally about 3m thick. Structure An en echelon thrust fault zone comprising the Diversion Channel, Power Line, Bottle Tree and Turkey Nest faults form the eastern limit to the proposed initial mining block in the southern underground area. In the Ramp 2 area adjacent to the highwall, the Southern Gate, Ramp 2 and 3D Seismic Faults will influence mine entry design. In the south, the Ironbark Fault will probably limit mining, and in the south-east, the Blackbutt Fault may influence mining although drilling has not been able to confirm its orientation. In the north the Ramp 3 Fault may form the limit to mining. A number of other faults (Highwall Dam, Cerito Creek, 3D Seismic) has been identified within the proposed mine area. Drillhole spacing of 250m at Newlands was sufficient to identify faults with seam displacements significant enough to disrupt mining, however, a high probability exists where faults with displacements of <2m will be found during mining.
Two monoclinal zones trending north-north-west are located within the proposed mine area and the UNS dips up to 11 • within these zones. Roof conditions may deteriorate in the vicinity of the monoclinal axis. In the northern part of the proposed mine area, broad low amplitude folding with the north-west trending axes is not considered likely to adversely affect potential mining operations providing there is an awareness of the synclinal axis location when planning underground water management and drainage. Coal Quality West of the Power Line Thrust Fault Zone raw coal ash in Working Section 1 ranges from 13.3% to 17.6% (average 15.8%) and in Working Section 2, from 14.5% to 24.9% (average 18.5%). Coal Washability Simulated plant recovery studies on slim core working sections indicate clean coal ash generally increases towards the east across the deposit, ranging from 11.6% up to 16.6%. Yield results may vary from 83% to 93%. Seam Gas At depths >200m, the total desor~able gas content in the UNS generally exceeds Sm /tonne. The gas is predominantly methane (>95%) with small amounts of carbon dioxide. Geological structures such as faults can be related to local accumulations of seam gas under relatively high pressure. Spontaneous Combustion Samples of likely roof coal above the probable UNS working section were tested using the Relative Ignition Temperature test method. Results indicate a low to moderate propensity for spontaneous combustion. Igneous Activity No igneous intrusions within the UNS were identified during the exploration programme. Groundwater Permian aquifers with water flow rates up to 31/s were encountered in the overburden above the ONS.Flow rates in the UNS were very low.
APPROACH TO GEOTECHNICAL DESIGN The first step of the geotechnical design was to divide the underground area into a number of design sectors in which ground conditions were assessed to be similar but distinct. Five sectors were identified based primarily on geological factors such as presence of particular sedimentological units or faults. (Figure 4). Pillar design, roof support, subsidence, trafficability and face conditions were presented for
Bowen Basin 1995 - Symposium
51 594000
593000
595000
597000
596000
~
C, C, C,
C, C,
C, C,
--...
-...
C,
-...
-...
-...
-+----l----l.----~--+-+.\-\-l+µ,.:~¼-l-ll-ll-l-~--+-++-H-+-+--l-\-\rt-\-'\-\-l,+\-lc\ -\-\c\-\-\+I--IP<'-M~rl,---\;:--\,=---+1;M---H-+-+-+-+-H-+
593000
595000
594000
596000
597000
NEWLANDS COAL PTY LTD k k
UNDERGROUND ARE.A
Normal fault
+Anticline
SOUTHERN
Reverse fault
+Syncline
PRINCIPAL STRUCTURAL ELEMENTS
..._Monocline
- , , tt - Structure contour, floor of UNS
MBGS
Figure 2. Southern underground area, principal structural elements.
Bowen Basin 1995 - Symposium
52 597000
596000
595000
594000
593000
Working Section UNSA+B
,.,, 0
0
0
0
= 0
♦
♦
+--+-~ ~ ~~~~~r::-::- ------t-->v-,'- --------;:::== '===±~t,~~t- ~::;-t e Working Section 1
♦
0
l
•
~
.,.....,
0 0
~ -~~} UNSA+B+C+D
•
0
....
4774
0
d
I I
\
0 ldlometns
593000
♦
595000
594000
Ill Large diameter (150mm) core hole ♦ Diamond core hole, geophysically logged e HMLC core hole, not geophysically logged • HMLC core hole, geophysically logged Q Non core hole, geophysically logged o Non core hole, not geophysically logged
+
Pre 1980 dril hole
NEWLANDS SOUTHERN
'llffl Boundary between working sections
597000
596000
UNS
COAL
PTY
LTD
UNDERGROUND AREA ISOPACH
MAP
WORKING
SECTION
Figure 3. Southern underground area, isopach map, UNS working section.
Bowen Basin 1995 - Symposium
MBGS
53
,·
//
-:-i~:~-;~··,:.·.····•:,.·
',, \ /
•• _,, ,•. ···· ·-·
ll ·"""~
c:.;;.;,;~e:..,:,:'-4.':.:..;+,;;t.,;,:,",
Coffey Partners International Pty Ltd
~·
C I
;;,
Consulting Engineers. Managers and Sc1en11sts Env1ronmen1 • Geotechmcs • M1nmg • Water Resources
NEWLAND$ COAL PTY LTD GEOTECHNICAL ASSESSMENT EXPLORATORY UNDERGROUND MINE MINE DESIGN SECTORS scale
COfflY
i>B
Figure 4. Geotechnical assessment exploratory underground mine, mine design sectors.
Bowen Basin 1995 - Symposium
A. (. N OOJ 59;; OT!l
Rgure 4 Job no
Z 175/5
54
Sector 1, defined as the typical conditions. The leaving of a coal roof was seen as advantageous for both development and longwall extraction. Attention to water control was highlighted in the context of trafficability in the panels aligned parallel tQ strike. A bolting pattern of 4 AX bolts at 1.Sm centres was proposed along with a recommendation to trial 'cut and flit' type operations at depths <150m. A number of special design requirements were proposed for Sectors II to V. In Sector II, where low strength claystones occur within Sm of the working floors at depths less than 100m, chain pillar sizes were limited to 25m (rib to rib). In Sector III, particular attention to water control will be required to limit the production of slurries of low strength floor strata. The presence of massive sandstones in the roof defined Section IV and the design issue related to the possibility of periodic weighting. Sector V covered the areas around the known faults - increased roof support was recommended in these areas.
CURRENTSTATUSOFGEOLOGYAND PLANNING In the southern underground mining area the average drill hole spacing is 250m. The spacing has been closed up to 125m in the area along the main headings and around some of the confirmed geological faults. Geological structure models for the top and bottom of the coal seam have been developed using Mapteks Vulcan software on Silicon Graphics workstations. A number of longwall panel layouts were considered giving due respect to the known faults encountered. The current layout has panels which • run approximately North-South and average 1800m in length with a 250m face width. Panels have been limited in the South by the Ironbark and Blackbutt
faults. In the North the panel lengths are limited by the Ramp 3 fault. · Not all the faults present will have been located. In order to gain a better understanding of the geology, Newlands plan to extend the exploration underground using a continuous miner and shuttle cars. A three heading layout developing off the final end wall in N2.10 Pit will run south south-east for 700m before turning east for 600m. At this stage, it is planned to mine twin drives north and south of these main headings until the anticipated faults (boundaries) are reached. This approach will provide operating conditions for: •
floor roof and roof bolting patterns ribs
•
groundwater
•
advance rates.
Actual experience will be gained in fault driveage particularly for the 3-D Seismic fault. This driveage has been so designed that it can be expanded upon to fit into a longwall mine layout.
CONCLUSION Mine plans are dynamic and change as additional information comes to hand. This exploration program has certainly emphasised the need for a flexible approach to mine planning. In addition it has highlighted the important contribution that an experienced team of geologists make in advancing the understanding of the structure of an underground reserve.
Bowen Basin 1995 - Symposium
55
The poten tial of surface and down-hole
seism ic in multi- layer basalt s BJ Evans & M Urosevic Department of Exploration Geophysics Curtin University and Australian Petroleum Cooperative Research Centre
The seismic method has been known to produce extremely poor results in areas of multi-layered basalts in the Bowen Basin. The past use of seismic methods has been so poor that seismic is no longer used to map economic seams beneath basalts. Yet, drilling is extremely expensive. To find a seismic method which might work, BHP Australia Coal commissioned the recording of a reversed vertical seismic profile (RVSP) and surface seismic line at Wards Well. The area exhibited the typical geology which normally produces poor seismic ie. a 70m thick multi-layered basalt section, underlain by a 50m layer of poorly consolidated clay/sand sediments, which overlies the economic coal seams.
The RVSP survey showed strong coherent seismic noise on most of the receiver line, but reflection events were evident. After recording and analysis of the RVSP data, parameters were established for the recording of a seismic line. Shot records of this line displayed a high level of the expected coherent noise. After processing, a seismic section was produced which displayed many of the geological features expected of the stratigraphy. However, only the deeper seams were acceptably imaged, with the coherent noise masking the shallower seam reflections. This seismic section is a commencing point for the successful imaging of seams beneath multi-layered basalt flows and the method used in the field was not conventional. That is, very long offset data were recorded which conventionall y would not be recorded. The typically high level of seismic noise believed to be due to the generation of many guided and refracted waves within and around the basalt layers. Using conventional surface seismic methods, such noise trains are unavoidable resulting in poor seismic data. In this paper, we show the method of recording the RVSP and surface seismic line, the processing of the data and the resulting sections. Then we postulate the physics of how the strong noise levels were generated, how the deeper reflections were recorded, and why the shallow reflections were not recorded. We also propose alternative (and cheaper) seismic methods for mapping seams beneath basalts, which offers the potential for a new seismic method for imaging coal in the Bowen Basin.
INTRODUC TION Seismic recording methods in the Bowen Basin have been considered untrustworthy for mapping economic seams beneath thick Tertiary cover or multi-layer basalts. This is because excessive noise masks any reflected signal due to either the absorption of seismic energy or an unusually high level of noise being generated in the Tertiary sediments or basalts. BHP Australia Coal required seismic tests be performed at Wards Well to see if the method could be used to aid the mapping of economic seams beneath the basalts. The stratigraphy of the site is shown in Figure 1 where a thin 2m veneer of sand/ clayey soil overlies six basalt layers of varying thickness, which extends to 70m in depth. Variable thicknesses of clay interfingers between the basalts, beneath which there is a 50m section of poorly consolidated sand and clay, followed by two coal seams having a large block of siltstone between them. The most economic seams are found from 160m to 350m in depth. The RVSP method uses an existing bore-hole. Seismic reflections produced fromshots fired up the bore-hole, are observed without the influence of the over-burden. This means that an existing bore-hole (cemented off above the top economic seam) is used which is 'sacrificial' . The RVSP method is initially used because it generates seismic energy from beneath the Tertiary sediment or basalt layers, thereby reducing the influence of the upper geological section on the recorded seismic data . The method is also used to define the optimum near-surface seismic shot-hole depth and charge size, for recording the surface seismic. Before seismic data is recorded in a new area, it is possible to computer model the expected seismic shot records. To set up such modelling, sonic and density logs are required to provide fundamental information upon which the seismic response is computed. This form of modelling (known as 'elastic' modelling) produces records which are very similar to field records. Using the logs from the bore-hole provided by BHP Australia Coal, and a 144 station receiver line with a Sm station interval, Figure 2 was generated using a shot depth of 20m. Analysis of the record indicates that strong surface waves would be generated, with poor seismic reflections. The record
Bowen Basin 1995 - Symposium
56
Om
Surface
------ - 2m -----Soil, se.nd/clay
had previously proved useful at Moranbah, but the Tertiary at that site did not have basalt (Urosevic & others, 1993).
REVERSED VSP 24.Sm
== 1.3m .,.,.,.,~~ ~-------,.., ,,, ,,, , ,,,,,,,,,, ,,,.· ....... 9.1 m ~~~~~~~,,,.,., Basalt ~~~:~~~~~~~~::~:~: ,,,,, , , , , ,,,,, ,,,,, , ,,,,,, ,,, ,,, , ,,,,,,,,,,,,,
~~~~~~ ~;'.;~~;; ,;; 0.4m 8.4m ...:...;.;.;.;...................." " ' " " " ~ J J J J ..................................~.......
cla.y
8,6m 4.0m
70m Unconsolidated se.nd/cle.y 120m
SOm
Cod 2.Sm SOm
Siltstone
Cod
157m
Cod Coe.I Cod
Prior to the field work, arrangements had been made with BHP Collieries to use their 144 channel 24-bit recording system (which has subsequently been upgraded to 192 channels). Single, 30hz geophones were layecrout at a Sm station interval with the bore-hole at one end. The bore-hole was cased to 1S7m. Shots showed reflections at 200 to 300ms curve from the near offsets becoming weak on the mid to far offsets. To improve far offset data, it was necessary to increase the charge size, since the energy had a greater distance to travel to reflections, and more energy was being absorbed by the shallower sand layering. Noise affected the inner traces of the data, with reflections contaminated by coherent noise as the charges were fired up the bore-hole. The optimum solution was to record data with shots at around 22m, using a single K-primer. It was decided that 22m holes should be drilled, down which would be loaded a single K-primer at 22m, followed by a double K-primer at 12m to observe a stacked section using both single/double charges and 12m/22m hole depth.
Figure 1. Wards Well stratigraphic column.
2-D SURFACE SEISMIC DATA is useful in indicating the problem of obtaining a good quality seismic shot record in coi:nplex stratigraphy (Figure 1) and was a precursor to field work. The seismic test line was along an exploration line where bore-holes were drilled every 800 m to a depth of around 3S0m. The bore-hole-was centrally located on the seismic line. An RVSP is performed by firing different sized charges up the bore-hole until an optimum source size and depth is determined for recording reflections. This method
The recording parameters were as follows: Instruments: Channels: Sample interval: , Low-cut filter: High-cut filter: Receiver interval: Hole depth: Charge size: Geophones:
BHP instrument, 24 bit 144 0.2Sms 8Hz 1000Hz Sm 22mand 12m 1 K-primer (170g) at 22m and 2 primers at 12m Single 30Hz
Figures 3 and 4 show field shot records with a 12m and 22m depth charge. Automatic gain control (AGC) and refraction statics has been applied to enhance reflections that may be present. The dominant events observed on the records are the surface waves and far offset events in a window from 300 to S00ms. Many of the far offset events are actually noise caused by the basalts and not reflections, so it is difficult to know which are the reflections.
DATA PROCESSI NG Hnri1onlnl
nll<i11I
(.-.tl
Figure 2. A computer modelled shot record, showing a typical poor seismic record expected in the area. Reflections should appear at the positions shown, but they are not evident.
Shot records showed a lack of continuity from the far offset events to near offsets. The 22m records were preferred for the better signal strength and continuity across the record. The far-offset curved events appeared to be real reflections, because they were present on all records irrespective of the
Bowen Basin 1995 - Symposium
57
Figure 3. Two 12m shots after AGC and statics correction.
Figure 4. Two 22m shots at start and end of line, after band-pass and F-k filtering, deconvolution and AGC. Bowen Basin 1995 - Symposium
58
w- - ~ - ..... .,
..
-
..
-
-
-
•.
-
•.
-
•.
••
-
-
••
-
••
-
••
-
••
-
••
-
••
-
••
"..
-:
' ; ' ; ' " ' ' ' ' ' ; ' ' ' i' ;I; 1i1~1111i~ l ' ; ' ,, ' :':/ ; ' ' ; ; ' ; ' ; ' ' ' ' ::,•
~2
Ol(I\ W :l\ -.UO..,
/ttt)l\~ : :
fr ·w:OOc'(<J~rti
tt ~i:
-~
l'f
;1 t
~
Figure 5. Stack with a zero offset VSP seismogram inserted.
processing method used . Computed static corrections indicated that there was good control over the statics application. Data for all offsets were stacked after f-k and a surgical mute (to remove noise trains) then statics were applied, plus deconvolution, and band-filtering. It became apparent that inclusion of the inner traces, while increasing the frequency content of the stack, reduced the coherency of deeper reflection events by introducing noise. The noise was possibly caused by remains of multiple refractions in the data and intensified the stepped reflection, as shown in Figure 5. A field zero offset VSP seismogram was then added to the figure. This was generated by constructing a common receiver gather of traces next to the bore-hole, transforming the data to two way time, removing the down-going waves, aligning and stacking up-going waves (ie. reflections). This resulted in the generation of a single trace which was reproduced 10 times and overlayed at the bore-hole location. There appears to be good agreement between many of the events observed on the VSP and the seismic section, with the shallowest events (seams) at 140ms tieing, as well as those at 180, 240, 270,290 and 320ms. This is about as far as is reasonable for acceptable interpretation. Other processing steps, such as Dip Moveout (OMO) were applied but appeared to smear the data. The final stack (Figure 6) was migrated but it smeared the data. Finally, phase attribute analysis
was applied to produce the section (Figure 7). The phase section appeared to provide supporting evidence of a lack of structure along the line tested.
PROCESSING DOWN-HOLE VSP DATA During the RVSP test, the geophones had been placed from the top of the bore-hole along the line. This allowed the computation of average and interval velocities of arrivals at the nearest phones. Figure 8 shows the interval and average velocity versus depth plot. High velocity basalt layers are seen from 20m down, with a high velocity band at 290m which is compacted sandstone. The chosen shot depth of 22m used for the seismic line indicates that it was fired within the upper-most basalt layer. A comparison of interval velocity information between this bore-hole and the adjacent bore-hole 750m west showed that the basalt layers were at different depths, indicating variable basalt levels. The RVSP shots were fired up the bore-hole every 20m, but there was a gap between 190 and 120m, due to the hole bridging. Therefore the RVSP data were sorted into common receiver gathers ready for VSP processing. The shots showed that no first arrival was received until about the depth of S0m, when it disappeared. The further the geophone was away from the bore-hole, the larger the data hiatus. Consequently, most of the energy from the shot was totally refracted or reflected within the
Bowen Basin 1995 - Symposium
59
Figure 6. Final stacked section showing dipping seams.
'"
•.
;
--
. I
•
.
~
Figure 7. Phase attribute stack showing seam continuity.
Bowen Basin 1995 - Symposium
60 6000
5000 •
4000 •
Dlllilinter
i?:' 3000 •
u0
--aver
Cl>
>
2000 •
1 000
0 0
ui
co
0
,-
~
co
,-
co
l()
(\J (0
0 l()
v
c:i (\J
ui (\J
0 C')
l() (\J
co
v
c:i l()
c:i ,-...
c:i a,
c:i
0
,-...
C'(\Ji
a,
0 0
(0
l()
l()
l()
~
~
~
~
0
0
0
(\J
C') (\J
l() (\J
0
v ~ 0
,-...
0,
(\J
(\J
v
v
v
0
0
0
C')
C') C')
l() C')
~
~
~
Depth (m)
Figure 8. Ward's Well velocity profile.
-
.
PIH
-•
I HI
,w.
IHf
"'
".
..
.. .. I 1•
I
llil .... ~
'1
~
, '• I
••••
/'
' •• • ,, '•
I I
•
1 I 1 I
'I I I I
'I
•, I
WU Figure 9. Fold map for a section 200m away from the borehole.
near-surface layers of basalt, and little to no energy was transmitted for deeper reflection. The data were then processed for the removal of noise and direct waves (bandpass and deconvolution ) to produce VSP gathers for each receiver. Data for offsets from the bore-hole up to 145m away were then mapped into the CMP domain. Figure 9 shows the fold map of where
reflected data would be obtained using the required offsets, and it has the typical curvature expected of VSP stacks. There is a central strip where no fold is shown. This resulted from the loss of data due to there being no shots fired between 120 and 190m, and is useful as an indication that a shot interval equally fired all the way up the bore-hole will produce better mapped results. The VSP stack has had little processing, compared to the surface seismic section. Consequently , the VSP data would be of far better quality \~f they had additional processing including statics corrections applied to them. Figure 10 shows a VSP stack using offsets of 10 to 235m, which overlies the seismic section for a distance of 110m from the bore-hole. A good agreement with the surface seismic reflections at 170ms and 250ms. The shallowest seam is vague on the VSP section at 150ms, but is missing from the surface seismic section. There was no continuity of the reflections across the VSP section because of the loss of data due to the bore-hole bridging over the column of 120 to 190m. VSPs properly recorded, have the potential to be used as a continuous mapping tool where bore-holes are drilled no further apart than 400m. (The most useful shots are the deeper bore-hole shots.)
SEISMIC MODELLING AND WA VE PROPAGA TION ANALYSIS During the processing of the surface and RVSP data, the causes of the high levels of coherent seismic noise and the reasons for the success in recording long offset reflections became more apparent.
Bowen Basin 1995 - Symposium
61
Figure 10. Stacked seismic section with the VSP stack overlayed.
The computer modelling of Figure 2 was reviewed and compared with the field data. The computer modelled events observed in the near offset traces are reminiscent of multiples, while two forms of wave train pass across the record, one slower and the other at faster velocity. This was compared with a typical shot record using a 22m shot (Figure 11 ). -.
The field data with strong noise trains are very similar to the modelled record, except that the frequency content was broader (as was expected) and the near offset multiples were not evident. In fact, the numerically modelled record appeared noisier than the field data, which was a surprise.
►
...........
..
......
.
..........
Figure 11. Comparison of the computer modelled record with a field record.
Bowen Basin 1995 - Symposium
..
..
..
---------
.-
62
The modelling was primarily used to confirm that the events between 300 and 500ms, seen on the far offset traces, are real reflections originating from
Hi
Hi Lo~
Low velocity High velocity Seam
Seam
Figure 12. Normal reflection path with normal velocity profile.
the deep seams. Further investigation of this problem is proposed for future research.
Figure 14. Multi-layer reflections.
Seismic records have the following physical principles: Normal reflection path
Normally a seismic wave travels as a ray from low to high velocity, and is reflected back to the surface (Figure 12). The ray bends towards the normal • according to Snell's Law, and vice-versa when travelling from high back to low velocity. The reflections from the seam arrive at offset distances as far away as the depth of the reflection layer.
High Low
High Figure 15. Guided ('Trapped' or 'Channel') waves.
angles than previously, causing reflector energy to diminish. Guided waves
Low velocity Seam
In Figure 15, waves are trapped or guided within layers which exhibit a large velocity contrast, and
Figure 13. Reflection path where velocity inversion occurs.
Reflections are strong, because the vertically polarised geophones respond to vertically arriving energy. The far offset distance is conventionally no larger than the deepest reflection depth. Actual reflection path
In Figure 13, the ray travels from a near-surface high velocity layer to a low velocity layer (called an 'inversion layer'), then the ray path would towards the normal as shown here, rather than away from the normal as shown earlier. In this case, reflections appear weaker because they arrive more horizontally than previously. Since we use vertically polarised geophones, reflections with energy arriving at any other angle but vertical to the geophones, will be poorly recorded. Multi-layer ray path
Seismic ray paths are shown in Figure 14 for a wave travelling down through multiple high and low velocity layering. If the near surface layer has a high velocity, it causes the wave to arrive at steeper
\
I
L
High Low
Higr.
Figure 16. Multiple Refractions.
continuous internal reflection of energy occurs. Some energy will leave the top of the layer and return to the surface, which is referred to as 'leaking' away from the wave guide. Multiple refractions
A wave travels from a low velocity layer to a higher velocity layer (Figure 16) and refracts at the critical angle, travels along the lower (higher velocity) layer, then refracts back towards the surface at the critical refraction angle. For multiple layering, this can happen continually from seam to seam, setting up multiply refracted waves arriving at the surface.
Bowen Basin 1995 - Symposium
63
\t
High
However, if it is feasible to stack a 200m wide RVSP section away from each bore-hole, then in the case of holes 400m apart, it should become possible to image the seams between the existing bore-holes without the need for surface seismic (Poole, 1994).
Low
CONCLUSIONS
Low
w
Figure 17. Peg-leg multiple~.
Peg-leg multiples Peg-leg multiples occur (Figure 17) when the acoustic contrast is so high between layers that energy is trapped within a layer, reverberating vertically, which eventually returns to the surface. Such phenomena have more chance of occurring on the near traces (receiving vertically reflecting energy).
SEISMIC INTERPRETATION A good quality seismic interpretation has not been attempted at this experimental stage, since the shallow seams could not be imaged clearly, and the deeper seams were still affected by noise. However, the general trend of the section shows the seams dipping up from east to west. The VSP section indicated that it may contain shallower reflection data. The seismic section successfully images the deeper seams in excess of 150m, and the VSP section ties well with the seismic section for the deeper events and indicates an image of the shallower seams. The next step is to develop some technique to remove the noise, thereby enhancing signal. Another is to use the existing bore-holes to provide natural VSP holes for imaging geology up to 200m away from each bore-hole. To remove noise from seismic data, we can recognise the directionality of arriving waves and filter them. To do this, it is necessary to record two or three components of the seismic data (since seismic waves arrive vertically, horizontally and laterally to the line direction). This requires twice or three times as many field recording channels) and three component (3-C) data analysis, the software of which is not currently commercially available.
The surface seismic reflection method at Wards Well shows promising initial results. More field and data processing work is needed to obtain reliable data. This experiment indicated that shot holes should be drilled into the shallowest, high velocity basalt layer. Long-offset recording is a minimum pre-requisite for seismic recording in multi-layer basalts where the near-surface basalt is thin. The experiment indicated that a suite of properly performed overlapping vertical seismic profiles could be used as an alternative to surface seismic, where drill holes were no further apart than 400m. This would reduce the cost of drilling where structure is expected between existing bore-holes. If the receivers were three component, it may also offer the possibility of roof stability and rock strength prediction.
ACKNOWLEDGMENTS We acknowledge the support of BHP Australia Coal in allowing the release of this paper. In particular, Ken O'Reilly and Alan Davies provided encouragement for our work over basalts. We also acknowledge the help of Greg Poole (BHP Collieries) whose field expertise and search for new seismic applications is of profound importance to opening up new areas to assist mining. We also acknowledge The Australian Coal Association, the Minerals and Energy Research Institute of W.A., Griffin Coal, Western Collieries, Shell Australia and the Australian Petroleum Cooperative Research Centre who support the' Advanced Seismic Syndicate'.
REFERENCE UROSEVIC, M., EVANS, B.J., ZHAO, P. & SEMAN, M., 1993: Seismic acquisition, processing and interpretation at Moranbah, Queensland: Internal Sponsors report for Shell Coal.
Bowen Basin 1995 - Symposium
64
Bowen Basin 1995 - Symposium
65
Integration of computer modelling
l!_rocesses into coal exploration in the Callide Coal Measures Basin 1
Peter Jorgensen & Mark Bigg/ 1. Department of Earth Sciences, The University of Queensland 2. Callide Coalfields Pty Ltd
At the beginning of 1992, Callide Coalfields Pty Ltd embarked on a programme of review and rationalisation of their exploration lease covering the Callide Coal Measures Basin. The programme was intended to identify new areas of mineable coal, and to delineate areas suitable for relinquishment from the EPC. The study was the first review of the coal geology of the basin since a similar project in 1977 located the Boundary Hill deposit. It was also the first exploration project carried out by the company in which computer modelling procedures were fully utilised as an integral part of the exploration process. The programme proved successful, locating seven small to medium-sized deposits, some of which occur in areas previously regarded as non-prospective. The generation of exploration targets was conducted via workstation-based computing facilities (MINEX GMC 3D on Silicon Graphics workstations). Varied information types such as regional magnetics and radiometrics, Landsat and airphoto lineaments, fault locations, regional oxidation and base of weathering patterns, basement distribution patterns, overburden thickness ratios and topography grids were incorporated with a limited amount of previous drillhole information to form the base data set. Using the computer system in a GIS-like manner, the data set was combined as a series of layers that ultimately built up a model of the geology of the study area. From this model, prospective areas could be delineated, but only those satisfying a narrow set of quality parameters were investigated further. It was only at this point that exploration drilling was conducted at the specified sites to test the validity of the predictions and to refine the model. Keywords: Callide Coal Measures, basin evaluation, GIS, structural features.
INTRODUCTION AND SCOPE The Callide Basin is located approximately 100km south-west of Gladstone and 450km north-northwest of Brisbane in east-central Queensland (Figure 1). The coalfield covers an area of about 18 000 hectares and is located within a north-west trending synclinal basin 22.5km long by 8km wide.
Present open-cut mining operations are located in the Dunn Creek, Trap Gully and The Hut areas in the south as part of the Callide Mine, and at Boundary Hill in the north-west of the basin. These deposits are owned by a joint venture between Shell Company of Australia Limited (66¼%) and AMP Society (3311.,%), with the managing company being Callide Coalfields Pty Limited (a wholly owned subsidiary of Shell Australia Limited). One outcome of work associated with the company' s submission to QEC Tender H0969/92 was a desire to investigate alternate coal sources both within and outside the basin. So at the beginning of 1992, Callide embarked on a programme of review and rationalisation of their exploration lease. The study was intended to identify new areas of mineable coal, and to delineate areas suitable for relinquishment from the lease. A seven step procedure was set out to achieve these objectives:Review basin geology
January-March 1992
•
Identify prospective areas March- May 1992
•
Establish drill targets
May 1992
•
Exploration drilling
June-August 1992, June-October 1993
•
Evaluate results
November 1992January 1993, December 1993February 1994
Follow up drilling
August-September 1994, February 1995
Rationalisation of lease
March 1995
•
REGIONAL GEOLOGY AND SEDIMENTOLOGY The Late Triassic Callide Basin is an intermontane, partly fault-bounded synclinal basin elongated along a north-west trending axis and asymmetric in cross-section. The largely undeformed basin fill unconformably overlies a variety of strongly deformed Palaeozoic and earlier Triassic rocks (Figure 2) which were subjected to intense compressive shortening during the latest Permian
Bowen Basin 1995 - Symposium
66
..........
HAY POINT AND DALRYMPLE: BAY
0 U E E N S L A N D
SCALE 0
100
200
Kilom etres
II
COKING COAL
0
TOWN OR CITY
•
MINE
..... t7 Figure 1. Locality map.
Bowen Basin 1995 - Symposium
COKING AND THERMAL COAL THERMAL COAL THERMAL/CONVERSION COAL
EXPORT PORT
GEOLOGY OF CALLIDE COAL MEASURES BASIN
fJ)
'<
B
"0 0
...
'll
s::
B
§ [ZJ TERTIARY UNDIFFERENTIATED CAINOZOIC ALLUVIUM
□
JURASSIC PRECIPICE SANDSTONE
~
TRIASSIC CALLIDE COAL MEASURES
~
TRIASSIC MUNCON VOLCANICS
w
PERMIAN GALLOWAY PLAINS TONALITE
~
PERMIAN RAINBOW CREEK BEDS
□
CARBONFEROUS THREE MOON CONGLOMERATE
~
LOWER PERMIAN YOUI.AMIIIE CONGLOMERATE
f:•:•:•:•J
TERTIARY BASALT : WEATtEREO
Figure 2. Regional geology of the Callide Basin.
68
to early Late Triassic Hunter-Bowen Orogeny . The Callide Basin is considered to have formed after the orogenic climax, as an elongate trough parallel to the imposed structural 'grain' (Jorgensen & Fielding, submitted). Its component sediments are thus separated in both time and depositional setting from the Permian coal measures of the Bowen Basin further to the west. The Callide Coal Measures comprise up to 150m of elastic sedimentary rocks interbedded with four major coal horizons (Figure 3), and including one of the thickest black coal seams in Australia. The unit forms a grossly fining-upward megasequence with thick conglomerate bodies at the base, passing up somewhat abruptly into coal-bearing, finer-grained sediments. The basal conglomeratic part of the sequence is suggestive of high energy environments of deposition, perhaps associated with alluvial fans. The supply of coarse detritus then ceased, allowing finer-grained fluvial systems to become established and under appropriate circumstances, peat mires. The coal-bearing portion of the succession was probably deposited on an alluvial plain (Glikson & Fielding, 1991). The coals are sub-bituminous in rank, typically high in ash and usually interbedded with elastic strata. The thickest seam interval in the basin has conventionally been referred to as the Callide Seam. Due to the contemporaneous interaction of alluvial processes and peat accumulation, the seam is not a single, extensive coal body. Instead, it is actually a mosaic of component seams which overlap each other in a complex fashion (Jorgensen & Fielding, 1994). The Callide Coal Measures are unconformably overlain by fluviatile sediments of the Jurassic Precipice Sandstone and also by sandstones and claystones of the Tertiary Biloela Basin.
and south-western portions of the basin (Cameron, 1972). Some work on the regional geology of the basin was carried out as part of the compilation of the Monto 1:250 000 sheet area (Dear & others, 1971). Svenson & Hayes (1975) also reviewed aspects of the basin and its coal measures. Up until 1976 the majority of company drilling activities had also been concentrated in and around the known deposits. At this time an Authority to Prospect which covered the entire basin was granted (to Thiess Bros Pty Ltd), and an extensive exploration programme was undertaken. Detailed appraisals of the exploration lease were carried out (Grimstone, 1977; Grimstone & Roach, 1978) and resulted in the discovery of thick coal resources in the Boundary Hill area. Since 1982, exploration activities throughout the basin have been directed towards ground geophysical surveys (galvanic resistivity, mini-sosie, SIROTEM, TSIM and magnetics), drilling (rotary chip and core), and downhole logging (caliper, gamma, density, neutron, sonic and SIROLOG). Such techniques aided in outlining deep coal resources in the Kilburnie area along the north-western margin of the basin. Callide Coalfields Pty Limited and its predecessors have now completed over 2 400 drillholes for 167 000m (of which 24 000m have been cored}.
PREVIOUS BASIN ANALYSIS The original basin evaluation was undertaken by Grimstone (1977). The approach of that study, as described by Grimston~& Roach (1978) is summarised in Table 1.
THIS STUDY EXPLORATION HISTORY The boundaries of the Callide Coalfield were first mapped (beyond the initial 1890 discovery in the Dunn Creek region; Rands, 1891), by the Government Geologist, L.C. Ball, in 1906 and 1911 (Ball, 1906; 1911). He estimated that the coalfield extended from the Callide Range in the north, to Rainbow Creek in the east, Callide Creek in the south, and beyond Kilburnie Station in the west a total area of more than 100 square miles. Until the beginning of commercial coal production in 1945, the basin was largely ignored. To assist with the early exploitation of the coal, the Queensland Mines Department carried out field mapping and diamond drilling work between 1947 and 1951 (Reid, 1945; 1947a; 1947b; Reid & others, 1949; Shepherd, 1951a; 1951b). These investigations were centred on the southern parts of the coalfield around the then current workings. A second Mines Department drilling programme during the period 1964 to 1968 focused on testing the subsurface extent of the Callide Coal Measures in the western
For the current study, approaches such as Kennedy & Woodbury (1981), Ward (1984), Clark (1991), Mullard (1991), Davies (1992), Standards Association of Australia (1993), and Wilson & others (1993) were incorporated into an exploration strategy appropriate to the Callide Basin:•
All informati0n concerning the regional geology and exploration history of the basin was to be examined in order to delineate areas within the exploration lease that not been fully investigated in the past. The review would also identify existing information that could be utilised during subsequent exploration activities.
•
Following the basin review, potential deposit areas were to be examined in detail and then modelled utilising the available information. Targets for preliminary exploration drilling would be established from the first pass geological models.
Bowen Basin 1995 - Symposium
69
u ui
~
0:::
::J --, w ...J
0 0
~
z
<
er
::)
::::;;
w
PRECIPICE SANDSTONE
z ui
~
0:::
150
~ TRIASSIC -
JURASSIC
DISCONFORMITY ...... ...... .... ....... .. .... SEAM HORIZONS
--
125
DESIGNATED PLYS DESCRIBED AT DUNN CREEK MINE HIGH ASH TOPS I
Bond
CALLIDE SEAM MEMBER
z
<
w
~
6 < I
0:::
w
::;::
0
...J
I I I I I I I I I I
CAWDE SEAM
0:::
CALLIDE 100 COAL MEASURES
g_
'@~ Sl2Yfil.O!!t- -
""
]
__ ..9
C2 CJ
(.)
~
E
0
c~
N
◊EAST.o.
....0
D MARKER BED .o. FINISHING CYCLE C6 ◊ MAJOR PARTING C7 PLIES o BRAIDED STREAM DEPOSIT CB
D..
:::,
_ _ _ _ _ ...J _ _
SAWMILL SEAM LOWER SAWMILL WRIGHT SEAM
Cl
CS
◊WEST
SAWMILL SEAM HORIZONS
BOTTOM SEAM HORIZONS
50 w
...J
0 0
~
I ~
0:::
~
w
...J
OU o_ -(/)
::::. (/) I< o:::wlr
::;::I--
0
...J
z
<
z
0:::
< (.)
0:::
w
BASAL CONGLOMERATE MEMBER
CL CL
25
::)
........ ............ ................................ ................. ......... MUNCON VOLCANICS
0 Scale in metres
UNCONFORMITY
MODIFIED AFTER COATES, 1982, 1985. FLOOD, PALAEONTOGICAL DIVISIONS AFTER DE JERSEY, 197 4, STEVENS, 1978.
Figure 3. Composite stratigraphic column of the Mesozoic sediments in the Callide basin area,
Bowen Basin 1995 - Symposium
70
TABLE 1. CALLIDE COALFIELDS 1977 BASIN EVALUATION PROCESSES (after Grimstone & Roach. 1978) Stage 1 »
literature search
»
»
placing the coalfield in its regional geological setting; delineating the approximate margins of the basin (literature, photogeology); identifying the important stratigraphic surfaces (palynology, mapping); drawing structure contours of these surfaces; overlaying them and delineating their interaction with that of the Callide Seam; preparing a first stage base map.
»
confirming the structure contours by cross-sections along and across the basin axis;
» »
extrapolating the structure contours to intersect topographic contours at the basin margins; testing by field mapping;
»
drawing overburden isopachs;
»
preparing a second stage base map.
»
drawing isopach and iso-quality maps of seam components;
»
defining reserve classification limits;
»
combining overburden isopachs, limits of the Callide Seam, and geological reliability into the refined base map, and planning further exploration by selecting the most attractive targets.
»
Stage 2
Stage 3
•
Drilling of the identified sites would be carried out as part of the 1992 and 1993 annual exploration drilling programmes.
•
The results from both drilling programmes would be assessed and the various areas then recategorised as prospective or otherwise. Follow up drilling would be carried out during 1994.
•
By early 1995 sufficient details should be known about the basin such that all non-prospective areas could be relinquished during the rationalisation of the exploration lease due at that time.
CONSTRAINTS From the outset of the project, a specific style of coal resource was targeted. The economic viability of potential deposits was a high priority and exploration was to be restricted only to those areas that satisfied the following criteria:•
at least 20Mt of in situ resources (class 1 inferred or better, Galligan & Mengel, 1986) a cumulative overburden ratio of <8:1 raw ash <22% (as received) gross specific energy >16.0 MJ/kg (as received) Tertiary clay overburden thickness at a minimum.
BASIN REVIEW The basin evaluation was initiated early in 1992. Literature searches were conducted to locate all possible sources of information, and detailed summaries of the basin's exploration history were made. The literature review highlighted the paucity of regional data within Callide's archives. To rectify this, regional gravity, airborne magnetics and radiometrics from a 1986 BMR survey were acquired. A complete set of aerial photographs covering the basin were <l:lso purchased.
DEFINITION OF TARGETS The results of the basin exploration review suggested that further investigations should be focussed in two main areas - in the zone north-east of the Dunn Creek Mine, and in the central and northern portions of the basin, extending from The Hut mining area across to the Boundary Hill Mine. These regions were seen as having been under-explored in the past, and so the possibility of them yielding at least one suitable target during the study was quite high. The methods used to aid coal exploration in these areas are discussed below.
(a) Existing data The literature search also delineated a sizeable amount of data concerning the two proposed exploration areas. Most was contained in the Grimstone (1977) report. Other sources were a series of University Honours theses that had been completed since the last basin analysis (O'Sullivan, 1977; Stevens, 1978; Coates, 1982; Lumley, 1985; Behets, 1987; Waterfield, 1988; Sorbie, 1990),
Bowen Basin 1995 - Symposium
71
regional geology maps and scattered drillhole data from the areas. However, little of the information existed in a computerised form so the initial step was to remedy this situation.
identified (Figure 5), of which nine eventually proved to be prospective.
Map information (coal seam isopachs, LOX lines, Precipice Sandstone and Tertiary sediment thickness isopachs, basement outcrop patterns and topography) was digitised into SURP AC and loaded into MINEX. Some of it was then processed further and converted into gridded surfaces. Company borehole logs, plus stratigraphic sections from the Honours theses, were encoded into DATCOL and transferred to the MINEX database. The regional geophysics was loaded directly into the workstation and stored as grids in MINEX.
The mining areas in the Callide Basin are characterised by a wide variation in both thickness and composition of overburden. Both factors exert a strong influence on the design and economic viability of current pits, and so were included as constraints on the type of coal resource being sought. The Precipice Sandstone and Tertiary sediment isopach maps of Grimstone (1977) were converted to MINEX grids and used to predict potential zones of reduced overburden thickness (Figures 6 and 7). The gridded topography surface was also utilised during the deposit modelling to calculate cumulative overburden ratios.
(b) Lineament analysis An analysis of the regional lineaments was conducted in an attempt to identify possible structural controls on the basin. Regional and local scale airphoto linears, measured structures from company records and published maps, Honours thesis information plus Landsat lineaments (Walker, 1985) were combined to form the data set. This was then digitised into SURPAC and transferred to the workstation. Utilising ENGLOG software, the lineaments were analysed statistically to emphasise the most prominent features. These were compared with the gridded regional geophysics to delineate the basin margins and any other basement structures (Figure 4).
(c) Muncon Volcanics outcrop Once the broad scale exploration targets had been identified, the area of investigation within each zone was reduced by using two simple techniques. The first was to create an outcrop map for the Muncon Volcanics. As this unit immediately underlies the basin fill, its outcrop provided a precise limit on the extent of the Callide Coal Measures. A grid of the upper surface of the unit was also utilised during the deposit modelling process to give an indication of the possible dip and dip direction of at least the lower seams within the coal measures sequence.
(d) Regional oxidation pattern The exploration area was further reduced by discounting those portions of the coal measures that lay outside the regional LOX line and therefore had been sterilised by weathering and oxidation.
(e) Downthrown fault blocks Highlighted during the basin review was the fact that some of thick coal areas in the basin were associated with downthrown fault blocks. It was therefore decided to commence the new cycle of exploration in similarly affected areas. Utilising the existing regional fault data and the lineament analysis information, all probable zones of fault movement were identified, and the initial investigations were concentrated in these zones. Sixteen specific target sites were originally
(f) Topography and overburden
(g) MINEX modelling The workstation was utilised in two separate ways. It was initially used as a GIS in all the processes detailed above to compile and manipulate the various types of data. Secondly, it was applied in its more conventional role to formulate models of the potential deposits. Boreholes, stratigraphic sections and a limited amount of quality data were combined to formulate a seam stratigraphy for the project area. Seams were then correlated between data points to provide the basis for modelling of each of the various target sites. Seam thickness (Figure 8), coal quality and overburden ratio grids were calculated in order to delineate which sites satisfied the pre-imposed resource criteria.
EXPLORATION DRILLING From the above work, nine sites were identified as warranting further investigation. Six of the prospects were initially drilled in 1992 and follow up drilling was carried out in them in 1993. The remaining areas were drilled for the first time in 1993. The data collected during these programmes was processed and used to refine the original modelling. More specialised targets were then planned and drilling of them was conducted during 1994 and early 1995.
DEFINED RESOURCES After the preliminary drilling was completed it became apparent that only seven of the nine original target areas were still prospective. Two of the areas are tied in as one and called the Amy's Find prospect. The other five are known as the Pete' s Rugby Field, The Heather, Rosendale, Central Reserve and Dingo Gully prospects (Figure 9). All of the deposits were delineated during the first pass definition of targets except for the western portion of Amy's Find. Its potential was only highlighted during the seam modelling work when significant coal thicknesses and lowered overburden ratios were inferred for the area.
Bowen Basin 1995 - Symposium
...
\0 \0
(11
rJ'J
'<
e
',:I
0 <ll
Z-4~0B
2~0008
2550008
2600008
2650008
Figure 4. Relationship between the regional aeromagnetics and prominent lineaments. The regional LOX line is shown as a dashed line.
z0 0 0 0
(II (')
t--
cr:I 0
~ Ill
= cr:I ~
....
'I>
=
t--l ID ID t/1
z 0 0 0
+
.... II')
(')
t--
f./'J
'<
a
"O 0
....
'I>
C:
a z 0 0 0 0
.... (')
t--
+
2~5000E
250000E
255000B
Figure 5. Location of the primary exploration targets and their proximity to regional lineaments.
260000B
265000B
-T
----'
=
0
~
~
:::s
=
~
...
(I)
z
:::s
0 0 0
""'"
(")
...
~
'° '°VI
r--
rJl
'<
!3
"d 0
... s= (I)
!3
z 0 0
0
... C
(")
r--
+
CALLIDE COAL MEASURES BASIN PRECIPICE SANDSTONE THICKNESS 1977 ORIMESTONE STUDY
also showing major linears 24~0008
2~0008
Figure 6. Isopach map of the Precipice sandstone thickness.
2550008
2650008
:z: 0 0 0 0
(II C')
r--
=
0
~ ~ ::,
=
~
.... ::,
<ll
~
\0 \0
tl1
z 0
0 0
IC)
C ')
r--
en
'<
!3
"O 0
....
<ll
s::
!3 z0 0
+ - CALLIDE +COAL MEASURES BASIN 0 0
C ')
r--
TERTIARY SEQUENCE THICKNESS 1977 GRIMESTONE STUDY also showing Tertiar y Basalt Outcrop ~0000B
2~0000
Figure 7. Isopach map of the Tertiary sediment thickness.
2~0000B
260000B
2600008
-.:a
01
l---- ·-1__ _
CUMULATIVE SEAM ISOPACH (m) MODELLED SEAMS OP THE CALLIDE SEAM
::s
....
I
""'
L---.
1,0 1,0
I
U1
L____
7
L
- I
s=
!3
+
r
+
I I
ti1
-- $u■■ ary or Grid LOrlaln •
Rotation =
LBxtenl •
LMeah
0
•
Grid point• =
2•2000 0 25800 100.0
1«18 Grid $tattatlca : Maxt ■ u■ s Mlnl ■u■
=
Averaae •
::>A.!'\nnn'R
_J
•Auuxom • --
- Y_Orlaln •
7308000
- Y_Bxlenl • - y_l(eeh •
19200 100.0
•2.38 0.00 11 . 07
l
2,;onnni:1
1 ______ -------2!'\!'\000'R
Figure 8. Modelled cumulativ e seam thickness of the Callide seam horizon.
2AOOOOR
[ ctrawn by : mb 21 - jun - 95 1date scale 1: 100,0
::>R!'tOOOFl
00
To
Gladstone
AVON PROSP
::s
"""'
1.0 1.0 VI
KILBURNIE DEPOSIT
DINGO ~ GULLY ~PROSPE CT
s::
CALLI DE MINE
!3 TRAP GULLY
CALLIDE COALFIELDS DISTRIBUTION OF COAL DEPOSITS
CENTRAL RESERVE PROSPECT
~ROSENDAL E 9'PROSPECT
DUNN CREEK
..2 Q) 0
m ~
Figure 9. Distributio n of the coal deposits in the Callide Basin.
'
78
TABLE 2. SUMMARY OF MODELLED RESOURCE QUALITIES FOR NEWLY DISCOVERED COAL DEPOSITS.
CATEGORY
Central reserve (Ind) Dingo Gully (lnf) Rosendale (Ind) Amy's find (Ind) Avondale (Ind) The Heather (Ind) Pete' s Rugby Fields (Ind)
AS RECEIVED BASIS Range All Mean OB Cum. FE TM VM ASH SE TS ofOB Res'ces OB Ratio Coal Iron Total Volatile Raw Gross Total depths 31 Jan Thick. Thick. Oxide Moisture Matter Ash Spee. Sulphur 1995 in Ash Energy (m) (mt) (m) (m) m3 /t % % % % % MJ/kg 0-120 42.2 80.2 5.40 15.04 12.50 15.0 21.9 21.4 18.80 0.25 0-100 26.7 75.6 8.30 10.96 4.04 15.2 21.5 22.8 18.31 0.21 0-160 not calculated yet (in progress) 0-120 74.5 70.6 6.40 11.05 14.50 17.1 21.9 19.8 18.76 0-140 45.9 103.9 4.20 17.65 12.20 19.5 22.2 17.1 18.59 0-120 34.6 71.5 4.70 11.60 10.80 17.0 22.5 24.2 17.29 0-120
9.5
77.7
7.16
The modelled resource qualities for all the deposits are summarised in Table 2. Although each new deposit is in itself only relatively small, in total they represent quite significant reserves. Of the prospects, only Pete's Rugby Field does not comply exactly with the original resource constraints - but it contains relatively shallow coal and is in close proximity to the Boundary Hill mine so it is still of interest to Callide. Table 2 does not include any data for the Rosendale area as it is currently being modelled. Preliminary work on this deposit has suggested that it contains approximately 30Mt of inferred resource. Currently all the deposits are undeveloped, although preliminary mine designs have been drafted for some of them as part of a series of final year projects carried out by University of Queensland Mining Engineering students. The prospects are presently at indicated or inferred class 1 measured resource status.
CONCLUSIONS The project has been considered a success on several fronts :Geology review
The study was the first review of the coal geology of the Callide Basin for over 15 years. This review indicated that while much of the basin had been explored for large deposits, the potential for locating one or more smaller deposits of about 20-40Mt was quite high. Computer utilisation
It was the first project carried out in the basin which fully utifised computers as an integral part of the exploration process. MINEX GMC 3D software on Silicon Graphics workstations was used in two varied roles. During the initial basin review and regional geology analysis, the workstation was employed in a GIS-like manner to process, concatenate and manipulate widely varied
10.10
10.10
17.5
22.1
24.8
16.83
data sets. It was then used to combine these 'layers' of geological data so as to examine relationships between the different information types. When areas of interest had been derived and investigations into specific coal deposits were begun, the software was then utilised in its more familiar role as a modelling package to assist in seam correlations and formulate deposit models. Deposit models
Another significant feature of the project was that the computer modelling was begun at the very outset of coal exploration. This has allowed the generation of deposit models in a format such that they can be continually updated as more information becomes available, and means that the models should remain useable for the life of the deposit. Potential deposits
The programme was commenced with a pre-conceived type of exploration target. With computer modelling to the fore, an integrated approach was used to identify five sites that satisfied the imposed criteria. Drilling and redefinition of targets
Because of the detail of the original models, it has been possible to streamline the subsequent drilling programmes in such a way that the drill holes have been specifically sited. This has meant a saving in both time and money, and acquisition of the data needed to refine the models has been accelerated. Proven deposits to indicated status
These deposits have proved to be of medium size, with coal qualities and overburden ratios that are not markedly inferior to other proven mining areas in the basin. They are currently at indicated or inferred class 1 status, but it is intended to upgrade them to at least measured resource status.
Bowen Basin 1995 - Symposium
79
Rationalisatio n of exploration lease
This stage of the programme is currently underway. Portions of the old exploration lease have been relinquished and applications for MDL's over selected areas of the basin are in the pipeline.
REFERENC ES BALL, L.C., 1906: The Callide Coalfield . Queensland Government Mining Journal, 7, 139-140. BALL, L.C., 1911: The Callide Coalfield. Queensland Government Mining Journal, 12, 1-165. BEHETS, R.A., 1987: The geology of the southernmost Callide Basin, East Central Queensland. University of Queensland Honours Thesis. CAMERON, J.B., 1972: Callide Coalfields (Coal prospecting and exploration, 1964-8). Geological Survey of Queensland Report, 68, 1-42.
CLARK, I.H., 1991: Computer modelling of coal basin structures. Proceedings of the Australian Coal Association Underground Coal Mining Exploration Techniques Workshop, Brisbane. COATES, S., 1982: The stratigraphy and structure of the Trap Gully area, Callide Basin, East Central Queensland. University of Queensland Masters Qualifying Thesis. DAVIES, A.L., (1992): Geophysics at the coal-face. Exploration Geophysics, 23, 87-96. DEAR, J.F., McKELLAR, R.G. & TUCKER, R.M., 1971 : Geology of _the Monto 1:250 000 Sheet Area. Geological Survey of Queensland Report, 46, 1-124. DE JERSEY, N.J., 1974: Palynology and Age of the Callide Coal Measures. Queensland Government Mining Journal, 75, 247-255. FL(X)D, P.G., 1985: Fades Study of the Callide Seam, Central Queensland: Implications for Mine Planning and Design. Australian Coal Geology, 5, 13-24. GLIKSON, M. & FIELDING, C.R., 1991 : The Late Triassic Callide Coal Measures, Queensland, Australia: Coal petrology and depositional environment. International Journal of Coal Geology, 17, 313-332. GRIMSTONE, L.R., 1977: The geology of AP188C and the evaluation of the Callide Coalfields. Thiess Bros Pty Limited - Mining Division report. GRIMSTONE, L.R. & ROACH, C., 1978: Evaluation of the Callide Coalfield. Australasian Institute of Mining and Metallurgy Conference, North Queensland, September 1978. JORGENSEN, P.J. & FIELDING, C.R., 1994: Application of fades and architectural analysis to opencut coal mining: The Late Triassic Callide Coal Measures, east-central Queensland. In, Boyd, R.J. & Diessel, C.F.K. (Editors): Twenty-eighth Newcastle Symposium on "Advances in the Study of the Sydney Basin", 228-235. JORGENSEN, P.J. & FIELDING, C.R., submitted: Fades architecture of alluvial floodbasin deposits: Three dimensional data from the Upper Triassic Callide Coal Measures of East-Central Queensland, Australia. Submitted to Sedimentology. KENNEDY, L.A. & WOODBURY, A.O., 1981 : The Hat Creek Coal Deposit: A geological case history. Geoexploration, 21, 19-48.
LUMLEY, D., 1985: A paleoenvironme ntal analysis of the Callide Coal Measures in the north-eastern corner of the Callide Basin. University of Queensland Honours Thesis (unpublished). MULLARD, B., 1991 : Computer intensive statistics: New ways of thinking about exploration data. Proceedings of the Australian Coal Association Underground Coal Mining Exploration Techniques Workshop, Brisbane. MURDOCH, B.A., 1977: A resistivity survey at Biloela in Queensland for Thiess Bros. Report 286, Murdoch Geophysics (Aust) Pty Ltd. O'SULLIVAN, T., 1977: Geology of part of the northeastern Callide Basin, East Central Queensland . University of Queensland Honours Thesis. RANDS, W.H ., 1891 : On the new discovery of coal near the Callide Creek, Port Curtis District. Geological Survey of Queensland Publication, 80, 1-4. REID, J.H., 1945: Callide Coal. Queensland Government Mining Journal, 46, 47-49. REID, J.H., 1947a: Report on the Callide Coalfield. Queensland Government Mining Journal, 48, 12-17. REID, J.H., 1947b: Callide Coalfield. Queensland Government Mining Journal, 48, 260-261. REID, J.H., MAO, C.S. & TANG, Y.S., 1949: The Callide Coalfield. Dunn Creek locality. Queensland Government Mining Journal, 50, 546-550. SHEPHERD, S.R.L., 1951a: The Callide Coalfield. Drilling in the upper Dunn's Creek section. Queensland Government Mining Journal, 52, 133-141. SHEPHERD, S.R.L., 1951b: The Callide Coalfield. Drilling in Petersen Gully section. Queensland Government Mining Journal, 52, 442-452. SORBIE, A.J., 1990: Geology and morphostructur e integrated with Coalfield computer databases, south eastern margin of the Callide Basin, Central Queensland. University of Queensland Honours Thesis. STANDARDS ASSOCIATION OF AUSTRALIA, 1993: Guide to the technical evaluation of higher rank coal deposits. Standard 2915. STEVENS, J., 1978: A palynological and sedimentologica l study of the Callide Basin, East Central Queensland . University of Queensland Honours Thesis. SVENSON, D.S. & HAYES, S.W., 1975: Callide Coal Measures, 1975. In Traves, D.M. & King, D. (Editors): Economic Geology of Australia and Papua New Guinea, Volume 2 - Coal. Australasian Institute of Mining and Metallurgy Monograph, 6, 283-287. WALKER, R.D., 1985: Callide Basin, Queensland, Landsat structural analysis. Report EMR 124/85 CSR Ltd Minerals Exploration and Development Group.
WARD, C.R. (Editor), 1984: Coal Geology and Coal Technology, Blackwell Scientific Publications, Melbourne. WATERFIELD, D.W., 1988: Geology of the northwestern Callide Basin, East Central Queensland . University of Queensland Honours Thesis. WILSON, R.G., JOHNSON, M., HANES, J., HARMAN, P., HATHERLY, P. & PRYOR, E., (1993): Exploration of deposits . In, Hargraves, A.J. & Martin, C.H. (Editors): Australasian Coal Mining Practice. Australasian Institute of Mining and Metallurgy Monograph, 12, 62-75.
Bowen Basin 1995 - Symposium
80
Bowen Basin 1995 - Symposium
81
Geolo~-_ical inl!.uts and plant design for utilisation of V,ueensland coals in AtlSTA Electric power stations BET Hutton & NM Turner AUST A Electric
Geological data are collected during exploration to enable design and efficient operation of electricity generating plant using particular coals.
The coal quality properties routinely collected from borecore data are proximate, ultimate and ash analyses, ash fusion properties and energy content. These properties determine the basic design and capital cost of combustion plant. Other properties needed to be collected are grindability and abrasiveness indices, and the handleability indices of fines and moisture content, clay content and mineralogy, and empirical flow rate measurements. Such additional geological properties determine auxiliary plant design and capital cost, and operating costs for the bulk coal handling plant, milling, and combustion products disposal. Coal supply tender specifications seek geological properties to fulfil the above requirements with a density of detailed results sufficient to provide representative results considering the variability of the results. Geological information is also required to confirm the availability of coal reserves and resources for the projected life of the plant. This paper outlines the effects of these coal properties on the capital cost and operating cost of combustion plant, as experienced by AUSTA Electric. In particular, the effect of ash fusion temperature on the furnace size and cost, the effect of Hardgrove Grindability on milling plant type, and the effect of ash content and properties on flue gas cleaning plant cost.
INTRODUCTION AUST A Electric presently operates coal-fired power stations in Queensland at Swanbank, Tarong, Callide and Stanwell. The generating capacity, fuel suppliers, and coal types burnt for each station are listed in Table 1. Coal supply contracts entered into by AUST A Electric are of variable time and total tonnage combinations. Contracts are entered into in response to the issue of a coal supply tender specification that is designed to elicit from the tenderer, geological information to characterise the coal supply over the projected tender life. Tender information allows determination of the adequacy of in situ resources to produce mineable reserves of specified quality to fulfil the Initial Contract Quantity of coal to be delivered. Additional security of supply for the medium term may be addressed by a requirement for an Additional Quantity to be offered for delivery after the Initial Contract Quantity. A requirement for an Additional Resource to be set aside may also be requested to provide for longer term security of supply. The coal properties affect the capital and operating costs of power station plant. These costs can be estimated from coal properties, and form one of the inputs to the evaluation of coal tenders resulting from a coal supply tender specification. In particular, some examples are: •
The heat value of the coal affects the coal handling plant size.
TABLE 1. Station
Capacity
Mine
Swanbank A, B
920MW
Tarong Callide B Stanwell
1400 MW 700MW 1400MW (when complete)
Ebenezer Jeebropilly Swanbank New Haenke AQC (Wilkie Creek) Oakleigh Meandu Callide Curragh Blackwater
Coal Measures/Basin
Walloon/ Clarence-Moreton Walloon/ Clarence-Moreton Ipswich/Ipswich Ipswich/Ipswich Walloon/Surat Walloon/ Clarence-Moreton Tarong Beds/Tarong Callide/Callide Rangal/Bowen Rangal/Bowen
Bowen Basin 1995 - Symposium
Geological Age
Middle Jurassic Middle Jurassic Late Triassic Late Triassic Middle Jurassic Middle Jurassic Late Triassic Late Triassic Late Permian Late Permian
82
•
The ash fusion temperatures affect the size of the boiler furnace.
•
The ash content affects the size of the boiler furnace, the flue gas cleaning plant and the ash handling plant.
•
The Hardgrove Grindability affects the type and size of pulverising plant.
•
The volatile content affects the type and size of pulverising plant.
•
The moisture content affects the type of pulverising plant and the power station operating costs.
AUST A Electric operates power stations which burn Queensland coals with properties varying as follows: Ash Fusion Temperature (Deformation) "C
1030°C - 1600°C
Specific Energy (as fired analysis)GJ/t
19-29
Ash Content (as fired analysis) %
10 - 32
Volatile Content (as fired analysis) %
16 - 35
Moisture Content %
8 - 21
Hardgrove Grindability
34- 95
COAL SUPPLY TENDER SPECIFICATION Component parts of a coal supply tender specification are: (1)
The Standard Coal Quality Specification and Rejection Limits. This response is provided in the form of a signed schedule. Herein, the tenderer nominates the quality parameters of the coal expected to be delivered throughout the contract term and nominates rejection limits. These data provide, inter alia, the limiting values of coal properties (particularly ash, energy and moisture content) used in the calculation of the price to be paid for the coal, and information sufficient to quantify the capital and operating costs for plant designed to burn the standard quality coal. It should be noted that the tenderer is encouraged to nominate the optimal product from the resource (which complies with limiting qualities noted in the specification) as the standard quality coal. This is expected to optimise the mine and power station combination and should result in lowest possible cost coal being delivered.
(2) The Source of Coal This response is provided in the form of a signed schedule. The defined area and seams from which coal may be mined are nominated. It is expected that the Initial Contract Quantity of coal will be delivered from areas of Marketable Reserves. That is, from reserves for which detailed mine planning has been undertaken on in situ resources that have been determined to Measured status as per the Code for Reporting of Identified Coal Resources and Reserves (Galligan & Mengel, 1986). Should the proposed contract require medium and longer-term security of supply options then defined areas and seams available for the Additional Quantity and Additional Resources must be specified. It is expected that these future requirements would be based on in situ resources that have been defined to Measured or Indicated Resource status as per the Code. The quality of coal for these future supplies should be consistent with that offered for the Initial Contract Quantity. It is important that the areas and seams to be mined are defined. The nolJUnation of mining tenement details for inclusion in subsequent coal supply contract documentation clearly sets the source of supply in place with a view to avoiding delivery of coal not the subject of the original tender. (3) Analysis of current production and/or geological testing Data are requested to demonstrate that the supplier can offer the coal within the specified quality. Depending on the total tonnage and term of proposed deliveries tenderers may be requested to provide evidence based on analysis of current production or an analysis of geological data. Should the tenderer be presently supplying coal to the power station at the same or similar qualities then an analysis of production over the previous 3 years may be sufficient. However, in the case of new supplies, analysis of bore core data is required. Ideally, bore core data, on a seam by seam basis, will be listed in schedule form. Table 2 lists product coal and coal ash properties and their individual influences on plant design and costings. (4) Statistical Data Statistical analysis of the coal quality parameters listed above provides the detail to verify the Standard Coal Quality Specification, and to generate capital and operating cost data in the case of new plant to be designed to burn the offered coal. Statistical data is sought in schedule form listing mean, standard deviation, and range of values for all the coal
Bowen Basin 1995 - Symposium
88
TABLE 2. SCHEDULE - INDIVIDUAL CORE, PRODUCT COAL AND COAL ASH PROPERTIES. PROPERTY Sample Number Core Diameter Seam Thickness From To Fraction Analysed Yield Date of Coring Moisture Holding Capacity at 30"C, 97% R.H. Air Dried Analyses Proximate Moisture Ash Volatile Matter Fixed Carbon Specific Energy Sulphur Total Pyritic Sulphate Organic Phosphorous Chlorine Arsenic (As20J) Dry Ash Free Analyses Volatile Matter Fixed Carbon Specific Energy Ultimate Carbon Hydrogen Nitrogen Sulphur Oxygen Relative Density Crucible Swell Number Hardgrove Grindability Index YGP Abrasiveness Durham Cone Flow Property Test Mineral Matter in Coal Ash Fusion Temperatures Reducing Initial Deformation Spherical Hemisphere Flow Oxidising Initial Deformation Spherical Hemisphere Flow Coal Ash Analysis SiOi Al203 Fe203 TiOi Mn304 CaO MgO Na2O K2O P20s 503
UNITS
INFLUENCES
mm m m m % classification by rank, and an indication of bed moisture
% % % % GJ/t
l
% % % % % % ppm
I
% % GJ/t
combustion calculations - coal fJow, ash flow, gas flow, inlet dust burden fuel ratio, if >3, combustion stability questions
combustion calculations
slagging and fouling indices
I
) fouling, limited significance for pf combustion fouling, if >0.5% then severe fouling environmental, coal leaching
i
combustion stability, if VM <25% DAF, problems
I
% % % % %
mg/kg %
·c
I combustion calculations -
coal flow, ash flow, gas
I flow, inlet dust burden I gas emissions, Nox and SOx
)
mass and bulk density calculations reactivity, carbon burnout and ash particle size milling capacity mill wear coal handling plant design coal handling, if bentonite >3%, problems, ash abrasion (quartz) furnace sizing
flue gas cleaning, precipitators % % % % % % % % % % %
rh•b,.,ioo
I classification of ash, bituminous when Fe20J>CaO + MgO I
) fouling index
Bowen Basin 1995 - Symposium
84
properties listed for the individual core, product coal and coal ash properties schedule. Additional statistical data is sought in the form of frequency distribution curves for the individual properties. The Standard Coal Quality Specification should reflect field average values for p roduct coal properties. The Rejection Limits nominated should be based on the higher values (for ash content) or on the lower values (for ash fusion temperature), and in general 95% of results should be below or above these values respectively. An example of a boiler fuel specification developed from statistical analysis of the data is presented as Table 3. Tabulated are base properties for basic plant design together with an indication of the range of characteristics measured. The bases of the properties shown is as follows: • (a)
Proximate analysis as fired 'base' properties are field average properties.
(b)
Data on Hardgrove G~indability Indices is indicative of the lower range or harder quality coal.
(c)
The base ash fusion temperatures are indicative of the lower range of values obtained.
(d)
Other base properties indicated, such as ash analyses, are averages of available results.
(e)
The YGP abrasiveness index of 50 is based on the higher values and in general 95% of YGP results are below this value.
The coal supply tender specification may also seek supporting geological information that complements the tender schedules described above. The criteria, that the geological properties listed in the coal supply tender reflect a density of detailed results sufficient to provide representative results considering the variability of results, require submission of supporting information tl'.> fu lfil this undertaking. The requirements are: (5) Plans showing sampling locations Such plans show any bias in testing locations towards initial or later years production when overlain by plans showing proposed mining strips and development schedules. (6) Isoquality plans These plans are sought to demonstrate the spatial variability of key coal quality parameters like Initial Deformation Temperature or Iron in ash, which then indicates areas and times of potential slagging problems.
(7) Interpretative geologic plans Definition of coal quality parameters in the Standard Coal Quality Specification and the nomination of seams, reserves and resources in the Source of Coal must reflect a detailed understanding of the geology of the resource to be developed . Interpretative geological plans including representative cross-sections, seam and overburden isopachs, seam floor structure contours, and plans showing defined or inferred structural disturbances should be presented in support of the understanding of the coal deposit. (8) Beneficiation Whether the tendered product is run-of-mine or washed coal supporting coal preparation data should be supplied. If the intended product is run-of-mine coal, the coal loss and dilution allowances are required to be given. These may be absolute or percentage thickness allowances. The ash, density and moisture content of included dilution must be specified. If the intended product is washed or part washed coal then size separation and washability data should be provided. If current mining practice dictates the absolute loss and dilution thickness allowances to be used then sampling should include this material in the analytical sample. However, as much of the geological work precedes mining evaluation care should be taken to separately sample sufficient roof or floor dilution strata to allow evaluation of working section quality.
(9) Mining details All coal supply tenders need to be supported by details of the mining method proposed. This detail should, as a minimum, include the mining equipment list, manning breakdown, coal stockpile and handling arrangements, and coal preparation flow sheets. Plans showing mine infrastructure, site layouts, and proposed mining pits should be accompanied by detail of the planned mining strips and a development schedule for the planned length of the contract (tonnage or time). (10) Other requirements Tenderers may be requested to provide detailed mine costing information confidentially to independent auditors to establish the viability of their proposals. Tenderers may also be requested to produce custom-designed geological and mining block digital databases suitable for evaluation by proprietary mine planning software packages.
Bowen Basin 1995 - Symposium
85
TABLE 3. BOILER FUEL SPECIFICAT ION COAL AND ASH PROPERTIE S. Basic Design Coal Base 1 Moist Hold Capacity (at 30"C & 97% R.H.)
Range of Individual Characteristics 2
%
4.0
3-5
Proximate Total Moisture Ash Volatile Matter Fixed Carbon Gross Specific Energy
% % % % MJ/kg
10 16.5 17.0 56.5 25.9
8--18 11-22 15-21 40-65 18-29.5
Sulphur Total Pyritic Sulphate Organic
% % % %
0.6 0.30 0.02 0.28
0.19-1.0 0.10-0.9 0.01--0.14 0.06--0.60
% % % P.P.M.
0.13 0.20 0.80 2.5
0.006--0.57 0.15--0.25 0.00-4.16 0.1-20.0
% % Mj/kg
23.0 77.0 35.0
21-30 70-79 30-36
%
87.0 4.5 1.7 0.8 6.0
78.0-90.0 4.2-4.8 1.frl.9 0.4-1.4 3.5-15.0
Specific Gravity
1.45
1.35-1.55
Hardgrove Grindability Index
60
55-85
C.S.N. YGP Abrasiveness Index
1.5 50
1-2 15-60
Typical Low Moisture Low High Moisture High Ash Coal Ash Coal 3 4
As Fired Analysis
Phosphorous Chlorine
COi Arsenic (as As203) Dry Ash Free Analysis Proximate Volatile Matter Fixed Carbon Specific Energy Ultimate Carbon Hydrogen Nitrogen Sulphur Oxygen
Ash Fusibility Temperatures
% % % %
1050 1080 1100 1180
1030-1460 1040->1600 1050->1600 1060->1600
Oxidising Atmosphere Deformation Spherical Hemisphere Flow
1150 1230 1260 1300
1100-1500 1150->1600 1250->1600 1290->1600
Ash Analysis
eao
MgO Na203 K2O P2Os
503 Ll2O
18.0 22.0 16.0 44.0 20.0
22.2 77.8 35.8
26.7 73.3 33.3 78.0 4.5 1.9 0.6 15.0
·c
Reducing Atmosphere Deformation Spherical Hemisphere Flow
Si(h Ah03 Fei03 TiOi Mn3O4
8.0 11.0 18.0 63.0 29.0
% %
% % % % % % % % % %
55.0 21.0 8.5 1.0 0.1 5.0 2.0 0.4 1.0 1.5 1.7 0.013
32.0-77.0 11 .0-35.0 1.5-25.0 0.2-1.5 0.01--0.45 0.3-20.0 0.1-5.0 0.1-2.5 0.02-2.6 0.1-3.5 0.03-3.5 0.007--0.035
Bowen Basin 1995 - Symposium
Typical Low Slagging Low Fouling 65.0 18.4 9.6 0.5 0.1 1.6 1.5 0.2 1.6 0.5 0.2 0.013
Typical High Slagging High Fouling 53.0 20.0 5.5 0.6 0.1 7.7 5.0 2.5 1.3 0.6 2.5 0.013
86
AUSTA Electric bums coal in its power stations with a wide range of Hardgrove Grindability Indices. At Callide 'B' the boiler fuel specification indicated a HGI of 70-95 whilst at Swanbank coals are burnt with HGI around 35.
EFFECTS OF COAL PROPERTIES ON COMBUSTION PLANT COSTS AUST A Electric operates power stations which have been designed on the basis of coal whose properties have wide variation. 1.
BOILER FURNACE - Ash Fusion Temperature
3.
Stanwell power station (4 x 350MW) was designed on the basis of a coal with a Deformation temperature of 1030"C, whilst Tarong power station (4 x 350MW) was designed for a cqal which had a Deformation temperature of 12so·c.
The ash content, moisture content, specific energy and ash chemical analysis have an effect on the flue gas cleaning plant size. Comparing Tarong and Stanwell, the flue gas cleaning plant at Tarong was specified for a coal with a maximum ash content of 32%, a minimum moisture content of 8%, a minimum specific energy of 16.3GJ /t, and an ash with 95% SiO2 and AhO3. For Stanwell flue gas cleaning plant, the specification coal had a maximum ash content of 22%, minimum moisture content of 8%, a minimum specific energy of 18.0GJ/t, and an ash with 76% Si02 and Ah03. The flue gas cleaning plant at Tarong power station was also specified with a higher collection efficiency (99.24%) than at Stanwell power station (98.98%). These factors, the difference in fuel properties and specified collection efficiencies, resulted in Tarong flue gas cleaning plant (electrostatic precipitators) being approximately twice the size of that at Stanwell.
This difference in ash properties account partly for the difference in boiler furnace size at the two power stations. The Stanwell boiler furnace is substantially larger in terms of volume than the Tarong boiler furnace. The increase in boiler furnace volume for the coal with the lower Deformation temperature results from the necessity to provide more heat transfer area to reduce the gas temperature at the furnace exit to the accepted level below the ash Deformation temperature. This reduces the risk of ash adhering to superheater tubes and causing blockages. 2.
PULVERISING PLANT-Specific Energy, Ash Content, Volatile Content, Moisture Content, Hardgrove Grindability, Abrasiveness. The selection and performance of power station pulverising plant is affected by the coal properties - Ash content, Volatile content, Moisture content, Hardgrove Grindability and Abrasiveness Index. The pulverising plant reduces the coal from typically 90mm top size to a pulverised product of typically 75 percent minus 200 micron in size analysis. There are three basic types of pulverising plant - low speed, medium speed and high speed. AUSTA Electric has experience in the three types of pulverising plant - high speed plant at its former power station Gladstone Power Station and at Callide 'A', medium speed plant at Stan well, Callide 'B', Tarong, Swanbank and Collinsville power stations and low speed plant at Swanbank and Collinsville power stations. The Hardgrove Grindability (HGI) describes the coal grindability. The Index relates the given coal grindability to a standard. High HGI (80-100) indicates soft coal and low HGI (<50) indicates hard coals. The pulveriser output is related to the Hardgrove Grindability Index; and as the HGI decreases the pulveriser output decreases for a given pulverising plant and for a given pf fineness.
FLUE GAS CLEANING PLANT - Ash Content, Moisture Content, Specific Energy, Ash Analysis
4.
COAL HANDLING PLANT - Specific Energy, Handleability The capital and operating costs of the coal handling plant are affected by the specific energy of the coal and the coal handleability. As the coal specific energy decreases for a given power station output, the required quantity of coal burnt increases, and this effects the costs associated with the coal handling plant. For a mine mouth power station, for a change in specific energy from 15GJ / t to 25GJ / t (as received), the capital cost of the coal handling plant decreases substantially. Coal handleability is a function of the clay content and type of clay, the moisture content, and the percentage of fine material in the coal. Clays such as bentonite cause handleability difficulties in coal handling and necessitate changes to plant design in order to reduce the risk of blockages. The capital cost of coal handling plant increases when the design is based on a coal with bentonite compared to that when the design is based on a coal without bentonitic or swelling clays.
Bowen Basin 1995 - Symposium
87 5.
ASH HANDLING PLANT - Ash Content, Specific Energy The purpose of the ash handling plant is to remove the ash from the power station plant to a storage area. At Tarong Power Station the ash is removed as a lean phase slurry (10-15% solids) to an ash dam. At Stanwell Power Station currently being commission ed the ash is removed as a dense phase slurry (65-70% solids) to an ash storage area. The Stanwell ash system is approximat ely one third of the cost of the system installed at Tarong Power Station, as the storage area for the dense phase is less than that required for the lean phase slurry system. The ash production rate affects the cost of the ash removal system; and the ash production rate is a function of the ash content and the specific energy of the coal. For a dense phase slurry system the ash production rate mainly affects the cost of the ash storage system; and as the ash storage system accounts for approximat ely ten to
fifteen percent of the cost for the dense phase ashing system, the effect of the ash production rate on the overall cost of the dense phase ashing system is small. For a lean phase ashing system however, the cost of the ash storage area represents approximat ely sixty percent of the overall cost of the lean phase ashing system; consequent ly the effect of a change· in ash production rate on the overall ash system cost is more for a lean phase ashing system than for a dense phase ashing system.
CONCLUSION This brief analysis indicates how coal and ash properties affect the costs of power station plant. It is important therefore to acquire data on the coal properties to allow reliable assessment of power station plant costs. It is for this reason that the geological assessment of a coal resource plays such an important role in the planning for a power station developme nt.
Bowen Basin 1995 - Symposiu m
88
Bowen Basin 1995 - Symposium
89
Use of coal in cement industry Jeff Caldwell, Queensland Cement Limited
In Central Queensland, the QCL group produces 3 different products - grey cement, ivory cement and lime. Grey cement is produced at the large modern facility at Gladstone - currently the centre of a study into its possible expansion, whilst ivory cement and lime are produced through a single rotary kiln in Rockhampton. In doing this, QCL consumes about 100 000t of C.Q. coal. After today, I hope that none of you will ever again refer to a cement path, a cement slab, a cement block, or a cement bridge. All of these are forms of CONCRETE. There is no such thing as a cement slab.Cement is a powder which hardens after reacting with water and is the binding agent which with sand and rock combine to be concrete. The most common form of cement is Portland cement, so named because in its hardened state it is similar in appearance to stone found in Portland, England. Cement was used by the early Romans & Greeks, but the oldest form of concrete found was in a hut floor dated to 4600 B.C.
TYPES OF CEMENTS Cement hardening is a result of the hydration of calcium silicates, with some side effects from calcium aluminates and calcium alumino-ferrites. These initially react with water, partially dissolve and crystallise as newly formed substances. These are thin-fibre like crystals, very fine grained and are the principal strength giving constituents of hardened cement paste. This strength is attributed to the co-operation of powerful adhesion forces (electrostatic forces of attraction acting between the very small hydrate phases) developed by the hydration products and the mechanical stabilisation of the mass by interlacing of the newly formed compounds. How does this magic occur and how is coal involved? Cement is made by the reaction at high temperature between oxides of calcium, silicon, aluminium and iron. These are the four most abundant metals on the surface of the earth. They are also the major constituents of coal ash. Coal performs two functions in cement manufacture. Coal is burned to provide the heat necessary for the reactions to proceed and the ash becomes part of the final product. The relative levels of these elements in coal ash and cement are roughly:
Cement (QCL) Coal Ash CaO 68 Oto 3 SiO2 24 50 to 60 AhO3 5 15 to 20 Fe2O3 3.5 5 to 15 The proportions are greatly different in ash and cement and this is of great importance to a chemist at a cement plant.
MANUFACTURE OF CEMENT The four major ingredients of cement are supplied by raw materials rich in at least one of the four metals. CaO as CaCO3 in limestone (or coral) SiO2 in sand AhO3 in clay or fly ash Fe2O3 in ironstone or foundry waste. These are first ground tog~ther to a very fine powder or slurry to create surface area for the solid to solid reaction. The equipment most commonly used is a ball mill or roller mill. The chemical structure of th~ final cement is determined by the proportioning of raw materials at this stage and much of the effort in cement manufacture goes into this stage. Not only is the quality and performance possible by the final cement established at this blentling stage, the performance of the kiln and its refractory brick lining is also affected . This raw material mix is fed to the kiln, where the mix is heated to about 1500°C and new compounds are formed . These are: Tetracalcium referred to as C4AF alumino-ferrite Tricalcium aluminate C3A Dicalcium silicate
C2S
Tricalcium silicate C3S For the chemical purists cement chemistry uses some licence in the symbols used. C3S is not a compound of carbon and sulfur. Since it was established earlier in this paper that cement has been around longer than the naming of chemicals and the allocation of symbols, cement chemists see this as their natural right. C4AF contributes very little to concrete strength. Its main purpose is to help the reaction in the cement kiln by melting and helping the reaction interface between solid cakium and solid silica. C3A performs a similar role to C4AF in the kiln. However C3A is very reactive with water with the generation of a lot of heat. C3A contributes very little to strength development of concrete, but the heat generated by the reaction help to set off
Bowen Basin 1995 - Symposium
90
other reactions between the calcium silicates. is relatively slow reacting and is the reason that concrete continues to gain in strength up to years after the concrete has set. is fast reacting and contributes the majority of strength gain at early ages particularly 3 and 7 days but also most of the 28 day strength.
colour of cement comes from the iron content. This point is important in the manufacturer of ivory cement at Rockhampton.
Different types of concrete are sold with strength development specified at these ages (i.e. 3, 7 28 day). Within the cement kiln, several reactions take place: up to 400 ·c escape of free and absorbed water
4.07 x Cao - 7.6 x SiO2 - 6.72 x AlzO3 - 1.43 Fe2O3. C2S = 8.6 x SiO2 + 5.07 AlzO3 + 1.08 Fe2O3 - 3.07 CaO C3A = 2.65 x AlzO3 - 1.69 x Fe2O3 C4AF = 3.04 x Fe2O3 A raw mix producing a clinker yielding
C2S
C3S
If we take a coal with an ash analysis of 53% SiO2, 24% AlzO3, 13.5% Fe2O3 and 2.5% CaO and a specific coal consumption of 0.16t coal per tonne of clinker.
The potential C3S of clinker can be calculated from the chemical analysis as
400-9oo·c
decomposition of clay to simple oxides
60% C3S, 21.2% C2S, 8% C3A, 10% C4AF with 67.6% CaO, 23.2% SiO2, 5.1% of AhO3 and 3.3% Fe2O3
600-1000°C
decomposition of Calcium carbonate to oxide with carbon dioxide liberated
when firing the kiln with the above coal will yield a clinker of
800-1200°C
calcium begins to react with aluminium, iron and silica - (C2S is formed)
1260-1310 °C
The compounds rich in iron and aluminium melt causing the mixture to agglomerate. This liquid phase helps the reaction between the still solid calcium and silica.
C2S combines with C to give C3S. The temperature necessary depends on the amount of C3S to be formed . The reacted mix called cement clinker drops from the kiln to a cooler where air is blown through the cooler to achieve rapid cooling to prevent reversion of the reactions. The air so used is heated and becomes reaction air (secondary air) for the combustion of coal. (Finally coal gets a mention). 1450°C
Coal is used as pulverised fuel and is blown into the kiln by primary air. The burner pipe used is traditionally a straight pipe about 250mm diameter. Some burner pipes are fitted with swirlers to improve the flame shape. Once alight the flame is self propagating because of the heat generated and reflected back off the wall of the kiln.
COAL Coal then has two effects. The reason for using coal (or oil or gas) is to create the temperature needed for the reactions to proceed. Coal is chosen because it provides the lowest cost energy. Because coal contains an ash content which is absorbed into the feed bed in the kiln, the ash components take part in the reaction. The chemistry of cement is controlled to give about 60% C3S. The iron and aluminium levels are usually chosen to give the best balance between kiln performance and cement performance. Most of the
69% C3S, 22% C2S, 7.3% C3A, 9.4% C4AF when burning with a fuel with no ash. This can be easily accommodated by changing the raw material mix to one higher in calcium and lower in the other metals. The difficulty occurs if the coal ash changes rapidly - say from one train load to the next. Suppose the ash content changes from 10% to 14% with most of the increase being in the silica content. The heat content of the coal will drop by about 4.5%, taking the coal consumption from 0.16 to 0.167tonne coal/tonne clinker. The clinker composition changes from 60% C3S on 10% ash coal to 54% C3S on 14% ash coal. While this can again be corrected by changing the raw kiln feed, this can take up to 2 days before the change in coal ash has been noticed, the effect determined and the correcting feed produced and blended. For a kiln operating at 1500°C this change in clinker and the burning characteristics can cause large portions of clinker coating to fall off the kiln's brick lining, often taking a layer of refractory brick with it. A couple of such episodes can result in brick failure and kiln shut down. A coal with fluctuating ash content makes control almost impossible unless a coal blending facility is available at the coal plant which evens out these fluctuations. The performance of the cement made from this clinker is also altered in that early strength ( 3-7 days) maybe be reduced. Three considerations are used when choosing which coal to use - stability of ash content, heat content and delivered price.
ROCKHAMPTON OPERATION Ivory Cement
With ivory cement and lime production at Rockhampton, some other problems are important.
Bowen Basin 1995 - Symposium
91
In producing ivory cement, raw materials which are low in iron are used. Limestone is washed to remove all red clay, silica sand instead of river sand, and kaolin clay instead of ordinary clay. Coals used can make a substantial contribution to the iron content of clinker and then the cement. The aim for iron content of clinker is <0.6% . A coal with say 13% iron in the ash could contribute 0.35% iron to the clinker (13% Fe2O3 x 10% ash x 0.28t coal/t clinker.) • For ivory clinker manufacture we can use only those coals with low iron contents. To date, Blair Athol coal (at 9% ash and 4.2% Fe2O3) and Gregory coal (at 6.5% ash and % Fe2O3) have been used.
If there is a marketing advantage in further improving the lightness of ivory cement, a reduction in iron content and other colouring metals such as chromium, manganese, nickel, and titanium will be necessary. Eventually, this may require a change to oil or gas firing of the kiln or a mixed firing of coal supplemented by oil or gas. Lime Production
The chemistry of Lime production is much simpler. Limestone (Calcium carbonate) is heated to about 10oo·c to drive off carbon dioxide, leaving Calcium oxide (lime). Lime is an industrial alkali and is used in the sugar industry, gold industry, waste water treatment, acid neutralising, drinking water purification, road stabilisation and soil conditioning. The plant at Rockhampton has produced lime for over 20 years, but for the past 15 months has used its rotary kiln to produce high grade lime. The rotary kiln has allowed an improvement in lime quality to occur with available lime being increased from 85% to above 92%. The kiln is coal fired on lime production. All coals used to date have created ash rings which grow to a size that will close off the kiln. The free space is eventually reduced to the point where it 1s not possible to draw sufficient combustion air through the kiln. This leads to the kiln being shut down and the ring manually removed. The ring which builds in the kiln is a combination of the coal ash and fine lime. The ash metals become molten within the flame and solidify when their temperature is reduced. If the ash particles remain air borne within the kiln it will solidify as the gas temperature drops with the heat transfer to the limestone bed. This ash leaves the kiln and is collected in the electrostatic precipitator and is a distant cousin to fly ash from a power station. A portion of the ash solidifies as the swirling flame contacts the kiln wall. This portion of the ash sticks to the kiln brick lining and is fixed at that point. Over time, enough molten ash in the cooling flame solidifies at this point and the ring grows. A mix of coal ash and fine lime which becomes air borne can react and become a molten mass. The chemistry of
this material is akin to blast furnace slag which is molten at about 12oo·c. This ash ring grows to proportions where combustion is compromised - by space available and the inability of sufficient combustion air to pass through the kiln. Three coals have been trialled to date - Gregory, Blackwater and Blair Athol. Gregory coal was used initially as it contained the lowest known ash content available in Central Queensland at 6.5%. As this is an export grade coking coal, the price is comparatively high, plus an ash ring was growing after about 12 days operation. The relatively cheaper Blackwater coal was trialled with lime product quality being maintained although a ring grew within 10-11 days. At this time, kiln capacity is well in excess of sales so that a drop in kiln utilisation is not a major problem. It becomes a cost trade-off between the cost per tonne of product for coal used versus the cost per tonne of ring removal and cost of reheating. Lime production uses about 35t of coal to produce lO0t of lime. Blair Athol coal is currently used at Rockhampton. As mentioned earlier, at Rockhampton the single rotary kiln is used to produce lime and Ivory cement. Ivory cement is used where a light coloured concrete is required or where other colouring agents are used in concrete. With Ivory cement production, the minimisation of iron in the product is paramount. Blair Athol and Gregory coal both contain a low iron content in their ash making their use in Ivory production preferable. Blair Athol coal is used because of price per unit of energy at the point of use. There are several theories about ring formation in a rotary lime kiln. The fusion temperature of the ash is said to be as important as ash content. Factors which appear to affect ash fusion temperature are iron and aluminium contents as well as their ratios with silica.
GLADSTONE OPERATION Grey Cement
At Gladstone, coal remains the cheapest and most effective energy source for the production of clinker. The range of coal grades the cement industry uses is shown in Table 1. The coal is ground in a ball mill, mixed with air and blown into the kiln through a refractory lined pipe. The coal firing system controls the flame characteristics necessary for stable kiln operations. Two main coal firing systems exist; direct or indirect firing. Each system has varying degrees of control over air velocity, air volume and coal fineness. In a direct firing system, the air that is used to sweep the coal through the mill also conveys the fine coal into the kiln. The indirect
Bowen Basin 1995 - Symposium
92
TABLE 1 net heat value (ar) ash (ar) moisture (ar) volatiles (ar) sulfur (ar) density (raw coal) ~indabilitv (drv)
MJ/kg % % % % kg/m 3 "H
max. 32 21 11
36
0.2 900 90
Kiln operation and refractory lifetime is directly related to the burning process. In general, to obtain a stable flame and the best heat transfer to the clinker, the flame is short and sharp. This is also associated with the right environment for the formation of good clinker. The following is a list of the main influences on the flame shape: • Grinding fineness The burning time (flame length) of the fine coal increases approximately with the square of the diameter.
min. 23 7 4.5 20 3 750 45
firing system has a separate air source to convey the fme coal into the kiln. This allows better control of the conveyed air (primary air) and coal fi neness. Table 2 summarises some of the criteria used when selecting the type of coal firing system to choose. The air that is drawn through the mill is usually waste heat from the cooler grate. Waste heat is used to improve the burning process. The temperature of the air is maintained at 70°C to prevent self-ignition.
•
Volatile content The higher the volatile content, the shorter the burning time.
Temperature in the combustion chamber The higher the temperature the faster the burning process. Due to the importance of a stable flame shape it is essential the coal quality remains consistent. Changes in the calorific value or hardness of the coal can change the coal's milling performance and burning properties.
TABLE 2. Advantages
Simple design Low risk of explosions Simple extinction of fire in the grinding system by stopping coal feed. No spread of fire into silos.
Disadvantages Combined operation with the kiln, therefore often not optimal operating conditions. High primary air up to 30% Mill shutdown = kiln shutdown Sampling for fineness control difficult
Simple Flame Control. Low primary air ratio. Water vapour from coal drying is not introduced into the kiln. Short mill shutdown -::t kiln shutdown Only one mill required for several kilns. E m lin f r finen s c n r l More complex installation requiring additionally dedusting filter. Investment cost higher than with a direct firing system (valid for one kiln only). More vulnerable to fires and explosions in gas ducts and filter. Risk of self-ignition of the pulverised coal in the storage silos.
Figure 1. Coal firing systems.
a'lrecf /1r1ng
indlrecf firing
~ ~-=-=-=---., firing !I
bin
raw
I
mlll
~m~
I~ :~.~
lnle1
mlll
Inlet - -... air
mlll
_ _ ... __ Inlet air
raw
coal bin
Bowen Basin 1995 - Symposium
93
Classification of humic coals for resource
characferisation(Draft ISO Standard) Grant W Quinn 1, Joan S Esterle2 & Judy G Baile/, 1 BHP Australia Coal Pty Ltd, 2 CSIRO Exploration & Mining, 3 Geology Department, University of Newcastle.
Most classification systems for coal are based on chemical properties and were developed by coal scientists, principally for utilisation purposes. There is a need therefore, for a standard system for resource characterisation and descriptively naming resource coals for international comparison. This Standard sets out a system of nomenclature which is applicable to all humic coals and which carries sufficient information to describe a coal in a simple and useful way. Coal is composed of organic particles, termed macerals, which are derived from macerated plant tissues. These macerals are readily identified by the relative reflectance of each maceral group and the internal morphology of each maceral. This makes maceral group composition a useful tool for classifying most coals. During thermal maturation, or coalification, coal macerals undergo progressive changes in physical and chemical properties as they progress through the coalification series from peat to anthracite. Many coal classification systems use changes in chemical properties, which can be measured by parameters such as volatile matter or carbon content, for classifying coals according to their position in the coalification series, termed rank. However, these properties are strongly dependent on maceral composition, so account must .be taken of coals of the same rank but with different maceral composition. No single property, even of one maceral group, provides a precise measure of rank, but vitrinite reflectance closely fulfils this requirement and has become the most widely accepted rank estimator. For this reason, vitrinite reflectance is also a useful property for classifying coals. The amount of mineral impurities in coal, commonly approximated as ash yield after combustion, is an important property from the utilisation point of view. Because of this importance, ash yield is also an important parameter in coal classification. In summary, these three properties, ash yield, maceral composition and rank are useful for classifying coals. The ECE-UN developed an International Classification of 'in-seam', as distinct from traded coals, based on the above concepts. This system has
been demonstrated to be applicable to both Euro-American Carboniferous and Inda-Pacific Permo-Triassic coals and is thus widely relevant on an international scale. For this reason it has been adopted here as the basis for the ISO standard. It is also significant that any classification of coals requires adoption of more or less arbitrary boundaries to distinguish classes or sub-classes. Thus individual coals may be inadequately assessed if their closeness to boundaries is ignored. The heterogeneity of coal, compounded by the inexactitude of coal analyses, makes coal a difficult material to classify and this variability must be recognised by any system of classification. An important modification in the ISO Classification is the introduction of indistinct class boundaries which acknowledges this complexity and provides a reasonable mechanism for addressing it. Finally, a simple Guide to Coal Utilisation is presented in the Attachment which is adequate as a first pass tool for evaluating the potential uses for a coal resource, given a few common chemical analyses.
SCOPE The primary scope of this International Standard is to provide an instrument which will permit the classification and naming of coals for the characterisation of world humic coal resources. A subsidiary objective is to provide a guide to coal utilisation. Such a guide is presented in the attachment which will allow a broad appreciation of the potential uses of a particular coal resource. Only humic coals are included in the domain of the classification, that is coals containing <25% of macerals in the Liptinite Group. This classification is not to be used. for commercial or trade purposes.
Normal trade practices make use of many coal properties at levels of appraisal best met by using analyses and test data directly, rather than incurring the severe approximations used in classifications and guides.
Bowen Basin 1995 - Symposium
94
REFERENCES Draft ISO/ Australian Standard 95064.
Sampling from coal seams
ISO 7404:3(1994)
Methods for the petrographic analysis of bituminous coal and anthracite - Part 3: Method of determining maceral group composition.
ISO 7404:5(1994)
Methods for the petrographic analysis of bituminous coal and anthracite - Part 5: Method of determining microscopically the reflectance of vitrinite.
ISO 1171(1981)
Solid mineral fuels Determination of ash.
METHOD This classification for resource coals is based on the following properties:Ash yield (percentage, dry basis), Macera} group composit\on (here represented by total vitrinite content ), and Rank (as represented by mean maximum reflectance of vitrinite, Rvmax.). 1
2
In terms of Ash yield, four resource categories of coal and 2 categories of associated rock are defined. Only the categories of coal are included in the domain of the classification. Low ash
$10%
Medium ash
>10$20 %
High ash
>20$30%
Very high ash
>30$50%
Carbonaceous rock
>50$80%
Rock
>80% ash
In terms of Macera[ Group Composition, three resource categories are defined on the basis of total vitrinite content, providing total liptinite is <25%: Low vitrinite coals
1
<40% vitrinite content
Medium vitrinite coals 40-60% vitrinite content High vitrinite coals 3
>60% vitrinite content
In terms of Rank, names are assigned to three primary resource categories: Low Rank
Lignite and Subbituminous coals (upper boundary 0.6% Rv max.),
Medium Rank
Bituminous coals (upper boundary 2.0% Rvmax.), and
High Rank
Anthracites (upper boundary 6.0% Rvmax.).
Within this framework, secondary categories are defined as: Rvmax. Low Rank
Lignite Sub-bituminous
$0.4% >0.4$0.6%
Medium Rank
Semi-Bituminous Ortho-Bi tu mi nous Meta-Bituminous
>0.6$1.0% >1.0$1.4% >1.4$2.0%
High Rank
Semi-Anthracite Ortho-Anthracite Meta-Anthracite
>2.0$2.5% >2.5$4.0% >4.0$6.0%
If the descriptions are applied to coals after mining and/or beneficiation, terms indicating sampled section, size fraction, and preparation state shall be included.
eg: 1. 2.
Raw coal, 100 x 0mm Bottom 4.Sm of the Main seam, 100 x 6mm, .washed and graded coal.
It is important to acknowledge that the boundaries defined above are not exact, but depend on the precision of the tests employed.
For the three classification parameters, viz. ash yield, vitrinite reflectance and vitrinite content, the tolerances at class boundaries are equal to the repeatabilities of the tests: Ash yield
±2%
[ISO 1171 (1981)]
Vitrinite content
±6%
[ISO 7404:3 (1994)]
Rvmax.
±0.06% [ISO 7404:5 (1994)]
It is important to emphasise that coals can and should be characterised by a variety of petrographic analyses for specific uses . In particular, the processing and utilisation behaviour of a coal will be dependent upon the full suite of maceral components, especially those of the Inertinite and Liptinite groups . Total vitrinite is usedhere for simplicity and I>ecause it varies inversely with the other macera1 groups .
Bowen Basin 1995 - Symposium
0.4
0.5
0.6
1.0
1.4
2.0
2.5
3.0
4.0
5.0
6.0 Rv max %
RANK
PETROGRAPHIC COMPOSITION _ _ _ _ _ _ _M_E_D..... IU_M_R_A_N_K_______~_H_I_G_H_RA_N_K_ _ _...-100 (% Total Vitrinite) 100 _____L_O_W_RA_N__K
80
80
66
66
HIGH VITRINITE
60 - - - - - - - - - - - - - - - - - - - - - - - - - - - - - - - - - - - - - - - - - - - - + - 6 0 0:1 0
~ ffl
::s 0:1
Ill
...::s
<I>
~
1.0 1.0
54 46
54 46
I I
MEDIUM VITRINITE
40 - - - - - - - - - - - - - - - - - - - - - - - - - - - - - - - - - - - - ' - - - - - - - + - 4 0 34
34
20
20
LOW VITRINITE
0 1---------+-- ----+------1- ---+----1---- 1------+----- -+-0 SEMI
V1
LIGNITE
SUBBITUMINOUS
ORTHO
BITUMINOUS
rJl
'<
0.4
9
0.5
0.6
1.0
1.4
2.0
2.5
3.0
4.0
5.0
6.0 Rv max %
',:I
0
...
<I>
s::
9
U)
D
J::.
::,
~
0
B~ as 8
J::.
18
!a: as
~ci
-='o
::iE
D
Ash (Hn % mass (db) 100
80
50
30
20
10
Dama.in of the classification
~ Not included in the classification
~8
i
:f
~
0
E8
<
c,(.)
~
J::.
J::.
~-~
J::.-
U)
J::.
0
Tole~nce Zone of Analyses Rvmax +0. 06% Vitrinite Content+ 6% Ash Yield+ 2% absolute (db)
CLASSIFICATION OF HUMIC COALS FOR RESOURCE CLASSIFICATION (Adapted from the ECE-UN In Seam Coal Classification, 1993)
= C11
96
USING THE CLASSIFICATION SYSTEM AND NAMING COALS To classify a coal, duplicate analyses of ash yield (dry basis), maceral group analysis and mean maximum reflectance in oil of all vitrinite are required . Samples shall be acquired according to (Draft Australian and Standard, 95064 / Draft ISO Standard). 1.The ash yield determines the Ash Class, e.g. High ash.
Combining the results of the above determinations results in a classification and a descriptive name for the coal. For Example: ASH VITRINITE % %
Rvmax %
NAME
Low ash, low vitrinite ortho -bituminous coal (seam coal, in situ). Low to medium ash, medium to high vitrinite, semi to ortho-bituminous coal (Washed coal, 38x0mm). Medium ash, medium vitrinite, semibituminous coal . (Washed coal, 50x0mm). Low ash, high vitrinite ortho- anthracite (washed and graded coal, 20x10mm). Low ash, medium to hi~h vitrinite su -bituminous coal (Raw coal, run-of-mine).
5
33
1.3
10
60
1.04
15
50
0.7
3
95
2.7
8
65
0.52
2.The total vitrinite content is then used to determine the coal Maceral Composition Class, e.g. Medium vitrinite. 3.The rank determination, Rvmax, is used to determine the Rank Class to which the coal belongs, e.g. Ortho-Bituminous. In cases where any of the analyses fall within the repeatability zone(s) of the test procedure(s), certainty of classification is not possible and the descriptors of both adjacent classes are applied. This acknowledges the real situation of the heterogeneity of coal and the inexact nature of coal analyses.
ATTACHMENT ISO GUIDE TO EVALUATING COALS FOR UTILISATION PURPOSES Whether in the seam or in the commercial state, coals vary widely in physical and chemical composition due to different conditions of peat formation, changes over geological time and the mining and preparation practices they have undergone. These variations affect a coal' s suitability for different uses. Suitability is also determined by the industrial plant in which the coal is used and the utilisation practices employed therein. Further aspects that are critical to the selection of coals and are usually over-riding influences, are the availability of suitable coals and the economics of mining and transport. There are a wide variety of coals available for commercial use and often the best balance is found by using blends of coals. The inherent technical flexibility of coal allows substitution of blend components, in whole or in part, when sufficient cost savings may overcome any operating disadvantages incurred by their inclusion.
Consequently it is most unsatisfactory to attempt to rigidly restrict given coals to specific uses. This is particularly so in the preliminary stage of resource coal evaluation. The method presented below provides a first pass appraising different coals, given a few common coal analyses.
METHOD When looking at how a coal can best be used, one simple process of appraisal is to compare its principal properties with those of coals in common use. This can be achieved by using simple, non-discriminatory charts. These charts provide a first level appraisal of a coal relative to other coals in use. The charts feature the following major fields of coal utilisation:
1.
Firing pulverised fuel power stations
2.
Coke making
3.
Pulverised coal injection into blast furnaces
4.
Firing cement kilns
Bowen Basin 1995 - Symposium
97
5.
Domestic heating and light industrial use
6.
Liquefaction
For these fields,the most commonly used coal properties and analytical reporting bases are:
1.
Volatile matter (air dry basis)
2.
Ash (air dry basis)
3.
Crucible Swell Number (CSN or FSI)
4.
Gross Heat Value (air dry basis)
5.
Total Sulfur (air dry basis)
other coal properties such as ash, CSN, gross heat value and total sulfur . It is necessary for users of the Guide to realise that it does not answer questions about the operation of a specific plant and that it does not commend or reject a coal. Rather, the aim of the Guide is to allow users to determine whether a coal is within typical ranges or not.
USING THE GUIDE The following examples show how the Guide may be used.
Research shows that there are approximate upper and lower limits for common usage that can be assigned to each of these properties in each area of utilisation. These limits have been extended to include cases where coals outside the most common range are used. The limits, and the ranges they represent, do not suggest that the coals lying within them are preferred for any reason, but merely report the common ranges and the less common ranges for coals of all ranks and states of preparation. As these limits are imprecise, specific values are not reported but a graphical representation allows them to be indicated. The charts are also flexible in that they are subject to review with changing trends in coal utilisation.
GUIDE TO COAL UTILISATION The charts for the commonly used coal properties combine to form the Guide to Coal Utilisation which may benefit by some explanation of how it may be used. Each property is presented in one chart for all fields of utilisation keeping the same sequence from chart to chart. Thus the first chart deals with volatile matter on the air dry basis. The common range of this property for coals suitable for being fired as pulverised fuel is shown as a solid strip. The range for other coals used (but not as frequently) is shown as a shaded extension.The boundary between the solid strip and the shaded extension is diffuse, indicating that they are approximate. The ranges of volatile matter for coals commonly used in other fields of utilisation are similarly displayed. The other charts can be used to gauge the common and less common ranges of
Suppose the properties of coals A and B on the air dry basis are: Property Coal A Coal B Volatile Matter% 27 45 Ash% 11 12 Crucible Swell N~mber (or FSI) 7 1 Gross Heat Value MJ/kg (Kcal/kg) 32(7600) 20(4780) Total Sulfur % 0.4 2.2
1 Equivalent terms are specific Energy and Calorific Value.
Reference to the charts shows that for coal A, many uses may be considered but in some instances such as cokemaking, the coal may be less appealing. Coal B may fit a liquefaction use but seems broadly difficult to fit easily into any of the current utilisation practices.
OTHER PROPERTIES TO BE CONSIDERED Total moisture, Hardgrove Grindability Index, top size, ash fusion temperatures, vitrinite reflectance and "fluidity" are other commonly determined properties that could supplement the first order appraisal. They have been considered as secondary order here as they are either more limited in their application over several fields of utilisation or require much more difficult analyses and so are used by the more skilled personnel at a more advanced stage in the evaluation. Similarly, other bases for the properties could be included. For example, in very detailed studies, carbon, hydrogen, volatile matter and gross heating value are best converted to the dry mineral matter free basis(dmmf).
Bowen Basin 1995 - Symposium
98
INTERNATIONAL STANDARD
AGUIDE TO COAL UTILISATION © 40
30
20
10
50
60 1 Pf 2 Coking 3 PC! 4 Cement 5 Household 6 Liquefaction
50
60
b
a
40
30
20
10
40
30
20
10
50
I•
2 Coking 3 PC! 4 Cement 5 Household
20 4
3
2
!
I
I
i
I
I 10
30
40
50
9
8
7
6
5
6 Liq"ofmmo
I
1 Pf 2 Coking 3 PCI 4 Cement 5 Household
__ __ __ __ __ _ _ _ _ ___.
___.
___.
___.
2
3
4
20
15
10
___..__
___..__
5
6
25
30
___..__ 7
__. 6 Liquefaction
___..__
9
8
40
35
I"'
2 Coking 3 PC! 4 Cement 5 Household 6 Liq,ofac,ioo
1.5
0.5
2
10000
8000
6000
4000
2000
2.5
3
3.5
4
1 Pf 2 Coking 3 PC! 4 Cement 5 Household 6 Liquefaction 1.5
0.5
2
2.5
3
3.5
4
1 Firing pulverised fuel power stations (Pf)
4 Firing cement kilns
2 Metallurgical coke making
5 Household/light industrial fuels, including
3 Pulverised coal injection into blast furnaces (PC!)
smokeless (a) and ordinary. (b)
6 Future liquefaction
Bowen B asin 1995 - Symposium
99
A comP.arison between the borehole image p__rqcessing_ system a_nq logging of orientea 'drill-core tn determtntng r,:acture characteristics within coal seams Dong R Choi, Raax Australia Pty Ltd, Canberra Gordon RS Saul, Garry Leblang and Associates Pty Ltd, Townsville
The prediction and control of methane emissions from coal seams depends on accurate characterisation of reservoir features. The two most important properties controlling degasification in reservoirs are gas pressure and permeability. Variations in gas pressure are subject to geological factors such as coal lithology and diagenesis, factors which are beyond the control of development technologies. Permeability of methane in coal is dominantly a function of in-seam fracture type, continuity, infill and density. These features can be readily assessed, allowing efficient design and implementation of degassing techniques. Determining fracture characteristics, in particular fracture aperture, should ideally be achieved within the reservoir. The Raax Borehole Image Processing System (BIPS) has the ability to determine fracture orientation, infill type and aperture, through the analysis of video images of borehole walls. The principal advantage this system has over analysis of oriented core is its potential to measure these features within the in situ stress environment.
An inclined hole was drilled as part of a coal-bed methane exploration program in the south-central Bowen Basin. The principal objective of this hole was to quantify fracture orientation, density and infill through a combination of Raax BIPS survey and analysis of oriented drill-core. Individual fractures imaged by BIPS were identified in core and compared, specifically to assess the accuracy of video image analysis. Both techniques accurately recorded the orientation of a N-S fracture set, however, an E-W set, clearly seen in core analysis, was not imaged well by BIPS. This is considered to be caused mainly by the difference in minerals filling two fracture sets: The E-W fractures are almost entirely occupied by dull brown clay minerals (illite and kaolinite), whereas the N-S fractures are dominantly calcite-filled, showing stronger colour contrast on images and making it easier to identify. Because both fracture sets have widths of 0.3mm or less in most cases, the BIPS obviously imaged grains up to 0.3mm in diameter. Determination of fracture widths and infills showed a wide variance between the two techniques.
This study based on BIPS images and core logging reveals features of fracture development in coal seams. The combination of BIPS and on-site core logging provides a powerful combination of methods to understand and record fracture systems. Geotechnical logging of coal seams is increasingly seen as indispensable for coal exploration including coal bed methane extraction.
INTRODUCTION A full understanding of in situ fractures in coal seams (cleats) is essential for coal exploration, extraction of coal bed methane, and safety in underground mining operations. They require a good understanding of the nature of fractures developed in coal seams and interseam burdens. Until recently however, no reliable tools have been available for depicting and orienting in situ cleats in coal seams except for an acoustic televiewer which utilises ultrasound beams. Recently an innovative borehole camera system has been invented by Raax Co. Ltd. (Kamewada & others, 1990), and has been introduced into Australia by Raax Australia Pty Ltd. The system has been used in many coal exploration projects in Australia to date. Late in 1994 Raax Australia Pty Ltd. and G. Leblang & Associates Pty Ltd. investigated coal seam cleats in one of the MIMs Moura holes for their coal bed methane project using the BIPS and on-site logging. Here we compare the results obtained by the two different techniques.
OUTLINE OF THE BOREHOLE IMAGE PROCESSING SYSTEM (BIPS) An outline of the BIPS has been introduced already elsewhere (see NSW Department of Mineral Resources, 1993). The system consists of field and analysis subsystems. Figure 1 shows an in situ setup with a sonde descending into a borehole, which is equipped with a depth indicator, an image processing and recording system, a sonde • controller, and a dual monitor. Figure 2 is another type of in situ setup, which has a sonde fixed to a rod for investigating boreholes drilled upwardly, horizontally or downwardly with
Bowen Basin 1995 - Symposium
100
The analysis subsystem is composed of a personal computer, a magnetic tape driver, a magnetooptical disk driver, a 70MB hard disk and software developed specially for this system.
Image proc essing unit Coble
TV camera Sande
Mirror
(a) Hanging type
Figure 1.BIP field subsystem illustrating semivertical hole survey.
The BIP field subsystem produces a 360° projection image by digitising the oriented projection image of a borehole wall that is easily scanned using a special mirror. Analogous image signals are transmitted through a TV camera set in the sonde. After conversion by analog/ digital converter, they are registered in the frame memory, and then 360° projection images processed by the CPU are recorded on the magnetic tapes and can be observed in the monitor screen through digital/ analog conversion. Conversion to a 360° projection image is carried out through built-in software and the processed images are seen on the monitor in real time. Field data in the magnetic tapes are copied onto magneto-optical disks in the laboratory for data analysis and permanent data archival. The 360° projection images are reproduced on cathode ray tube to measure the dip angles, strike and aperture of discontinuities. The results obtained are recorded on a floppy disk and used for stereoanalysis and statistical treatment. Specification of the BIPS is as follows. 1. Field subsystem Observed and recorded images
Actual images and 360° projection images with a standard scale are simultaneously displayed and recorded.
Maximum observation depth
1500m (coaxial and fibre optical cables; 60 °C)
Applicable borehole diameter
56-200mm
Applicable borehole direction
Any direction (upward and downward; downward holes <60° from the horizontal and all upward and subhorizontal holes require drillers assistance)
Recording speed
1- 90m/hour(average 54m/hour)
Recording method
Magnetic tapes and VTR
Resolution
0.15mm (borehole diameter at 66mm; actual image)
-------,
--------: ! ~---l--' : ! Monitor !!
~
I
L.~---....~-(b) Rod type
o
0
Image processin g unit
Figure 2. BIP field subsystem, illustrating upward hole survey.
angles <60 ° from the horizontal. Orientation of the hole is based on information of magnetic compass for semivertical and upward holes, and a ball bearing for low angle, subhorizontal, and sideward holes.
0.5mm (borehole diameter at 66mm; processed image) Colour tone
Bowen Basin 1995 - Symposium
Analogue (actual image) GB, 8 bits each (processed image)
101
2. Analysis subsystem
DRILL RIG
Computer system
PC (Windows, 486 or WIN CH COM PUT ER S higher microprocessor, 8MB RAM, VGA graphic card, SCSI board; MO -""T-~~~=:2::::!__ _ ___:~~~==z=......l::G!.:...1.:-L. disk drive)
Recording media
MT, HD, magnetooptical disk
Colour tone
RGB, 6 bits each
Hard copy
Video printer and 35 mm film
Analysis function
Others
Measurement of dip and strike of bedding, and width of apertures, tabulation, stereonet analysis (Wulffs, Schmidts), analysis of relaxation of rock mass, statistical study using AVTD method, fracture frequency. Reduction of images (arbitrary scale V /H), 3-D image models viewed from any angle.
BIPS STUDY OF MOURA A-1 SLANT HOLE Method of study
Field work: An application of the BIPS was made on coal seams in MIM Holdings Moura A-1 slant hole located some 20 km south of Moura town. The field work was carried out on 18 and 19 December, 1994 using the trailer-mounted 600m system (Raax Australia Pty Ltd., 1995a). The field work set up is shown in Figure 3. This setup was chosen to overcome problems in terms of the relative low angle and depth of the hole. However, it caused difficulty in adjusting to ground level and reduced effective cable length by about 40m. The depth was later adjusted with reference to density log depth during analysis. The survey involved several difficult technical problems in the initial stage. The hole was relatively deep (653m) and low angled - 46 • in the shallow section and 56 • in deeper sections, considered to be impossible to survey without help of drillers. In addition, the depth of the hole posed cleaning problem, as BIPS is based on visual image recording and requires clean water and clear borehole walls. Despite these difficulties, the survey was successfully carried out. The BIPS probe went down smoothly through several badly caved zones where previous logging tools had difficulty in getting through. The large weight of the BIPS cable (about 300kg at 400m in depth) and buoyancy by water coupled with smooth internal rod surface contributed to this success. Hole cleaning using a polymer and a thorough flushing-out with clean
---30m----Figure 3. Moura field work setting.
water was successful. Finally high quality BIPS images have been obtained from 370.00-555.30m. Because of the survey setting - sending the BIPS probe through the drilling rods, it was impossible to totally centralise the probe, which was about 10mm lower than the centre of the hole. This eccentricity caused slightly steeper dip measurement values (~2°) while strike stayed almost the same. The BIPS probe is equipped with magnetic as well as electronic compasses. However, these compasses, particularly the magnetic compass, are useful only for semivertical holes steeper than 80° from the horizontal. For angled holes like this one, the BIPS is equipped with a ball bearing which indicates the low side of the hole to orient images. Azimuth and dip of the hole were derived from directional data provided by MIM Holdings Ltd.
Data analysis: The field data in the magnetic tapes were transferred to magneto-optical disks to accommodate data processing as well as to permanently archive them. The software, BIPS Image Processing Program made by Raax Japan, was used for data processing. During the data analysis following hole parameters were used. Hole diameter
96mm
Azimuth of the hole 370.00-380.00m
276 • from true north
380.00-390.00m
275 • from true north
390.00-480.00m
274 • from true north
480.00-510.00m
273 • from true north
510.00-560.00m
272 • from true north
Inclination 370.00-560.00m
56 • from the horizontal
Depth adjustment 370.00-432.00m
1.2m deeper than BIPS depth
430.00-560.00m
0.75m deeper than BIPS depth
Bowen Basin 1995 - Symposium
102
The above parameters were incorporated in measuring dip and strike of fractures and other discontinuity surfaces as well as aperture width. All measurements were numbered and tabulated. The data analysis was made using Raax's Data Analysing Program run on windows software, and stereonet projections and diagrams were produced. In the first stage of the study, major features including fractures, faults, beddings/laminae and other sedimentary structures such as erosional boundaries were measured throughout the depth surveyed (Raax Australia Pty Ltd., 1995a). In the second stage, attention was paid to coal seam fractures (A, Band C-Seams), particularly to the coal seam C to map every cleat developed in the seam and visible on images (Raax Australia Pty Ltd., 1995b). In this study, fracture mapping was made on photographs enlarged to the half actual size in repeated comparison with computer images and photographs. The mapping results were examined by on-site core logging (Saul, 1995a), each measurement being compared and verified one by one wherever core was available. In the following section, partial results of this study focusing on C-Seam are presented as a sample study. Results
HIPS analysis: The BIPS imaged complete sections of coal seams as well as non-coal intervals with a theoretical resolution of 0.5mm. They clearly imaged areas with severe fragmentation and caving where cores had been unrecovered, and some logging tools could not reach and record (Figure 4). The analysis revealed two orthogonal fracture patterns in C-Seam as well as in A and B-Seams; N-S and E-W both with a high angle to the horizontal. Most of the N-S trending fracture set have been identified, measured, and tabulated. The N-S fractures intersect the bore normal to the azimuth, compared to E-W ones which are roughly parallel to the hole. BIPS observation showed that around half of the N-S fractures were open, and the remaining half were filled with white linings (calcite veins) with sharp boundaries (0.5mm or less). This results was verified by the core logging as described later. As the calcite width in core observation was around 0.3mm or less, the BIPS has depicted up to 0.3-0.4mm in width considering the intersect angle between fractures and borehole azimuth and the apparent maximum 70 % larger appearance of the width on the images. This has been considered beyond the resolution limit of the BIPS. It was noted that major open N-S fractures (1.0mm or
wider) were spaced regularly in all coal seams 50-70cm in interval (Figure 4). Compared to the N-S set, the E-W set was difficult to detect on the BIPS images, particularly in the first stage analysis. This was, as confirmed by core logging, due to the thorough mineralisation of the E-W set by clay minerals and their extreme thinness, <0.3mm. This was coupled with their orientation, being parallel with the borehole azimuth. On the BIPS images, the E-W set appears as a very thin, dull brown lines, and could be seen only on both sides of the hole where the clearest images were obtained (Figure 4). Because of this limited resolution and little continuation on the screen image, most of them have not been measured, resulting in the bias in statistic results (Figure 5). The fracture frequency diagrams (Figure 6) revealed distinct trends in mineralisation depths. Closed or tight fractures (calcite-filled) are developed mainly at the top and the bottom of the seam. Whereas, open and partly open fractures dominate upper and lower sections of the seam.
On-site core logging: Analysis of geotechnical features within oriented core is a commonly applied technique when seeking structural information. The working brief when this project was initiated specifically targeted characterisation of fracture orientation, width (aperture), infill type, density and length. Specifically concerned with fractures from within coal seams, the project sought to optimise the potential intersect by a proposed horizontal drilling programme, of features aiding permeability. All other fractures from interseam units, between the depths of 323.54m and 653.07m were also recorded. Fractures within coal seams were only measured where they penetrated two or more coal lithotype boundaries, features confined to a single lithotype were treated as cleats and not recorded. The first of these objectives, the accurate determination of fracture orientation was accomplished using a core orientation frame (Figure 7), developed by Dr. W. Laing and Mr. P. Givney of James Cook University, Townsville. This device allowed the reconstruction of the HQ (61mm) drill core into the original azimuth and dip of the inclined (46-56 °) drill hole, Moura A-1. The core was oriented within the frame partially by utilising orientation marks on the core provided by a downhole "spear'', and particularly by orienting the ellipse of bedding intersects. As the hole azimuth was perpendicular to bedding strike, this method was easily, and accurately applied. The measurement of fracture attitude within in-seam
Figure 4. Composite column showing BIPS images (3-dimensional and 360° projected), and interpretation. All solid lines indicate the N-S trending fractures, which are developed at the interval of 7-20mm. Though numerous, most of the E-W fractures were unable to measure in terms of their dips and strikes, because they were imaged only on both sides of the wall due to their extreme thinness and dull brown clay infills which showed little colour contrast with the borehole wall. As noted, core was severely fragmented between 540.20 and 540.80m and was not well recovered.
Bowen Basin 1995 - Symposium
103
DEPTH
3- D
( m) 540.00
--rn 0
;:o l'T1
I
VI
~
//
l'T1
;:o rr,
r-
-<
540.50
-n ::0 )>
G1
3: (T1
z
-c rr,
CJ
-- ------
/
I
/,/
',
'
~
541.0 0
1;, I
I
r
,/
E-W FRACTURE!TIGHTl
/
PARTLY OPEN FRACTURE
/
MAJOR OPEN FRACTURE
/
TIGHT FRACTURE
/
MINOR OPEN FRACTURE
Bowen Basin 1995 - Symposium
104
C-SEAM ALL FRACTURES
Figure 5. BIPS derived fracture orientation, C-Seam, Moura A-1. In C-Seam, only two E-W fractures were measured by the above reason. Most of the N-S semivertic,al fractures are well imaged and measured .
<<>> ****** % Diagram ****** T.N
... \ ·' - _/ 3'3/59\ '
I
--- ...... .._J
s
Schmidt (L.H) Depth : 538.749 - 541.314 m
Number of Data : 75
Aperture : 0.5 - 3.0 mm
and inter-seam units was carried out using a compass. All fracture orientation were then plotted on an equal angle (Schmidtt) stereonet to p reserve angular relationships. Fracture orientation results from a specific seam (C-Seam) are shown in Figure 8. A complete record of fracture characteristics from the Moura A-1 inclined hole appears in Saul (1995b). Fracture width was physically measured by vernier callipers where possible, elsewhere widths were measured by a steel tape or visually estimated. In general, fracture widths were recorded as 'trace', indicating that the average width was below 0.3mm (Saul, 1995b). Where infill material was present, it was often possible to extract this from individual fractures, adding calliper measurement. Infill type as determined by field characteristics was also recorded. The presence or absence of infills, along with the percentage of fracture surface covered by infill material was used to estimate the degree of fracture 'openness', as summarised for C-Seam in Figure 9. The spacing and length of fractures was determined normal and along the greatest penetration of features respectively. Where the N-S fracture set (Figure 9) continued through the width of the core a minimum length of ea. 16cm was measured, though these were treated as through going. The features that trended parallel to the core azimuth (E-W fractures) could be measured along their
length, and are recorded for C-Seam within Figure 9. A Comparison of "on-site" core logging results and BIPS results
As summarised above, the results from the two techniques (on-site core logging and BIPS) have yielded a strong correlation for many of the features recorded by both approaches. Specifically, the strong similarity between the ori~ntation data derived from the N-S fracture set pomts to the robustness of the two procedures when determining the attitude of well defined features. Figure 5 shows the orientation of BIPS determined fractures. When compared to fractures measured by on-site orientated core logging (Figure 8), the paucity of identified E-W trending fracture is clearly demonstrated . The width of these features are, in general, smaller than the N-_S ~~t, and . . . typically, infills are dominated by tlhhc/kaohmhc clays (Saul, 1995a), rather than calcite typifying N-S fracture infills, where present. The BIPS system may record brighter features, such as the milky white calcite preferentially, the bei_ge to wine . coloured clays simply not contrasting strongly with the borehole walls. Fracture aperture showed a considerable variance between the two methods (Figures 6 & 9). The BIPS results clearly indicate greater widths than those determined by on-site logging. The explanation for this may be three-fold:
Bowen Basin 1995 - Symposium
Crack Frequency (count) per 10 cm
- - - - - - - - - - - - - - - - - - - - - - - - - -- -- - - - - - - - - - - - - - - -- +-- 10 5
Width of Aperture (mm)
Crack Frequency (count) per 10 cm c:,,
s: 9
i
- 5 t. ~!~{·'
<'.~··
.,{-'
t °"
A ·'
,1 1 l !I I
I I
I I
l
T
1
I 538
I
I
I I
I
I
I
539
I
'
I
r
I
I
T
T
_,. .!·'
,:!fr"
✓,..o , s
('~~• ~·~~-'
T
'I
II
I
I
II
I I
I I I I
-~··
540
T
I
T
I
I
I 541
I
I
I
I
I
I i __J I
Width of Aperture (mm)
0
Hair Crack
I
542
Depth (m)
Figure 6. BIPS derived fracture features, including frequency (density) per 10cm, openness and width, C-Seam, Moura A-1. Note that the aperture widths indicated as 0.5mm are actually smaller than 0.5mm and simply show the limit of BIPS resolution. Tight (mineralised) fractures mainly occur at the top and the bottom of the seam, whereas the open and partly open fractures dominate the middle section.
106
core, these features are ubiquitous, and often exhibit a shiny broken surface, which may serve to reflect the downhole camera light source, appearing as a bright reflective feature. Potentially, these surfaces may be interpreted to represent infilled fractures. Fracture 'openness', or the degree to which fracture surfaces are coated with infill material are approximat ely similar as measured by both techniques (Figures 6 and 9). The type of infill material was sometimes misidentifi ed by the BIPS camera, thought the accuracy of infill determinat ion was quite high. This should be tempered by the apparatus's apparent failure to image clay infills, thereby biasing results toward features that it could readily identify. The density of fractures represents an important characterist ic which both techniques targeted . The on-site logging identified far more number of fractures than the Raax BIPS camera except for C-Seam which was most exhaustivel y analysed by BIPS (Figure 4). The ability to deal with physical core, particularly in this instance, allows many subtle or smaller features, below the theoretical BIPS resolution (0.5mm), to be recorded.
A Figure 7. James Cook University core orientation frame, showing; A) Basal protractor, fo r azimuthal control, B) Graduated scale for dip control, C) V angled seat in which core sits. The entire device is completely non-ferrous.
•
Downhole lithospheri c stress conditions are generally causing aperture extension.
•
Limitation within the resolution of the BIPS system, theoreticall y resolving apertures down to 0.5mm. The system may "see" smaller apertures, though the software is unable to measure below a set boundary.
•
The mechanical plucking of coal at the fracture / borehole wall intersect. As this occurs at relatively acute angle (ea. 35 °), the strength of the coal is insufficient to withstand the abrasion of the diamond coring bit. In
The comparison between fracture data as determined by two different techniques has served to highlight the advantages or otherwise of both approaches . The Raax BIPS downhole camera produces accurate determinat ion of major fracture orientation . This allows it to be applied in areas where coring is too expensive, or where the principal objectives of determinin g downhole fracture orientation s are not dependent on accurate determinat ion of small scale aperture width. An example of appropriate use may be in mapping highwall fracture systems. Future developme ntal work, ongoing within the Raax company, will continue to enhance this tools capabilities , Figure 8. Orientation of fractures within C-Seam, Moura A-1, as determined by on-site core logging. Fractures are plotted as po1es to planes, and then contoured on an equal angle stereonet.
• 1 pt. (1.72%)
-2%
I
- 4% - B'l'o
-r
-
16%
(Max.::32.7S°to)
58 Pts
~
Spherical Meari:: 82•-047 SµM rical V3nanc~ 0.~6 CalcuJated girdle : 6-222
Calcu/atoo beta .lxis: 84--042
Bowen Basin 1995 - Symposiu m
107
I
OPEN FRACTURES PARTLY OPEN FRACTURES CLOSED FRACTURES
FRACTURE DENSITY/M lnterval(m)
<3 <9 <20 <30 TG
Fracture length E-
FRACTURE DENSITY/M
Fracture length cm lnterval(m)
(:)
(:)
(:)
~
1,"'-
"~
1,'ti-
1,'o
<o(:)
<o(:) 1,"'-
-,"
<3 <9 <20<30TG
538.19
538.19
I
1111111111/
I
I
I
540.77
N-S fractures
E-W fractures
Figure 9. Features of fractures within C-Seam, Moura A-1, including openness, length and density, determined by on-site logging.
specifically in regard to present limitations in software. It remains an exciting tool, particularly in the determination of downhole 'in stress' fracture conditions. On-site logging of core appears to remain an important tool in the determination of fracture features, and will perhaps remain so in the area of infill determination , fracture type and in detailing very fine scale characteristics.
ACKNOWL EDGMENT S We thank Steven Davisdon and Roarld Brotherton of MIM Holdings Ltd, and Reed H. Meek of Conoco Australia Pty Ltd, Brisbane for their supervision throughout this study and permission for partial release of the proprietary data. Our thanks are extended to Peter Malpas, consultant, who organised the successful field work in Moura in December, 1994, and Bret Leisemann of CSIRO, Brisbane who gave valuable suggestions in improving the BIPS. Raax Co. Ltd., Sapporo, Japan supplied updated information of the BIPS and other borehole imaging systems.
REFERENC ES KAMEWADA, S., HOE, S. G., TANIGUCHI, S. & YONEDA, H., 1990: Application of borehole image processing system to survey of tunnel. In Barton, N. & Stephansson, 0. (Editors): Rock joints. Proceedings of the International symposium on rock joints. Loen/Norway, 4-6/June, 1990, 51-57. NSW DEPARTMENT OF MINERAL RESOURCES, 1993: New borehole image processing system . MINFO, 38, 10-13. RAAX AUSTRALIA PTY LTD, 1995a: Report on Moura A-1 slant hole borehole image processing system (BIPS) survey. MIM Holdings Ltd., Brisbane. RAAX AUSTRALIA PTY LTD, 1995b: Moura A-1 hole
borehole image study - coal seam fracture mapping-. MIM Holdings Ltd., Brisbane.
SAUL, G., 1995a: Comparison between seam and fracture characteristics using the Raax Borehole Image Processing System (BIPS) survey, and on-site fracture logging of core. MIM Holdings Ltd., Brisbane. SAUL, G. R. S., 1995b: Report on Moura Coalbed Methane Project. Moura A-1 inclined Drillhole, structural analysis. MIM Holdings Ltd, Brisbane.
Bowen Basin 1995 - Symposium
108
Bowen Basin 1995 - Symposium
109
The University_ of NSW pilla r design app_roach and its appl icati on to underground mine aesign issues in the Bowe n Basin JM Galvin & BK Hebblewhi te Departmen t of Mining Engineering , School of Mines, University of New South Wales
BACKGROUND The history of mining is blemished with major disasters involving pillars and innumerabl e incidents involving roadway falls. Several regional pillar collapses occurred between 1919 and 1959 in iron ore mines in the Lorraine District of France. All caused severe windblasts and seismic events, indicative of their suddenness . Twenty-nin e men died in the only two incidents to occur on working days. A major pillar collapse in a German potash mine in 1958 caused perceptible ground movements for an average radius of 19kms. In 1960, all 437 undergroun d workers at Coalbrook Colliery in South Africa were killed when more than 4,400 pillars failed in a five minute period. Over 7,500 pillars failed in a few hours. The seismic event was recorded 720km away. Fortunately , events of such magnitude are rare. However, the Australian coal mining industry has not been immune from similar but smaller scale incidents in the last decade and is indeed fortunate that major loss of life was probably avoided because most of the events occurred during shutdown periods. In NSW and Queensland in the last 15 years, there have been over 15 unplanned regional collapses of pillar workings. At least six of these were sudden (virtually instantaneo us) and occurred in active working sections. On four occasions, the mine was idle; on one occasion, the panel was broken down and on the other occasion, the workmen had just withdrawn . Four regional creep events have also occurred, three of which caused loss of main developme nt. Thus, unless mining engineers can state with conviction that pillar failure mechanism s are now well understood and pillars are designed on the basis of sound engineering principles, there is no room for complacenc y (Salamon, 1989). Mining engineers cannot make the statement categoricall y. However, the knowledge base on pillar failure mechanism s has been sufficiently advanced that the pillar design approach presented in this paper is sufficient to have enabled all 15 unplanned failure events in NSW and Queenslan d in the last 15 years to have been pre-empted.
This knowledge base is also a critical element in developing an improved understand ing of roadway behaviour and reinforcem ent since pillar behaviour and roadway behaviour are interactive. 34 fatalities due to falls of roof and sides in NSW coal mines in the last 10 years attest to the need to develop an integrated understand ing of roadway and pillar systems. The outcomes of research aimed at advancing the understand ing of pillar behaviour mechanism s will not withstand engineering scrutiny if they are not developed in the context of the overall mining system, i.e., pillar, roadway, pillar roof and floor contacts and surroundin g strata. Given the increasing use of longwall mining systems, it could be assumed incorrectly that the need to develop an improved understand ing of coal pillar mechanics has diminished . On the contrary, this need is just as great since soundly engineered outcomes are required for understand ing and improving roadway behaviour and support procedures , rib stability, chain pillar design and regional creep control in longwall mining. As an indication of the importance of sound pillar design in current mining practice, the following summary from recent Australian mining experience illustrates the costs and serious consequenc es of 'getting it wrong' . Pillar Instability: Mine A
$6 000 000 compensati on bill for surface damage.
•
Mine B
Loss of two continuous miner sections including all section equipment.
•
Mine C
Loss of approval to extract significant areas of lease under surface features.
MineD
Curtailmen t of one longwall operation, loss of access to future reserves.
Mine E
Loss of production section including all section equipment .
Bowen Basin 1995 - Symposiu m
110
Industry
database which contains the information necessary to evaluate the influence of these variables.
Loss of insurance coverage for creep events, significant increase in insurance premiums, increased community resistance to mining.
(2)
The application of mechanical engineering principles to the geological environme nt in order to gain insight into the physical processes involved.
(3)
Review of field performanc es where operating mines are utilised as a full scale testing 'laboratory'.
(4)
Rigorous probabilisti c analyses to quantify levels of risk associated with the knowledge base.
UNSW RESEARCH PHILOSO PHY The Departmen t of Mining Engineerin g at UNSW has been active for several years now in a research program targeted on strata control aspects of coal mine design. This research has been financially supported by the NSW Joint Coal Board . Although based on considerab le NSW mining experience and data, the project has included Qld case histories in the database and the outcomes are equally applicable in NSW and Qld . Underlying the research program has been a strong and consistent philosophy regarding the question of strata mechanics in undergroun d coal mines and the appropriate research approach to deal with this topic. This philosophy should be carried through into practical mine design. The philosophy could be summarise d as follows: Mining causes a change in loading conditions in the rockmass. As with other engineering structures such as bridges, dams and jumbo jets, rock response to load obeys basic principles of physics and mechanics. However, engineers in other fields have well-define d material properties and loading environme nts to work with, compared to mining engineers, who are at the mercy of nature with materials of variable geological and mechanical properties. In addition, the mechanical properties of rock are also very size and environmen t dependent. Severe limitations are, therefore, associated with laboratory testing, with measureme nts being relative (to a standard) rather than absolute. In order to address these intrinsic problems associated with rock mechanics, the research undertaken by the UNSW Strata Control for Coal Mine Design (SCCMD) Project has been based on the following fundamenta l principles: (1)
The methodolog y of empirical research which recognises that, in most instances, it is not possible or practical to analyse a real engineering problem exhaustivel y in terms of all possible variables. Therefore, a realistic approach is adopted that involves the investigatio n of the effects of the most important on primary variables. Success is dependent on identifying all the primary variables and having a
Trial and error, curve fitting and experiment al panels are not adequate nor acceptable design tools on their own.
UNSW PILLAR DESIGN PROCED URE This paper presents the key component s of the UNSW Pillar Design Procedure which is one of the outcomes of the SCCMD Project. Methodolo gy
A coal pillar comprises the pillar itself, the roof and floor strata and the pillar roof and floor contacts. Pillar systems may collapse gradually, in which case there is ample warning, or suddenly to the point of being instantaneo us. In general, pillar system failures initiated by roof or floor failure develop gradually. Sudden collapses are usually associated with pillar system failures involving competent roof and floor strata in which the coal pillar itself fails. These failures present the greatest hazard to personnel as evidenced by experience. The UNSW Pillar Design Procedure applies to coal pillar failure mechanism s in a geological environme nt comprising competent roof and floor strata. Weak roof and floor strata would warrant larger pillar sizes than those computed by this procedure. The design of such pillar systems, however, would need to be conducted utilising specific strata properties. The overall design methodolog y follows the logical decision making process illustrated in the flowchart (Figure 1). Figure 2 illustrates the principal influences in the design process, which consists of the following discrete steps: •
Decide on what is a tolerable, or acceptable level of risk. Risk equals probability of failure x consequenc e of failure. Both component s must be carefully considered .
•
Determine an appropriate 'design' Factor of Safety (FOS) which reflects this level of risk.
•
Select mining dimensions .
Bowen Basin 1995 - Symposiu m
111
IPR<XEED
I
DETERMINE TOl.ER,A,BLE LEVEL Of RISK !Risi:= Probal>lity o/ Failure x ConsequenceJ
s
forms of pillar strength relationships have been quantified by this analysis; a power law formula, and a linear formula. A marginally higher confidence level is associated with the power law formula.
PILLAR WORKING LOAD
DETERMINE PII..IAR L04D
DETERMINE PII..IAR STRENGTH
The Pillar Working Load is the maximum load that the pillar will be subjected to. This is determined by both the stiffness of the surrounding strata and the stiffness of the coal pillar. When a mining panel is narrow compared to its depth, the roof strata is stiff and it arches across the panel. Therefore, the total dead weight load of the overburden is not transferred to the coal pillar. As the panel width to depth ratio (w/h) increases, the stiffness of the roof strata reduces until it is incapable of arching across the panel. In this case, the full dead weight load of the overburden has to be supported by the pillars.
0'.LCI.JVJE
FKTOR OF WETY
Figure 1. Pillar design decision.
In an extensive layout comprising pillars of regular size, pillars are of equal stiffness and, therefore, share the load equally. The Pillar Working Load is the dead weight of overburden within the pillar's area of influence, shown shaded in Figure 3. This is referred to as Tributary Area Load. The load divided by the plan area of the pillar equates to the Average Pillar Stress, crp. In an extensive layout comprising pillars of irregular size, the pillars with the greater width to height ratios are subjected to more load because they are stiffer and, therefore, provide greater resistance to roof sag. Advanced numerical techniques may be required to calculate Average Pillar Stress in these layouts.
Probabllly ofFallu'e
~~~~h~
H
ls supported by pillar
a, = 0.025H c ,c 1
w,w,
Figure 2. Principal influences on processpillar load, strength and Factor of Safety.
•
Determine pillar load and strength for selected mining dimensions.
•
Calculate the pillar Factor of Safety.
•
Check stability compliance between the calculated and design value of FOS.
•
Check pillar dimensions for mining operational compliance (e.g., wheeling, flit distance, ventilation, spontaneous combustion, etc.).
The design methodology has evolved from a probabilistic analysis of field performance of pillar systems in New South Wales and Queensland. Two
Figure 3 Tributary Area Load
Bowen Basin 1995 - Symposium
( MPa)
112
Pillar loads have been calculated mathematicall y for various width of panels and are shown as a function of Tributary Area Load, Figure 4. Pillar load ranges from 50% of Tributary Area Load for a single pillar panel to 95 % for a 7 pillar wide panel. The extent of load reduction depends on the stiffness of the surrounding strata. Stiffness can be difficult to quantify and may vary considerably. Therefore, pillar design should be based on full Tributary Area Load irrespective of the width to depth ratio (W/H) of the panel and the nature of the surrounding strata.
the strength of rock in compression when it is subjected to a specific confining pressure. The compressive strength of rock increases significantly with increase in confining stress. This accounts for why lateral confinement provided to a pillar by rib bolts, mesh, wire ropes and stowage can result in a significant increase in pillar strength. Conversely, rocks are typically ten times weaker in tension than in compression. The strength of fissured rocks, such as coal, is volume and shape dependent. For a given shape, the strength of coal decreases as the volume of the specimen or pillar increases. For example, the strength of a 1.5m cube of coal is only about 14% (1.7) that of a 25mm cube of coal. This means that laboratory testing grossly over-estimate s the field strength of coal. The reason that strength reduces as size increases for a fixed shape specimen is that more and more weaknesses are contained in the rockmass. The strength of coal increases as the width to height ratio of the specimen or pillar increases. One of the reasons for this behaviour is that as height is held constant and the width is increased, the strength of the core of the pillar increases due to the increased amount of confinement provided by the outer coal to the core.
-- • • -- •••• • •• ••• • 0
2
No.
3
5 7
s
4
5
e
7
□□□
i=
1
2
3
4
5
6
7
Figure 4. Pillar panel loading.
PILLAR STRENGTH The strength of any material or structure is defined as the maximum load it can support per unit area. Since 'load per unit area' is defined as stress, strength can also be defined as the greatest magnitude of stress which a material or structure can support. No unique value of strength can be given for rock. The strength of a piece of rock is a function of its volume (size), its shape, the amount of confinement provided to its sides and the direction of the applied stress. Uniaxial Compressive Strength (UCS) refers to the strength of rock in compression when it is not confined. Triaxial Compressive Strength refers to
One of the best examples of the influence of shape is shown in Figure 5, Wagner (1974). Large scale in situ coal pillars were loaded to destruction using a displacement- controlled loading system comprising 25 x 500ton hydraulic jacks. The figure shows the distribution of vertical stresses in the centre plane of a pillar at different stages of pillar compression. Three important points emerge from this field investigation: 1. The load-bearing capabilities of the pillar corners and, to a lesser extent, pillar sides, are small compared with those at the centre of the pillar. This highlights the influence of confinement on the strength of adillar. The corners and sides are the le·a st confine portions of the pillar whereas the central portion is subjected to the greatest confinement. 2. The central portion of a coal pillar is capable of withstanding extremely high stresses even if the circumferentia l portions of the pillar have already failed. 3. The distribution of stress across a pillar is not uniform, especially once pillar load exceeds about 2/3 pillar strength. Hence, pillar design based on average pillar stress calculations must make allowances for peak pillar stresses. Pillar strength in the field is also a function of the nature of the roof and floor contact surfaces and strata. Under load, a coal pillar wants to expand laterally. Friction and Cohesion along the roof and floor contacts generate resistance to this movement. This resistance increases as the area of the pillar
Bowen Basin 1995 - Symposium
113
PRINCIPAL PILLAR STRENGTH FORMULAE Numerous pillar strength formulae exist, many are very similar and nearly all are of one or other of the following two forms: Linear Form:
; 100
.. (1)
e. Ill Ill
CD
!:,
Power Form:
75
(I)
~ a. 50
.. (2)
CD Cl
e 25 CD
C
= Pillar Strength k1, k2 = Measurement of the compressive
Where: Sp
~
0
5
10
15
strength of coal material
20
w h A,B
Pillar compression (mm)
= Pillar Width
= Pillar Height =
Field or laboratory derived values
(A+ B = 1)
a,b
Figure 5. Distribution of vertical stress in a pillar undergoing compression (after Wagner 1974).
= Field or laboratory derived values
(Note that both types of formulae recognise the effect of pillar width to height ratio, w/h, on pillar strength). An example of each type of formula is:
increases, that is, as the width of the pillar increases. The resistance at the roof and floor contacts generates lateral stresses which help to confine the pillar and, thereby, increase its load carrying capacity or strength. The beneficial strengthening effects of friction and cohesion at the roof and floor contacts decrease with vertical distance away from the contacts towards the mid-height of the pillar.
Sp = 6.4[0.62+ 0.36(~]
(MPa) .. (3)
(Bieniawski, 1967) (MPa) .. (4) (Salamon & Munro, 1967)
This behaviour also accounts for why:
Pillar strength increases as pillar width to height ratio, w/h, increases. •
•
Pillar strength is dependent on both the shape and volume (size) of the pillar. In strong roof and floor environments, pillar failure is initiated at mid-height, giving an hourglass shape. When roof and floor contacts are well-bonded, the need of the coal pillar to expand under load can induce horizontal stresses capable of buckling and shearing floor and roof strata.
•
Pillar strength formulae of the linear form do not recognise the effect of volume on pillar strength. However, it can be shown that power law formulae do take account of the effect of pillar volume on pillar strength. Equation 4 can be reduced to the form of Equation 5.
Laboratory strength results differ so much from field strengths.
R0.59
Sp = 7•2 yo.061
where
R
= w/h ratio
V
=
. .(5)
w 2h = pillar volume.
Qualification of field strength, therefore, needs to be based on an analysis of the actual field performance of full scale pillars, both failed and unfailed. Even then, it is still not practical nor realistic to measure all rock mass and geological variations and input them into the design. The established engineering design methodology in these circumstances is to utilise probabilistic
Bowen Basin 1995 - Symposium
114
40
/ 35 --unear ---h•1 .5 m, Power ..... h-3 m, Power h=4.5 m, Power -h=6.0 m, Power --h=7.5 m, Power h=9.0 m, Power -
-ea 30
a.
~ II) II) Cl)
--=-
25
... en... 20 .!!!
...ea
V
/ v/
_0·
v~v
~[/2 ~
--~
~~~ ~~ ~
a:
Cl) C)
/ v/
15
~ ~ ;;,:::::;--~ ~~ __.....-J
Cl)
>
< 10
~
-~
2
3
I~
,' = - '
5
0 0
4
5
7
6
8
9
10
11
12
Width/Height (w/h)
Figure 6. Pillar strength relative to width/hei ght ratio (w/h).
statistical methods to quantify the degree of variabilit y and uncertain ty in the design due to these factors (major geological disturban ces or features still need to be assessed separately ). A probabilis tic analysis of collapsed and stable bord and pillar workings has been performe d on field data from NSW and Qld coal mines. Australia n paramete rs for the two most universal forms of pillar strength formulae, namely the linear form (e.g., Bieniawski) and the power law form (e.g. Salamon & Munro) were quantifie d from this probabilis tic analysis. The analysis is based on calculatin g the pillar working load at the time of failure. The statistical analysis involves fitting values to variables contained in the pillar strength formulae that obey the principles of empirical research (i.e., they include the primary variables that control the physical process) until the scatter of predicted strength values is minimise d with respect to computed failure loads. Stable as well as collapsed cases are weighted in the statistical analysis. The standard deviation is the measure of the degree of fit (or conversely, scatter). The paramete rs which yield the maximum likelihood of predictin g the field performa nce within the range of the Australia n database (w/h = 1.07 to 10.6) are: UNSW Linear Formula:
UNSW Power Law Formula: (a) For w/h <5 (MPa) . (7) (b) For w/h ~5
(Squat Pillars)
Sp=19.24
(MPa) . (8)
(Standard Deviation = 0.0735) Figure 6 plots the two formulae relative to width / height ratio, using multiple values of pillar height (up to 9m) for the power law formula. This figure illustrates the influence of volume on pillar strength and the care which must be taken in thick seam applicatio ns commonl y encounte red in the Bowen Basin. The power law formulae fit the Australia n database slightly better than the linear formula as shown by the lower standard deviation . This is primarily because, unlike the linear formula, the power law formulae take into account: •
the exponent ial increase in lateral confinem ent generated within pillars as w/h increases; the effect of pillar volume on pillar strength.
(MPa) .. (6)
(Standard Deviation = 0.0863)
The probabilistic analysis has shown that pillar strength in the field is largely independ ent of the material strength of the coal seam once wlh
Bowen Basin 1995 - Sympos ium
115
exceeds 2. This behaviour is consistent with field strength being dominated by the w/h ratio and the associated lateral constraint that this parameter generates. It is also consistent with the findings of the Mining Research Establishment of the National Coal Board (UK) reported by Evans and Pomeroy in 1973: " ... at atmospheric pressure (no lateral confinement) there is a 14:1 ratio between the strongest and weakest coals while at 5,000lb/in 2 (34MPa) confining pressure the ratio is only 2:1. This latter ratio is reduced to about 1.25:1 if the results for anthracite are excluded. In other words, the strengths of almost all coals are virtually indistinguishable at high confining pressures" .
The Australian database is moderately small (30 cases) and it is plausible that some critical factors may be absent. The largest database of collapsed and stable pillars assembled is that of Salamon and Munro in South Africa (125 cases) . Because pillar strength is largely independent of coal seam material strength, it is reasonable to compare and to combine both databases in order to check for inconsistencies. Close correlations were obtained in both cases reaffirming that pillar strength is largely independent of coal seam material strength. The strength parameters for the linear and the power law formulae differed by only 5% and 3% respectively. In all cases, a lower standard deviation was associated with the power law formulae (0.0689 to 0.0735) than the linear law formulae (0.0776 to 0.0863). Probabilistic analysis is a far more rigorous mathematical process than curve fitting. It assigns a statistical significance to stable as well as to collapsed cases, although collapsed cases carry a much higher weighting. Determination of Factor of Safety The use of Factor of Safety (FOS) is a means of incorporating acceptable and tolerable levels of risk into engineering designs. Risk
=
Probability x Consequence
Risk is the product of the probability and the consequence of an unwanted event, in this case, a pillar instability or failure.
When the consequences of failure are serious, a reduced probability of failure needs to be adopted in order to achieve an acceptable level of risk, e.g., when mining a panel of pillars, the normal acceptable level of risk in terms of probability of failure is 3 in 1000. However, this probability of failure would be unacceptable for a more serious consequence of failure, such as sudden flooding of the workings. In this case, a probability of failure of at least 1 in 100 000 may be chosen as representative of the tolerable level of risk, considering the seriousness of the consequences.
For coal pillars: Factor of safety
= Pillar Strength
'Pillar Load'
The probabilistic analysis of field performance data from mines in New South Wales and Queensland has defined the relationship between Probability of Failure and Factor of Safety (FOS). The table below lists the appropriate FOS to be used with either of the UNSW formulae in order to achieve the required Probability of Failure which is consistent with the acceptable or tolerable level of risk for the pillar design. Probability of Failure 8 in 10 5 in 10 1 in 10 1 in 100 3 in 1000 1 in 1000 1 in 10 000 1 in 100 000 1 in 1 000 000
FOS (Linear) 0.84 1.00 1.29 1.59 1.72 1.85 2.09 2.33 2.57
FOS (Power) 0.87 1.00 1.24 1.48 1.59 1.69 1.88 2.06 2.23
On the basis of previous mining experience, a probability of 3 in 1000 is regarded as representing an acceptable level of risk with respect to a bord and pillar based production panel (where pillar life expectancy is in the 1-3 year range). As pillar requirements, with respect to lifetime or consequence increase, lower probabilities of failure are required to minimise the risk and hence, higher values of FOS need to be adopted. In some instances, the two forms of pillar strength formula generate nearly identical values. Nevertheless, the table of Probability of Failure and Factor of Safety indicates that a higher risk is assigned to the use of the linear formula. This apparent anomaly is a consequence of the greater scatter of data (hence, higher standard deviation) associated with the linear formula. This is one of the reasons why the UNSW Pillar Design Procedure recommends the use of the power law formulae in preference to the linear formula. Because this procedure has been developed on a probabilistic basis, it needs to be reviewed periodically as the database expands and the understanding of pillar mechanics advances.
GEOLOGICAL FACTORS The preceding sections of this paper have outlined the engineering approach to pillar design which is incorporated in the UNSW Pillar Design Procedure. In applying this procedure to a diversity of geological environments, it is important to recognise the significance of geological features to the engineering behaviour of a coal pillar system. Some of the major geological features which have a bearing on pillar system behaviour are summarised below.
Bowen Basin 1995 - Symposium
116
Significance to Pillar Design
Feature
(a) Structural defects within the coal pillar > Larger structural features such as fault planes, slickensides or major cleat planes can significantly reduce the effective pillar width (especially in thiclc seams) resulting in reduced load carrying capacity. > Microstructure causes significant variation in 'laboratory strengths' of coal. These start to influence and dominate the 'geometric factors' once (w/h) ratio falls below 2. > Greater stiffness increases ability for load to span or bridge (b) Stiffness of surrounding strata (determined by strata tfiickness, elastic across panels, or failed pillars. modulus) > Stiff strata above a goaf area can cause excessive side abutment loading on pillars. > Stiff strata can generate regional creep effects across large areas of pillars. Strategic use of barrier pillars between production areas and regimes of partiaf/ full extraction is a control measure. > Stiff strata can dictate the mode of pillar failure (dependent on relative stiffnes~ between strata and coal).
'pillar system' fails due to roof/floor foundation failure. > These have the effect of reducing the induced lateral confinement of pillar coal which would normally gen- erate greater pillar strength.
> Coal pillar may remain stable, but the
(c) Weak roof and/or floor (d) Weak bands or slippery contact surfaces within or aajacent to the coal pillar
CONCLUSIONS
REFERENCES
A probabilistic approach to underground coal mine pillar design has been presented in this paper, giving engineering design principles based on design to acceptable levels of risk in a geological/geotechnical environment of numerous variables and changing hazard levels.
BIENIAWSKI, Z.T., 1967: An analysis of results from underground tests aimed at determining the in situ strength of coal pillars. CSIR Report MEG 569, Pretoria, South Africa.
This approach finds particular application in the Bowen Basin. The UNSW Pillar Design Procedure recognises many of the issues which prevail in the Bowen Basin, including thick seams and their influence on (w/h) ratio and pillar volume; the dominance of pillar geometric factors over laboratory coal material strength factors in all but very low (w/h) ratio pillars; the need to recognise and take account of roof and floor strata properties and pillar contact surfaces as part of the overall pillar system and the effect of any structural geological features on pillar integrity when determining the overall loading regime and system strength.
EVANS, I. & POMEROY, C.D., 1973: The Strength, Fracture and Workability of Coal. A Monograph on Basic Work on Coal Mining Carried Out by the Mining Research Establishment, National Coal Board . Pergamon Press. SALAMON, M.D.G. & MUNRO, A.H., 1967: A study of the strength of coal pillars. Journal of the South Afrrican Institute of Mining and Metallurgy, 67.
SALAMON, M.D.G., 1989: Design of Pillars for Partial Extraction. Geotechnical Considerations in Mine Design. Key Centre for Mines, University of New South Wales, Sydney, July 1989. WAGNER, H., 1974: Determination of the complete load-deformation characteristics of coal pilfars. Proceedings of the 3rd Congress of the International Society of Rock Mechanics, Denver, CO, USA.
Bowen Basin 1995 - Symposium
117
Seismic monitoring for mapping of longwall caving at tiordonston e Mine 1
1
2
.
1
Peter Hatherly , Xun Luo , Byron McKavanagh , Robert Dixon & Derek Devey3 l. CSIRO Exploration and Mining 2. Central Queensland University, Rockhampton 3. Gordonstone Coal Management
Detailed seismic monitoring was carried out at Gordonstone Mine to map the extent of fracturing associated with longwall mining in the German Creek Seam. The height of fracturing appears to extend to just above the Aquila Seam, and does not intersect overlying Tertiary aquifers. This agrees with observed conditions at Gordonstone. Seismicity is strongly correlated with periods of longwall production, and occurs mainly within a zone from 50m ahead of the face, extending obliquely upwards to 100m above the face, and 30m below. This is believed to represent the abutment zone of peak mining-induced stress. It is inferred that the dominant failure mechanism in this zone is a horizontal thrust producing a shear failure oriented towards the goaf.
INTRODUCTION Gordonstone is a new underground mine in the Central Bowen Basin some 50km from Emerald, shown on the location map of Figure l. The German Creek Seam is being mined by retreating longwall panels which are currently of 250m width and at a depth of about 230m. There is typically 170m of Permian cover with a further 60m of Tertiary volcanics and unconsolidated sediment extending to the ground surface. In places, the unconsolidated sediments are highly water charged. Breaching of these aquifers is unlikely at Gordonstone, but other mines in the vicinity have less Permian cover, and the possibility of significant water inflows is of concern. The primary aim of this project was to define the maximum height of fracturing above longwall panels in the prevailing strata conditions. Knowledge of the dynamics of fracture development is crucial to an understanding of water inflows. Numerical modelling has been used extensively to determine the stress redistribution and failure paths associated with longwall panels, but direct monitoring of stress concentration and strata fracturing is clearly advantageous. Seismic monitoring was used at Gordonstone because of the ability of this method to locate remote points in the rock mass where failure has occurred, and to track the time history of these failure fronts as they propagate in relation to mining. The technique is therefore very useful in monitoring the active failure area in a longwall panel. Less costly techniques involving extensometers or piezometers do not compare well for this purpose in that such
measurements only refer to the point of application of the sensor. Seismic sensors do not have to be placed directly in the failure zone and they can monitor post-failure behaviour. The geological setting of Gordonstone Mine is described by Kelly & others, 1994. Figure 2 shows the stratigraphic column for RDH Hole 964 based on borehole logging and chip analysis. Notable features of the strata are weak roof and floor to the German Creek Seam (UCSs are 8-10 and 8-12MPa respectively), caused by high clay content in the rock units, and extreme lateral variability in rock units. Rocks become coarser and stronger upsection. At 13 m into the roof, the UCS is 50-60MPa. The dominant horizontal stress direction around LW103 is NNE, parallel to the Panel and sub-parallel to the dominant coal cleat and strata joint directions.
EXPERIMENTAL DETAILS The locations of the seismic stations are shown in plan view in Figure 3, superimposed on the longwall roadways. In each of the three boreholes shown, 8 triaxial geophones were cemented from below the German Creek Seam level through to the base of the Tertiary. For each hole a ninth geophone station was located at approximately 10m depth. Each of these stations consisted of 14Hz geophone elements arranged orthogonally. Central Queensland University (CQU) installed three component seismometers (2 Hz) at locations SSl and SS2 on Figure 3. Three piezometers were installed in hole 967 at the levels of the Corvus, Tieri 1 and Pleiades Seams. All data were cabled to a secure central recording site, where mains power was available from a diesel generator. The equipment at this site was mainly developed by CSIRO. The CSIRO seismic system was designed to monitor 27 triaxial geophones (81 channels) sampled at lkHz and to discriminate the events from noise. In order to achieve the high level of performance required, a parallel processor system was used. This system utilised six 486 CPUs linked to a controlling 486 PC computer. The multi-processor nature of the acquisition system allowed for powerful processing of the raw samples from the geophones without affecting the PCs operation. In fact, the PC's performance was limited by the rate
Bowen Basin 1995 - Symposium
118
152" 20
·-~ r
-'-/...._·,~--
0
Oepod
■
Township
"-./
,..· ._-;
. Figure 1. Location of Gordonstone Mine and other Coal Mines and Infrastructure in Central Queensland.
SURAT 'BASIN
Railway, Haulage RoU1e
Coal Measure
..,._ 8il)ortPort
at which events occurred not the sample rate, the complexity of the discrimination algorithm or the number of geophones being monitored. Events were then passed to a UNIX workstation (Silicon Graphics Indy) running the ISSI (Integrated Seismic Systems International Ltd, Welkom, RSA) seismic analysis software, XMTS. The workstation included an EXABYTE tape drive for mass storage and modem link through a mobile phone for remote communication and operation from our Brisbane office. The Appendix provides more details on the CSIRO system. Central Queensland University (CQU) also monitored the activity detected at SSl, SS2 and selected borehole geophones using seismographs and methods detailed previously in McKavanagh & others, 1995. Installation and commissioning of this equipment took place during July and August 1994. Continuous monitoring then occurred until
completion of LW103 early in November 1994. To calibrate the system a series of surface and deep borehole shots were fired into the array in September 1994. Other data monitored for correlation purposes included: • Piezometer pressures. Longwall production, and support pressures. Strata behaviour /structural mapping in gateroads.
SEISMIC DAT A More than 1200 events were recorded during the experiment. Approximately 40% of the events were rejected from data processing because their P-wave arrivals were so emergent (indistinct) that reliable first arrival times could not be recognised from the records. In all, 629 events which occurred in the period from 16/09/94 to 29/10/94, with sharp first P-arrivals were processed. We found that events
Bowen Basin 1995 - Symposium
119 2
C.-J•UIIAT>
14
CEl.TAT
UC£CM 7501
C.cphaie L001licn
STRATIGRAPHIC SECTION B07 ➔ * 100
6
(Cepth in metres)
0
4
DENcSS>
CALIPEF:
G/CC
CM
2 . 50
12.50
15
(1 01. 0)
.. . -.-
121.65 122.65 123.60 124.05
-
... Pleicdes Upper Seam 'p' Tuff
:-:-:
:=
.s::•-i--iI
-
- - i - - - - l - -1- i t - -
Pleicdes Lower S e e m - - ~ - - ----+-- - - - < - - + - - - - - -
I
~~
B06 ➔ * (131.0)
I
BOS ➔ * (161.0) Tieri (i) Seem
:::::
B04 ➔ * (191.0) 200
·::: :
~ •·•·• Corws Seam
~~ ·
I It
~::. __- - -·~ ------;-;1_:.~_-··_-::.-=--i-- - , - - - - - -
-~_;; :;:. .~.~
l
B03 ➔ *
(221.0)
..,..__
~*
B 02 _ (231.0)
,,;_it·-<1'- ;,-
- - - --·--,.•-~, - - -- -- l t - - - - -1- - - . - - - - -
.Jt:· ~
'""'';.;.!':':~
r
B01 ➔ * (251.0)
265 ..lO
·:::.: 8 0,e of Hole
r
I
~
>
Figure 2. Stratigraphic Section and Wireline geophysical logs of Borehole 964 at Gordonstone Mine, also showing geophone stations (B01 to B07).
Bowen Basin 1995 - Symposium
120
North 500
0
1000
8 8
LW102
0
LW103
LW104
1000
D 0 * 00 t "=, 0
•-(B)B
t965(C)
Shot holes
O
a~(P)o 500
t966 (A)O
8[:::j 0
in mders
D
8 8
Figure 3. Plan of surface installations and borehole positions at Gordonstone Mine, in relation to development roadway~ for Longwall Panel 103. Holes 964, 965, and 966 are CSIRO geophone holes; SS-1 and SS-2 are CQU surface seismographs; hole 967 is the piezometer installation, and the holes for the calibration shots are shown as stars.
500
500
recorded by three boreholes could be accurately located from P-wave arrival times only. However, nearly 80% of the events were recorded by geophones in only two of the boreholes. To determine accurate locations for these, further analysis was needed . Information on the direction of the wave propagation between the source and geophones was therefore incorporated in the location process. Normally the approach to obtain a source direction is to orient each triaxial geophone station so that one element is vertical and its two horizontal components are aligned with North-South and East-West orientations. However, it was impractical to control the orientations of the horizontal geophone elements during their installation at Gordonstone due to the use of multiple strings and their depths (up to 260m). Instead we determined the orientations on the basis of the geophone vibration directions produced by two underground calibration shots (Figure 3). The complete data set of seismograms was then upgraded using these orientation angles to provide mathematically equivalent data to that normally obtained from oriented geophones. S-wave arrivals can also be used for location purposes. However, the Gordonstone data show strong S-wave anisotropy with the vertical component significantly delayed compared with
the horizontal component. The S-wave arrivals were therefore not considered in event location. The location algorithm used in XMTS assumes a homogeneous velocity model. We determined the P-wave velocity using a least-squares solution to the traveltime differences from the two calibration shots. A P-wave velocity of 3.3km/s was obtained. This is the same as the average velocity for the inter-seam strata from the borehole log shown in Figure 2. The accuracy of location for an event is considered to be generally <Sm within the seismic network and <10m outside. XMTS can also be used to calculate focal mechanisms once an event has been accurately located. Only a relative few have been calculated to date, but there is enough data to suggest that the predominant mechanism on both the Tailgate and Maingate sides is a shallow angle shear oriented generally towards the goaf. The mechanisms in the centre of the Panel are not as consistent.
DISCUSSION As shown in Figure 4, a direct correlation is evident between longwall mining production, represented by number of shears taken, and the number of seismic events recorded per day. Very few events occurred when the longwall was inactive. This is clear evidence that the seismic activity is mining-induced. More seismic events, typically 50
Bowen Basin 1995 - Symposium
121
per day, were also recorded as the face passed within the array (as defined by the volume of groundmass between the three boreholes) . This is at least partially due to increased sensitivity to events within the array. The locations of events are shown in plan view in relation to the Panel in Figure 5. The concentration of events on the Tailgate (Western) side, and to a lesser extent the Maingate (Eastern) side of LW103 is immediately noticeable. There is a marked decrease in the central part of the Longwall and a few events occurred below the previously mined LW102 Panel. Two depleted E!W zones caused by array downtime are marked. The pronounced cluster of events centred near Cut-Through 3 of the Tailgate is of considerable interest, as this intersection required increased support in previous LW102 development. Figure 6 shows representative daily long sections. It demonstrates that the forward abutment tends to be about 50m ahead of the face, and passes obliquely upwards back over the longwall face for up to 120m. The angle of draw is 15 •. The abutment appears to be restricted to 30 m beneath the face, where the sediment becomes quite strong beneath the soft immediate floor horizon (Figure 2.) Located events are shown in cross section view looking Northwards along LW103 in Figure 7. The gateroads are marked where they intersect the German Creek Seam. The seismic pattern maps the angle of draw for Gordonstone goaf, 15°, very well. The lateral abutments are clearly defined by this dense zone of seismic events. The events are concentrated above the Tailgate and Maingate, and
the maximum height is well defined by the Aquila Seam, with only a few scattered, low magnitude events above this. The borehole log shows this interval to be higher velocity, and the strata are orthoquartzites with high MPa. It is clear that in this. section of LW103, fractures do not extend to within 40m of the base of the Tertiary. The events are grouped into Sm depth intervals in the histogram shown in Figure 8. As expected, most events occurred just above the German Creek Seam, a few significant events occurred below the mining horizon, and there was a gradual decrease with height above the mining horizon. However, the surprising result is the marked decrease in activity between the Corvus and Tieri 2 Seams. From the borehole logs and stratigraphy in Figure 2, this is the strongest roof horizon between the German Creek Seam and the base of the Tertiary. It was expected that this horizon would attract stress and cause numerous large events. Conversely, the secondary peak between the Tieri 1 and 2 Seams correlates with an interval of slower velocities in the borehole log. Figure 9 is a long section through LW103, looking West. Note that the 'quiet zone between the Corvus and Tieri 2 Seams is quite prominent in this view. While Figures 4 to 9 clearly depict the location of the events, their interrelationship and timing are best studied using computer visualisation techniques. A 'movie showing the occurrence of seismic events in relation to the longwall face advance and roadways has been prepared. This shows that many of the events occur in sequences which are suggestive of propagating fracture planes.
100
100
90
90 C:
80
....co
Cl)
70 60
1'ii ~
Q)
0)
C: Q)
0
50
-~
·e
a.>
"iii 0)
..0
·;::
:::J
·c
E 40 30
(/)
C:
,g
80
E Q) 1ii >,
70
C:
~ 0 "O
C: ~ 0
60
E Q) 1ii >,
50
"O
0)
C:
.Q
E Q) 1ii >,
Cl)
a.> > a.> 0
a.>
(/)
40
..0
30
C
E :::J
(/)
0
E
0
20
-.... C
~
0
(/)
~ 0 "O
cii
.2:?
Cl)
C
~
C:
a.> .c
-....
>,
-shears -events
20
t::
CU
iii
10
10
0 .., .., .., .., .., .., .., .., .., .., .., .., .., .., .., .., .., .., .., .., .., .., .., .., .., .., .., .., .., .., .., 0 <!! <!! <!! <!! <!! <!! ~ ~ ~ <!! ~ ~ ~ <!! <!! ~ ~ ~ ~ ~ ~ 0 0 ~ ~ ~ 0 0 ~ ~ ~ ~ ~ <!! 0 0 "' "' "' "' "'~ "' e e e a; ;:::: a; iiiN ~N a;N ,;; iii iii iii iii ;:::: ~ ~ ~ ~ ~ a; ;;; ~ ;;; iii ~ i?; ~ ~ N ~ N N N
i
date
-
-
-
Figure 4. Daily correlation between longwall production in Panel 103 Gordonstone Mine and number of seismic events.
Bowen Basin 1995 - Symposium
122
North 0
500
in meters
LW103
LW104
1000
1000
...._face
.
Position I
0
7()
#965(C)
Q
0 n
500
500
f•ce Pos;,;on 29 1/10;~1
500
0
Figure 5. Distribution of seismic events between 16/9/94 and 29/10/94 in plan view of longwall Panel 103 at Gordonstone Mine. The event magnitude (local scale) is proportional to the size of the symbol used. Periods of array downtime resulted in two apparent aseismic gaps (arrowed).
The piezometer data in Figure 10 are of great assistance in explaining the seismic observations. The sensors in both the Corvus and the Tieri 1 Seams show the first obvious response to mining on 6th October, some 170m ahead of the longwall face. The sensor in the Pleiades Seam responds about 5 days later. Hydraulic pressure in the Corvus Seam decreased, but increased in both the Tieri 1 and the Pleiades Seams in direct response to mining. This continued until sensor failure occurred on the 15th, 17th and 19th October, the face being at distances of 73m, 55m and 22m ahead respectively. These distances are generally consistent with the failure fronts indicated by the seismic data, particularly in the Corvus Seam on the 15th-16th. The increases in
hydraulic pressure are consistent with the compressional shear indicated by the source mechanisms.
CONCLUSIONS •
The detailed in situ fracture pattern induced by longwall mining can be determined by seismic monitoring. The fractures tend to occur 50m ahead of the longwall face, forming a fracture zone up to 50m in width, which extends obliquely back over the face.
Bowen Basin 1995 - Symposium
123 500
450
600
550
700
650
750
800
850
900 950 1000 1050 150
150
,...._ 100
Oct 23, 1994
< C'· C
C: C
c-:
>
c:.,
100
.
E
._,
so -
AO
TI
.. .
0
s -50
co
B,C
-50
facl position
. -100
-100 600
500 550
650
0
GC
A
450
so
T2
...-
700
750
800
850
900 950 1000 1050
850
900 950 1000 1050
Distance (m) 600 '
500 550 '
450 150
> c'- C
-
50
~
~
700
0
750
800
150
Oct 23, 1994
. . . . .
,...._ 100
E ......, §
650
100 AO T2
co
cc
s -50
A
-100
i .. face pos111on
B,C
0 -50 -100
'
600 650
SOO 550
450
50
II
700
750
800
850
900 950 1000 1050
Distance (m)
450 SOO 550 600 650 700 750 800 850 900 950 1000 1050 150 ....--''---'---'----'---'-----'---'- '----'---'--....L.....-.L.--'-_... _-.- 150
Oct 24, 1994
< C'· C
100
,...... 100
E ......,
AO
§ 50 C:
t-
so TI CO
.~. •• : t
~ - - - - - - - ' -cc 0 , - - - - - -• • '-------• ..-• -
s -50 -
i ..
A
• face pos111on
B,C
0 -50
-100 ...........,---,---.---.---~---. ---,---,...--,--...........-,----,---,-...,__ -100 450 500 550 600 650 700 750 800 850 900 950 1000 1050
Distance (m) 450 500 550 600 650 700 750 800 850 900 950 1000 1050 150 .......-'---'----'-'--'---'-----'-----'_ __.___ _._____, _ __..____, _ __.__...,... 150
Oct 24, 1994
> c'- C
100
,...... 100
E ......, §
~
c:.,
AO
50 _ _ _ _ _ __ _ , . _ . ! ~ - - - - - - - - - - - - - - - 1 " 2 , - t
50
co •• • , ---------r ..--.--.---------cc .
o
11
·'
0 , - - - - - ~.
~ -50
A
i ..
• face pos1uon
B,C
-50
-100 ...L...,,----,.-----,---.---~--- .---,---,...--,--...........-,----.---r...,__ -100 450 SOO 550 600 650 700 750 800 850 900 950 1000 1050
Distance (m) Figure 6. Example of vertical distribution of daily events on the Maingate side ( <c'-c) and Tailgate side (>c'-c), viewed looking westwards at Panel 103, Gordonstone Mine. Face advance for the day is also shown.
Bowen Basin 1995 - Symposium
124
50 100 150 200 250 300 350 0 -150 -1 00 -50 150 150----ro J-----'----- '-----'--_,_ ~~-----"-- ---"--:-=-= -:::!~---t-LW 104 LW 103 LW 102
(In developm ent)
(Being mined)
(Mined)
.
,--100
e
100
..
'-"
50
0
•
i
•
i
• gareroads
-50
-1 00 ....L..-- -------.- ----.---- -,.------ .---~-~ --+- -1 00 50 100 150 200 250 300 350 0 -1 50 -1 00 -50
Distance (m) Figure 7. Vertical distribution of events located within the middle of the array, viewed end-on looking northwards at Panel 103, Gordonstone Mine.
Number of Events
90 80 70 60
I
I
I
I
I
I
5
lO
15
20
25
30
~
Figure 8. Histo~ram of located seismic events from Panel 103 at Gordonstone Mine in Sm depth intervals.
TI
I
I
T2
I I
I I I I I
-10
I I
-20
I
I
-30
-60
-70
co
I
0
-50
I
65
I
lO
-40
I
60
I
0
ril
I
55
I
s
-
I
50
AQ
,._.,. 30 c:: 20 >-
I
45
I
---. 40
Q.)
I
b
50
·~
I
35 40
GC coal seam
••••••••••••··········· ......-....-... .......
I I
w
I
~ Bowen Basin 1995 - Symposium
125
450 500 550 600 650
700 750 800 850 900 950 1000 1050
Figure 9. Vertical distribution of all events, viewed side-on looking westwards at Panel 103, Gordonstone Mine.
150
150
All events
e
-= -
A
50
-~ CU
....
co
..
A
-50
50
Tl
.•
0
~
fiS
100
100
. ...
•
0
GC
-50
-100 ...L...,------.---,---,---r---r---ir-"""T---,---.--"T"'""-r---- -......... -100 450 500 550 600 650 700 750 800 850 900 950 1000 1050
Distance (m) 800
600
700 600 ■
■
500 C
0
400
~
position of lonowall
• •
ell
·.::
• •
300
ell
> ell a..
200
500
I tU
• • ••••• •
#3, 125.6 m, Pleiades Seam
:=
Ol C
-
400 ..Q
•
0
C
.::it:.
•• • •
100 0
-100
0
·.;::
• •
300
• •
·u5 0 a.
piezo hole ~@223m
-200 +--+---t-+--+---t- + --+---t-+--+---+-+---+---+-+---+--+-!---+--+-!---+--+ --,f---+--+--,,-J- 200
8
N
...
I N
8
8
N
N
~
~
...
...
"'Q lC)
Q ,.._
N
N
8
N
... ~
Q
"'N
a
N
... ~
a
N
... ~
~
a ...
8
N
N
...
iii
...
0
~
;;:;:
a;
~
~
8
N
a
N
... ~
-
8
N
8
N
8
N
8
N
...
...
...
0
0
0
~
iii
~
;;:;:
a;
~
~
~
...
date Figure 10. Hydrostatic pressures from piezometers installed in ROH 967 Gordonstone Mine against face position from the recovery roadway in Longwall Panel 103.
•
Fracturing is more significant in the Tailgate area than the Maingate area, with the central section being notably less fractured .
•
The fractures extend generally up to 100m above the German Creek Seam to the Aquila Seam, with an isolated few penetrating to 120m.
•
The failure mechanism is dominated by shallow angle shearing (reverse faulting) resulting in roof material thrusting into the goaf.
•
•
ACKNOWLEDGMENTS This project was funded by CSIRO Exploration & Mining, BHP Australia Coal, ACARP and Central Queensland University. Gordonstone Mine provided site support in the form of drill-holes, surface access, borehole logging and full details of mining. The authors wish to sincerely thank these organisations for their support. The many individuals who have made this Project's success possible, include in particular: Greg Poole of BHP Steel Collieries Division, for the geophone installations and firing of the calibration shots.
Piezometer data are consistent with the locations of the fracture fronts and seismic source mechanisms. Seismic monitoring clearly has a future role in geotechnical studies of longwall behaviour, in areas of concern such as floor breaks, periodic weighting and optimising face width.
Ian Gray of Sigra Ltd, for the piezometer installation. •
Mark Favas (CSIRO EM) and David MacDonald (CSIRO DIT) for 3D visualisation.
Bowen Basin 1995 - Symposium
126
•
Craig Bugden of CQU for assistance during the monitoring and support of the CQU equipment.
Mike Kelly (CSIRO EM, formerly Gordonstone) and Bill Lawrence (Gordonstone) for useful discussions. Brian Evans and Milovan Urosevic (Curtin University) for the calibration shots.
•
Alan Davies (BHP AC) for his support and encouragement. Ross Dungavell, Michael Barry, Zak Jecny, Mark Kochanek, Don Flynn, Rob Wenzel, Ian Hutchinson and Mathew Thurley of CSIRO EM for many vital aspects of development of the Project.
REFERENCES KELLY, M., LAWRENCE, B. & DEVEY, D., 1994: Roof Control at Gordonstone Leads to Australian Records. The Australasian Institute of Mining and Metallurgy, Bulletin, 6, December.
McKA VANAGH, B., BOREHAM, B., McCUE, K., GIBSON, G., HAFNER, J.,& KLENOWSKI, G., 1995: The CQU Regional Seismic Network and Applications to Underground Mining in Central Queensland, Australia. Pure and Applied Geophysics, 145(1).
APPENDIX Specification Summary of CSIRO Seismic Monitoring System
Computing Hardware:
IBM compatible industrial 486 DX2-66 containing 6 intelligent acquisition cards. SGI Indy (MIPS 4400 CPU) running ISSI seismic processing software. Analog Signal Conditioning:
Switchable preamp gain (0,20,40,60dB) under software control. 16th order Bessel anti-alias filtering (fadB presently locked to ½ th sampling frequency). Analog to Digital Conversion:
Multiple MicroStar Labs DAP 3200 series intelligent acquisition cards (up to 7 per PC).
Number of triaxials, sampling rate and complexity of trigger detection is not limited by PC architecture. All ST A/LT A parameters can be adjusted. Trigger Associator:
Running on PC (written in C) monitoring DAP cards for triggers. Software configurable parameters include: Minimum number of stations per event, Time for signal to cross geophone array (Association Time) . PC to Indy Communication:
Each DAP 3200 can monitor 5 triaxials. 12 bit AID converter with software controlled gain (0, 20dB). Sampling frequency under software control. Presently up to 2 kHz, but higher rates possible depending on number of triaxes per OAP card . Timing synchronised _by Master + many Slave configuration (accurate to ½o of sample frequency).
NFS Ethernet connection. DAP2ISS software (running on Indy) writes raw event in ISSI database format. Remote Monitoring Facilities:
Outside world connection to Indy via mobile phone + modem.
Trigger Detection:
EXABYTE 4 Gbyte tape backup.
ST A/LT A algorithm (written in DAPL and C) being executed on DAP 3200 cards.
UPS of system with controlled shutdown after 15 minutes of power failure.
Bowen Basin 1995 - Symposium
127
Geological factors which impact on the vitfb_ility and effectivenes~ of highwall mining tn the Bowen Basin Dr Ian L Follington, CSIRO, Division of Exploration & Mining
The main risk to highwall mining operations comes from ground control related problems due to their fundamental reliance upon the self supporting capacity of the rock mass. The absence of any artificial support or rock engineering places a heavy emphasis upon developing an accurate geotechnical site characterisation to ensure the technical viability of operations on any given site. If the site is considered suitable, the next step is to extend the site characterisation into a layout design matching system capabilities and ground conditions. This paper briefly outlines current highwall mining practice in both Australia and the USA. It relates the geomechanical limitations and problems that the system has experienced to date and discusses these in the context of the development of the Bowen Basin highwall mining industry. The paper also outlines some of the research that has been undertaken to date by the CSIRO Division of Exploration and Mining in collaboration with BHP Australia Coal Pty. Limited addressing the geomechanical design issues associated with highwall mining. Highwall mining has the potential to transform the surface mining industry in the Bowen Basin, particularly in the wake of the growing thermal coal markets in Asia and the additional productivity demands this will place on the industry. This potential will only be realised if three issues are adequately addressed; Site evaluation & layout design - MINIMUM site investigation standards must be set and maintained, supported by appropriate layout design matching system capabilities to ground conditions,
Operational control, guidance & feedback enhanced technology must be applied to improve system control and record the rock mass response to operations in order to move the industry up the highwall mining learning curve more rapidly and at lower cost, and Flexible mining systems - improved mining technology is required which is able to fully exploit the thick (>4m) and steeply inclined (>6.)coal seams of the Bowen Basin. The potential for highwall mining in the Bowen Basin is considerable but it will not be realised unless the necessary investment is made in
research and development to address the issues outlined above.
INTRODUCTION Highwall mining is an automated mining method which extracts coal from the base of an exposed highwall via a series of parallel headings driven to a significant depth within the seam horizon. The method allows recovery of coal from surface pits that have reached final highwall positions due to uneconomic stripping ratios, or in areas where coal has become sterilised in service corridors etc. Highwall mining is a hybrid system capable of accessing these reserves for less than a tenth of the capital cost and in a fifth of the lead time a full underground mine would take to commission, while producing >lMt per year. The successful application of this mining system in Australia, assuming a penetration depth of 300m, a seam thickness of 3m and based on the available strike length of highwall, would enable access to >500Mt of additional black coal reserves. Highwall mining also has the potential to develop as a primary mining technique on new reserves with access being gained from box cuts or trenches. This system would be particularly attractive for steeply dipping or narrower seams where stripping ratios are prohibitive for conventional surface mining. This application would be particularly suited to smaller operators where a mobile washing plant could be combined with the highwall mining system providing a flexible, mobile, high production mining system with low establishment costs and a short lead time. The remote operation, coupled with the scarcity of information regarding local conditions as highwall mining proceeds, demands a greater understanding of the geomechanical environment ahead of mining. This problem has two main components; the first, prior knowledge of the geological and geotechnical conditions within a highwall mining reserve and the second, matching the ground conditions and mining system capabilities in an optimum layout configuration. Highwall mining in the USA
Highwall mining first began in the Appalachian region of the eastern USA about 50 years ago, utilising auger miners in thin (<lm), flat seams in
Bowen Basin 1995 - Symposium
128
-
.
.
,,..,_
.- _, ....... .
,, .,,,
..;
~
....
.
. I".
I
•
•
A
::<"' ;--•....
•
~ #
Plate 1. An Addcar Highwall Mining System in operation in the USA.
abandoned contour stripping operations. Since then, several other auger style miners have been developed. In 1989 Addington Resources Inc. developed the Addcar Highwall Mining System (AHMS) which consists of a remotely controlled, camera guided continuous miner which is connected to a series of 12m long modular conveyor cars used to convey the coal to the surface. The coal is received at the surface by a launch vehicle that loads the coal into trucks or stockpiles on the pit floor. This system was further refined over the next few years to result in 14 systems in operation in the USA today and one in Australia . The AHMS units in the USA regularly produce 75 OOOt per month with peaks of up to 135 OOOt per month, in thin seams of only 1-2.5m (Sartaine, 1993) (See Plate 1). A number of other highwall mining systems are currently active in the USA . These include the Metec machines (Antoline, 1995) and the Archveyor (Sawarynski, 1995). At present there are approximately 10 Metec machines operational in the Eastern USA. These systems have a limited penetration depth (<200m), but compensate for this by having a proven capability to operate successfully u nder more adverse mining conditions. The Archveyor system incorporates a number of innovative features and is able to provide operators with directional control and a high level of automation. At present only one of these systems has been built for surface mining, although an underground version is currently being commissioned.
Review of operational experience in USA
Highwall mining in the USA is predominantly carried out in the Appalachian Mountains of the Eastern USA. Highwalls are mined either in abandoned contour stripping areas or concurrent with existing stripping operations, and in some cases through reserves that were previously mined using auger equipment. Detailed geotechnical investigations are rarely undertaken and mine design is limited to panels of four or five entries to 300m depth with pillar widths generally equalling seam thickness (or greater) and 5-6m barrier pillars (equivalent to an entry and two pillars) separating the panels (Plate 2). The assessment of the local geotechnical conditions in terms of the roof material and condition of the highwall is made by the foreman on site prior to mining, and if deemed unsuitable those sections of the highwall are not mined or in extreme cases the area is abandoned. Small amounts of roof material typically spall onto the miner during mining under laminated strata, and where more serious roof instability is encountered the punch is normally abandoned. This approach to highwall mining serves to promote both lower recovery and production rates. Where any mining system, and particularly a remotely operated system such as highwall mining, is being operated on a 'hit and miss' basis such as this with limited prior investigation it can never realise its full potential.
Bowen Basin 1995 - Symposium
129
Plate 2. A typical panel configuration from a highwall mining operation in the USA. Highwall mining in Australia
In 1989, the first highwall mining trials in Australia were carried out by BHP Australia Coal Pty. Limited at Moura Mine. Ten rectangular openings were driven into the coal seam to depths of up to 30m using an experimental system of a modified Marietta miner and customised conveyor carts. This was an experimental system only, constructed to test the concept (Mai & Shanks, 1990). The entries driven as part of this trial demonstrated excellent stability, standing stable three years after the trial. In July 1993, Oaky Creek Coal contracted AIMC Australia Pty. Ltd. to mine their highwalls using a Joy Highwall Mining System (an AHMS built under licence). Highwall mining design guidelines were principally based on experience gained from the USA miners. Typical practice at the Oaky Creek Mine is to mine a panel of five entries, altering the direction of each heading by 0.25 • to produce a fan similar to an outstretched hand (Boyd, 1995). The inter-entry pillar dimension is typically equal to seam thickness. These panels are separated by a barrier pillar, usually 5-6m wide. Up to April this year highwall mining had consumed 5km of Aquila Seam highwall at Oaky Creek Mine over an 18 month period (Adie, 1995). The seemingly random nature of roof failures has so far inhibited any confident predictions of roof conditions based on empirical relationships developed on site. It is considered that release planes are generated by a combination of the redistribution of stress related to mining and/ or the vibration induced by coal cutting. There are characteristically two types of roof falls which have been experienced at Oaky Creek Mine. The first is a slabbing type caused by bed separation, these extend laterally from 0.3-1.5m and are typically around 0.02m-0.lm thick. The second is a block type mechanism formed by the combination of sub-vertical jointing and bedding planes (Plate 3). The frequency and degree of severity of roof falls has been the major contributing factor in the poor performance of the system at Oaky Creek Mine. It was calculated that 66% of the time attributed to retraction and re-entry was a direct result of roof
falls. This does not account for the time taken to remove the accumulated material from the miner or repair time spent on cables and belts (Adie, 1995). Good conditions have been encountered in some areas and high production achieved indicating the potential of both the site and the system. In October 1994 Mining Technologies Australia (a wholly owned subsidiary of Addington Resources Inc.) and Eltin Highwall Mining Pty. Ltd. began contract highwall mining operations at German Creek Mine with an Addington built AHMS. Operations commenced in the Aquila Seam in Pit R extracting all of a 1.Sm-1.7m seam. The immediate experience was a very unstable roof giving poor mining conditions and consequently slow advance (O'Hagan, 1995). It was found that there was an intensely jointed and friable shear zone, some 0. lm thick, in the top part of the seam. The roof of the Aquila Seam is well laminated and contains slickensides and pyrite laden bedding planes. This material was deemed to have a much higher intact tensile strength than immediate roof material from the Aquila Seam at Oaky Creek Mine. However, the presence of closely spaced structural discontinuities acted to significantly discount the tensile strength of the rock mass. The instability in the immediate roof was related to the presence and action of structural defects in the form of shearing, bedding and sub-vertical jointing. Where these effects were diminished in the "shadow" of the Grasstree Dyke, zero roof falls were experienced and 104% of planned extraction was achieved. This highlighted the profound influence of the structural defects upon immediate roof stability. A plan showing extraction achieved from Pit R is attached as Figure 1. Hydrogen sulphide was liberated in very large quantities in Pit A as soon as coal was cut. This disrupted operations while suitable counter measures were put in place to protect staff. It was found that it is possible to operate safely under conditions where high concentrations of hydrogen sulphide are present.
Bowen Basin 1995 - Symposium
130
Plate 3. Entry portals at Oaky Creek Mine.
I
Fault
C=:J
Pit R Highwall
~
Highwall Mining Reserve 300
0
Highwall Mining Extraction
mettes
Figure 1. Plan showing extraction from Pit R at the German Creek Mine.
CSIRO/BHP Australia Coal Pty. Limited Collaborative Project - Highwall Mining Geomechanics Design Guidelines
The project has centred on Pit 17DU South, the site proposed for the first highwall mining operation at the Moura Mine. The project has been running now since October 1992. It is divided up into four programmes:-
Recognising the immature state of the art in terms of geomechanics design for highwall mining, the CSIRO and BHP Australia Coal Pty. Limited have embarked on a collaborative research project aimed at developing geomechanical design guidelines for highwall mining under Australian conditions.
(1) Site Investigation;
(2) Layout design; (3) Monitoring and Assessment of Layout Performance; and ;
Bowen Basin 1995 - Symposium
131
(4) Definition of Geomechanical Design Guidelines for Highwall Mining. To date the first two Programmes have been completed and work is proceeding on the third Programme. The fourth and final Programme is projected to be complete by May next year. The Site Investigation program utilised a wide range of geological and geotechnical investigation techniques in order to effectively investigate the ground conditions at Pit 17 DU South and develop an effective methodology for investigation of future prospective highwall mining sites. The site investigation program for Pit 17DU South utilised the following techniques (Leisemann & Follington, 1993):
•
Core drilling
•
Downhole geophysics
•
Borehole imaging analyses
•
In situ stress measurements
•
Piezometry
Pressuremeter testing
•
Geotechnical core logging
•
Point load and UCS testing
The influence of coal extraction upon highwall stability is difficult to predict and represents a particular challenge associated with the assessment of highwall stability. There are a number of approaches which are currently being explored in terms of detecting any instability in the highwall as mining proceeds. These are to trial passive microseismic sensors located in boreholes behind the highwall which will detect and locate, in 3D, any fracture development in the rock mass adjacent to the highwall. The other is to use a CSIRO development striped light system to repeatedly scan the highwall to detect any change in structure or dislocation along joint surfaces that may relate to instability.
Span stability In order to design stable spans for highwall mining, detailed structural and sedimentological data is required over the highwall mining reserve. A detailed sedimentological model is required over the reserve to delineate the lateral extent and variation of different lithologies.
Highwall mapping •
The results of this indicated a consistent rise in the shear modulus over the first 5-lOm of the borehole, supporting the measurements made in the overlying C to DU seam interburden using the RaaX BIPS system (Leisemann & Follington, 1994).
Inspection of abandoned highwall mining trial headings The Layout Design Programme divided the problem up into its three primary components; highwall, span and pillar stability. The key geomechanical parameters affecting each problem are discussed below.
Highwall stability It is critical for highwall stability analysis to establish an accurate geomechanical model for the rock mass adjacent to the highwall. However, in order to build an indicative model it is necessary to investigate the rock mass for sedimentology and structure in both the vertical and horizontal directions. Vertical boreholes were fully cored to accurately log the sedimentology and to carry out detailed geotechnical logging of all structure. Horizontal boreholes were cored in the interburden to delineate structure orientation, condition and spacing, and then surveyed with the RaaX BIPS system to detect the degree of relaxation in the rock mass from blast damage and lateral stress relief. The degree of relaxation decreases with depth into the rock mass and was delineated accordingly into four zones (Leisemann, 1994). This proposed zonation was further supported by the results of the pressuremeter profiling conducted in horizontal boreholes in the DU seam indicating that the effects pervaded down into the seam horizon.
Rock strength, bedding strength and spacing for each lithology is then required. The geomechanical model for the rock mass adjacent to the highwall in terms of the degree of blast damage and stress relief in the first 40-S0m of the rock mass into the highwall was employed in the assessment of span stability. The stability of the immediate roof strata in the headings plays a fundamental role in the success of the highwall mining system. It is therefore essential that the best possible estimation of the prevailing geotechnical conditions be made over the highwall mining reserve area. This involves the generation of a larger geomechanical model based on the most accurate predictions possible from the extrapolation of site investigation data. Horizontal boreholes drilled perpendicular to the highwall within the first 2- 3m of the immediate roof have proven to be invaluable in defining the geotechnical conditions. This data is then used to provide input into span stability assessment. A wide range of assessment techniques have been investigated, none of which provided definitive results (Trueman, 1993). Research into this area is ongoing.
Pillar stability Coal pillar design has been traditionally heavily reliant upon empirical relationships established for tried and tested pillar designs and as result is generally conservative. The problem with pillar design for highwall mining is the extreme geometry in one dimension. This major change in geometry makes it difficult to extrapolate from empirical
Bowen Basin 1995 - Symposium
132
data. As a result the approach to pillar design adopted as part of the CSIRO Highwall Mining Geomechanics Design Guidelines project has been to determine a methodology for assessing the in situ strength and deformability characteristics of coal (Medhurst, 1995). A programme of coal testing at four diameters, 61, 101, 150 and 300mm, was undertaken to characterise the well documented size effects associated with coal. The ultimate aim of this work is to predict coal strength and deformability characteristics from regular sized laboratory specimens (Medhurst, 1995). The Layout Design Programme also considered the impact of a number of factors upon the design. These factors included; coal strength, layout and sequencing, weak interfaces, horizon control, entry mis-alignment, entry profile and seam dip. It was found that overall the most robust layout design was one which maintained parallel entries with no barrier pillars (Follington & others, 1995). A probabilistic process was developed to assist in the selection of layout designs for any given site (Fama & others, 1995). In terms of the influence of the above factors upon layout stability a number of significant conclusions were reached. These included the following; •
Overall highwall stability is not likely to be an issue during highwall mining operations where pillars have been adequately designed. Localised highwall instability represents a major hazard to highwall mining operations and a rigorous hazard identification process is required, to be followed up with regular monitoring against records during operations.
•
Incorporation of a weak coal/floor interface substantially reduced pillar stability by the order of 20%, similarly, addition of a weak coal/roof interface had the effect of reducing this by a further 20%.
•
Poor horizon control has a minimal negative effect upon pillar stability, but any effect upon span stability remains untested (an·d difficult to predict).
•
Local increases in seam thickness have an effect upon pillar stability, the impact of this effect will vary with seam thickness, coal strength and interface properties.
•
Entry misalignment was found to have a relatively minor negative effect upon both adjacent pillar and panel stability. The effect on span stability was not able to be determined with any degree of confidence.
•
A circular entry profile has comparable pillar stability for the same extraction ratio as for a square profile whilst promoting greater span
stability and minimising the impact of weak coal/rock and floor interfaces. A layout with parallel entries without barrier pillars was found to be the most robust design under the range of conditions examined, including steep dip conditions (12 °). Limitations upon Highwall Mining
Highwall mining is principally limited by a lack of understanding of the rock mass response to extraction and how best to optimise for this in terms of system design, layout configuration and operational technique. The establishment and maintenance of a stable highwall is a fundamental platform on which any successful and safe highwall mining operation must be built. The influence of time upon highwall stability is not well understood, but one thing is certain highwalls rarely become more stable with prolonged exposure. The time gap between exposure of a final highwall and commencement of any highwall mining operation has a significant effect upon not only highwall stability, but also mining conditions for some distance into the reserve beyond the wall. The action of standing water in final pits is also of concern and the deterioration of immediate roof material submerged in mine water is clearly observable at the wall. The extent of these effects on subsequent highwall mining operations is undetermined at this stage. Span stability is probably the greatest single obstacle to the success of highwall mining operations at any site. Figure 2 serves as a general description of the likelihood of span instability being encountered at any given point along a highwall entry. The curve plotted on the graphs is a function of site geology, system characteristics and operator performance. The location and influence of 'weak zones' in the rock mass is predictable to some degree, although never with 100% accuracy or precision. As our understanding of the impact of different geological conditions upon span instability improves and span failure mechanisms are better defined, our ability to predict localised areas of instability will improve. The rate at which entry drivage is achieved will influence the amplitude of this curve, flattening it as it increases. This is only a general trend and our ability to predict standup times for unsupported spans is only rudimentary at best. The impact of machine damage transmitted to the immediate roof during coal cutting is also considered to be an important factor governing span stability. Figure 2 attempts to describe the general relationship between the degree of span instability and the ultimate entry depth. It is widely assumed that entry depth is solely a function of power loss to the continuous miner and so can therefore be readily addressed . In reality the ultimate depth of an entry is determined more often than not by the
Bowen Basin 1995 - Symposium
133
Seam
Probability of roof fall Entry depth .,._
"weak zone" Entry face
-/
Seam
Probability of roof fall Entry depth
-4r
"weak zones"
-4r
Entry face Seam
Probability of roof fall
Entry depth .... Figure 2. Probabili ty of roof falls with entry depth.
Bowen Basin 1995 - Sympos ium
134
ground conditions rather than system depth limitations. In Figure 3 three sites are represented as A, Band C, with A as a poor site, B as a good site and C as an excellent site. Figure 3a shows how when the gradient of the curve of the degree of instability against entry depth reaches a critical level, the entry is stopped. This critical level is a mining system characteristic and different systems can tolerate different rates before having to abandon an entry. The key to regularly achieving extended entry depths is being able to remain below this rate. Moreover, we need to improve site assessment in terms of the depth of the highwall mining reserve in order to set realistic recovery targets. Highwall mining has often been criticised for low recoveries; more coal is lost in entries stopped short than from panel loss due to conservative pillar designs. From an economic point of view, the tonnage rate per unit time is a critical measure of system performance. Figure 3b plots cumulative tonnage against time, the gradient of this curve reaches a minimum level below which highwall mining is sub-economic. This is another key measure in determining the ultimate economic depth of highwall mining at any given site. Steeply dipping seams (>6 degrees) present a number of technical difficulties for all of the current generation of systems. In addition to the greater depth of cover and resultant higher stress environment, there are kinematic problems to be overcome. The combined weight of the modular conveyor train and miner makes it difficult to recover the system once it has advanced to its 300m limit. Any localised steepening of dip or cross dip serve to aggravate this situation. There are also problems associated with accurately guiding and controlling the continuous miner under such conditions. Current highwall mining technology is limited by the lack of guidance technology available for the miner to enable straight headings to be repeatedly driven in a chosen direction (the leader in this field being the Archveyor). Currently, on the most widely applied system, the AHMS, the system is guided by video cameras mounted on the continuous miner. This provides some level of feedback to operators but given the hostile environment in which the cameras operate with excessive dust, water and vibration the quality of the image is not always high. Without a higher level of both accuracy and precision in terms of guidance the assessment of geomechanical conditions and optimal layout design can not be utilised. Ultimately it will be the bounds of confidence in terms of the guidance of the system which will govern the recovery rate and productivity rather than the geomechanical conditions. Improved guidance technology is the current focus of several research projects in the USA (USBM) and
in Australia (CMTE, CSIRO) which are attempting to address this problem. There are a number of promising developments in this area some of which are set to become available on producing systems in the near future. Recovery from thick seams (>4 metres) represents a challenge to future highwall mining operations in Australia, and in particular in the Bowen Basin. In order to attain acceptable recovery rates (>50%) major advances in both system design and layout configuration are needed to maximise recovery rates, production rates and stability. A new generation of high wall mining systems will be required to take up this challenge effectively. These systems will require equipment and geotechnical engineers to work closely together if they are to meet their goals.
AUSTRALIAN HIGHWALL MINING FUTURE DIRECTIONS Increased recoveries
Research is continuing in the CSIRO /BHP Australia Coal Limited collaborative Highwall Mining Geomechanics Design Guidelines Project to better understand the geomechanics of the rock mass and coal seam and the effect that highwall mining has upon them. One of the major aims of this work is to maximise the coal recovery through optimisation of the layout design and sequencing of excavations. There is real potential to increase span dimensions under good roof conditions. The challenge comes in determining the capacity of the roof to support an unsupported span of a given dimension with any degree of confidence. This problem is the focus of a project proposal currently under consideration by ACARP. The aim of this project is to develop a reliable tool to determine unsupported span dimensions based on readily available geotechnical data. Increased penetration depth
The current mining depths achieved in Australia are variable and, as previously discussed, span stability and production rates are limiting factors in terms of mining depth. System design requires significant enhancement to maximise performance in terms of penetration depth in a range of mining conditions. The ability to better match system capabilities to ground conditions will be at a premium in this endeavour. Another factor to be considered is that as reserves get larger the effort required to maintain the same level of confidence in site assessment increases. This may serve to increase the risk of unforeseen ground conditions. System guidance
Numerous research projects are in progress to provide systems on the miner to improve guidance capabilities. The USBM is currently working on several systems including the ring laser gyroscope,
Bowen Basin 1995 - Symposium
135
Gradient of curve determines end of entry
"' Degree of span instability f(freq. falls+severity)
Limit of current : highwall mining; technology :
150
450
300 Final entry depth (metres)
Figure 3a - Degree of span instability plotted against entry depth.
Gradient of curve determines end of entry (economic criteria)
Cumulative tonnage 3 different site curves fr site+system+operator)
Time in entry .....
A= A poor site B = A good site C = An excellent site
Figure 3. A plot of the relationship between entry depth, span instability and tonnage.
continuous wave radar, infra red cameras for roof detection, laser guidance, and ground penetrating radar (GPR). In Australia, the CSIRO has trialled their own GPR in conjunction with BHP at Moura with excellent results. GPR allows the operator to guide the miner by using the GPR readout to maintain a constant pillar width as mining
progresses. This system will allow constant pillar widths, however all pillars are only constant width . and shape in relation to the first pillar created. If the first pillar is not straight or wanders laterally, all the other pillars will be as well. The miner needs a guidance system to monitor its direction in three dimensions, and a workable system is not yet fully
Bowen Basin 1995 - Symposium
136
available. This represents a significant barrier to the optimisation of pillar dimensions and hence the recovery rates that the system is able to provide.
ANTOLINE, S., 1995: The Metec Highwall Mining System, Automated Mining Technology Conference, IIR, 27 &28 April.
Backfilling highwall mining punches
DUNCAN FAMA, M.E., CRAIG, M.S. & FOLLINGTON, I.L. (in preparation): A probabilistic apprpach to layout selection for highwall mining. CSlRO Division of Exploration & Mining, Confidential Internal Report.
Coal recovery could be increased from 50-55% to levels approaching or matching the best performance of longwall mining with the advent of backfill technology. By backfilling headings it may be possible to significantly raise extraction ratios and also enable multi-pass operations in thick seams (>6 metres). There are a number of fundamental economic and logistic issues related to the application of backfill technology to highwall mining as well as the geomechanical problems associated with sequencing and interaction of excavations. This has been the focus of an ACARP funded project into the application of backfill in highwall mining.
CONCLUSIONS Operational experience with Highwall Mining to date, both in Australia and the USA, has shown that it is vital that the geomechanical environment is well understood prior to the initiation of extraction at any site. Failure to undertake this has been found to result in lower recoveries and production rates. The collation of all site geological and geotechnical data into a geomechanical model covering the whole highwall mining reserve area has been found to be an essential step in the assessment of ground conditions for highwall mining. This information can be used to ensure that optimal excavation designs are adopted maximising recovery rates and productivity. Once this has been established hazard maps for both the immediate highwall and the roof conditions over the reserve area can be produced as a guide to operators during extraction. Highwall mining in the Bowen Basin has enormous potential with extensive reserves accessible to highwall mining techniques. This paper has attempted to assist the reader in better understanding the geological factors which impact upon the viability and effectiveness of highwall mining in the Bowen Basin.
REFERENCES ADIE, R., 1995: Implementation of Australia's first high wall system - Oaky Creek Case Study, Automated Mining Technology Conference, IIR, 27&28 April.
FOLLINGTON, I.L., DUNCAN FAMA, M.E., CRAIG, M.S., LEISEMANN, B.E. & MEDHURST, T.P., 1994: Factors Affecting Highwall Mining Design at Pit 17DU South, Moura Mine, Qld . CSIRO Division of Exploration & Mining, Confidential Internal Report No. 103C, December. LEISEMANN, B.E. & FOLLINGTON, I.L, 1993: An Attempt to Quantify the Variation in the Composition and Structure of a Seam in the Baralaba Coal Measures of Queensland, Australia for Input to High wall Mining Design, The Twelfth Conference on Ground Control in Mining, Morgantown, West Virginia, August 3-5. LEISEMANN, B.E. & FOLLINGTON, I.L., 1994: Program 1: Field Investigations & Data Reduction, CSIRO Division of Exploration & Mining, Confidential Internal Report No. 10C, January. LEISEMANN, B.E., 1994: Evaluation of Blast Affected Highwalls Using Borehole Imaging, CSIRO Division of Exploration & Mining, Confidential Internal Report No. 18C, April. MAI, V.K.L. & SHANKS, D.H., 1990: NERDDP Project No.
1125, High wall Mining of Coal, Completion Report. MEDHURST, T.P., BROWN, E.T. & TRUEMAN, R., 1995: Experimental Studies of the Effects of Scale on the Strength of Coal. Accepted for publication in 8th ISRM International Congress on Rock Mechanics, Tokyo, September. O'HAGAN, G., 1995: Implementation of Australia's
second high wall system - German Creek Case Study, Automated Mining Technology Conference, IIR, 27&28 April. SARTAINE, J ., 1993: High wall Mining in Australia, Joint QCO/DME, Coal Industry Safety Conference, 1-3 September. SAWARYNSKI, T., 1995: The Archveyor Highwall Mining System, Automated Mining Technology Conference, IIR, 27 &28 April. TRUEMAN, R., 1993: Estimates of Unsupported Spans and Stand-Up Times for High wall Mining Drivages in Pit 17 DU South, Moura Mine, CSIRO Division of Geomechanics, Confidential Internal Report New Series No. 189, June.
Bowen Basin 1995 - Symposium
137
Ma.terial characterisation for open pit mining geomechanics 1
John Simmons & Dennis McManus2 1. Sherwood Geotechnical and Research Services 2. BHP Australia Coal Pty Ltd
Stability of open pit spoil piles is a continuing issue. Mining practices have improved, and geotechnical knowledge has advanced, but the scale and economics of open pit operations is such that there is always likely to be some risk of instability. The risk is low, but not absent, under 'normal' mining conditions due to the need to maximise productivity. Materials generally become stronger in deeper strips, but this benefit is counteracted by higher spoil loading effects. Completion of stripping is within the planning window for many operations. Environmental management and economic pressures are increasing. It is unlikely that there will be substantial resources available for detailed geotechnical investigations of final void conditions. Even less likely will be substantial post-mining resources to investigate strength conditions for restoration earthworks. BHP Australia Coal has developed a spoil categorisation scheme to assist in geotechnical shear strength evaluations for spoil stability. The scheme is likely to provide the framework for strength evaluation for the foreseeable future, due to its accessibility and coverage of most common conditions where shear strength requires assessment. This paper describes the categorisation scheme, and discusses its value and weaknesses. It is based on geological assessment, and can probably be extended to most coal measure environments. Proposals for extending its application to rock masses, prompted by final voids scenarios, are presented.
SPOIL CATEGORISATION SCHEME The origins of the categorisation scheme can be traced to CSIRO research at Goonyella mine in the late 1970s, together with the substantial geotechnical resources then deployed by Utah's Technical Services department. The work was consolidated by Michael Dunbavan and Alan Davies in the late 1980s (BHP Engineering, 1991a). A planned formalisation of the scheme within a Pit Slope Manual for BHP's Bowen Basin coal mines never eventuated, due to a combination of resource limitations and other priorities. Among the other priorities were operational instabilities, to which
the scheme has been applied with great success for several years. The concept of a categorisation process arose from observations of failures in spoils composed predominantly of particular lithologies. Clay-rich spoils are in general far weaker than blocky sandstone-derived spoils. The key to assessment is plasticity, however, and this must be approached from an engineering perspective. The combination of Utah Technical Services' investigations, CSIRO research, and on-site experiences, gave rise to a database of material classification tests and shear strength tests, as well as shear strengths obtained from backanalysis of failures. The plasticity of spoil matrix material is a function of clay mineralogy and clay content, both of which are determined from the geology of the source materials. For geotechnical purposes, unit weight and shear strength are of greatest concern for stability considerations. Deformation is not generally an issue, except for rock walls and generally in the longer term. Erodability and dispersiveness are important for longer term issues. The spoil categorisation scheme was developed for evaluation of unit weight and shear strength, primarily for stability analysis purposes. The original intention of the scheme was to assign representative shear strength properties to spoil materials. It was found necessary to recognise four geological categories: Category Description 1
Fine grained, high plasticity, Tertiary spoil
2
Fine grained, low plasticity, Tertiary/ Permian spoil
3
Medium grained Tertiary /Permian spoil with fine matrix
4
Coarse grained, blocky Permian spoil
Furthermore, the mode in which shear strength is mobilised was categorised in the following manner: a
bulk spoil (unsaturated state)
b
bulk spoil (saturated state)
c
basal spoil, saturated or near-saturated and reworked to a condition of significant shear deformation
Bowen Basin 1995 - Symposium
138
TABLE 1. BOWEN BASIN SPOIL MATERIAL SHEAR STRENGTHS Category
Description
1
Fine grained, high plasticity, Tertiary spoil
2
Fine grained, low plasticity, Tertiary /Permian spoil
3
Medium grained Tertiary /Permian spoil with fine matrix
4
Coarse grained, blocky Permian spoil
The shear strength mobilisation modes are categorised as follows: a
bulk spoil (unsaturated state)
b
bulk spoil (saturated state)
C
basal spoil, saturated or near-saturated and reworked to a condition of significant shear deformation
(a) Unsaturated
Category
1 2 3 4
(kN}m3)
c' (kPa)
18 1
(c) Basal
(b) Saturated
$'
$'
$'
(deg)
(kN}m3 )
c' (kPa)
(deg)
20
25
20
18
18
18
30
2.5
0
10
28
1
20
0
15
3
1.5
1
15
3
1
7.5
2.5
1.5
1
10
2.5
1.5
1
0
1.5
2
18
50
1
15
18
50
1
15
30 2
35
2.5
20
20
20
0
25 25
30
(deg)
18 18 28
Note: The larger figures are the recommended mean values for each parameter, while the smaller figures in Italics are the recommended standard deviations.
Bulk spoil was that which had not undergone significant reworking (change in spoil fabric) since placement. Basal spoil was that which was saturated or nearly so, and had a sheared fabric caused by substantial reworking. Generally, basal spoil is formed from spoil dumping into pit mud or . water, or from development of a failure mechanism, and is found within Sm of the pit floor. In practice, the placement fabric of spoil is characterised by high variability due to material selection, dumping, rilling, and rehandling. Figure 1 shows an interpretation of spoil fabric from an early CSIRO study at Goonyella mine. Clearly, it is unrealistic to undertake 'represe~tative' sampling and laboratory testing of such spoil deposits by conventional geotechnical methods. The intention of the scheme is to represent spoil 'material variability in terms of average conditions, but also to indicate the variations to be expected. Table 1 shows the unit weight and shear strength parameters assigned to the different spoil categories and modes. By examining the database of unit weight and shear strength data, it was possible to make estimates of standard deviations of the parameters. These were intended as a measure of the expected variability within each category. The implication should not be made that the parameters were derived on a rigorous
statistical basis, so the term guesstimates might be preferable. The parameters were selected after checking against several known spoil and/or basal failures, over the full range of BHP Bowen Basin sites and materials. Being based on known failures, they are simultaneously biased to selected situations, but also biased to the largest possible sample size for strength assessment. The effect of the location bias cannot be evaluated directly. The bias towards averaging at a larger-scale is beneficial for geotechnical purposes.
APPLICATIONS OF CATEGORISATION SCHEME In recent years, most experiences with failures in spoil have been traced either to weak floor conditions, steep floor dips, or in-pit bench stripping methods incorporating shot ground. The geotechnical problem is to assign representative material parameters, to enable rationally-based remedial measures to be assessed. Figure 2 shows a failure in an extended key at Moura Ramp 16 (BHP Engineering, 1991b). The profiles include the prefailure geometry, and two different sections through the failure mass. Categorisation was used for all spoil materials in order to estimate insitu shear strength parameters
Bowen Basin 1995 - Symposium
West
East Weathered Surface
0&v0
Unsorted
0000
Uniform blocky
Crestal Material
Back-Gully Material
Cid Al
....
(I)
::s
Upper lev~I skirt material (Jl
'<
!3
"'O 0
....
(I)
s::
!3
Old Pit Floor
Jn situ Sediments
• Figure 1. D1agramm atic cross-section • showing typical structure an d fabric of spoil piles • (B arton & others, 1976).
140 100 ~ - - - + - - - + - - - + - - - + - - - + - - - - + - - - + - - - + - - - + - - - + - - - - - .
80
B Lower Spoil (unsaturated) BSpoil (unsaturated)
60
Shot Overburden
------- ----~
40
20
0
BSpoil (saturated)
B Lower Coal -20
0
20
120
100
80
60
40
140
180
160
200
220
Figure 2a: Moura 16B Lower Key Slump : Pre-failure Geometry for Backanalysis
100
80
Slump Profile at Section A·B
60
Presumed slip surface
40
20
0
B Lower Coal -20 40
60
80
100
120
140
160
180
200
220
240
220
240
Figure 2b: Moura 16B Lower Key Slump : Failed A-B Profile
100
80
60
Slump Profile at Section C-D
Presumed slip surface
40
20
1
0
B Lower coal -20 40
Figure 2.
60
80
100
120
140
160
180
200
Figure 2C: Moura 16B Lower Key Slump: Failed C-D Profile
Bowen Basin 1995 - Symposium
120 Existing strip spoil (prior to failure) assumed crest elevation 86m
100
=
0
~
80
II>
0.3m
Parting
0.3m
Lower2
:::s
= ....
Lower 1
I» <ll
:::s
60
~
\0 \0 U1
r:Jl
40
'<
!3
"O 0
....
<ll
s::
20
'
. .. . ..
!3
Dysart Lower 1 and Lower 2 Splits
0
-20 0
20
40
60
80
Figure 3. Saraji Ramp 12S; backanalysis of Lowwall failure.
100
120
140
160
180
200
220
142
for the shot ground buttress. For remedial design, interpolation between categories was used to estimate shear strength parameters for rehandled spoil forming a buttress. Figure 3 shows a backanalysis for failure along a weak band between the Dysart Lower 1 and Lower 2 seams at Saraji mine (BHP Engineering, 1991c). This weak band is a notorious destabilising influence at Saraji. Categorisation was used to obtain spoil strengths, in order to be able to backanalyse the shear strength of the weak seam. Several different spoil and floor geometries have been analysed in this manner, yielding virtually constant weak seam strength parameters. Similar studies have been undertaken at Peak Downs, Goonyella/Riverside, Peak Downs, Norwich Park, Blackwater, and Gregory mines. The scheme has been discussed for a range of in-pit bench mining applications by Simmons & McManus (1992). Over all these sites, it has been possible to use the categorisation process as the starting point for analysis and design. An important boost to confidence in applicability of the scheme came when prernining studies were undertaken for Cattle Pit at Oaky Creek mine. The work involved geotechnical drilling and testing to categorise overburden lithologies for spoil shear strength, together with identification and testing of potential weak seams. Boxcut stability was marginal, and compromised by the mining practices implemented. Remedial measures were undertaken after backanalysis of a boxcut failure confirmed the applicability of the categorised shear strength parameters (BHP Engineering, 1993). Most recently, older and geotechnically troublesome A seam areas at Moura mine have been the target of renewed mining. The categorisation scheme has proven to work successfully there, enabling analysis and design to concentrate on evaluation of weak, wet, and steep dip floor areas.
CURRENCY OF THE CATEGORISATION SCHEME The scheme has been in use for approximately 6 years. The original data base of unit weights and shear strengths has not been augmented over that time. Additional testing has been undertaken on spoil materials from Norwich Park mine (BHP Engineering, 1992), without challenging the values of the averaged parameters adopted. Given the current confidence in the scheme, testing has been concentrated on geological weaknesses, for which laboratory results were likely to be more cost-effective and reliable. Since 1993, the authors have been involved in an assessment of geotechnical stability for the currently planned ultimate deep open pits at Goonyella mine (BHP Engineering, 1995). A number of difficulties have been experienced in
undertaking stability analyses for high spoil piles at Goonyella. Where known failures have developed, the shear strength parameters identified from the scheme have often not been consistent with observed failure geometries and the known Factor of Safety (1.0 at failure). For ultimate spoil piles, up to 200m high, stress-deformation analyses and stability analyses using the scheme parameters have predicted spoil failure mechanisms that have not been observed at current spoil heights. The difficulties with the analysis of very high spoil piles has given rise to two concerns, which cannot be independently resolved with currently available information. The first concern is that the shear strength parameters may only be correct for a limited range of spoil heights (ie spoil stress levels in current practice). The second concern is that failure mechanisms at other stress levels may be different from those observed at current spoil heights. Geologists and engineers have mapped slope failure mechanisms in soil materials over a wide range of failure heights, including waste dumps more than 500m high. The mapping evidence is that failure mechanisms are much the same over a very wide range of stresses, up to 500m of spoil height at least. If the analyses with categorised spoil parameters lead to unrealistic predictions of mechanisms, then it may be concluded that categorised shear strength parameters may be workable only within a restricted range of current spoil heights. Associated with the ultimate spoil heights are the ultimate rock walls for the open pit. For typical Bowen Basin lithologies, rock substance strengths are such that rock mass strength failures are unlikely to develop until wall heights exceed 300m. That is, of course, provided that the method for assessment of rock mass shear strength is realistic. Currently available methods for rock mass shear strength assessment require some form of classification (Hoek, 1995). There would be obvious advantages in approaching rock mass shear strength in the same manner as spoil categorisation, to take advantage of the same geological tools. The two issues of stress-level dependency of spoil parameters, and extension of the categorisation scheme to rock mass strength assessment, justify closer examination of the categorisation process as discussed below.
SHEAR STRENGTH BASICS The shear strength of any surface within a geological material is the maximum shear stress that can be sustained without significant non-recoverable strain, at a particular effective normal stress. (Effective stress, or intergranular stress, is the total normal stress, less the pressure of fluid within the pores of the material).
Bowen Basin 1995 - Symposium
143
SHEAR STRESS ('t)
C'
NORMAL ( O"')
STRESS Figure 4. Modes of shear strength mobilisation.
While the concept is simple, representation of it becomes complex. Geological materials are frictional under the stress levels of interest, so the shear strength becomes a function of the effective normal stress. Time and water can significantly affect the shear stress - normal stress relationship. It is traditional to consider the functional relationship as linear, giving rise to the familiar Mohr-Coulomb model of shear strength: s = c' + er' .tan cj>' The parameters c' and <I>' are not constants, and are not the shear strength of the material but merely the means of calculation of the shear strength. Because of the relatively soft particles, and the very wide range of particle sizes present in most spoils, the shear strength relationship is expected to be a nonlinear function of effective normal stress as shown in Figure 4. For an initially unsaturated spoil, saturation causes softening at interparticle contacts, slaking of clay-rich particles, and reworking by water flow, all effects being largely irreversible. The effect of wetting-up is also shown in Figure 4. Drying-out of wetted spoil results in further non-reversible changes. Substantial shearing results in preferred orientations and development of shear structures such as slickensiding, where clay minerals in particular approach a stage of residual shear strength. These basic principles should explain why three modes of strength development were considered necessary within the categorisation scheme. The parameters c' and cj>' are seen from Figure 4 to be functions of effective normal stress. They are also strongly influenced by two geological or geotechnical properties: interparticle friction and
fabric dilatancy. For example, the friction constants for calcium carbonate and feldspars are significantly higher than for quartz. Dilatancy arises when the fabric undergoes shear deformation. At low normal stresses, the particles tend to override, creating expansion (dilatancy) of the fabric. At higher normal stresses, less energy may be expended by crushing and shearing of the particles and dilatancy may be suppressed and even be replaced by compaction of the fabric. Correlating these principles with the shear strength parameters in Table 1, it can be seen that there is an orderly progression from higher to lower frictional strength parameter (cj>') from the geologically less competent and less quartz-feldspar dominated lithologies. The relationship between material category and cohesion intercept (c') is similar, but not so clear.
PROBLEM AREAS Choice of Appropriate Shear Strength Parameters
Figure 5 shows shear strength envelopes for unsaturated bulk spoil over the range of effective normal stresses under discussion in this paper. While the actual envelope (at a point in time) is curved, the model is linear. For a particular effective normal stress level (spoil height) there are many combinations of c' and 4>' that could be used to obtain the same shear strength. It is also obvious that the 'best fit' parameters are substantially different at different ranges of effective normal stress. To address the stress range dependency of the categorisation scheme, it would obviously be more appropriate to use a nonlinear shear strength
Bowen Basin 1995 - Symposium
144
SHEAR STRESS ('t)
---------------
------
SURCHARGED
CUT FACE
DRAGLINE MAX HEIGHT
NORMAL ( O'')
STRESS
Figure 5. Effects of curvature of strength envelope.
envelope. However, this would remove the physical accessibility of the Mohr-Coulomb approach. Development of either a nonlinear criterion, or c' and cj>' parameters dependent on normal stress level, will clearly be necessary in order to address end-of-mining spoil stability probl~ms at stress ranges other than those presently experienced. Stress Paths and Degree of Mobilisation of Shear Strength
There are other effects on shear strength development which are more subtle, but which ~hould be recognised if the categorisation scheme is intended for successful application over a range of stresses other that those typical of current mining practices. It is well known that the cut (lower) face of a spoil lowwall stands steeper than the dump (upper) face, even in essentially homogeneous spoil. Part of this relates to the fabric of the (lower) dump face, but the most important effect is due to the form~tion of the cut face by unloading (destressmg). Laboratory testing which included the effects of different stress paths, such as lateral unloading, clearly showed enhanced - values at low effe~tive ~tresses, due to mobilised dilatancy (BHP Engmeermg, 1992). Clearly, from Figure 5, it would be potentially embarrassing and destabilising to utilise inappropriate values of c' and cj>' for stress ranges and stress paths other than those from which the parameters were first derived.
Problems in Identification of Acceptable Failure Mechanism
In analysis of potential slips in spoil lowwalls of up to 200m total height (BHP Engineering, 1995) it was found that the lowest FOS corresponded to backscarp dip angles approximately equal to the angle of repose. Similar predictions were obtained when the FLAC modelling code was used to simulate formation of such slopes. FOS values up to 15% higher were calculated, using the same shear strength parameters, for mechanisms felt to best match those observed in the field where backscarps were generally closer to twice the angle of repose. The reasons for these findings were not rigorously evaluated. However, there were indications that more 'realistic' mechanisms were likely when different parameters were used, but giving rise to the same shear strength at a typical slope height of 200m. It was concluded that the effects of envelope curvature (Figure 5) must be allowed for when assigning shear strength parameters to the spoil materials. This implies that more representative parameters will have to be evaluated or guesstimated for the higher spoils likely towards completion of open pit mining.
ROCK MASS CATEGORISATION The Factor of Safety concept should mean much the same thing for both spoil and rock slopes, and would if the underlying derivation of probability of
Bowen Basin 1995 - Symposium
145
failure could be undertaken in a consistent manner. Unfortunately this is not the case, and it is necessary to redress some of the inconsistencies which now confront analysis of safe final pit slopes. The shear strength of rock masses is a scale-dependent phenomenon related to insitu stress state, discontinuity fabric, and the rock substance strength. Depending on the orientations and shear strengths of discontinuities capable of forming failure mechanisms, the rock will fail either along discontinuities (structurally controlled) or through the rock material, or some combination of structure and material. For the range of normal effective stresses and rock substance strengths usually encountered in Bowen Basin open pit mining, structurally controlled failures typically dominate. The magnitude of kinematically-poss ible failure mechanisms on exposed walls is related to the continuous exposure length of the bounding discontinuities. A component of safe design is to limit the failure magnitude by adjusting batter angle and/or bench geometry. However, unless a rigorous probabilistic analysis based on exhaustive structural mapping is undertaken, there is always some uncertainty about the resulting probability of failure. The most cost-effective way of addressing such design issues is by pit inspection and supplementary mapping, and by competent blasting practices. For rock mass failures, an appropriate shear strength must be estimated or derived from measurable parameters. It is well established that the Mohr-Coulomb shear strength relationship is inappropriate. The most practical and effective criterion which is readily available is the empirical Hoek-Brown relationship. This has been successfully introduced in a wide variety of applications, however it has rarely been applied to the "soft" rocks of the Bowen Basin which are so dominated by sedimentary structural features. An opportunity arose to evaluate Hoek-Brown parameters applicable to the rock masses in the Cleanskin pit at Goonyella mine, as part of the deep open pit study (BHP Engineering, 1993). A current, 90m high partial endwall exposes Tertiary, weathered Permian, and fresh Permian rocks. Parts of this endwall are, by observation, close to the onset of rock mass failure, and it was possible to backanalyse the observed mechanisms. These parameters were then applied to the recommended final end and highwall bench profiles, to support the final wall profile recommendations. The backanalysed Hoek-Brown parameters were substantially different from those that would have been derived from currently used rock mass classification principles. While the evaluation of rock mass shear strength parameters has been undertaken at on specific site, it is wise to recall Hoek's (1995) plea for further research and development for such rock masses.
"I see almost no research effort being devoted to the generation of the basic input data which we need for our faster and better models and our improved design techniques. These tools are rapidly reaching the point of being severely data limited .... The fact that the criterion works, more by good fortune than because of its inherent scientific merits, is no excuse for the current lack of effort or even apparent desire to find a better way". Given that the rock mass shear and structurallycontrolled failure processes must both be considered and designed-for in highwall mining and highwall-entry applications, it is clear that much more thought will have to be given to categorising Bowen Basin rock masses for strength development in the near future.
CONCLUSION S A categorisation of Bowen Basin coal measure rock materials for spoil strength has been successfully developed and implemented at BHP Australia Coal and other mine sites. The categorisation scheme has enabled spoil shear strength parameters to be evaluated for a wide range of materials and conditions. It is unlikely that serious problems would be encountered if the scheme is properly used anywhere within the Bowen Basin. With the imminent widespread implementation of highwall mining and related activities, and final open pit development looming at several sites within the near future, the principle of a categorisation scheme offers many attractions for geotechnical design. Further development is warranted for exceptionally high spoil piles. The extension of a categorisation scheme to rock masses will require further development, so that the resulting parameters can be utilised with approximately the same level of confidence and same resultant meaning in terms of design probability of failure.
ACKNOWLED GMENTS The Goonyella Deep Open Pit Study provided the impetus for writing of this paper. This study, and most of the other work referenced in the paper, were undertaken by BHP Engineering for BHP Australia Coal. The first author was, until close to the time of publication, employed by BHP Engineering. While the information used in the paper has been generated principally as part of BHP activities, the opinions expressed in this paper are the sole responsibility of the authors. Both authors acknowledge the work undertaken by Michael Dunbavan and Alan Davies in preparation of the spoil shear strength categorisation scheme. It is hoped that the value of this work will not be lost, and that some form of geologically-inspir ed geotechnical manual for slopes will be prepared for use by those who have most to gain. These are the
Bowen Basin 1995 - Symposium
146
many and varied personnel who support open pit mining operations and who will have the responsibility for safe and cost-effective end-of-stripping planning.
REFERENCES BHP ENGINEERING PTY LTD, 1991a: Pit Slope Manual Project Report. Report to BHP Utah Coal Ltd, G91 / 4, March.
BHP ENGINEERING PTY LTD, 1992: Geotechnical Study for Multi-Pass Stripping Gilbert Pit, Norwich Park Mine. Report to BHP Australia Coal, G92.015, July. BHP ENGINEERING PTY LTD, 1993: Geotechnical Evaluation of the Cattle Creek Deposit. Report to Oaky Creek Coal Ltd, Q250/390, February. BHP ENGINEERING PTY LTD, 1995: Goonyella/Riverside Mine Geotechnical Assessment Proposed Deer Open Pit Mining. Report to BHP Australia Coa Q49-16/RE-00396/1445, February.
BHP ENGINEERING PTY LTD, 1991b: Report on Stability Analyses and Remedial Design for Moura Mine Key Slump. Report to BHP Utah Coal Ltd, Q49/1, July.
HOEK, E., 1995: Strength of rock and rock masses; The challenge of input data for rock engineering. News Journal of the International Society for Rock Mechanics, 2 (20, 4-16 and 23-24.
BHP ENGINEERING PTY LTD, 1991c: Ebony Pit Ramp 12S Stability Check for In-Place Interburden, Previously Failed Lowwall. Report to BHP Utah Coal Ltd, Q49/3, September.
SIMMONS, J. & McMANUS, D., 1992: Geological and Geotechnical Influences on Strip Mining Using In-Pit Bench Techniques. Proceedings of the Third Large Open Pit Mining Conference, Mackay, Austalasian Institute of Mining and Metallurgy, 397-403.
Bowen Basin 1995 - Symposium
147
Information from geology_: implications for soil formation anarehavilitation in the r.os( coalmining environment, Bowen Basin, Australia 1
2
2
AV Spain , J Ester le & TPT McLennan 1. Minesite Rehabilitation Research Program, CSIRO 2. Division of Exploration and Mining, CSIRO.
The coal mining industry is likely to disturb as much as 60 000ha of the Bowen Basin up to the year 2000 (Roe, 1992a). While comprising only a small proportion of the approximately 32 000km2 of the Bowen Basin, this considerable area will eventually need to be rehabilitated by creating appropriate land forms with a stabilising and self-sustaining cover of vegetation. The job of restoring the disturbed area will fall to the practitioners of rehabilitation science. This new science is the formal study of processes leading to the return of damaged, degraded and artificial landscapes to some form of agreed stable land use. It is a rapidly-developing and composite discipline drawing its knowledge base from disciplines within the biological, earth and social sciences; it thus demands a broad spectrum of knowledge from its practitioners. Rehabilitation science will clearly play an increasingly-important role in humankind's future and views the post-mining environment as an end member in a spectrum of progressivelysevere disturbance. The geology of the Bowen Basin within which coal mining operations occur (Figure 1) is of importance during exploration, deposit assessment, mining and rehabilitation. Geological information relating to the mining environment has significant practical implications for the siting of infra-structures, the nature of the landforms and waterways to be created, the management of toxic materials and in planning for post-mining rehabilitation. Importantly, it offers an opportunity for more effective integration of knowledge of the behaviour and classification of materials and thus the capacity to predict and to extrapolate. With few exceptions (see, for example, Kelly, 1987; Kelly & Kelly, 1987; Banks, 1990), the implications and use of geological information is frequently unknown, ignored or is not effectively integrated into the body of information used by many rehabilitation practitioners. This paper briefly outlines the actual and potential significance of geological information to rehabilitation practice in the open-cut coal mining industry of the Bowen Basin. It focuses particularly on the problems of soil formation and the
consequent limitations to ecosystem development due to the nature of the overburden materials and the environment. Lastly, it describes some of the distinctive features of the minesoils of the area.
HOW CAN GEOLOGICAL INFORMATION BE USED IN REHABILITATION PRACTICE? Geological concepts and information can contribute directly to rehabilitation through its various sub-disciplines: i. Structural geology - history and gross nature of materials and their placement in the landscape; structural features can also effect the floor stability of the spoil pile and that of final voids (Mallett & others, 1982; Seedsman, 1985); ii. Geomorphology and hydrogeology- nature of the landscape into which the mining operations are to be fitted, the major landscape level processes including erosion, incision and water flows into, over and through landforms; iii. Geochemistry /mineralogy - the detailed character of the materials present. With appropriate interpretation, this will provide considerable insight into the processes that are likely to occur when materials are exposed to weathering processes on the surface, built into tailings dams, etc.; it has implications for soil development, revegetation and water quality. The overburden materials available on any site are, in soil science terms, the parent materials of the soils that will form during weathering. The physical and chemical properties, placement and management of overburden materials will largely circumscribe the development of the ecosystems established on them. Geology potentially offers a rigorous characterisation (texture, structure, composition) of materials that allows extrapolation of materials knowledge and inferred processes at a range of spatial scales.
Bowen Basin Symposium - 1995
148
SARAJI
N
EXMOOR FM
OAKY CREEK/EMERALD AREA
MARIA FM / INGELARA FM ALDEBARAN SANDSTONE
lij!j!j!j:j\~jij:j1!:II Volcanolithic rich sediments
Figure 1. General location map of the Bowen Basin and schematic stratigraphy of the Permian coal Measures. Stratigraphy modified after Draper & Balfe, 1985.
iv. Sedimentology- study of the origin and spatial distribution of parent materials. At the basin scale, sedimentological trends in the Bowen Basin Permian coal measures arise from the interplay of tectonics and depositional palaeoenvironments that are transitional from coastal to deltaic and alluvial plain sequences (summarised in Baker & others, 1993; Falkner & Fielding, 1993; Fielding& others, 1993). The transition from a back-arc extensional to foreland basin resulted in a shift from westerly craton derived, quartz-rich sediments to easterly arc derived volcanolithic-rich sediments (Baker & others, 1993). Provenance, compounded by sedimentological reworking controls the character of the overburden materials which must be rehabilitated. For example, coal mines operating on the western side of the Bowen Basin will handle a spectrum of rock types arising from volcanolithic-rich, sandstone dominated alluvial/upper delta plain palaeoenvironments of the northern Moranbah Coal Measures to quartz-rich sediments of coastal plain to marine paleaoenvironments in the southern German Creek Formation (Figure 1; Banks, 1990). In addition, the quality of coal and coal rejects vary with respect to palaeoenvironment. Overlying
these measures are similarly-variable younger Triassic to Quaternary sediments and Tertiary basalts which are variably overprinted by weathering. At the mine scale, sedimentological variability is often greater than at the basin scale (McLennan, 1994). For rehabilitation purposes, the variability is (and must be) encapsulated into mineable geological units which exhibit different properties as parent materials (pH, EC, C, alkalinity, bulk density, dispersivity, major and trace element chemistry, texture). Commonly, these are: Quaternary alluvium, weathered Tertiary sequences and weathered to fresh Permian coal measures. The coal measures can be subdivided by the proportion of sandstone to silt- or mudstone, carbonaceous materials and coals (Figure 2). The texture and composition of these different units will effect the rates of weathering, soil formation and resulting soil character (Kelly & Kelly, 1987). Lateral trends in the distribution of these units and subunits can be projected down-dip from mining from borehole data obtained during exploration and operations (Kelly & Kelly, 1987). Tonnages and proportions of 'problematic' units to be subject to selective placement on to spoil piles can be
Bowen Basin Symposium - 1995
S
149
SOLUM ZONE OF TERTIARY WEATHERING (sedimentary rock to basalts)
quartz-rich sandstone (/)tn
we ::::, ·.:
cc·s,
(/)0
<( G)
We
:E ·.:
pyritic mudstone coal seam carbonaceous mudstone mudstone
co
volcanolithic sandstone high clay content
- 3: :E.c CC 0 w G) -:::-
mudstone coal ,, ~ . _ carbonaceous mudstone
o: z~ <( CU ft
...
§
-:.:: ~
~
..J CU
c:,: E
ea. 40m
Cl)
::::·:_:·: :.: .:.: volcanolithic sandstone
horizontal distance and structural dip Figure 2. Generalised measured section representing a high wall.
calculated from these data, providing a framework from which to plan rehabilitation practice.
SOIL FORMATION ON BOWEN BASIN POST COAL-MINING OVERBURDENS Soil Formation A soil is defined as a natural body usually differentiated into horizons or layers which differ biologically, chemically and morphologically from their underlying parent materials. At least some of these differences are due to pedogenic processes (Birkeland, 1984). Soils are considered to form under the combined influence of five interacting factors, namely, time, climate, topography, parent materials, and the biota (Johnson & Hole, 1994). However, in contrast to geological materials, soils are essentially biological constructs whose directions and rates of development depend closely on those of the ecosystems of which they form a part. Some significant features of soil formation on Bowen Basin coal mining overburdens:
i. Time. Soils forming in the post-mining
environment are always embryonic and most in the Bowen Basin are less than ea. 35y old (Roe, 1992b). Natural soils form over much longer time scales. Alfisols (Soil Survey Staff, 1992) are well-represented in the Bowen Basin and approximately 10 000y has been considered necessary for the formation of a fully-differentiated profile of this type (Birkeland, 1984). However, certain pedogenic features such as an upper organic (A) horizon form rapidly and are found in some Bowen Basin minesoils, notably where a complete vegetative cover has developed. ii. Climate. The climate of the Bowen Basin is strongly seasonal semi-arid with much of the irregular annual rain falling as storms (Kelly, 1979). In terms of rehabilitation (and thus soil formation), success in establishing vegetation is particularly dependent on rainfall that is both adequate in amount and satisfactorily distributed throughout the wet season; this combination of circumstances is often not met in the Bowen Basin, or elsewhere in semi-arid Australia.
Bowen Basin Symposium - 1995
150
Further, the high intensity of much of this rainfall often compounds the problems of ecosystem establishment and maintenance with accelerated erosion. iii. Topography. In contrast to most natural environments, considerable control of topography is practicable in the post-mining environment of the Bowen Basin although the degree of this is subject to economic constraints. Conventional landforms with long slopes are subject to considerable erosion and further consideration should be given to the nature of the landforms appropriate to dispersive materials. The types of landforms to be created and their associated waterways should differ depending on the properties of the overburden present, the amounts of spoil to be disposed of and other factors. It should be remembered that few examples of stable elevated landforms containing such materials exist in nature. iv. Parent materials. The physical, chemical and mineralogical properties of the parent materials clearly differentiate natural soils from minesoils. As with all incipient soils, the properties of minesoils depend closely on those of their parent materials (Chesworth, 1973). Most natural soils form from such partly-weathered parent materials as saprolite whereas, in the post open-cast coal mining environment, they form on materials that have only been recently exposed. Further, the specific surface areas of such parent materials are raised through the mechanical fragmentation that occurs in the mining process. In discussing the influence of parent rocks on subsequent soil formation, Brewer (1954) considers the following to be of most importance: •
The amounts (and nature) of clay that can be formed by weathering of the parent rock in place. This will largely determine the texture of the soil initially formed. In addition to the finer-grained mudstones and siltstones, volcanolithic-rich sandstones in the Bowen Basin may contain more than 20% inherent clay content (Baker & others, 1993), and the feldspars and micas weather quickly upon exposure. Clays in the Bowen Basin Permian strata are predominantly illite, mixed layer illite/smectite, kaolinite, quartz and chlorite while smectites are dominant in the Tertiary rock units (McLennan, 1994), The amounts of alkali and alkaline earth elements that can be released by mineral weathering. This will determine the nature of the elements that will dominate the soil solution and the exchange coP-'plex and, with selected anions (notably COi ), determine the pH. The presence of large amounts of these elements are considered to inhibit profile differentiation. Kelly & Kelly (1987) found
that, in addition to decreasing salinity, minesoil pH increased in overburden sediments away from the box cut. Na, Ca and Mg are high in spoil leachates in the Bowen Basin. Minerals high in these elements (and in Fe), and common in Bowen Basin sediments are diagenetic carbonates (dolomite, ankerite, calcite), chlorites and clays (J. Baker, personal communication, June, 1995). In addition to Fe, basalts are also rich in K, •
The amount of Fe (ferrous and ferric) that can be released by mineral weathering; for example, weathering of the above minerals and laterisation of basalts result in high Fe and Al concentrations, The rates of release of the above elements through weathering,
•
The permeability of the parent rock. The importance of this is largely modified through mechanical fragmentation by the mining process.
An additional consideration in the post-mining environment is the presence of potentially toxic or inhibitory concentrations of certain elements (or combinations of elements), since these can interact negatively with the biotic component. Swaine (1981) considers that few problems of toxicity are likely to emerge in low S Australian coals since such materials possess only low concentrations of trace elements present as sulphides. Nonetheless, pyrite occurs in some sandstones and other materials and is expressed as acid producing seeps in certain mines, for example, those of the German Creek Formation. Soluble Al concentrations may be high enough to inhibit plant-growth in minesoils more acidic than ea. pH 5. Lastly, the nature of the parent material and the degree of post-mining fragmentation will control the degree of spoil consolidation and the changes that will occur over time. v. Biota. The presence and activity of the biota, its constructs, excretory and other decomposing organic matter derived from it are the critical factors that differentiate soils from raw parent materials. The biotic component must be conceptualised more widely than simply the plant cover, although this latter provides the photosynthetic base on which the remaining biota depends. Because of their close inter-dependency, soil development on recently-exposed substrates must also be considered in combination with the progressive changes that occur in the biological ecosystem components. Odum (1969) has described the substantial qualitative and quantitative changes through which ecosystems progress on the way to maturity. Therefore, due to limited ages, both soils and the ecosystems of
Bowen Basin Symposium - 1995
151
Table 1. The major biological factors that influence soil development and function. i. PLANTS
Major roles: primarily sources of organic matter, additional effects on soil structure and through the formation of the rhizosphere. Major components: >
surface litter (leaves, twigs, bark, woody materials, flowers, fruits, seeds, etc.), root litter;
>
substances exuded or leached from the aerial and underground parts of plants.
ii. ROOT SYMBIONTS
Major roles: primarily enhancement of nutrient supply to the biota but also protection against pathogens and toxic concentrations of certain elements, mediation of other processes promotive of plant growth: Major agents: >
fixers of atmospheric nitrogen (all prokaryotes: bacteria, actinomycetes, cyanobacteria [Cycads]);
>
mycorrhizas, obligate associations between fungi and plant roots, several types.
iii. THE MICROBIOT A
Major roles: primarily agents of decomposition >
decomposers (enzyme sources);
>
autotrophs (cryptogams).
iv. SOIL ANIMALS
Principal roles: decomposers, soil mixers (ecosystem engineers), promoters of gas exchange, infiltration and movement of water within the soil, transport of microbial propagules; Principal groups of relevance in Bowen Basin soils: termites, ants, certain beetles. which they form a part must be regarded as highly immature in the post-mining environment.
Table 1 lists the ecosystem components that have major impacts on soil development. It should be noted that considerable prominence is given to the mechanical role of soil animals and plant roots. Bowen Basin Minesoils
Given the above combinations of soil forming conditions and materials, what are the properties of the resulting Bowen Basin minesoils? Any comprehensive understanding of the Bowen Basin minesoils is some time away. Nonetheless, enough information exists to make some preliminary generalisations and consider these in relation to final uses envisaged for the affected lands. A major feature of these minesoils is their wide variability over a range of spatial scales. Much of this should reflect differences between coal measure overburdens and the segregation of materials that occurs post placement in the landscape. Nonetheless, considerable variation takes place at smaller scales associated with local phenomena such as faults.
In terms of post-placement processes, substantial erosional redistribution of overburden materials occurs with considerable sorting of fine and coarser particles (Figure 3) to produce topographicallyrelated but quite different parent materials and minesoils in defined landscape positions (catenas). Soil development is unlikely to progress far until some degree of physical stability is attained. In considering these minesoils, a distinction has to be made between those forming directly on spoils and those to which substantial quantities of topsoil have been applied (Banks, 1990). The properties of the latter soils will depend largely on the nature and depth of the topsoil applied (Banks, 1990). Plant growth in such topsoils exerts an ameliorative effect on the pH and salt concentrations of the underlying spoils. In terms of their physical properties, Bowen Basin minesoils have only weak horizon development and most have a poorly-developed structure with limited numbers of biologically-produced macropores. Gravel contents are often high in minesoils not subject to erosional sorting; clay and silt contents of the fine earth are variable, both the latter ranging from ea. 5 to 60% (Fitzpatrick & others, 1995) depending on landscape position and the degree of erosional sorting (Figure 3).
Bowen Basin Symposium - 1995
152
--
40..-------------------, Ridge materials
E C 0
30
9-22% coarse sand 20-28% fine sand~ 11-32% silt 36-38% clay
/
~ 20 (1)
c6 (1)
Upper valley site
(1)
16% coarse sand 14% fine sand 33% silt 36%clay
i 10 a: 0
......
100
............ ~
Lower valley site 0% coarse sand 12% fine sand 57% silt 30%clay
200
300
Horizontal distance (m) Figure 3. An example of a sequence of topographically-related minesoils (catena) from the northern end of Blackwater Mine.
Surface crusting (structural, depositional and chemical) and hardsetting are common surface phenomena although the latter may be atypical due to the presence of degrading rock fabric. Dispersivities of the surface crusts and aggregates are also high. Of a total of 37 sites sampled from a variety of landscape positions at Blackwater, Gregory and Saraji Mines, 35 had median dispersion scores above the values at which spontaneous dispersion occurred in deionised water. However, it should be noted that many of the natural soils of the Bowen Basin are also dispersive. Chemical properties are equally varied with differences between mines which may be related to their different lithologies and facies. In recent studies, Spain & others (1995a) reported that minesoil pH values (water, 1:5) ranged from 2.7 in some acid seeps to more than 10. The median value for 223 soils from a range of landscape locations in the three mines above was 7.8 with an interquartile range of 6.9 to 8.8 (Figure 4a). Many Bowen Basin minesoils are saline: 43% of the 223 soils mentioned above had EC values of more than 0.5 dS m-1 (water, 1:5)(Figure 4b). Some local natural soils have similarly high values although the balance of salt concentrations differs between these and the minesoils (Spain & others, 1995a). Exchangeable sodium percentages are frequently high, in keeping with the elevated dispersivities. As in minesoils elsewhere, concentrations of a number of major (particularly N and P) and trace nutrients (for example, Zn and Mo, Evans & others, 1980) may limit plant growth. However, apart from salinity, toxic concentrations of elements appear generally rare. In keeping with the juvenile status of the soils and ecosystems involved, biological activity in
minesoils appears generally low and their organic matter concentrations minimal. Organic inputs from the grass-based systems often sown are of restricted diversity thus limiting the types of decomposer organisms that may colonise their soils. Studies by Fitzpatrick & others (1995) and Tongway & others (1995) have shown that the surface development of biological activity, as reflected by the depth distribution of readily-mineralisable organic nitrogen (Gianello & Bremner, 1986), was often minimal and at best restricted to the top 50mm of the soil. Preliminary estimates of microbial biomass concentrations made across an age series of spoil piles and reconstructed landforms at the three mines listed above indicate generally low values in comparison with local natural soils, except in some low-lying run-on sites. This was not, however, true of soil dehydrogenase activity (Spain & others, 1995b). The propagules of many of the organisms responsible for such ecologically-desirable associations as mycorrhizae and certain nitrogen-fixing associations occur in very low and generally-limiting concentrations. In terms of biomass and activity, the dominant groups of soil animals are the termites and the taxonomically-diverse ants; both are of importance in modifying the physical properties of soils (Stork & Eggleton, 1992). Termites play an additional role as primary decomposer organisms, in conjunction with their internal symbiotic microflora. Soil animal populations are poorly known but appear generally low. Termite and ant activities on spoil piles are related to site age. Where present, termite feeding activities often occur at levels similar to those of the finer-textured natural soils but less than those of coarser texture (Spain & Andersen, 1995).
Bowen Basin Symposium - 1995
153
a. pH (water, 1:5).
en 25
"C L.. 0 0
(l) L..
0
(l) C) ~
C
20 15 10
(l)
~
(l)
a..
5 0
4
5
6
7
8
10
9
11
pH 60r-------------------..
b. EC (water, 1:5).
en
"E 50 0
0
-
30
C
20
(l) L..
40
0
(l) C) ~
(l)
~
(l)
a..
10 0
0.0
0.5 1.0 1.5 2.0 2.5 3.0 Electrical Conductivity (dS/m)
3.5
Figure 4. Frequency distributions of pH (a) and EC (b) (water 1:5) from 223 sites at Blackwater, Gregory and
Saraji Mines.
MINESOIL CLASSIFICATION For purposes of communication and technology transfer at many levels, appropriate systems of classifying minesoils must be developed. These should be included among the other man-influenced soils known as anthrosols (FAQ/UNESCO, 1988) or anthroposols (Isbell, 1993). Work conducted at three Bowen Basin mines has lead to the development of a draft technical classification to serve local needs (Hollingsworth & Fitzpatrick, 1995). The latter classification largely uses readily-observable soil properties and ten separate types of minesoil profiles have been recognised. Further development of this classification is needed to increase its utility.
CONCLUSIONS Soil development and ecosystem establishment in the Bowen Basin are potentially difficult processes to initiate. Nutrient deficiencies and imbalances, high salinities and extreme pH levels together with frequently-difficult physical conditions are common features of these soils. An uncertain and sometimes erosive rainfall combines to exacerbate the parent material problems and such biological characteristics as the extremely-sparse distribution of the propagules of some important root symbionts compound these difficulties. Geological information can assist materially in the identification, classification, description and behaviour of post-mining materials. Potential inputs are not restricted to these and there is scope
Bowen Basin Symposium - 1995
154
for wider inputs to management of the mining environment although the interface with biology requires further development. Post-mining land use has been an issue of continuing concern to the industry and the wider community for some time. It may be asked whether, in light of the properties of many parent materials and the difficulties of establishing stable functional agricultural ecosystems, the time has come to seriously re-consider our options, particularly for the more difficult spoils? Do the costs of establishing such ecosystems and their probable maintenance expenses make a reasonable economic return unlikely? It may be time to consider whether more passive land uses are appropriate, at least until enough time has passed for weathering and soil development to have developed a more stable soil environment.
ACKNOWLEDGEMENTS We gratefully acknowledge the assistance of BHP Australia Coal for access to their mines and for financially supporting the work that was carried out under their Special Research Program.
REFERENCES BANKS, R.J., 1990: Selected geological constraints on rehabilitation. In, Bowen Basin Symposium, 1990, Proceedings, Geological Society of Australia, Brisbane, 144-149. BAKER, J.C., FIELDING, C.R., DE CARITAT, P. & WILKINSON, M.M., 1993: Permian evolution of sandstone composition in a complex back-arc extensional to foreland basin: the Bowen Basin, eastern Australia. Journal of Sedimentary Petrology, 63, 881-893. BIRKELAND, P.W., 1984: Soils and Geomorphology, Oxford University Press, New York. BREWER, R., 1954: Soil parent material. The Australian Journal of Science, 134-138. CHESWORTH, W., 1973: The parent rock effect in the genesis of soil. Geoderma, 10, 215-225. DRAPER, J.J. & BALFE, P.E., 1985: Late Permian stratigraphy - western Bowen Basin, Queensland. In, Advances in the Study of the Sydney Basin,
Proceedings of the 19th Symposium, University of Newcastle, Newcastle, NSW, 106-109. EVANS, M., EMMERTON, B., BELL, L.C. & WHITEMAN, P.C., 1980: Defining rehabilitation limitations and alternatives for a new mine - the arproach at the Gregory opencut coal mine, centra Queensland. In Hannan, J.C. (Editor): Environmental Con trols for Coal Mining, The University of Sydney, Sydney, Australia, 326-339. FALKNER, A. & FIELDING, C., 1993: Quantitative facies
analysis of coal-bearing sequences in the Bowen Basin, Australia: af plications to reservoir description. Specia Publications of the International Association of Sedimentologists, 15, 81-98. FAQ/UNESCO, 1988: FAD- UNESCO Soil Map of the World, Revised Legend. FAD, World Soi[ Resources Report, 60, Rome.
FIELDING, C.R., FALKNER, A.J. & SCOTT, S.G., 1993: Fluvial response to foreland basin overfilling; the Late Permian Rangal Coal Measures in the Bowen Basin, Queensland, Australia. Sedimentary Geology, 85, 475-497. FITZPATRICK, R.W., HOLLINGSWORTH, l.D. & SOOLE, P.K., 1995: Soil description, classification and mapping. In Spain, A.V. & others: Measurement of the rate of soil formation in spoil and rehabilitated spoil landforms at BHP Australia Coal Pty Ltd Mines, Central Queensland. Report to BHP Australia Coal on project 'Soil from Spoil', Minesite Rehabilitation Research Program, CSIRO. GIANELLO, C. & BREMNER, J.M., 1986: Comparison of chemical methods of assessing potentially-available nitrogen in soil. Communications in Soil Science and Plant Analysis, 17, 215-236.
HOLLINGSWORTH, l.D. & FITZPATRICK, R.W., 1995: Technical classification of minesoil and spoil materials from BHP Australia Coal mines in the Bowen Basin, Queensland. Report to BHP Australia Coal on project 'Soil from Spoil', Minesite Rehabilitation Research Program, CSIRO. ISBELL, R.F., 1993: A Classification System for Australian Soils (Third Approximation. CSIRD Division of Soils, Technical Report 2/1993 .
JOHNSON, D.L. & HOLE, F.D., 1994: Soil formation theory: a summary of its principal impacts on geography, geomorphology, soil-geomorphology, Quaternary geology and palaeopedology. In Factors of Soil Formation: A Fiftieth Anniversary Retrospective, Soil Science Society of America,
Madison, Wisconsin, 111-126. KELLY, R.E., 1979: A description of natural environment features of the Isaac River catchment and of coal-strip mining operations. In, Rummery, R.A. & Howes, K.M.W . (Editors): Management of Lands Affected by Mining, Division of Land Resources Management, CSIRO, Floreat Park, W.A., 33-54. KELLY, R.E ., 1987: Drill hole logs provide the third dimension for minespoil reclamation. In, Mining and Environment - A Professional Approach. The Australasian Institute of Mining and Metallurgy, Parkville, Victoria. KELLY, R.E. & KELLY, R.E., 1987: Prediction of some minespoil characteristics from exploration drill hole logs. In, Environmental Workshop, 1987 Papers, Australian Mining Industry Council, Dickson, ACT, Australia. MALLETT, C.W., SEEDSMAN, R.W. & EMERSON, W.W., 1982: The significance of plastic clay horizons in coal measures of the Bowen Basin. Australian Coal Geology, 4, 531-541. McLENNAN, T.P.T., 1994: Review of Research Investigations and Existing Data on the Characteristics of Coal Mining Spoil, Bowen Basin, Central Queensland. Report to BHP Australia Coal, Minesite Rehabilitation Research Program CSIRO, Project MRX0029. ODUM, E.P., 1969: The strategy of ecosystem development. Science, 164, 262-270.
Bowen Basin Symposium - 1995
155
ROE, P.A., 1992a: Mining as a land_use in the Fitzroy Catchment. In, Duivenvoorden, L.J., Yule, D.F., Fairweather, L.E. & Lawrie, A.G. (Editors): Proceedings of the Fitzroy Catchment Symposium, 12-13 November, 1992, University of Central Queensland, Rockhampton, Australia, University of Central Queensland, Queensland Department of Primary Industries, Capricorn Conservation Council, United Graziers Association, Rockhampton, Queensland.
SPAIN, A.V., JONES, D. & McFADZEAN, S., 1995a: Soil and spoil properties: leachates and dispersivities. In, Spain, A.V. & others: Measurement of the rate of soil formation in spoil and rehabilitated spoil landforms at BHP Australia Coal Pty Ltd Mines, Central Queensland. Report to BHP Australia Coal on project 'Soil from Spoil', Minesite Rehabilitation Research Program, CSIRO.
ROE, P.A., 1992b: Overview of environmental practices in the Queensland coal mining industry rehabilitation. Proceedings of the 17th Annual Environmental Workshop, AMIC, Dickson, ACT, 49~5.
SPAIN, A.V., JOYCE, S. & McFADZEAN, S., 1995b: Soil biology. Jn, Spain, A.V. & others: Measurement of the rate of soil formation in spoil and rehabilitated spoil landforms at BHP Australia Coal Pty Ltd Mines, Central Queensland . Report to BHP Australia Coal on project 'Soil from Spoil', Minesite Rehabilitation Research Program, CSIRO.
SEEDSMAN, R.W., 1985: Clay rock diagenesis. In, Bowen Basin Coal Symposium, Geological Society of Australia, Brisbane, 121-122.
STORK, N. & EGGLETON, P., 1992: Invertebrates as determinants and indicators of soil quality. American Journal of Alternative Agriculture, 7, 38-47.
SOIL SURVEY STAFF, 1992: Keys to Soil Taxonomy, 5th edition, SMSS Monograph 19, Pocahontas Press Inc., Blacksburg, Virginia.
SWAINE, D.J., 1981: Trace-element aspects of coal mining, preparation and storage, in J.C. HANNAN (Editor) Environmental Controls for Coal Mining, The University of Sydney, Sydney, Australia, 264-274.
SPAIN, A.V. & ANDERSEN, A.N., 1995: Soi_l fauna. In Spain, A.V. & others: Measurement of the rate of soil formation in spoil and rehabilitated spoil landforms at BHP Australia Coal Pty Ltd Mines, Central Queensland. Report to BHP Australia Coal on project 'Soil from Spoil', Minesite Rehabilitation Research Program, CSIRO.
TONGWAY, D., HINDLEY, N. & LUDWIG,}., 1995: Soil nutrient build-up study. In, Spain, A.V. & others: Measurement of the rate of soil formation in spoil and rehabilitated spoil landforms at BHP Australia Coal Pty Ltd Mines, Central Queensland. Report to BHP Australia Coal on project 'Soil from Spoil', Minesite Rehabilitation Research Program, CSIRO.
Bowen Basin Symposium - 1995
156
Bowen Basin Symposium - 1995
157
The Appl_ication; of SIRpLQG ~o predicting
coal quality variations 1n s1tu, in a steaming coal operation Mark Biggs, Callide Coalfields Pty Ltd
Callide Coalfields produces a sub-bituminous, very sub-hydrous, low rank, steaming coal with good combustion properties, primarily for domestic power generation. At the Boundary Hill Mine, one of two operated by Callide Coalfields Pty Limited in the Callide Coal Measures Basin, the iron content of mined coal is unpredictably variable in both a vertical and lateral sense within and between seams. This variability creates problems in predicting the slagging behaviour of as-received coal during combustion especially where the iron content of the ash exceeds 19%. Therefore, if patterns in this variability could be determined and related to some geological property or process of formation of the coal seams, then areas of high iron might be predicted in advance of mining. Since 1992 ongoing collection and interpretation of SIROLOG downhole geophysical log data has significantly contributed to a number of research projects related to gaining a preliminary understanding of the iron distribution and formation during the Coal Measures' deposition. Because the probe was able to record variations in coal mineral matter content, it was found to complement more conventional techniques such as reflected light petrography, X-Ray Diffraction and SEM techniques that examine the mineralogy of iron species. Additionally, software has been developed to allow integration of SIROLOG data into existing geology databases, enhancing coal quality modelling and daily prediction of parameters such as raw ash, silica and iron contents and ash fusion parameters. The correlation of SIROLOG-derived iron geophysical traces between drillholes and other sample points highlighted lithological and structural controls to the iron distribution in the sequence previously not detected. This work has allowed the development of a methodology for predicting iron in advance of mining and reconciling as sold coal quality to that predicted. Predictions are currently being assessed at the coal face as mining progresses through high-iron zones. Keywords : Callide Coal Measures, SIROLOG, iron mineralogy in coal, log correlations, prediction.
INTRODUCTION AND SCOPE The Callide Coal Measures Basin is located approximately 120km south-west of Gladstone and 450km north-north-west of Brisbane in eastern Central Queensland. The coalfield covers an area of about 18 000h and is located within a north-west to south-east trending synclinal basin 22.5km long by 8km wide (Figure 1). Present open-cut mining operations are located in the Dunn Creek, Trap Gully and The Hut areas in the south as part of the Callide Mine, and at Boundary Hill in the north-west of the basin. At Boundary Hill most of the coal is won from the Callide Seam Member of the Callide Coal Measures. This unit is Late Triassic and contains alternating sequences of conglomerate, sandstone, siltstone, mudstone, carbonaceous shale, and sub-bituminous durainous coal of varying hardness and thickness. A detailed description of the geology of the area is given by Biggs & others (1995). Current mining seam thicknesses are 16-21m at Boundary Hill. Seam thicknesses down to, and including 0.3m can be encountered. Figure 2 outlines some typical geophysical signatures of the various coal seam horizons. Coal quality parameters vary widely vertically and laterally, eg. Total Moisture (16-20%), Raw Ash (8-28%), Iron oxide in Coal Ash (0.5-72.0%), and Initial Deformation Temperature, reducing atmosphere (1080-1600+ °C). Boundary Hill Mine has been experiencing (since July, 1992) sporadic but serious supply problems to Queensland Alumina Limited (QAL), in that when mining from Blocks 8, 9 and 10 coal with an unusually high and variable iron oxide in ash content was being encountered. Iron contents above 19% appear to be a pre-condition, if not probably causation, of slagging in QAL's boilers. A lack of information for mining planning purposes prompted a major investigation into explaining the iron oxide's formation, occurrence and measurement. The work program was performed by Technical Services staff in combination with external academic researchers. Throughout 1993 a number of these research projects related to gaining a preliminary understanding of the iron distribution and formation were undertaken:- Dr J Patterson, CSIRO - Division of Coal and Energy Technology (Patterson & Marvig, 1993) investigated through SEM techniques the mineralogy of iron species; Dr J Esterle, CSIRO - Division of Exploration and
Bowen Basin 1995 - Symposium
158
tJ
I ff
COIONO CCML COIONO ANO 1HE111Mt. CIMl. 1HEIIIMI. CCML ~ CQU.
0
10WH Olf CITY
•
tM,t£
..... EXl'OlfTl'otrT
SCALE 1 y Il<llomwN '.l° I 2r
LOCATION OF
CAWDE COALFIELDS EPC188 CAil.JDE
I
~
TRAP OULLY
CALLIDE COALFIELDS DISTRIBUTION OF COAL DEPOSITS
CALLIDE MINE
-
\Ud'
Figure 1. Locality map coal measures basin.
Bowen Basin 1995 - Symposium
159
indicator kriging and/ or conditional simulation as suitable modelling algorithms for predicting the behaviour of the iron content on a seam-by-seam basis.
BULK DENSITY SEAMS
C2027
a::: w
CD ~
w
~ ~ <(
w
U1
w
0
_.J
_J
<(
u
Callide Coalfields work on-site (Biggs, 1994) involved a drilling program (see Figure 3), of 164 in-pit quality holes (157mm diameter) at detailed spacings (<20m) and 14 rotary chip exploration holes (120mm diameter). A program of downhole geophysical logging of the above holes using the neutron-gamma SIROLOG tool, contracted from Auslog Pty Ltd. was completed. Parameters such as raw ash, total iron in coal and silica were estimated. Since July 1993 Callide has been using its own probe. This information enabled updating of the Boundary Hill quality database which in turn allowed rigorous statistical analyses of available values (by seam) and a trial of geostatistical (ordinary kriging) methods for selected seams to be undertaken. Lithological and structural mapping of the highwalls (Godfrey, 1994) provided invaluable information on observable iron mineral affiliations within the coal measure sequence (Figure 4). This paper examines the role SIROLOG played during these internal and external investigations.
SIROLOG METHODOLOGY It has been shown through past research and practice at Callide that the prompt neutron-gamma method (neutron-capture) can be employed for the determination of ash and some of its constituents in coal seams which are intersected by boreholes (Charbucinski & others, 1986; Biggs, 1990; 1991; Borsaru & others, 1991; 1993a,b).
Disconformity
sou 3000
0
Angular Unconformity
Figure 2. Long-spaced density geophysical response from Boundary Hill mine. The mine working section covers various plies of the 'A' seam.
Mining (Esterle, 1994) examined the vertical and lateral variability in petrographic composition and iron content in the context of the geological environment under which the deposit formed; Dr C R Fielding, University of Queensland (Fielding, 1993) investigated the sedimentological and structural controls on high iron distribution; and Dr E Baafi, University of Wollongong (Baafi, 1993) began preliminary investigations into using
All the boreholes logged were water-filled and the probe was centralised during logging operations. The logging probe used was of 70mm external diameter and was fabricated from aluminium 3.2mm thick. The scintillation detector in the probe was a 76 x 38mm BGO (Bi4Ge3O12)detector. A section of the exterior of the probe barrel (about 40cm in length), located so that the detector was rough~ at the centre of this section, was painted with 1 B. This reduced the background in the capture spectrum produced by the thermal neutrons which interact with the probe, the photomultiplier and the electronic components. The neutron source used was 5.0µg of 252 Cf (source activity = 118.4Mbq). The source to detector distance was 15cm. The capture spectrum was dumped onto the hard disk of a laptop computer every 10cm logged. The logging speed was 2m/min.
PRINCIPLE OF RAW ASH DETERMINATION The ash content of a coal sample is the weight percentage of residue after combustion; and is closely related to the mineral content of coal. The determination of ash in coal seams by the neutron-gamma method relies on the correlation between ash content and a combination of two or
Bowen Basin 1995 - Symposium
160 8Q ~-~----------.- ------------,--- --------r-----= ;:--------. 0 C\I C\I
C')
r-.
I.'~ •. ~--P. • .•.
z
✓,
0
Q
... CIO
C\I
(')
r-.
+
+
I
' , . . •
o
o
0
•
.,..,......,.. • • 0 O
••
---
•
• •
:-. /...-::::. • . . .. I • • • • • •• •• • • .. • I• •• • • 0
0
••••
:z: Q 0
....CDC\I C')
r,.
+
+
• •• • • ••
I
~
•
•
0
•
\
•
• •
z0
...~ C\I
(')
r-.
•
+ •
:z: C 0
- + C\I
CII (') r,.
0
•
•
(')
r-.
+
• •
i • :+. .,., ,. "'• • \1: • ••• 0
.,,,.
.,,,.
• • ...
f....
C
•
0
• •
~j
....0C\l
0
•
\ \ \ \
• • •
z 0
• •
0
• • •
• •
• •
• •
'
0
t~-+·-·_r \
\
"·•.' . \
·\ I •
h \\
\
•
\
\ \
.
\ \
Figure 3. Boundary Hill deposit; blocks 8-10. Location of 1992-1993 iron study boreholes and structural features.
Bowen Basin 1995 - Symposium
161
TABLE 1. NEUTRON CAPTURE DATA FOR MAJOR COMPONENTS IN COAL ASH (modified after Charbucinski & others, 1986). Capture Cross-section cr(barn=10-12 cm)
Major gamma rays (MeV)
Aluminium (26.98)
0.23
Silicon (28.09)
0.1 6
Chlorine (35.45)
33.0
Iron (55.85)
2.55
Manganese (54.94)
13.0
Titanium (47.90)
6.1
Calcium (40.08)
0.43
Sulphur (32.06)
0.52
7.72 7.69 8.47 7.20 6.38 4.93 3.54 7.41 7.79 8.58 7.65 7.63 8.88 9.30 7.06 7.16 7.24 7.27 6.76 6.56 6.42 4.88 1.38 6.42 4.42 1.94 8.60 7.80 5.42 4.87 3.22 2.93 2.38 0.84
Element (atomic mass)
three of the main constituents of ash, such as Al, Si and Fe (see Figure 5). Since the reaction probability of capture-gamma ray emission per nucleus for Al is much lower than for Si and Fe, the determinations of ash relies mostly on the correlation between ash content and the sum of Fe and Si contents (Charbuckinski & others, 1986). The neutron-capture technique can cope with wide variation in Fe or Si, because their contributions to the ash are measured separately in the capture spectrum and not through the average atomic number (Zeq), as in the gamma-gamma method (Borsaru & others, 1993b). The logging method described here employs the neutron capture reaction. The compound nucleus formed in neutron capture decays almost instantaneously, emitting gamma radiation. Due to its high hydrogen content, coal is an excellent matrix for this technique. The neutrons emitted are thermalised by colliding with the hydrogen nuclei present in coal, and they subsequently interact with the nuclei from the coal matrix. An advantage of this technique is that the major gamma rays, produced by the main constituents of the mineral
Gamma-ray intensity (I) per 100 neutron radiative captures 27.40 4.20 2.44 7.80 12.40 62.70 68.00 10.40 8.55 2.91 22.10 27.20 0.74 4.15 11.06 5.80 12.10 3.36 24.20 4.70 30.10 5.20 69.00 38.90 14.90 72.50 2.70 3.90 59.10 11.50 27.10 22.30 44.5 75.5
matter in coal (Al, Si, Fe, Ca, Ti, S), have energies above 3 MeV (Table 1). This level makes the prompt neutron-gamma method less sensitive to interferences from other neutron interactions (Charbuckinski & others, 1986). An example of a full neutron-gamma spectra in a coal seam (for a high ash, moderate iron zone) are shown in Figure 6a. The peaks seen in the spectra are from boron (0.48 MeV), hydrogen (2.22 MeV), and silicon (3.54 and 4.93 MeV). The resolution of the BGO detector and the counting statistics are insufficient to observe clearly identifiable peaks corresponding to Fe, Al, Ca, and Ti. Although individual concentrations cannot be measured, it is possible to set windows in the spectrum which correspond to combinations of these elements. Current calibration equations for ash integrate counts in the 2.6-5.18 Mev region.
PRINCIPLE OF IRON DETERMINATION The variation in the concentration of Fe in the two coal zones from the same borehole as displayed in Figure 6a is evident in Figure 6b through the
Bowen Basin 1995 - Symposium
162
TABLE 2. PRINCIPLE IRON-BEARING MINERALS IDENTIFIED IN CALLIDE COAL. GROUP
MINERAL
FORMULA
ABUNDANCE (% vol of mineral matter)
SILICATES
Chlorite Biotite Expandable lattice clays
OXIDES
Goetbde •· •·•
(Mg,Fe,Al).(A1Si40,.)(0H), K(MgFe),(AISi,O ,.)(OH), variable
0-8 0-8 0-9
~~/
Fe,03 .,
HFeO...
0-40 0- 10
Lirnonite
FeO(OH).nH,0
trace
CARBONATES
Siderite
FeCO,
0- 75
SULPHIDES
Pyrite
FeS,
0-2
SULPHATES
Coquimbite Natrojarosite
Fe,(SO.),. 9H20 NaFe,(SO.),(OH),
trace trace
after Ward (1990); Faraj (1993) ; Patterson and Marvig (1993)
variation in the intensity of the two dominant Fe peaks at 7.63, 7.64, and 9.30 MeV in the capture spectrum, although these are not separated due to the poor resolution of the scintillation detector). The two gamma-ray spectra shown were calculated averaging the count rates over an approximately 2 m thick interval, one having low ash and iron and the other high ash and moderate iron. Iron values are calculated by integrating counts in the energy window 7.0-8.0 MeV and divided by the count-rate in the energy window 2.08-2.38 MeV (Hydrogen). This window measures the variation of the thermal neutron flux surrounding the probe at the location of the BGO detector (Borsaru & others 1988). Iron-sourced gamma rays have higher energies than many gamma rays released in capture process by other elements commonly present in coal, and therefore are easily distinguishable in the neutron-gamma spectrum. Possible interference could be produced by Cl (7.41, 7.79 MeV) if present in noticeable quantities (Borsaru, 1991). When there is a large variation in Silicon (7.20 MeV) and Aluminium (7.69, 7.72 MeV) in the coal seams, they can also present a source of interference, although not of significant magnitude.
DATA INTERPRETATION AND DISPLAY Gamma-ray spectra recorded downhole are transferred to a binary raw data file. Modularised, dos-based interpretation software (SiroView) has been developed in collaboration with the CSIRO -Division of Exploration and Mining to allow processing of this data on desktop or notebook computers (Figure 7). Options include nomination of variables of interest eg. density, display, seam/interval selection, calculation of quality parameters and output of data to printer or ASCII
files for transfer to spreadsheet or other mine planning software. Figure 8 displays ash and iron ratio trace data transferred to spreadsheet for a borehole at Boundary Hill with high iron in ash levels. It reveals the variable nature of the iron distribution and its effect on the ash ratio values (and subsequent raw ash estimates).
STATISTICAL ANALYSES Data provided by the SIROLOG probe was used as an adjunct to existing laboratory analyses to enable interrogation of iron variations on a seam by seam basis. Basic statistical analyses have been undertaken by both mine personnel and Dr E Baafi (Baafi, 1993) . He found that there is a significant difference in the number of samples for each seam (as much as at least twice SIROLOG iron data compared with the number of analytical data). This effect is greater for the lower seams where the number of samples decrease (see Figure 9). In general, both the mean and median of iron do not vary considerably from seam to seam, withe A3X having both the highest mean and variability of iron, while the AS seam has the lowest mean and variability of iron. Figure 10 graphically displays a comparison between laboratory analyses and SIROLOG estimates, by seam, for ash and iron in the original calibration cored holes. Baafi (1993) found significant correlations between analysed iron and silica, aluminium and SIROLOG iron. The ash estimates from the neutron gamma SIROLOG system (between the original calibration ranges of 9 to 40%) are highly correlated with lab analyses (r2 = 0.93; rms deviation= 1.94% ash) . More scatter is seen for the iron estimates (r2 =0.79; rms deviation= 0.88% total iron), with Biggs (1991) accounting for the difference between an analysed
Bowen Basin 1995 - Symposium
163
I
ZONE OF HIGH IRON
I CLEATS/
-f11NlS
A1
W.ff $1DlfAITI!
I
As
S/NW
N
Figure 4. High wall map of Block 8, Boundary Hill Mine, showing distribution of visible siderite relative to elastic partings and seam boundaries. Modified after Fielding (1993); Esterle (1994).
and a derived iron value as being due to one or a combinatio n of the following factors: • The drill core samples used for calibration are smaller samples than that logged by the SIROLOG probe and are less representat ive (100mm versus~ 1000mm) •
Calibration is based on plotting ash and ash analyses versus probe response to obtain the linear relationships. Australian black coals commonly contain 1% carbonate which is lost upon ignition, and consequent ly is not accounted for by the multiple linear relationship .
•
Sample laboratory error.
•
Random error.
Current calibration equations over-estima te real iron values below 6%. Histograms were plotted for both the analytical and SIROLOG estimated iron values for each seam. In general most iron population s are normally distributed , the SIROLOG estimates tend to be more symmetrica lly distributed more than the analytical iron grades (the analytical values are slightly positively skewed), but this may be due to the reduced number of data points used (Baafi, 1993)
CHARAC TERISAT ION OF MINERA L MATTER Detailed work on mineral matter at Boundary Hill has been undertaken by Ward (1990) who subjected coal samples to low temperatur e radio-frequ ency ashing and XRD techniques; Faraj (1993) and Patterson & Marvig (1993), whose work involved scanning electron microscopy and microprobe analyses of coal seam composites. Results of this work are summarise d in Table 2. The important minerals detected in Callide Basin coals were in decreasing order, kaolinite, siderite, goethite, quartz and pyrite. Trace minerals detected were titanium oxide, ilmenite, pyrrhotite, sphalerite, zircon and chakopyrit e. Calcium and magnesium appear to be organically bound in the coal. Three iron containing minerals, siderite, goethite and pyrite account for the bulk of iron present in the coal samples examined. The siderite has been found to be partially oxidised to an iron hydroxide phase, suggested to be cryptocryst alline goethite (FeOOH). Relative amounts of siderite and associated goethite are not known, however these minerals are dominant throughout and clearly changes in their abundance account for the high and variable iron contents of Boundary Hill coal. (Patterson & Marvig 1993) Additionall y, two main forms of siderite with essentially identical chemical compositio n were
Bowen Basin 1995 - Symposiu m
164
30
20 10
50 45
35 30
25 8 Silica Oxide in Ash %
Raw Ash % (ar)
Figure 5. Boundary Hill Deposit: Al seam 3D Plot of Silica, Raw Ash and Iron Oxide.
observed by Faraj (1993) in variable amounts. Siderite nodules formed early in diagenesis and cleat/vein and other infillings in coal, presumably formed much later after consolidation of the coal. The chemical composition of siderite was essentially the same regardless of form, locality or stratigraphic depth and therefore is not a useful indicator of changes in depositional environment or different stages of diagenesis. The average formula determined by Patterson & Marvig (1993) is Feo.9sMno.02Cao.01 C03. Attempts were made to investigate the correlation of SIROLOG iron and silica data with mineral matter determination, however as Figure 11 demonstrates, the simple mineralogy and known chemistry of the major minerals would allow good estimates of siderite and pyrite contents from chemical analyses for inorganic C and pyritic S in the coal. The balance of total iron could then be expressed as goethite.
IRON FACIES DISTRIBUTION Fielding (1993) has studied the distribution and origin of the iron fades from a geological perspective by combining outcrop observations
with detailed chemical analyses of core samples, SIROLOG iron trace fence diagrams, and a more extensive set of SIROLOG iron estimates and chemical analyses on a seam by seam basis. Contouring of iron in ash was initially conducted on a seam basis revealed a pattern of east-north-east trending highs and lows, in positions which varied between seams. This trend is coincident with the dominant orthogonal joint sets (so· and 310 ·) in the mine, as defined in igneous intrusions, faults, joints, coal cleats and air-photo linears. Both outcrop observations and quantitative iron data suggest, however, that the distribution of iron is too complex to be adequately expressed in seam by seam maps. Rather, iron minerals occur as an overlapping network of laterally discontinuous patches and zones throughout the coal body, across the mine area. To overcome this a working section composited iron colour shaded contour map was generated (Figure 12). Some association with structural features is clearly evident on the plan. Fielding (1993), in agreement with previous workers, found that much of the iron is present as siderite, but in two forms. The first phase of
Bowen Basin 1995 - Symposium
165
Boundary Hill : C2922 · •· ·•·•· Full Spectrum fif01fBHfaTfilil¾fit1f@EI~FmJFi!
f>
Spectrum : 61.90 - 63.20 m 26.8 % raw ash
Boundary Hill : C2922 Detailed Neutron Gamma Spectrum 200 190 180 170 160 150 •. 140 130 ~ 120 ex: 110 100 90 0 80 70
□ low_iron
Elhigh_fe ■ Titanium ■ Silica
-=
■ Calcium
-u==
60
50 40 30
■ Manganese ■ Iron ■ Aiuminiu,m C
20
10
Energy Kev
Figure 6. a. C2922 Full neutron-gamma spectrum for a high ash, moderately high iron interval. b. C2922 Comparison of detailed neutron -gamma spectrum for low and high zones.
siderite formed during the accumulation of shallow burial of the formative peat. A second, more widely distributed phase, formed much later at elevated temperatures and associated with circulating ground waters. The second phase overlaps considerably with the first, but is concentrated along thin beds of powdered coal (sooty coal); adjacent to elastic partings; along structural discontinuitie s; and near igneous intrusions and mafic dykes (Godfrey, 1994).Fielding (1993) noted that iron estimates from the SIROLOG probe were only generalising the iron occurrence and could not differentiate between these different phases, but
that the technique should be used in conjunction with aerial mapping of zones of structural disturbance; isopach mapping of elastic partings; delineation of areas and seams affected by structuring and adjacent to thick elastic partings.
COAL PETROLOG Y In conjunction with Fielding's study, a detailed petrographic study was undertaken by Esterle (1994) to determine whether high iron occurrence could be related to coal fades distributions within the seams at Boundary Hill Mine. Her study
Bowen Basin 1995 - Symposium
=
0
~
II>
=s
= ...=s Ill
fll
...
\D \D I.II
r:Jl
'<
a
"O 0
... fll
s::
a
Figure 7. Siroview "FlO" option display.
167
Boundary Hill : C2922 • n-g SIROLOG Trace
Figure 8. Boundary Hill: C2922 n-g SIROLOG Trace.
Bounda Com
•
f<',%.J • .ABORATO V -SIROLOG
,..._n(estfe) siro
Seam .
Figure 9. Comparison between analysed and estimated iron. Boundary Hill December 1993.
examined the vertical and lateral variability in petrographic composition and iron content in the context of the geological environment under which the deposit formed. One of her objectives was to determine the relationship between coal fades distribution and quality, including iron content and SIROLOG traces. Esterle (1994) found that detailed examination of high peaks on the SIROLOG iron ratio ("FERAT") traces show that they can be correlated for up to
500m (Figure 13). Although high iron zones occurring vertically within seams are often associated spatially with elastic partings (as exemplified by peaks in the "FERAT" traces) there is no statistical relationship between raw ash yield and high iron (Figure 11). The vertical variability in iron content of coal seams within a profile is not consistent across the deposit, but correlations can be made between closely spaced boreholes. As previously mentioned, the
Bowen Basin 1995 - Symposium
168
Boundary Hill 1986-9 g-g SIROLOG Calibration 35 30 • Seam Composites -Linear (Seam Composites)
y =0.9648x + 1.5401 • 2
R = 0.9258 5
25.00
5.00
30.00
35.00
Lab Raw Ash(% ar)
Boundary Hill 1998 n-g SIROLOG CALIBRATION 6.00
= 0
--= i..
5.00 4.00
1-4
0
E,-1
J·-
C2866, Q0910 -Linear (C2866, Q0910) ♦
Q
c., ~ 3.00 0 2.00 ~ 0 =: .1.00
y
=0.8393x + 0.8884 R2 =0.7945
1-4
00
0.00 0.00
1.00
2.00
3.00
4.00
5.00
6.00
Lab Total Iron %
Figure 10. Boundary Hill ash and iron calibrations.
SIROLOG FERAT traces in some boreholes show iron peaks occurring at 1 to 3m spacings within seams, and between visible elastic partings, similar to the spacings of petrographic cycle boundaries(Figure 13). Previous work by Esterle (1992) had established that for Callide Coal vitrinite content can be reasonably estimated from volatile matter (on a daf basis). It was hoped that SIROLOG could be used to estimate macerals. Esterle (1994) conducted a comparison of iron content with petrographic composition for L2916 (Figure 11 shows telovitrinite and mineral matter plotted against iron). As suggested by the comparisons of iron with megascopic coal types and raw ash, there is no direct correlation between iron content and maceral composition. In this borehole, iron contents are highest in the top and bottom of the A2 to A41 sequence, subjacent to the roof and floor.
CONCLUSIONS During 1993 research was undertaken on a number of topics relating to examining the high and variable iron in ash content of Boundary Hill coal. Although it was only one of a number of techniques used, information gained from configuring the SIROLOG probe to measure in situ raw ash, silica and iron provided a major adjunct to existing laboratory analyses. Examination of downhole traces complemented mapping of highwall exposures, and indeed did highlight that the rates of spatial variability in iron content at Boundary Hill are high. Other techniques were used by researchers to identify two phases of emplacement of the major iron mineral - siderite. One phase is thought to occur syn- to epigenetic with peat accumulation and early burial history, the other post-coalification and associated with intrusive volcanics and groundwater movement. This
Bowen Basin 1995 - Symposium
169 ~
~
r. ~ ~ g ~ g g ; ~ g g g g ~ *g
0
C
C
O
O
:
O
C
0
0
C
0
C
0
~AihAiAKttif'--'-·-
J
, , , ,
p:o 1 etrR , e,,t Afh 0
~
~
~
~
~
~
~
~
~
~
, , , , , ~
~
~
~
0
n ~ ~ : I g ~ ~ , S I i 8 ~ ~ .,O Figure 11. Boundary Hill, comparison of mineral matter determinations.
variability creates difficulties in predicting zones of high iron in advance of mining, as noted in Table 3 below. Variations between iron predictions and as-dispatched quality are thought to be due to blending operations and the difficulties in accurately representing reality using grid-based modelling algorithms.
the sedimentological features. The proportions of each phase are as yet unknown. SIROLOG is a unsuitable tool in this regard , being only capable of measuring total element (eg. iron) concentrations.
Detailed investigations of mineral and maceral associations by Esterle (1994) suggest that a cyclicity in petrographic variation within seam profiles occurs which can be related to episodic flooding with water both laden, and devoid, of sediment during the peat accumulation of the seams. These flooding events control the mineable geometry of the deposits by means of simple seam splitting and increase in raw ash contents, as shown in SIROLOG fence diagrams.
At the highwall scale, iron mineralisation decreases rapidly (within a few hundred metres) away from dykes, faults and joints. It is suggested that in addition to following vertical features such as faults/joints and cleat, secondary iron mineralisation in these are~s of high iron have followed horizontal discontinuities within seams. These discontinuities were created by elastic partings, boundaries between petrographic cycles, small scale erosive features and fracture zones caused by compressive deformation (Esterle, 1994; Godfrey, 1994).
The scale of vertical variability in iron parallels the cyclicity in maceral composition in the northern end of the mine, but not the southern (Esterle, 1994). Seam splitting and thinning is also more common in the northern area. However, work by Fielding (1993) suggests that much of the iron mineralisation is secondary and distributed relative to the structural grain of the geology, rather than
The use of SIROLOG has contributed significantly to this iron study in three areas. The system was firstly utilised as a source of routine downhole geophysical data , providing detailed information on seam thickness and correlation, and the presence and thickness of elastic partings. Additionally it significantly enhanced the deposits' coal quality database by the ability of on-site technical
Bowen Basin 1995 - Symposium
170
z
C
- + C
+
Cl0
CII (")
r-,
z
C
- + C CD
CII (") r-,
z
C
- + C
....
CII
(")
r-,
z
C C CII
\
C\l
\
- + (")
r-,
zC
0 Cl0
C C\l
(")
r-,
245600E UMOOB 2452008 2448008 2-4-!l000B Figure 12. Boundary Hill deposit, composite iron oxide in ash%, seams Al-AS. Also showing dykes, faults, linears and intrusion. Lighter shading denotes higher values.
Bowen Basin 1995 - Symposium
z
z
-
-
0 0
«>
C\l
(')
r-
0
....0 C\l
(')
r-
250RL
250RL 20 20
40
40
200RL
= ,... \0 \0 ~
tl'J
'<
a
"0 0
...
<I>
s::
a 150RL
2455508 7321718N
2452778 7321415N
2453378 7321305N
2454318 7321132N
Figure 13. Typical north-south cross-section at Boundary Hill showing modelled seams and SIROLOG "FERAT" traces downhole.
2455898 7320902N
,...
,...
-.;J
172
TABLE 3. BOUNDARY HILL STRIP 1: MONTHLY PREDICTED VS ACTUAL COAL QUALITY DISPATCHED. MONTH PREDICTED 1994
September October November December
Total Moisture %
17.8 18.1 17.2 18.0
ACTUAL Total Moisture %
PREDICTED ACTUAL Raw Ash (ar) %
17.0 16.8 17.3 17.3
Raw Ash (ar) 11,
14.0 13.8 14.0 13.2
14.9 13.6 14.6 14.9
personnel to generate satisfactorily accurate raw coal quality estimates of in situ ash, silica and total iron. Finally, relevant data was transferred to sophisticated mine planning software which enabled a series of fence diagrams and colour shaded contour maps to be generated, so as to investigate the vertical and lateral distribution of iron facies across the deposit. Work is continuing in examining in more detail the correlation of SIROLOG iron traces between drillholes and other coal quality parameters such as macerals, mineral matter and ash fusion temperatures
PREDICTED
ACTUAL
PREDICTED
ACTUAL
Spee. Enc (ar) MJ/kg
Spee. Enc Car) MJ/ka
Fe,<>, In Ash (db) %
Ft,<>, In Ash (db) 11>
19.68 19.63 19.52 19.92
19.95 20.46 19.98 19.85
14.21 16.90 20.09 19.36
11.55 14.17 15.37 15.94
BORSARU, M., BIGGS, M.S. & NICHOLS, W.J.F., 1993a: Neutron-Gamma Logging for Iron in Coal and Implications for Estimating the Ash Fusion characteristics at Callide Mine. Nuclear Geophysics, 7(4), 539-545. BORSARU, M., MILLITZ, P. & CERAVOLO, C., 1993b: Comparison Between the Neutron-Gamma and Gamma- Gamma Techniques for Ash Prediction in 140mm Diameter Quality Holes at the Callide Mine. Nuclear Geophysics, 7(1), 125-132. CHARBUCINSKI, J., YOUL, S.F., EISLER, P.L. & BORSARU, M., 1986: Prompt Neutron Gamma Logging for Coal Ash in Water Filled Boreholes. Geophysics, 51, 5, 1110-1118.
REFERENCES
ESTERLE, J.S., 1992: Macera! Reflectance Variability and Recognition in Callide Coals. Report IR 174. CSIRO, Division of Geomechanics, 1-30 (December 1992).
BAAFI, E., 1993: Basic Data Analysis of Iron Values Callide Coalfields - Boundary Hill Mine. Report of the Department of Civil and Mining Engineering, University of Wollongong, (December, 1993), 1-18.
ESTERLE, J.S., 1994: Petrographic Variation in Coal Seams at Boundary Hill Mine, Callide Coalfields, and its relation to Iron Content, Report SA, CSIRO -Division of Exploration and Mining, 1-45 (January 1994).
BIGGS, M.S., 1990: The Use of New Techniques in Computerised Data Recording and Downhole Geophysical Logging using SIROLOG During Drilling Programs at Callide Coalfields. In Beeston J.W. (Compiler): Proceedings of the Bowen Basin Symposium 1990, Geological Society of Australia (Qld), Mackay, September 1990, 163-180.
FIELDING, C., R. 1993: Origin and Distribution of Iron-Bearing Minerals in Coal Seams at the Boundary Hill Mine. Dept of Earth Sciences, University of Queensland, 1-12 (Nov 1993).
BIGGS, M.S., 1991: The Application of Neutron-Gamma Sirolog to Estimate Iron Content in Coal and Implication for Estimating Ash Fusion Characteristics. In Griffiths P. (Editor): Queensland Coal Symposium, Australian Institute of Mining and Metalurgy, Brisbane, Qtd, 187-198.
FLOOD, P.G., 1982: Fades Modelling and Palaeoenvironmental Reconstruction of Coal Measure Sedimentation Within Several Queensland Coal Basins. NERDDP Grant Report, 120. FARAJ, B.S.M., 1993: Investigations into Iron Mineralisation in Boundary Hill Coal, Department of Earth Sciences, University of Queensland, 1-3 (25 May 1993).
BIGGS, M.S., 1994: An investigation into the High and Variable Iron content in Coal at Boundary Hill, 1993 Annual Progress Report #1, Callide Coalfields Pty Limited, 1:-23.
GODFREY, N.H., 1994: Brief report on Trial Highwall Mapping of Geology at Boundary Hill Pit Box Cut, Callide Coal Mine. Gary Leblang and Associates, unpublished report to Callide Coalfields, 1-18.
BIGGS, M.S., BURGESS, A.W. & PATRICK, R.B., 1995: Callide Basin. In Ward, C.R., Harrington, H.J., Mallet, C.W. & Beeston, J.W. (Editors): Geology of Australian Coal Basins, Geological Society of Australia, Coal Geology Group Special Publication, 1, 471-488.
JUNIPER, L., 1993: Slagging Investigations at Callide "B" Power Station. Combustion News, November 1993. Australian Combustion Technology Centre, 1-2.
BORSARU, M., CHARBUCINSKI, J., HUPPERT, P., YOUL, S.F. & EISLER, P.L., 1988: Coal Ash Determination in Dry Boreholes by the Neutron Capture Technique. Nuclear Geophysics, 2(4), 201-206.
PATTERSON, J.H., & MARVIG, P., 1993: Characterisation of Iron Containing Minerals in Callide Basin Coals. Report CET /IR184R, CSIRO - Division of Coal and Energy Technology, unpublished report, 1-10 (December 1993).
BORSARU, M., CHARBUCINSKI, J., EISLER, P.L. & YOUL, S.F., 1991: Neutron-Gamma Logging in Coal Seams of Variable Iron Content. Nuclear Geophysics, 5(1/2), 117-122.
WARD, C.R., 1990: Mineral Matter Analysis of Coal Samples from Callide, Queensland, Report R685 by Unisearch for Callide Coalfields Pty Limited, University of New South Wales, 1-16.
Bowen Basin 1995 - Symposium
173
An improved ash fusion test Charles DA Coin, Hakan Kahraman & Adrian P Reifenstein ACIRL Ltd
A new method of the measurement of ash fusion temperatures has been developed using essentially the same equipment as is used for the measurement of ash fusibility under Standards such as AS1038.15-87 and ASTM D1857-87. However, unlike the standard method the new method produces quantitative results of the melting of the ash. It has a much improved precision in determination of the temperatures at which these changes take place. Repeatability and reproducibility of the results are much improved. Correspondence between the index temperatures of current ash fusion tests [Initial Deformation (IDT), Sphere, Hemisphere and Flow] with reference points in the new method is poor, particularly in rela~ion to IDT and initial dimensional changes. The temperatures of significant movement in the new test appear to be systematic and are likely to correspond to mineralogical melting points. As slagging and fouling mechanisms depend on relative melting of mineral phases, the new test provides a significant improvement on the current ash-fusion method.
INTRODUCTION The current standard ash fusion test [ASTM D1857, 1987; AS1038.15, 1987] is subjective, being based on the operator's judgement of the degree of deformation of the ash sample as the temperature rises at a specified rate in a controlled atmosphere. The repeatability limits of 3o ·c and reproducibility of 50-80°C reflect the subjectivity of the current test. The change from the original form of the sample pellet, through all the stages until complete melting, is a continuous process. In cases of congruent melting, the entire transformation can occur over a very narrow temperature range. However, in cases of incongruent melting, the transformation can be happen in stages as various eutectics are traversed. Another criticism of the standard ash fusion tests has been unreliability in predicting the behaviour of coal ashes in real combustion processes. It has been emphasised that the initial deformation temperature is not the temperature at which ash melting begins. Gerald & others (1981) and Huggins & others (1981) found that most ashes commenced melting at temperatures far below the initial deformation temperatures. They also found that all of the ash fusion temperatures, including the initial deformation temperatures, were dependent on ash composition in a manner which mirrored liquidus curves and not the solidus curves
of ternary oxide phase diagrams. The degree of partial ash melting is significant at temperatures as much as 200 °C to 400 °C below the initial deformation temperature and the initial deformation temperature values make little distinction among the coal ashes whereas the Mossbauer measurement of iron in glass can give a better clear rating of the samples. A number of recent studies have made use of the technique of multiple linear regression analysis whereby any fusion temperature such as initial softening temperature is estimated by combining and weighting the effects of several compositional variables (Rees, 1964; Riley & others, 1989; Winegartner & Rhodes, 1975; Sondreal & Ellman, 1975; Vorres, 1979; Gray, 1987; Sleiger & others, 1988; Lloyd & others, 1989a; Lloyd & others, 1989b; Lloyd & others, 1993). However, attempts by the present authors to use such regressions have not been successful and are unlikely to be so, considering the complex mathematics that would be needed to describe even the SiO2-AhO3-CaO system, even without consideration of incongruent melting and the concept that the melting of the ash can be a gradual process and not a sequence of discrete events. An ash fusion test based on the electrical resistivity of coal has been suggested (Sanyal & Mehta, 1993). In this test the resistance and the current flowing through an ash are monitored up to 1350°C when the sample is heated at the same rate and in the same environment as that specified for the ASTM ash fusion test. Although it has been stated that the apparatus and its components are inexpensive to build and are based on commercially available material, it is still new equipment and requires a capital investment. Similar techniques based on the measurement of electrical resistance of ash also have been proposed (Raask, 1979; Sanyal & Cumming, 1981; Gibson & Livingston, 1991). Electrical conductance methods for detection of the onset of fusion in coal ash and deposits have also been proposed (Cumming & Sanyal, 1981; Conn & Austin, 1984; Cumming & others, 1985). It was claimed that these methods provided a better measure of likely performance of an ash in a boiler than the aforementioned methods, particularly the standard ash fusion temperature. However, Wall & others (1989) has shown that these methods have inherent technical difficulties. A thermo-mechanical analysis device has been also constructed to characterise ash and deposit samples from both experimental-scale combustion test
Bowen Basin 1995 - Symposium
174
facilities and full-scale operating boilers (Ellis & others, 1987]. It was indicated that the results obtained from this thermo-mechanica l analysis device can be used to broadly assess the temperatures at which sintering and fusion occur. There are many variants to the conventional ash fusion test and these are described in detail in their respective standards [ISO 540-1981; ASTM D1857-1987; AS1038 .15-1 987; BS 1016.15-1970; DIN 51730-1984; COST 2057-1982; SABS 932; GE 219-1974] and summarised by Hough (1990) and this is indicative of the recent interest in the subject and the limitations of the existing methods. This paper does not seek to address the consequential questions raised by Hough regarding the mechanisms of ash fusion and the application of the method to actual ash fusion during coal combustion. These matters are currently being researched and indications are that the results from the new ash fusion method are enabling resolutions of the pathways and mechanisms of coal combustion ash fusion.
EXPERIMENT AL The aims of the research were firstly to demonstrate the technique using selected equipment parameters as outlined below, and secondly, using only a selection of three ashes, to examine the effect of variations of the technique on the outcomes. Samples
A total of 30 coal ash samples were subjected to the new ash fusion test. To ensure a wide variety of response, a wide variety of coal ash samples were selected and tested. An inert sample of alumina refractory material also was tested. Basic Apparatus
The new test requires two standard ash fusion ceramic tiles (25*25*6mm, Figure 1) and a moulding device as cited in Figure 4 of AS1038.15. The mould produced four cylinders of ash of 2mm diameter OBLIQUE VIEW
and 2mm height. Ash fusion tests were performed in a standard Carbolite ash fusion furnace. Test method
The new ash fusion test uses most of the existing test set-up and is easier than the standard ash fusion tests. The preparation of the four ash pellets in the cylindrical mould is easier and faster. They are disposed toward the comers of an ash fusion tile and a second tile is then placed on top of the pellets (Figure 1). As the temperature increases at 5°C/minute, photographs of the assemblage were taken at 2o·c intervals. The separation of the tiles was measured from the photographic negatives using a transmitted light microscope at 25x magnification with a graticule in one eyepiece. The results are presented as the primary curves and the rate of change of separation with respect to temperature (Figure 2). The separation of the tiles is given as percentage plotted as marked points. Sets of points that are horizontal indicate no movement in the sample over the associated temperature range. Sets of points exhibiting slopes indicate some contraction of the ash cylinders, probably due to melting. The rate of change of separation (first derivative) is calculated as the function of the average change in separation per minute i.e. y
(X1 - X2) flt
where y is the first derivative of tile separation per minute, x1 is the reading of tile separation(%) from a previous photograph, x2 is the reading of tile separation(%) from the following photograph, and M is the time interval between the two photographs (minutes). These results refer to the right y-axis (Figure 2). The rate of change allows easy identification of periods of maximum contraction. The results from testing according to AS1038.15, i.e. initial deformation (D), spherical (S), hemispherical (H) and flow (F) temperatures are also marked in the graphs. Once the technique had been demonstrated, three ash samples were selected, each of a different response type. Parameters examined were the size of the ash pillars, number of pillars, method and frequency of recording and measurement, effect of heating rate, effect of system kinetics, and measurement of pillar width and volume.
RESULTS Coal ash samples
Figure 1. Arrangement of the ash pellets and the ceramic tiles for the improved ash fusion test. The tile separation is measured from photographs.
The coal ash samples were found to exhibit a range of responses to the heating regime. Some displayed one or more periods of significant movement over narrow temperature ranges (Figure 2). Some exhibited no change or very slow change in the new ash fusion test (Figure 3) and these corresponded to ashes with Sl600°C in the conventional test. Others exhibited more gradual collapse over an extended
Bowen Basin 1995 - Symposium
175 ASH No . 2 100lll
r
t:
?,
,:• ,'.
H
10lll
·, ·
0
:,
II
..
BOlll
C 0
8"
1
....C a
6"
60lll
-0
.....
..... ..., "'....
C
:;, ~
"'
0 ..... ...,
0. QJ
"'
...,
""
40lll
:
.
QJ
-0
y\\
.
C0
0. (/l
:ii
20lll
"'.....
2"
I\
F 0lll
0lll
1000
1400
1300
1200
1100
1500
1600
Temperature c:::C Run •1
Run #2
0
X
Rate •1
Rate #2
Figure 2. An improved ash fusion test result in which an ash sample displayed periods of significant movement over several narrow temperature ranges. The current ash fusion test results are also indicated.
5
ASH No
oC
C .....
a
s:::
6"
60lll
0
~
"'.....
...,.....
~
..."' "'
,::: 0 ..... ...,
0. QJ
"'
...,
4lll
40lll
"'.... C0
0. QJ (/l ~
"' Zlll
...........
, .... .........
1000
✓-
1300
1200
1100
0lll
HOO
1500
1600
Temperature oc Run •1
Run #2
0
X
Rate 11
Rate •2
Figure 3. An improved ash fusion test result in which an ash sample exhibited protracted change. The current ash fusion test [AS1038.15] temperatures are also indicated.
temperature range (Figure 4). Gradation of responses was also observed between these three groups. Inert sample
An inert sample of alumina refractory material was used to confirm that the system measured the
proportional differences in ash pillars throughout the gradual temperature increases and to give an indication of any background correction that might be needed. The alumina refractory sample did not display any movement in the test indicating that the new ash fusion test did not require base-line correction.
Bowen Basin 1995 - Symposium
176 ASH No
11 10•
D
811
,. :o I!! ..
.i ..... i:: 0
II
60"
..
..... ..,
611
5> 1 6 D oC
"'..... "'c.
'O
;:::_ i::
0 ..... ..,
QI
"'
..,
10•
"" "'"'c...... Ill
"'
~
'O
211
1 000
1100
1 2 00
1 3 00
1 100
15 0 0
1600
Te mperature oC Run s 1
Run •z
0
X
Rate s 1
Rate •z
Figure 4. An improved ash fusion test result in which an ash sample exhibited gradual collapse over an extended temperature range. The current ash fusion test [AS1038.15] temperatured are also indicated.
Repeatability of results
The repeatability of the results can be viewed as the repeatability of the magnitude of the response and separately as the repeatability of the temperature at points of critical movement (analogous to the current ash fusion test). All the ash samples were tested in duplicate to check the repeatability of the new method with respect to the allocation of temperature at the points of critical movement. A statistical analysis of the differences of the magnitude of response for two consecutive runs at the same temperature level revealed a standard deviation of 11.92% for each test at the 95% confidence level. Points of critical movement were arbitrarily regarded as significant when the first derivative curve exceeded 1.5%/minute. The majority of results (94%) were identical within the interval of the photography (20°C). This is substantially better than the S0°C repeatability for the AS1038.15 test. It will be seen below that increased frequency of photographic recording or continuous video-recording the interval can reduce this precision to approximately 5 ·c and is only limited by the variation in the proximity of the samples to the thermocouple, the inherent precision of the thermocouple and the homogeneity of the sample. Reproducibility of results
Reproducibility due to operator variation or bias was determined by using two operators to measure the tile separation from the photographs using 15 randomly selected samples. A statistical analysis from the differences of two operators revealed that
at the same temperature, the degree of deformation had a standard deviation of 10.30% for each test at the 95% confidence level. Size of the ash pillars
Results from the use of 3mm*3mm and Smm*Smm pillars were compared with the results from the 2mm*2mm pillars. It was found that both the 3mm*3mm and Smm*Smm pillars showed semi-random expansion, indicative of gas evolution. The 2mm*2mm pillars showed no signs of expansion. Number of pillars
Six 2mm*2mm pillars were used instead of four. Using six pillars did not affect the results. However, the use of six pillars is recommended for reasons of stability should one pillar be unstable. Method and frequency of recording and measurement
Using the standard photographic method of recording and heating at the standard rate of S°C/minute, recording was done at every 10·c and 5 ·c. With the cooperation of the BHP Australia Coal Barney Point Laboratories, continuous video recording was used with computerised image analysis of the video image. As expected, reducing the recording interval increases the precision and increases the repeatability of the points of significant movement accordingly. It became evident that there is a great amount of resolvable detail with the 5 ·c intervals and continuous recording.
Bowen Basin 1995 - Symposium
177 100
90
''T'" , "h ' . ·- r
80
?
~·1 '"'"""
70
'\ ___ j_____________:::~·:--+-·-,
60
C .,li
"'ii0..
.
"'
:
\
:
:
[ r·\\
50
40
\,
30
.
20
10
0 900
1000
1100
1200
1300
1400
Temperature C-C)
1500
1600
2:-a2PAUCOl.. 050713
16%
14%
12%
5
.
Ql
C
_J
10%
2o•c Photo lnierval
ni ;,
~ 0
8%
I"'
6%
~
ii
.. !e. 0..
..,
4%
BHP-Video
2%
0% 900
"'
- - BHP-Video
1100
1200
1300
1400
Temperature C-C)
1500
1600
2 - 2 2 0 ~ ll507l:S
••••••• •• s•c Photo Interv .......... s•c Photo Interv - - 2o•c Photo Inter
Figure 5. Comparison of the results of 2o·c, s·c and continuous video recording for specimen A. The use of continuous recording or 5 ·c intervals produced very similar results (Figure 5). Such detail may not be needed for industrial identification and use. For such purposes, recording every 10·c could be recommended. Effect of heating rate Experiments were performed using heating rates from to 2"/minute to 20"C/minute and the results achieved were independent of heating rate within the range examined.
Effect of system kinetics Using the information from previous experiments to select the temperatures of significant movement, the samples were heated until just prior to these points and held at temperature for 30 minutes to examine the effect of "kinetic momentum" and thereby assess whether the indicated significant temperatures were true eutectics. There was no significant effect of kinetic overshooting when the temperatures were held.
Bowen Basin ·1 995 - Symposium
178 1 1 0 % - - . - - - - - - - - - - - - - - - - - - - - - - - - - - - - -- -- - - - - - - , - 10% 9% 8% 7%
~
0) C
a,
6% C
0
~ 8.
5%
...I
!·c
--s
c0
Jl
4% 70%
3%
!\
I
/
,,\
60%
,' ,' ,
:
!\
'
It
\ ;
\. \,'
't. :
•
•
'.
••••••••• J
"..:
..,
I ,
\
r-··,,
,,\
\
,' \ '. /
'.
"../
,
,, •
\. '
:
/
'
\\!
:
!:
' '
2%
\ '.. \ !
1%
50%--+------·--~-------.---------~--'- '-----.-----'----r-..__-----+-0% 1600 1500 1400 1300 1200 11 00 1000 Temperature *C
- - Y-axis change --..- X-axis change -E3- Volume change ••••••• Y-axis rate
Figure 6. The variation in the pillar width and apparent volume for specimen A.
Measurement of pillar width and volume
The photographic method allows simultaneous measurement of the pillar width and hence approximate volume. This may give clues to the cohesivity and perhaps adhesivity of the mixture of liquid and solid material. The results of such measurements are given in Figure 6.
DISCUSSION Correspondence of the improved test with AS1038.15 ash fusion test
The major changes observed from the primary and first derivative curves of some samples in the new method were broadly coincident with only a few of the temperatures indicated in the AS1038.15 ash fusion test (Table 1). These coincidences were generally observed when the new method exhibited significant tile movement over a narrow temperature range. However, the general correspondence between the results of the two methods was poor. The temperature of the first movement or initial deformation in the new test was generally observed well before the AS1038.15 Initial Deformation temperature (IDT). In some cases the cylinders had reduced to approximately 35% of their height prior to the IDT of the AS1038.15 test. This supports previous criticisms of the standard ash fusion tests (Gerald & others, 1981; Huggins & others, 1981) by explaining why conventional ash fusion temperature determinations have had such poor reproducibility.
The new method was compared with twelve results from an Australian inter-laboratory exercise that used the standard ash fusion method (AS1038.15-87). The new method allowed interpretation of the variability in reproducibility between current ash fusion results. In the new method, samples which displayed gradual collapse over an extended temperature range had significantly poorer reproducibility in the standard ash fusion test (Figure 7). This is consistent with the cognitive difficulty of marking a point of change in a system which is changing very slowly. Furthermore, the new method revealed more details in these samples than the standard ash fusion test. In comparison to the previously described case, in the new test, samples that exhibited low ash fusion temperatures and high rates of movement over a narrow temperature range, were found to display improved reproducibility in the standard ash fusion test. Further, the IDT on the current ash fusion tests were found to correlate more closely with initial significant movement in the new ash fusion test (Figure 8). However, it should be noted that the IDT can just as frequently occur up to 200 ·c prior to any significant movement taking place (Table 1). The initial conditions chosen were found to be the optimum with the exception that better precision of results were achieved with recording at every lO'C, 5 ·c or continuously, although 5 ·c recording intervals are probably the best compromise.
Bowen Basin 1995 - Symposium
~ 8. a,
,!!!. "O
179
----------------- -
90%
80% 70% C 0
60%
·.-i
.µ
ru ru
--
' ' "''' ' ' ' '
8% 7% 6% 5%
50%
H
9%
C 0
·r-l
.µ
0. Q)
Ul
40%
4%
30%
3%
ru
H CU
20%
2%
10%
1%
0.
Q)
!/l
'O
0%--t----~--...-- ~--,---__,_-~---- ~------'---~----'- o% 1600 1500 1400 1300 1200 1100 1000 Temperature oC
•
#1
- - Rate #1
Figure 7. Comparison of the new method with an inter-laboratory exercise in which Initial Deformation temperatures exhibited poor reproducibility. IDTs are indicated with 'Y .
100% 90% 80% 70% C 0 ·r-l .µ
60%
CU
50%
H CU
0. Q)
Ul
-------
10% 9%
''' """-'
8% 7% 6%
5%
C 0 .µ
·r-l
4%
CU H
30%
3%
!/l
20%
2%
10%
1%
40%
ru
0.
Q)
'O
0%4-----~-_,____,_,____.__~----~------ ---......- - - - 0 % 1600 1500 1400 1300 1200 1100 1000 Temperature oC
- - Rate #1 Figure 8. Comparison of the new method with an inter-laboratory exercise in which Initial Deformation temperatures exhibited acceptable reproducibility. IDTs are indicated with 'Y . Limitations to further improvement of the test
Correlation of improved ash fusion test results with mineralogical changes
The sources of statistical variation are predominantly in the recording of the temperature (i.e. variability in the proximity of the cylindrical pillars to the thermocouple).
Combining the results of all the samples indicates that some temperatures of significant movement occur frequently (Figure 9). The first derivative
Bowen Basin 1995 - Symposium
180
TABLE 1. CORRESPONDENCE BETWEEN THE FIRST MAJOR PEAK OF THE NEW TEST ON CATEGORY 4 SAMPLES WITH THE INDEX TEMPERATURES OF THE AS1038.15 ASH FUSION TEST. Initial
Sample No.
IDeformation (°C)
2
1200 1280 1160
7
I
Sphere (°C)
I Hemisphere (°C) I
Flow ("C)
Improved test first major peak (°C)
1260 1420 1320
1280 1440 1360 1600 1480 1580 1500 1420 1500 1390 1420 1560
1380 1480 1400
1210 1300 1130 1540 1450
8 9 1340 1580 14 1200 1460 1540 15 1180 1560 1600 -1500 16 1220 1480 1540 1300 18 1180 1380 1480 -1360 20 1360 1480 1540 1290 21 1280 1370 1450 1110 22 1320 1400 1460 1370 23 1440 1540 1580 1490 25 1340 1600< 1140 26 1300 1540 1580 1600 1450 27 1180 1320 1360 1440 1170 28 1220 1340 1360 1420 1180 Approximate coincidences of the conventional ash fusion temperatures with the temperatures of the first major point of change in the improved test are outlined in bold. peaks may be coincident with melting points of known mineral phases which would indicate that the ash was melting incongruently. This is consistent with mechanisms of melting and fractionation of the ash in coal combustion (Creelman, 1994). Correlation of melting profiles with phase changes in coal- derived and synthetic ashes is currently being undertaken, as is direct testing of slag deposits in commercial and experimental boilers. It is apparent that there is a need for this type of information to correlate the mineralogical data with the ash fusion and relate this to the slagging and fouling behaviour.
CONCLUSIONS An improved ash fusion test has been developed using essentially the same as that used in current standard ash fusion tests except that four pellets of ash are disposed towards the comers of an ash fusion tile and a second tile is then placed on the top of the pellets. The separation of the tiles is measured as heating progresses. The improved ash fusion test is superior to the existing AS1038.15 ash fusion test. The information is objective rather than subjective and contains much more information. The method gives superior repeatability and reproducibility and is enhanced by increasing the recording frequency. The changes in tile separation are easy to determine and measuring requires very little skill and requires no significant increase in time to perform and may be done in less time if the higher heating rates are used. The correspondence between the temperatures of significant movement of the new test and the index points of the current ash fusion test (IDT, Sphere, Hemisphere & Flow) is poor, with the best
correlation occurring with IDT in samples that exhibit significant tile movement over a narrow temperature range. The temperatures of significant movement appear to be systematic and correspond to mineralogical melting points. As such they should provide much more useful information on slagging and fouling than the current ash fusion method. The test is largely insensitive to most operating parameters although use of pellet sizes greater than 2mm,..2mm is not recommended. The results of the test also makes available new information on the apparent cohesivity of the liquid and solid mixture in the pellets as they melt. This information may prove useful in the estimation of the stickiness of the mixture. There is a necessity for further investigations into the relationship between mineralogical and chemical compositional and ash fusion behaviour.
ACKNOWLEDGMENTS This project was funded by the Australian Coal Association Research Program [Project Nos. 3092 & 4060 (Coin &others, 1994, 1995)]. Samples were provided by ACIRL Ipswich Laboratory, ACIRL Maitland Laboratory, R.A. Creelman and Associates, CSIRO - Queensland Centre for Advanced Technologies, Callide Coalfields, South Blackwater Coal Ltd., BHP Australia Coal and Yarrabee Coal Company Pty Ltd. Video recording of the tests was performed by BHP Australia Coal Barney Point Laboratories.
Bowen Basin 1995 - Symposium
181
Frequency 12"'
10%
.. . . . • . . • . . . . . • . . . . . . . . . . . . . . . . . . . . . . . . . . . .. . . . . . . . . .. .. . . . . . . . . • • • . • . . . . . . . . . . . . . . . . . . . . . . . . . . . . .. . . . . . .
8%
...................... .
6%
. • . . . . . . . . . . . . . . . - . .. . .
4%
• • • - - • - • • •• • •••• - • -
2"'
••• ••••••
°"' 1000
10-40
1080
1120
1160
1200
1240
1280
1320
1360
1400
1440
1480
1520
1560
1600
Temperature C
Figure 9. Temperatures of significant movement in the improved ash fusion test for the 30 samples studied.
REFERENCES AS 1038.15 (1987). Methods for the analysis and testing of coal and coke - fusibility of higher rank coal ash and coke ash. Australian Standards Association. ASTM D1857-87 (1987). Standard test method for fusibility of coal and coke ash. American Society for Testing and Materials.
BS 1016, Part 15 (1970). Fusibility of Coal Ash and Coke Ash. British Standard . COIN, C.D.A., KAHRAMAN, H. & REIFENSTEIN, A.P., 1994: Improved Ash Fusion Test. Australian Coal Association Research Project 3092, 54. COIN, C.D.A., KAHRAMAN, H. & REIFENSTEIN, A.P., 1995: Improved Ash Fusion Test. Application of Advanced Technology to Ash-Related Problems in Boilers, Proceedings. Waterville Valley, July 1995.
CUMMING, I.W. & SANYAL, A. 1981: An electrical conductance method for predicting the onset of fusion in coal ash. In, Bryers, R. W. (Editor): Proceedings of the Engineering Foundation Conference, 12-17 July, Henniker, New Hampshire. 1983, Engineering Foundation. DIN 51730 (1984). Determination of Fusibility of Fuel Ash. German Standard. ELLIS, G.C., LEDGER, R.C. & OTTREY, A.L., 1987: Thermo-mechanical analysis as a technique for characterisation of ashes and deposits formed during combustion. Steaming coal testing and characterisation workshop, Institute of Coal Research, University of Newcastle, NSW, Australia, 1987, 17. GE 219-74. Coal Ash Fusibility Determination Method". Peoples' Republic of China National Standard.
CONN, R.E. & AUSTIN, L.G ., 1984: Studies of sintering of coal ash relevant to pulverised coal utility boilers. 1:Examination of the Raask shrinkage-electrical resistance method. Fuel, 63, 1664.
GERALD, P.H., HUGGINS, F.E. & DUNMYRE, G.R., 1981: Investigation of the high-temperature behaviour of coal ash in reducing and oxidising atmospheres, Fuel, 60,585.
CREELMAN, R.A., 1994: Using mineralogy as a guide to understanding slagging: a case study. In, Proceedings of Practical Workshop on Impact of Coal Quality on Power Plant Performance, May 15-18, Brisbane, Paper 14, 12.
GIBSON, J.R. & LIVINGSTON, W.R., 1991 : The sintering and fusion of bituminous coal ashes. Engineering Foundation Conference on Inorganic Transformations and Ash Deposition During Combustion, Palm Coast, Florida, 425-447.
CUMMING, 1.W., JOYCE, W.I. & KYLE, J.H., 1985: Advanced techniques for the assessment of slagging and fouling propensity in pulverised coal fired boiler plant Journal of the Institute of Engineers, 58.
GOST 2057 (1982). Methods of Determining Ash Fusibility. State Standard of the USSR.
Bowen Basin 1995 - Symposium
182
GRAY, V.R., 1987: Prediction of ash fusion temperatures from ash composition for some New Zealand coals. Fuel, 66, 1230. HOUGH, D.C., 1990: ASME Ash Fusion Research Project. American Society of Mechanical Engineering, Report No. FT /88/01, 7. HUGGINS, F.E., DEBORAH, A.K. & GERALD, P.H., 1981: Correlation between ash-fusion temperatures and ternary equilibrium phase diagrams. Fuel, 60, 577. ISO 540 (1981). Determination of Fusibility of Ash. International Standard Organisation. LLOYD, W.G., RILEY, J.T., RISEN, M.A ., GILLELAND, S.R. & TIBBITTS, R.L., 1989.a: Estimation of ash softening temperatures using cross terms and partial factor analysis. Energy & Fuels, 4, 360. LLOYD, W.G., RILEY, J.T., RISEN, M.A., GILLELAND, S.R. & TIBBITTS, R.L., 1989b: Estimation of ash fusion temperatures from elemental composition: a strategy for regressor selection. American Chemistry Society Division of Fuel Chemistry, Preprints, 36, 325.
SABS Method 932. Fusibility of Coal Ash. South African Bureau of Standards. SANYAL, A. & CUMMING, I.W., 1981: An electrical
resistivity method for detecting the onset of fusion in coal ash. US Engineering Foundation Conference on Slagging and Fouling from Combustion Gases, Henniker, 329-341. SANYAL, A. & MEHTA, A.K., 1993: Development of an electrical resjstance method based on ash fusion test. Engineering Foundation Conference on Impact of Ash Deposition on Coal Fired Plant, June 20-25, Sollihul, England. SLEIGER, W.A., SINGLETARY, J.H. & KOHUT, J.F., 1988: Application of a microcomputer to the determination of coal ash fusibility characteristics. Journal of Coal Quality, 7, 48. SONDREAL, E.A. & ELLMAN, R.C., 1975: Fusibility of ash from lignite and its correlation with ash composition, U.S. Bureau of Mines Report, GFREC/RI-75-1, Pittsburgh.
LLOYD, W.G., RILEY, J.T., RISEN, M.A., GILLELAND, S.R. & TIBBITTS, R.L., 1993: Estimation of ash fusion temperatures. Journal of Coal Quality, 12(1), 30-36.
VORRES, K.W., 1979: Effect of composition on melting behaviour of coal ash. Journal of Engineering for Power,
RAASK, E. J., 1979: Sintering characteristics of coal ashes
REES, O.W., 1964: Composition of the ash of Illinois coals. Illinois State Geological Survey, Urbana, Circular 386.
WALL, T.F., GUPTA, R.P., POLYCHRONIADIS, P., ELLIS, G.C., LEDGER, R.C. & LINDNER, E.R., 1989: The strength, sintering, electrical conductance and chemical character of coal ash deposits, NERDDC Project No. 1181 - Final Report, Vol. 1, Summary Report.
RILEY, J.T., LLOYD, W.G., RISEN, M.A ., GILLELAND, S.R. & TIBBITTS, R.L., 1989: Predicting ash fusion temperatures from elemental analysis. In, Proceedings of the 6th International Coal Testing Conference, 1989, 58.
WINEGARTNER, E.C. & RHODES, B.T., 1975: An empirical study of the relation of chemical properties to ash fusion temperatures. Journal of Engineering for Power, 97, 395.
by simultaneous dilatometry-electrical conductance measurements. Journal Thermal Analysis, 16, 91.
101,497.
Bowen Basin 1995 - Symposium
183
Practical coal quality evaluation of export thermal coals
Lindsay Juniper Ultra-Systems Technology Pty Ltd, Brisbane.
INTRODUCTION
primary energy source, so that sensible sales negotiations can prevail.
When evaluating the technical quality of export thermal coals, we are really appraising its value or 'marketability' in the market place. In general, the value of any commodity, including thermal coal, is the price someone else is prepared to pay for it, and there are many factors which impact on the perception a buyer will have on that value.
Despite the logic for more informed sales negotiations at the technical level, the marketing of thermal coal is still carried out along the lines of "commodity" sales, where the buyer and seller are locked in the deadly embrace. This means that the buyer often uses the "red herring" technique, which uses invalid technical argument to win a dollar cut in the coal price. On the other hand, the seller generally accepts the price cut because he cannot argue on the same technical basis with his customer.
From a technical standpoint, the value of a thermal coal product can be well defined in terms of its ability to generate cheap electricity, without any problems during its combustion in boilers, and there are many tools which are available to carry out such an analysis. These tools range from examination of borecore laboratory data, through bench, pilot and full scale testing, to coal value modelling. At the other end of the scale is the commercial reality of trading any commodity, and that is simply the price of the coal ($/t), with an adjustment for changes in energy ($/GJ). This can also be well defined simply by both parties (seller and buyer) agreeing to the price. The problem is that extended argument and negotiation can take place before a price is finally agreed. The arguments generally include the technical aspects of the coal quality, but in the final analysis coal is sold on price, and price alone, provided the coal quality meets the buyers specifications. Why then do we worry about thermal coal quality? The answer to this question lies in the needs of the coal seller in being assured that his particular coal product will meet certain criteria in the eyes of the buyer, including:
This paper discusses some of the anomalies, contradictions, red herrings and commercial constraints to logical coal sales which occur along the way to export coal sales.
TECHNICAL ASPECTS Pulverising
Japanese specification limits suggest that hard coals, below HGI values of about 40, are not acceptable for current power plant designs. There are three aspects to this limit: •
Mill power consumption may increase with reducing HGI (harder coals), and cost differences can be determined for these changes in power consumption.
•
The capacity of the mill to grind sufficient tonnage of coal for full load boiler operation may be reduced as HGI reduces.
•
It is generally expected that a coarser pulverised fuel (PF) product will be produced from harder coals.
•
Meeting the buyers coal specification over the life of a supply contract.
•
Providing some hard evidence that the coal will perform satisfactorily in his plant.
•
Ensuring that contract penalties for supplying coal outside specifications are not outrageous.
•
Having the technical ability to supply after sales service, and to defend complaints against the performance of particular coals.
Utility practice generally aims to achieve a PF product fineness of 70% <75µm, and the expectation is that lower HGI coal will require adjustments to the classifier settings to achieve this PF fineness, with a subsequent reduction in mill capacity. The fact is that there is no clear correlation between PF product fineness and HGI, and there are other factors which have a greater impact on PF fineness, including maceral content (Conroy, 1991; 1994).
•
Understanding the needs of the buyer, and the problems he encounters in using coal as his
In addition, coals with low HGI values generally have a high volatile matter (VM) content, and as
PF Product
Bowen Basin 1995 - Symposium
184
1.20
60
c:: .o ..::
50
~
:J
Cl)
c:: 1.00
40
0 (.) \.,,.
~
30
&
(!)
l:
::::::
~ 0.80
20
§?
:.:: ~
10
Cl)
a::
0.60
-... -... ea
ea
:::::,
:::::,
(/)
(/)
G)
G)
C
3
30
30
C)
C
m
0
.c ~
m
..J
Coal
...
G)
C
:::::,
I
ea
"iii
ea
0
C
:E <{
-c
.c
G)
0
£
ti5
Figure 1. HGI and relative mill power consumption for a range of export quality coals.
such, the low HGI, high VM coals will not require the same PF fineness to achieve the required PF burnout (combustion efficiency) of the coal, as discussed below.
values of 40 and below, have lower relative mill power consumption than some of the higher HGI coals such as Lithgow, Hunter and South African coals.
Power Consumption and Capacity
This effect is evident because of the interaction of a number of coal properties, as well as the mode of operation of the mill, and evaluation of the grinding performance of a coal purely on HGI can sometimes lead to erroneous conclusions.
The combined effects of the above will be to increase the mill power consumption if the classifier settings on the mill are adjusted to the standard 70% <75µm. However, if the classifier settings are not adjusted, and a coarser product fineness is acceptable, then the power consumption may not necessarily be increased. In addition, the coal flow rate to provide sufficient energy to the boiler to maintain full boiler load will impact on the mill power consumption. A coal with a low specific energy will require a higher coal flow rate, and hence the power consumption of the pulveriser will be higher than that of a coal with a high specific energy. The actual power consumption of the mills can be estimated using mill manufacturers correla tions between power consumption and coal properties (HGI, PF fineness and moisture content), and the predicted coal mass flow through the mill. These estimates are illustrated for a number of export quality coals (Figure 1). The figure shows that low HGI coals do not necessarily produce high mill power consumption. The first Surat Basin coal certainly has a high power consumption, because of the very low HGI and moderate specific energy of this coal. The other Surat Basin and the Indonesian coal, with HGI
PF Burnout Coal volatile matter content (VM), sometimes expressed as Fuel Ratio (Fixed Carbon/Volatile Matter), is generally used by utilities to judge the PF burnout for a coal, and limits on Fuel Ratio up to 2.5 (VM = 29 %daf) have been imposed to ensure satisfactory PF burnout of coals in utility plant. The reason for this limit is not particularly with regard to boiler efficiency, as typical loss of efficiency through unburnt PF is of the order of 0.1 % to 1.0%, and any improvement on these values does not significantly affect the overall economics of electricity generation. The main reason these limits are imposed is because of ash disposal. In Japan, the cost of ash disposal is of the order of $Aus80.00/t, due to the lack of land fill sites, and a significant proportion of fly ash from power stations is sold into the cement industry, where the carbon in ash value of the fly ash must not exceed 5%. Figure 2 shows a correlation between coal Fuel Ratio and PF burnout in full scale boilers (Juniper & Conroy, 1995), and shows burnout values
Bowen Basin 1995 - Symposium
185
■
··-
Maximum Fuel Ratio to achieve f-------- - a i1 - + - - - - ---98 + -- - - - - - - - - j
5% carbon in ash 10% Ash
I
15% Ash I
97 + - - - - - - + - - - - - - - - + - - - - - + - - - - - - + - - - - - ; 3 2.5 2 1.5 1 0.5
Fuel Ratio Figure 2. Correlation of PF Burnout with Fuel Ratio (Juniper & Conroy, 1995)
roughly correlating with Fuel Ratio. Note the fairly wide scatter of results, varying from 99.0% to 99.7% burnout at a Fuel Ratio of about 2.1. Using the regression line shown, the burnout values and corresponding Fuel Ratios which correspond to 5% carbon in ash, for varying coal ash content are also indicated. As shown, the Fuel Ratios which correspond to 5% carbon in ash vary from 2.5 for 15 %db ash content, to 1.9 for 10 %db coal. This figure gives an indication of where limits on Fuel Ratio may be set, however, it should be noted that there is considerable scatter in the data, and individual coals should be judged on their actual performance, and not on this rough correlation. To obtain a feel for the impact of PF burnout on the economics of coal supplies in Japan, the following scenario can be evaluated. If fly ash produced in a plant is less than 5% carbon in ash, then it can be sold as a cement additive, at say $20.00/t. If the carbon in ash value is >5%, then it will cost $80.00/t for its disposal. The economics of this scenario is set out in Table 1, and the assumptions which apply to the calculations include: •
•
Coal price is $Aus75.00 /t, fly ash is sold to cement plant for $Aus20.00/t, alternatively ash disposal cost is $Aus80.00 / t. For the carbon in ash < 5% case, 85% of the coal ash is removed as fly ash and sold to cement, 15% is furnace bottom ash which cannot be sold to cement, but is disposed by other means.
For the carbon in ash >5% case, 100% of the ash is disposed by other means. As shown in Table 1, the economic impact of the limit of 5% carbon in ash, can be between $Aus8.50/t to $12.75, depending on ash content, and based on the above assumptions. Ash Deposition (Slagging & Fouling)
The evaluation of ash deposition characteristics of thermal coals by utility buyers is usually carried out using "indices" which are calculated from the coal and ash chemical properties. A study of the effectiveness of these indices for Australian coals has been carried out by Juniper (1995), and the conclusions on the applicability of a range of indices are summarised in Table 2. Table 2 sets out the previously accepted limits for a number of commonly used indices, as well as the modified limits applicable for Australian coals. As shown, there are a number of the commonly used indices which are now considered to be not applicable for Australian coals, as well as some new indices which have some merit in evaluating Australian coals. In particular, the commonly used Slagging Factor (Rs), which was developed for Eastern US coals, is Base/ Acid ratio (B / A) of the coal ash times dry sulphur content. In this case the sulphur content is used as a surrogate for iron, as pyrite in US coals. Iron is sometimes in the form of pyrite in Australian coals, but more often as siderite, making the use of sulphur in this index inappropriate for
Bowen Basin 1995 - Symposium
186
Table 1: Impact of PF Burnout on Cost of Coal Supplies %db
10.0
12.5
15.0
PF Burnout
%
99.42-
99.25
99.07
Landed Coal Price (Energy adjusted)
%It
75.00
72.92
70.83
$It $It $It
1.70 1.20 74.50
2.13 1.50 72.29
2.55 1.80 70.08
$It $It
$It
0.00 8.00 83.00
0.00 10.00 82.92
0.00 12.00 82.83
$It
8.50
10.63
12.75
Ash Content
Carbon in Ash < 5% Sale to Cement Disposal Cost Total Effective Coal Cost
Carbon in Ash > 5% Sale to Cement Disposal Total Effective Coal Cost
Differential Coal Cost
Table 2:
Limits for Coal Quality Parameters Relating to Slagging Characteristics Previously Accepted
Limits Coal Index Calculated Viscosity, CV1426°c Silica Ratio T250 Base/Acid Ratio Slagging Factor, Rs Fe20 3 x B/A Multi-Viscosity Index Slagging Temperature Fe20JCaO Fe203 + Cao
poise oc
% % oc
%
Low Slagging
High Slagging
Low Slagging
High Slagging
-
-
>2000 >90
<350 <75
>1370 <0.5 <0.6 <0.5 >1350 <0.3
<1200 >1 .0 >2.6 >2.0 <1150 >3.0
-
Australian coals. A better way of expressing the same index, for Australian coals would be to use B/ A multiplied by the iron content, expressed as Fe2O3, and this correlation has a reasonable correlation for predicting the slagging characteristics of Australian coals. Some points which arise out of Table 2 are: •
New Limits for Australian Coals
The T2so temperature is a commonly used index, and is the estimated ash temperature corresponding to an ash viscosity of 250 poise. This correlation did not appear to be appropriate for Australian coals.
-
N/A
N/A
<0.09
>0.3
NIA
-
N/A
<0.6 <0.6
>2.0 >1.2
N/A N/A
NIA N/A
<7.0
>12.0
•
A new 'index' which has been previously proposed for Australian coals (Phong-anant & Pang, 1992), being simply Fe2O3 plus CaO, was shown to be a reasonable indicator of slagging potential.
•
The popular use of ash fusion temperatures to assess the slagging potential of coal has been shown to be of little value, yet again! Figure 3 shows the correlation for Initial Deformation Temperature (IDT), and yields little information on the slagging characteristics of the coals. There were some coals with an IDT <1150°C which do not produce molten deposits at reasonably high gas temperatures,
Bowen Basin 1995 - Symposium
187
1600
-
1500
■
G'
~ 1400
@
.2 ~
Cl)
~
~
(/) (lJ
1300
··--□
--■ □
□
(!)
-
■
■
■
u 0
□
l=I
□
~ □
- □ □ □
r::Jll
■
~ □ □ □
u
I
n
■
■
I ■
■
I
□
1200
■
-
□
■
I
■
□
) ■ ■□
□
□
I
[D
8
n
ll
□
j
-
;
□
□
□
II
□
□
l ■ Mol1en
1100
□ Powder
1000
1000
1100
1200
1300
1500
1400
1600
Initial Deformation Temp (C) Figure 3. Plot Showing the Lack of Correlation between Initial Deformation Temperature and Furnace Gas Temperature (Juniper, 1995).
and there were others, with an IDT >1300°C, and which were shown to have poor characteristics in this regard. The best which can be implied, is that if a coal has an IDT greater than about 1400°C, it will probably not cause a problem. NOx Emissions Emissions of NOx from coal fired plant is affected by several factors including:
Coal Properties:
- rank, volatile content, and
nitrogen content
Plant design:
- type, number and geometry of burners, furnace size
Operating Conditions: - furnace stoichiometry and combustion temperature Predictions of NOx emissions from PF combustion have proven to be difficult, mainly because of the large influence of plant design and operating characteristics on NOx emissions. The influence of coal properties on NOx emissions is also difficult to predict, and the commonly, and incorrectly, accepted notion that NOx emissions are directly affected by coal nitrogen content is unfounded, as illustrated in Figure 4 (Juniper and Conroy, 1995). This data was derived from measurements of NOx emissions under standard conditions in pilot scale plant, and shows a very large band of NOx emissions, with some high nitrogen coals having lower emissions than those of some quite low nitrogen coals.
The relative influence of the plant design and coal properties is illustrated in Figure 5 (Holcombe & Trenaman, 1994). The shaded area represents pilot scale NOx measurements, as measured under a number of different mixing conditions, and the correlation between the pilot scale data, and the full scale measurements is represented by determining the "Mixing Number'' for the plant, when burning the respective coal. The plant Mixing Numbers can be categorised by the plant design where plants with low NOx burners, or with tangent firing systems generally have low "Mixing Numbers" in the range up to 5, while excess air, high swirl burners range up to Mixing Numbers of 10 and beyond. Also shown in Figure 5 is the relative influence of coal properties on NOx emissions, compared to plant design factors. The figure shows that the plant design factors represent about 2.5 times the influence that coal properties have.
CONCLUSIONS There are many areas of thermal coal evaluation in which simple laboratory analyses, by themselves, do not give an accurate evaluation of the performance of coals in utility plant. At best, ALL relevant properties should be taken into account to describe the process being considered. Some the anomalies, contradictions and commercial constraints include:
Bowen Basin 1995 - Symposium
188
1200 , - - - - - - , - - - - - , - - - - - - , - - - - - . - - - - - , - - - - ,
-:;, 1000 0 ~
€
800
,/J
E~
Cl.
s
•
•
<o
•
600
Cl)
C:
.Q
•
Cl)
• •
•
400
-~
JJ )(
0
<'.
200 Japanese Limit
0 1.0
1.2
2.2
2.0
1.8
1.6
1.4
Coal Nitrogen Content(% daf)
Figure 4. Plot Showing the Lack of Dependence of Coal Nitrogen Content on NOx Emissions (Juniper & Conroy, 1995).
1400 , - - - - - - - - - - r - - - - - . . - - - - - - - - . - - - - - r - - - - - - , Range of Variation due to Plant Design
,~ "
0
1200
~
+-----+------1--------===J======i=== =::.: Pilot Scale Data
<o
€E ~
1 000 -+------< Range of Variation due to Coal Properties
Cl.
S
800 - + - - - - - - - + - - - - - -
">
t::
·i 600
~!!?
- + - - - - -.....
E
LU
0
400
<'.
200 - + - - - 1 - - - - - + ~ - - + - - - + - - - - - - ! - - - - + - - - + - - - + - - - - + - - ~
0
2
4
6
8
10
Arbitrary "Mixing Number'' Figure 5. Relative Impact of Coal Properties on NOx Emissions compared to Plant Design Factors (Holcombe, 1994).
Bowen Basin 1995 - Symposium
189
•
Pulveriser performance needs to be described by the relative mill power consumption, and not just HGI alone. It has been shown that low HGI coals can, in some cases, have lower mill power consumption than much softer coals. Some of the easily measured properties which affect power consumption are: >
HGI
>
Total moisture content
>
PF size reduction
>
Specific energy
REFERENCES CONROY, A., 1991: Grinding Behaviour of Hard Coals. Combustion News, ACIRL Ltd, November, 1991.
PF burnout is generally evaluated by utilities on the basis of volatile matter content, however the real requirements are to limit the carbon in ash value, which is affected by ash content among other parameters. To achieve realistic limits on volatile matter, the ash content must be taken into account. However, there is a genuine need to place some regulation on coals to ensure that carbon in ash values do not exceed commercial requirements in being able to use the ash in cement manufacture. •
In a similar vein, the use of coal nitrogen content to evaluate NOx emissions is not valid, as not only is there a poor correlation between NOx emissions and coal nitrogen, the emissions are affected far more by the plant design and operating factors, than the coal properties.
The use of ash fusion temperatures for the evaluation of ash deposition characteristics is not recommended. The use of new and improved ash deposition indices is the best we have at this time, and allow reasonable evaluations to be made in this area.
CONROY, A, 1994: Correlations of Grinding Characteristics with Coal Properties. Practical Workshop on Impact of Coal Quality on Power Plant Performance, ACIRL Ltd, Brisbane. HOLCOMBE, D. & TRENAMAN, K.J., 1994: Correlation of NOx Measurements in Pilot Scale and Full Scale Plant. Practical Workshop on Impact of Coal Properties on Power Plant Performance, ACIRL Ltd, Brisbane. JUNIPER, L., 1995: Applicability of Ash Slagging "Indices" - Revisited. Combustion News, ACIRL Ltd, February, 1995. JUNIPER, L.A. & CONROY, A.P., 1995: Technology Tools to Support the Marketing of Thermal Coal. Centennial Geocongress (1995), Geological Society of South Africa, Johannesburg, South Africa. PHONG-ANANT, D. & PANG, L.S.K., 1992: A Comparative study of mineral matter transformation and ash deposition in the ACTC Boiler Simulation Furnace and Power Stations. 2nd Australian Workshop on Ash Deposition, Brisbane, Australia.
Bowen Basin 1995 - Symposium
190
Bowen Basin 1995 - Symposium
191
Geotechnic al investigations and pit wall
desiKJts in faulted ground at Eastern Creek Soufh 1
2
3
RW Seedsman , M Cameron & S Peou 1. Coffey Partners International Pty Ltd
2. McElroy Bryan Geological Services Pty Ltd 3. Newlands Coal Pty Ltd
Production from Eastern Creek South began in mid 1994 to supplement production from the Newlands Main deposit. The deposit was identified in the late 1970s and low level exploration conducted until 1992. In 1992 McElroy Bryan Geological Services Pty Ltd (MBGS) initiated a systematic exploration program on behalf of New lands Coal Pty Ltd (Newlands) to bring the resource to measured status as a basis for mining. Mining is by conventional dragline techniques but requires a haul of 15km to the coal preparation plant at the Newlands mine site. Prior to 1992 geological investigations had included drilling on a widely spaced grid, surface mapping, bulk sampling and ground magnetometer surveys. Coal quality was known to be variable with raw ash contents ranging between 14% and 25% and averaging 15.4%. Given the structural setting of the deposit and the presence of dykes and sills, there was always an understanding that structural disruption of the target Eastern Creek B seam (ECB) may be present. This paper discusses how the structural and geotechnical model for the deposit evolved and how the implications were incorporated into the mine plan.
1992 - 1993 STAGE 1 & 2 DRILLING MBGS was commissioned to prove up the deposit to measured resource status. By the end of 1993 a total of 300 holes had been drilled using open and cored holes and geophysics on a spacing of 125m. The aims of the drilling were to delineate the line of oxidation, coal quality, seam splitting, structure, and igneous intrusions. Some anomalies in seam thickness were detected but no pattern could be determined. The bulk sample pit had been excavated in 1989 and clearly displayed minor faulting associated with a dyke. Faulting was also indicated by surface geological mapping. Shearing within the ECB seam was evident in the bulk sample pit and it was assessed that fine coal in these crush zones may increase the fines content of the run of mine coal. Three fully cored geotechnical holes were scheduled in the 1993 program. The focus was to obtain rock strength data to be used in blast and diggability assessments. Selected core (with associated logs) were forwarded to Coffey Partners International Pty Ltd (Coffey) for testing. Difficulties were encountered in obtaining core for testing. Inspection of the logs revealed the presence of numerous sheared puggy zones, slickensided surfaces, steeply dipping bedding and fault
NE
SW
Figure 1. Initial conceptual model for Eastern Creek South.
Bowen Basin 1995 - Symposium
192
90 OVERALL SLOPE ANGLE= 30° SPOIL PROPERTIES- c'= 20kPo
80
0'= 30°
FULLY DRAINED
70
E
-50 ~
:::c
(!)
LI.I
:::c ~40
g en
30
20
0;---------------,,-------------~--------------. 10 15 20 25 FRICTION ANGLE (deg) Figure 2. Design chart for spoil pile height.
surfaces, and in one hole no ECB seam. In 2 holes the coal was logged as "crushed", "completely rub bled", and "broken". Laboratory determined rock strengths (unconfined compressive strength) ranged from lOMPa to 40MPa and the overburden comprised of about 50% sandstone, 22% interbedded sandstones and siltstones, and 28% siltstone.
1993 GEOTECHNICAL REVIEW Coffey reported in early 1994 expressing concerns regarding the geotechnical environment at Eastern Creek South. Drawing on the work by CSIRO in the early 1980s as well as an interpretation of the regional fault pattern, Coffey drew an analogy with conditions reported from Curragh. A simple
Bowen Basin 1995 - Symposium
193
NE
SW E431 E56R
E702
E698
E719C
E694C
Not to Scale ECB SILL
Figure 3. Schematic diagram of expected structural features at Eastern Creek South.
conceptual model for the geological structure at Eastern Creek South was proposed (Figure 1). The impact of the proposed conditions on highwall and spoil pile were discussed with Newlands and some simple slope design nomograms were produced (Figures 2). Of particular concern at that time was the risk of spoil pile instability. MBGS logging had identified the widespread development of slickensided surfaces in the floor of the ECB seam. Seam dips in excess of 4° were interpreted from the seam floor levels for the regions near the crop line and at depth. None of the defect surfaces submitted for testing was sufficiently intact to allow shear box testing. A drained friction angle of 13° was ascribed to the slickensided surfaces in mudstone and 18° for slickensided surfaces in coal. It was concluded that mining strategies were available to address the risk of spoil pile and low wall instability. New geotechnical targets for the 1994 drill program were developed in association with MBGS. 1994 STAGE 3 INVESTIGATIONS A further 40 holes including 4 fully cored holes were drilled in the 1994 program. This drilling confirmed the presence of thrust faults and sub-horizontal bedding plane shears. The thrust faults appear to propagate upwards within narrow (approximately 15m wide) zones. In some areas coal wants with an area of 50m x 100m wide are present on the eastern or down dip side of thrust faults. Further sill and dyke occurrences were intersected including one dyke not detected by earlier high resolution magnetics. On the basis of all the drilling, MBGS produced a conceptual cross section for Eastern Creek showing seam repetition, high angle thrusts, and areas of no
coal (Figure 3). It is noted that the relative vertical displacement either side of the faults is minimal. Some of the thrust fault planes host intrusives and may have been the conduit for the sill intrusives. Close examination of the caliper and sonic logs extended the knowledge on the distribution of bedding plane shears in the floor of the ECB seam. In core the shears were noted to be 50mm to 150mm thick and consisted of highly polished, sheared, slickensided surfaces, and strongly disturbed bedding. Drill hole intersections of shears were identified according to their location relative to the seam floor and plotted in plan view (Figure 4). Four categories were defined: m, 0.5-1.0m, 1.0-3.0m, and 3.0m below the floor of the ECB seam.
1994 GEOTECHNICAL REVIEW The focus of the 1994 review was the design for the low-wall. The distribution of bedding plane shears indicated that they were largely absent in the vicinity of the low wall. However there was a limitation in the reliance on sonic logs to pinpoint shear zones in as much as they require water filled holes. The shallow holes at Eastern Creek South did not hold water. It was decided to assume that pre-sheared surfaces were present in the low wall area. Additional core samples had been collected but the sheared surfaces were unsuitable for testing. Laboratory simulation of sheared surfaces by reversals in a shear box gave a drained residual friction angle of 11 °. Two-wedge, circular, and non-circular slip analyses of low wall stability showed that the two-wedge technique gave the lowest factors of safety for failures involving both the low wall bench and the spoil pile. A simple design chart was produced
Bowen Basin 1995 - Symposium
194
(T')
"
--r-·"
.f'
Ol lD
606000
so5500
so5000
so4500
-f-
,..
so 6338 (T')
'
"
Ol lD
If) (0
,._
0 0
,,
lD lD If) (0
,._
,.._
I
-,,"'
_,,,,,
If) (0
\
-f..,
.,,
0111
I I
o/'il
0 0
lD lD
I
If) (0
I
SILL
,._
I
.-,,""
I
,,.
~
'
--
_,,.,,,
0 0 0
0 0 0
lD
lD
If)
:e
""
If) (0
,.._
"
+'"
SHEARING IN Im- 5m HORIZON
0 0
0 0
ID
lD
'<I"
'<I"
,.._
"',.._
0 0
0
If) (0
(0
0 0 '<I"
0 '<I" If) (0
"',-. .
,._
(0
.,.. -f- ... 0
0 lD (T')
,~,.
SILL
- = - 1 - - - + - + - = -+--t--+----"'-+- - t - - - - t-+----t--"!i''- + - - - l - --
T'
--#'-
T
./' 0 0
lD (T')
If) (0
l!l
,._
(T') (T')
"',._ (0
Figure 4. Interpreted geological map showing zones of no coal and shearing in the floor.
Bowen B asin 1995 - Symposium
195
.-s 40
•
X
u
z
anticipate the need to implement stability management plans for spoil piles based on the experiences from the Newlands Main deposit.
w
al
The general thrust of the recommendations was to use an acceptably conservative low wall design, exploiting the available reach of the dragline to give as much room as possible together with a wait and see strategy on the spoil piles. It was assessed that the highwalls should be stable except in local areas near faults.
::i
~ 30 ~
g ~
0
a:: ~ I- 20 X
!:2 w
3° SEAM DIP 13° FRICTION ANGLE
X
..J
PERFORMANCE TO DATE
0
, g; 1 0 - - l - - - - - - - - . - - - - - r - - - - - - . - - - - - -60 20
30
40
50
LDW WALL CREST TO PROJECTED TOE OF SPOIL PILE (ml
Figure 5. Design chart for surcharged low walls at Eastern Creek South.
(Figure 5) for use in assessing the suitability of proposed pit layouts. The following was recommended : •
low wall spoil be placed at least 30m (if possible 40m) from the low wall crest,
•
low wall bench heights be restricted to <18m for face angles of 45°,
The structural models have been confirmed with exposures of thrust faults in the highwall and the presence of bedding parallel shears in the floor of Ramp 9 and 10. There were no low wall failures when the ramps were opened up. Areas of no coal and intruded sections of the seam were observed in the pit and were in reasonable agreement with the exploq1.tion model. However, more dykes were exposed in the highwall than were located by the drilling and magnetometer surveys. Shearing of the ECB seam was present in both ramps. The expected increase in fines has been confirmed in the coal preparation plant.
Bowen Basin 1995 - Symposium
196
Bowen Basin 1995 - Symposium
197
3D visualisation of borehole sedimentolo gy data
B Poulsen, JS Esterle & T Meyer CSIRO Exploration and Mining
Sedimentological modelling of lithologic data from boreholes provides a framework for geotechnical testing, ground engineering and mine planning in both surface and underground coal operations. Although sedimentological data are readily available from geophysical records and fully cored boreholes, 3D modelling commonly focuses only on coal seam thickness and depth without regard for interburden sequences. Where variations in lithology are directly correlative to interburden thickness (eg. thick interburden = thick sandstone unit) or where stratigraphy is simple, this may suffice for engineering design and strata control. However, in areas of complex or rapid lateral variation, sedimentological models, especially in conjunction with structural models, provide a useful tool for predicting geological hazards ahead of mining. Where mine scale sedimentological models exist, they are often contained in reports which are not fully digested by the mine site engineering department or management. Simple methods for presenting the data include type sections with defined fades or rock units, cross sections which demonstrate lateral variability of units, isopach maps of various units and slice maps which represent the relationship between units at any given horizon. A schematic block diagram showing the interpreted sedimentological development of the different units often provides the final visualisation in 3D. While these methods form the basis of a 3D geological model, it is often difficult for lay persons to accurately visualise the data in 3D. A myriad of commercial and home grown software exists for visualising geological data in 3D. All have their advantages and disadvantages. This paper presents modelling of coal measure borehole data using a 3D visualisation package Earth Vision TM that has not been widely applied in the Australian mining industry. Having attempted to model this data set and others in several modelling packages, CSIRO EM has found EarthVision™ to be an excellent tool for modelling and visualising geological data in a sedimentary environment.
types were kept small and their definitions simple for the purpose of modelling. Units consisted of 1. massive sandstones 2. interbedded to interlaminated sandstones and siltstones and 3.coal. Seams and rock types occurring within the interburden were interpreted, named and recorded by depth in each borehole to generate an ASCII file which could be submitted to Earth Vision™ or any other mine modelling package. Earth VisionTM
Earth Vision is an integrated set of two and three dimensional mapping, modelling, visualisation, and analysis tools used to interpret spatial (3-D) information, including geological, hydrological, geochemical and geophysical data sets. The process of building the Earth Vision TM model can be broken down into three distinct stages: Translating the borehole information from the mines data base into the required Earth Vision TM format. (Borehole data processing and preparation) Building each lithological layer of the model. (Grid calculations) Combining the layers to form the final model and visualising the result. (Geological structure builder) Borehole data processing and preparation
METHODS
Earth Vision TM , like most modelling packages, has a fairly rigid format requirement for the borehole information from which it builds its models. This format was not supported ~ the program used to log the holes. Earth Vision T does provide a number of tools for the interactive editing of input and output data files, however the creation of a simple FORTRAN translation program was seen as the simplest and most time efficient way to produce the necessary Earth Vision TM input files.
A total of 270 geophysical logs was used to identify and correlate coal seams and major rock units in the study area. Lateral continuity of defined units were checked by a series of cross sections and manual isopach maps of each unit. The number of rock
A FORTRAN program was written that read the ASCII dump of the borehole data, did some simple error checkini then wrote an output file in Earth VisionT format. The translation program was easily modified so that the different'formats
Bowen Basin 1995 - Symposium
198
modelling of pseudo 2D (as described later) compared to 3D surfaces were obtainable.
standard method of building a geological model in Earth VisionTM.
In addition, the translation program allowed for the amalgamation of any number of individual units to a single unit, to assist in model simplification. This was required when it was decided (mid-way through building the model) that bodies that coalesced, and had been logged as separate units, would be more appropriately modelled as a single unit.
The massive sandstones in the region being modelled are non-continuous and often conformal to the coal seam below and feature coalescing channels and lobate and linear splays. These units are modelled as true 3D entities taking advantage of any conformal surfaces to assist the model building process. As mentioned, these sandstone bodies were initially logged as separate but inter-related units, however it was found that combining some units into a single sandstone body, and letting EarthVisionTM split and coalesce these as it so determined, produced a more realistic final model.
Grid Calculations
Grid calculations are the extrapolation of scattered point data to calculate grid nodal values. This can be done in two or three dimensions, depending on the nature of the scattered data. The operator can control the degree to which input data is honoured. Minimal tension gridding is thiJ'rimary gridding technique used in Earth Vision . In contrast, trend gridding is an analytical technique whose surfaces abstract the input data rather than closely honouring it. In minimum tension gridding, an initial estimate is made for every grid node based on nearby scattered data points. The initial estimate is an average of these neighbouring points, calculated using an inverse distance weighting function. Once the estimates are complete, a number of iterations begin to re-evaluate the grid nodes using a bi-harmonic cubic spline function. The useful characteristics of this function is the distribution of tension (second derivative of curvature) among the nodes so the sum of the squares of the second derivatives is minimised. Simply stated, the curvature is distributed, rather than concentrated at the data points. Conformal gridding is a specialised variation of the minimum tension technique designed for cases where the property value (control value) spatial distribution is related to variations in a surface. The most frequent need for conformal gridding occurs in geological applications where sedimentary deposition has created strata that initially were relatively flat but where subsequent tectonic events have cause deformation or faulting. In such cases, the normal minimum tension gridding technique can lead to discontinuous occurrences of a property value where those occurrences should be connected as a continuous layer. Conformal gridding in effect transforms the co-ordinate system back to a geometry that mimics the original environment. This transformation is accomplished by flattening (referencing the Z-values) to a specified surface, a 2-D grid (the structural contour surface). Over the region covered by the 270 boreholes are 5 main coal seams which are largely continuous and, for the model building process, non-conformable. These coal seams were modelled by creating a surface in 3D space of the top and bottom of the seam (pseudo 2D surfaces) which, when joined together in the final model building stage, defined the coal seam. This technique appears to be the
Geological Structure Builder
The geological structure builder creates three-dimensional geological models of faulted or unfaulted areas from a series of 2-D grids surfaces and 3-D grid iso-surfaces, each of these representing an individual horizon, body or unit. These models can contain multiple intersecting faults and layers that are created according to geologically consistent rules. After producing surfaces defining the top and bottom of each coal seam and the individual sand bodies the final model was constructed in a process that took 30 hours on a fast Silicon Graphics workstation. To build the final model the surfaces that represent the top of the individual units were ordered from oldest to youngest. EarthVisionTM then allows these surfaces to be combined according to four geological operations: Depositional Surface, Depositional Isopach, Unconformity and Channel Erosion. Depositional Surface deposits or 'settles' on the unit below. It prevents the unit from truncating any underlying surfaces. Depositional Isopach is similar to Depositional Surface in that it also 'deposits' onto the zone below, but instead of specifying the top of zone, the thickness of the zone is specified. Unconformity causes the unit to deposit onto the underlying surfaces except where they intersect the new unit; then it truncates them. Channel Erosion causes the surface to truncate the underlying surfaces, with no deposition occurring at all. For modelling purposes, the lower surface for each coal seam was defined as being deposited unconformably on any unit below while the upper surface and all sand bodies were deposited conformably (contrary to sedimentological thought process) To represent the interbedded to interlaminated sandstones and siltstones a 'fill' unit was deposited in any gaps between the coal seams and massive sandstone bodies.
RESULTS An example of the model generated in Earth Vision™ is presented in Figure 1. The stratigraphy can be subdivided into packages, or intervals bound by coal seams. These intervals vary laterally in thickness and, in general, the
Bowen Basin 1995 - Symposium
199
■ coal seams ~ interbedded rock types
D sandstones Figure 1. Multiple slices through an Earth Vision TM model of coal measure data. Model generated from 270 geophysical records of boreholes drilled on a 250m grid.
proportion of sandstone to mudstone increases with increasing interval thickness. The offset relationships between successive intervals as a function of differential compaction is well displayed by the model. Block diagrams can be made and sliced along coordinates parallel to the EW and NS axes of the model. Fence diagrams can be constructed along any desired transect. With the model, discrete layers can also be highlighted by removing all others back to the slice, or section line.
CONCLUSIONS Accurate 3D geological models provide a visual method for understanding the inter-relationships between rock units in coal measure sequences. EarthVision™ has proved a useful tool in producing such models by reducing the requirement for manual on-screen correlation across boreholes while at the same time producing a highly realistic model. Its ability to handle coalescing rock bodies, particularly sandstones and coal seams, alleviates some problems of nomenclature during correlation. The model can be easily updated as additional borehole information becomes available. Although not conducted in this study, the model easily
incorporates structural features such as faults, joints and intrusions. Another modelling feature is the ability to assign and model attributes to discrete units or combinations. For example, UCS values could be isopached in 3D for individual sandstone bodies occurring in the roof of a target seam; or, coal quality data could be modelled across seams. Previous work (Meyer & Lohe, 1994) has modelled groundwater flow through sedimentary strata. In conclusion, EarthVision™ provides a powerful tool for both modelling and visualisation of geological data in sedimentary environments. It is complementary to commonly used mine and geological modelling packages.
ACKNOWLEDGMEN TS We would like to acknowledge BHPAC for providing access to borehole information to conduct this preliminary modelling exercise. Peter Harvey of Queensland Supercom.guting Laboratory acted as liaison with Earth Vision M.
REFERENCE MEYER, T. & LOHE, E., 1994: Geological modelling of Pacific Waste MallMements Rochedale landfill site . CSIRO EM Unpublished Report. using Earth Vision
Bowen Basin 1995 - Symposium
200
Bowen Basin 1995 - Symposium
201
lnseam drilling for exploration - where are we and where are we going? J Hanes WHY IN-SEAM DRILLING? In-seam drilling is conducted mainly to drain coal of gas and/or water prior to development or extraction. Growing priorities for in-seam drilling include detection of structures or their absence and testing of gas contents especially in seams prone to outburst. Gas drainage holes are mainly drilled as rotary holes of around 90mm diameter drilled from one set of gateroads, across the proposed lo_n gwall panel and beyond the next proposed gateroads. They are therefore around 250 to 300m long. They are drilled in fan patterns or as parallel holes at 15 to 20m spacings. Rotary holes are seldom straight and the resultant curve can mean they do not cross the next gateroad panel. Some of the holes close after drilling and do not drain the coal. Sometimes when rotary holes intersect a geological structure, the bit bogs and cannot penetrate the structure. The larger the drill rig the lesser is the chance of the bit bogging, and of the driller detecting a structure. Downhole motors and some form of hole surveying are used to drill directionally controlled holes for exploration and gas drainage. The longest hole in coal is 1530m. It is difficult or impossible to detect small structures in these holes. Small rotary rigs are popular for drilling relatively short holes for detecting structures or for taking cores for gas content testing. The currently used bottom hole assemblies result in curvature of holes and often unknown trajectories.
WHERE ARE WE? Until recently, this was a common question asked by drilling people because of no or poor borehole survey technology. Survey of boreholes is now accepted as necessary for all holes in outburst prone mines as not knowing where a hole goes is nearly as useful as having no hole at all. Currently around 300km of rotary drilling at around $30/m and 160km of directional drilling at around $75/m are drilled each year in Australian collieries. A conservative estimate of cost for this work is $9M for rotary and $12M for directional drilling. There is a trend towards replacing some of the rotary drilling with directional drilling to achieve better accuracy or at least to know where the holes go.
Rotary drilling technology has changed little during the last 20 years except perhaps for the introduction of the lightweight ProRam drill. With the recently introduced, very stringent, requirements of proving outburst-prone coal is safe to mine has come the need to survey drainage holes to prove they have reached target. Survey is currently conducted using a single shot photographic survey tool or in some cases a multishot photographic or multishot electronic survey tool. The survey tool is pushed down the hole after drilling, either on PVC pipe or on the drill rods. Either method is prohibitively time consuming.
Directional drilling with downhole motors is revolutionising in-seam drilling. Holes can be drilled straighter but at a lower penetration rate. The use of survey tools is critical during drilling to maintain hole trajectory. Two years ago, the only options for surveying were a single shot photographic tool or the Dupont electronic survey tool which resided behind the bit. The single shot tool has to be pumped down the rods, a photograph exposed, the tool withdrawn and the film developed before the attitude of the bit is known. The Dupont tool communicated with the collar of the hole via a sonic pulse which was satisfactory in holes which did not intersect stone or structures. Now, in response to industry requirements, there are two electronic survey tools available which reside behind the bit. The upgraded Dupont tool supplied by AMT now uses a solid communications cable installed in the rods to transmit bit attitude while the rods are stationary and is used by many mines. The Drill Scout supplied by Surtron Technologies is a true MWD tool and communicates data out of the hole via a single strand wire cable fitted to a mandrill. This tool was introduced into active service in 1995.
There is currently no tool available for detecting small geological structures in boreholes during or after drilling. Longhole drilling requires that the seam roof be intersected each 50m to provide horizon control. This necessitates a pullback of the hole and drilling of another branch . The popular drill rods used today (eg BQ, NQ are not capable of sustained use for very long (+ 1500m) holes (Gray, 1992). The rod joins do not have adequate tensile strength.
Bowen Basin 1995 - Symposium
202
WHERE DO WE WANT TO BE? The need is increasing for drilling to confidently drain gas to below levels which can cause outbursts or unsafe rib emissions, while detecting and accurately locating all geological structures which are significant to mining. There is a desire for these demands to be met at a reasonable cost. Rotary drilling is favoured for routine gas drainage drilling because of its cost advantage, but drilling accuracy must be improved. A robust survey tool located behind the bit which can either provide accurate survey data during drilling or on retrieval of the rods is required. Such a tool would, at least, allow rotary drilling to be used without the time consuming need for post drilling survey. If hole trajectories are irregular enough to leave gaps in the drained coal, directional drilling could be used to target the undrained areas. Better directional control of rotary drilling or replacement with a more accurate drilling method at a similar cost is desirable. Detection and accurate location of geological structures in the hole are prime requirements of both rotary and directional drilling. There is a need to accurately identify structures varying in magnitude from mylonite 1cm thick to large faults. There is also a need to detect and define changes in gas parameters along the hole. Dete~tion of structures during drilling is desired to allow prompt action for maintenance of borehole wall stability. There is a need, especially during the drilling of directionally controlled holes, to know where the bit is located with respect to the boundaries of the coal seam. Currently the intersection of stone in a hole is confusing as it takes considerable effort to determine if the stone is roof, floor, a fault or a dyke. If stone is intersected, the rods must be partly withdrawn and a new branch of the hole commenced. There is a need to record drilling parameters in each hole drilled to provide accurate data for detection of geological hazards and to maximise drilling efficiency. The current method of manual recording is too haphazard and needs to be replaced by automated recording, data processing and drill control.
WHERE ARE WE GOING? The Exploration Taskforce of ACA initiated an ACARP funded scoping study of in-seam drilling research requirements in 1993. This study defined the industrys research requirements which have been addressed by research projects funded in 1994, 1995 and to be funded in 1996. The research is coordinated by the Taskforce with the author acting as the Taskforces research coordinator. Coordination is minimising duplication, assuring the research is directed and facilitating communication among all players.
Commercially available survey tools are improving and are satisfying industrys current needs. Tools to detect geological structures during drilling and the means of controlling the borehole environment to permit use of these tools are currently being developed under varying levels of ACARP support. To enable use of geophysical probes during drilling, the AGA project on Pressurisation of Boreholes was approved. A borehole collar pressurisation system was developed to allow drilling of holes under a pressure which is sufficient to prevent gas desorption during drilling. This pressure should help maintain borehole stability and will provide a water-filled hole for use of geophysical logging tools. AGA have incorporated a sampling vessel for accurate determination of gas desorption pressure of cuttings samples thus providing a rapid assessment of the potential for outburst. Trials of the system are planned shortly. Lunagas was funded to design a system for detecting changes in gas make during drilling and the resultant gas recovery system is being built for trials by Lunagas supported by BHP. Tools to detect structures are being developed. Funded by ACARP, AGA are developing detectors of drilling parameters including bit torque, load and RPM which will be installed behind the bit initially in directional drilling bottom hole assemblies and later in rotary drilling. The tool will incorporate a survey device being commercially designed by Sigra. Changes in coal strength indicated by the sensors should be correlatable with geological structures. ACIRL, with ACARP funding, has developed a prototype calliper tool for detecting changes in borehole diameter associated with structures. Partly funded by ACARP, CMTE are developing two tools for structure and roof I floor proximity sensing. These are a radar and a radiometric tool (Hatherly & others, 1995). AMT, the developers of the MECCA survey system, are commercially developing a Profiler tool which will be incorporated into their popular survey tool. The Profiler will detect roof/ floor proximity. Monitoring of a ProRam drill conducted by BHPR is providing data on changes of drilling parameters with drilling of varying geological structural conditions. There is a desire to automatically monitor drilling parameters on all rigs to reduce the human elements of error and lack of interest in detailed data recording and to maximise useful data capture. The downhole tools being developed will have to communicate their data to the drill collar. The AMT MECCA survey system does this via a cable-in-rod system and the Drillscout survey tool communicates via a single core cable. Adaptation of the MECCA for third party systems is being considered as are other communication systems. AGA have just completed an ACARP project which aimed to develop standard electrical and mechanical connections for downhole tools. Because of the wide diversity of requirements, standardisation is not really practical, but the
Bowen Basin 1995 - Symposium
203
project provided useful guidelines. Data communicated uphole will have to be stored and processed. With ACARP funding, BHPR are developing an intrinsically safe 486 field computer which will be initially used for their monitored ProRam drill, but will also be available to third parties. As the problems of hole surveying, roof/ floor proximity sensing and drill monitoring are overcome, there will be a need to drill longer holes to beyond 2000m to explore and predrain proposed longwall blocks. An ACARP funded Simtars project in 1993 showed that currently used rods will not be suitable for such long holes. With further ACARP support, Sigra have built a drill rod test rig and will be testing various drill rod joints to assess their suitability and to facilitate design of more appropriate joints. To improve straightness of rotary holes, the mines have been conducting their own site-specific trials of various bottom hole assembles and communicating their results to colleagues at regular drill operator and supervisor meetings. CMTE and BHP are funding a trial of waterjet drilling and waterjet assisted drilling at Appin Colliery to compare these types of drilling with conventional rotary drilling. Kembla Coal and Coke are just completing an ACARP project which studies the options for maintaining the stability of boreholes drilled through unstable ground . Finding solutions to in-seam drilling problems requires a multifaceted approach. ACARP funding of research into in-seam drilling totals around $500,000 per year for 1994, 1995 and 1996. This funding alone is insufficient to address all
problems nor to find solutions to the many day to day problems experienced by the mines. The funding allows investigation and initial development of solutions for medium term challenges. Other funding is available through CMTE and directly from mining companies. The mining companies put a lot of effort into solving their immediate problems, assisted by their suppliers and they share their achievements with other operators in the industry. Researchers funded by ACARP typically contribute funding to accelerate their projects. Suppliers are funding their own developments and assisting some of the research projects. Progress on all fronts is communicated at regular meetings of all players. The ACARP Exploration Taskforce is showing that industry challenges can be successfully addressed when all players are involved to firstly define the priorities, then to find the solutions. Regular communication between researchers, suppliers and industry assures that the projects are focussed and that minimal duplication of effort occurs.
ACKNOWLEDGEMENTS The willing cooperation and sharing of information by all my in-seam drilling colleagues in the mining industry, suppliers and researchers should ensure development of successful solutions to the industrys in-seam drilling challenges.
REFERENCES GRAY, I., 1992: Optimisation of Long Hole Drilling Equipment. ACARP Project C3023. HATHERLY, P., LUO, X., McKA V ANAGH, B., DIXON, R. & DEVEY, D., 1995: Seismic monitoring for mapping of longwall caving at Gordonstone mine. This volume.
Bowen Basin 1995 - Symposium
204
Bowen Basin 1995 - Symposium
205
H~drocarb on generation in Permian coals of ueensland, Australia: source of coa seam gases 1
1
1
1
1
2
1
.
M Glikson , SD Golding , G Lawrie , LS Szabo , C Fong , K Baublys , JD Saxby & P Chatsf1eld 1. The University of Queensland Coalseam Gas Research Group 2. CSIRO Division of Energy and Coal Technology
Petrological and experimental studies of Bowen Basin coals show a perhydrous vitrinite to be the source of oil and coalseam gas. The present study supports a threshold of oil generation from sub-bituminous coals, with peak generation occurring in high volatile bituminous coals of 0.8% vitrinite reflectance. Although the light fraction has been shown to be expelled, a substantial proportion of the oil generated is heavy oil, retained in micro-cleats and inertinite cell cavities. The oil residue or bitumen, when subjected to further heating, cracks into methane.
Our study shows a strong correlation between native gas desorption and bitumen content and indicates that bitumen is the major source of coalseam gases in Bowen Basin coals. Bitumen, although sourced from vitrinite may show equal or higher concentrations within inertinite cell cavities as in vitrinite cleats. Bitumen concentrations effect H/C ratios as well as carbon isotope compositions of vitrinites and inertinites. Experimental studies and carbon isotope compositions support vitrinite as the source of the bitumen. The effect of rapid heating at high temperatures on coals is further highlighted by coking of bitumens in the vicinity of vein minerals, and the sporadic distribution of coked vitrinites and concentrations of inertinites throughout coal seams in the basin. The sporadic distribution of inertinites is not reconcilable with their formation being the result of adverse depositional environment or climatic factors. Residues from artificially matured and naturally matured vitrinite and its resulting inertinite have been observed using transmission electron microscopy and atomic force microscopy. These residues were seen to have developed identical ultra-structures. Micro-channels in vitrinite at peak oil generation form from the breakdown of oil-generating material, leaving drainage channels. Upon further heating, the vitrinite alters into inertinite. Nano-pores in the order of soA are characteristic of inertinite and form a sponge-like nano-texture capable of adsorbing high concentrations of gases.
2
INTRODUCTION Previous Studies and Aims of the Present Study
Until very recently, coal has not been regarded as a major source of petroleum in Upper Palaeozoic to Cainozoic reservoirs, even though in many cases the coal seams are the only source rock logically linked to particular oil reservoirs. Oil generation from coals has been studied in the early eighties by Durand & Paratte (1982) and Bertrand (1984). The former demonstrated the oil generating capacity of coals and suggested rapid movement and expulsion of oil from coal. The latter compared the geochemical and petrographic characteristics of coals, and found a discrefancy between geochemical indicators o petroleum potential and the notion of exinite being the source of oil. A recent revival of coal as a source of oil has seen a number of studies (e.g., Powell & others, 1991; Noble & others, 1991; Snowdon, 1991; Boreham & Powell, 1993). Clayton & others (1991) demonstrated that oil has generated from coal of the Fruitland Formation in the San Juan Basin as well as other basins in the U.S.A and has been expelled into overlying reservoirs. Most studies focus on liptinite group macerals as the source for oil in coals. Given the low content of primary liptinite group maceral (e.g., exinite and resinite usually in the order of 2-3%) compared to an average of 50% of perhydrous vitrinite in most coals, it is difficult to reconcile these data with any significant oil generation from the primary liptinite macerals. The source of coalseam gas in Australian Permian basins is likewise a subject of controversy. Most studies support thermal cracking of coal macerals through burial effect as the trigger and source of coalseam gases. Recently, bacterial reduction of C02 by methanogens was put forward as a major process responsible for coalseam gas generation (Smith & others, 1992). Several sources and processes may well be involved in gas generation. Resolution of the origin of gases at specific sites requires the systematic appraisal of coal rank, maceral composition, gas chemistry and isotope composition within the local geological context (cf. Golding & others, 1995). The fundamental problems of coal characteristics effecting hydrocarbon generation,
Bowen Basin 1995 - Symposium
206
both oil and gas, arise from the heterogenous nature of coal as a rock. Therefore, only through the interaction of several disciplines is it possible to understand the processes responsible for hydrocarbon generation and their transport or storage in coals. The aims of the present interdisciplinary study are to determine the source of coalseam gases, as well as understand the processes responsible for liquid hydrocarbon generation and movement in coal and the formation of high inertinite coals in Australian Permian basins. Samples and Methods of Study
Core samples from exploratory boreholes and highwall samples were collected from coal mines and exploration drilling in north, central and southern Bowen Basin, as well as the Triassic sub-basins of Callide and Tarong. Desorption of gases was carried out on core samples obtained during drilling and stored in pressurised stainless steel cylinders. Cores were desorbed over a time of 600 hours. Petrological studies have been carried out on polished coal blocks in reflected white light, and fluorescence mode, at wave length of 546nm, using an MPV-2 photomicroscope. Transmission electron microscopy (TEM) was applied to ultra thin sections of coal as well as residues from artificially matured coals following the method outlined by Glikson & Taylor (1986). Observations were carried out on a Hitachi-H-800 electron microscope. A Jeol 6400 field emission SEM equipped with Energy Dispersive Spectrometer (EDS) was used for elemental analysis of cleat and vein minerals. The same coal blocks were used for maceral analysis and reflectance determinations.
Atomic Force Microscopy (AFM) was carried out on polished resin-embedded coal samples embedded perpendicular to bedding as for light microscopy. Atomic force microscope images were obtained on PSI Autoprobe LS (Park Scientific Instruments) in both contact and non contact modes. Full details of the methodology will be published elsewhere (Fong & others, 1995). This technique utilises van der Waals attractions and repulsions to obtain a topographic profile of the sample surface. The images presented here were obtained in contact (repulsive) mode where a constant force was maintained between the tip (mounted on a 0.6µ cantilever) and the coal surface. The z axis was used to maintain this force, and the signal is directly proportional to vertical excursions of the surface.
Bitumen was separated from samples representative of ranks from sub-bituminous to medium volatile bituminous using chloroform in a Soxtech System HT2. Quantifying bitumen was done by weight percent in high volatile bituminous coals and by petrological methods in medium volatile bituminous and sub-bituminous coals.
Elemental analysis was carried out on Carlo Erba elemental analyser Model 1106. Carbon isotope analysis was carried out on separate vitrinite and inertinite fractions as well as separated bitumen. CO2 collected after combustion was analysed on a VG 602E isotopic ratio mass spectrometer. The isotope data are reported in the usual delta per mil notation, being the difference in parts per thousand between the isotope ratio of the sample and that of the PDB standard (Peedee Belemnite).
Experimental maturation simulation of coals was carried out on suites of samples representative of a particular rank, ranging from sub-bituminous to medium volatile bituminous. Cores 4.5mm in diameter and 5mm height, from separate vitrite (95% vitrinite) and inertinite-dominated dull bands from sub-bituminous, high and medium volatile bituminous coals were used. These were heated from room temperature to 400, 500, 600, 700 and 800°C in a thermogravity apparatus, Rigaka TG 8110, and thermomechanical apparatus, Rigaka TM 8140. Both instruments were connected to the Thermal Analysis Station T AS 100. Hydrocarbons and gases generated and expelled were collected for analysis by GC-MS.
RESULTS AND DISCUSSION Transmission Electron Microscopy
Application of Transmission Electron Microscopy (TEM) to the study of the coals has enabled a better understanding of the nature and origin of some of the less understood macerals such as vitrinites, micrinites and detrinites. A perhydrous vitrinite is a predominant and the most commonly occurring maceral in Australian coals of Permo-Triassic age. The relatively lower reflecting and isotropic perhydrous vitrinite forms bands, often several hundred microns and more in thickness, which TEM shows to be composed of electron transparent fine laminae of lipidic nature (Plate figure 1), alternating with higher electron dense humic matter (Glikson & Fielding, 1991 ). This vitrinite has been interpreted to represent accumulations of leaves (Falkner, 1986) and is being shown in our study to be a major source of oil and methane gas in Australian Permian sedimentary basins. The generation of oil from inertinite-dominated coal is shown to be dependant on the presence of exinite and resinite. The latter rarely form more than 1-2% of the total maceral composition. The particular microstructure of this type of vitrinite following oil generation (Plate figures 4 & 5) renders it not only highly susceptible to adsorption of gases but facilitates movement of gases within the coal. The lipidic laminae which are seen to slowly disappear during oil generation (Plate figures 6 & 7) leave micro-channels within the contracting vitrinite. Storage of gas in vitrinites would be facilitated along these channel-like microstructures in the order of P.5 microns across, being significantly larger than the nano-structures
Bowen Basin 1995 - Symposium
207
Plate figure 1. Vitrinite (V) and inertinite (I) in a sub-bituminou s coal. Vitrinite typically shows fine laminations of lipidic (electron transparent) nature alternating with denser humic material.
Plate figures 2 &: 3. High volatile bituminous coal (0.7-0.8% Rv). Bitumen infill of inertinite cell cavities. Bitumen (electron transparent material with characteristic 'holes', B), displaying flow lines often delineated by mineral matter (M) carried with the mobilised heavy oil.
Plate figures 4 &: 5. Residue from a high volatile bituminous coal subjected to 600°C heating. Breakdown of hydrocarbon generating lipidic laminae is visible as is the conversion of vitrinite to inertinite.
Bowen Basin 1995 - Symposium
208
Plate figure 6. Inertinite from a medium volatile bituminous coal (1.3%Rv).
Plate figure 7. Inertinite formed from vitrinite heated to soo·c.
Plate figure 8. High magnification (200 000 times) of inertinite formed from vitrinite from artificial maturation simulation to soo·c. Very fine sponge text~e formed from nano-pores of the order of 80A constitutes the matrix. Larger pores are visible as somewhat fuzzy light patches. Black nano-particles are metals.
Plate figure 9. Naturally formed inertinite from a medium volatile coal, showing identical structures and texture to that obtained from artificially formed inertinite. Bowen Basin 1995 - Symposium
209
Multi Image Presentation
A 160.0
A 60.0
120.0
40.0
80.0
20.0
40.0
0.0
0.0
0
1500 1000 500 Jun 22 95 s33gz,Q010 Dull lnertinite 10 A
1500 2000 A 1ooo 500 Bright s19,O010 95 27 Jun 10B
0
2000A
Plate figure 10a & b. Atomic Force micrographs showing similar pore structure as seen in TEM. Dark areas represent pores. Micro-mesh texture not visible in AFM.
subsequently characterising inertinites. Microchannels formed in vitrinites during oil generation become natural drainage channels for hydrocarbons generated. This perhydrous vitrinite being distinctly isotropic has high adsorptive power as demonstrated experimentally (Ting, 1987). With further heating at peak gas generation stage, the vitrinites are transformed into inertinites. TEM studies of natural inertinites show sub-micron pore structure in the order of 80A, forming a micro-sponge texture (Plate figures 8 & 9), which explains oil and gas movement through these coal components, and the subsequent presence of heavy oil residue in fusinite cell cavities (Plate figures 2, 3 & 13). Inertinite plant cell walls under a light microscope appear impervious. It is noteworthy that regardless of precursor (whether Type I, II or III), all organic matter forms micro-mesh structures when past generation of hydrocarbons or other volatiles (Saxby & others, 1986; Glikson & others, 1989, 1992; Glikson, 1994, 1995). TEM studies of residues from maturation simulation experiments have shown identical nano-structures in inertinite artificially matured from vitrinite to those of naturally formed inertinite (Plate igures 8 & 9). Inertinite or char as it often is referred to, due to its very high micro-porosity is capable of storing excessive concentrations of gas under lithostatic or hydrostatic pressure. This is supported by our desorption studies of inertiniterich coals. A high volatile bituminous coal (0.7-0.8% Rv) demonstrates oil generation having occurred with the residual heavy oil, the precursor of bitumen
having moved through the coal and polymerised in cavities of inertinite (Plate figures 2 & 3). Flow lines in the bitumen are visible, and a strong association with mobilised minerals is evident. In residues from a high volatile bituminous coal subjected to 600°C, most of the oil has generated and the micro-channels created by this process are still distinguishable in parts of the coal (Plate figure 4). Hardening through increasing density occurs and the 'chatter' lines typical of dense materials such as inertinite are often a characteristic feature (Plate figure 5). This feature becomes more pronounced in residue after 800°C (Plate figures 6 & 7).
Atomic Force Microscopy The porous structure of a number of Bowen Basin samples has been imaged by this technique and the results will be presented in detail elsewhere (Fong & others, 1995). Examples of an inertinite (Plate figure 10a) and of a vitrinite (Plate figure 10b), are presented, both from a medium volatile bituminous coal sample. The inertinite exhibits substantial mesoporosity (pores of microns diameter) in comparison with its vitrinite precursor which exhibits mainly macroporosity (pores 0.04µ diameter). This mesoporosity provides an interconnecting network which enhances storage capacity and diffusion characteristics of adsorbed gas molecules. The porosity observed in vitrinites is commonly sparse and is well defined with cylindrical entrances (Plate figure 10b). These microchannels observed have diameters typically of 0.05-0.1µ which classify as macropores in character.
Bowen Basin 1995 - Symposium
210
Plate figure 11. Coked bitumen adjacent to pyrite or calcite veins (reflected light microscopy).
.._
;,. . ,•
..• . . .
.
.-•
. ~,--•-·-~?-..
•
Plate figure 12. Coke after vitrinite (reflected light microscopy).
Plate figure 14. Bitumen vein (lower part of photo) and infill of inertinite cell cavities. insert: bitumen infill of cleats in vitrinite (reflected light microscopy).
Organic Petrology and Maturation Simulation Experiments
Emphasis has been placed in this study on the primary vitrinite and inertinite macerals and the secondary maceral bitumen (cf. bituminite of Taylor & others, 1991). The coals of the Bowen Basin display a diversity in inertinite to vitrinite ratios throughout the basin, with no distinct provenance (Figure 1). All Bowen Basin coals have an input from bitumen, varying from <5% to 45%. Generally bitumen concentrations appear to increase towards the south; however, some boreholes in the Sutter Creek area in the northernmost part of the basin may contain 20-30% bitumen, further supporting localised heat effects rather than regional geothermal regimes as the dominant control on hydrocarbon generation. Bitumen is seen to infill cleats in vitrinite, forming veins (Plate figure 14a), as well as infilling cell cavities in inertinites (Plate figure 14). Our studies to date show a good correlation between native gas desorption and bitumen content of Bowen Basin coal cores (Figure 2). Extractable bitumen characteristically decreases with elevation in rank, corresponding to thermal degradation; however, highest yields were obtained from coals at 0.7-0.9% Rv. Bitumen at this rank still displays the characteristic orange fluorescence when subjected to blue light excitation. At ranks 1 % Rv, mainly pyrobitumen is observed which is devoid of fluorescence. Bitumen when associated with cleat mineralisation characteristically displays coking structure (Plate figure 1l). Coked vitrinite is also often associated with vein mineralisation (Plate figure 12). Reflectance of vitrinite shows fluctuations both laterally (Figure 3a and 3b) and vertically within seams (Figure 4), in direct response to the proximity ofigneous intrusions (Crossley, 1994) as well as indirect response to heating by hydrothermal fluids (Collerson & others, 1995).
Plate figure 13. Calcite vein in bitumen.
In maturation simulation experiments, vitrinite and inertinite responded differently to temperature in
Bowen Basin 1995 - Symposium
211
0
o'bl <eS : oo •o • •
0
OOo
•
0. 0
0
0 0
~o o 0 100% 100% Bitumen,__........__ _..__ ___..._ __.,,.____...__....___.....__ __..______. lnertinite Figure 1. Vitrinite, inertinite and bitumen composition of Bowen Basin coals; filled circles for northern Bowen Basin, open circles for southern and central Bowen Basin.
9000
-.E
•
8000·
C
7000-
•
§ 6000-
,-
u, n,
O>
5000
•
uQ) .0 .....
0
4000
u,
Q)
u
3000
E
•
-•
•
•
•
• •
2000
1000
•
0
5
10
I
I
I
I
I
15
20
25
30
35
' 40
45
50
% Bitumen Figure 2. Correlation between native gas desorption in mls (STP) and bitumen content of Bowen Basin cores.
Bowen Basin 1995 - Symposium
212
604000
60'500
605000
605500
I ;;
606000
606500
I
NORTBERN SILL
-+-----+--f~------4----'.----+-- ~ -~ \ _
DYKE
Sn.L MACNtTIC A.NOMA!. Y PAUl.T
;
-+- sample location
A
604000
604500
605000
605500
606000
606500
I
NORTIIERN SILL
' I
I i I \
I .!
J
DYKE
Sll.L ;
MACPttTIC A.NOMA!.' f AULT
/
/
I I
I
B
Figure 3. Lateral variations in vitrinite reflectance plotted as isotherms in response to intrusions and associated hydrothermal fluid activity: A, top of seam; B, Sm below top of seam (New lands geology after Crossley, 1994).
Bowen Basin 1995 - Symposium
213
825
8 .775 .75
i
►
0
It:
.725 .7 .675 .65 .625 .6 .575
28
34
32
30
36
36 ..Dqlth
42
40
44
46
46
Figure 4. Vertical fluctuations in vitrinite reflectance within a coal seam, Newlands.
1 0.9 II
t)
0.8
I
• •• • □
□ □
•
•
□
•
0
•E 0.7
•
□
0
~
•
□ □
0.6
11
□ □
0.5-
• • □
□ □
□
0.4-'---~,---. -----.-----.--- """T"""---r,- -~,---.----.-- --, 1.2 1.3 1.4 1.5 1.1 1 0.5 0.6 0.7 0.8 0.9 %VRo
•
vitrinite
□
inertinite
Figure 5. Atomic H/C of Bowen Basin and Callide coal macerals versus % Rv.
regard to peak hydrocarbon generation: the maximum mass loss in vitrinite occurring between 340-SS0°C. This interval marks peak hydrocarbon generation and expulsion of all light oils and some gases. Isolated bitumen heated to these temperatures cracked into hydrocarbon gases without leaving any residue. Inertinite-dominat ed samples on the other hand attained maximum weight loss at higher temperatures of 570°C; however, total weight loss from these was significantly lower than from vitrinite. Details of this part of the study will be published separately.
Mass losses occurring to coal below 300 ·c consist mainly of moisture and some carbon dioxide. High yields of bitumen have been reported to be typical in organic matter subjected to rapid heating at high temperature (Barth & others, 1989). The same study found maximum bitumen formation at 280- 340°C. This study lends strong support to a previous study (Price, 1993) which suggested that the role of geologic time in organic maturation had been overestimated. Localised intense heat has been shown in our study to exert a marked effect in organic metamorphism.
Bowen Basin 1995 - Symposium
214
-23 D
-23.5
.E
._ Q) a.
(.)
D
• -24-
Q)
Cl
D
D
•
-25
•
D
••
D D
D
•
••• • •
-24.5-
(") .....
D
D
• D
• ••
D
D
•
D
• •• • • D
-25.5
• D
-26
0
I
I
5
10
I
15
•
I
20
25 30 % Bitumen
vitrinite
□
35
40
'
45
50
inertinite
Figure 6. Carbon isotope compositions of Bowen Basin coal macerals versus bitumen content.
-23 D
-23.5
.E ._
-24
Q)
a. (.)
-24.5
(")
..... Q)
Cl
-25-
D
D
••
•
D D
D
•
D
•
•• •
D
D
• • ••
D
•
-25.5-
• •
•
I
I
D
II
• D
•
D
-26 0.5
I
I
I
I
0.6
0.7
0.8
0.9
•
vitrinite
1 1.1 %VRo
□
I
1.2
inertinite
Figure 7. Carbon isotope compositions of Bowen Basin coal macerals versus% Rv.
Bowen Basin 1995 - Symposium
'
1.3
'
1.4
1.5
215
Reflectance of residues after heating to 400"C was 0.5-0.6% compared with 0.4-0.5% in the original coal sample. A significantly more pronounced change was evident after 600"C heating. The vitrinite was transformed into characteristically anisotropic ribbon coke, with some pyrobitumen and mineral matter inclusions (Rmin = 1.65-1.72%, and Rmax = 2.74-2.86%). Residues after 800°C heating had the appearance of pyrofusinite with reflectance of 2.2% (Rmin) and 4.5-4.6% (Rmax). Elemental analysis, carbon isotopes and vitrinite reflectance
A more or less expected inverse relationship is visible between vitrinite H/C and Rv (Figure 5); however, H/C ratios of inertinites in high to medium volatile bituminous coals are often close to or the same as those of vitrinites at ranks greater than 0.7% Rv, depending on bitumen content. The latter can be in higher concentrations within inertinite than vitrinite. The pronounced effect of maceral associations on elemental composition has been demonstrated previously (Mastalerz & others, 1993). The same study showed that inertinite was the product of intense thermal degradation of the associated vitrinite. Similarly, our study confirms inertinite being the product of short duration intense heating of vitrinite. In samples where bitumen concentrations are relatively low (i.e., <10%), inertinites are isotopically 'heavier' than the corresponding vitrinites (Figure 6). Differentiation between inertinite and vitrinite carbon isotope compositions is often masked, however, by higher bitumen concentrations in the former. Increasing rank (and decreasing H/C) is followed generally by isotopically 'heavier' (i.e., less negative) vitrinites and/ or inertinites in sub-bituminous coals before oil generation (Figure 7). Previous studies of the isotope geochemistry of Australian coals have reported no systematic trends in the carbon isotope composition of coals with maturity (Smith & others, 1982). The simplest explanation for the trend of heavier carbon isotope compositions with maturity is that the lighter isotope of carbon was preferentially lost during maturation. Studies of kerogen in both contact and regionally metamorphosed sediments show similar changes in carbon isotope composition with maturity as measured by vitrinite reflectance (e.g., Simoneit & others, 1981). Vitrinite reflectance and carbon isotope compositions often display an inverse trend for coals in the high to medium volatile bituminous rank (Figure 7). This anomaly can be explained only as a result of the presence of adsorbed isotopically light Cfu. In sub-bituminous coals, a more 'normal' relationship is obtained between carbon isotope composition and vitrinite reflectance. Thus, a sharp distinction in H/C, vitrinite reflectance and isotope systematics marks coals that are within peak oil generation from those coals that are at the threshold or below the oil window. Isotopic compositions of bitumens are similar to those of the
associated vitrinites, further supporting vitrinite as a source of oil .
SUMMARY AND CONCLUSIONS 1. Bowen Basin coals are characterised by a significant input from bitumen. 2. Inertinite to vitrinite ratios show an irregular distribution at all scales, and are believed to be the result of preferential rapid heating at high temperatures. A variety of coking structures supports episodal high temperature heating of many coals. 3. Coal rank determined by vitrinite reflectance is often 'erratic', rather than increasing systematically with depth, with significant variations both laterally and vertically within individual coalseams. Thermal aureoles of 3.0% Rv over 1km in diameter about igneous intrusions are not unusual. 4. TEM studies showed ultrastructures of inertinites in the form of nano-pores, organised in a micro-mesh forming a sponge texture enabling movement of liquid hydrocarbons and storage of gases. AFM studies further supported these observations. Both TEM and AFM demonstrated an analogy between artificially matured vitrinites and naturally obtained inertinites. 5. Experiments simulating coal maturation established oil generation and bitumen production from sub-bituminous coal, and with further heating the formation and release of gaseous hydrocarbons . 6. Vitrite bands composed of almost pure vitrinite, under artificial maturation generated significantly higher yields of hydrocarbons (i.e., oil & gas) than inertinite-dominated coals. 7. C-isotope compositions confirm vitrinite as the source of hydrocarbons, and also demonstrate the presence of bitumen in inertinites, as well as vitrinites. 8. H/C ratios of maceral groups are effected by bitumen concentrations.
ACKNOWLEDGMENTS This study is part of an ongoing project funded by Queensland Transmission and Supply Corporation (QTSC) and ERDC, and we gratefully acknowledge their supyort. Thanks are due to George Blazak for elementa analysis. Our sincere thanks to Frans Bos and The Shell Company of Australia, David Moelle and Roger Byrne of Capcoal, Sarum Peou and Grant Davidson of Newlands Coal and Dick Clair and MGC Resources whose assistance with access to sampling sites and drill-core material is much appreciated. Lynne Milne's assistance with some of the TEM preparation is gratefully acknowledged.
Bowen Basin 1995 - Symposium
216
REFERENCES BARTH, T., BURGUND A.E. & HOPLAND, A.L., 1989: Generation of organic compounds by hydrous pyrolysis of Kimmeridge oil shale - bulk results and activation energy calculations. Organic Geochemistry, 4(1), 69-76.
BERTRAND, P., 1984: Geochemical and petrographic characterisation of humic coals considered as possible source rocks. Organic Geochemistry, 6, 481-488. BOREHAM, C.J. & POWELL, T.G., 1993: Petroleum source rock potential of coal and associated sediments: Qualitative and quantitative aspects. In Engel, M.H. & Macko (Editors): Organic Geochemistry, Plenum Publishing Corporation, 133-157. CLAYfON,J .L., RICE, D.D. & MICHAEL, G.E., 1991: Oil generating coals of the San Juan Basin, New Mexico and Colorado, U.S.A. Organic Geochemistry, 17(6), 735-742. COLLERSON, K.D., GLIKSON, M., GOLDING, S., CROSSLEY, J., SZABO, L., SAXBY, J. & REGELOUS, M., 1995: Gondwana rifting, magmatism and the generation of gas in Australian Permian coal (submitted to Chemical Geology).
GLIKSON, M., TAYLOR, D. & MORRIS, D., 1992: Lower Palaeozoic and Precam brian petroleum source rocks and the coalification path of alginite. Organic Geochemistry, 18(6), 811-897. GLIKSON, M., 1994, 1995: Hamersley Basin. Unpublished Reports to CRA-Exploration. GOLDING, S.D., GLIKSON, M., GRAY, I., LAWRIE, G. & GILLIES, A.D.S., 1995: Basin characterisation for coalseam methane potential. ERDC Coalbed Methane Strategic Planning Workshop, Brisbane. MAST ALERZ, M., BUSTIN, R.M. & LAMBERSON, M.N. 1993: Variation in chemistry of vitrinite and semi-fusinite as a function of associated inertinite. International Journal of Coal Geology, 22, 149-162. NOBLE, R.A., WU, C.H. & ATKINSON, C.D., 1991: Petroleum generation and migration from Talagang Akar coals and shales offshore N.W. Java, Indonesia. Organic Geochemistry, 17(3), 363-374. POWELL, T.G ., BOREHAM, C.J., SMYfH, M., RUSSELL, N . & COOK, A.C., 1991: Petroleum source rock assessment in non-marine sequences:pyrolysis and petrographic analysis of Australian coals and carbonaceous shales. Organic Geochemistry, 17(3), 375-394.
CROSSLEY, J.M., 1994: Geology of the New lands Eastern Creek South area, central Queensland. B.Sc.Hon.Thesis, University of Queensland.
PRICE, L.C., 1993: Thermal stability of hydrocarbons in nature: Limits evidence characteristics, and possible controls. Geochimica et Cosmochimica Acta, 57, 3261-3280.
DURAND, B. & PARATTE, M., 1982: Oil potential of coals: A geochemical approach. Symposium Petrological and Geochemical Exploration of Europe , Glasgow, 255-265.
SAXBY, J.D., BENNETT, J.R., CORCORAN, J.C., LAMBERT, D.E. & RILEY, K.R., 1986: Petroleum generation: simulation over six years of hydrocarbon formation from torbanite and brown coal in a subsiding basin. Organic Geochemistry, 9, 69-81.
FALKNER, A.J., 1986: Sedimentology of the Blackwater Formation, Ipswich coal measures, southeast Queensland. PhD Thesis, University of Queensland. FONG, C., GENTLE, I., GLIKSON, M. & LAWRIE, G. in preparation: for submission to Langmuir. GLIKSON, M. & TAYLOR, C.H., 1986: Cyanobacterial mats; major contributors to the organic matter in Toolebuc Formation oil shales. Geological Society of Australia Special Publication, 12, 273-286. GLIKSON, M., LINDSAY, K. & SAXBY, J., 1989: Botryococcus, a planktonic alga, the source of petroleum through the ages; TEM study of oil shales and petroleum source rocks. Organic Geochemistry, 14(6), 595-608. GLIKSON, M. & FIELDING, C., 1991: The Late Triassic Callide Coal Measures, Queensland, Australia: Coal petrology and depositional environments. International Journal of Coal Geology, 18(3), 313-332.
SIMONEIT, B.R.T., BRENNER, S., PETERS, K.E. & KAPLAN, I.R., 1981: Thermal alteration of Cretaceous black shale by diabase intrusions in the Eastern Atlantic: II effects on bitumen and kerogen, Geochemica et Cosmochimica Acta, 45, 1581-1602. SMITHJ., GOULD, K.W. & RIGBY, D., 1982: The isotope geochemistry of Australian coals. Organic Geochemistry, 3, 111-131. SMITH, J., PALLASSER, R. & RIGBY, D., 1992: Mechanisms for coalbed methane formation. Coalbed Methane Symposium, Townville, 63-67. SNOWDON, L.R., 1991: Oil from Type III organic matter: resinite revisited. Organic Geochemistry, 17(6), 743-747. TAYLOR, C.H., LIU, S.Y. & TEICHMOLLER, M. 1991: Bituminite - a TEM view. International Journal of Coal Geology, 18, 71-85. TING, F.T.C., 1987: Optical anisotropism and its relationship with some physical and chemical properties of coal. Organic Geochemistry, 11(5), 403-405.
Bowen Basin 1995 - Symposium
217
Nature and origin of f!actures in permian coals from the Howen Basin and the relation ship with in situ reservoi r permea bility 4
2
CI Pattison 1, CR Fielding , RH McWatters3& LH Hamilton 1. Geocontext Pty Ltd 2. Department of Earth Sciences, University of Queensland, St Lucia 3. Geospan Pty Ltd 4. School of Geology, Queensland University of Technology
A field investigation into the development of cleat and other fractures within Permian coal measures was undertaken in the Bowen Basin of eastern Queensland, Australia, in order to provide predictive information on coal permeability for use in coalbed methane exploration. The work initially involved the detailed examination of exposed coal seams and was followed by the integration of coal core fracture descriptions and measured in situ coal seam permeability data. Detailed fracture data were collected from five open-cut and three underground mines in the southern and central Bowen Basin, covering the Upper Permian German Creek Formation and Rangal Coal Measures. Fractures noted in the coals fall readily into the four categories of faults and shear zones, extension and compressionrelated joint sets, mining-induced fractures, and coal cleats. Four geometric varieties of coal cleats were identified: class (A) orthogonal sets, (B) sinusoidal sets, (C) polygonal sets, and (D) chaotic sets. Superimposed or overprinted type A sets were also observed locally. On a regional scale the cleats typically parallel dip (face cleats) and strike (butt cleats), but local departures from this pattern occur in proximity to faults, where face and butt cleat directions were often reversed, rotated or multimodal. Field data suggest that coal cleats of classes A, B and C were formed by brittle fracturing of the coal during burial, while class D and superimposed cleats were formed during later compressional events. Constraints on the timing of deformation events affecting the Bowen Basin, and geochemical data provided by Faraj & others indicate that the cleats were formed within 5MY of formation of precursor peats, but were in many cases modified by later structural events. To assess the relevance of this information to coalbed methane exploration and development complimentary coal-core fracture descriptions derived from a series of MIM Holdings Ltd coalbed methane exploration drillholes were analysed and compared with in situ stress and permeability data .. All coals were logged at the lithotype scale and the results used to develop a fracture index capable of assessing relative differences in fracture intensity and the effects of fracture mineralisation. The various indices were then plotted against measured in situ permeability
and incorporated stress data, with the resulting relationship indicating that the intensity of inherent fracturing has a significant impact on the permeability of a given coal seam.
INTRODUCTI ON The considerable black coal deposits of the Permo-Triassic Bowen Basin in east-central Queensland, Australia, are mined extensively by open-cut and underground methods. In recent times, there has been an active interest in the potential for commercial coalbed methane extraction from sub-surface coal measures in the basin. As part of a broader research effort into the controls on methane generation, storage, and production potential of Bowen Basin coals, this paper presents summary results of a regional investigation into the characteristics and origin of cleats, and their relationship to other structures and sedimentary features associated with two major Late Permian coal measure units (German Creek Formation and Rangal Coal Measures). The aims of this study were to determine the local and regional distribution and orientation of fractures occurring naturally within coal, to investigate the relationship between cleats and other fractures (joints, shears, faults), and interpret the origin of cleats and establish a regional model for their development. The relevance of this information to coalbed methane exploration and development was then assessed by devising a generic coal fracture index from available coal core description data that could be used as a guide to relative levels of reservoir fracture intensity. Once calculated, the indices were plotted against measured in situ permeability results (injection/fall-off testing) and the effects of measured present-day in situ stress incorporated.
REGIONAL GEOLOGY The Bowen Basin is a large, elongate Permo-Triassic sedimentary basin extending north-south for approximately 900km in eastern Queensland and northern New South Wales, Australia (Figure 1). It
Bowen Basin 1995 - Symposium
218
contains up to 10km of variably deformed shallow marine and fluvio-deltaic siliciclastic sedimentary rocks, which are unconformably overlain in the south by relatively flat-lying Jurassic and Cretaceous rocks of the Surat Basin. The region hosts significant economic accumulations of coal, natural gas and precious metals, and is one of the most intensively explored basins in Australia. In gross structural terms, the Bowen Basin can be readily divided into distinct units that reflect underlying basement morphology and the effects of subsequent tectonic events on the basin sequence (Figure 2). The main depocentre of the Bowen Basin, known as the Taroom Trough, occurs along the eastern margin of the basin and lies adjacent to the Connors and Auburn Arches, which collectively form part of the extensive New England Fold Belt. Subsequent erosion of these arches has exposed Late Carboniferous batholiths that represent the core of a former Andean-style continental-margin mountain range. The western flank of the basin comprises the Collinsville Shelf and Comet Ridge, which together represent a basement terrain that was originally cratonised to the Australian plate during the Late Palaeozoic (Kirkegaard, 1974). The remaining significant tectonic element is the Denison Trough, which along with recently identified smaller marginal rift-basins (Fielding & others, 1994), formed during the initiation of the Bowen Basin. On the larger tectonic scale, the Bowen Basin forms part of the Bowen-Gunnedah- Sydney foreland system of eastern Australia, which began forming in response to convergence of the palaeo-Australian and palaeo-Pacific plates during tne Early Permian (Murray & others, 1987; Murray, 1990; Caritat & Braun, 1992; Elliott, 1993). Initial sediment accumulation occurred on a basement of Siluro-Devonian and Carboniferous volcanic and marine sedimentary rocks and comprised thick piles of predominantly basaltic volcanics and volcanic1astic sediments (Dear, 1994). Continued downwarping of the basin during the Early Permian, or a marine transgression, subsequently initiated widespread marine sedimentation in the eastern part of the basin and mixed marine, deltaic and fluvial sedimentation in the north and west, where periodic coal measures accumulated. Towards the end of this activity in earliest Late Permian times, extensive coal-forming environments developed on deltaic and coastal plains occurring along the western margin of the basin that are now preserved as the German Creek Formation and eqmvalents (Fielding & Mcloughlin, 1992; Falkner & Fielding, 1993; John & Fielcing, 1993). This period was later followed by renewed u plift and associated volcanic activity to the east of the Bowen Basin, which initiated a period of dominantly terrestrial sedimentation and the effective reorganisation of dispersal systems. The marine basin was progressively filled by successive pulses of coarse sediment supply derived from the east, and feeding into major southward-flowin g axial river systems. Lowland alluvial and coastal
plain environments were rapidly established across the entire basin, leading to the accumulation of the Rangal Coal Measures and equivalents at the end of the Permian (Fielding & others, 1993). Continued uplift along the eastern margin of the basin ultimately led to the development of south-westerly divergent thrust fronts within sedimentary rocks occurring along the eastern margin of the basin and adjacent to major faults developed at the boundary with shelf regions to the west, including the German Creek-Oaky Creek area on the Collinsville Shelf and the South Blackwater, Cook and Curragh areas on the Comet Ridge. Uplift along the eastern margin of the basin and associated compression of the basin sequence continued into the Triassic, culminating in further major episodes of crustal shortening in the Early and Middle Triassic (Ziolkowski & Taylor, 1985; Elliott, 1993). This reriod also corresponds with the maximum burial o Bowen Basin sediments determined from subsidence modelling (Baker & Caritat, 1992). Subsequent geological events of potential relevance to this study include a widespread Early Cretaceous thermo-magmatic event within the Bowen Basin and adjacent regions (Pattison, 1990; Marshallsea & others, 1985), and a Middle Cretaceous compressive deformation (Dickens & Malone, 1973; Elliott, 1993) that affected eastern Queensland. For a more detailed assessment of the basin evolution with respect to cleat formation see Pattison & others (in press).
METHODOLO GY Field Fracture Mapping
Fracture measurements were undertaken at five mine sites in the central and southern Bowen Basin which exploit the Late Permian German Creek (Oaky and German Creek) and Rangal Coal Measures (Moura, South Blackwater, Cook, and German Creek East). All accessible open-cut pits (totalling 14) and underground workings (3) were visited and exposed coal faces studied at regular intervals (50-lO0m). In some areas, data were collected from more closely-spaced stations, typically 5 or 10m. At each location the orientation and spacing of cleats and any other coal fractures were recorded at regular intervals from top to bottom of the exposed seams. In cases where fracture orientations were consistent throughout the vertical profile of the seam, ten readings were recorded per station. However, where variations were evident, the seam was divided into identifiable structural units with each unit being analysed separately. The physical nature of the fractures were also recorded at each sampling locality, with particular attention paid to any curvature in the vertical and horizontal planes, as well as the presence and composition of infilling minerals. The prevailing angle between the predominant cleat sets was measured periodically and detailed coal profiles attempted at a few sites only. Wherever possible, the traverses incorporated larger-scale faults, which were examined for
Bowen Basin 1995 - Symposium
219
Reference
149
148
21
21'
0
Operating m,ne - openc:ut
()
Operat,ng m,no - opencut and underground
•
Operating mmc - underground
111D
Non-o~r•ting mme - opencur and
underground
Non -operdtmg m,nc • unrlergroun<f
□ Re,ds Dome b«Js 81,,, Ath<JI Coal Measures, Collmsv,lle ~ Coal Measures
N1wt1
M0<anbah Coal Mct1sures. G~man Creel.
~ FornvtlOf'J
1Yngal Ccul Measures, 81,,1,r,a Coal
■ Measure~. 811nd,1f'lnll For~t,on 0
50 luk>mclrH
150•
22 ·
22'
B11i1Athol~ Clerm~i 23•
OakyC
0
k
\~\~arrabtt
CurraghrQ
•Bluff
ackwlterO altichhlrdt
)•Cook South Blackwater 24'
Springsure
24'
J)
\
■ B i loela
t>Moura 'l(j anga ilC
25•
25 '
■ Cracow
BASIN
SURAT
150•
148"
Figure 1. Map showing the extent of coal-bearing formations in the Bowen Basin and the location of past and present coal mines.
kinematic indicators. Detailed measurements of the strike, dip and intensity of jointing in overburden strata were also taken, along with sedimentologi cal descriptions and related pafaeo-curren t data,
Additional cleat directions for deep-level Rangal Coal Measure coals, as determined from remnant magnetism data for selected MIM Holdings Ltd coalbed methane drillholes in ATP 564P, are
Bowen Basin 1995 - Symposium
220
coal cleats found within a bright coal lithotype (90- 100% bright bands) are assumed to extend the full vertical thickness of the lithotype and are weighted accordingly with a value of one (1.0). However, bright coal bands represent only 50% of inter-banded lithotypes and, consequently, coal cleats restricted to these bright bands can be assumed to extend only half the vertical thickness of the lithotype. Hence, a lithotype weighting factor of 0.5 . TABLE 1. LITHOTYPE WEIGHTING FACTORS APPLIED TO THE COAL CORE. Lithotype
% Bright
Weight Factor
Bright Coal Bright-banded Inter-banded Dull-banded Dull minor Dull Dull stony Sapropelic
90-100 60-90 40-60 10-40 5-10 0-5 0-5 0-5
1.0 0.75 0.5 0.25 0.1 0.05 0.05 0.05
The formula applied to the fracture data for any given coal seam was as follows.
~ (Lh X Lw) X lOOO
Fs CFI = -...,_ _ _ _...,__-H L..,
LLh
Figure 2. Map showin& the major structural elements of the Bowen Basm.
included for comparative purposes and are used with the kind permission of Conoco Australia Pty Ltd. Core Fracture Analysis The core fracture data included in this study relate entirely to the Rangal Coal Measures and were gathered by MIM Holdings Ltd during drilling in the Banana-Mour a-Theodore and Blackwater-So uth Blackwater areas of ATP 564P. Coal cores derived from this program were described at the lithotype scale with the fracture type, intensity, form and any infilling mineralisation recorded on standardised data entry sheets. All the detailed coal core logging included in this study was undertaken by Garry Leblang of Garry Leblang and Associates. Coal Fracture Indices The methodology adopted for determining a generic fracture index for coal essentially entailed the calculation of a total fracture length per square metre area and was based on the product of vertical fracture height and fracture.intens ity (i.e. the number of fractures per metre). For the purposes of this study, horizontal shear zones, fractures and partings were not included in the study. Vertical fracture height was determined from lithotype thickness data and subsequently weighted according to the percentage of bright bands within the host fithotype (Table 1). This weighting was undertaken to counteract the universally noted confinement of coal cleats to the bright layers within the various coal lithotypes. For example,
where Lh = lithotype thickness (m), Lw = lithotype weighting factor and Fs = measured fracture spacing (mm). The coal fracture index was first calculated at the lithotype scale for each of the fracture groups (face cleats, butt cleats and other fractures) and subsequently summed over the entire seam and averaged to produce a relative face , butt and other fracture index. To further refine the data, the coal fracture index formula was applied to fractures infilled with clay and/ or carbonates for each of the fracture groups, thereby allowing the effects of mineralisation to be removed from the analysis (e.g . Face CFI - Face Clay-filled CFI - Face Carbonate-fill ed CFI = Unmineralised Face CFI). This unmineralised CFI is taken to represent the natural fractures that are available as permeable pathways for fluids and gas, and assumes that all mineralised fractures have no porosity or permeability.
COAL FRACTURE SYSTEMS The natural fractures found in coals examined during the field study fall readily into four distinct classes, which in descending order of magnitude are (1) faults and shear zones, (2) extension and compression-r elated joint sets, (3) mining-induc ed fractures, and (4) coal cleat (Figure 3). Although fractures induced by mining will not be considered here, it is important to note that drilling, blasting, and the de-stressing effects associated with overburden (open-cut) or coal removal (underground ) can produce fracture
Bowen Basin 1995 - Symposium
221
to encompass the vertical extent of the seam (Tremain & others, 1991).
Lithotypes
Figure 3. Illustration of the relationship between the four types of fractures recognised in exposures of Bowen Basin coals: faults and shear zones, extension- and compression-relate d joints, mining-induced fractures, and coal cleats.
systems that can be either misinterpreted as part of the natural fracture system or effectively overprint the pre-existing network (e.g. Hanes & Shepherd, 1981). Consequently, every attempt was made to isolate and exclude from the analysis any fractures associated with blasting and those mirroring surrounding workings. Of the three remaining classes, only the joint and cleat sets require further definition here. The complex nature of fracturing in the coals examined made this a particularly difficult task, and ultimately involved revisiting mine-sites to clarify interpretations that developed as our experience grew. Nonetheless, consistent observations were identified that did not conform with conventional descriptions reported in the literature. This may in large be due to the relative preponderance of literature related to cleating in Laurasian coals, as opposed to Gondwana coafs, and ultimately to compositional differences between the two. As such, the definitions provided should be regarded as bein~ specific to the Permian coals of eastern Austraha. Cleats in Coal
The use of the word cleat as a mining term dates back to the late 19th Century (Kendall & Briggs, 1933) and has since been adopted by miners, geologists and engineers to describe a variety of fractures commonly found in coal. Most writers regard cleats in coal as equivalents to joints in elastic rock (e.g. Ver Steeg, 1942; Ramano & Moiz, 1968; McCulloch & others, 1974a; Diamond & others, 1976; McCulloch & others, 1976; Grout, 1981; Ward & others, 1984; Spears & Caswell, 1986; Condon, 1988), or as closely spaced, pervasive fractures (Heidecker, 1979; Laubach & others, 1991) that originated by imperceptible movement associated with Mode 1 extensional opening (Close, 1991, Close & Mavor, 1991, Tremain & others, 1991). Consequently, cleats in coal have been variously described as being restricted to individual coal bands, or in some mine exposures,
The more generalised definition can be misleading, especially when applied to the Permian coals examined during the present study. Of all the observed patterns to emerge from our work the most consistent relates to the vertical extent of cleat development. In all cases, cleating was found to be well developed within bright coal bands, but was rarely well-developed in dull bands. Such a tendency has been noted previously by numerous investigators (e.g. Ting, 1977; Hucka, 1989; Law, 1991, 1993; Tremain & others, 1991; Close & Mavor, 1991; Close, 1991; Mavor & others, 1991), and is regarded here as of fundamental significance. It was also noted that cleats rarely crossed lithotype boundaries, unless they were linked through the duller lithotypes by through-going fractures. As vertically-extensiv e fracture sets were not universally developed, and where they existed only linked a small percentage of available cleats, this suggested both a genetic and temporal difference between these two fracture systems (i.e. lithotype controlled and vertically unrestricted fractures). For the purposes of this study, a cleat is defined as an extensional fracture occurring within coal that is confined to a particular lithotype or microlithotype. This definition may not be universally applicable, but it is interesting to note that lithotype-controlle d cleat height has also been described for coals of the Uinta (Bunnell, 1987; Hucka, 1989, 1991) and Raton (Close, 1988) Basins in the USA. Joints in Coal
Given that cleats are defined here as being lithotype-bound, then the definition of a joint in coal refers to any other extensional fracture that is confined to, or transects a coal seam. Although the definition of a joint automatically assumes an extensional origin, no specific contemporaneous tectonic stress regime or structural mechanism is implied in the term. The coal joints noted during this study generally extended vertically through only a small number of lithotypes, but in some cases extended throughout the entire seam, this being especially notable in mine exposures of German Creek coals. This latter type of joint has been documented elsewhere, where they are often referred to as master cleats (Henkle & others, 1978; Laubach & others, 1991). However, based on our field observations, it is likely that these seam-height joints represent late-stage tensile fractures associated with unloading and de-stressing, and would not be present at any great del'th. Primary evidence for this is the lack of any visible infilling mineralisation associated with these major fractures, even when minerals are evident within the cleat system, and the noted lack of vertically-extensiv e fractures found in coal cores derived from depths >300m. Although not entirely conclusive, it does agree with the interpretation forwarded by Tremain & others (1991) that so-called 'cleats' found in some immature Tertiary coals in the USA are nothing more than recently developed joints.
Bowen Basin 1995 - Symposium
222
The further distinction between differing generations of joints, and perhaps differing modes of formation, could be important to our understanding of the structural history of a coal seam, and hence its potential permeability to fluids and gas. However, in situations where seam-height joints existed, the intensity of fracturing commonly made the identification of any original macroscopic fabric impossible. As a consequence, no attempt has been made here to distinguish between the differing hierarchies of coal joints.
B
A
Mineralisation in Cleats and Joints Cleats examined were typically filled by one or more mineral species, while joints in coal and elastic rocks showed more erratic mineralisation. Cleats within coals of the German Creek Coal Measures were noticeably less mineralised than counterparts in the Rangal Coal Measures, where the presence of reddish-brown clays was noted at all exposures throughout the southern and central Bowen Basin. Within these latter coals, clays were ubiquitous in face cleats, whereas they were only occasionally found in butt cleats, with illite and kaolinite the dominant phases. Butt cleats and joints, on the other hand, were dominated by calcite and other carbonate minerals. In all cases noted, carbonates were clearly formed after the clay minerals and occupied the centres of cleat and joint apertures.
SUPERIMPOSED 'A' SETS
FRACTURE GEOMETRIES Cleats As described elsewhere, cleats in coal generally form an orthogonal set of fractures that are essentially perpendicular to bedding surfaces. These cleat sets are well developed and continuous in bright coal bands and poorly developed and discontinuous in the dull bands. For historical reasons the predominant or primary cleat is referred to as the face cleat, and the secondary or end cleat known as the butt cleat. In plan view, face cleat geometries typically range from linear to curvifinear and form parallel to sub-parallel sets that can be continuous beyond the open-cut pit scale (~SOm). Butt cleats generally form parallel sets that are aligned normal to the face cleats. However, there are many exceptions to this idealised geometry. In some areas the face and butt cleat are largely indistinguishable or similar in appearance , whereas in other areas the cleat pattern is chaotic or resembles that of polygonal shrinkage cracks (Figure 4). Four general classes of cleat geometries were identified during the course of this study; Class A - orthogonal sets, B - sinusoidal sets, C polygonal sets, and D - chaotic arrangements (Figure 4). The distinction between these classes was sometimes complicated by the presence of a second or superimposed cleat set (Figure 4), and geometries with some elements of classes A, B and C were also observed. Nonetheless, of the cleat geometries described, the only one obviously structurally-related is the chaotic class which can be directly linked to the proximity of in-seam
Figure 4. Illustration of the four geometric classes of cleat recognised in Bowen Basin coals: A) orthogonal sets, B) sinusoidal sets, C) polygonal sets, and D) chaotic arrangements. Additionally, type A cleats were found locally in superimposed sets indicating overprinting.
shearin$. It is difficult to estimate the relative proportions of each class, due primarily to limited plan exposure, but it appears that classes A and B predominate, even within seams affected by shearing. Polygonal cleats were noted in areas where no other cleat was evident, a relationship also noted by Tremain & others (1991) within some U.S. coals. Such cleat development was particularly evident in the dull coals. The superimposed cleat sets were largely recognised only in situations where their orientation differed significantly from previous generations, although a difference in the presence or composition of infilling minerals was commonly evident. Both face and butt cleat spacings for class A and B geometries ranged from 1mm-100mm, dependent upon the host lithotype, with 1-lOmm being typical in bright lithotypes and 5-20mm in duller bands. In the vertical dimension both cleat sets generally occurred as linear fractures occurring perpendicular to bedding. However, some cleats
Bowen Basin 1995 - Symposium
223
were noted that curved toward the horizontal plane, especially in close proximity to shear horizons. No systematic attern in spacing was evident for the polygona class of cleat geometries, but of the examples recorded the diameter of individual polygons rarely exceeded 50mm.
f
Joints
The coal joints defined in this study extended over greater vertical distances than the cleats but were significantly less frequent, especially in cored coal samples. These joints in many cases occurred as roughly orthogonal sets that conformed with the pre-existing cleat fabric, dipping at high angles to the bedding. However, this was not always the case and joint sets dipping at low to moderate angles to bedding were noted in several localities. These obliquely-dipping joints were particularly evident in highly faulted areas (e.g. Cook Colliery), where the joints were aligned parallel to the east-northeast dip of the numerous reverse and thrust faults that cut the coal seam. The coal joints commonly found in minesite exposures appear to occur at regular intervals ranging from <10cm to >100cm. In some cases the joints found in coal were aligned parallel to joints in the overburden strata, whereas in others no clear relationship existed. It was also noticeable that joints within a given coal seam rarely extended any great distance into the immediate overburden strata. Joints in elastic overburden and interburden strata were generally more variable in both orientation and distribution than their coal counterparts. Joints were best developed in sandstones, where as many as three sets were common, and within close proximity to faults. It was generally found that one of the joint sets was aligned roughly parallel to either the face or butt cleat direction m adjacent coal, although significant departures did occur.
REGIONAL TRENDS Fracture orientation data collected at regular intervals along exposed highwalls and in underground headings were combined for the various study sites and compared in order to assess regional patterns. Data for different formations were treated separately, and where possible, the data for individual seams within a given formation were combined independently. On a regional scale, face and butt cleats were found to consistently align parallel with structural dip and strike respectively. This pattern prevailed in the German-Oaky Creek (Figure 5), South Blackwater-Cook (Figure 6), and Moura (Figure 7) areas, even where gross strike variations occur. In relatively undisturbed areas, the orientation of face and butt cleats remained constant from seam to seam within a single formation, and even between different coal measure sequences exposed in the same area (Figure 5). The determination of cleat directions for coal core from the Moura area also indicates that face and butt cleat trends remain fairly constant at depth over a large area.
This general regional consistency is significant in that likely cleat orientations at depth could be predicted from outcrop patterns or from stratigraphically higher seams in the same sequence. However, caution must be exercised as variations in general cleat orientations were found to exist at both the regional and local scales, particularly in areas adjacent to faults or where in-seam shearing is severe. The best examples of such regional variations occurred in the north of the German Creek Mine, where faulting is intense (Figure 5), and in the Moura area, where cleat orientations are markedly different in proximity to a major northeast-trending basement structure that has been subsequently overprinted by thrust faults (Figure 7). Regionally consistent joint orientations in both coal and elastic rocks were less evident, but some consistency was apparent over distances in the range lkm-lOkm. Cleats recognised as being remnant sets, based on the presence of infilling minerals, were somewhat variable from site to site, although a general north-south and east-west trend was evident in the data (Figure 6).
RELATIONSHIP TO STRUCTURE Cleat orientations were found to vary most commonly in proximity to fault zones. In these zones, either the cleat set which was closest to the fault orientation tended to be best developed, regardless of whether it was the locally consistent face or butt, or each cleat set exhibited a bimodal orientation (Figure 8). In some intensely faulted areas the face and butt cleat sets were interchangeable on a metre by metre scale. A further noticeable trend associated with some normal faults was the tendency for cleat orientations to show a progressive rotation into the plane of the fault, becoming[arallel and perpendicular to the expose fault trace. In cases where this was evident it strongly implies that either the faults existed prior to cleat formation or that both formed contemporaneousl y. Within coal seams affected by intense in-seam shearin~ a gradual or abrupt variation in cleat orientations was also noted to occur vertically through the seam (Figure 9). This was particularly evident in the German-Oaky Creek area and is largely responsible for the complex face and butt cleat patterns seen in the composite rose diagrams in Figure 5. As chaotic cleat sets are also more evident in coals affected by shearing, it is apparent that significant crushing and rotation accompanied shortening of the coal measure sequence. The implication of this finding is that although the generation of crushed zones associated with shearing could provide ideal avenues for fluid and gas flow, it is also likely that the overall vertical connectivity of the seam is adversely affected. Less significant variations in cleat orientations and frequency were also noted across major fades changes m overlying elastic strata. Cleat spacings were generally found to show similar lateral consistency to orientation, with similar degrees of variation adjacent to zones of
Bowen Basin 1995 - Symposium
224
TRUE NORTH
MAGNETIC
Rangal CM's
NORTH
German Ck East
A - Aquila seam G - German Ck seam T - Tieri seam
0 I
KM
50 I
Face Cleat
Butt Cleat
Coal Jo ints
Rock Joints
Figure 5. Map showing regional cleat and joint orientations in the German Creek - Oaky Creek area of the Bowen Basin. Note tlie general consistenc7 in cleat orientations between seams of the German Creek Formation and the similarity with coals o the Rangal Coal Measures (German Creek East).
Bowen Basin 1995 - Symposium
225
TRUE NORTH
■
MAGNETIC NORTH
Blackwater
0
Km
10
Rangal CM's
Face Cleat
Butt Cleat
Coal Joints
Rock Joints
Remnant Cleats
ffiSth
ffi-----i-.-1--
E8ffi@@
Figure 6. Map showing regional cleat and joint orientations in the Blackwater area of the Bowen Basin. Note the common presence of remnant cleat sets in the region.
Bowen Basin 1995 - Symposium
226
TRUE NORTH
MAGNETIC
NORTH
ffiEB/ ~~---- ---~~
Moura ■
E8EB-------€BEB~ EB~ ~ EBEB ffiE8 ~6i)
Km
10
Rock Joints
Rangal CM's
ffiEB Face Cleat
o
■
Theodore
Butt Cleat
Measured in outcrop
Measured in core
L Thrust \
Fault
Figure 7. Map showing regional cleat orientations in the Moura -Theodore area of the Bowen Basin, as measured in both outcrop and from core samples derived from depths >300m. Note that measurements in outcrop include data from Bassett (1984) and Miller (1992).
Bowen Basin 1995 - Symposium
227
FACE CLEAT
BUTT CLEAT
I
MAGNETIC NORTH
TRUE NORTH
.J .J <(
~
0 :-
J: C)
J:
METRES
I I 50
JOINTS ~ IN COAL
50
0
100
o: I
I
o· ffi 0--- 0; Rangal Coal Measure outcrop
o: o· I
......-
i\)(\ ' \ SEE LARGED MAP
1
I
•~
Faults
Figure 8. Map showing the orientation of cleats and coal joints in the Argo seam exposed in Ramp 14 North, South Blackwater Mine. Note the bimodal orientation of cleats adjacent to the northerly of the two normal fault intersected by the highwall, and the rotation of cleats into this fault.
structural disturbance. Cleat frequency was not typically found to increase near fault zones, although the incidence of pervasive fractures (joints) within coal seams and overburden strata did (Figure 10). As noted previously, cleat frequency also varied systematically with lithotype, the bighest frequency being associated with vitrain layers. Joints in overburden strata tended to show
more complex patterns than those shown by cleats. However, in areas of faulting joints through both coal and overburden were often aligned with and perpendicular to the fault trend, ana showed a good match to cleat directions. The regional consistency in cleat orientations and relationships with strike and dip trends evident
Bowen Basin 1995 - Symposium
228
Face
Butt
million years of surface peat accumulation. In the present study, detailed structural observations are combined with direct mineralogical and geochemical evidence for the timing of cleat formation (Faraj & others, 1995), allowing a more precise and detailed interpretation to be made.
GERMAN CREEK SEAM 3.0M THICK
Figure 9. Cleat orientations in a vertical section of the German Creek seam affected by in-seam shearing at the German Creek Mine.
within the Permian coal measures of the Bowen Basin has also been noted in various other parts of the world (Close, 1993). Cleat orientations that progressively curve into the plane of normal faults (i.e. face perpendicular to fault) have been reported from the USA (Laubach & others, 1991), as has the tendency for fault trends to be superimposed onto cleat patterns (Tremain & others, 1991). The data set summarised in this paper, however, combining regional-scale information with detailed observations on a much finer scale, allows an understandin~ of the controls on cleat formation and characteristics which has hitherto been unavailable for most coal-bearing basins. This theme is now developed in the following section.
CLEAT FORMATION Theories proposed to explain the formation of cleats in coal have been categorised by Close (1993) into three groups: endogenetic - involving soft-sediment deformation processes such as differential compaction and shrinkage during coalification, exogenetic - related to tectonic stresses imposed during burial and/or uplift, and duogenetic - involving some combination of the preceding. Various authors have pointed to the regional consistency in cleat orientation and relationship with dip and strike as evidence of a tectonic origin. Close (1991) and Close & Mavor (1991) surmised from structural and other data that cleat formation in Cretaceous coals of the San Juan and Raton Basins (USA) occurred during burial and prior to folding of the strata, and occurred within a few
In a similar manner to Close (1991), we interpret the perpendicular nature of cleats with respect to bedding in Bowen Basin coals as evidence that cleats were formed prior to folding. Equally, the parallelism with strike trends suggests a relationship with the burial process, as discussed above, while modifications to the regional pattern suggest that cleats were modified by pre-existing structures or in some cases overprinted by later structural events. The generally recognised orthogonal geometry of cleats strongly indicate that they formed by brittle failure of lithified material. Consequently, the evidence suggests that the majority of cleats are of tectonic origin and formed under the influence of a re~ional stress pattern. However, as cleat geometries can be variable, it is likely that their orientation was controlled to some degree by local stress fields, with the generation of Class A, B and C sets reflecting differing degrees of stress anisotropy. As recognised during previous studies, butt cleats were always confined between face cleats, which has in the past been used as evidence to suggest that face cleats were the first to form. However, the presence of polygonal cleat geometries and the similar mineral assemblages infilling face and some butt cleats, suggests that the two cleat sets may have formed contemporaneously or butt cleat initiation closely followed face cleat generation. Given the common directional divergence between cleat sets and other fracture sets within the coal, it can be further concluded that coal joints formed separately to cleats, even though the initial cleat anisotropy obviously influenced later generations of fractures. Some of these coal joints are clearly related to local compressional structures, whereas others have orientations that mimic joint sets in overlying elastic rocks, suggesting they formed as a result of unloading and de-stressing. The Late Permian coal measures of the Bowen Basin accumulated immediately prior to, and during a period of flexural loading and progressive contractional deformation. The west-south-westward advance of thrust sheets into the eastern part of the basin simultaneously led to the release of vast quantities of sediment into the basin which initiated flexural subsidence and the rapid burial of sediment. The orientation of the thrust vector (and facies patterns evident in outcrop) imply that the contractional deformation affected the northern part of the basin earlier than the southern part, and the relative intensity of compression indicates that shortening was more severe in the north. The foreland phase of the Bowen Basin began around 255Ma, and the youngest strata preserved were formed around 235Ma at about the time of maximum burial (Baker & Caritat, 1992). The climax of compression (Hunter-Bowen Orogeny) and uplift of the Bowen Basin succession occurred between 235 and 230Ma, by which time it is argued
Bowen Basin 1995 - Symposium
I'
...
9CAU
CLEAT ORIENTATION AND DENSITY MAP A4, TALAGA! PIT SOUTHEASTERN HIGHWALL TRAVERSE
FACE CLEAT
G7 ~ ~
~
'C[.J
~FACE CLEAT
~BUTT ~CLEAT
0 Yl(f! I
!1 TRUE NORTH
\
,
!
MAGNETIC NORTH
CJ')
'< 9 "l'j
0
...s::
fll
9
-
REFERENCE COAL CLEAT ORIENTATIONS BUTT CLEAT
FACE CLEAT
1----i VITIWN --DURAJN
SECONDARY COAL FRACTURES -
~
JOINT SHEAR1NG ALONG JOINT
JOINTS IN OVERBURDEN (SANDSTONE) (SHALE) JOINT ..______, SHEARING ALONG JOINT
CLEAT FREQUENCY SCALE
10
SCALE 0
10metree
-
- - - - - - - < >3 d•1elcm 2-3dNle/Cffl 1------1 c2ct.ta/Cffl
Figure 10. Map showing cleat and joint data gathered from dose-spaced stations in the Talagai Pit (A4), Oaky Creek Mine. Note the ihcrease in coal joints toward the fault which intersects tlie highwall at 108m. .
230
cleat sets had been formed. The modification of cleat patterns around thrust and other faults of proba\)le Hunter-Bowen origin implies that cleats formed in a stress environment locally modified by these structures. Radiometric dates from illites filling face cleats (the earliest phase of cleat mineralisation recognised) cluster around 245-240Ma and 225-220Ma (Faraj & others, in press), indicating that the cleats had formed by 245Ma. According to subsidence analysis, the German Creek and Rangal Coal Measures would have been buried to approximately 1000m and 300m, respectively, by this time, and would have been under the influence of a west-south-westerly orientated compressive stress regime. The period 245-240Ma was also evidently a time of significant intrusive and hydrothermal activity along the eastern margin of the southern Bowen Basin, as evidenced by radiometric dates from granites and alteration systems associated with precious and base metal mineralisation. All evidence cited points toward cleat formation during the Permo-Triassic burial event which preceded uplift and deformation of the succession. Face cleats, which were aligned parallel with the axis of principal compressive stress and hence dilational, were mineralised early while butt cleats remained predominantly closed. The second period of illite formation in face cleats corresponds to a post-deformation period of crustal extension and high heat flow during the Late Triassic. This was foflowed by carbonate-dominated mineralisation which infiltrated face, butt and other fracture systems within the coal. The age of this mineralising event is poorly constrained, but may correspond with an Early to mid Cretaceous period of magmatic and structural activity within the Bowen Basin and partially overlying Great Artesian Basin.
COAL FRACTURING AND RESERVOIR PERMEABILITY It has long been recognised that coal seam permeabifity is one of the primary factors governing the commercial viability of coalbed methane extraction. An understanding of the factors controlling the permeability of coals is therefore essential in both an exploration and resource evaluation sense. The permeability of a coal seam is influenced not only by the prevailing stress conditions, but also by the nature, intensity, and openness of the fracture network occurring naturally within the coal (e.g see Durucan & Edwards, 1985). As this relationship is poorly understood, especially in relation to in situ conditions, the following discussion should be regarded as a starting point from which more detailed analyses can be undertaken in the future. In an attempt to assess the relationship between permeability and the fracture network inherent to a given coal seam, the CFI for face cleat, butt cleat, 'other' fractures, and combined total fractures for
each seam were plotted against depth for selected MIM Holdings Ltd coalbed methane exploration wells (Figure 11). In the example shown, a positive linear relationship between permeability and relative fracture intensity was evident. However, such a relationship was not always apparent for many of the other wells examined. The CFI data for all the wells studied were subsequently plotted against in situ permeability data in order to assess possible relationships. The underlying trends evident in most of these plots was best shown by the relationship between total fracture and total unmineralised fracture indices and measured permeability (Figure 12), where potentially more than one overall positive relationship can be discerned . Although the evident scatter could be due to a number of factors, the present-day in situ stress condition is believed to be the primary controlling factor. The influence of local horizontal stress conditions on the reservoir permeability of coals from the southern Bowen Basin was first recognised by Enever & others (1994), who demonstrated that a close relationship existed between the measured in situ minimum stress in coal and the results of injection/ fall-off testing (Figure 13). However, as significant deviations from a truly linear relationship did exist, coal fracture indices have been employed to establish whether inherent fracturing could explain these noted departures. Quite clearly, the relationship between fracturing and permeability is complex, and one that cannot be understood without first isolating the effects of present day stress conditions. This was achieved by plotting the various fracture indices against permeability for those seams where in-seam stress data was available, and each data point allocated its respective stress value. However, due to the limited number of data points, the in-seam stress data was subsequently divided into three recognisable classes (Figure 13) and the generalised stress condition for each data point allocated accordingly. The resulting coal fracture versus permeability plot shown in Figure 14 indicates that at a given value of stress, or within a range of stress values, measured permeability tends to increase as a function of the un-mineralised fracture index. That is, the greater the intensity of un-mineralised fractures present within a given coal seam the greater its measured permeability. Although the model needs substantial refinement, it does indicate that the relative intensity of coal seam fracturing could have an important bearing on reservoir permeability, and that currently used pseudo-porous flow models may not be appropriate when assessing the production potential of a coalbed methane reservoir. It is also likely that the strongly anisotropic stress conditions commonly encountered in the central and southern Bowen Basin dictate to a large extent which fracture group or groups are open and available as permeable pathways. Consequently, it is unlikely that fracture sets in the coal orientated at high angles to the prevailing principal horizontal stress would contribute to reservoir permeability in any significant way. Clearly, orientation of the
Bowen Basin 1995 - Symposium
231
FACE CLEATS
Btrrr CLEATS
OTHER FRACTURES
TOTAL FRACTURES
MINERALISED FRAC., URES
CFI
CFI
CFI
CFI
%
SEAM NO
~
0
5(1
100
150
0
50
IOO
25
150
50 75
0
l(J(J
HJO
200
JOO
25
75
100
k (me.I)
~
(1.07 700
7(1()
700
I
0.12
.a ' i5.
,L 7
SO
I
0. 15
800
800
900
900
800
900
900
900
Figure 11. Coal fracture indices for an MIM Holdings Ltd coalbed methane exploration well in the southern Bowen Basin.
principal horizontal stresses needs to be incorporated into the model so that, dependant on the angle between stress and cleat directions, weighting factors can be applied to these fracture indices. The inclusion of stress orientation data is particularly important in the case of the un-mineralised fracture indices. As noted above, butt cleats found in the Rangal Coal Measures of the central and southern Bowen Basin are often less mineralised than the face cleats. Consequently, in situations where the face cleat are aligned roughly parallel with the principal horizontal stress, the lack of mineralisation in the butt cleat is potentially of minor significance. No compensation for such a variab1e has been included in the derivation of the un-mineralised fracture indices, and some caution must be exercised when assessing the relationship between permeability and the total un-mineralised fracture index of a coal. Nonetheless, this approach does appear to offer some insight into the factors that control reservoir permeability, and upon refinement may be a useful tool in the delineation of economically viable coalbed methane targets.
CONCLUSIONS Coal cleats in the Bowen Basin of eastern Queensland, Australia, are interpreted to have formed by brittle failure of macerals during burial in the Permo-Triassic. Age dates on minerals infilling the cleat system indicate they formed prior to 245Ma, which is <lOMa after surface peat accumulation. Evidence also indicates tnat face and butt cleats either formed contemporaneously, or
butt cleat formation closely followed face cleat generation. Cleat orientations were largely dictated by the prevailing regional stress pattern, with face cleats aligned paralfel to the principal maximum horizontal compressive stress. However, localised influences on the existing stress field, predominantly associated with earlier or contemporaneous faults, modified cleat orientations. These influences resulted in the formation of cleat sets with different geometries, each of which reflects a variable state of stress anisotropy. Subsequent uplift and deformation of the Bowen Basin succession during the Middle to Late Triassic further modified the cleat pattern and initiated additional fracture systems within the coal, many of which parallel contemporaneous thrust-related structures. A second phase of clay mineralisation occurred in the Late Triassic (225-220Ma) and was followed a later phase of extensive carbonate mineralisation, potentially during compression in the Early to mid Cretaceous. It is also possible that an additional cleat set was superimposed on former sets during this compressive regime. More recent uplift and unloading, combined with mining activities, resulted in the form<Jtion of vertically extensive joint systems within coals located at or near the surface. Together, these fracture systems provide a record of the structural history of the Bowen Basin. The relationships established during this study have some predictive value in the exploration for economic coalbed methane targets. The regional parallelism between face cleats and structural dip provide a basis from which to predict cleat orientations in structurally uncomplicated areas. Cleat orientations may also be predicted in zones of
Bowen Basin 1995 - Symposium
232
Total linmioeralised Coal Fracturing vs Perme,ability
Total Coal Fracturing v Permeability 100 100
0
LOW STRESS
0
10
0 0
0
~
.§.
t9
0
,; I :a
..5
~
!.
0 0
0
0
0
:
0 0
0
8 0
0
<P
00
0
0
0. 1
0.00 1 . l - - - 4 - - - - + - - - - + - - - + - - - + - - - - - I 150 125 100 75 50 25
0
I 50
100
50
0
..s
0
0.01
0 0
0.0 1
r. .
:a
0
0
0 I
300
250
.200
350
Un-mineralised Total CFI
Coal Fracture Index (CFI)
Figure 14. Plot showing relationship between un-mineralised total coal fracture index and measured permeability for seams from selected MIM.Holdings Ltd CBM exploration wells southern ana central Bowen Basin.
Total Unmineralised Fracturing v Permeability 100
0
faulting by assessing the nature and orientation of faults and comparing with the detailed case histories presented herein.
0
10 ~
0
,;
I
1E :
0 I
0
l,
Oo
0
0 0
0
81:>
0
0
0
150
100
50
0
0
&
0
00 1
0
0 0
0
0
0
0
00 Oo 0
Oo 0
0
0
0
0 0
0
'o
g o
0
0
0
.§.
:?50
"00
Coal Fracture Index (CFI)
Figure 12. Total coal fracture and un-mineralised total coal fracture indices for selected CBM exploration wells plotted against measured in situ permeability.
MODERATE STRESS
• •
• •• • • •
Q
!.
,;
• ••
:a
:
...
E
0. 1 LOW STRESS
HIGH STRESS
•• • • •
• •
• ••
0.0 1
0.001 4
7
9
10
11
12
13
Minimum Stress in Coal (MPa)
Figure 13. The relationship between in situ minimum stress in coal and measured permeability for selected MIM Holdings Ltd CBM exploration wells in the southern Bowen Basin (after Enever & others, 1994).
It is clear from the data gathered during the present study that previous structural deformation may not in itself improve fracture permeability in Bowen Basin coals. No increase in cleat frequency was noted adjacent to younger faults exposed in the mines, and it was often found that cleat systems were preferentially mineralised in such areas. Equally, crushed zones generated adjacent to in-seam shear zones could provide permeable avenues for fluids and gas, but the overall effect on the seam was the generation of chaotic cleat sets and the disturbance of any vertical fracture continuity. Although the intensity of vertical to sub-vertical joints was greatest near fault zones, the typical spacing was such that they would be unlikely to significantly improve gas flow to well-bore. Vertically extensive joint sets interpreted as forming during recent de-stressing could have a significant impact on coal seam permeability, especially where the average spacing is in the order 2-Scm. However, no such extensive fracture sets have been recorded in coal cores recovered from depths >300m.
100
10
0
10
0
0
14
The presence and distribution of minerals in Bowen Basin coal cleats is also predictable to some deree . Face cleats are characterised by the presence o clays and calcite, whereas butt cleats are generally either filled by calcite or are essentially unmineralised. This information, combined with an understanding of present stress conditions could be utilised to design the most effective stimulation strategy for a given situation. Quite clearly, coal seam permeability to gas is the most significant concern to coalbed methane exploration in the Bowen Basin, and in an attempt to shed light on this topic a coal fracture index was developed and
Bowen Basin 1995 - Symposium
233
results plotted against measured permeability data and in situ stress results. The results of this analysis indicate that for a given stress regime, the intensity of fracturing inherent to a coal seam has a significant impact on measured in situ reservoir permeability. With some refinement, and used in conjunction with measured or predicted stress data, the coal fracture index methodology may prove useful in the future as an exploration tool or aid in the generation of more reliable reservoir models.
ACKNOWLEDGMENTS This project was financially supported by the CSIRO Division of Petroleum Resources, MIM Holdings Ltd, and by CSIRO/University of Queensland and CSIRO/Queensland University of Technology collaborative grants. B. Douglas, S. Edgar, C. Larkin, C. Huddy and Dr J. Esterle assisted in field data collection. Coal Resources of Queensland Pty Ltd, South Blackwater Mines, BHP-Mitsui Moura Mine, Curragh Mining, Oaky Creek Coal, and Capricorn Coal Management are thanked for allowing access to exposures and other data, and in particular mine geologists Keith Rixon, Diane Somer, Paul Cottam, Attila Kovago, Peter Ledger, Eric Dahl, Nick LeFevbre, Russ -Phillips and David Moelle are thanked for their help. The coal fracture index results and permeability data are published with the kind permission of Conoco Australia Pty Ltd. Mrs E. Burdin drafted some of the diagrams, at short notice, and Rod Holcombe provided useful comments on parts of the original draft.
REFERENCES BAKER, J.C. & CARITAT, P. DE, 1992: Postdepositional history of the Permian sequence in the Denison Trough, eastern Australia. American Association of Petroleum Geologists Bulletin, 76, 1224-1249. BASSETT, K.G., 1984: Geological investigations at Moura. In, A.J. Souvan & others, Gas, Coal, Stress and Stability Investigations at Thiess Damrier Mitsui Coal Pty Ltd, Moura, Queensland . Nationa Energy Research, Development and Demonstration l'rogram, End of Grant Report Number 359, Department of Resources and Ifoergy, Canberra, ACT, Australia. BUNNELL, M.D., 1987: Roof geology and coal seam characteristics of the No. 3 Mine, Hardscrabble Canyon, Carbon County, Utah. Utah Geological and Mineral Survey, Special Studies 69. CARITAT, P. DE & BRAUN, J., 1992: Cyclic development of sedimentary basins at convergent plate margins: 1. Structural and tectono-thermal evolution of some Gondwana basins of eastern Australia. Journal of Geodynamics, 16, 241-282. CLOSE, J.C., 1988: Coalbed methane potential of the Raton Basin, Colorado and New Mexico. PhD Thesis, Southern Illinois University at Carbondale. CLOSE, J.C., 1991: Western Cretaceous Coal Seam Project - Natural fractures in bituminous coal gas reservoirs. Gas Research Institute, Chicago, Illinois, Report GRI-91/0337, 1-140.
CLOSE, J.C., 1993: Natural fractures in coal. In, Law, B.E. & Rice, D.D. (Editors) Hydrocarbons from coal. American Association of Petroleum Geologists, Studies in Geology Series, 38, 119-132. CLOSE, J.C. & MAYOR, M.J., 1991: Influence of coal composition and rank on fracture development in Fruitland coalbed natural gas reservoirs of the San Juan Basin. Coalbed methane of western North America conference, Rocky Mountain Association of Geologists, 1-29. CONDON, S.M ., 1988: Joint patterns on the northwest side of the San Juan Basin (Southern Ute Indian Reservation), southwest Colorado. Rocky Mountain Association of Geologists, 61-68. DEAR, J.F., 1994: Major cycles of volcanism in the southern Connors Arch. In, Holcombe, R.J., Stephens, C.J. & Fieldin~, C.R. (Editors): 1994 Field Conference, Capricorn Regton, Central Coast, Queensland. Geological Society of Australia, Queensland Division, Brisbane, 31-45. DIAMOND, W.P., MCCULLOCH, C.M. & BENCH, B.M., 1976: Use of joint and photolinear data for predicting subsurface coal cleat orientation. U.S. Bureau of Mines, Report of Investigation, 8120. DICKENS, J.M. ·& MALONE, E.J., 1973: Geology of the Bowen Basin, Queensland. Bureau of Mineral Resources, Geology & Geophysics, Australia, Bulletin, 130. DURA CAN, S. & EDWARDS, J.S., 1985: The effects of stress and fracturing on permeability of coal. Mining Science and Technology, 3, 205-216. ELLIOTT, L.G., 1993: Post-Carboniferous tectonic evolution of eastern Australia. The APEA Journal, 33, 215-236. ENEVER,J.R., PATTISON, C.l., McWATTERS, R.H. & CLARK, I., 1994: The relationship between in situ stress and reservoir permeability as a component in developing an exploration strategy for coalbed methane in Australia. SPE/ISRM 28048. FALKNER, A.J. & FIELDING, C.R., 1993: Geometrical fades analysis of a mixed-influence deltaic system the Late Permian German Creek Formation, Bowen Basin, Australia. In, Marzo, M. & Puigdefabregas, C. (Editors): Alluvial Sedimentation. International Association of Sedimentologists, Special Publication, 17, 195-209. FARAJ, B.S.M., FIELDING, C.R. & MACKINNON, !.D.R., in press: Cleat mineralisation in the Late Permian coal measures of the southern part of the Bowen Basin, Queensland, Australia. In, Geyer, R. & Harris, I. (Editors): Coalbed Methane and Coal Geology, Special Publication, Geological Society of London. FIELDING, C.R. & McLOUGHLIN, S., 1992: Sedimentology and palynostratigraphy of Permian rocks exposed at Fairburn Dam, central Queensland . Australian Journal of Earth Sciences, 39, 631-649. FIELDING, C.R., FALKNER, A.J. & SCOTT, S.G., 1993: Fluvial response to foreland basin overfilling: the Late Permian Rangal Coal Measures in the Bowen Basin, Queensland, Australia. Sedimentary Geology, 85, 475-497. FIELDING, C.R., HOLCOMBE, R.J. & STEPHENS, C.J., 1994: A critical evaluation of the Grantleigh Trough, east-central Queensland . In, Holcombe, R.J., Stephens, C.J. & Fieldin~, C.R. (Editors): 1994 Field Conference, Capricorn Regton, Central Coastal Queensland. Geological Society of Australia (Queensland Division), Brisbane, 17-30.
Bowen Basin 1995 - Symposium
234
GROUT, M.A., 1981 : Cleats in coalbeds of the southern Piceance Basin, Colorado - Correlation with regional and local fracture sets in associated elastic rocks . Rocky Mountain Association of Geologists Field Conference Guidebook, 35-47. HANES, J. & SHEPHERD, J., 1981 : Mining induced cleavage, cleats and instantaneous outbursts in the Gemini seam at Leichardt Colliery, Blackwater, Queensland. Proceedings of the Australasian Institute of M ining and Metallurgy, 277, 17- 26.
McCULLOCH, C.M., LAMBERT, S.W. & WHITE, J.R., 1976: Determining cleat orientation of deeper coalbeds from overlying coals. U.S . Bureau of Mines, Report of Investigation, 8116 . MAYOR, M.J., CLOSE, J.C. & PRATT, T.J., 1991: Western Cretaceous Coal Seam Project Summary of the Completion Optimisation and Assessment Laboratory (COAL) site. Gas Research Institute, Topical Report No. GRI-91/0377.
HEIDECKER, E.J ., 1979: Photostructural detection of concealed cleat and faults influencing coal mine planning. Proceedings of the Australasian Institute of Mining and Metallurgy, 270, 39-45.
MILLER, D.E., 1992: Geology of the southern Moura Mine and Malakoff Range, southeast Bowen Basin, central Queensland . Honours Thesis, University of Queensland, Brisbane.
HENCKLE, W.R. JR., MUHM, J.R. & DEBUYL, M.H.F., 1978: Cleat orientation in some sub-bituminous coals of the Powder River and Hanna Basins, Wyoming. In, Hodgson, H.E. (Editor): Proceedings of the Second Symposium on the Geology of Rocky Mountain coal - 1977. Colorado Geological Survey, Denver, 129-141.
MURRAY, C.G., FERGUSSON, C.L., FLOOD, P.G., WHITAKER, W.G. & KORSCH, R.J., 1987: Plate tectonic model for the Carboniferous evolution of the New England Fold Belt. Australian Journal of Earth Science, 34, 213-236.
HUCKA, B.P., 1989: Analysis of cleats in Utah coal seams. Utah Geological and Mineral Survey, Open File Report 154. HUCKA, B.P., 1991: Analysis and regional implication of cleat and joint systems in selected coal seams, Carbon, Emery, Sanpete, Seveir and Summit Counties, Utah. Utah Geological and Mineral Survey, Special Study, 74 . JOHN, B.H. & FIELDING, C.R., 1993: Reservoir potential of the Catherine Sandstone, Denison Trough, east-central Queensland . The APEA Journal, 33, 176-187. KENDALL, P.F. & BRIGGS, H., 1933: The formation of rock joints and the cleat of coal. Proceedings of the Royal Society of Edinburgh, 53, 164-187. KIRKEGAARD, A.G., 1974: Structural elements of the northern part of the Tasman Geosyncline. In , Denmead, A .K., Tweedale, G.W. & Wilson, A.F. (Editors): The Tasman Geosyncline - A Symposium. Geological Society of Australia (Queensland Division), Brisbane, 47-62. LAUBACH, S.E., TREMAIN, C.H. & AYERS JR., W.B., 1991: Coal fracture studies: guides for coalbed methane exploration and development. Journal of Coal Quality, 10 (3), 81-88. LAW, B.E., 1991: The relationship between coal rank and cleat density - a preliminary report. American Association of Petroleum Geologists, Bulletin, 75, 1131 (Abstract). LAW, B.E., 1993: The relationship between coal rank and cleat density: implications for the prediction of permeability in coal. 1993 Internatwnal Coalbed Methane Symposium, Birmingham, Alabama, Paper 9341. MARSHALLSEA, S.J., GREEN, P.F., DUDDY, I.R. & GLEADOW, A.J.W ., 1985: The thermal history of the southern Bowen Basin. In, Bowen Basin Coal Symposium, Geological Society of Australia, Abstracts, 17, 237-241.
MURRAY, C.G., 1990: Tectonic evolution and
metallogenesis of the Bowen Basin. In, Bowen Basin Symposium 1990, Proceedings. Geological Society of Australia (Queensland Division), Brisbane, 201-212. RAMANO, R.N. & MOIZ, A.A., 1968: Study of the cleat in north and south Godavari Valley coalfields of Andhra Pradesh . Journal of Mines, Metals and Fuels, India, Calcutta, 16, 154-160. PATTISON, C.I., 1990: Igneous intrusions in the Bowen Basin. MSc Thesis. Queensland University of Technology. PATTISON, C.I ., FIELDING, C.R., McWATTERS, R.H. & HAMILTON, L.H., in press: Nature and origin of fractures in Permian coals from the Bowen Basin, Australia. In, Geyer, R. & Harris, I. (Editors): Coalbed Methane and Coal Geology, Special Publication, Geological Society of London. SPEARS, D.A . & CASWELL, S.A., 1986: Mineral matter in coals: cleat minerals and their origin in some coals from the English Midlands. International Journal of Coal Geology, (6), 107- 125. TING, F.T.C., 1977: Cleating in coals; its origin, spacing, and implications in mining and preparation. Geological Society of America, Abstracts, 9(7), 1201-02. TREMAIN, C.M ., LAUBACH, S.E. & WHITEHEAD, N.H., 1991: Coal fracture (cleat) patterns in Upper Cretaceous Fruitland Formation, San Juan Basin, Colorado and New Mexico: Implications for coalbed methane exploration and development. In, Schwochow, S. (Editor) : Coalbed Methane of Western North America. Rocky Mountain Association of Geologists Field Conference Guidebook, 49-59. VER STEEG, K., 1942: Jointing in the coal beds of Ohio. Economic Geology, 37, 503-509.
McCULLOCH, C.M ., DEUL, M. &JERAN, P.W., 1974a: Cleat in bituminous coalbeds. U.S. Bureau of Mines , Report of Investigation, No. 7910.
WARD, W.E., DRAHOVZAL, J.A. & EVANS, F.E. JR., 1984: Fracture analysis in selected areas of the Warrior coal basin, Alabama Geological Survey, Alabama, Circular, 111.
McCULLOCH, C.M., DEUL, M. & JERAN, P.W., 1974b: Structural control of cleat in bituminous coalbeds. Geological Society of America, Abstract of Programs, 6(7), 862-863.
ZIOLKOWSKI, V. & TAYLOR, R., 1985: Regional structure of the northern Denison Trough. In, Bowen Basin Symposium 1990, Proceedings. Geological Society of Australia (Queensland Division), Brisbane, 129-135.
Bowen Basin 1995 - Symposium
235
Gas sorption dynamics of Bowen Basin
coals
1
2
B Basil Beamish & Peter J Crosdale 1. Geology Department, The University of Auckland 2. Coalseam Gas Research Institute, James Cook University
Many previous gas sorption dynamics studies used either hand-picked vitrains or maceral separates rich in vitrinite. However, Bowen Basin coals are distinctive in their greater abundance of inertinite (Hunt, 1989; Smyth, 1989), particularly in the duller banded coals. Influences of dull and bright bands are poorly understood in terms of mine roadway gas emission and outbursting (Jackson, 1984), and have generally been overshadowed by the inferred relationships with coal rank. Some early workers referred to coal type as a basis of outburstproneness (e.g. Hargraves, 1958), but there appears to be little substantiation of this in Australian experience. Only one example is known to the authors on this aspect of Australian coals (Hunt & Botz, 1986), but the case was very site specific with little supporting data.
Current models of methane flow through coal indicate (i) initially, the adsorbed methane desorbs into the
gaseous phase before (ii) it diffuses through the pore structure of the coal
matrix in response to a concentration gradient until (iii) it reaches a cleat and finally
(iv) achieves free flow through the cleats in response to a pressure gradient (King & Eretkin, 1989a, b; Harpalani & Schraufnagel, 1990a,b). According to this model for coal seams, gas migration is governed by two main factors. First, the diffusion distance for methane depends upon the face and butt cleat spacing, which delineates the matrix block size of the coal. Second, gas flow volume through the cleats depends on their width, length, continuity and permeability. Although this model of methane transport through coal may well apply to predominantly bright coals where the cleats are open and unmineralised, the nature of gas flow through coals in the Bowen Basin is perhaps more complex (Beamish & Gamson, 1993). Similarly, methane release from small coal particles is considered a two stage process. Desorption from the pore internal surfaces is followed by diffusion through the pores. Since methane is physically adsorbed on coal, the time required for desorption is negligible compared to the diffusion step (Ruppel & others, 1972, 1974).
GAS DIFFUSION IN COAL Despite the practical necessity for information about gas diffusion through coal, little work has been done to establish coefficients of gases in coal (Olague & Smith, 1989). Three different techniques have been applied: Flowing gas through a solid coal disc and from the measured pressure drop and flow rate, a diffusion coefficient may be calculated (Thimons & Kissell, 1973; Smith & Williams, 1984a). Using the gas solid chromatography method to measure diffusion parameters for gases in coal (Olague & Smith, 1989). •
After undergoing a step-change in surface concentration, the rate of sorption from small particles is used to determine a diffusion coefficient (Bolt & Innes, 1959; Sevenster, 1959; Bielicki & others, 1972).
The latter technique has been used at CGRI to study Australian coals and the differences created by their banded nature. Spherical Unipore Diffusion Model
Historically, the unipore diffusion model has been applied to coal (Sevenster, 1959; Airey, 1968; Walker Jr & Mahajan, 1978). However, disagreement occurs concerning its applicability over the entire timescale of desorption. It provides the simplest form of comparison of desorption data. The fraction of gas desorbed at any time is given by:
For short time this may be simplified to
_y_=__§__ ✓Det
v_
✓n
The effective diffusivity is estimated from the first 600 seconds of desorption using the simplified form (Smith & Williams, 1984a,b). Bidisperse Pore Diffusion Model
Application of a bidisperse pore model (Ruckenstein & others, 1971) to coal leads to better estimation of long-term desorption trends (Smith & Williams, 1984a, b).The sorption behaviour is
Bowen Basin 1995 - Symposium
236
the parameter Wa, which reflects the ratio of the microsphere and macrosphere uptakes at equilibrium. Very small values of Wa indicate negligible microsphere uptake while larger values show macrosphere uptake is negligible.
modelled by a macrosphere comprised of microspheres. Rigorous mathematical description of the sorption is given by:
DETERMINATION OF DIFFUSION COEFFICIENTS
Vi
v_-
This may be simplified if diffusion by the macropores is very much faster than the micropores or if diffusion is macropore controlled, which may be evaluated from the parameter a. Three cases occur: (i) a<l0-3 - macropore diffusion is much faster than by the micropores, indicating the micropores are rate controlling 3
2
(ii) 10- <a<10 -
both macropore and micropore diffusion are important and
(iii) a> 102 - the macropore diffusion process is the rate limiting step. For a less than about 10-3, the uptake may be considered a two-stage sorption process (Ruckenstein & others, 1971). In this case, macropore diffusion and sorption is much faster than in the micropores and equilibrium is essentially achieved before any appreciable micropore uptake occurs. Initially, only macropore diffusion occurs, followed by a much slower second stage of micropore sorption with macropore sorption at equilibrium. Further information on the relative importance of the microsphere versus the macrosphere is given by
A variety of samples have been selected from the Baralaba, Rangal and Fort Cooper Coal Measures. Rank varies from high to low volatile bituminous. Solid coal blocks approximately 0.8mm in size have been hand-picked from bright and dull coal types and characterised by proximate analysis, pore distribution, petrography and methane sorption properties. Methane desorption testing was carried out using a high pressure microbalance (Beamish & O'Donnell, 1992; Crosdale & Beamish, 1993). Following regassing of the coal samples, desorption to atmosphere was recorded as a weight loss with respect to time. Diffusion coefficients are calculated from the rate data using the models described above. Desorption testing and modelling from two pairs of bright and dull coals indicate the spectrum of results obtained (Figure 1).
APPLICATION OF DIFFUSION MODELS TO BOWEN BASIN COALS Both the unipore and the bidisperse pore models have been applied to a range of coal ranks and types from the Bowen Basin. The uni pore model does not describe the long term desorption for all samples (Figure 1). Coals fitting this model typically have simple pore distributions and are usually mono-maceral bright coals (very high vitrinite percentages), although the model also
.
• ..
0.8
_
-0
a>
-e0 0.6
.
,,. ,,.
.....
.
....../
C:
0
·u 0.4
,,,.
e
11 ·'/
u..
0.2
,,."'
,,,.,,
o Sample 1 - 32.8% vitrinite
/
- ·· Unipore model fit
.,,,,.
~
- - Bidisperse pore model fit •
10
Sample 5 - 99.4% vitrinite
- - Unipore model fit o Sample 5 - 39.4% inertodetrinite -
,.· 0
Sample 1 - 72.9% vitrinite
•··· Bidisperse pore model fit
/
/
,,"'
"' ~
----·
■
•·-·· Unipore model fit
20
30
40
50
60
Square Root of Time (minsA0.5)
Figure 1
Bowen Basin 1995 - Symposium
Unipore model fit
237
applied to a sample high in inertodetrinite. Gas release from sheared coal is also described by this model. Sheared coals typically have very high diffusion rates, related to microstructural rather than petrographic controls. Coals not fitting the unipore model can be described by the bidisperse pore model, especially banded or dull samples with complex pore distributions (Figure 1). Petrographically, these coals contain a variety of maceral types and usually include mixtures of vitr~nites and inertinites. a is usually in the range 10- <a<lO, suggesting both macropore and micropore diffusion process are important. ~ values are typically large (10- 1 <1¥a<l0), indicating negligible macrosphere uptake. These models suggest coal desorption at the working face is complex. Different desorption rates can be expected related to coal type (bright, dull or banded) (Crosdale & Beamish, 1993). Practical application of this has been found at Collinsville where bright (vitrinite-rich) lower portions of the seam have retained higher gas contents than the duller (inertinite-rich) upper parts; the lower parts of the seam have a greater tendency for outbursting (Beamish & Crosdale, 1995).
CONCLUSIONS Methane desorption studies of bright and dull coal types from the Bowen Basin show the simple, unipore model often used to describe gas desorption does not apply in many cases. Complex pore structures associated with mixed petrographic types, especially of dull coals, require more rigorous modelling. The bidisperse pore model may be applied to these samples to describe gas desorption characteristics over extended time frames.
REFERENCES AIREY, E.M., 1968: Gas emission from broken coal. An experimental and theoretical investigation. International Journal of Rock Mechanics and Mining Science, 5, 475-494. BEAMISH, B.B. & CROSDALE, P.J., 1995: The influence of maceral content on the sorption of gases by coal and the association with outbursting. In,: Lama, R.D.(Editor): International Symposium/Workshop on Management and Control of High Gas Emissions and Outbursts in Underground Coal Mines. National Organising Committee of the Symposium, Wollongong, 353-361. BEAMISH, B.B. & GAMSON, P.O., 1993: Volume 2 Laboratory Studies : Sorption Behaviour and Microstructure of Bowen Basin Coals. In, Oldroyd, G.C. (Editor): Final Report ERDC Project 1464 Prediction of Natural Gas Production from Coal Seams. Energy Research Development Corporation, Canberra, 128.
BEAMISH, 8.8. & O'DONNELL, G., 1992: Microbalance applications to sorption testing of coal. Symposium on Coalbed Methane Research and Development in Australia, 19-21 November 1992, Townsville, 4, 31-41. BIELICKI, R.J., PERKINS, J.H. & KISSELL, F.N., 1972: Methane diffusion parameters for sized coal particles. US Bureau of Mines Report of Investigations RI 7697, Washington. BOLT, B.A. & INNES, J.A., 1959: Diffusion of carbon dioxide from coal. Fuel, 38, 333-337. CROSDALE, P. & BEAMISH, B., 1993: Macera! effects on methane sorption by coal. In, Beeston, J.W. (Editor): New Developments in Coal Geology : A Symposium. Coal Geology Group, Geological Society of Australia, Brisbane, 95-98. HARGRAVES, A.J., 1958: Instantaneous outbursts of coal and gas. Proceedings of the Australasian Institute of Mining and Metallurgy, 186, 21-72. HARPALANI, S. & SCHRAUFNAGEL, R.A., 1990a: Measurement of parameters impacting methane recovery from coal seams. International Journal of Mining and Geological Engineering, 8, 369-384. HARPALANI, S. & SCHRAUFNAGEL, R.A., 1990b: Shrinkage of coal matrix with release of gas and its impact on permeability of coal. Fuel, 69, 551-556. HUNT, J.W., 1989: Permian coals of eastern Australia: geological control of petrographic variation. International Journal of Coal Geology, 12, 589-634. HUNT, J.W. & BOTZ, R.W., 1986: Technical note outbursts in Australian coal mines: a petrographic factor. Bulletin and Proceedings of the Austra[asian Institute of Mining and Metallurgy, 291, 59-63. JACKSON, L.J., 1984: Outbursts in coal mines. IEA Coal Research, London. (Report number ICTIS/TR25). KING, G.R. & ERETKIN, T.M., 1989a: A survey of mathematical models related to methane production from coal seams, part 1: Empirical & equilibrium sorption models. Proceedings of the 1989 Coalbed Methane Symposium. The University of Alabama, Tuscaloosa, 125-138, April 17-20, 1989. KING, G.R. & ERETKIN,-T.M., 1989b: A survey of mathematical models related to methane production from coal seams, part II: Non-equilibrium sorption models. Proceedings of the 1989 Coalbed Methane Symposium. The University of Alabama, Tuscaloosa, 139-155, April 17-20, 1989. OLAGUE, N.E. & SMITH, D.M., 1989: Diffusion of gases in American coals. Fuel, 68, 1381-1387. RUCKENSTEIN, E., VAIDY ANATHAN, A.S. & YOUNGQUIST, G.R., 1971: Sorption by solids with bidisperse pore structures. Chemical Engineering Science, 26, 1305-1318. RUPPEL, T.C., GREIN, C.T. & BIENSTOCK, D., 1972: Adsorption of methane/ethane mixtures on dry coal at elevated pressure. Fuel, 51, 297-303. RUPPEL, T.C., GREIN, C.T. & BIENSTOCK, D., 1974: Adsorption of methane on dry coal at elevated pressure. Fuel, 53, 152-162. SEVENSTER, P.G., 1959: Diffusion of gases through coal. Fuel, 38, 403-418.
Bowen Basin 1995 - Symposium
238
SMITH, D.M. & WILLIAMS, F.L., 1984a: Diffusion models for gas production from coal - determination of diffusion parameters. Fuel, 63, 256-261. SMITH, D.M. & WILLIAMS, F.L., 1984b: Diffusion models for gas production models from coals application to methane content determination. Fuel, 63, 251-255 . SMYTH, M., 1989: Organic petrology and elastic depositional environments with special reference to Australian coal basins. International Jou rnal of Coal Geology 12, 634-656 .
WALKER JR, P.L. & MAHAJAN, O.P., 1978: Methane Diffusion in Coals and Chars. In, Karr Jr, C. (Editor): Analytical Methods for Coal and Coal Products. Volume 1, Academic Press, New York, 163-188.
NOTATION De = t = V = Voo =
a ~
THIMONS, E.D. & KISSELL, F.N ., 1973: Diffusion of methane through coal. Fuel, 52, 274-280.
"t
~
= = = =
the effective diffusivity (D/rp2) (cm 2 /sec) time (sec) volume of the desorbed gas total desorbed volume dimensionless rate parameter dimensionless rate parameter dimensionless time sqrt(-s/a)
Bowen Basin 1995 - Symposium
239
Analysis of mining conditions by
integra_tion of hig_~wall mapping and geofogical modelling techniques Nigel Godfrey & John Thrift Garry Leblang and Associates
INTRODUCTION This paper presents the results of the development of a systematic method for the collection, storage, interpretation and integration of highwall mapping data into the mine planning process. The techniques have been developed chiefly at BHPAC's Moura Mine over a period of some 2 years. The work at Moura was targeted at the prediction of downdip roof conditions for planning highwall mining. However, various key geological requirements involved in the open cut planning process are also very ably covered. The method can also make a significant contribution to geological investigations associated with longwall underground mine planning developments adjacent to existing open cuts. The geology within a mine area is a product of both local and regional geological history and the development of an association and interrelationship between lithological and structural conditions over time within this pattern of events. This association can often be used as a predictive tool. In like manner, due to the interrelationship between structural influences within the sedimentary pile, structural conditions in one area may also be used as an indication of the likely occurrence of particular structural conditions elsewhere. However, making these predictions requires a large and detailed body of structural and lithological information. The collection and analysis of such a large data set by traditional highwall mapping methods to a sufficient level of detail is a time consuming and expensive process which few mines have been willing to undertake in the past. Even then, the data collected has been difficult to analyse in a routine and effective manner for incorporation into the mine planning process. The technique outlined herein involves the gathering of large sets of structural and lithological data from exposed mine highwalls using customised CAD software and photographic interpretation of ground photography of the highwalls. The data is used to generate plans
showing the distribution of lithologies and structural defects in the highwall. The data is then processed for incorporation into minesite geological modelling and mine design software.
THREE DIMENSIONAL HIGHWALL MAPPING Geological mapping in 3 dimensions is essential for predictive modelling of downdip roof conditions for highwall/punch and other forms of underground mining. In addition, it is substantially important in the prediction of highwall instability for open cut operations and for the design of the last highwall from which highwall mining is to commence. It is also a serious consideration when blasting optimisation is undertaken and for the prediction of overburden conditions likely to contribute to serious spoil failures. The structural (and other) parameters involved are: DEFECT ORIENTATION, DEFECT SPACING FREQUENCIES, DEFECT INTERSECTION RELATIONSHIPS, DEFECT SURFACE CHARACTERISTICS, •
LITHOFACIES CONFIGURATION AND RELATIONSHIPS, and
•
LITHOLOGICAL CHARACTERISTICS.
Defect structure is primarily associated with the influence of tectonic forces on the sediment pile concerned, but the interrelationship of particular lithofacies styles and characteristics, together with the affects of diagenesis on these lithologies, and, if pertinent, weathering, are important allied considerations. A thorough understanding of pertinent sedimentology, the diagenetic background of the sediments in question, regional and local tectonics and the influence of the weathering process within the area is accordingly most important.
Bowen Basin 1995 - Symposium
240
DEPOSITIONAL ENVIRONMENT
ROCK MASS UNIT DISPOSITION AND RELATIONSHIPS/ PALAEOGEOGRAPHY
SEDIMENTARY HISTORY
DIAGENETIC HISTORY
LITHOFACI ES LITHOLOGICAL CHARACTERISTICS
WEATHERING
STRUCTUR AL CONDITIONS HYDROLOGICAL CONDITIONS POOR U/G ROOF & HIGHWALL STABILITY .__....,.~ CONDITIONS. ORE DIGGABILITY BLAST CONDITIONS
_,,__-----------
Figure 1. Flow diagram of geological interelationships influencing poor mining conditions.
The best opportunity to observe such phenomena within the mine area, is in the highwalls, and these present an ideal opportunity for capturing fundamental geological relationships. Consequently, geological mapping of open cut highwalls should be of prime concern when gathering appropria~e information for prediction of downdip geology. The mapping will show patterns and styles of occurrence of deleterious structural conditions, lithofacies relationships,
then photographed from the ground using high resolution film. Strip mosaics are constructed from these photos and used to continuously map the highwall via photointerpretation onto clear film overlay.
and the style and characteristics of any interaction between the lithology and the structure. These can be used as a guide to both the likely location of poor structural conditions and/or for the prediction of areas worthy of further investigation in cases where poor roof conditions are solely due to the lithology. (See Figure 1, above).
The high wall marker co-ords are read in by customised 3D CAD software routines to construct a model of the highwall outlined as a series of triangular "panels" whose planes are each defined in 3 dimensions. Corresponding marker points are marked on the transparent mapping overlays off the markers shown in the strip mosaic photography. Structural and lithological features are then mapped onto the overlay. This geology is then digitized within the CAD system using these triangular panels as construction surfaces upon which all highwall features are rendered.
3-D MAPPING METHODS The method has evolved using a combination of traditional mapping methods with data acquisition tailored to suit readily available and commonly used software packages. These include both CAD and spreadsheet applications. The procedures used are outlined below. Survey control is provided by markers placed at the top and bottom of the highwall. The highwall is
Separate structural and lithological maps are made. In pit representative field check mapping is undertaken and special note made of any poor roof conditions, and potential highwall failure planes.
Features are thus located within the 3 dimensional planar setting of the particular "panel" area concerned. It is of note that some of the scale change differentials inherent in the stereo overlap strip mosaic photography are obviated via this process.
Bowen Basin 1995 - Symposium
s ERIAL STRIKE DIP No.
(into wall)
FEATURE 01ST WIDTH DIP XYZ TO OIR ANGLE CO-OROS LENGTH ~OOF L/R
298
342
R
83
N,E+RL
20m
30
40
SHAPE MAJOR SURFACE DEFECT WEATH TYPE INFILL ROUGHT 80
53
20
2
30
WATE R
0
HIGHWALL CREST
/
HIGHWALL BATTER
....
LOCATION, ATTITUDE AND ATTRIBUTES APPENDED TO EACH SERIALLY NUMBERED STRUCTURAL FEATURE FROM TABULATED SPREADSHEET. DATA AS
1,0 1,0 (J1
Cll
'<
BOTTOM MARKERS
!3
TABULATED DATA IS ATTACHED TO CENTROID LOCATION AS A DATA BLOCK , USUALLY HIDDEN, IT CAN BE BROUGHT UP WHEN DESIRED TO SHOW ATTRIBUTE CODES, AS
"O 0 {I)
....
s::
!3
SERIES OF TRIANGULAR PANELS CONSTRUCTED BETWEEN SURVEY CONTROL MARKER CO-OROS DESCRIBE ARTIFICIAL, 3 DIMENSIONAL PLANE SURFACES WHICH APPROXIMATE THE HIGHWALL PLANE.
296 ATTITUDE 220L87 XYZ CO-OROS 65-0IST TO ROOF 20-WIDTH 90-SHAPE 15-INFILL 40-SURFACE ROUGHNESS 1 -DEFECT TYPE 10-WEATHERING 1 -WATER
Figure 2. Highwall survey control markers, 3D CAD highwall plan construction and structural feature location and attribute notation.
242
DIP SYMBOL FOR DEFECT VI TH 10· DIP (NEAR HORIZONTAL)
/EACH DffECT LINE HAS SERIAL No NEAR ORIGIN POINT l)o.
~ -
DIP SYMBOL - GIVES DIRECTION TD EITHER SIDE OF STRIKE SYMBOL SYMBOL LENGTH INDICATES ( / DIP ANGLE. (HERE - ss·) DEFECT IS REPRESENTED AS A LINE-AT DESIGNATED LENGTH FOR SCALE CONCERNlDIN AZIMUTH DIRECTION INTO VAL_ FROM JO CENTROID I □ CATION ORIGIN ___ --
DIP SYMBOL FOR_ / 86• DIP (NEAR
------
I
--~=-~-=-~~~~-J
\_...6~~~,f,:L_~-
----
H!GHVALL 1 OP
Figure 3. Highwall plan view dip and strike symbol representatio n.
Whilst this process is not strictly accurate in terms of the 3 dimensional location of features, relative spatial relationships are maintained. The method has proven entirely adequate for the mapping of the following: DEFECT TYPES AND CHARACTERISTICS, •
PATTERNS OF OCCURRENCE OF STRUCTURAL FEATURES, RELATIVE SPACINGS OF STRUCTURAL FEATURES, PLANAR ATTITUDE OF FEATURES,.
•
FREQUENCY OF OCCURRENCE,
•
INTERSECTION RELATIONSHIPS, and
•
LITHOFACIES BOUNDARIES AND TYPES.
Each defect feature is serially numbered and, at its centroid location as projected onto the 'panel', and digitized as a point located in 3 dimensions on the plane of the 'panel' (e.g. given xyz co-ordinates) (Figure 2) . Coded surface and other characteristics, along with centroid location, planar attitude, length and distance to coal roof of the feature concerned, are tabulated during the mapping phase. These are transferred into a spreadsheet and input into the 30 CAD system such that the characteristics are recorded as "attributes" opposite the serial numbers of their respective features. Each feature is in turn positioned in 3 dimensions on its highwall panel area plane via its centroid co-ords, planar attitude and designated length (Figure 2).
In addition, the customised 30 CAD system enables the number coded attributes of each feature to be displayed in a list, at their locations adjacent to the lines depicting the strike traces of the features on the map, alongside the respective serial numbers (Figure 2). Features are shown on plan view maps at their tabulated lengths at the map scale concerned, as a line in the azimuth direction into the highwall. Dip symbols are shown coming off this line at a length proportionate to their dip angle (Figure 3). It should be noted that defect lengths mapped are not necessarily definitive in that the outcrop length of a particular feature in the highwall may be less than the actual length of the defect, as it penetrates into the overburden behind the batter and cannot be seen. However, subjective experience has shown that shorter features do not usually penetrate for proportionate ly much greater distances than the lengths shown on the highwall. Longer features may well do so. Hence, the lengths shown are not necessarily the absolute length but a good proportionate guide to the penetrative tendencies of the features concerned. The coded geotechnical attributes relating to the surface characteristics of the features, their width and infill type, distance from coal roof, weathering, water and so on, are in the form of broad groupings selected on the basis of their similarity to systems already operating within the industry for geotechnical logging of core. When these are all analysed for given mine lengths and integrated with length and attitude information they indicate areas of poor structural integrity. The spreadsheet 'data base' can be interrogated to produce 'sub files' which can be input to programmes which generate stereonets and rose
Bowen Basin 1995 - Symposium
243
diagrams. These geological tools present the data in a most effective manner for analysis of particular structural trends and elements. (e.g., subsets of data containing pitward dipping joints). Depending on the complexity of the highwall geology being mapped, a line kilometre of high wall will contain anything from 600 to 1400 structural features. This represents a massive collection of statistically representative data. It is the size of this information collection which enables computer analysis to present reliable indications of trends and predictions and to determine important but subtle indications which would be difficult if not impossible to discern otherwise. Separate lithology and structural maps can be plotted. These can be at any desired scale but are usually presented at 1:500 or 1:1000. Lithology maps are shown as elevation or "wall" views with abbreviated, lettered lithology-type codes and colour infill differentiation of the respective lithofacies units. Numbered codes within lithofacies correspond to further descriptions of the lithologies in note form. These are placed in a box elsewhere on the map. Structural maps are usually plotted in plan view to better display the strike relationships of the defects. Rose and stereonet diagrams are shown along the highwall length opposite the highwall sections concerned - usually at successive 50 or 100m intervals; though any distance can be specified. These diagrams thus represent structural sub-domains selected by the user, as an investigative tool. It should be noted that great flexibility of presentation and style is afforded within the method and maps may be presented in any one of a number of views or combinations thereof. Data can also be transferred as floppy disks for direct input to other PC's or minesite software systems where it may be manipulated in any one of a variety of ways for stand alone presentation or integration with minesite modelling.
INTEGRATION INTO MODELLING DATABASE Lithological data from the highwall mapping system has been imported into the Mincom Minescape system via dxf files dumped from a 3D CAD Model. The lithological data consists of strings identifying the boundaries of all lithofacies units identified. This detailed data can be viewed and analysed on an interactive graphics screen with successive highwalls being viewed in perspective to assess the variation and trend of lithological units. Available drillhole information can also be viewed at the same time to assist in the interpretation of lithological variation .
From visual examination of the highwall and drillhole information composite units are selected based on lithological and/or mechanical properties and these are used to form the basis of seam interburden or overburden models. The roofs and floors of these units are then selected from the highwall mapping data to provide control surfaces used in the generation of overburden/interb urden models. The appropriate interburden flags are also entered into the drillhole database. Structural and defect data collected during the highwall mapping process is accessed via ascii files obtained from the spreadsheet database. The information is processed using a computer program which counts the number of defects within a nominated range of orientations and with attributes occurring within a nominated block size. The method is a moving average technique with both the counting block size and increment being variables. The output from the program is a series of x,y and z strings defining the centroid of the counting block and the number of defects with a nominated range of orientations and attribute data. This information can be readily transferred to geological modelling software to produce plans showing the distribution and frequency of the nominated defect data.
DATA ANALYSIS The structural and defect data obtained from highwall mapping can be readily analysed using stereonets and rose diagrams to identify each particular defect set developed throughout the mine area. At Moura Mine this consisted of an orthogonal joint set whose orientation varies as a function of the strike and dip of the sediments and a north west trending joint which parallels one of the major fault directions in the mine and does not appear to rotate appreciably with changes in strike and dip of the sediments. The frequency and distribution of each individual joint set varies considerably within individual pits throughout the Moura Mine. The distribution and frequency of development of each particular joint set has been analysed by producing contour plans as illustrated in Figure 4. The areas of more intense joint development appear as the darker shading. The particular joint set being contoured is shown in the accompanying stereonet as that trending 330·. Generation of models of interburden/ overburden units has been trialled in a number of areas at Moura Mine. The models generated have generally proved to be satisfactory up to 300m from the highwall face though the degree of detail depends on the number of sequential highwalls available and the density of drillhole data. The lithological models also appear to be able to assist in the evaluation of potential thrust ramp areas which
Bowen Basin 1995 - Symposium
244
r
'J"9llDD - - - , - - - - - - , - - - - - - - , - - - - - . - - ,n.~11,0--,
N
w
0
E.
s
7Z152l00-~---~--~---~-7Zl:ZlOO_J
Figure 4. Joint Frequency and Development.
tend to be associated with rock mass units o f contrasting competency.
UTILISATION OF HIGHWALL MAPPING DATA The lithological and structural data obtained from highwall mapping can be incorporated into minesite geological modelling and mine planning computer software to assist in the mine planning process in a number of areas which are briefly outlined below.
Highwall Stability
Highwall failure mechanisms can be analysed using a combination of the lithological and structural data obtained from highwall mapping. The method allows weak sediment layers in the highwall to be identified together with potentially hazardous bedding orientations. Statistical analysis of defect orientations using stereonets, and the spatial definition of specific defects and their frequency of occurrence assists the development of design criteria in overcoming potential stability problems, particularly with final highwalls associated with highwall mining developments.
Drill and Blast
Overburden /interburden models can be interrogated to determine the distribution of lithologies within each individual blast hole. This information can then be utilised to determine the distribution of explosive density within the blast hole column to achieve optimal fragmentation. Superimposing the proposed blast hole pattern on plans showing the frequency and orientation of the major defects also allows the blasthole pattern and blast tie up directions to be optimised. All the above can be achieved using computer based geological modelling and mine design systems .
[Detailed exposition of highwall failure mechanisms is shown in the poster display]. Roof Conditions
Potentially unstable roof conditions which may affect proposed highwall mining openings can be analysed by generating hazard maps based on the distribution of weak lithological units in the seam roof and the distribution of structural defects. This information could be used to identify areas in the mine which are less attractive for the commencement of operations or which require
Bowen Basin 1995 - Symposium
245
l'+'+'+'+'+'+I
............
joint
1
joint
2
du 1 dul
o
O
< 4rn > 4rn
0
o------~-------...,.--------------ig
i'!-------,,□-------eo.-----------------i~
Figure 5. Indicative Hazard Map.
more detailed evaluation. Exploration programs could then be planned to collect the required additional information.An illustrative hazard map based on highwall mapping data is shown in figure 5. The figure delineates the areas of intense jointing in the two major joint directions together with the thickness of a mudstone unit (dul) forming the immediate seam roof . The highwall mapping data forms a detailed geological database, which, if systematically and regularly obtained and integrated with drillhole
information, provides a mechanism for the more accurate delineation of geological hazards thereby assisting the mine planning process.
CONCLUSION The 3D highwall geology mapping technique briefly described in this paper represents a quantum leap in terms of data collection, interpretation, presentation and cost effectiveness over previous methods.
Bowen Basin 1995 - Symposium
246
The results are presented in a manner readily useable by professionals from other disciplines via mine computer systems for input into mine planning.
The efforts of Brett Larkin in development of CAD software routines are also gratefully acknowledged.
When all this highwall information is integrated with that from drilling into a suitable computer modelling system it provides a very powerful tool for mine planning.
THRIFf, J.A ., ELLIS, P.R. & DOKTAN, M., 1995: Moura Mine Highwall Mapping Data Evaluation. Runge Mining (Australia) Pty Ltd - Report Number 2268a March 1995.
ACKNOWLEDGEMEN TS
GODFREY, N.H.H., 1981 : Theory ahd Technique of Ground and Aerial Photography for Geological Mapping of Strip Mine High walls. In, Strip Mining 45m and Beyond, Australasian Institute of Mining and Metallurgy Symposium, September 1981.
The authors would like to thank BHP AC Pty Ltd Moura Mine for permission to publish this paper and in particular, Mr. Robbie Gough, for his continuing support and encouragement.
REFERENCES
GODFREY, N .H .H., 1994: Some New Developments in Highwall Mapping. Bowen Basin Coal Geologists Association Seminar Meeting, May 1994.
Bowen Basin 1995 - Symposium
247
Basin phases 11;nd sequence stratigraphy of the Bowen Basin 1
1
1
JM Totterdell , AT Brakel , AT Wells & KL Hoffmann 1. Australian Geological Survey Organisation 2. Department Of Minerals And Energy, Queensland
2
150°
INTRODUCTION Interpretation of seismic and well data by the National Geoscience Mapping Accord Sedimentary Basins of Eastern Australia project has resulted in the development of a sequence stratigraphic and structural framework for the Bowen Basin in Queensland. This framework provides an understanding of the structural evolution of the basin, the basin phases and the response of depositional systems to changes in accommodation. This paper presents results from a sequence stratigraphic interpretation of seismic data from the Bowen Basin between 23 °30' and the Queensland-New South Wales border. A grid of about 900 industry and BMR seismic lines was chosen with a line spacing of approximately 10km in order to provide a regional coverage. Sequence stratigraphy is a well established tool for the interpretation of marine and coastal deposits (see Weimer & Posamentier, 1993 and references therein). A sequence stratigraphic approach can also be used for the interpretation of nonmarine successions, such as the Late Permian-Triassic of the Bowen Basin, where the effects of sea level change may be minimal or non-existent. Here, sequence stratigraphy is based on the response of depositional systems to changes in base level and accommodation as a result of tectonic subsidence and uplift and sediment supply.
20·
200km
PACIFIC OCEAN
24°
2e0
SURAT
________; /
OLD
NSW
BASIN
GEOLOGICAL SETTING OF THE BOWEN BASIN The Bowen Basin is the northernmost unit of the Bowen-Gunnedah-Sydney basin system (Figure 1). During its development, the Bowen Basin was bounded to the east by the active New England Orogen, and to the west by a relatively stable craton of Early-mid-Palaeozoic rocks. The basin contains up to 10km of terrestrial and shallow marine, largely elastic sediments, along with substantial deposits of black coal. The thickest successions are found in the Taroom and Denison Troughs, which are separated by the Comet Ridge. The Bowen Basin was initiated in the Early Permian as a result of back-arc extension associated with subduction along the continental-margin Camboon Volcanic Arc. This was followed by a period of subsidence driven by thermal relaxation. From the mid-Permian, contractional events in the New England Orogen resulted in the onset of foreland basin conditions. From the Late Permian
32°
TASMAN SEA 16/A/297
Jurassic-Cretaceous sediments Permian-Triassic sediments Concealed margin of Permo-Triassic sediments
1
TAS
t;]
Figure 1. Map of eastern Australia showing location of the Bowen Basin. Also shown are the locations of the seismic section shown in Figures 3 and 4, and correspondingly labelled 3 and 4.
Bowen Basin 1995 - Poster Paper
248
to the late Early Triassic, foreland loading resulted in accelerated subsidence in the Taroom Trough. During this period, many of the earlier extensionrelated structures were reactivated as thrusts. This episode of shortening culminated in the Middle to Late Triassic. Extensive erosion and peneplanation during the Middle to Late Triassic was followed by deposition of the Surat Basin.
SEQUENCE STRATIGRAPHY OF THE BOWEN BASIN The basin-filling history of the Bowen Basin can be divided into three parts: the Early Permian rift phase, the Early-Late Permian thermal subsidence phase and the Late Permian-Triassic foreland loading phase. The sequences and sequence boundaries recognised are listed in Figure 2. The sequence boundary codes are according to the scheme of Wells & others (1994), and the sequences are given informal alphabetic designations.
EARLY PERMIAN RIFT PHASE Supersequence A
The earliest phase of basin development was an Early Permian extensional phase. In the Denison and Arbroath troughs this phase is represented by the synrift sediments here referred to as supersequence A. In the Denison Trough, the synrift succession (the Reids Dome beds) occurs in a series of half graben associated with a northstriking extensional fault system (Korsch & Totterdell, 1995). The major depocentres are adjacent to the east-dipping Merivale Fault on the western side of the Denison Trough. The synrift sediments in the Denison Trough are of APP2 age (Price & others, 1985), but may be as old as APPl as the base of the sequence has not been penetrated at its thickest point; it reaches a maximum thickness of approximately 4000m in the Westgrove area (Brown & others, 1983). The synrift succession in the Arbroath Trough occurs in a series of small half graben located approximately 70km south of the Denison Trough; the bounding faults dip to the south-west or west. The age of the succession is APP2.l-2 .2 (Price & others, 1985), and possibly as old as APPl.2. The Early Permian Camboon Volcanics, which crop out on the eastern side of the Taroom Trough, are at least partly equivalent in age to the synrift sequence. The Camboon Volcanics have isotopic dates (Ar-Ar) of 281 and 294Ma (Runnegar, 1979) and faunas from near the top of the Camboon Volcanics are comparable to those from the lower Cattle Creek Formation (Parfrey, 1986). The Combarngo Volcanics, which occur at the base of several wells on the western side of the Bowen Basin, from the Denison Trough in the north to the Wunger Ridge in the south, are probably equivalent to, and continuous with, the Camboon Volcanics (Murray, 1994). The distribution of supersequence A elsewhere in the southern Bowen Basin remains unclear due to the sparseness of wells and
biostratigraphic control. The upper part of a volcanic and sedimentary succession ("Kuttung Formation") in the Undulla-Moonie area is a time equivalent of the Camboon Volcanics and supersequence A (APP2.1-APP1); the age of the lower part of this succession is not well constrained but probably extends into the Devonian. The succession can be correlated with the Tamworth Belt section that crops out to the south in New South Wales. Supersequence A sediments also extend across to the south-western side of the trough where a palynological age of not older than APP2.2 (C.B. Foster, AGSO, unpublished) has been assigned to fluvial sediments. In the Denison Trough, the synrift succession thickens into the faults and onlaps basement in the hanging wall block. Supersequence A consists of interbedded mudstone, sandstone, coal, tuff and conglomerate. Data quality is variable and distinct seismic facies are evident on only some seismic lines. The basal unconformity (sequence boundary B15) is generally either poorly imaged or not discernible on both industry and BMR data, especially on older data or where the rift fill is very thick. On some lines the base of the sequence can be recognised as an onlap surface; on others, it is merely the base of a package of reflections above a non-reflective basement. Several unconformities within the synrift succession can be recognised by both truncation and onlap of reflections (B25 Figure 3), but it was not possible to correlate these unconformities at a regional scale. Therefore, the synrift sediments are here treated as a supersequence. These unconformities indicate the episodic nature of the fault movement. Supersequence A in the Arbroath Trough consists of dominantly fine-grained elastic sediments with interbedded coal and is approximately 1100m thick (Day & others, 1983). As in the Denison Trough, the synrift sequence thickens into the bounding faults. The Camboon Volcanics in the Taroom Trough contain andesitic and basaltic flows and tuffs and elastic sediments (Day & others, 1983). The Combarngo Volcanics, on the western side of the Trough, contain flows and pyroelastics ranging in composition from olivine basalt to andesite and rhyolite (Murray, 1994). In general, the Camboon and Combarngo Volcanics are poorly imaged. The base of the volcanic-sedimentary succession has either not been interpreted or is not imaged on the seismic data, except in some places on the western margin where the contact between the Combarngo Volcanics and granite basement can be discerned. The succession in the southern Bowen Basin on the eastern side of the Taroom Trough is very thick (over 6000m) and the base has not been imaged. Well data show that it consists of interbedded elastics, minor coal and andesitic-rhyolitic tuffs and flows. East of the Goondiwindi-Moonie Fault the succession is folded and cut by thrust faults. Supersequence A extends across the Taroom Trough, west of the Moonie Fault, and onlaps volcanic basement on the western side of the Trough. The top of the succession is a possible
Bowen Basin 1995 - Poster Paper
249
DENISON TROUGH
TAROOM TROUGH
lnjune Creek Group
lnjune Creek Group
0
en
S35
(/)
Hutton Sandstone
:::,
[ Westgrove Ironstone Mbr
er: a:
-,
-------- ------ ---- S25
Precipice Sandstone - - - - - - - - Moolayember Fm
en
S20
J
Precipice Sandstone
S10
895 - - - - _ - ___ Moolayember Fm
Clematis Group
885- - - - - - - - - - - - Clematis Gp
H
Rewan Group
880 - - - - - - - - - - - - - - - - 875 - - - - - - - - - - - - Rewan Group
G
Bandanna Formation
z er:
- ~e~tgr_?v~~~ns!on:_~br _] Evergreen Formation
-- - - - - - - - - - - - -BOO-Showgrou nds Sandstone
0
er: ii: ....
K
S30 Evergreen Formation
(/)
Hutton Sandstone
L
870
Baralaba Coal Measures
- - -- - - - -- - - - - 865
Burunga Formation Black Alley Shale 861 -- - - - - - - - - - - - - - - -? 860 - - - - - - - - - - - - - - - - Scotia Member Peawaddy Formation a: - - - - - -.- - - - - - 855 ? ~ 856 - - - - - - - - - - - - - - - - Banana Formation lngelara Formation w Flat Top Formation ? . . ~ Barfield Formation___ _ _ _ _ _ _ ? ? _ __ _ __ Formation _ _ _ Freitag ..J 850 Oxtrack Formation • • Aldebaran ? - 845 - - - - - - - - - - - - - - - - -? Sandstone z 840 - - - - - - - - - -- - - ? Cattle Creek Formation Buttel Formation ~ :E 831 - - - - - - - - - - - - - - - - - ? 830- - - - - - - - - - - - - - - - Reids Dome ffi Camboon Volcanics o.. 825 - - - - - - - - - - - - - - - - · beds B > ..J 15 ., v ,, v v v-...,,vv-...v, ,v-..."V.nJVN"VV' -<VlJ'V'-"VV-...CVI Vl
:e
F E
D C
, u v ~ v 'u v~•v u v ~ • • u v ,~ v ,, v ~ v v , , ~ v v v • , v v v - , v
a: er:
w
B
A
basement
- - - - Sequence boundary ITTY't'l Major unconformity Correlation uncertain ?
D
Maximum flooding surface Other boundary Sequence code
Figure 2. Sequences, sequence boundarie s and stratigraph y in the Denison Trough and Taroom Trough, Bowen Basin.
truncation/ onlap surface (interpreted as B30) that can be seen on some seismic lines. Although this succession represents the earliest sedimentat ion in the Taroom Trough, it appears to be restricted to the southern part of the Trough; further to the north it is probably correlative with the Camboon Volcanics. Draper & Beeston (1985) proposed a palaeogeographic setting for the Reids Dome beds where alluvial fans and talus slopes formed adjacent to the active faults, with a narrow apron of braided stream deposits. Meanderin g streams with extensive swampy overbank areas drained into large lakes, probably from the hinge (i.e. opposite
the fault) side of the half graben. This extensive, interconnec ted depositiona l regime was probably typical of later synrift deposition, but seismic data indicate that many of the depocentre s were relatively isolated during the early rift phase. A similar depositiona l environme nt is envisaged for the Arbroath beds. Coarse elastics were deposited adjacent to the fault scarps and coals accumulate d in a adjoining floodplain environme nt. Thick lacustrine mudstones overlie the coal. Occasional sandstone and conglomera tic sandstone units in the overlying dominantly silty section may represent pulses of sediment influx from the eroding footwall. On the hinge side of the half
Bowen Basin 1995 - Poster Paper
250
graben, interbedded sandstone and mudstone derived from the hanging wall block were deposited in a fluvial environment. The depositional setting of supersequence A in the Taroom Trough was also fluvial. Although there is some age equivalence, the stratigraphic relationship between the volcanics and initial sedimentation in the Taroom Trough and the synrift sediments of supersequence A is unclear. No seismic lines unequivocally tie the synrift sediments of the Denison Trough with the volcanic successions on the eastern margin. The upper part of the volcanic-sedimentary succession further south is an age equivalent of supersequence A, but the succession also extends well into the Carboniferous and may be as old as Devonian. Nevertheless, the extension that led to the development of half graben of the Denison and Arbroath troughs was probably related to the thinning of the continental crust and emplacement of magmas that led to the volcanism and initial subsidence in the Taroom Trough.
EARLY-LATE PERMIAN THERMAL SUBSIDENCE PHASE Subsidence curves for wells across the Bowen Basin show that rift development in the Denison Trough and volcanism in the Taroom Trough was followed by a thermal subsidence phase (Totterdell & Korsch, 1992). In the Denison Trough this phase of basin development is represented by sequences B to E. In the easternmost Taroom Trough, sag phase sedimentation was restricted to sequences Band C. Sequence B
The first sequence of the thermal subsidence phase of basin development was sequence B, which is represented by shallow marine-deltaic elastic sediments in the Denison Trough (approximately equivalent to the Cattle Creek Formation and lower Aldebaran Sandstone), and in the Taroom Trough by marine volcaniclastic sediments at the top of the Camboon Volcanics and the overlying limestone, siltsone and mudstone of the Buffel Formation. Sequence B is of APP3 to APP4.1 age. In the Denison Trough the base of sequence B, B31, is commonly marked by truncation of underlying reflections (Figure 3) and/ or by onlap of overlying reflections. In places it is a high amplitude, continuous reflection. In general, sequence B is characterised by parallel reflections caused by interbedded marine-deltaic elastics. In the southern Denison Trough, sequence Bis of relatively uniform thickness, with only minor thickening over the half graben, and unconformably overlies supersequence A. In the northern Denison Trough, the sequence is often markedly thicker over the half graben, although it does not appear to thicken into the bounding faults. This geometry indicates that the lower part of sequence B in the northern part of the trough represents immediate post-rift fill, with deposition concentrated over the subsiding and compacting rift fill.
In the Taroom Trough, in the northern part of the study area, sequence B is represented by the Buffel Formation and a marine sedimentary succession at the top of the Camboon Volcanics (Parfrey, 1986). The base of the sequence, B30, is usually a relatively high amplitude, continuous reflection in the northern part of the study area, but is more variable elsewhere. Palynological data indicate that sequence Bis also present is the southern Taroom Trough, although the incoherent nature of the seismic data and the paucity of biostratigraphic information do not allow delineation of this package. The possible truncation/ onlap surface mapped as B30 in this area marks the base of this sequence, however the sequence was not distinctive and the top of it could not be mapped. Following deposition of the rift sediments, a drop in relative base level resulted in erosion of part of the rift fill and the development of a type 1 sequence boundary (B31). During the subsequent rise in relative sea-level, sequence B was deposited over the half graben. The hiatus between these two sequences was probably longer in the southern Denison Trough, where there is little evidence of compaction-related thickening or deformation in the overlying succession. The marine shale and minor limestone and marginal-marine shale and coal of the lower part of sequence B comprise the transgessive systems tract (TST). They are overlain by coarser, aggradational- progradational highstand systems tract (HST) deposits consisting of nearshore-deltaic sandstones, conglomerates and minor coals with interbedded marine (prodelta) shales. The seismic horizon that has been mapped within sequence B, B40, may represent the maximum-flooding surface separating these systems tracts. Baker (1991) proposed that the "lower Aldebaran delta" was a large, arcuate tide-wave-dominated delta that prograded eastwards from a point of major sediment discharge located south-west of Springsure. Further south the depositional environment was one of barrier bars, tidal channels and flats that fringed the western margin of the trough, and in the far south, small deltas sourced from areas to the south prograded northwards into the trough. In the Taroom Trough, sequence B was deposited in shallow marine environments. Sequence C
Sequence C is the second sequence deposited during the thermal subsidence phase in the Denison Trough. Sequence C contains sediments of the upper Aldebaran Sandstone and the Oxtrack Formation and is of APP4 .2-4.3 age. A marked angular unconformity within the Aldebaran Sandstone in the Denison Trough has been mapped as sequence boundary B45, the base of sequence C (Figure 3). This unconformity marks the first phase of contractional movement on the half graben bounding extensional faults and inversion of the rift fill. This event can probably be correlated with the mid-Permian deformation in the New England Orogen on the eastern side of the Bowen Basin
Bowen Basin 1995 - Poster Paper
251 1 km
0
0
approx base
B70 Triassic B65 B61
856
B50 m,d-Aldebar an
B45 unconform,ty
B30 10
• B25
]
rtfl ftll sequences
. B15
.
~
~
~"
•
c.:i; ',vJ',; 1'.;t""I
~'I,,,,.
Figure 3. Portion of seismic line BMR78.0 2 showing the geometry of superseq uence A angular unconfor mity (B45) between sequence s B and C.
(Korsch & Totterdel l, 1995). While B45 is an angular unconfor mity truncatin g underlyin g reflections adjacent to the reactivate d faults, elsewhere the unconfor mity is very subtle or appears concorda nt. The B45 reflection is variable in nature and not very strong where it separates sediment s of similar composit ion. Sequence C is generally thinner than the underlyin g sequence B. In the north-we stern part of the trough the sequence consists of fluvial-deltaic coarse sandstone s and conglome rates, but elsewhere , it consists of finer-grai ned material (Baker, 1991). In the Taroom Trough the B45 sequence boundary is represent ed by the hiatus between the Buffel and Oxtrack Formation s. There, the sequence boundary at the base of sequence C merges with the underlyin g B30 sequence boundary as sequence B is too thin to be resolved seismically. The depositio nal setting for sequence C in the Denison Trough was that of a fan delta entering the sea south of Springsu re (Baker, 1991). The fan delta was not as extensive as the preceding "lower Aldebara n" delta. Away from the direct influence of the delta, depositio n of finer-grai ned material took place in marine and marginal marine environm ents. Further east in the Taroom Trough, the Oxtrack Formatio n was deposited in relatively
(rift-fill) and the
quiet shelf waters below wave base. Low elastic input over much of the area allowed the accumula tion of limestone . Sequence C is only locally develope d on the eastern side of the Taroom Trough (Beeston & others, 1995), which may have been exposed for at least part of this time. Sequence D
In the Denison Trough, sequence D includes the Freitag and Ingelara Formatio ns and the Catherine Sandston e. All are marine shelf deposits, and the Freitag and Catherine formation s were deposited in near-shor e, often high-ener gy, locations. The age of sequence Dis APPS.01 to APPS.02 (Ufimian Kazanian). The basal sequence boundary , B50, correspon ds to the sub-Freit ag unconfor mity. It is a significan t sequence boundary formed at the base of a transgres sive systems tract, and is marked by low-angle discordan ces and/or onlaps or downlaps in many seismic sections. The direction of onlap/do wnlap is usually southeast erly to westerly. B50 is typically a weak reflector, but is moderate ly strong in places. A drop in relative sea-level caused incision of sequence C and the developm ent of BS0 as a type 1 sequence boundary . Initially, the top sands of the Aldebara n Sandston e were eroded, and re-worked
Bowen Basin 1995 - Poster Paper
252
in a littoral to nearshore environment (Freitag Formation). Rising sea-level caused the overlying Ingelara Formation muds to accumulate in the quieter, deeper waters of the offshore shelf. The Ingelara Formation is capped in much of the Denison Trough by the marine-bar sands of the Catherine Sandstone, which represent nearshore deposits at the top of prograding parasequences. Sequence E Sequence Eis a dominantly mud-rich, progradational marine unit, represented by the Peawaddy Formation in the Denison Trough. It is of APP5.2 age (Tatarian). B56 at the base of sequence E is usually a weak reflector, and difficult to identify without recourse to well ties. Stratal terminations below it are rarely evident, but examples occur in line BMR78.02 (Figure 3). Much of sequence E in the Denison Trough represents shelf muds deposited in the offshore zone normally below wave base. However, some sandy phases indicate that at times sand was transported offshore by episodic events, such as storms. The abrupt overlying of the nearshorelittoral Catherine sands by the deeper shelf Peawaddy muds points to B56 originating as a type 2 sequence boundary, which formed when the rate of sea level rise slowed to a minimum and then accelerated. The upper portion (HST) of sequence E coarsens to a dominantly sandy section (the "Mantuan Formation"); as with the top of Sequence D, this is interpreted as a progradational parasequence. The uppermost part of this interval, . known informally as the Mantuan Productus Bed, is variably a coquina, beach facies or a high energy nearshore deposit. On the Roma Shelf in the south-west, the equivalent Tinowon Formation contains thin coals laid down in deltaic or coastal swamp facies (O'Brien, 1989) along the basin margin.
LATE PERMIAN - TRIASSIC FORELAND LOADING PHASE The effects of westerly-directed thrusting in the New Englii,:td Orogen and consequent foreland loading on the eastern margin of the basin spread across the basin from east to west over a period of approximately 10 million years (Totterdell & others, 1992). In the Taroom Trough foreland loading overwhelmed thermal subsidence as the dominant subsidence mechanism during deposition of sequence D. On the western side of the Trough (Comet Ridge) and in the Denison Trough, its influence did not become evident until deposition of the Black Alley Shale or Bandanna Formation (sequence F). Accelerated subsidence as a result of foreland loading resulted in the deposition of up to approximately 9km of marine-fluvial Permian and non-marine Triassic sediments. Sequence D In the Taroom Trough, sequence D includes the Barfield, Flat Top and Banana Formations (Beeston
& others, 1995). As the underlying sequence C is very thin or only locally developed the surface equivalent to B50 cannot be distinguished on seismic data, and merges with B30. Sequence Din the Taroom Trough is dominated by shallow marine shelf dfposits. Pluvial or fluvio-deltaic sediments, including coals, occur at the base of the sequence in the north-east (Beeston & others, 1995). The overlying muds of the Barfield Formation reflect rising sea level. Phosphatic concretions and lenses within the Barfield Formation may mark higher order flooding surfaces. The Flat Top Formation is an overall progradational unit deposited in a marine shelf setting; deltaic facies within the formation on the eastern margin of the Trough are the result of local sediment input. Minor coals occur within the Banana Formation (Taroom Trough) and Muggleton Formation (Roma Shelf) at the top of sequence D. Well data indicate that two or three higher order sequences are present within sequence D, but they could not be delineated and regionally correlated using seismic data. This higher order sequence stratigraphy probably reflects the effects of thrust movements in the orogen immediately to the east. Sequence E In the Taroom Trough, sequence E is approximately equivalent to the coal measures of the Scotia Member (Burunga Formation) and its equivalents to the south, and the Tinowon Formation on the Roma Shelf. Horizon B55, at or near the base of the Scotia Member, is here regarded as probably being equivalent to B56 at the base of the Peawaddy Formation. Horizon B55 in the Taroom Trough is usually a strong reflection in the Taroom-Burunga area; elsewhere it is variable in amplitude. Westerly-directed onlaps are present in lines in the western part of the trough but otherwise, it shows no explicit seismic evidence of being a sequence boundary. Like B56 in the Denison Trough, B55 in the Taroom Trough is probably a type 2 sequence boundary; due to a relatively rapid rate of subsidence there was no fall in relative sea level. The coals of the Scotia Member were deposited in mires that developed as a result of rising base level during the transgressive and highstand systems tracts. In the southern part of the Taroom Trough, 855 is marked by fluvial conglomeratic sandstones overlying marine muds; here the rate of subsidence was less and a type 1 sequence boundary developed as a result of relative sea level fall. Sequence F The effects of foreland loading spread across the whole of the basin during sequence F time. This package of sediments began with the marine Black Alley Shale in the west and the marine upper Burunga Formation in the east, culminating in coal measures (Bandanna Formation, Baralaba Coal Measures, and equivalents) in all areas. The age of the sequence is APP5.02-APP6 (Tatarian). Within this sequence, horizon B65 has been mapped in
Bowen Basin 1995 - Poster Paper
253
order to delineate the base of the coal-bearing interval. Though we lack sufficient evidence to be confident of classifying it as a sequence boundary, that possibility cannot be excluded as there is a basinward shift in facies between the underlying marine shales and the deltaic to fluvial coal measures. B61 /B60-B65 interval: The base of the Black Alley Shale, B61, is variable in its seismic response. It can exhibit strong reflections, but usually has a low amplitude expre~sion. In some lines it appears to truncate beds below it. Downlaps and onlaps onto B61 occur in some lines, and are normally directed southerly to westerly. The erosional nature of this boundary in outcrop (Wells & others, 1994) and the sudden change from high-energy nearshore facies of the top of the Peawaddy Formation to quiet-water black shale, establish it as a combined sequence boundary and transgressive surface. B60 lies at the base of the upper Burunga Formation, and is the strong reflection in the Taroom-Burunga area. Throughout this region the horizon usually displays no sequence boundary characteristics, but some truncations below it and westerly- to south-westerly onlapping strata have been interpreted in some sections. In the northern part of the study area, downlapping relationships of southerly-prograding delta foresets can be seen. The Black Alley Shale is a dark marine shelf mud deposited below wave base, in stark contrast to the underlying nearshore sands of the topmost Peawaddy Formation. As with boundary B56 between sequences D and E, B61 appears to be a type 2 sequence boundary. The Black Alley Shale was deposited in a restricted, anoxic marine environment. An acritarch "swarm" at the base is related to a change to a restricted environment. The only marine macrofossils known from the Black Alley Shale occur in impoverished assemblages within a few metres of the base. The impoverishment is consistent with a low-oxygen environment, and the concentration of the fossils in this zone suggests that it may be a condensed section. The rest of the formation would represent part of a highstand systems tract.
variable with a bias towards the SW-SE sector. B65 is tentatively interpreted as a either a facies or parasequence boundary, fitting in with regional deltaic progradation, but as noted above, the surface could also mark the start of a new sequence. On a local scale the coal measures have a blanket-like geometry, but regionally they thicken towards the axis of the Taroom Trough, where there is a very pronounced thickening south of about 26 • as a result of continuing foreland loading, while the western areas behaved as an easterlydipping block hinged along the western basin margin (Brakel, 1989). The coal measures were deposited initially in a lower delta plain environment, that was followed by middle and upper delta plain conditions as progradation proceeded (Draper & McClung, 1983; Beeston & Draper, 1991). The deltaic coal measures are interpreted to represent peatland development on the topsets of deltas, overlying the prodelta and delta-slope sediments of the B61 /B60-B65 interval. The facies spread fairly quickly across the entire basin, suggesting rapid progradation of the shoreline. In the Moura area, a low relief landscape was produced, characterised by large, long-ranging peat swamps and occasional incursions of elastic sediments brought in by migrating distributary channels (Mallett, 1983). Higher than normal sulphur in the coals of this area (Hunt & Brakel, 1989), and high boron in the coals near Theodore (Swaine, 1971), suggest a marine to brackish influence. Palaeocurrent directions (Jensen, 1975) converge on this central eastern region, confirming that the last remnant of the sea was expelled from the basin here. Sequence G
The upper part of the Burunga Formation is a progradational marine to fluvio-deltaic unit. The marine mudstone that overlies the Scotia Member and a marine shale overlying coals in the Cabawin-Undulla area are equivalent to the Black Alley Shale. These sediments represent the transgressive systems tract. Elsewhere much of the unit is deltaic and prodeltaic in origin and is interpreted as a prograding highstand systems tract.
Sequence G consists of the Rewan Group and its equivalents and is of APP6-APT2 age. It consists of lithic sandstone and mudstone, deposited in fluvial channel and floodplain environments, with alluvial fan conglomerates containing volcanic detritus in the east. Redbeds occur in the upper part of the section. Sequence G represents a continuation of the basin-wide progradational pattern established in sequence F. Subsidence curves indicate that the rapid subsidence established during the Late Permian continued during deposition of sequence G. Regional cross-stratification orientations (Jensen, 1975) suggest that palaeodrainage was internal, and did not change radically from that in the underlying sequence. Provenance areas lay chiefly in the orogen to the east and contemporaneous volcanism in the orogen is inferred from the abundance of labile felsic volcanic detritus.
B65-B70 interval: The base of the coal measures, B65, is usually expressed as the lower boundary of a zone of strong reflections (Figure 4). The horizon does not usually show features associated with sequence boundaries. There are some truncations of underlying beds in few seismic sections (Figure 3), but in the context of the overlying deltaic coal measures most of these may be prodelta foresets. Downlaps are fairly common; their directions are
While sequence G shows a variable seismic response in the northern part of the study area, in the south, it is characterised by an almost featureless seismic signature, indicating a relatively homogenous lithology. Throughout most of the region the base of the sequence (B70) is a well defined reflection at the top of the sequence F coals. On the Nebine Ridge in the far west of the basin, distinct westward directed onlapping relationships
Bowen Basin 1995 - Poster Paper
254
0
1km
510
895
890 885
J!2 Q)
E >ro
880
s: s: I6
875
870
865
860
855
Figure 4. Portion of seismic line C83-T-04 showing truncation of strata beneath sequence boundary B80, the base of the Clematis Group.
occur at the base of sequence G. Erosional relief on B70 is visible in places, underlying strata are truncated in many sections, and locally there are onlaps and downlaps onto it; the contact between the Rewan Group and the coal measures has also been described by several authors as disconformable. This points to the existence of a regional erosion surface several hundred kilometres in extent, one of several criteria given by Flint (1993) for recognising sequence boundaries in fluvial settings. Sequence G was deposited in meandering mixed load and anastomosing fluvial channels and floodplain environments (Jensen, 1975). The relatively fine-grained sediments, especially in the upper part of the sequence, and moderate sand:shale ratios point to an increasing rate of base
level rise and fluvial aggradation during its deposition. Several localised unconformities have been reported within the sequence (Jensen, 1975) and some have been observed on the seismic data, but they could not be traced regionally. Supersequence H
Supersequence H, which contains the Clematis Group and its equivalents, can be divided into two sequences, H1 and H2, each defined by a basin-wide drop in base level and accommodation. Supersequence H marks a significant change in fluvial depositional style and B80 at its base is a major sequence boundary caused by an Early Triassic contractional event (Elliott, 1993; Korsch & Totterdell, 1995). SBO is an erosional unconformity truncating underlying reflectors on the western edge of the Taroom Trough (Figure 4) and is
Bowen Basin 1995 - Poster Paper
255
marked by major changes in sandstone composition, grainsize and provenance. An abrupt decrease in accommodation caused by a drop in base level is demonstrated by the change from an aggrading meandering fluvial system (sequence G) to braided fluvial environments in parts of the basin. The internal drainage system of sequence G was disrupted and a more southerly-directed axial drainage system was established (Jensen, 1975). Sequence H1 corresponds approximately with the Glenidal Formation. It is characterised by a change in composition from the mudstone and labile sandstone of the underlying sequence G to quartzose and sub-labile sandstone and a decrease in mudstone content; sandstone forms about 60% of the succession. The sudden decrease in accommodation that is marked by B80 led to development of soil profiles and braided stream channels in the northern part of the basin (Jensen, 1975). Sequence H1 is not present in the southern part of the basin. Sequence H2 includes the upper part of the Clematis Group (approximately equivalent to the Expedition Sandstone) in the north and the Showgrounds Sandstone in the south. In the northern part of the study area there is little seismic evidence of strata! terminations associated with B85, but it probably correlates with a sequence boundary interpreted near the base of the Expedition Sandstone in wells and outcrop . In the Roma Shelf and the southern part of the basin, sequence H1 is missing and H2 lies unconformably on earlier Bowen Basin or basement rocks. In the southern Taroom Trough, sequence H2 sediments are widespread but thin, onlapping basement highs on the western edge of the basin. Braided stream channels predominated in the north, and meandering fluvial systems existed elsewhere. Supersequence I The final succession deposited during the foreland loading phase was supersequence I, which includes the fluvio-lacustrine Moolayember Formation and its equivalents. Supersequence I sediments are widely distributed throughout the basin and onlap basement rocks on the western margin. Increased accommodation allowed more labile fluvial and lacustrine sediments to accumulate than during deposition of supersequence H, but the palaeodrainage maintained a similar southward-directe d axial pattern. A marine or brackish water influence is evident within supersequence I. The unit can be divided seismically into two sequences. Sequence h is dominantly a fine-grained succession. B90 at the base of sequence h is often a high amplitude relatively continuous reflection that corresponds to the base of the lacustrine Snake Creek Mudstone. Strata! truncations are found under B90 on some lines but mostly it appears to be conformable, and on poorer quality lines it can be difficult to identify. It is possible that these truncations are spurious and that h represents a continuation of sequence H2, deposited as base level continued to rise and accommodation
increased. If so, the point of maximum accommodation (the non-marine equivalent of a maximum flooding surface) would occur within the lowermost part of I1. Sequence h is generally coarser grained than h. B95 at the base of the sequence is commonly marked by a relatively strong reflection in the north but is difficult to distinguish in the south. The depositional environment was one of meandering fluvial channels and lakes with alluvial fans present on the eastern margin of the basin.
CONCLUSION S The basin-filling history of the Bowen Basin can be described in terms of the chronostratigraphi c sequences deposited during the different phases of basin development. The history of the Bowen Basin began with rifting, followed by thermal subsidence and foreland loading phases. In the Late Permian, the thermal subsidence and foreland phases were contemporaneous, as the effects of loading spread across the basin from east to west over a period of about 10 m.y. During the rift phase, extensive volcanism in the main part of the basin (the Taroom Trough) built up a thick pile of volcanics. The smaller rifts in the western basin (the Denison and Arbroath Troughs), meanwhile, accumulated a thick succession of coal measures and elastic sediments. The thermal subsidence phase is characterised by marine sedimentation. Four , marine shelf to deltaic sequences can be recognised in the Denison Trough during this interval. The foreland phase first affected the whole basin at the time sequence F was deposited, and lasted until the end of Triassic deposition. For most of this time the environment was dominantly non-marine. In non-marine strata, sequence boundary recognition relies on abrupt changes in facies and stacking patterns, especially where strata} terminations are obscure. The combination of an erosional surface, a sudden increase in grain size and a change in composition, all of regional extent, indicates a change in base-level leading to a new cycle in sedimentation. The onlapping relationships demonstrated during the foreland loading phase, particularly in the Triassic, suggest an overall increase in fluvial accommodation prior to the contractional events that terminated deposition in the Late Triassic.
ACKNOWLEDGEMENTS We wish to thank other AGSO and GSQ members of the NGMA project for their discussion during the project. We thank R.J. Korsch and J.E. Blevin for reviewing the manuscript and the Cartographic Services Unit, AGSO, for drafting the figures. This paper is published with the permission of the Executive Director, Australian Geological Survey Organisation and the Chief Government Geologist, Department of Minerals and Energy, Queensland.
Bowen Basin 1995 - Poster Paper
256
REFERENCES BAKER, J.C., 1991: Diagenesis and reservoir quality of the
Aldebaran Sandstone, Denison Trough, east-central Queensland, Australia. Sedimentology, 38; 819-838. BEESTON, J.W. & DRAPER, J.J., 1991 : Organic matter deposition in the Bandanna Formation, Bowen Basin. Queensland Geology, 2, 35-51. BEESTON, J.W., DIXON, 0. & GREEN, P.M., 1995: Depositional history of the southern Taroom Trough, Queensland. The APEA Journal, 35, 344-357. BRAKEL, A.T., 1989. Permian coal measures in the exposed part of the Bowen Basin. Bureau of Mineral Resources Australia, Bulletin, 231, 69-91. BROWN, R.S., ELLIOTT, L.G. & MOLLAH, R.J., 1983: Recent exploration and petroleum discoveries in the Denison Trough, Queensland. The APEA Journal, 23, 120-135. DAY, R.W., WHITAKER, W.G., MURRAY, C.G., WILSON, I.H. & GRIMES, K.G ., 1983: Queensland geology: a companion volume to the 1:2 500 000 scale geological map (1975). Geological Survey of Queensland Publication, 383.
KORSCH, R.J. & TOTTERDELL, J.M., 1995: Structural events and deformational styles in the Bowen Basin (this volume). MALLETT, C.W., 1983: Depositional environments of the Rangal Coal Measures, southern Bowen Basin. In Proceedings of a Symposium on the Permian Geology of Queensland. Geological Society of Australia,
Queensland Division, Brisbane, 281-288. MURRAY, C.G., 1994: Basement cores from the Roma Shelf, New England Fold Belt and Taroom Trough beneath the Surat and Moreton basins. Queensland Government Mining Journal, 95, 17-34. O'BRIEN, P.E., 1989: Bowen Basin beneath the Surat Basin. Bureau of Mineral Resources, Australia Bulletin, 231, 93-105. PARFREY, S.M., 1986: Early Permian invertebrates from the Camboon Andesite near Biloela, southeastern Bowen Basin. Geological Survey of Queensland, Publication 387, 57-67. PRICE, P.L., FILATOFF, J., WILLIAMS, A.J., PICKERING, S.A. & WOOD, C.R., 1985: Late Palaeozoic and Mesozoic palynostratigraphical units. CSR Oil and Gas Division Palynology Facility, Report 274/25.
DRAPER, J.J., & BEESTON, J.W., 1985: Depositional aspects of the Reids Dome beds, Denison Trough. Queensland Government Mining Journal, 86, 200-210.
RUNNEGAR, B., 1979: Ecology of Eurydesma and the Eurydesma fauna, Permian of Eastern Australia. Alcheringa, 3, 261-285.
DRAPER, J.J. & McCLUNG, G.R., 1983: Sedimentation and depositional environments of the Permian sequence in GSQ Eddystone 1, Denison Trough, Queensland. Geological Survey of Queensland Publication, 384, 1-41.
SWAINE, D.J., 1971: Boron in coals of the Bowen Basin as an environmental indicator. Geological Survey of Queensland Report, 62, 41-48.
ELLIOTT, L.G., 1993: Post-Carboniferous tectonic evolution of eastern Australia. The APEA Journal, 33, 215-236. FLINT, S.S., 1993: The application of sequence stratigraphy to ancient fluvial successions. In Yu, B. & Fielding, C.R. (Editors): Modern and ancient rivers their importance to mankind. 5th International Conference on Fluvial Sedimentology, Brisbane, July 1993, Keynote Addresses & Abstracts, K22-K32.
HUNT, J.W. & BRAKEL, A.T., 1989: Relationship between geological setting and coal type and quality in the Permian basins. Bureau of Mineral Resources, Australia Bulletin, 231, 301-332. JENSEN, A.R., 1975: Permo-Triassic stratigraphy and sedimentation in the Bowen Basin, Queensland. Bureau of Mineral Resources Australia, Bulletin, 154.
TOTTERDELL, J.M. & KORSCH, R.J., 1992: Structural configuration and tectonic development of the Bowen and Surat basins in the Taroom region. Bureau of Mineral Resources, Australia, Record, 1991/102, 35-52. TOTTERDELL, J.M., WELLS, A.T., BRAKEL, A.T., KORSCH, R.J. & NICOLL, M.G., 1992: Sequence stratigraphic interpretation of seismic data in the Taroom Region, Bowen and Surat Basins, Queensland. Bureau of Mineral Resources Australia, Record, 1991/102.
WEIMER, P. & POSAMENTIER, H.W. (Editors), 1993: Siliciclastic sequence stratigraphy: recent developments and applications. American Association of Petroleum Geologists, Memoir, 58.
WELLS, A.T., BRAKEL, A.T., TOTTERDELL, J.M., KORSCH, R.J . & NICOLL M.G., 1994: Sequence stratigraphic interpretation of seismic data north of 26 • S, Bowen and Surat Basins, Queensland. Australian Geological Survey Organisation Record, 1993/51.
Bowen Basin 1995 - Poster Paper
257
Location of coal subcrop _at Callide Coalfields using the TSIM geophysical metliod Wes Nichols, Callide Coalfields Pty Ltd
The Thiel Surface Impedance Method (TSIM) has been trialled at Callide Coalfields for fault location, blasted overburden characterisation and subcrop location. Of these, subcrop location has proven to be most useful. Accurate location of coal subcrop using the TSIM machine has provided significant savings in drilling costs. Relatively large resistivity contrasts exist where coal subcrops against surrounding sediments on basin margins. The TSIM method can easily detect this contrast and locate subcropping coal up to 50m down from the surface. Hence, TSIM serves as a simple means of accurately targeting boreholes. TSIM surveying is a one-person operation and, consequently, is a cheap geophysical method for subcrop delineation. It has been used successfully at Callide Coalfields to locate coal subcrop at the "Eastern Hillside" deposit.
INTRODUCTION The Callide Coalfields are located some 105km south-west of Gladstone and 450km north-north-west of Brisbane in East Central Queensland (Figure 1). The coalfield covers an area of about 18 000ha and is located within a north-west to south-west trending synclinal basin 22.5km long by 8km wide. Present open-cut mining operations are located in the Dunn Creek, Trap Gully and The Hut areas in the south as part of the Callide Mine, and at Boundary Hill in the north-west of the basin. The Callide Basin is a fault bounded synclinal basin of Middle to Upper Triassic age. It is elongated along a north-west trending axis and asymmetric with strata dipping typicalfy <10°. The Triassic Coal Measures form a grossly fining upward megasequence with thick conglomerate sequences at the base passing upward somewhat abruptly into coal bearing, fine grained elastic rocks. Thick, laterally extensive quartzose fluviatile "sheet" sandstones of the Precipice Sandstone were deposited over the Coal Measures by a braided river system in the Early Jurassic. The Callide Basin sequence was tilted to the south-west during the Tertiary, exposing and eroding the eastern margins and subsequently burying the western margins under Tertiary sediments of the Tertiary Callide Basin. Volcanic activity exhibited by basalt flows that blanket much of the eastern area, accompanied
the tilting. Basalt dykes and stocks also intruded the Callide Coal Measures to the north at Boundary Hill (Biggs & others, 1989). The Callide Coal Seam Member in The Hut area is characterised by rapid lateral splitting and coalescence of seam plies and a generally lower quality specification than Dunn Creek and Trap Gully. On the basis of recognised seam splits and downhole geophysical logs, the Callide Seam has been broken into 6 distinct plies (Biggs & others, 1989). Structurally, dips are <5 • and exploration drilling to date gives no indication of significant faulting being present, although a number of north-west to south-east and north-south photolineaments have been observed. A north-west to south-east trending fault with a throw of 10- lSm to the east occurs along the southern margin of the Eastern Hillside area (Biggs & others, 1989). Coal reserves at The Hut - Eastern Hillside deposit as at 31/07 /94 were 16.46Mt (Biggs, 1994). 4.4Mt of these resources are located between 0-40m (on the margins of this deposit) and these resources have been earmarked for exploitation in the near future. Prior exploration activity had not concentrated on LOX line location and, clearly, this would be necessary for box cut and initial pit design. Consequently, a TSIM survey program was initiated to locate the LOX boundary and provide information for targeting LOX line drillholes. The Thiel Surface Impedance Meter (TSIM) (Figure 2) has been utilised by Callide Coalfields and a number of other mining companies since its development by Dr. David Thiel (Griffith University, Brisbane) in 1986. It has been used variously for fault detection, mapping intrusions, and for location of coal subcrop (Biggs, 1990). This paper outlines a case study which has proven to be successful in positive lateral location of coal subcrop which allowed for accurate targeting of drillholes and, consequently, presented considerable time and cost savings.
SURFACE IMPEDANCE THEORY Surface impedance theory and mapping is not new. Various papers were published prior to Dr. Thiel's works (Biggs, 1990). The TSIM meter is an electromagnetic (EM) surface mapping tool which measures changes in apparent
Bowen Basin 1995 - Symposium
258
tJ
I
~ CCl<IHC COAL
I
CCl<IHC Al40 lffCIIW4L COAL
0
TOWH OIi arr
:~=V£RSO)# COAL
0 U EE .._. CXl"OIITl'O«T
SCALE 0
100
200
LOCATION OF CALLIDE COALFIELDS EPC188 CAWDE
~ ~
CAlUOE MINE
CALLIDE COALFIELDS DISTRIBUTION OF COAL DEPOSITS
TRN' CUU.'r
tit=-'
0
.; 2
iii
Figure 1. Location plan.
resistivity (pa) of the earth. When an EM radio wave strikes the earth, some of the energy is reflected and some penetrates. The surface impedance (resistance to the flow of an oscillating current) at a point is a measure of the resistivity of the earth at that particular position. VLF waves are a good source of EM energy because they are produced by powerful transmitters and maintain their strength for very long distances of several thousands of kilometres (Kearey & Brooks, 1991) .
Electromagnetic waves have two component parts which oscillate at right angles to each other - the radial electric field (Ex) and the tangential magnetic field (Hy) . The magnetic component of a VLF wave will induce secondary electromagnetic fields (eddy currents) in conductive earth. Depending on lateral changes in the resistivity of the earth, the strength of the induced secondary electromagnetic field will vary. The TSIM machine simultaneously measures three components: 1) the Ex field, 2) the Hy field,
Bowen Basin 1995 - Symposium
259
to find the upper layer thickness (t) in metres and the substrate resistivity (pz) in ohm-metres: k = (PalP1)
ReQ= k½cos(45- 'I') A=
✓ k + 1 - 2ReQ
if'1'<45°; or
✓ k + 1 - 2ReQ
if '1'>45°
k+ 1 +2ReQ
A =_
k+ 1 +2ReQ
2 -1 [<ReQ- 1 + A ) • (ReQ + 1)]
_
2AReQ
a - cos
a
t =~ - - - - _ - 7 41t.f. 41tx10 1/2 P1
L=A
0
(Note: if I L I > 1, data does not fit two-layer theory) P2 = [
Figure 2. TSIM machine used for traversing.
and 3) the phase difference between the primary wave from the transmitter and the secondary wave caused by the induced eddy currents. The phase difference is a function of the depth to the conducting body. The calculations involved with the method have been outlined previous papers and are presented as follows: 1) apparent resistivity (pa) (Gidley, 1987; Biggs, 1990)
where µa= magnetic permeability of the medium; and f = frequency in Hz 2) skin depth (o) = theoretical maximum depth of penetration (Gidley, 1987; Biggs, 1990)
o= 500 . (Pal /)½ 3) field data inversion - two layer earth model (Grissemann & Reitmayr, 1979) where Pa = apparent resistivity (Q.m); P1=upper layer resistivity (Q.m); 'I' = phase angle (degrees); f=VLF station frequency (Hz)
l
~ ~ z P1
These equations provide the basis for simple inversion and interpretation of TSIM data and, subsequently, a windows-based software package is currently being prepared for Callide Coalfields designed around these equations.
TSIM EQUIPMENT The TSIM machine is a portable 10kg instrument with a 4 character (A-D) alpha and 10 digit (0-9) numeric keypad and small digital display. A 3m trailing aerial plugs into the rear of the machine and separate sockets on the front accommodate a data download cable and a battery charger connection. An operations manual comes with the package and software is provided for data download and interpretation. The machine can be easily operated by one person and, with the assistance of a laptop computer, data can be downloaded and interpreted immediately after traverses are completed.
TSIM TRAVERSE DESIGN The mesa-like Eastern Hillside has a gently to moderately sloping pediment around its margins (the oblique view in Figure 3 gives a pseudo-3D image). These slopes grade abruptly into the precipitous terrain which is characteristic of the Jurassic Precipice Sandstone throughout this region. Coal subcrops in the marginal areas at depths as shallow as 20m. The outer areas along the margin are densely wooded with acacia (wattle) and the vegetation thins to open eucalypt woodland closer to the sandstone cliffs. The
Bowen Basin 1995 - Symposium
260
THE HUT - EASTERN IIlLLSIDE CONTOUR PLOTS
Interval = Sm
OBLIQUE VIEW = 075 Azimuth = 30 View Angle Z amplification = 3x
PLAN VIEW (Shows all TSIM Survey Lines)
Note: The 6 TSIM Lines (T03, T04, T0S, T07, T09 & TIO) selected for this study are annotated.
Figure 3. The Hut - Eastern Hillside contour plots.
Bowen Basin 1995 - Sympo sium
~ 259500E
259MOE
259600E
259650E
259700E
259750E
259800E
259850E
259900E
0 IO
I()
(")
M
M r-,
M r-,
z
z
0
0
I()
-
+
~
(")
r--
=
z
~
-
~
:::s
=
I»
...
0 0
....
\C \C U1
New
LOX Point
~2650 ~ 8 _1
(")
r--
4.9
0 IO
i Jl~•~I
'<
!3
-.::, 0
...
fl>
~
!3
9 . .35
z 0 0
(")
r--
z
+ .
, I~8:i~ TO 3
+
~
7 1i 9
. i
M
r,.
3 0 0
New lJOX Point
+
T05 e.os 9 5~4
(\J (")
(")
r--
M
r,.
z
0
+
+
+
94
New LOX Points Indicated by M r,. Arrows I()
M M
\ f.9.3
\0.98
+
z
•
\1. 8 \2.68 \6 ~
\ .3·_55
'~--~ T04
+
+
+
+
\3. 36
12.46 8.92
0
I()
~
4
~.ib 11
New LO~
+
ff,. 0 j15. 4 11t..44 19
+
\14.9~ 11
I()
z
,si~~
I
11~ 6
+
11_,
.3.88 \4 \6°.8 1i \7 .30 \10803 5. 6 \'=9.42
+
R2659
+
<///1\CL
--R2660
(")
M
+
5
?1:~2 .30
r--
+
+
11.-
~i§~ ~fz
(")
rJ'J
+
+
cJ;
fl>
:::s
0 0
THE HUT EASTERN - HILLSIDE
-
0
z
0 0
-
Apparent Resistivity r,. Raw Data Shown Along Lines
M M
M
z
+
+
+
+
0 IO
+
+
+
+
z
(\J
M
M
r,.
z
0 0
0 0
(\J
N
M
M
M r-,
259500E
M
259550E
259600E
Figure 4. TSIM lines 3, 4 & 5.
259650E
259700E
r,.
259750E
259800E
259850E
259900E
t,:i
= ....
262
0 CD CD
0)
lD CD
N 0
0
g
0
§
0
§
0 0
0::
0
0
0
g
0
§
i
0
LEGEND
, ~
N
0 0
0::
0
0
Lithology Reference
g
, ~ --..'t~""'RO'"l1l~<rwc11;,,r.~~1G:8•c-:'4-e-
g
D D
~ ==
/~~~F.~t:.~~~~-0
......... i ~--..~~no~1.o
ClJAYS'l'ONE SANDS'l'ONE
B MUDS'l'ONE
i'
DI] SOO'l'Y
COAIJ
EJ WEA'l'HERED -
COAi.i
G COAIJ
~ J:;i~i;~~-=-tt
COALI
(SUFPIXED) INPERIOR
"-"c't, CARBONACEOUS ~ SHAIJE
5--, s....C i:."'=
~~-:
0
SIIJ'flS'l'ONE
~ CONGIJOMERA'l'E
tE] COAi.i
(UNDIFF.)
36.oo··- -
Figure 5. Borehole cross-section, TSIM line 3.
pediment was generally conducive to TSIM traversing but, some areas were heavily wooded and steep. The location of the LOX line had been estimated from previous drilling and this estimated line was used to plan the TSIM traverse lines. The lines were drawn on plans and the line start pegs were placed into position by land surveyors prior to TSIM traversing. Traversing was then performed by following predetermined compass bearings from the start points. The traverse end points were then picked up by land surveyors upon completion of the TSIM program. In all, 24 traverse lines were completed (Figure 3b) with data collected at Sm intervals along each line. For the purpose of this paper, 1 of the lines where the TSIM data was confirmed by drilling will be discussed (Figure 4). However, the poster presentation itself will include data on several lines.
RESULTS It must be noted that the TSIM traversing was completed prior to any drilling along the traverse lines. Boreholes were targeted according to the TSIM results.
The raw data shown along the lines in Figure 4 • represents the resistivity value at each Sm interval along each traverse . The arrows indicate the position of the anomaly (adjacent to the high resistivity value related to the coal subcrop). Clearly, the TSIM results indicate that the previous location of the LOX line along that traverse is erroneous and that the coal subcrop lies some 40m (almost half of a pit width) north of the old LOX point on line T03. Boreholes R2659, R2660 and R2650 were drilled and, subsequently, the TSIM results were confirmed. Figure 5 shows the borehole section along line T03. The plot includes a lithology stratigraphic column for each borehole with SIROLOG gamma-gamma long-spaced density traces to the left of each lithology column. Seam correlations are also shown. The remnant coal seam in borehole R2659 consists of sooty, weathered and inferior coal. Borehole R2660 shows a good working section (H33 & H35 seams) of coal with a minor portion of inferior coal at the top of the H33 seam. The quality of the coal in borehole R2650 was good enough to warrant it being redrilled as cored hole C2650.
Bowen Basin 1995 - Symposium
263
CONCLUSION The TSIM machine is a one-person, portable instrument. The data it collects can be easily downloaded and interpreted in the field for quick anomaly location. The TSIM machine proved to be very accurate in locating the LOX line at the Eastern Hillside deposit. Instead of the usual large number of holes being required for location of LOX lines, the TSIM machine was used to determine a minimal number of drillhole targets for confirmation of the LOX line boundary. Following data interpretation, three holes were drilled along each traverse: one outside the indicated LOX boundary, one on the LOX line, and the other inside the LOX line. The LOX boundary was confirmed and this resulted in a considerable cost and time saving for the drilling program. The results from this and future TSIM surveys will be used to determine the location of the LOX line around the entire Eastern Hillside. Consequently, this adds considerable confidence to original box-cut and pit designs.
REFERENCES BIGGS, M.S. & others, 1989: Summary of the Geology and Mining Operations of the Dunn Creek, Trap Gully and Hut Deposits, Callide Coal Measures Basin, Central Queensland . Callide Coalfields Report. BIGGS, M.S., 1990: Results from Trials of the TSIM Surface Impedance Geophysical Technique at Callide Coalfields. In, Bowen Basin Symposium 1990, Proceedings, Geological Society of Australia, Queensland, 181- 184. BIGGS, M.S., 1994: Summarised Coal Resources of the Callide Coal Measures Basin. Callide Coalfields Report . GIDLEY, P.R., 1987: An Examination of the Thiel Surface Impedance Mapping (TSIM). CSR Minerals and Development Group Report. GRISSEMANN, C. & REITMA YR, G., 1979: VLF Magnetotellurics in Ore Exploration and & Structural Geology. Geophysics, 44(3), 412. KEAREY, P. & BROOKS, M., 1991 : An Introduction to Geophysical Exploration (Second Edition) . Blackwell Scientific Publications, London. THIEL, D.V., 1990: Surface-Impedance Changes in the Vicinity of an Abrupt Lateral Boundary at the Earth' s Surface. In, IEEE Transactions on Geoscience and Remote Sensing, 28(4), 500-502.
Bowen Basin 1995 - Symposium
264
Bowen Basin 1995 - Symposium
265
THE BLAIRATHOL COAL MINE LOCATION
Blair Athol is situated 280km south-west of Mackay and 25km north-west of the township of Clermont (Figure 1). Two Mining Leases (ML 1804 and ML 1881) cover all of the economic coal resources within the basin, known as the Blair Athol Coalfield.
Figure 1. Location map.
OWNERSHIP
The following parties comprise the Blair Athol Coal Project Joint Venture (BACP JV): Queensland Coal Pty Limited
57.195 %
Arco Coal Australia Inc.
17.527 %
Arco Resources Limited
13.889 %
EPDC (Australia) Pty Limited
7.9723 %
J.C.D. Australia Pty Limited
3.4167 %
The joint venture is managed by Pacific Coal Pty Limited.
DEVELOPMENT HISTORY
The discovery of coal at Blair Athol in 1864 is credited to a station hand employed by James McLaren, the original owner of Blair Athol Station, who struck a thin seam of coal while sinking a well for water. Sporaµic mining of this seam, now known as the No.2 Seam, began in 1890 with the Queensland railways as the main customer. Bowen Basin 1995 - Symposium
266
Blair Athol coal acquired a reputation for its clean burning properties. Following the chance discovery of the thick No.3 Seam in 1900, and the extension of the railway system to the coalfield in 1910, several collieries were established on the field . Underground mining ceased in 1946. In 1936, the first of two small open cut mines commenced. The second pit was opened in 1946 and continued production through to 1984. The potential of the deposit was recognised by CRA in the 1960s, leading to the acquisition of 60% of Blair Athol Coal Pty.' Ltd. in 1968. Yet it was not until after the oil crisis in 1973 that a potentially large export market emerged, sufficient to u nderpin a major mine in a remote area. Finally, in 1980 agreement was reached to supply coal from Blair Athol under long term contract to Japanese utilities. This culminated in May 1984 with the first commercial shipments of coal from the new open pit mine. Since 1984, annual shipments of Blair Athol coal have doubled from SMt to lOMt.
MINING METHODS
Mining at Blair Athol is carried out by conventional strip mining techniques. Overburden to the No .3 Seam is removed by a 46m dragline. As the No.3 Seam is unusually thick and the thicknesses of overburden and coal are similar, overburden is removed in two passes in 100m wide strips. Production demands and the need for greater flexibility have led to the total strip length being increased to approximately 5km. This enables a large in pit inventory of coal to be kept ready for mining. Coal is mined using two P&~ 2100 electric shovels and a fleet of 180t capacity Caterpillar 789 rear dump • trucks. Although the No.3 Seam has in the past been mined in two passes, full seam mining commenced recently. There is no washplant at Blair Athol, as the coal can be sold raw. Hence, mining practice limits the introduction of dilution into the ROM coal by maintaining a clean top of coal surface and adhering to defined floor levels. Once deli vered to the primary crusher station, the coal passes through a hopper and an apron feeder into a hammer mill. This reduces the ROM coal to -S00mm topsize. It is then fed into twin rotary breakers at the secondary sizing station where it is reduced to 120mm topsize. Undersize coal from the breakers is fed over a screen to take out product sized coal (-40mm). The oversize stream passes through rolls crushers at the tertiary station to reduce it to -40mm. Product coal is either conveyed to one of three stockpile rows with a total capacity of 600 000t, or bypassed to the rail loadout hopper. The stockpiles have been successfully designed and managed to minimise the potential of the coal to self heat. Mine infrastructure is presented on Figure 2.
GEOLOGY
The Blair Athol Basin is a small, intracratonic basin located on the north-western margin of the Bowen Basin. The basin is not unique in the region; in fact several others, more or less similar, have been identified nearby. However, only one other basin (Wolfang Basin) contains a thick coal sequence, and Blair Athol remains the only one supporting a coal mine. The Blair Athol Basin formed in response to the interaction between Early Permian back-arc extension (acting along east-west axes) and a corridor of tectonic instability trending north-north-west from the Denison Trough into the Anakie Inlier. Within this zone, both classic half graben basins and more complex subsidence structures developed. The Blair Athol Basin is representative of the latter form . Wolfang is typical of the former. An episode of compression in the mid Permian and fault activity continuing into the Tertiary period further modified the basin forms. Palynological investigations at Wolfang suggest that the earliest sedimentation within these basins took place at the same time as deposition within the Denison Trough. Hence, Reids Dome Beds equivalence is assigned to the lowest parts of the sequence. These sediments are typically coarse sandstones and conglomerates. Lacustrine/paludal coal forming Bowen Basin 1995 - Symposium
267
BLAIRATHOL 6-
~
0
1000m
7487SOC..,..
'I!
!
'I!
I
Quaternary
CJ Alluvium
Tertiary
~ Basalt Flows
Early Permian
CJ Blair Athol Coal Measures ~ Scree/talus deposits
Proterozoic to Early Cambrian
CJ Scurvy Creek Meta-arenite CJ Hurleys Metamorphics
Figure 2. Mine geology and infrastructure. environments developed later and are considered to be equivalent in age to the Aldebaran Sandstone. This subdivision of the Permian sequence was developed by Preston & Sayers (1980), who described the two sequences as the Lower and Upper Coal Measures. Other discussions of the geology of the basin have been published by Osman & Wilson (1975), Preston (1985), and Miller (1995). The most recent detailed discussion was included in an unpublished report by Smith (1989). Typical cross sections through the Blair Athol Basin are shown in Figure 3. A composite stratigraphic column is presented in Figure 4. The Lower Coal Measures unconformably overlie a highly irregular basement surface (Proterozoic - Early Cambrian Anakie Metamorphics Group). The sequence comprises well indurated fluviatile conglomerates and coarse sandstones with minor carbonaceous shale and stony coal lenses. Its maximum thickness is estimated to be 130-150m around the basin centre. The upper boundary of the sequence has been arbitrarily fixed at the floor of the lowermost correlated coal seam (No.4 Seam). The Upper Coal Measures comprises fine to medium grained sandstones and siltstones with four major coal seams and lesser mudstone and granule to pebble conglomerate. Palynological studies (Foster, 1975; Price & Filatoff, 1989; Price, 1979 & 1995) have grouped the sequence down to the floor of the Bowen Basin 1995 - Symposium
268
A
A' 350•
No 1 SEAM
No2SEAM
B
B'
350m
1000m
Figure 3. Representative cross-sections. No.3 Seam within APP 3.2 (Lower Aldebaran Sandstone). Recent work (Price, 1995, personal communication) suggests that the No.4 Seam is no younger than APP 3.1, placing it at the top of the Lower Coal Measures. The No.1 Seam is the uppermost seam in the coalfield and averages 7.Sm in thickness. It is known from two small pockets, each coinciding with a local topographic high. One area has been mined out; the other nearly so. Evidence of ancient in situ burning of this seam is known from a larger third area, where overlying sediments have collapsed and been baked. The first seam discovered and mined at Blair Athol (No.2 Seam) ranges in thickness from 0.3m in the south-west of the coalfield to 2.3m in the centre. Two minor coal plies and their splits are commonly associated with the main interval. A long period of stable, paludal conditions with an equilibrium between subsidence and accumulation rates, led to the formation of the No.3 Seam. This seam averages 27m in thickness and is generally free of major stone partings. The No.4 Seam occupies a larger area than any of the overlying coal seams. It is affected by several episodes of splitting, with the main intervals ranging in thickness from 3m-Sm. Stone partings within the seam often comprise coarse sandstone and conglomerate. Together with episodes of seam erosion (crevasse splay) and the moderately high inherent mineral matter content of the coal, these features indicate a more fluvial environment.
COAL QUALITY
The Blair Athol seams are low rank bituminous coals, containing low ash and sulphur, moderate volatile matter and specific energy levels and high ash fusion temperature·s. They exhibit excellent handling, grindability and combustion characteristics. Bowen Basin 1995 - Symposium
269
PERIOD
~
~
<
t.)
-
SEAM
BIOSTRATIGRAPHIC
UNIT
~
S - A-
~ ATHOL CX:W.. MEASL.RES
APP U .2
•-•-Ns. t (7.5nf
Ii) Upper Coal...,...,.. Na.7 \ U nt
Oua,u Nndnt,-, .ri.u,,.. arcl
mud-.one "M1h non-c:olung ea ■ • n•
APP:U
N., 3 (nnt
M umi.mThlc:knns 1DOm
APPU
APPJ.U
z
$ :E a: w
(i) L"'8rCollll....._,,.,.
~
Flwal conglom••arclaaarwa
APP S.1
Q.
a: jj
andnlrewfimll'IOl'mudllDN and11anyc:o■ len-.
APP2.1
M•min Thiduwa 130 • 150m
UfrOFF. ENI. Y PER..»I Ut'llc tir.:aa a l 1Ch111 h g ma,ta (Conaolidaad .,....,_,. dltpo8 t)
?UKALUNOA BEDS EOUV. A,gtliNd~111&Nri»
z < ~ a: w
sa.AVY CREEK META-ARENTE
Q.
Chlorilt-4,la1Z a:t'ilt Wllif'I minor
a:
phyllia arG mica actiat
w
Q.
HI.REYS METIJ«:IRPI-ICS Snngly 1Dle9d ql.91Zi• rd fi,_ W•rad q..u-mica -=hill
Figure 4. Stratigraphic column. The No.3 Seam accounts for nearly all of the coal product. The seam is dull and massive in appearance, due to the coal' s high inertinite content (67% dmmf). Vitrinite and liptinite concentrations (dmmf basis) are 29% and 4% respectively. Vitrinite reflectance (Rv max) is 0.70%. As the mine has no washery, adherence to quality specifications relies on pit scheduling and stockpile blending. In general, vertical variations in coal quality in the No.3 Seam are significantly greater than lateral variations. There is also an overall decrease in the inherent mineral matter content of the coal from the No.4 Seam (average 10% inherent ash) to the No.1 Seam (average 2%). Typical physical and chemical properties of Blair Athol coal are listed in Table 1.
COAL RESOURCES
A summary of current coal resources and mineable in situ reserves within the Blair Athol Coalfield is presented in Table 2. Coal resources are of Measured status.
FUTURE DEVELOPMENTS
The current annual export tonnage is lOMt, with the potential for sales of 13Mt in 1996. To achieve this target an expanded operation is proposed, involving a truck and shovel fleet developing a new mining area in the north of the coalfield.
Bowen Basin 1995 - Symposium
270
TABLE 1. BLAIR ATHOL PRODUCT COAL QUALITY.
Total Moisture(% ar) Moisture (% ad) Ash(% ad) Volatile Matter(% ad) Total Sulphur(% ad) Gross Calorific Value (kcal/kg ad) Chlorine(% ad) HGI Abrasion Index (mg Fe/kg coal) Ash Fusion Temperatures (Reducing) Deformation ( °C) Hemisr,here ( "C) Flow ( C)
16.0 7.5 8.0 27.2 0.30 6520 0.07 60 14 1550 1570 1580
TABLE 2. BLAIR ATHOL COAL RESOURCES AND RESERVES. Seam
No.I No.2 No.3 No.4 (Upper) No.4 (Lower) TOTAL
REFERENCES
Coal Resources (Mt) 0.2 3.5 188 36
Mineable In Situ Reserves (Mt) 0.2 2 153 30
7 235
185
FOSTER, C.B., 1975: Permian Plant Fossils from the Blair Athol Coal Measures, Central Queensland. Palaentographica, 154(B), 121-171. MILLER, D.E., 1995: Geology of the Blair Athol Basin in 1995 Field Conference Clermont -Anakie Area. Geological Society of Australia, 96-101. OSMAN, A.H. & WILSON, R.G ., 1975: Blair Athol Coalfield in Traves, D.M. & King, D. (Editors): Economic Geology of Australia and Papua New Guinea - 2:Coal. Australasian Institute of Mining and Metallurgy, Monograph, 6, 376-380. PRESTON, K.B., 1985: The Blair Athol Coal Measures, In Bowen Basin Coal Symposium, Geological Society of Australia, Abstracts, 17, 59-64. PRESTON, K.B. & SAYERS, P.G ., 1980: The Geology and Coal Resources of the Blair Athol Coalfield. Blair Athol Project Feasibility Study. Volumes 4A - 4H. PRICE, P.L., 1979: Selected Core Samples from the Roof and Floor of the Big Seam, Blair Athol, Queensland. Mines Administration Pty Ltd Palynological Report No. 145/29. PRICE, P.L. & FILATOFF, J., 1989: Summary of Palynolog!cal Results on Selected Bore Samples Submitted by Pacific Coal Pty Limitea. APG Consultants Reports No. 145/50 to 145/55. PRICE, P.L., 1995: Borehole Samples for the Valeria Exploration Permit, Northern Denison Trough. APG Consultants Report No. 145/72. SMITH, R.D.C., 1989: Geology and Coal Resources of the Blair Athol Coalfield. Pacific Coal Pty Limited . RDC Smith Pacific Coal Pty Limited DE Miller Blair Athol Coal Project Bowen Basin 1995 - Symposium
271
COLLINSVILLE COAL MINE LOCATION
Collinsville and the Collinsville coal mines are located at the far northern limit of the Bowen Basin, 80km south-west of the coastal town of Bowen and 106km by rail to the deep water loading port of Abbot Point.
TENURE AND HOLDER
The Collinsville coal mines, along with the Newlands coal mines and Abbot Point, comprise the NCA project - a joint venture between Mount Isa Mines Ltd (75%) and Agipcoal Pty Ltd (25%) . Collinsville Coal Company Pty Ltd operates the Collinsville coal mines on behalf of the joint venture.
DEVELOPMENT HISTORY
Collinsville was officially recognised as a potential coalfield as early as 1866, though it was not mined until 1919. The area came to be known as the Bowen River Coalfields or 'Moongunya (the aboriginal word meaning coal). When mining commenced there were two mining interests at Collinsville Bowen Consolidated Coal Mines (BCCM) Ltd and the Government owned State Mine. Full scale mining did not commence until the railway was completed in 1922, which provided access to the port of Bowen and other coastal markets. Coal was first used by the railway and local industries for steam generation. By 1950 the principal utilisation of the coal was for power generation - Mount Isa Mines Ltd, and later Collinsville power station, being the major customers. By 1952, MIM acquired control of the BCCM Ltd to ensure a reliable source of steaming and coking coals. Dacon Collieries Properties Pty Ltd gained control of the State Mine in 1961. Collinsville Coal Company Pty Ltd was formed by the merging of the two mining interests in 1975. In 1989 the joint venture was formed. Today Collinsville Coal is comprised of an opencut operation and two underground mines, selling coking and steaming coal to domestic and export markets.
MINING METHODS
Seven seams are mined in the opencut operation, while only one seam is mined by both of the underground mines. The undergrounds (No 2 and Bocum) are both worked using continuous mining machines and shuttle cars to an underground conveyor system. The Bowen seam is mined in both undergrounds, and is taken in two to three lifts due to the thickness of the seam (7 to 8m) and the vertical variation in coal quality (top is steam; bottom is coke). Both mines have low seam gases. Hazards include occasional faulting and poor roof conditions in both undergrounds; 'muddies (or iron concretions) falling from the roof in No 2 mine; and very wet conditions in Bocum. In the opencut, overburden is removed by a combination of a dragline, truck and shovel, and truck and front-end loader. Coal is excavated and hauled using a front-end loader and Dart truck fleet. Some pits are multi-seam operations where up to three seam may be mined . On the other end of the scale, one seam (Blake) is mined in three to four lifts, due to its thickness (-12m) and the need to remove parting and intrusion at various levels throughout the seam. The area or seam mined on a day to day basis is highly dependent on the particular customer. Coking coal stockpiles are built from a blend (in specified ratios) of several (2 to 5) of the coking coal seams, and are then washed to contract specifications. Steaming coal is not washed, so must therefore be mined to ensure the coal parameters meet the contract values. The steaming coal product will consist of the Blake and / or the Bowen seam(s). Within the coal measures several seams are heat affected due to intrusion that was injected into the seam. This intrusion occurs mainly as sills within the seam, and to a lesser extent, as dykes that cut through the seam. In the Bowen Basin 1995 - Symposium
272
(/)
w
0::
:::> (/)
<(
LLJ
::E _J
<(
0
u w
_J _J
> (/) -z_J
SANDSTONE WITH CONGLOMERATE . . . . ... . . . . . . .. . BLENHEIM . ...... AT BASE ......... SUBGROUP . . . . . . MURRAY SEAM 0-0.5m .......................................... . . ..... ..... . ...... ......................... . . ..... SANDSTONE &. SILTSTONE .... ................ . ... .................. ..... ..... UPPER COAL ......... .... . . MEASURES .. .. .. .. .. .. ... ... LITTLE GARRICK SEAM 0- Im ........ ......... . . ... .. 45-75m I GARRICK SEAM 0.6-3.4m , - - - ......... .. ............... . . . ... PEACE SEAM 0-1 m - - - - - - - - - ..•.•.•.•.•.•.•.• ....... . . . . . .. ....... ........ GLENDOO ................ ............... SANDSTONE &. SILTSTONE . . . SANDSTONE: ......... ............. ... ... ... .. . -......... ....................... MEMBER en ........ 18-40m ~ ........ ............... .......... . .. !SCOTT SEAM l-2.5m:-------1 ~ . . .. 6m ........ en ......... .. .. ...... I DENISON SEAM I -3m : C!> . .... ......... ......... z ... ... POTTS . . . . . SEAM 0-2m .............. ~ ......... . a:: ........ ........ ........ 0 .. .. ..... SANDSTONE &. SILTSTONE ............ . . . .. 3: .............. .... ... ........ LOWER COAL LITTLE BOWEN SEAM
0-0.8m
MEASURES 120-150m
. . .. .. ... ... . ............... .................... ........... .......... ......... ......... ................. . ..... .. . . .. .. ... ...... ................. ......... . .. ....................
_J
0
u
~
w !BOWEN SEAM 7-em-:------l~ :::>
(.)
-SANDSTONE &. SILTSTONE
!BLAKE SEAM 0-16m : t - - - - - - - - '
LIZZIE CREEK VOLCANICS
vvv V
V
vvv
Figure 1. Stratigraphic column showing working seams. opencut, both the ultra-low volatile (UL V) coal and intrusion are mined as interburden and are rejected. The sills are found as rods of intrusion, thus mining of coal usually follows along the contours o these pods or the UL V coal surrounding the pods. The low volatile coal surrounding the UL V coal may be mined and blended with other steaming coals.
273
Acid water and acid spoil are also problems faced when mining in the opencut. Most of the pits have a continual seepage of water which combines with the oxidised, pyritic sulphur in the overburden and coal, to form acidic to highly acidic water. Water pumped from the pits must be held within evaporation dams and cannot be released into creeks adjacent to the leases. All pumping equipment on site is made of stainless steel to resist corrosion. When rehabilitating an area, acid spoil must be covered with a thick layer of inert soil and then top soil. A new trial is being undertaken at present, where by a chemical called PROMAC is spread over the acid spoil. This product neutralises the spoil by killing the bacteria that converts the pyrihc sulphur into sulphuric acid. This, in turn, reduces the amount of inert and top soil that is need in rehabilitation process.
GEOLOGY
The Collinsville Coal Measures, Early to Middle Permian in age, unconformably overlie the Lizzie Creek Volcanics (proximal braided) and are conformably overlain by the Blenheim Subgroup (open marine) (Smith, 1986). Fluviatile and marine sandstones comprise these measures and are approximately 215m thick in the Collinsville area (Smith, 1986). The coal measures have been divided into the Lower Coal Measures, the Glendoo Sandstone Member, and the Upper Coal Measures (Figure 1). There are ten coal seams, ranging in thickness from Oto 16m, which comprise the measures (Figure 1). Seven of these ten seams are mined at the Collinsville mines. The coking coal seams mined are the Murray, Garrick, Scott, Denison, Potts, and the bottom of the Bowen seam. The steaming coal seams mined are the Blake and the top of the Bowen seam. The mine workings follow around the prominent syncline (west) and closed anticline (east) structures at the northern tip of the Bowen Basin (Goode, 1984). The average dip of the seams is 8°. Faulting is evident in and around the Collinsville area. The northern extreme of the basin is bounded by large, north-west trending faults, which have upthrown the Lizzie Creek Volcanics on the eastern side of the basin. Within the mining leases there are several large faults which form the limit of some working sections. Also there are numerous small faults found within the mining areas, both in the undergrounds and in the opencut, which have a slight to moderate impact on the mining operations. Many of the seams have been intruded, wholly or partly, which in turn has coked the coal. The presence of this intrusion in some areas has affected the viability of the seams in those areas.
COAL QUALITY
Within the Collinsville Coal Measures the coal quality varies both vertically and laterally. Table 1 sets out the average coal quality expected from each seam or area. The coking coal stockpiles are blended to a specified ratio of 40:40:20 of SDN:SDW:GAR. Potts and Murray seams are occasionally added in small proportions (~8%) in place of some SON and GAR, respectively. TABLE 1. AVERAGE COAL QUALITY.
Garrick East ....... 13.6 . . .. . .. 23.4 .. .. . . .. 4-5 ........ 3.4 ....... . 29-30 Garrick West ...... 12.5 .. .. ... 25.1 ........ 3-8 ... .. ... 2.3 .. .. .... 29-30 Scott North . ....... 14.2 . .... .. 24.5 ... ..... 3-4 ........ - ..... . .. .. 29-30 Scott West ..... : ... 15.5 ....... 25.0 ........ 3-4 ....... . - ......... . 29-30 Denison North . ... 21.6 ....... 23.3 ........ 4-5 .. .. . .. . - ........ .. 29-30 Denison West ..... 17.5 ...... . 25.3 .. ... ... 4-5 ...... .. - ... ....... 29-30 Potts ........ .. . ... 24.9 .... ... 20.9 .. . . .... 4-5 ..... ... - . ... .. .. .. 27-28 Bocum - Steam .. .. 14.10 .. .... 21.1 .. .. .. .. 1-2.5 ...... - .... .. .... 29-30 Bocum - Coke . .. .. 11.80 ...... 23.3 ........ 3-3.5 .... .. - ......... . 29-30 Blake Central .... . . 22.0 .... . .. 18.8 . . .... .. 0-2 ........ - . .. . ...... 26-29 Blake West .. ...... 18.4 .... . . . 19.7 .. ... . .. 0-2 ........ 0.52 .. ... .. 26-29 Blake North .. ..... 18.3 ....... 20.2 . ... .. .. 0-2 ........ 0.52 ....... 26-29 No 2 Mine . . . . . . . . 17.0 ....... 20.0 ..... . .. 0-2 ........ . .. ... ... ... 29-30
Bowen Basin 1995 - Symposium
274
The stockpiles are built to 36 OOOt before they are washed to the specifications displayed in Table 2, thus producing an average yield of between 67 to 72%.
TABLE 2. EXPORT COKING COAL PARAMETERS (WASHED). Inherent moisture ...................... <1.5% Ash .......... ............... . .........9.0% (±0.5%) Volatile matter .........................=26.0% Fixed Carbon ..........................63.5% (maximum) Total moisture .. ............. ..... .....8.0% (maximum) Total sulphur ..... ... ..... .. ...... ..... <0.9% Crucible Swelling Number (CSN) .......=6 Fluidity . . ... ... .......................1000 to 2000ddpm Reflectance ......................... ... 1.05 to 1.10% Size ......... ....... ......... . ......... <32 mm
COAL RESERVES AND RESOURCES
Recently the coal reserves have been reduced due to a very limited, coking coal mine life and the increasing cost in the excavation of the resource. The reserves are listed in Table 3.
TABLE 3. OPENCUT AND UNDERGROUND RESERVES. Scott-Denison North .......... .2 950 000 . .... ... .. ....... 9.6 Scott-Denison West ............ 1 751 000 ....... .... . ..... 9.8 Garrick West ..... ........ ...... 768 000 ................ 13.8 Garrick East .... . ... .... ........ 277 000 ................. 6.3 Potts ........................... 749 000 ..... . .......... . 4.7 Blake West . . ..................9 492 219 ......... ........ 2.7 Blake North .................. .1 216 300 .............. . .. 3.2 Blake Central ................... 361 000 ................. 2.6 Bowen Central .................. 471 000 ................. 2.2 Bocum Underground . ..... ... =2 700 000 .... . ..... ..... .. No 2 Mine Underground ....... =460 000 ............ ..... N.B. reserves are in situ adb tonnes. Other resources include Garrick West Underground and Garrick East Underground.
FUTURE DEVELOPMENT
The coking coal has approximately 4 years mining life left and there is approximately 15 years of steaming coal production. The production tonnage for this year is a total of 2 348 OOOt (underground = 578 OOOt; opencut = 1 770 OOOt). The following three years production are expected to be similar to these totals. Currently the first strip in Garrick East is being developed. Mining in Blake North will start within the next few years. Blake North coal, in conjunction with Blake West coal, will be supplied to domestic markets including, possibly, the Collinsville power station (due to reopen around 1998). By the end of this year a highwall auger will be employed to reach resources that have not been mined in the highwall and end walls of current opencut pits. In approximately four years time it is envisaged that a highwall miner will be mining resources out of the economical opencut range.
REFERENCES GOODE, A.H., 1984: The geology of the Collinsville Coal Measures in the Kerale Station region, northern Bowen Basin. Bachelor of Science Honours Thesis, James Cook University. SMITH, B.S., 1986: The geology and context of the Lizzie Creek Volcanics in the Collinsville region, Queensland. Bachelor of Science Honours Thesis, James Cook University. Bernadette Michelle Williams Collinsville Coal Company Pty Ltd
275
THE DAUN IA COAL DEPO SIT LOCATIO N
The Daunia coal deposit is located between the Isaac River and the Peak Downs Highway some 30km south-east of Moranbah and 150km south-west of Mackay (Figure 1). The Peak Downs - Hay Point Railway forms the western limit of the deposit.
EXPLORATION HISTORY
The Daunia coal deposit was located by the Utah Developme nt Company in the 1960s during exploration drilling along the western side of the northern Bowen Basin under Authorities to Prospect 6C and 67C. The area was subsequent ly taken up by the Central Queensland Coal Associates as Special Coal Mining Lease (SCML) 244 Clermont in 1973, a title now changed to Mining Lease (ML) 1781. Drilling of the deposit to Measured Resources status was completed during the 1970s with fault delineation and coal quality drilling continuing intermitten tly until 1982. Daunia was the subject of a number of mining feasibility studies during the early and mid 1980s but no further progress towards mining resulted at the time. Interest in the area in was rekindled 1994 following identificati on of potential new markets for the coal. An updated mining study has since been undertaken and a mine developme nt strategy formulated . A drilling programme to locate a site for initial mining, confirm quality specificatio ns, delineate seam subcrops and more accurately define structure, has recently been completed.
GEOLOGY
Daunia is located in the northern Bowen Basin adjacent to the southern extension of the Burton Range Fault system which defines the boundary between the structurally stable Collinsville Shelf to the west and the deformed Nebo Synclinoriu m to the east. Structure is complex with the coal measures strata preserved within a down-fault ed synclinal structure aligned north-north -west. Bounding faults display throws of up to 90m. Dips range from 5° to 30° and smaller scale faulting is widespread . Over eighty high angle normal and reverse faults have been identified. Despite the general complexity , sizeable areas of gentle dip and moderate structure have been located . The economic coal seams are contained within the Upper Permian, Rangal Coal Measures which are conformabl y underlain by the Fort Cooper Coal Measures and overlain, also conformabl y, by the Triassic Rewan Group. The Fort Cooper Coal Measures consist of labile sandstones and siltstones and thick seams of interbedded coal, carbonaceo us mudstone and tuffaceous claystone. The thick Girrah seam lies within the formation while the Yarrabee Tuff, immediatel y overlying the lowermost part of the Vermont seam, is taken as the upper boundary (Matheson, 1990). The coal seams within the Fort Cooper Coal Measures have no current economic potential. The barren Rew an Group comprises greenish-gr ey, labile sandstones and mottled red and green mudstones. At Daunia only the lower transitional section of the unit, which is similar to the underlying Rangal Coal Measures in lithology except for the absence of coal seams remains. The Rangal Coal Measures consist of labile sandstones , siltstone, shale and coal seams. Some strong carbonate cemented sandstone beds have been reported. Two coal seams of economic significance are present, the Leichhardt seam and the underlying Vermont seam. The Leichhardt seam is 4.5 to 5.Sm thick. The coal is very dull near the top but becomes brighter towards the base of the seam. A basal split, termed the Bowen Basin 1995 - Symposiu m
276
Collinsville r
■ ~
LEGEND Operating Mine Deposit
Eungella Dam
Nebo West Extended
220 -
-
----
Rug
REGIONAL
~~~":~ & ~orens
Figure 1. Bowen Basin 1995 - Symposiu m
•
277
TABLE 1. DAUNIA COAL DEPOSIT, COAL QUALITY DETAILS.
Proximate Analysis (air dried basis) Inherent Moisture Ash Volatile Matter Fixed Carbon Total Sulphur (air dried) Phosehorus (air dried) Crucible Swellin~ Number ecific Energy air dried) ~ ardgrove Grmdability Index Nitrogen (d.a.f.) Fluidity (ddpm) Ash Fusion Properties (Reducing Atmosphere) Deformation Temperature Hemitehere Temperature Flow emperature Alkalis in Ash Mean Maximum Reflectance
Coking Coal
PCI Coal
Steaming Coal
2.0% 8.0% 20.5% 69.5% 0.5% 0.03% 7 32MJ/kg 85 1.7% 40
2.0% 9.5% 20.5% 68.0% 0.4% 0.07% 4 31.5MJ/kg 85 1.6% 10
2.0% 13.0% 20.0% 64 .0% 0.4% 0.06% 1 30.5 MJ/kg 80 1.5% 2
>1300 >1400 >1500 <l.5% 1.28%
>1350 >1500 >1500 <1% 1.27%
>1400 >1500 >1500 <1% 1.27%
Leichhardt ply, occurs in the north of the deposit and comprises some 0.6 m of dominantly bright coal. It lies approximately one metre below the main Leichhardt coal. The Vermont seam generally occurs as three splits; referred to, in descending order, as the Vermont seam, the Vermont Lower seam and the Vermont ply. Only the uppermost split, comprising 1.8 to 2.5m of clean, bright coal is considered economic. The middle split, averaging 1.6m in thickness, is visually clean but duller and high in inherent ash. The lower split, located immediately below the Yarrabee Tuff, is generally thin (average 0.7m) and produces low recoveries on washing. The upper and middle splits coalesce in the southern part of the deposit. Igneous intrusions are rare but where present are usually in the form of dykes preferentially emplaced along faults. Two occurrences of cindered Leichhardt seam and one of cindered Vermont seam have been encountered but the areas affected in each case are small. A seam splitting diagram is given as Figure 2. Geology is presented in Figure 3. Figures 4 and 5 show typical cross-sections.
COAL QUALITY
The coal at Daunia is low to medium volatile bituminous with moderate to low raw ash and low sulphur. The Leichhardt ply and Vermont seam produce good coking coals and the Leichhardt seam is capable of producing both thermal and coking fractions. Table 1 presents coal quality details for likely metallurgical and steaming products.
COAL RESOURCES AND RESERVES
Measured Resources have been calculated across the entire mining lease on seams considered to be economically recoverable. Details are as follows: Measured Resources (tonnes x 103) Seam 96 000 Leichhardt 5 000 Leichhardt ply 55 000 Vermont 156 000 TOTAL A relative density of 1.4 was used in the calculations.
From the above, Recoverable Reserves of 58.3Mt, to an overburden depth of 70m, have been established at a prime ratio of 7.6bcm/tonne. Bowen Basin 1995 - Symposium
278
--- -------------------------~------
DL1 RANGAL COAL MEASURES
LEICH HARDT SEAM
~-------------- ---
Leichhardt Seam
DL 1
Cl)
E CU C1)
en
(4.5 to 5.5m)
----------
CU 0
u
Leichhardt Ply
DL 0
c..,
E 0
c::
INTERBURDEN (10 to 35m)
0
c.., LU
Vermont Seam
DV2
DV4
Cl)
E
CU C1)
en
"cij 0
u
c..,
E 0
c:: 0 c.., LU
FORT COOPER COAL MEASURES
I
.c ::::,
en
INTERBURDEN (25 to 40m)
DG 0
GIRRAH SEAM
(15 to 30m)
DAUNIA
.BHP
Seam Nomenclature
Figure 2. Bowen Bas i n 1995 - Sy m po si um
279
E
8
0
8
8 N
~
.,
7 560000mN
'
\il ~
7 556000mN
DAU NIA GEOLOGY ;. -
• Fault, showing throw (m)
-
- Leichhardt Seam Subcrop Vermont Seam Subcrop RewanGroup Rangal Coal Measures Fort Cooper Coal Measures
0
2km
Figure 3.
Bowen Basin 1995 - Symposium
11 \j
l1
A
A1 250
250
LEICHHARDT SEAM
j : ....
Rewan Group
0
-
7',ng,1 - - Cool
"•'"'"'~"
100 .AL ...................................... ·······················································••f~·;:;:i•~:•;:;'•'i'f}::•:•:{•::::::::::,.:, ... _. '...... .
B
Rewan Group
JPJ#j)#fj@ffofPrn"··· ···""""""'''
"'""""~""'""J :: j
.•:•:•········· ••••
100
81 2001 150i
U'l
'<
!3
100
"O 0
...
'I>
s::
DAUNIA CROSS - SECTIONS
!3
:;?'
C 200
f
lll
Rangal Coal Measures
200
------- ------
Fault, showing relative displacement
1111 Rewan Group
c1
150 100
150 AL
100
lj)l)))l J Fort Cooper Coal Measures 50
0
Figure 4.
100
200
300
400
500 metres
so
.. !
281
L,
L
i
250
200
200
150
150
i
·=·. ·=·•.,_,_ •• •..,_..·=· . --"'---oo
__ .,:++.,.:.-s+:.:_::++_::-a+::;;.,.-'··=·.-c~-
100
,,,,J/\/::=:=·=······
50
50
·•.•.•.•-··
DAUNIA LONGITUDINAL SECTION -
Rewan Group
@[ii{ Ranga/ Coal Measures ::::=)} Fort Cooper Coal Measures 1000
2000fflltrN
Figure 5.
FUTURE PROSPECTS
REFERENCES
A deposit development strategy has been proposed which advocates the extraction of a large bulk sample to evaluate mining conditions and to provide coal for market acceptance trials. If successful, this initiative may develop into an on-going mining operation. Initial work relating to land acquisition, surface rights and environmental approvals has commenced.
MATHESON, S.G., 1990: Coal Geology and Exploration in the Rangal Coal Measures, North Bowen Basin. (,,lueensland Geology, 1. SEDGEMAN, J.B. & E.N., Milligan, 1975: Poitrel-Burton Downs District. In, Traves, D.M. & King, D. (Editors): Economic Geology of Australia and Papua New Guinea - 2: Coal. Australasian Institute of Mining and Metallurgy, Monograph, 6, 134-137. UTAH DEVELOPMENT COMPANY LIMITED, 1985: Daunia Project. In, Bowen Basin Coal Symposium, Geological Society of Australia Abstracts, 17, 279-282. BHP Australia Coal Pty Ltd.
Bowen Basin 1995 - Symposium
282
Bowen Basin 1995 - Symposium
283
THE ENSHAM COAL MINE LOCATION
The Ensham coal mine is located in the western part of the Central Bowen Basin, 200km west of Rockhampton and approximately 30km east- north-east of Emerald. The Capricorn Highway and the Central Railway line pass through the southern part of EPC505. Other mines that lie in close proximity to Ensham include Gordonstone, Gregory and Oakey Creek to the north and South Blackwater, Blackwater and Curragh to the east. The Togara North exploration area adjoins Ensham to the south and the Kingower exploration area adjoins Ensham to the west.
TENURE AND HOLDER
The Ensham deposit is currently covered by EPC505, EPC542, ML70049 and ML7459. The tenures are held by the Ensham Joint Venture comprising Bligh Coal Limited, Idemitsu Queensland Pty Ltd, and LG International Pty Ltd. The tenures are managed and operated by Ensham Resources Pty Ltd on behalf of the Joint Venture.
DEVELOPMENT HISTORY
The deposit was initially explored by the Geological Survey of Queensland from 1971 to 1982. The area was released by tender and Authority to Prospect (ATP) 426 was issued in 1984 to a joint venture of 15 companies. Exploration by the joint venture concentrated on the opencut areas in the east of the ATP and a number of feasibility studies were produced which examined various options for development. As individual companies reassessed their priorities, the number of joint venturer partners decreased. In 1990, EPC505 replaced A TP426 and a lease for the 290 sub-block area was reissued to the current Joint Venture. ML70049 "Yongala" covering an area of 1648 hectares within the Ensham North area, was granted in February 1993 and an opencut mine established to exploit the Pollux seam. ML7459 covering an area of 6108 hectares within the Ensham Central and South areas, was granted in May 1994 and opencut stripping in D and C Pits to extract the Aries-Castor (A2C) seam commenced in August 1994.
MINING METHODS
Overburden is removed by dragline and/or excavator. Coal is removed by loader or excavator and is currently hauled by bottom and rear dump trucks to a rail siding east of Yongala. Coal is crushed to a top size of 50mm by rotary breaker and railed a distance of 352km to Gladstone. The coal is direct shipment coal and no washing is required.
GEOLOGY
Structure
The controlling structural features of the Ensham EP are the Comet Ridge to the east, and a broad southwesterly plunging syncline which trends northeast across the central part of the EP. Strata dip towards the synclinal axis at generally less than 5 • although some areas of flat dip have been interpreted on the flanks of the syncline. Major folding is not apparent within the opencut areas but minor warps have been noted in the highwall exposures. The faulting identified or inferred to date has mostly been normal faulting with throws commonly less than 10m but with some throws up to 20m. Fault trends are mostly east-west to south-east-north-west. Some low angle thrust faults have been noted in the pit highwalls with the southern side invariably thrust over the northern side. The overthrust section is usually less than 30m horizontal with the vertical throw generally less than Sm. Some very minor drag effects have been noted in the immediate vicinity of the fault plane. A structural feature that has been noted at Ensham is the development of narrow graben and half-graben structures. The grabens are generally less than 30m across with throws of up to 20m on steeply dipping fault planes. Disturbance of the coal adjacent to the graben is negligible although the seam Bowen Basin 1995 - Symposium
284
• EPC505
·- ·-- ·7
i i
L_ __
I
I
j j
i :
, I I : I:
,I
r
_;--1.
,I
:I
I
I, -·I
.r·
! I ,
I
·rd ____ .Ji •
~<
""""'
I
~ c,Q ~~
or
I
•eo
- .~ _ho)
/
I
/
ENSHAM SOUTH
I
I
I
I
I
i !
I L._:_~ I
i i
°'· •.
,,,,.-;:::. /:J _ : - · ·\_··- ·
.r ·- ...... _,
·, ..\.. _.....-··--------_.,
/
-r--·· '--~-
.• ;__/ . !.
\
i
I j
i i i i i i
!' ~) (
,_,
.,.,_ ~ -- - -- ✓
,,..&·
i
i._ _ __ __ ____ __ ______ __ ____ _
_.I
~
:....
er-"~ ---/
·--. .... . .. )
i
- -- -:"
I
.. J,--~--- -' ··"
/
1··- .. __;
)
COMET
Bowen Basin 1995 - Symposium
2.5
2.5
0
Kilometres
5.0
/
/'
285
■ NSHAII PROC ■ as FLOWSH ■■ T
COAL QUALITY
LAND Cl.EARING AND TOPSOIL REMOVAL
REHABILITATION
DRIWNG
MINING COAL BY FRONT END LOADER
HAUL TO ROM STOCKPILE DRABUNE EXPOSES COAL
RECLAIM BY FRONT END LOADER AND DOZER FOR STOCKPILING AND MIXING
♦
•
l
~J\
ROLLS CRUSHER
-
r8+-~~ER • _ _ __ __
-50 x 0mm __,s,J
CONVEYOR
has been hardened significantly immediately adjacent to the fault plane. The half-grabens have a down-warp on one side terminated by a steep fault. The grabens and half-grabens appear to be of limited lateral extent. Stratigraphy
The coal seams at Ensham belong to the Late Permian Rangal Coal Measures. The Coal Measures are recognised throughout the area having a thickness of some 100m. The seams subcrop over a strike length of about 80km around the northern and eastern limits of the EP. The top of the Rangal Coal Measures is regarded as the transition from carbonaceous sediments to the fluvial sequence of green coloured, non-carbonaceous siltstones and lithic sandstones of the Triassic Rewan Group. Underlying the Rangal Coal Measures is the Upper Permian Burngrove Formation which comprises light blue-green coloured sandstones, greenish grey siltstones and mudstones, and banded coal seams which are frequently interbedded with fawn to light brown coloured tuff and tuffaceous mudstones. The major coal seams are developed within the upper part of the Burngrove Formation and include the thick Virgo and Leo seams. At Ensham, these seams have a thickness of 4-lOm and raw coal ash contents of 30-45%. Washability testing has indicated that the Fl.60 fraction has an ash content of around 13.5%, specific energy of 6650 kcal/kg (GAD) and a yield of 40-70%. Tertiary sediments unconformably overlie Permian and Triassic strata and generally consist of multicoloured claystones and quartzose sandstones with bands of ironstone and silcrete forming cappings on hills and ridges rising up to 80m above the surrounding land surface. Bowen Basin 1995 - Symposium
286
GENERALISED STRIKE SECTION AND SEAM CORRELATION DIAGRAM ENSHAM OPENCUT AREA
@:IR'.]@[X]&[Ml @@(l!J'u'[X]
MR 1
r
;~;;;;.;~■1~t; ~I-i.sv~i"'= =,., ., =._._ ~ ~miii••~ IINUIIIII RINPUII
PIT TDIIW
PIT D
PIT C
I
i (FUTURE)
PIT A (FUTURE)
Coal Seam Development
Correlation of all seams within the tenements has been based primarily on wireline log response. The main seams developed within the Rangal Coal Measures at Ensham are, in descending stratigraphic order, the Aries (A), the Castor (C), and the Pollux (P) seams. The splitting and coalescing of some of these seams gives rise to a number of other seams. The generalised strike section and d iagrammatic seam correlation diagram demonstrates the nature of the splitting/ coalescence and presents the seam nomenclature system that has been developed for the opencut area. Within the Ensham Central and Southern areas, the principal seams developed are the A2C and A22C seams formed from the coalescence of an Aries 2 seam and the underlying Castor seam. These seams have an average thickness of 5.3m and 5.0m respectively and have been identified over a strike length of some 11.5km. Based on quality parameters, the seams are subdivided into a top ply (±1.0m thick), a middle ply (±3.Sm thick) and a bottom ply (±0.4m thick). The bottom ply is separated from the middle ply by a mudstone band that varies in thickness from 0.20m thick to over 0.40m thick. Where the mudstone band is greater than 0.3m thick, the bottom ply is referred to as the C22 seam. Depth of weathering ranges from 10m to 20m. At Ensham North, the Pollux seam becomes cleaner over a strike length of approximately 5.5km. The seam averages 2.6m thick and is currently being mined from the Yongala Pit. In the north of Yongala, the Pollux seam coalesces with the Castor seam to produce a Castor-Pollux seam with an average thickness in excess of 4m. The depth of weathering at Yongala averages 21m.
COAL QUALITY
A variety of thermal and soft coking products can be produced from the various Rangal seams at Ensham. Because of the direct shipping nature of the coal, quality control of mining, stockpiling and blending operations is essential to ensure Ensham continues to meet its various contract Bowen Basin 1995 - Symposium
287
ENSHAM COAL
I
TYPICAL SEMI-SOFT COKING COAL QUALITY
TYPICAL THERMAL COAL QUALITY
(ISO STANDARDS)
(ISO STANDARDS)
TOP
MIDDLE
10.0
11.0
adb
adb
Moisture Ash Volatile Matter Fixed Carbon
4.0 13.0 25.5 by diff.
4.0 9.5 26.5 by diff.
Total Sulphur Phosphorus
0.60 0.05
0.60 0.05
SPECIFIC ENERGY Gross kcaVkg
6700
7000
HGI CSN
57 0-1
57 0-1
-50
-50
1400 1550 +1600
1400 1550 +1600
59.9 30.5 1.0 4.1 1.5 0.4 0.7 0.5 0.8 <0.02 0.2
48.8 34.3 1.0 7.8 3.2 0.6 0.9 0.3 1.2 <0.02 0.5
84.2 5.0 1.9 0.6
83.6 4.9 1.9 0.7
db
adb 9.0 - 10.0
Total Moisture (%, ar)
Total Moisture %, arb PROXIMATE ANALYSIS (%) Moisture Ash
Volatile Matter Fixed Carbon Total Sulphur Phosphorus
SPECIFIC ENERGY Gross kcaVkg Gross AR kcaVkg OAF kcaVkg
4.0-4.5 8.0-8.5 29.0-30.0 by diff.
8.3-8.9 30.2-31.4 by diff.
0.5-0.6 0.04-0.10
0.52-0.63 0.042 - 0.105
7100- 7300 6690-6920 8070-8390 60
HGI Size
PROXIMATE ANALYSIS (%)
-30
(mm)
Size Si02 Al2O3 T.02 Fe2O3
eao MgO
Na2O K2O P205 Mn304 SO3
Carbon Hydrogen Nitrogen Sulphur
56.5 26.7 1.1 7.5 2.9 1.2 0.3 0.8 2.2 <0.02 0.4
(%, daf) (%, daf) (%, daf) (%, daf)
84.0 5.1 2.0 0.6
FLOW TEMPERATURE +1500
CSN
5-7
GRAY-KING COKE TYPE E-G
GIESLER PLASTOMETER Initial Softening Max Fluidity (deg C) Max Fluidity (dd/min) Resolid Temp (deg C) Plastic Range (deg C)
(mm)
Ultimate Analysis
Ash Analysis (%)
405-410 450 50-120 470-480 60-75
DILATOMETER Initial Softening (deg C) 405 - 410 445 Max Contraction (deg C 475 Max Dilatation (deg C) 40 Max Contraction (%) -16--22 Max Dilatation (%)
PETROGRAPHICS Vrtrinite% liptinite % lnertinite % Semifusinite Micrinite % Macrinite % Fusinite % Minerals% Rv (max) %
65.0- 77.0 2.1 - 2.3 18.0 - 26.0 10.0 - 18.0 0.2-0.4 0.8-0.9 1.5-2.0 2.5- 10.0 0.85-0.86
Ash Fusion Temperatures (Reducing Atm. degrees C ) IDT HOT FT
Ash Analysis (%) SiO2 Al2O3 T.02 Fe2O3 CaO MgO
Na2O K2O P205 Mn304 SO3
Ultimate Analysis Carbon Hydrogen Nitrogen Sulphur
(%, daf) (%, daf) (%, daf) (%, daf)
specifications. Currently Ensham markets two thermal products, differentiated on ash/ energy specifications, and a semi-soft coking coal. Typical specifications for these products are presented in the accompanying table. The versatility of the coal and the simplicity of the mining/ coal handling operation allows Ensham several options by which to meet specific quality requirements. Ensham has a commitment to environmental responsibility and to ensuring that our products meet customer requirements. To assist with these goals, Ensham has gained accreditation to 1SO9002. Bowen Basin 1995 - Symposium
288
COAL RESERVES AND RESOURCES
Mineable in situ reserves have been calculated for the A, B, C and D pits from the LOX to th e 60m coverline, at 79.28Mt. There are also significant underground reserves available. Yongala reserves are calculated as approximately 30Mt mineable in situ with considerable additional reserves available for extraction by underground mining methods. It is estimated that there is an in situ resource of >1Bt in seams >3m in thickness (up to 6m in thickness) within EPSOS and EP542.
FUTURE DEVELOPMENT
Stage three opencut mine development is designed to lift production from the current 1.7Mt per annum to 3.6Mt per annum. Exploration of the vast underground resource is continuing.
Allan R Dawson Manager Exploration and Coal Technology Ensham Resources Pty Limited
Bowen Basin 1995 - Symposium
289
GOONY ELLAIR IVERSID E MINE LOCATION
The Goonyella/Ri verside mine is located some 30km north of Moranbah and 200km west south-west of Mackay (Figure 1). The mining leases cover approximately a 20km strike length of the Moranbah Coal Measures (MCM) with the economic seams continuing northwards into the North Goonyella Mine and southwards into the Moranbah North area . There is a rail link from Riverside and Goonyella to the ports of Dalrymple Bay and Hay Point.
TENURE AND HOLDER
The Goonyella/Ri verside mine is a combined operation of the Central Queensland Coal Associates' (CQCA) Goonyella Mining Leases 1736 and 70038 BHP and Mitsui Coal Pty Ltd's (BHPM) Riverside Mining Leases 1764, 1802 and 1900.
DEVELOPMENT HISTORY
The economic coal seams at Goonyella were discovered in the 1960s by the Utah Development Company during a regional exploration programme which covered most of the western edge of the northern Bowen Basin. The programme involved extensive traverse drilling and was carried out under Authorities to Prospect (A to P) 6C and 67C. At about the same time, Thiess Peabody Mitsui Coal Pty Limited, the predecessor of BHPM, located an extension of the Goonyella se<!ms in its adjoining A to P 3C. Development drilling at Goonyella was completed in 1968, confirming the feasibility of establishing a large open-cut coal mine. Goonyella mine commenced operations in 1971 at an initial capacity of 4.4Mt per annum and has since expanded to 7.0Mt per annum of product coking coal. Initial mining took place in the Goonyella Middle seam with Goonyella Lower seam contributing to output from 1983. Mining began at Riverside in 1983 with an annual production of 3.3Mt, mainly from the Goonyella Lower seam. Following BHP's acquisition of the Utah Development Company in April 1984, the management of both mines became the responsibility of BHP-Utah Coal Limited, since renamed BHP Australia Coal Pty Limited. In March 1989, Goonyella and Riverside mines merged operationally. The coal from each mine is still marketed separately by the relevant joint venture parties.
MINING METHODS
Coal is mined at both Goonyella and Riverside by open-cut, strip mining methods. At Goonyella, five draglines are assigned to overburden removal. A bucketwheel excavator and associated conveyors commissioned in 1982, are used to assist in pre-stripping. Two truck-shovel stripping fleets also operate at the mine. The coal is mined by a coal shovel or wheel loaders and transferred to coal haulers, with capacities of 150-220t, for transport to the breaker station. ROM coal is beneficiated at the central processing plant by heavy medium cyclones, spirals and flotation cells. At Riverside, overburden removal is carried out by three draglines supplemented by a truck-shovel fleet. Coal is mined by either a coal shovel or a wheel loader and transported to the breaker station by a fleet of four 220t coal haulers. As at Goonyella, the preparation plant utilises heavy medium cyclones, spirals and flotation cells to clean the coal. Bowen Basin 1995 - Symposium
290
Collinsville ■
A.
LEGEND Operating Mine Deposit
Eungel/a Dam
Nebo West Extended
IRIVERSIDE
22° 1 - - - - - - - -
REGIONAL
~~~1:~4 Figure 1. Bowen Basin 1995 - Symposium
291
The Goonyella mine is divided for operational purposes into seven pits named, from north to south, Red Hill, Cleanskin, Riverside, Eureka, Broadmeadow, Isaac and Railway. The Riverside mine is divided into blocks A to J, with I omitted, running consecutively from south to north.
GEOLOGY
The Goonyella/Riverside mine is located on the western flank of the northern Bowen Basin on the stable Collinsville Shelf. The Upper Permian coal-bearing strata are relatively undisturbed and dip gently to the east at 3 • to 5 •. The economic coal seams occur within the MCM which are conformably underlain by the German Creek Formation, and conformably overlain by the Fort Cooper Coal Measures. The German Creek Formation in this area contains labile and quartzose sandstones, siltstones and rare thin coal seams. The Fort Cooper Coal Measures are characterised by labile sandstones and siltstones and thick, heavily banded, poor quality coal seams. The MCM comprise labile sandstone, shale, mudstone and siltstone with several thick coal seams and rare tuffaceous beds. A coal seam correlation diagram is presented as Figure 2. The coal seams of economic interest are the Goonyella Upper seam (GUS), the Goonyella Middle seam (GMS) and the Goonyella Lower seam (GLS). Mining is currently restricted to the GMS and GLS. The coal seams are consistent over large areas but are subject to occasional seam splitting and rejoining. The Goonyella Upper seam in the north (GUO) is 4-Sm thick and comprises a l.1-l.2m thick, heavily stone-banded upper ply of dull to dull-banded coal; and a clean, 3.l-3.8m thick, lower ply of interbanded to bright-banded coal. To the south it splits into GU3 and GU2 with the GU3 split coalescing with GUS in the central to southern areas to form the 4-Sm thick GUl. The GUl comprises a stone-banded upper ply of dull-banded to interbanded coal, a heavily stone-banded middle ply of dull coal, largely equivalent to the upper
South
North
Diagrammatic Only
Seam Correlatlon Diagram
Figure 2. Bowen Basin 1995 - Symposium
292
ply of GUO; and a clean lm thick, basal ply of interbanded to bright-banded coal. The Goonyella Middle seam in the north (GMO) is 9-lOm thick. In central areas GMO splits into GMl and the thin GM2 rider seam. Average thickness of GMl is 6-7m. GMO and GMl can be divided into four plies based on increasing coal brightness from top to bottom. These are: •
A stone-banded 1.2-2.2m upper ply of dull coal;
•
A clean, 1.5-2.Sm ply of dull to dull-banded coal;
•
A 1.9-2.6m ply of mainly dull-banded to interbanded coal with a thin mudstone parting in the upper O.3m and three thin partings in the basal O.5m; and
•
A 1.7-2.8m basal ply of bright-banded coal with two thin, centrally located mudstone partings. In the north, an additional O.7m of bright coal containing three mudstone beds occurs at the base of the seam.
The Goonyella Lower seam is 5.7-6.9m thick in southern areas (GLl), coalesces with the rider seam (GL4) to form the 8-9m thick GLO in central parts; but splits again farther north to form the 6m thick GL6 and the 3m thick GL7. The GLl and GLO contain a stone-banded upper section of dull coal with minor bright bands; and a persistent, 1.6-1.8m thick basal ply of mainly bright-banded coal. GL4 and GL6 are stone-banded with predominantly dull to dull banded coal. Typical coal brightness profiles and ply correlations for each of the three main seams are presented in Figures 3 to 5. Geological structure at Goonyella/Riverside is characterised by shallow dips and low frequency, small throw, reverse, normal and thrust faults and low amplitude monoclines. Fault throws rarely exceed seam thickness with a
37414
+---------G~--------
-
Bright
-
Bright Banded
.:J
u
37368
lnterbanded Dul/Band8d
□ D1.11/, minor brights
□ Dull ~ Carbonaceovs
l:::..==i mudstone
b-=-~ §· ·-3
Rt#!
Mudstone
Siltstone Sandstone
~ Coreloss
NORTH
SOUTH
GOONVEUA UPPER SEAM BRIGHTNESS PROFILES AND PLY CORRELATION 1993 PRIORITY DRILLING
Figure 3. Bowen Basin 1995 - Symposium
e
{II
... s::
0
e "0
'<
Cl'J
\0 \0 U1
= ,...
{II
...
Ill
= Cd
~
G)
l
n>
~
I l
~
G)
Cd
0
:i
C
0
(/)
~
--J
I\) (X)
SAMPLE 25714
SAMPLE 25707
SAMPLE 25706
SAMPLE 25655
SAMPLE 25705
SAMPLE 25654
SAMPLE25704
SAMPLE 25653
I\) (X) .. iii(X)
=
t•:-:-:,:,:,:-:-:-:•:❖ ~
p.i..--~-:?m~8:::: u)
==::JJoni:::::=:__ -LU:=--nw.:=----- l----=------l-_J__ _.k'.'._~Zl2
SAMPLE 25656
.
.
----
~
- - - - - - - - - - - - + - - ~ - - -- - ------.------+--....L.....L..LJ-....._._----L. .L...-..1-..1....L...L..u.......J...
.
I\)
.....
~
-..J
u)
'"r1 ....
!3
!3
fl)
0
""... r::
..,.__ _....,>--SAMPLE 25722
...
'<
.,."'~-
~
~
r
G)
I
~
z
0
tll
(SI
(JQ
sAMPLE 25716
SAMPLE 25657
SAMPLE 25721 - --"'1 - - - - -~ - - --'->--- -..i..__-..i..SMPLE 25719 SAMPLE 25720 SAMPLE 25717 SAMPLE 25718
SAMPLE 25661 - -.i..- - i - - - ----+1..:SA ::..::M :.::...Pl.::::;E~SAMPLE 25658
~ .... ....
w
t-:i ~
r,Q
295
TABLE 1. TYPICAL PROPERTIES OF PRODUCT COAL. Goonyella
Riverside
1.0% 10.0% 24.7% 8.9% 0.55% 8 0.025% 1.1%
1.3% 9.5% 23.8% 9.8% 0.58% 7.5 0.007% 1.3%
405"C 455"C 495"C 90 1400ddpm
410"C 460"C 495"C 85 900ddpm
Softening Temperature Max. Contraction Temperature Max. Dilatation Temperature Max. Contraction Max Dilatation
375·c 425"C 470"C 26% +120%
385"C 430"C 470"C 25% +85%
Petrographic Analysis Mean Max. Reflectance of Vitrinite
1.12%
1.17%
63% 1% 22% 10% 4%
60% 1% 22% 12% 5%
Chemical Analysis Moisture (air dried) Total Moisture (as received) Volatile Matter (air dried) Ash (air dried) Sulphur (air dried) Crucible Swelling Number (FSI) Phosthorus (in coal) Alka i (in ash)
Gieseler Plastometer Initial Softening Temperature Max Fluidity Temperature Resolidification Temperature Plastic Range Maximum Fluidity
Ruhr Dilatometer
Macera! Composition Vitrinite Exinite Semi-Fusinite Other Inertinite Mineral Matter
maximum of 20m recorded on the Eureka Fault to the south of Eureka Pit. Fault trends are mostly east-west and north-south, with a north-westerly orientations dominating in the far south. Igneous intrusions are rare. A few thin, (<2m) east-west trending altered to fresh, dykes have been located, as have two sills along the eastern boundary of the Goonyella lease. In the north, a thick sill occurs some 150m above the GUS, and in the south, two holes have intersected an intruded and coked GMl seam. Poorly consolidated Tertiary and Cainozoic deposits overlie the Permian sequence. In the south, sands, silts and clayey sands associated with the Isaac River reach 25m in thickness. In the north, Tertiary sediments are more extensive and include remnant basalt flows. The Tertiary is normally 30-40m thick but thickens to over 80m in a deep channel along the northern lease boundary. General geology, seam subcrops and structure are presented in Figure 6.
COAL QUALITY
Goonyella and Riverside are both one product mines supplying prime hard coking coal to the export market. Current product specifications are listed in Table 1. The coal is medium volatile bituminous, low in phosphorus and has a high fluidity. There is an increase in coal rank from the upper to the lower seams and from west to east.
COAL RESOURCES AND RESERVES
In situ coal resources in seams greater than 0.7m thick to 60m depth and > I.Sm thick beyond 60m depth, as at 31 May 1995, stood at: Resource Category
Goonyella (txl03 )
Riverside (txl03 )
Inferred Indicated Measured
0 243 345 1 304 560
0 0 47 423
Coal quality cut-off was 50% plant yield at product ash.
Bowen Basin 1995 - Symposium
296
Section A-A 1 I
... ', I
;'... I
I I I I I
Section 8-8 1 Tertiary Cover
~
. . ..
"""''>i-•..,_ ~ Moranbah
•
~""""J::'~ ·• .•. ·""IIOb. • . .
Coal Measures
Section C-C 1 ,v;;iiiiZ~'ivv'~E~~~~~:;;;;:;:;;:~;:%w!l
Tertiary Cover
Moranbah ~
J~···. ·•·· . ,J~ ,:: ''H:~·ti·: j<f,::: ==:,,
,
Coal Measures
Section 0-0 1 Tertiary Cover
"""'-::".,,~-;:J.J,;:::::-.....;; Moranbah Coal Horizontal Scale
Measures
qL..._..,_1_..1.5_ __.9_ _,jkm 0
Measures
200
400
Vertical Scale
Figure 6. Bowen Basin 1995 - Symposium
600m
.BHP
297
Open-cut coal reserves have been calculated to a depth of 90m except for the Lower seam in Red Hill and Cleanskin Pits where a 120m limit was applied . At 31 May 1995, based on the same seam thickness and coal quality criteria listed above, reserves totalled: Factor used in resource and reserve calculations were:
FUTURE DEVELOPMENT
Reserve Category Mineable In situ Recoverable Marketable
Goonyella (tx10 3 ) 213 614 189 516 142 535
Riverside (txl0 3 ) 47 423 42 480 , 28 791
Goonyella has sufficient open-cut reserves to sustain current operations for at least another 20 years. Underground resources are very large and are Riverside Goonyella Parameter 1.4 1.39 to 1.36 Specific Gravity 90.0 88.7 Mirung Recovery(%) Yield Fl.45 x 0.87 75.2 Wash Plant Recovery(%) 1.5 1.0 to 1.3 Moisture Content (% ad)
presently being evaluated to initially supplement and eventually replace open-cut production. Deep exploration drilling has been carried out both within Mining Lease 1763 and in the adjacent Exploration Permit for Coal No. 554 Red Hill, acquired by CQCA in 1994. Riverside reserves are expected to be fully depleted within 10 years. It is planned to replace production progressively from 2000 with underground coal derived from the BHPM Wards Well deposit, Mining Lease 1790 located some 20km to the north.
BHP Australia Coal Pty Ltd.
Bowen Basin 1995 - Symposium
298
Bowen Basin 1995 - Symposium
299
GORDONSTONE MINE INTRODUCTION
Gordonstone Mine is located 48km north-east of Emerald and 354km by rail from the Port of Gladstone. It is owned by a co-venture between ARCO Coal Australia Inc., Mitsui Gordonstone Coal Management Pty Ltd and MLC Coal Investment Pty Ltd. Gordonstone Coal Management Pty Ltd, a wholly owned subsidiary of ARCO Coal Australia Inc., is the operator of the mine. The Gordonstone Coal mining lease (ML1978) lies within the initial Authority to Prospect (A to P 389c, later EPC 389) which adjoins BHP (Gregory and Crinum) to the north and the Ensham deposit to the South. ML 1978 encloses an area of 5840ha while EPC 389 covers an additional 20 350ha. ML 1978 was granted on April 12, 1990 and construction commenced on August 1, 1990. The initial underground development commenced in March 1991 and the first longwall commenced operating on April 19, 1993. Gordonstone production in 1994 was 3.96Mt and the accumulacive ROM production to the end of June 1995 was 8.lMt.
EXPLORATION HISTORY
Coal was reported in the Emerald area from water bores (Veevers and others, 1964) and during the late sixties several companies were granted Authorities to Prospect primarily to explore for areas of open cut coking coal. In 1966 Bellambi Coal Company undertook a small exploration programme in A to P 27C, part of which encompassed Gordonstone. Mount Isa Mines Ltd was subsequently granted A to P 42c and in 1968 two holes were drilled within the present Gordonstone area. During the period 1971 to 1975 the Queensland Department of Mines completed 37 drill holes in the Gordonstone area of which 29 holes intersected the German Creek seam(Park & Galligan, 1974). In 1982 Denham Coal Management were awarded the area as A to P 389c. In 1987 ARCO Coal Australia Inc. entered the project and in 1990ML 2251 (later ML 1978) was granted. Since 1982 a total of 835 drill holes have been completed in ML 1978 and EPC 389 with an aggregate meterage of 200.4km.
GEOLOGY
Gordonstone Mine is located in a relatively undeformed and stable area of the Bowen Basin. The mine lies on the western limb of the gently dipping Talagai Syncline which gently plunges south-west between the Capella Block to the north-west and the Comet Ridge to the east. Hence the regional dip in ML 1978 is generally south or south-east. ML 1978 contains gently folded Permian strata unconformably overlain by flat lying Tertiary and Quaternary sediments. The Permian strata in ML 1978 comprise the Blackwater Group and Back Creek Group. Within the coal bearing sequence the Fairhill and German Creek Formations contain the majority of the coal seams. The coal measure sequence is overlain by Tertiary volcanics and sediments which average 65m in thickness and range up to 110m. As many as eight distinct basalt flows can be recognised in the Gordonstone area (Hanna, 1985) and these are often interbedded or underlain by clay and water bearing sand/gravel beds. The main Tertiary aquifers are the basalts and the basal sand/gravel beds. Airlift water flows of more than 30L/s have been achieved from these aquifers. The Fairhill Formation. which averages 100m in thickness, contains lithic sandstones with numerous interbeds of siltstone or claystone as well as four coal horizons. The coal seams have no current economic significance. The Macmillan Formation is a marine sequence at the top of the Back Creek Group. It averages 45m in thickness and consists predominantly of siltstone with interbeds of lithic sandstone in the basal 20m . Bowen Basin 1995 - Symposium
300
The upper German Creek Formation averages 120m in thickness and is dominated by quartz lithic sandstones with minor siltstone interbeds and up to eight coal seams. The German Creek seam, which is the only seam suitable for underground mining, ranges in thickness from 1.8m to 4.0m with an average of 3m. The mine lease is bounded on the east by a major fault zone, the San Michelle Fault which trends north-south and is downthrown (50m to 70m) to the west. This complex fault zone extends north into Gregory and probably south into Ensham. The remaining mining lease is divided by a north-south trending fault, the Ti-Tree Fault. The Ti-Tree is a high-angle reverse fault downthrown to the east (6m to 30m). Elsewhere the Permian strata are relatively undeformed with generally dips of 1·to30, increasing to 6 • toward the subcrop. No igneous intrusions have been intersected by drillholes or current workings. In some areas sedimentary or elastic dykes have been intersected in the current workings and most have consisted of weak clayey sandstone. Within ML 1978 the depth of cover for the German Creek seam range from 80m to 400m. The current mining depths at Gordonstone range from 230m to 280m. The dominant horizontal stress direction in the mining area ranges from NNW to NNE. The dominant coal cleat and strata joint directions are NE. The current longwall blocks have been aligned sub-parallel to the dominant stress direction.
COAL QUALITY
Gordonstone produces two products: a high volatile, low ash, high fluidity coking coal and a medium ash, high energy steam1coal. Typical product quality is shown in Table 1 and Table 2. Within the mining lease the quality of the Getman Creek seam is relatively uniform. Reflectance varies from 0.95 in the west to 1.05 in the east. Ash values are higher to the east due to basal seam splitting.
TABLE 1. GORDONSTONE TYPICAL COKING COAL QUALITY TOT AL MOISTURE . ... %
.. . ARB . . . . . . . . . 8.0%
ASH . . . . . . . . . . ... %
. .. ADB
... .. 6.5%
VOLATILE MATTER ... %
.. . ADB
33% - 34%
CSN ... . . . . . . . . . . . . . . . .
.. .. 8-9
TOTAL SULPHUR . ... %
.ADB
0.70%
PHOSPHORUS .... . .. %
.ADB
0.02%
GIESELER FLUIDITY . . . . . . . . . . . ddpm .... 20 000 Plus TOT AL DILATATION .. % . . . . . . . . . . . . . . 150% Plus REFLECTANCE . . . . . . % . . . . . . . . . . . . . . . . . 0.93% TABLE 2. GORDONSTONE TYPICAL STEAM COAL QUALITY TOT AL MOISTURE . ... % . . . . . . ARB . . . . . . . . . . 8.0 ASH . . . . . . . . . . . .. %
. . . .. ADB
.. .. 13.0
VOLATILE MATTER ... %
. . . . . ADB
... 30 - 31
TOTALSULPHUR
.. %
. . ... ADB
. . . . . 0.8
SPECIFIC ENERGY
. . kcal /kg . . ADB
.... 7100
.. Btu/lb . . . . . . . . . .
12 780
.. Kcal/kg . . GAR
. 6496
. . Btu/lb ... GAR
11 693
ASH FUSION TEMPERATURE INITIAL DEFORMATION °C . . . . . . . . . . . . . . 1600 HARDGROVE GRINDABILITY INDEX . . . . . . . . . . . . 54 Bowen Basin 1995 - Symposium
301
COAL RESOURCES
Within ML 1978 and EPC 389 Gordonstone holds large reserves of coking and steaming coal in the German Creek seam. Due to the thick Tertiary cover the area is only amenable to underground mining. The Mineable In Situ Reserves for ML 1978 are 190Mt. The estimated In Situ Resources for EPC 389 exceed 700Mt.
GEOLOGICAL FACTORS INFLUENC ING UNDERGR OUND MINING AT GORDONS TONE Access to the German Creek seam by drift or shaft through the Tertiary sequence posed problems at Gordonstone due to extreme variation in rock strength, instability of strata (swelling clays and unconsolidate d sand/ gravel beds) and high water flows from the basalts or sand/gravel aquifers. During initial development of LW 101 and LW 102 gateroads higher than expected roof deformation was experienced. Two falls occurred during gateroad drivage and many intersections deformed excessively. The first installation road, although intensively supported, collapsed before drivage was completed. There was also a stability problem in the single roadway left behind by the first longwall. This was to be the next tailgate and was undergoing massive floor heave, rib spall and roof deformation. Thin section descriptions and X-Ray diffraction of roof and floor strata from LW 101 and LW 102 were completed. These indicated that the rocks were clay rich in both the large grains and in the cement or matrix. Additional strength tests of roof and floor strata suggested that some earlier test samples were allowed to dry out, resulting in higher strength results than if they had been tested in an original condition. These results and the observed deteriorating conditions described above had indicated that a re-assessment of the strata control approach was required . Subsequent changes in the primary and secondary roof support for LW 103 significantly reduced roof problems during the development and mining of LW 103. Management of changing roof and floor conditions will continue to provide a challenge to the operators of Gordonstone into the future. An adequate understanding of the conditions will require a high level of geophysical and geotechnical investigation.
POSTER DISPLAY
REFERENCES
The display shows the location of the mine, the geological setting and the position in the stratigraphic succession of the Bowen Basin. A plan showing a proposed mine layout and major geological features is also included.
• HANNA, P.J. 1985: Tertiary geology of the Gordonstone area. In, Proceedings of Bowen Basin Coal Symposium, Rockhampton . Geological Society of Australia, Abstracts, 17, 115-119. KELLY, M., LAWRENCE, W. & DEVEY, D.M. 1994: Roof Control at Gordonstone leads to Australian records. Australasian Institute of Mining and Metallurgy, Bulletin, 6, 51-57. PARK, W.J. & GALLIGAN, A.G., 1974: Coal Exploration, South Central Bowen Basin, Emerald area, Stage III drilling. Geological Survey of Queensland, Record, 1974/10.
VEEVERS, C.I., MOLLAN, R.G., OLGERS, F. & KIRKEGAARD, A.G. 1964: The geology of the Emerald 1: 250,000 Sheet area, Queensland. Bureau of Mineral Resources, Geology and Geophysics, Australia, Report, 68. OM Devey Gordonstone Coal Management Ply Ltd Bowen Basin 1995 - Symposium
302
Bowen Basin 1995 - Symposium
303
THE GROSVE NOR COAL DEPOSI T (EPC 552) LOCATION
The Grosvenor coal deposit is located 190km south-west of the coastal city of Mackay (Figure 1). The town of Moranbah, with a population of approximately 7 000 is centrally located within the area. The area is connected to the coast by the Peak Downs Highway, and by the Goonyella rail system to the coal loading facility at Dalrymple Bay. Moranbah airport to the south of the town is capable of handling small jet aircraft. Local access consists of a series of sealed roads supplemented by a number of graded and ungraded tracks.
EXPLORATION HISTORY
The prospect was explored by Utah Development Company Ltd (UDC) with the intention of locating areas with open cut coking coal. The area was relinquished because the thick cover of Cainozoic sediments and basalt made it unattractive for open cut mining. Departmental drilling in the period 1973 to 1978 was undertaken in the area to investigate potential underground resources within the Moranbah Coal Measures. Thirty cored holes drilled during this period are located within the area. Based on this exploration, several possible 'windows' were inferred in the Tertiary basalt over areas with open cut resource potential. In 1981, a programme of 69 holes was undertaken by the DME to ascertain the presence and define the extent of these potential open cut areas. It was also intended to determine which of the proposed Blair Athol-Goonye lla rail spur routes would sterilise the least coal resources. The area was one of twelve Bowen Basin coal areas offered for tender by the Queensland Government in 1993. It was named "Moranbah RA 284". Shell acquired the area in early 1994 as Exploration Permit for Coal 552. The deposit was renamed Grosvenor in order to avoid confusion with the adjoining Moranbah North deposit, which is also held by Shell. Initial activities have been the coding of previous borehole descriptions so that the information can be used on the Shell computer system. Black and white aerial photography was obtained covering the area. This photography together with ground survey control was used to prepare a digital terrain model and digital mapping data.
GEOLOGY
The coal measures of the Moranbah-Pea k Downs area occur on the Collinsville Shelf, a stable tectonic environment adjacent to the western cratonic margin of the basin. The strata have shallow dips to the east and have undergone limited structural deformation (Figure 2). No interpretation of localised faulting has been made using the current drill hole data. Stratigraphy
The coal seams of the Grosvenor deposit are contained within the Moranbah Coal Measures of the non-marine Blackwater Group (Figure 2). The underlying Back Creek Group is a dominantly marine sequence. To the south, the Moranbah Coal Measures intertongue with the MacMillan Formation and the upper part of the German Creek Formation. In the Grosvenor area, the Moranbah Coal Measures overlie the German Creek Formation, and are overlain by the Fort Cooper Coal Measures. The boundary between the Fort Cooper Coal Measures and the Moranbah Coal Measures is placed at the base of the lowermost interval of abundant tuff beds. Coal seams of economic significance are contained in the Moranbah Coal Measures throughout the area. The seams of the overlying Fort Cooper Coal Measures contain numerous tuff beds, have a high inherent ash content, and are not of economic significance. The stratigraphic relationships between the Moranbah Coal Measures and contiguous rock units in the Bowen Basin are shown below. Bowen Basin 1995 - Symposium
304
COLLINSVILL .
l
N
NEWLANDS
NORTH GOONYELLA RIVERSIDE GOONYELLA MORANBAH NORTH ~-"!'Y✓-. GROSVENOR
BLAIR ATHOL RWICH P GERMAN C OAKYCR GREG
·-:·
ARRABEE Rockha LINBAH EAST H
~ COKING COAL
SOUTH BLACKW
~:::::~:::~ COKING & THERMAL COAL (:.:_:_:_:;:j THERMAL COAL •
OPERATING MINE
C
PROSPECT
...._. COAL PORT
~
POWER STATION
..... THEODORE NORTH THEuDORE SOUTH
Figure 1. Locality map. The German Creek Formation consists of predominantly quartzose sandstones, silty sandstone, mudstone, carbonaceous mudstone and coal. The Moranbah Coal Measures range in thickness from 250 to 330m and contain eight seams which split and coalesce to form up to 16 coal horizons. A persistent tuff bed situated near the middle of the sequence at the level of the P seam is present throughout the area. The marker horizon is referred to as the "P Tuff" . The Fort Cooper Coal Measures comprise mudstone, siltstone, sandstone and coal, with abundant tuffaceous mudstone and tuff intervals. The abundance of tuffaceous material readily distinguishes the Fort Cooper Coal Measures from the underlying Moranbah Coal Measures. The thickness and extent of Cainozoic cover over most of the Grosvenor area precludes the possibility of surface mining. An area near the southern boundary contains shallow resources of the Harrow Creek and P seams with little Cainozoic cover, although existing tenure and local infrastructure impinge upon the majority of this resource. Throughout the area, coal seams subcrop beneath an irregular veneer of basalt and poorly consolidated sediments up to 150m thick. These sediments consist of sands, silts and clays, and are dispersed throughout the basalt flows. The basalt is partly vesicular Bowen Basin 1995 - Symposium
305
SEAM NOMENCLATURE, MORANBAH COAL MEASURES GERMAN CREEK FORMATION
NORTH
SOUTH FORT COOPER COAL MEASURES
GERMAN CREEK FORMATION
MORANBAH COAL MEASURES
Q/GU Seam PSeam
RSeam QSeam PSeam
RSeam QSeam PSeam
Goonyella Middle Harrow Creek seam Harrow Creek Seam seam Harrow Creek Lower seam Dysart Upper seam
Goonyella Lower seam
Dysart Lower seam
MORANBAH NORTH
GROSVENOR
MSeam Lseam
Dysart seam
Tieri Seam Harrow Creek Lower seam • Dysart Rider seam • Dysart seam
SARAJI
NORWICH PARK
Harrow Creek Lower seam
and usually contains zones of weathering. Most of the Cainozoic sediments are weathered with the base of weathering commonly extending a few metres into the underlying Permian strata. Igneous Intrusions Towards the northern extent of the Bowen Basin, the presence of igneous intrusions of Cretaceous age is a common occurrence. The incidence of these intrusions decreases to the South. Intrusions were intersected in only a few drill holes in the Moranbah-Peak Downs area and in view of the low incidence of intrusions in adjacent mines, it is unlikely that there will be large areas of coal affected by these features. Coal Seam Geology Seams of the Fort Cooper Coal Measures were intersected in only a few drillholes. These seam are typically banded and are of variable thickness (up to 60m). The basal coal horizon in this sequence is referred to as the Fair Hill seam in this area. In the Grosvenor area, the major coal seams occur in the Moranbah Coal Measures. These are discussed in ascending stratigraphic order below. The Dysart Lower seam is the lowermost seam of significance in the Moranbah Coal Measures, and averages 3.3m in thickness. The Dysart Rider seam contains a number of stone bands which are persistent over the area and are used to delineate the coal plies. The seam splits into the Dysart Rider I and Dysart Rider 2 seams. The Dysart Rider I seam averages 1.3m thick while the Rider 2 seam averages 1.2m thick, although in much of the area the seams were thin and of poor quality. Where the seams coalesce, the resulting Dysart Rider seam averages 2.3m thick. The Dysart Upper seam occurs as a single seam about 4.3m thick in the centre of the area or elsewhere is associated with an upper split referred to as the Dysart Upper 1 seam. The Dysart Upper seam is absent in the north of the area. Where the Dysart Upper I seam is present, the Dysart Upper seam is dull, mostly less than 1.5m thick and is more banded than the Dysart Upper I seam, which ranges in thickness from 1.1 to 4.0m. The Harrow Creek Lower seam in the Moranbah area is split into three seams; the Harrow Creek Lower, Lower 1 and Lower 2. The Harrow Creek Lower seam averages 3.5m thick in the southern half of the area but rapidly thins to the north and east to between 0.7 and 1.0m in thickness. While the Harrow Creek Lower 1 seam averages 0. Sm thick over most of the area, it thickens to greater than 1 m with depth. It is relatively dull with a marginally brighter basal section and is not developed in the northern half. The Harrow Bowen Basin 1995 - Symposium
SW
NE
A
A' BACK CREEK GROUP (UNDIFFERENTIATED)
/
/
- - - - - - - - - - MORAN BAH COAL MEASUR ES - - - - - - - - - - - FORT COOPER COAL MEAS URES- --CAINOZ01c...._,__
'
Bo,olt """ "
~~~~~s~~·
rJl
'<
...
:=
!3
',:I
-::-,,,.,;;,..='"" Pseams
0
Harrow Ck seam Harrow Ck Lo_. oearrw
....
I'll
s::
!3
Dysart Upper oean--. Dysart Rider oearrw Dysart Lower oeam
m
200L 100 0
o
500
1000 m
Vertical exaggeration xs
Figure 2. Schem atic cross section .
307
Creek Lower 2 seam averages 0.6m thick over limited areas but thickens to the south-east to about l.lm. It is moderately bright with a number of thin stone bands. The Harrow Creek seam, by virtue of its thickness and quality, is the most important seam in the area. It averages 3.9m in thickness, and consists of three major plies separated by prominent stone bands. All three plies are developed throughout the area. One of the most distinguishable stone bands within the seam is informally referred to as the "Goonyella Middle tonstein". This is a distinctive coarse crystal tonstein which occurs within the upper portion of the Harrow Creek seam and its lateral equivalent, the Goonyella Middle seam further to the north. The P seam is of relatively consistent thickness, averaging 4.9m over the area. It can be divided into a number of plies using the thin, persistent stone bands present in the seam. The lowermost portion of the seam generally has a high ash content while the uppermost portion of the seam is moderately bright. The Q seam within the area has split into two coal seams, the Q Upper and the Q Lower, with a separation of about 17M. Both splits persist northwards to Moranbah township, north of which they thin and deteriorate. The R seam is the uppermost seam in the Moranbah Coal Measures present only on the eastern side of the deposit. The seam is moderately bright and contains a number of stone bands which thicken towards the south. The R seam averages 3.0m in thickness in the south-east but deteriorates to about 0.9m in the north-east.
COAL QUALITY
The Harrow Creek seam contains significant resources of coking coal. It is a medium volatile bituminous coal containing some stone bands ranging from 0.15 to 0.Sm in thickness. A high grade metallurgical coking coal product of about 8% ash can be prepared by washing. Ash content of the raw coal, excluding stone bands, ranges from 10% to 28.5% and averages 19.5%. Volatile matter content of clean coal averages 23%. As vitrinite reflectance (Rvmax) increases down dip, the reflectance of a mine product should be in the range l. 1% to 1.3% with an anticipated volatile matter content of approximately 25%. Crucible swelling number of clean coal ranges from 8 to 9, Gray-King coke type is G6 to G7 with Gieseler maximum fluidity ranging up to S000dd/min. The levels of minor impurities include sulphur averaging 0.54% (ranges from 0.45% to 0.65%) and phosphorus averaging 0.03%. There is no doubt that this coal has very strong caking properties and the key quality parameters which may govern any future mining operation are ash content and overall recovery of product coal. Coals from the overlying P seam and underlying Dysart Lower seams are strongly caking but contain more disseminated minerals than the Harrow Creek seam and as such have less commercial appeal. Potential Utilisation
Queensland coals of similar specification to the Grosvenor product presently enjoy particular favour with overseas coke makers. These coals are highly desirable coke oven blend components valued for their coking properties and propensity to generate only low coke oven wall pressure.
COAL RESOURCES
An Indicated in situ coal resource of about 1 040Mt has been estimated for the P, Harrow Creek and Dysart Lower seams at depths <300m. Of this, approximately 20Mt may be found at <60m, predominantly in the P seam. The remainder of the deposit is suitable only for extraction by underground methods. Additional Inferred Class 1 resources of approximately l0SMt are contained in the P and Dysart Lower seams. Bowen Basin 1995 - Symposium
308
INDICATED IN SITU COAL RESOURCES SEAM
DEPTH
REPRESENTATIVE SEAM THICKNESS
APPROXIMATE AREA
(m)
p
Harrow Creek Dysart Lower Total
<60m 60- IOOm 100- 200m 200- 300m <60m 60- lOOm 100- 200m 200-300m 60- IOOm 100- 200m 200-300m <60m 60-IOOm 100-200m 200- 300m
4.5 4.5 5.1 4.9 2.6 3.1 4.1 4.3 3.0 2.7 3.4
2
(km )
1.9 7.8 30.0 20.6 1.3 3.3 32.2 34.3 9.2 11.0 26.7
Total Indicated in situ Resources
TONNES (x 106 )
15 50 210 145 5 15 185 205 40 40 130 20 105 435 480 1,040Mt
In situ coal resources have been estimated in accordance with the Australian Code for Reporting of Identified Coal Resources and Reserves The following parameters were used in estimating the resources • resources under areas of existing tenure were excluded; western boundary: seam subcrop or western boundary of EPC 552 •
minimum seam thickness I .Sm;
•
maximum seam depth 300m;
• relative density 1.40. For each seam, resource estimates were subdivided using the 60, 100, 200 and 300m overburden isopachs, With further subdivision of areas on the basis of seam thickness. Representative seam thicknesses, total areas and estimated tonnages for each depth category are shown below. Note that resource boundaries used for the estimates quoted in Departmental Records 1978/49 and 1987 /55 are only partly relevant to the areas now covered by EPC552. Resources quoted in Record 1982/7 straddle the EPC552/EPC548 boundary. It should also be noted that estimates in 1987 /55 include substantial resources at depths >300m. These are excluded from the estimates presented in this assessment.
FUTURE PROSPECTS Work planned for completion includes re-surveying of all holes that can be
found in the field. Where possible the accurate locations will be used together with borehole data to prepare a computer model of the deposit. Based on this work a detailed drilling programme will be planned.
Drilling will start in 1996 and in successive years the programme will be concentrated on the most prospective portions. The eventual intention for the area is to start a second longwall mine in addition to Moranbah North, either to supplement production or to provide coal for product blending.
REFERENCES
Because further drilling is not planned to take place until 1996, this summary is, except for a few minor changes, similar to the RA284 Overview Document prepared by the Department of Minerals and Energy in July 1993. This document contains a number of additional figures and all the basic data currently available. Frans Bos The Shell Company of Australia Ltd Bowen Basin 1995 - Symposium
309
THE HAIL CREEK COAL DEPOSIT LOCATION
The Hail Creek coalfield is located approximately 120km by road south-west of Mackay in Central Queensland (Figure 1). It may be accessed via the Peak Downs Highway, then from the Glenden Road. Hail Creeks nearest neighbours are the BHP Mitsui Coal properties (Kemmis Creek/Walker Creek/Bee Creek) to the south and the Newlands opencut mine to the north-west.
HISTORY
The first methodical exploration of the Hail Creek syncline was conducted by Mines Administration Pty Limited (Minad) commencing in 1969. Systematic mapping and drilling of the resource was carried out over the 1969-72 period. Additional drilling and testing was carried out by CSR, post 1972 and this has been continued by Pacific Coal during 1993-94. The ownership history of the Hail Creek resource is complex, hence only a summary is presented here. In 1969 the equity position was AAR (85%) and IOL (International Oil) (15%). In the period 1971-1977, Marubeni, Sumisho, Western Mining and CRA each acquired and sold equity in the project. In 1977 Esso purchased 25% from AAR (CSR). The equity position stabilised in 1980 with AAR (CSR) at 44%, IOL (CRA) 25%, Esso 25%, Marubeni 4% and Sumisho 2%. In 1988, CSR sold all of its coal assets, and in 1990 CRA finalised the purchase of the 44% that CSR held through AAR. The equity position then became and remains as follows: Queensland Coal Pty Limited
69%
Esso Australia Resources Ltd
25%
Marubeni Coal Pty Ltd
4%
Sumisho Coal Development Pty Ltd
2%
In 1993, Pacific Coal was appointed Operator of the Hail Creek Project. Title to the Hail Creek coal resources is held as Mining Lease 4738.
148' 15'
148'
148' 25'
ML 4738 showing the location of the Hail Creek Resource
1\ Eingel/a Dam
Hail Creek
21 ' 25'
Lake Elphinstone 21° 35'
21 ° 35' 15km
148° 15'
Figure 1. Location map. Bowen Basin 1995 - Symposium
148° 25'
310
GEOLOGY
Regional and Local Setting
The Hail Creek Coalfield lies within the Nebo Synclinorium on the north-eastern margin of the Permian Bowen Basin. In the Nebo district, two major synclinal features control the distribution of the coal measures. On the eastern side is the Hail Creek Syncline, a shallow fold approximately 30km long by 7km wide. To the west is the Carborough Syncline. A relatively small satellite structure of the Carborough Syncline is the Elphinstone Syncline. The Hail Creek coal resources occupy the northern end of the Hail Creek Syncline; the Elphinstone Coalfield (which is part of the Hail Creek Project resource) is contained within the Elphinstone Syncline. The Bowen Basin coals occur within four discrete coal measure sequences. Of these, the Hail Creek coals occur within the most widespread and uppermost sequence: the Rangal Coal Measures. Stratigraphy
The Hail Creek sequence is outlined below: Age/Name
Significance
Quaternary Unnamed
Alluvial sediments - overburden in part
Triassic Rewan Formation
Overlies the coal measures - barren of coal
Upper Permian Rangal Coal Measures
Contain the coal seams of economic interest
Upper Permian Fort Cooper Coal Measures
Contain the lower part of the Hynds Seam plus other semi/ non-economic coals
Cretaceous and Tertiary intrusives are also recognised within the sequence. The stratigraphic sequence is described in ascending order, as follows: Fort Cooper Coal Measures
The Fort Cooper Coal Measures (FCCM) conformably occupy the interval between the Moranbah Coal Measures (below) and the Rangal Coal Measures (above). In the Hail Creek Syncline they are some 400m thick and comprise lithic sandstones, mudstones and dirty coal seams and their distinguishing feature: numerous tuffaceous beds. Matheson (1990) defined the top of the FCCM as the top of the Yarrabee Tuff Bed, which at Hail Creek, is located just below the centre of the Hynds Seam. In the upper part of the FCCM the Fort Cooper Seam is recognised. The Fort Cooper Seam is better described as a coaly horizo1:1 of between 10-25m thickness. The top 2m may have some economic value where it is contiguous with the Hynds Seam, but this is not yet proven. The remainder is extremely stony and of no commercial value. In some areas the Fort Cooper Seam is contiguous with the Hynds Seam; elsewhere there may be a significant separation. Rangal Coal Measures
The Rangal Coal Measures are known to be approximately 210m thick in the Hail Creek area and contain the coal seams of interest. The coal seams are located within the lower part of the sequence. The Rangal Coal Measures contain three coal seams, namely: Elphinstone Seam Schammer Seam Hynds Seam (Upper Section) Bowen Basin 1995 - Symposium
311
These are described later in the section. The sequence above the Elphinstone Seam is predominantly arenaceous. The sandstones are fine to coarse grained, quartz-lithic and thickly to massively bedded. A sandstone sequence predominates between the Elphinstone and Hynds Seams, but a siltstone sequence of 5-lOm thickness is common, immediately above and below the Elphinstone Seam. Siltstone, which is frequently carbonaceous, also occurs in bands within the thicker sandstone sequence. The coal seams are described in the following narrative. Figure 2 shows the seam distribution in plan and section view. Figure 3 shows geophysical log responses of the main seams. The Hynds Seam is the lowermost economic seam and, whilst quite widespread, is missing or poorly known in some areas. The positioning of the Fort Cooper Coal Measures - Rangal Coal Measures boundary in the middle of the Hynds Seam is, from a practical point of view, a complication which has to be ignored . That is to say, the Hynds Seam must be considered as a single seam for the purpose of resource assessment and mining, and this is the approach taken in the following discussion. As previously noted, the Hynds Seam and the Fort Cooper Seam are contiguous in the northern part of the proposed mining area . Elsewhere the separation is typically 6m, but it rises to over 50m to the south. The seam is of variable thickness on a coalfield wide basis (1-l0m), but in the most attractive area it is consistently 6.5-8.Sm thick. The seam is characterised by a prominent stone band 0.2-0.4m thick, located approximately €no of the
A
A'
Figure 2. Seam distribution map and cross-section.
Bowen Basin 1995 - Symposium
312
DEP™ 0
10
20
30
40
RANGAL COAL MEASURES
50
60
70
BO
BO
FORT COOPER COAL MEASURES
100
Figure 3. Stratigraphic column. seam thickness from the seam roof. This band is of course the Yarrabee Tuff Bed. The stone band, together with a dull section of coal above and below, makes up a section of approximately 1.3m thickness has previously been known as the Hynds Middles. The sections above and below are the Hynds Tops and Bottoms respectively The Schammer Seam occurs in the north-west of the coalfield where it typically is less than 2m thick. It is not considered to be mineable. The Elphinstone Seam is the uppermost economic seam and is recognisable throughout the coalfield. The interval between the Elphinstone and Hynds Seam is variable. Over a small area in the south-west there is coalescence, while in the north the parting is 50- lO0m. Within the most attractive part of the deposit it varies from 25- 30m in the south to 45-70m in the central and northern areas. The Elphinstone Seam is typically 5.0-6.0m in the northern and eastern parts of the coalfield but thickens to 6.0-8.0m in the central and southern areas. The seam contains minor stone bands, but otherwise is quite clean. It is intruded in the south and in a small zone in the central area. Rewan Formation
The Rewan Formation is of Triassic age and conformably overlies the Permian sequence throughout the Bowen Basin. It comprises hard sandstones which are typically of a greenish colour. It is non coal bearing. At Hail Creek the Rewan Formation is preserved in the centre of the syncline but does not overlie the potential opencut reserves. Intrusive Rocks
Cretaceous acid intrusives are a feature of the north-eastern part of the Bowen Basin. The most prominent surface expression of these is the Mt. Gotthardt Range to the west of Hail Creek and a number of smaller outcrops to the north and west of the closure of the syncline. Bowen Basin 1995 - Symposium
313
Fortunately the coal seams have been relatively unaffected by these intrusives, except in the north-west where the granodiorite has dislocated the Hynds Seam and eliminated any potential reserves in this area. Tertiary basic intrusives are also known in the south-west where they have invaded both seams fairly extensively. The coal is coked and has no economic value. Alluvial Deposits
These are associated with the streams that flow mainly from the west and through the centre of the Hail Creek Coalfield. Alluvium is neither thick nor widespread. Structure
The Hail Creek Coalfield is located within a syncline, trending north-west to south-east and closing to the north-west. The syncline is asymmetric, with dips on the western limb being typically 5.5 °-8 • (flattest in the centre steepening to the north and less so in the south). On the eastern side dips are typically 12°-18 °. Minor faults have been delineated around the nose of the syncline and on the southern parts of the synclinal limbs. However, the coalfield in general and the area of opencut reserves in particular, are relatively unaffected by faulting. In the centre of the syncline the strata are believed to be dipping shallowly. Maximum depth to the Hynds Seam in the centre of the syncline is 390m. TABLE 1. INDICATIVE PRODUCT COAL SPECIFICATIONS.
TOT AL MOISTURE (% ar) PROXIMATE ANALYSIS(% adb) Moisture Ash Volatile Matter GROSS SPECIFIC ENERGY (MJ /kg adb) ULTIMATE ANALYSIS(% daf) Carbon Hydrogen Nitrogen Sulphur Oxygen TOTAL SULPHUR(% adb) HARDGROVE GRINDABILITY INDEX ASH FUSION TEMPERATURES ( °C) Reducing atmosphere Deformation Sphere Hemisphere Flow MINOR CONSTITUENTS (adb) Phosphorus(%) Arsenic(mg/ g) CAKING AND COKING PROPERTIES Crucible Swelling Number Gray King Coke Type Rogaindex Gieseler Fluidity dd/m PETROGRAPHIC ANALYSIS Vitrinite (%) Liptinite (%) Inertinite (%) Mineral(%) Mean max. reflectance of Vitrinite (Rv.max.)
Bowen Basin 1995 - Symposium
Hail Creek Coking 10.0
Hail Creek Thermal 10.0
1.0 8.0 21.4 33.0
1.0 14.5 18.7 30.1
89.4 4.91 1.56 0.39 3.7 0.36
89.0 4.71 1.45 0.43 4.4
0.36 78
1320 >1600 >1600 >1600 0.055 0.13 7.5-8.0 G6 75 200-400 56-60 0 35-39 4.4
1.29
0.105 0.16
314
COAL QUALITY
Hail Creek coal may be described as low-medium volatile, moderate ash coal with caking properties. Typical raw coal ash levels for the Elphinstone Seam and Hynds Seam are 15-18% adb and 18-25% adb respectively. Early studies of the Hail Creek coals considered making a single coking coal product at 10.5% ash. This is no longer an attractive product in the world market, hence a move .to a dual product scenario. The most likely products to be made from Hail Creek are a 8.5-9.5% ash coking coal and a 14-16% ash thermal coal in proportions 2:1. Summarised product coal specifications are listed in Table 1.
COAL RESOURCES
Coal resources within the Hail Creek Syncline are large. Estimates are tabled as follows:
Elphinstone Seam Hynds Seam Total
Measured Resources
Indicated Resources
(Mt)
(Mt)
220
250
l2Q
32Q
340
640
Of this resource it is considered in situ that mineable reserves are as follows:
Opencut
West and North-west North and East
Underground
REFERENCES
Mt 150 30
250
FLUOR AUSTRALIA PTY LIMITED, 1976: Hail Creek Coking Coal Project Feasibility Study, Volume 3A, Geology and Mining, November. GOSCOMBE, P.W., 1975: Nebo District. In, Traves, D.M. & King, D. (Editors): Economic Geology of Australia and Papua New Guinea - 2: Coal. Australasian Institute of Mining and Metallurgy, Monograph, 6. MATHESON, S.G., 1990: Coal Geology and Exploration in the Rangal Coal Measures, North Bowen Basin, {.lueensland Geology, 1. MINES ADMINISTRATION PTY LTD, 1972: Report on The Geological Investigation of SCML 312 (Appln) Bowen Basin, Queensland with Special Emphasis on the Hail Creek area, March. PACIFIC COAL PTY LIMITED, 1993: Hail Creek Coal Project, Mine Development Study.
KB Preston Pacific Coal Pty. Limited
Bowen Basin 1995 - Symposium
315
THE JELLIN BAH STATI ON COAL DEPO SIT LOCATI ON
The Jellinbah Station coal deposit lies adjacent to and predomina ntly on the east (right) bank of the Mackenzie River some 30km north of Blackwater . The potential mining area is between 7km and 17km north of Curragh Mine (Figure 1).
EXPLORATION HISTORY
The earliest reports of coal in the Jellinbah Station area are recorded in the Rockhampt on "Bulletin" of 11 January 1868. In 1900-1901, the Mackenzie River Coal Mining Syndicate completed trial diggings in the area, and in 1902 the Mammoth Mine was opened near the confluence of Blackwater Creek and the Mackenzie River. In 1957, Thiess Brothers completed a series of 68 boreholes between Curragh and the Mackenzie River. The Utah Developme nt Company explored the area between 1962 and 1966 as part of the exploration of the very large Authority to Prospect 6C. King (1969) provides reference to these earliest discoveries . Subsequen t to these earlier discoveries the State Electricity Commissio n of Queensland (SECQ) was granted tenure over Authority to Prospect 217C in 1978 from the proclaimed Departmen tal Area 56D. Drilling by the Departmen t of Mines (Carr, 1973, 1981; Galligan, 1977; Staines, 1975, 1977, 1978, 1987) had further demonstrat ed the presence of coal in the Jellinbah Station area. Since 1978, the Authority to Prospect has been re-issued as Exploration Permit EPC369 and control has passed through the Queensland Electricity Commissio n (QEC) and more recently to A UST A Electric. The QEC drilled 81 chip boreholes, 14 slim cores and three 200 mm cores in the area.
GEOLOGY
Jellinbah Station lies on the eastern flank of the Comet Ridge and on the western (footwall) side of the Jellinbah Fault. Exploration has been confined to the seams of the Rangal Coal Measures and the upper seams of the Burngrove Formation. The stratigraph ic units present are summarise d in Table 1. TABLE 1. JELLINBAH STATION DEPOSIT STRATIGRAPHY
AGE Quaternary
UNIT unnamed
Tertiary
unnamed
Late Permian
Rantal Coal Measures and urngrove Formation
LITHOLOGY mainlf unconsolidated sand, grave and clayriver deposits mainly multicoloured claystones and sand grey labile sandstone and siltstone, mudstone, tuffaceous mudstone, carbonaceous mudstone and coal
Surficial deposits of clays and unconsolid ated sand and gravel blanket much of Jellinbah Station. These river deposit and flood plain sediments average 18.Sm in thickness and thin against a prominent ridge of Tertiary age sediments. The north-easte rly trending ridge of Tertiary sediments overlying the Rangal Coal Measures in the southern part of the area comprises mainly multicoloured, iron-oxide stained claystones with thin quartzose sand and gravel beds interbedde d with the claystones. Bowen Basin 1995 - Symposiu m
316
148. E
Dysart ,
..
---- -----------( ... ...
,, ,
/
Norwich Park Mine
~
:
_,_,
, ,,
.
s-
H!Gnu,4Y
Blackwater Mine FAIRBAIRN RESERVOIR
24·
s
~ Cook Mine
Oua.ringa.
/
0
0
-
3Cl)
:I)
.
~
I
,
South Blackwater Mine
-,-
,,
, ,,
,,
,
-
--
,
,
124· s-
)
,
I
'
0
10 km
I E3 E3 b--..J
.>---- ------ ----
b=--1
b--=:---J
UNREDUCED SCALE 1 : 1 000 000
148. E Figure 1. Locality map of exploration permit EPC 369. Bowen Basin 1995 - Symposium
50 km
317
SOUTH
NORTH 00157
00027
00052
00061
00055
00166
00165
Figure 2. Generalised cross-section. In descending order, the coal seams present in the Rangal Coal Measures at Jellinbah Station are, the Aries, the Castor, and the Pisces. The Pollux and Orion seams, normally present in the Blackwater district, are absent in the area. Figure 2, a generalised north-south cross-section shows seam relationships, and in particular, the northerly increase in interburden between the Aries and Castor as the coalesced seam splits apart. The Aries seam ranges in thickness from 0.9 to 1.8m (average 1.4m) and has a varying lithotype brightness profile. In the south, where the Aries and Castor are coalesced, the seam is particularly dull. In the north, the seam is somewhat brighter. The Castor seam ranges in thickness from 1.5 to 3.5m (average 2.2m) with mainly siltstone and mudstone interburden increasing in thickness to 26m separating it from the Aries seam. The seam is relatively dull and consistent in profile throughout the area. Bowen Basin 1995 - Symposium
318
The Pisces seam comprises the upper clean coal 'working section, the Yarrabee Tuff Bed, and a lower banded section of coal, carbonaceous mudstone and interbedded tuffs. The 'working section ranges in thickness from 2.0m (eroded roof) to 10m (possibly structurally thickened) and averages 5.9m. The coal is generally dull with bright bands and is consistent in character throughout the area. There is a general thickening trend from south to north. The interburden between Castor and Pisces is predominantly sandstone, ranging in thickness from 33 to 62m. Overall, the coal measures sequence from Aries roof to Pisces seam 'working section floor, remains a constant 68m in thickness. Figure 3 shows representative borehole lithology and seam brightness profiles. The area west of the Jellinbah Fault, and including Jellinbah Station, is characterised by areally extensive compression related low-angle to beddingparallel shears (thrust flats) and relatively discreet zones of thrust ramping which are expressed as seam disruption, seam thickening and seam repetition. The thrust ramps are interpreted to strike north-northwest and dip to the northeast. Lateral discontinuities in the thrust sheets reflect the presence of transverse tear faults that separate domains of shearing. At Jellinbah Station, the thrust flats commonly occur in the floor of the Pisces seam 'working section or in the Yarrabee Tuff Bed. At times the shear ramps up section and runs near the roof of the Pisces seam or further up into the Aries or the Castor seam. It is evident that the shears are concentrated in mechanically weaker strata (Yarrabee Tuff) or near coal/stone interfaces where there is a contrast in strength of the lithologic units.
COAL QUALITY
The coal seams at Jellinbah Station are generally clean and free of major stone bands. The average and range of raw coal property values for all seams (on an air dried basis) is given in Table 2. TABLE 2. AVERAGE AND RANGE OF RAW COAL PROPERTIES
M% Ash% V.M.% S.E. MJ/kg I.D.°C H.G.I. S%
AVERAGE
RANGE
1.6 13.3 18.3 30.05 1190 77 0.50
1.1 - 3.6 8.8 - 21.4 17.0 -19.4 26.58 - 31.74 1080 - 1600 58 - 95 0.3 - 1.1
The coal at Jellinbah Station is amenable to a range of beneficiation options. Large diameter core pretreatment and analysis suggests that a dual export (P.C.1./soft coking coal) and domestic steam coal product can be produced by screening, and washing of the fines for an export product. Indicative product qualities are 7.5% ash (as received) P.C.1./soft coking coal and 17.5% ash (as received) steam coal. Run-of-mine steam coal with an average ash of 17.0% (as received) could be used directly for power generation.
COAL RESOURCES
In situ resources in the potential mining blocks total some 121Mt at a stripping ratio of less than 7 to 1 (cubic metres to tonnes).
FUTURE PROSPECTS Jellinbah Station coal will produce a range of potential products. An evaluation of contemporary export market requirements for coking, P.C.I. and thermal coal will determine the development strategy. Thence, sensitivity analysis of current financial models should reveal the optimal combination of domestic and export production levels. Should domestic coal requirements approach a full mine production quota (say 3.SMt) then run-of-mine coal will be produced for Central Queensland power stations. Having determined the optimal production rate (export and/or run-of-mine domestic coal) a final feasibility study will be undertaken. This study is planned for commencement in 1995/96. The study will comprise additional Bowen Basin 1995 - Symposium
319
00274
00276
41.12
45.32
90.55
1re.56
~ 112.25
ij 112.60
98.14 98,40
PISCES "!IS'
9711
111.l'i
Figure 3. Typical stratigraphic sections and graphic logs.
Bowen Basin 1995 - Symposium
320
exploration drilling for resource definition and structural modelling, and environmental, geotechnical, hydrogeological, hydrological and coal utilisation studies. Detailed mine planning using these new inputs will follow. Engineering solutions have been proposed for the key identified constraints to mine planning. A conservative approach has been adopted in addressing the major technical risks. Determination of product specifications and optimal production levels, and the evaluation of all capital, operating and infrastructure cost options could see Jellinbah Station ready for development some time after the year 2000.
REFERENCES
CARR, A.F., 1973: Coal exploration, South Central Bowen Basin, Jellinbah-Girrah area. Geological Survey of Queensland, Record, 1973/23. CARR, A.F., 1981: Preliminary evaluation of the coal resources of the Jellinbah East area, South Central Bowen Basin. Geological Survey of Queensland, Record, 1981/36. GALLIGAN, A.G., 1977: An evaluation of shallow coal resources in the Curragh area, South Central Bowen Basin. Geological Survey of Queensland, Record, 1977 /3. KING, D., 1969: A history of coal at Blackwater. Queensland Government Mining Journal, 70, 184-194. STAINES, H.R.E., 1975: Coal exploration, South Central Bowen Basin, Departmental Area 56D. Geological Survey of Queensland, Report 89, 1-18. STAINES, H.R.E., 1977: Coal exploration, South Central Bowen Basin, Jellinbah-Blackwater area. Geological Survey of Queensland, Record, 1977/10. STAINES, H.R.E., 1978: Coal exploration, South Central Bowen Basin, Jellinbah-Caledoni a area. Basic exploration data. Geological Survey of Queensland, Record, 1978 / 44. STAINES, H.R.E., 1987: Coal exploration, South Central Bowen Basin Jellinbah Caledonia area geology and coal resources. Geological Survey of Queensland, Record, 1987 /60. Nev Turner AUSTA Electric
Bowen Basin 1995 - Symposium
321
THE MEANDU COAL MINE, TARONG BASIN LOCATION AND TENURE
Tarong Coals Meandu Mine is located in Queenslands South Burnett District, approximately 180kmnorth-west of Brisbane (Figure 1). The mine is operated by Pacific Coal Pty. Ltd, which is a wholly owned subsidiary of CRA Ltd. The mine is the sole supplier of coal to Austa Electrics 1400 megawatt Tarong Power Station (4 x 350 MW Units) which generates about 40% of the electricity needs of Queensland. The Meandu Mine is covered by Mining Lease 6674. Additional deposits occur to the north (Kunioon) and to the south (South-west Yarraman) of Meandu and are covered by EPC 235 (pending Mineral Development Licences). Both tenements are held by Pacific Coal Pty Ltd.
f Murgon
Nanango
Nambour
,,.,~ MEANDU MINE Yar
Cabooltu
N
Esk
0
Beaudesert
50km
Warwick Figure 1. Meandu Mine geographic location.
Bowen Basin 1995 - Symposium
Coolangatta
322
DEVELOPMENT HISTORY
The Tarong area is named after one of Queenslands oldest properties Tarong Station. Coal at Tarong was first exposed during roadwork in 1939, but it was not until 1968 that exploration revealed the potentially economic deposits. Mining within Meandu ML 6674 began in 1983 from the King I pit and the power station was commissioned in early 1984. Four main pits have been mined to date, the King I, King IV, Northwest and Southwest pits (Figure 2).
MINING METHODS
The first step in the mining process at Meandu is to clear existing vegetation and remove top soil from the area to be mined. The topsoil is stockpiled so it can be used at a later date as part of the rehabilitation programme. Overburden is drilled and blasted prior to removal by the dragline. The mine is developed in strips approximately 90m wide. In order to supply 5.3Mt of product coal per annum, approximately 10Mm3 of overburden (excluding pre-strip) and >7Mt of raw coal must be moved. In addition approximately 2Mt of coarse rejects, 2Mt of interburden and over SMt of pre-strip are moved annually. Coal is exposed by a Bucyrus-Erie BE1370 dragline with pre-stripping required in some areas. Coal is blasted and loaded into Caterpillar 776 bottom dump haulers and Dresser Haulpac 630E rear dump trucks. Loading equipment includes a Hitachi EX3500 shovel (coal) and an EX3500 excavator (coal and burden). The trucks transport the coal to a SOOt, single-pass dump hopper, where a crusher breaks it to 300mm topsize. It is then conveyed to rotary breakers which reduce the coal to 75mm topsize. The coal is then conveyed to the raw coal stockpile which provides a buffer between the mine and coal preparation plant. A ROM stockpile of less than one week capacity is also available near the dump hopper. Coal is reclaimed from under the raw coal stockpile and conveyed to the raw coal screens where it is separated into two streams - coarse (material larger than 16mm) and small (smaller than 16mm). The two coal streams are processed separately in the coal preparation plant using jigs. Spirals are used for fines separation (0.5mm - 75 %m) and ultra fines are thickened and pumped to "storage dams" for future burial. The product coal is discharged from the jig, dewatered and conveyed to the product load out bin where a Coalscan analyses the coal for ash and moisture and transmits this information back to the control room operator. All equipment in the plant is controlled by a computer control system allowing the control room operator to monitor and adjust the process. Austa Electrics own conveyor system transfers coal from the product load out bin to the power station. After the coal has been mined, the strip is filled with spoil rejects and tailings and recontoured. Topsoil is replaced and native trees and grasses are directly seeded into the topsoil. Tarong Coal has a good track record in terms of environmental management.
REGIONAL STRUCTURE
The Tarong Basin is a relatively small, elongate, NNW-SSE trending, intermontane basin unconformably developed on the Palaeozoic Yarraman Block with dimensions in the order of 20km by 70km. The development of the Tarong Basin has been attributed to several mechanisms by various authors: passive·downwarp, Murphy & others, 1976; dextral strike - slip pull apart basin, Flood & Garces, 1986; half-graben, Veevers & others, 1993 and Williams, 1993. This author believes that the basin is an asymmetric graben or approximates a half-graben in geometry, at least in the Meandu area and that a component of dextral strike-slip is possible. Conclusive evidence of east-west tension is seen at Meandu Mine in the form of north - south trending normal faults. The apparent absence of significant faulting along the western margin is the main evidence for a 'half graben' geometry, however 'classic' graben-style fault blocks exist in some of the mining pits. A talus-slope deposit on the eastern margin of the Tarong Basin is suggestive of fault control, and magnetic intensity contours appear to change at the approximate location of the eastern margin. Bowen Basin 1995 - Symposium
323
Kingaroy
IIAJj KUtfOON
Nanango
Yarraman
SOUTHW£ST YAA!WilAN
~ MNNG/iRfAS ■
MINED AAfA5
' Figure 2. Location of mining areas - Tarong Coal. Bowen Basin 1995 - Symposium
..
324
In the King II area of the Meandu deposit, a major fault occurs with apparent dextral strike-slip displacement of over 600m (however this is not conclusive). This major structure is not entirely planar and appears to have an en echelon component. It is clear that the bulk of sediment filling the basin was supplied from the Boondooma Igneous Complex in relatively high ground to the west. Perhaps the half-graben symmetry is partly explained by the fact that sedimentation was forced away (to the east) from the higher, stable granites to the west and subsidence was enhanced to the east by differential sediment loading. Unfortunately little or no information on basement structure is currently available.
REGIONAL GEOLOGY
The Palaeozoic Maronghi Creek beds form basement along the eastern side of the basin. They crop out in the road cuttings between the power station and Yarraman and typically consist of steeply dipping, well-bedded phyllitic metasediments. Basement on the western side consists mainly of granodiorite and adamellite of the Permo-Triassic Boondooma Igneous Complex. Subsidiary, but widely distributed, rock types in the complex include granite, tonalite, diorite and gabbro. The name Tarong Beds was first used for Triassic sediments west of Yarraman and Nanango. Palynological examination indicates a Carnian (Late Triassic) age (Pegrem, 1986). The main rock types are sandstone and conglomerate and minor rock types include siltstone and mudstone. Significant economic thicknesses of coal are also present. The total thickness of the unit is not known, although the absence of basement in stratigraphic boreholes demonstrates a thickness of >350m. An estimate based on a recent mini sosie seismic line would put basement at approximately 500 - 600m depth in the King II area. The Tarong Beds are unconformably overlain by the Triassic-Jurassic Bundamba Group of the Moreton Basin to the southwest. Tertiary volcanics and sediments occur mainly on the topographically higher parts of the region.
LOCAL GEOLOGY
An alluvial fan occurs just to the north of the Meandu area (ML 6674). It is considered that the high energy fan deposition supplied the elastic infh,\xes into the low energy coal areas to both the north and south of the fan ie. Kunioon and Meandu. The sediment source as mentioned above was the Boondooma Igneous Complex west of Meandu. Within the Meandu Mine area, the Tarong Beds mainly consist of massive medium to coarse grained sandstones and interbedded fine grained sandstones and siltstones, with lesser conglomerates, and mudstones with significant economic coal seams throughout. Considerable lateral sedimentary facies variation occurs as a result of the high energy depositional environment. Fine to coarse grained sandstones predominate in the central section of the Meandu area, particularly higher in the sequence. Conglomerates which are usually matrix-supported, increase towards the basin margins and with depth. These sediments are predominantly quartzose with varying degrees of feldspar and minor lithic clasts; the percentage of lithic clasts increasing with depth. Lateral lithologic variations are common, due to the lenticular nature of the sand bodies. The finer-grained facies at Meandu are represented by interbedded siltstones and very fine-medium grained sandstones and laminated mudstones. Carbonaceous lamellae, plant remains and coaly horizons occur irregularly. Bedding generally dips at low angles ( degrees) south and south-east away from the central alluvial fan area. Local 'sub-basins' occur within the Meandu area into which deposition appears to have occurred from more than one direction. Normal faults with up to 30m vertical throw trending approximately northsouth occur in the King IV mining area forming 'text book' examples of extensional features such as graben and horst structures and tilt blocks. Bowen Basin 1995 - Symposium
325
Faulting generally post-dates coal formation however 'drape-like structures' across the faults in some areas are suggestive of syndepositional movement. In some areas faults which affect coal do not penetrate the overburden above which indicates a significant hiatus between deposition of the coal and the overlying sediments. Deep Tertiary weathering occurs in some areas. In the King IV area Tertiary valleys have been infilled by basalt flows and are currently exposed in the highwalls. Thicknesses greater than 100m of what appear to be Tertiary volcanics and sediments have been encountered in some boreholes. No evidence exists for coal seams being affected by contact metamorphism.
COAL SEAMS AND QUALITY
Within Meandu ML 6674 seven coal seams (Ace to Duke) were named during the initial mining development. These original seams are now broken into fourteen seams and each of these fourteen seams has a number of associated splits (Figure 3). Furthermore there are five new named seams below the Duke seam which also have associated splits. In total there are presently 19 named seams and 58 associated splits recognised at Meandu. Individual seams range in thickness from 2 to 20m and seam coalescence is common. The recognised mining areas tend to be defined by these areas of seam coalescence which may be up to 35m thick. Coal seams low in the sequence are generally dull with few bright bands and high ash, they are less laterally continuous and contain numerous stone bands. Seams higher in the sequence are generally brighter, have lower ash, are more laterally continuous and contain fewer stone bands. The improvement in coal quality vertically up the sequence is considered to be inversely proportional to depositional energy and a function of the 'stabilisation' of the basin with time. In other words, as the basin filled, the intensity of elastic influx from the fan into the coal forming environments decreased. The deposition of these elastic sediments into the coal forming environments has resulted in the ubiquitous stone bands and splits within the coal sequence. The coal at Meandu can be classified as a high-ash, high-volatile subbituminous to bituminous, low-sulphur steaming coal. As a general rule, quality deteriorates with the stratigraphic depth of the seam due to increasing ash content. Stone bands and partings occur in all seams and are widely variable in both thickness and composition. A tabulation of average seam ash, moisture and relative density at air dried basis is given in Table 1. Individual seams may show considerable variation around these averages giving a broad range of seam ash from 20 - 70% for all seams. ie. lowest ash to highest ash.
TABLE 1. MEANDU COAL SEAM QUALITY
ACE ..... . ...... ..... . 1.57 .............. 34.3 ............... 4.7 KING ................. 1.56 .............. 31.3 ............... 4.9 A ........ . ........... . 1.68 ..... ......... 41.7 ............... 4.0 B ...... ... ............ 1.62 .............. 36.9 ............... 4.2 C ..................... 1.61 ..... .. ....... 36.6 ......... .... .. 4.0 D ..................... 1.71 .............. 43.8 ............... 3.5 E ................. •.... 1.73 .............. 45.9 ............... 3.5 F ..................... 1.74 .............. 47.0 ............... 3.4 G ..................... 1.83 .............. 53.1 ............... 3.0 H ....... . ........... . 1.77 .. ............ 48.4 ............... 3.1 J ..................... 1.90 .............. 58.5 ............... 2.8 PRINCE ........ . ..... 1.98 .............. 64.2 ............... 3.2 BARON .............. 1.85 ... ........... 57.1 ............ . .. 2.6 DUKE ................ 1.77 . ............. 51.7 ............... 3.3 DUCHESS ..... ....... 1.67 . ...... ....... 45.0 ............... 4.1 Earl, Viscount, Lord and Peasant seams have insufficient data for tabulation.
Bowen Basin 1995 - Symposium
326
Al
A2 AJ r::=B 1
<=-~~
===BRNl
~Q~Z2:ZZ:ZZ;@~~i2Z:2Z::2Z:'~.2/~/I~~~==~ BRN2
~ Polenliolly Mineoble Cool
.__- - - BRN3
* ....
/--,-z~r,;';====-----
c..... z .....z--,/--,-z..-;,ti .... z .... z -..... z
DUK! ~UK2
~~.=== DUK3
M.L. 6674 COAL SEAM HIERARCt
Figure 3. Coal seam heirarchy, ML6674. The King seam in some mining areas contains reserves of specification quality coal suitable for direct feed to the power station. In fact the coal preparation plant was no t commissioned until 1986 because direct feed coal was initially mined from the King I pit. To date only the seams above the Prince seam have been mined. The coal preparation plant is now required to treat the bulk of the remaining coal to meet the power stations specifications of 28% ash, 14% moisture, 19.38 Gigajoules/tonne energy.
COAL RESERVES AND RESOURCES
The coal remaining within Meandu ML 6674 as at 30th June 1995 is given below: Total in situ coal resource
750Mt
Mineable in situ (open cut) reserves
250 Mt
Bowen Basin 1995 - Symposium
327
Additional significant coal resources are also held by Pacific Coal Pty Ltd, within EPC 235 in the Kunioon and SW Yarraman areas to the north and south of Meandu, respectively. Coal is sold exclusively to the Tarong Power Station. The current coal supply contract is for 65.59M product tonnes and an option exists for a further 44.41M product tonnes.
FUTURE DEVELOPMENT
The levels of geological complexity and mining difficulty will increase into the future mining areas. These difficulties will result from increasing depth of cover, increasing seam splitting, greater haul distances, greater need for pit dewatering and increasing risk of geotechnical instabilities. Fortunately the coal quality of the remaining mineable reserves is balanced between higher and lower grades ie. our best and worst quality coal areas are yet to be mined. Annual coal production is expected to continue at the current 5.0 - 5.5Mt rate for the near future. An increase in production to cater for additional power station units may be provided by opening the Kunioon area to the north of Meandu. At least two new mining areas will be developed within Meandu ML6674 in the next few years (the West and King 2 east pits). A recent life-of-mine study has indicated economic viability for mining deeper seams than initially considered. For this reason we are planning to extend mining in some areas to twin or triple seam operations resulting in a final coal floor as deep as 180m below original ground level. Due to the small size of our mining areas, the ability to perform such operations at Tarong is severely restricted by the logistics of manoeuvring the dragline from pit to pit and by the need to schedule more than one suitable coaling face at any time.
REFERENCES
FLOOD, P.G. & GARCES, B., Jr., 1986: The Tarong Basin, Queensland -A Late Triassic strike-slip (pull-apart) basin containing alluvial fan and coal-rich fluviatile sediments. In Willmott, W.F. (Editor): 1986 Field Conference - The South Burnett District. Geological Society of Australia, Queensland Division, Brisbane, 77-81. MURPHY, P.R., SCHWARZBOCK, H., CRANFIELD, L.C., WITHNALL, I.W. & MURRAY, C.G., 1976: Geology of the Gympie 1:250 000 sheet area. Geological Survey of Queensland, Report, 96. PEGREM, B.J., 1986: Geology of the Tarong Area and Meandu Coal Mine. GSA Field Conference, South Burnett District. WILLIAMS, B.M., 1993: The Geology of the Meandu Coal Deposit and the Central Tarong Basin, Southeast Queensland. Honours Thesis, University of Queensland. VEEVERS, J.J., CONAGHAN, P.J. & SHAW, S.E., 1993: Permian and Triassic New England Orogen/Bowen-Gunnedah- Sydney Basin in the context of Gondwanaland and Pangea. In Flood, P.G. & Aitchison, J.C. (Editors): New England Orogen, eastern Queensland. Department of Geology and Geophysics, University of New England, 31-45. M. Seppanen Pacific Coal Pty Ltd (CRA)
Bowen Basin 1995 - Symposium
328
Bowen Basin 1995 - Symposium
329
THE METEOR PARK COAL DEPOSIT LOCATION
Mount Isa Mines Limited (MIM) holds Exploration Permit (Coal) 538 covering the Meteor Park coal deposit located approximately 16 kilometres west of the township of Rolleston, 64 kilometres south-east of Springsure and 350 kilometres due west of the port of Gladstone, in the south-western sector of the Bowen Basin in Central Queensland (Figure 1).
EXPLORATION HISTORY
The original Authority to Prospect - ATP57C - was granted to Theiss Bros. Pty. Ltd. in November 1968. From 1969 to 1987 the area was explored under the terms of the Brigalow Mines Pty. Ltd. Joint Venture agreement between Theiss (50%) and MIM (50%). This joint venture changed in 1979 when CSR Limited acquired Theiss. CSR Limited managed the joint venture until 1990 when MIM acquired CSRs share of the joint venture. By 1975 the tenement comprised 142 sub-blocks. In 1987 Authority to Prospect 7CR, covering 35 sub-blocks, was granted to the Brigalow Joint Venture for three years. From September 1990 the area was held by MIM as Exploration Permit (Coal) 466 under the Mineral Resources Act 1989. EPC466 was reduced to 25 sub-blocks in 1992. In 1993 the same 25 sub-blocks became EPC538 which is current for two years_. Prior to 1985 the Meteor Park coal deposit was the subject of extensive geological exploration, environmental monitoring, and mining feasibility and coal transportation studies. This work identified areas of relatively low overburden to coal ratios which provided steaming coal at a quality suitable for the export steaming coal market. Total drilling in the deposit is in the order of 35 000m of which 1,700m is slim core and 100m is large diameter core drilling. Detailed chip and core drilling with geophysical logging was also carried out in areas interpreted as having thin Tertiary cover and thus potential for further discovery of economic coal occurrences. Other work has included:detailed laboratory analysis of core samples, •
geological computer modelling of coal seam structure and quality, rail, washability, infrastructure and water supply studies, coal export feasibility studies
•
geotechnical studies for mine design and overburden characterisation, collection of baseline environmental data.
GEOLOGY
The Meteor Park coal deposit is situated on the western edge of the Bowen Basin in a tectonic segment known as the Denison Trough, in which a thick sequence of Permian and Triassic sediments were deposited. Deformation of the sediments is thought to be contemporaneous, but accentuated by movement during a mild orogeny in the late Triassic. Sedimentation continued throughout the Mesozoic. Uplift in the early Tertiary was followed by erosion and extrusion of basic flood volcanics. Deposition of alluvial deposits occurred during recent time. The Meteor Park deposit is the only coal deposit within EPC538. Coal seams have gentle dips and are characteristically persistent and of consistent thickness and quality. Coals are contained in sediments of the Blackwater Group thought to be approximately equivalent to the Rangal Coal Measures although there has been no positive seam-to-seam correlation with seams of the Blackwater area. Tectonic deformation was minimal along the western edge of the Denison Trough and structure of the coal measures in the Meteor Park area is relatively simple and gentle. Structure of the coal measures in the potential Bowen Basin 1995 - Symposium
330
BOWEN BASIN Long reach
Wandaan
t
Roma 100
0
100
200
300
Kilometres
N
,,... ·-·"" ·""
I
L· - ·- · - · - · - · - ·- · - · - · - · - · - ·
• Meteor Downs
24'30'$
0
2
4
6
8
10
Kilometres
FIGURE 1
LOCATION PLAN Figure 1. Location plan. Bowen Basin 1995 - Symposium
331
"" "
II II II II
/
\
II
""
)j
::
::"
y-{ ,,...___/
-----
"----..
.,,,,,.--✓ r
,,;I II" Meteor Downs \ J_ /,,Y' • mN
""" ""
II II II
\
\
"" "
,-:,--..-,/,'
8 6 2 ~~~5iiiiiiiiiiiiiiiiiiiiiiiiiiiiiiiiiiiiiiiiii~~~ ~iiiiiiiiiiiiiiiiiiiiiiiiiiiiiiiiiiiii
0
KIiometres
FIGURE 2
METEOR PARK REGIONAL STRUCTURE PLAN
72111000111N
Boundary EPC538
Figure 2. Meteor Park, regional structure plan. Bowen Basin 1995 - Symposium
332
TABLE 1. TYPICAL ANALYSIS.
Proximate Analysis (%ad) Inherent Moisture Volatile Matter Ash Fixed Carbon Specific Energy (MJ/kg ad) Total Sulphur (%ad) HGI Ultimate Analysis (%daf) Carbon Hydrogen Nitrogen Sulphur Oxygen Ash Fusion Temperature (°C) Oxidising Initial Deformation Hemisphere Flow Reducing Initial Deformation Hemisphere Flow Ash Analysis ( % ) Si02 Ah03 Ti02 Fe203 CaO MgO Na20 K20 Mn304 P20s S03
11.0 28.7 10.1 50.2 25.30 0.5 53 78.38 5.14 2.08 0.50 13.90
1270 1360 1410 1190 1280 1320 55.39 20.39 0.65 10.79 4.85 1.89 0.89 0.61 0.13 1.24 1.67
opencut area is controlled by two major anticlines; the Consuelo and Inderi Anticlines. The deposit is located on the western limb of the Inderi Anticline and extends to the north and south towards two complementary synclinal structures named the Meteor Downs Syncline and the Meteor Park Syncline. Only minor faulting occurs (Figure 2). Seven coal seams have been identified which comprise the Meteor Park deposit and have been designated:Upper X
. A . B . C BC, and D. The X, A, B, C and D seams occur together in the Meteor Park Syncline, the BC seam is further north and the Upper seam is preserved only in the north of the deposit. The A and B seams thin and split to the north and south, while the D seam splits to the south, but is continuous northwards. Where coal seams subcrop against thick overlying cover, below the depth of recent Bowen Basin 1995 - Symposium
333
A~
Sean Ttickness Siltstone
Saoostone
SEAM A
3.49m
SEAMB
3.03m
SEAMC
0.50m
SEAMD
4.90m
Saoostone
Siltstooes/ MIiistones
Figure 3. Representative coal stratigraphic column. weathering, they appear to be only mildly affected by pre-Tertiary weathering. Within the potential opencut area coal seam dips average 2-3 • and increase to 5 • some areas. Coal seam thickness variations are minimal (Figure 3).
COAL QUALITY
The main seams in the Meteor Park deposit could provide a product fuel for power generation and probably petrochemical feedstock. More recently, technology suggests that these coals may be suitable as a feedstock to Integrated Gasification Combined Cycle power stations given the requirement for low ash fusion coal. The coal is described as high volatile, bituminous and weakly coking. Its product is potentially low ash, moderate energy thermal coal. A typical analysis of Meteor Park deposit coal is given in Table 1. Considering the large areas of occurrence of the main coal seams in the Meteor Park deposit, coal quality parameters are remarkably consistent overall. This has been related to lack of seam splitting and consistency of seam lithotype profiles. Consideration of air dried values indicate that Upper, A and B seams are capable of providing a raw coal product of low to medium Bowen Basin 1995 - Symposium
334
TABLE 2. SUMMARY OF IN SITU COAL RESOURCES. SEAM NAME
Upl'er B D TOTAL
AVERAGE THICKNESS (metres) 3.86 3.49 3.03 4.90
COALTO~NES (x 10)
7.5 19.3 57.2 190.5 274.5
ash (8-12%) and low sulphur, while heating value (24.6-26.4MJ /kg) is somewhat reduced due to the coals relatively high inherent moisture. The D seam ash is very low at 6.6% and its specific energy is satisfactory at 26.0MJ /kg even though inherent moisture is high.
COAL RESOURCES
Of the seven discrete coal seams identified in the Meteor Park deposit only four are considered to have economic potential. These seams are the Upper, A, B and D seams. The D seam, being the most extensive, accounts for the bulk of the coal resources within the deposit. Mining studies have included the BC seam as part of the B seam. The measured coal resources in the potential mine area are contained in these four seams as shown in Table 2. 3
The in situ overburden to coal ratio for this coal resource is 6.5m per tonne. Additional, indicated, coal resources have been identified and quantified at 35Mt. All coal resource tonnages are for seams with a thickness greater than 0.Sm and to overburden depths less than 80m.
FUTURE PROSPECTS MIM intends to advance to a Mineral Development Licence prior to the end of the permits current term. Various exploitation options for the Meteor Park coal deposit are being assessed and/or reassessed in the light of the changing market-place. Both domestic and export steaming coal markets are being monitored. For the future, where emerging technologies such as IGCC and coal liquefaction appear to favour the removal of ash in a molten form, Meteor Park coal may have distinct advantages when compared to coals with such properties as would require the use of fluxes to modify ash properties.
Phillip Sides Mount Isa Mines Limited
Bowen Basin 1995 - Symposium
335
THE MINERVA COAL DEPOSIT LOCATION
The Minerva coal deposit is located within EPC 553, 45kms south of Emerald and 20kms north of Springsure in the Central Highlands area of Central Queensland (Figure 1). The area is close to all major infrastructure. The Gregory Highway and Emerald-Springsu re Railway run parallel to each other six kilometres east of the deposit. An unsealed gravel road runs from the Wurba siding to within a few hundred metres of the site. Emerald, the major regional centre and Springsure are within 30 minutes drive.
EXPLORATION HISTORY
The area surrounding EPC 553 has been the subject of mineral, petroleum and coal exploration since the 1890s when Jack (1895) reported on the small gold and silver workings in the Minerva Hills Volcanics of Mt Saint Peter and Mt Little-Saint Peter in the south-west of the Minerva area. Minerals exploration centred on the volcanics continued up to the late 1980s (Dawney, 1989). The occurrence of significant coal resources at depth in the Reids Dome Beds near Cullin-la-Ringo to the north was first shown on petroleum seismic exploration in 1964 (Geophysical Service International, 1964). Departmental Area 55D covering the Bowen Basin, including the Minerva area, was declared in 1971 . The Geological Survey of Queensland then assumed responsibility for identification and delineation of coal resources within RA55. A series of exploration programmes were conducted in the area commencing in 1976 with GSQ Emerald 1 (EDl) and concluding in mid-1990 with a drilling programme in the Minerva area (Matheson & Jameson, 1990). Land within RA55 not already held under mining lease or exploration title was released for exploration by the Queensland Government in two stages in
100 N N 40 0 - l!!sia!!!ii...,,,,,,!!liiai.,,,,,,....,,!!!liiiiio aiiiil ____ iiii;;;;;a,.....,,
GENERAL LOCALITY MAP
Figure 1. General locality map, Minerva Coal Deposit. Bowen Basin 1995 - Symposium
336
1993. A general release was made on 1 March 1993 as Stage 1. Areas of known prospectivity including the Minerva area were released for competitive cash bidding and/or work programme tender on 4 December 1993 with tenders closing on 4 January 1994. The Minerva area had been divided into RA279 Cullin-la-Ringo and RA286 Cindie-Minerva. EPC 553 over RA 286 was granted to New Hope Exploration Pty Ltd (New Hope) and Winnin Pty Ltd (a subsidiary of Nissho Iwai Corporation of Japan) on 14 February 1994 for a period of four years. The exploration programme is managed by New Hope. Exploration by New Hope has consisted of two drilling programmes centred on the potential open-cut resources at Minerva. To date (June 1995) a total of 34 open holes, 3 slimcores and 5 large diameter cores have been drilled for a total of 3758mof open hole drilling, 300m of large diameter core and 164m of slimcore. Analysis and testing of samples is currently underway.
GEOLOGY
The regional and general geology of the Minerva area has been well-described (Matheson & Jameson, 1990; D' Arey, 1989). The regional geology and stratigraphy is summarised in Table 1. TABLE 1. STRATIGRAPHY OF THE MINERVA AREA AGE
FORMATION
Recent Tertiary
soil, alluvium Oligocene basalt flows Minerva Hills Volcanics Early Permian Cattle Creek Formation Reids Dome beds Devonian/ Carboniferous undifferentiated sediments
BASIN
Denison Trough
Drummond Basin
The surface geology of the deposit area is shown in Figure 2. The Minerva deposit is located within the Reids Dome Beds and is an extension of the coal seams identified in the Cullin-la-Ringo area. The environment of deposition and general geology of the Reids Dome Beds have been described in detail (Draper & Beeston, 1985). The Reids Dome Beds are a non-marine sequence of graben or closed basin origin. The dominant coal-forming deposystem appears to have been a swamp dominated meandering stream environment. Within the Minerva Deposit, the non-coal sediments grade from siltstone to medium grained lithic sandstones. Claystones, mudstones and coarse sandstones are relatively rare in the coal bearing sequence. Six correlatable seam groups of economic significance have been identified at Minerva. Coal seam correlation and a typical stratigraphic section with informal seam names are shown in Figure 3. The structure of the Minerva Deposit is dominated by the oval shaped north-west plunging dome informally named the Lexington Dome. The dome is surrounded by lineaments in the surrounding basalt cover which are clearly visible on air photographs and have been mapped previously by Veivers (1964). The domal nature of the area is supported by limited outcrop in Sandhurst Creek and has been confirmed by the recent drilling. A representative cross-section is shown in Figure 4. A single fault trending NNW has been identified with throws from +30m in the north to Sm in the south although smaller scale faulting elsewhere is suspected from the structure contours, cored sections and drill behaviour in open-holes. Dips in the central part of the dome are around 2 • steepening to about 5 • at the margins of the reserve area. The coal seams then appear to plunge at steeper dips to the north away from the dome. Local increases in dips have
Bowen Basin 1995 - Symposium
337
r._ ------..--------------------,---------------~--,
-
I
I
..,.. I
I
fj 100
-/
--
..,..
0
100
2'IXI
-
-
-
--
/
\
.
1ata> - ~ - - C C . - 1 1 0 1 . a
'
up
I IL_ _ _ _ _ ____._I_ _ _ _ _ __;:._ _ _ _ _ _ _r-a____._ _ _ _ _ _ _ _ _ _ _ __ _,--r~flfY"
Figure 2. Surface geology - Minerva Coal Deposit. been noted along the major NNW fault in core. Steeper dips have been observed in outcrops adjacent to intrusions in tributaries of Sandhurst Creek. The southern part of Lexington dome is extensively intruded, possibly by extensions of a deep seated intrusion which formed the dome feature. Intrusions are visible in outcrops in Sandhurst Creek and its northward and easterly flowing tributaries and in drillholes where coal seams have been preferentially replaced . The northern part of the dome appears to be free of intrusions at the current level of drilling. The Minerva Deposit is entirely free of basalt cover which appears to thicken rapidly away from the dome.
COAL QUALITY
The coal quality at Minerva has been estimated from analyses from Department of Minerals and Energy exploration and subsequently confirmed by the recent exploration and analyses. Samples have been subjected to washability tests at various densities followed by detailed sample analyses on re-constituted samples. Crushing and sizing testwork has been undertaken on large core samples. Preliminary combustion tests have been carried out at bench and pilot scale. Analysis and testing is currently in progress. Bowen Basin 1995 - Symposium
338
MIN1026
...
Q.D
••
,..,
Mloro O.,...ty
~
-r.i
~
"½_ _:._
I
,.
10
.... ...... t-- -;-
~
.I,,-'
·~
15
-c::: 20
~
~
.. ..
b-"""
--
~
•
.i::::.
c.
3
,C
---= b
Funnel No. 'f s -
•
Funnel No.2 s -
~
...... ""
:I:_
C"" :::i: ~
"::it:
,._
-~·~
~
~>
~
,..
"'-
i.;;.,,.
'""' ~ I~ ~
71
C ~
I~
t>
~
~
~ I-<"'"
1--c ~
<
.2::,_
r
-.....
... -
~
·~15
•
I~ I~
- L.c"'
is--::.!
....
~
~
7'D
-Wfll•S~
:>
-r.,,,,
•
.....
-=.
~
•
•
-- -=~
µ,,
.c:;
•
•
-l ..?
~
•
•
Sandhur•t No.2 s ~
~
~
~►
•
•
I~ !I..
~
,.
~ ~ :::S.._
- "----
....
~
I<
,.J
i£
ao
II..~
~
J
40
,_
'"
=-1:11' ◄
~
--s-
r.>
•
M i n - - No.'f S -
•
M i n - - No.2 S -
-
Min-- No.as-
• -
Mln-v• No.4 s M i n - - No.Ii S -
!"ii
Figure 3. Coal seam correlations and stratigraphic section.
Bowen Basin 1995 - Symposium
Soultl ____,
-··
--■
_,N
- - - - - --
· - - - - l - - - - ---
-- + ---
,..,co
,aoo
cr:l
--
1ooe·
-- - --- - --t -101•
-■
-N
-N
_..._
-
10011
-
-
0
~ ffl
::s
·---------------
-
cr:l
-
Ill 'I>
,
...
,oo..__ _ _ _ _ _ _ _ _ _ _ _ _ _ _ _ _ _ _ _..,__ _ _ _ _ _ _ _ _ _ _ _ _ _ _ _ _ _ _ _ ___._ _ _ _ _ _ _ _ _ _ _ _ _ _ _ _ _ _ _ _ ___.__ _ _ _..,_,oo t/l
'<
!3
"0 0
...
'I>
s::
HORIZONTAL 8CALE
!3
...
0
I'\.*«-
Vl!RTICAL ■ XAOQIUIATION 2:1
-
90
100
1N
-I
REPRESENTATIVE CROSS SECTION
Figure 4. Representative cross-section.
c.c c.c
=
340
The seams at Minerva fall into two groups, based on raw coal ash. The upper Sandhurst and Funnel seams have raw coal ashes in the range of 10% to 20%adb. The lower Wurba to Minerva seams have raw coal ash in the 5% to 8%adb range. The small variations in raw coal ash seen within seams probably reflects the sampling criteria and the amount of non-coal banding within a seam. All seams show extremely high yields (>95%) at Fl.60 or Fl.80 of a low ash product in the range 4% to 10%adb. Some variations in vitrinite content has been previously noted (Matheson & Jameson, 1990) and confirmed by recent analyses. The coal has no coking potential (CSN <1.5). The Minerva Deposit is capable of producing a low ash, low sulphur, high volatile bituminous steaming coal as either a raw coal or a simply beneficiated product. Preliminary tests indicate that Minerva coal will have excellent combustion characteristics above those expected for a coal of its rank. Typical coal specifications for a range of possible products is shown in Table 2. TABLE 2. INDICATIVE PRODUCT SPECIFICATIONS
·• . / :
tXfij @r , > ::r:s..Q»V.GT'.Y
,
•.· •••
j~j / ? : tttmiiliri') t !: :N:iri#~t j Ash Moisture Volatile Matter Specific nergy Sulphur
adb adb adb adb adb
7% 3.8% 32% 7250 kcal 0.35%
6% 3.9%
13% 3.3%
32% 7300 kcal 0.35%
32% 6750 kcal 0.46%
Chlorine
adb
0.02%
0.02%
0.02%
Nitrogen
daf
2.42%
2.42%
2.51%
H.G.I.
49
IDT
1420 0.81
Ro Max
COAL RESOURCES
50 1420 0.82
45 1420 0.82
Department of Minerals and Energy exploration and subsequent New Hope work has confirmed that shallow coal resources suitable for open-cut mining are present in the Minerva Deposit in the northern part of the Lexington Dome. Geological data has been modelled on the Mincom Stratmodel system for the calculation of reserves and resources. The apparent consistency of the seam quality in the Minerva Deposit and the ease of correlation over the deposit using downhole geophysical logging techniques has enabled reserves to be calculated at mineable in situ to marketable status. A 10:1 ratio cut-off for reserves has been used. This ratio, known as the marketable coal ratio, is calculated as: total volume of material ( including coal) marketable coal The ratio can be applied on a drillhole basis or block basis. Following the latest drilling, 150 100m x 200m potential mining blocks were modelled and the marketable ratio calculated for each block within an area of ratio of <10:l. Loss, dilution and yield factors were applied to each seam. A summary of reserves by seam within the 10:1 marketable ratio area is shown in Table 3. The Minerva Deposit contains 36Mt of mineable in situ reserves which reduce to 32Mt of marketable reserves. Bowen Basin 1995 - Symposium
341
TABLE 3. SUMMARY OF RESERVES BY SEAM
R~Yit:~blif/(J \: }MaiketabM : , gi~J(ji @t ii: r '!#¾Fmrr········• =::::: gijJtm i!i
\ 'MirtRlhiiih Sifii /
=
Sandhurst Seams Funnel Seams
2 900 000 4 800 000
2 770 000 4 570 000
2 190 000 4120 000
Wurba Seam Wills Seam Lexington Seam
7 310 000 1990000 4 410 000
Minerva Seams
14 560 000 35 980 000
6 950 000 1890000 4 190 000 13 830 000 34180 000
6 950 000 1890000 4190 000 12 710 000 32 060 000
TOTAL
FUTURE DEVELOPMENT
REFERENCES
Follow-up drilling is planned for September 1995. This is expected to lead into feasibility studies for a mine development with a target production date of late 1997. A multi-seam truck and excavator operation is envisaged utilising New Hope thin seam mining expertise developed at its Jeebropilly operations. A blended raw coal or simply beneficial product is proposed for railing to the Port of Gladstone. Preliminary discussions with potential consumers and all parties involved in a development are currently underway.
D' ARCY, R.K., 1989: Department coal reconnaissance drilling in the Cullin-la-ringo area, south-west Bowen Basin. Queensland Department of Mines Record, 1989/28. DAWNEY, R.L., 1989: Authority to Prospect 4846M, Final Report. Held by Department of Minerals and Energy, Queensland as CR20863. DRAPER, J.J. & BEESTON, J.W., 1985: Depositional aspects of the Reids Dome beds, Denison Trough. Queensland Government Mining Journal, 86, 200-210. GEOPHYSICAL SERVICE INTERNATIONAL, 1964: Emerald seismic survey, A to P 55 /56P, Queensland. Held by the Department of Minerals and Energy, Queensland, as CR1497. JACK, R.L., 1895: Annual progress report of the Queensland Geological Survey for the year 1894. Geological Survey of Queensland Publication, 103. MATHESON, S.E. & JAMESON, P.R., 1990: Coal Reconnaissance drilling in the Mount Minerva Area, Central Queensland. Queensland Resource Industries Record, 1990/13. VEEVERS, J.J., MOLLAN, R.G., OLGERS, F., & KIRKEGAARD, A.G., 1964: The geology of the Emerald 1:250,000 sheet area, Queensland. Bureau of Mineral Resources Report, 68. D Brown-Kenyon New Hope Corporation Limited
Bowen Basin 1995 - Symposium
342
Bowen Basin 1995 - Symposium
343
MORANBAH NORTH COAL DEPOSIT LOCATION
The Moranbah North Exploration Permit for Coal (EPC) 506 is situated 150km south west of Mackay and approximately 5km north of the mining township of Moranbah which services the Peak Downs, Goonyella and Riverside Mines. The northern boundary is coincident with the lease boundary of the Goonyella mine, the most southerly pit of which is within 2km of the permit area . The southern boundary is contiguous with Shell Grosvenor lease EPC 522. The area is bisected by the Isaac River with access via the Moranbah to Goonyella road on the western side and the Goonyella to Hay Point railway in the north east (Figure 1 ).
EXPLORATION HISTORY
The EPC area was explored by the Utah Development Company (Utah) and the Queensland Department of Minerals and Energy (DME) in the 1960s and 1970s. Utah drilled 100 holes of which 22 were partly cored with analyses carried out on the cored seams. Although these boreholes confirmed the southward continuation of the GM seam as mined at Goonyella, they also demonstrated the cover of Cainozoic sediments and basalts at Moranbah North was too thick for open cut extraction. Utah relinquished the area in 1972, and during the mid 1970s the DME undertook additional exploration to enable a broad underground assessment to be made. The area was subsequently awarded to The Shell Company of Australia in 1990 as EPC 506 and the name Moranbah North was adopted for the project. Shell' s approach during the first year of exploration was to investigate all seams for their longwall extraction potential and to validate previous borehole information. This involved drilling 23 partly and 3 fully cored holes targeting all major seams throughout the area. All holes were geophysically logged with raw coal, washability and coking coal testing carried out on all seams. The gas content and composition was measured for the major seams. The first year exploration results were used for a pre-feasibility study which concluded that a longwall mine extracting the GM Seam in the northern part of the area would be competitive in terms of quality and cost. Stage 2 exploration activities conducted during 1992 and 1993 were concentrated on the area covered by the 25 year mine plan as defined in the pre-feasibility study. A further 69 holes were drilling during the period targeting the GM Seam for both quality and structural control. Two large diameter cores were drilled for detailed GM Seam washability studies with 5 cores of the Cainozoic strata for geotechnical purposes. Coal seam tests were refined by increasing the number of float/ sink tests from three to six stages per ply sample. All boreholes drilled by Shell were surveyed using GPS technology and were geophysically logged. A land based magnetometer survey carried out by the Geophysical Research Institute was used to delineate the extensive Tertiary basalt flows that exist in the mine plan area. Shells exploration programme also included the testing of geotechnical properties, determination of seam gas content and composition, assessment of fluidity degradation over time and palaeomagnetic orientation of drill cores. A detailed feasibility study was then carried out covering all aspects of mining the deposit. Following this, drilling in 1994 and 1995 has concentrated on reducing the borehole spacing over the 20 year mine plan area. Detailed hydrogeological and geotechnical drilling programmes have also been completed as part of the mine planning process.
GEOLOGY
The Moranbah North exploration area straddles the subcrop boundary between the Moranbah Coal Measures and the Fort Cooper Coal Measures. The latter subcrop over the eastern half of the exploration area and are distinguishable by their characteristically thick interbedded sequence of tuff, Bowen Basin 1995 - Symposium
344
7 660 000 mH
~ ;<'-i - -- \ I NEW i {
--, ', t , •
I
t ~ --' \
1
- \ \ '-<.
7 EAO 000 mN
\
HAIL CREEK 7 E:tO 000 mH
i '-iwARD , __ -';EL
,
.\',
. I'
'
'cj\ \' .'
"-~
~~~~~~ry,
• ~q
l
· ~ -
QI
; ,
NORTH GOONYEL .•\
7 600 000 mN
) -· --
'
\;\ '-v,/ \\
)
,., /
.
,..,... ,..1
/
\
'•
•• ,
~
_,
.
' _.,
f J
-l • .• I
J
'
,
--------------~-.~--ii '
c>
.
,..
'
,,
. 7 ~o 000 mN
Seo le 0
5
1 : 450 000 10
20
Kilometres
Figure 1. Regional location and infrastructure. Bowen Basin 1995 - Symposium
~
N I
\
\
\
·,.
345
mudstone and coal. The highly interbanded nature of the coal seams preclude them from mining interest. The underlying Moranbah Coal Measures range in thickness from 2S0m to 300m, and contain 14 coal seams in nine coal seam groups. Sandstone, siltstone and claystone are the predominant interseam lithologies, with one distinctive tuffaceous marker band, the 'P tuff', recognised throughout the area . Detailed lithofacies analysis at the Goonyella Mine suggests that the sedimentology of the area is consistent with a fluvial dominated upper delta plain depositional environment. The coal measures are unconformably overlain by an irregular cover of Cainozoic sediments and basalt which ranges in thickness from 6m to 146m. Weathering of the strata beneath the unconformity surface extends down to a maximum of 40m, but is generally in the order of Sm to 10m. Widespread Tertiary volcanism produced extensive basalt flows which infilled the major depressions in the palaeosurface along the southern and western boundaries of the area. At least two main eruptive episodes occurred, but the basalt flows generally occur as a single composite sequence of massive lava, vesicular lava, ash flows and tuff reaching a maximum unweathered thickness of 6Sm. Eleven seams of the Moranbah Coal Measures subcrop within the exploration area. Borehole control for some of the lower seams in the south west of the area is minimal. The Q Seam at Moranbah North consists of two intervals, QA and QB, which are joined in the south western portion of the area. The QA Seam varies in thickness from 0.38m to 3. lSm, although it is generally less than 1.Sm. The QB seam has a maximum thickness of 1.96m with the seam interburden increasing towards the east. Stratigraphically below the Q Seam is the Goonyella Upper (GU) Seam (Figure 2) which reaches a maximum thickness of 4.93m in the central portion of the area and thins towards the south to a minimum thickness of 1.4m. The P Seam (Figure 2) correlates with the Goonyella Rider (GR) Seam at Goonyella Mine and with the P Seam at Peak Downs. This seam splits into the GR Seam, PLl and PL2 seams towards the north of the area. Where the P Seam occurs as a composite unit, it ranges in thickness from 4.7 to 6.lm. The GR Seam splits off the top, has an average thickness of 1.7m over most of the area, and underlies the GU Seam, by 20m to 2Sm. The PL Seam is a composite unit over the central portion of the area splitting into the PLl and PL2 seams towards the north. The two seams are separated by a maximum of 21m of interburden in this area. The P tuff is a regionally extensive tuffaceous marker bed that can be recognised throughout the exploration area. At Moranbah North it varies in thickness from 0.Sm to 3.0m and generally overlies the Goonyella Middle Seam (GM) by 40m (Figure 2). This interburden thins to the north. The GM seam is widespread throughout the region, correlating directly with the GM Seam at Goonyella and the Harrow Creek Seam at Peak Downs. The GM seam is the most prospective seam at Moranbah North, maintaining an average thickness of Sm to 6m over most of the mining area. The upper portion of the seam is transitional, composed of variable proportions of stone and high ash coal. By excluding this section from the working seam, the so called "ideal section" has been identified as the preferred mining target. A thin rider seam, the GMR (Figure 2), is frequently developed in the roof interval of the GM Seam. The GMR Seam occurs between 0.12m and 4m above the ideal section of the GM Seam. The seam ranges in thickness from 0.lm to 0.6m. The Goonyella Middle Lower (GML) Seam (Figure 2) occurs approximately 0.4m to 16.2m below the GM Seam and is laterally heterogenous grading from thin coal over most of the area into carbonaceous shale bands. The Goonyella Lower Rider (GLR) Seam (Figure 2) is separated from the overlying GML Seam by 16m to 68m of interburden varying in thickness form 0.2m to 1.Sm.
Bowen Basin 1995 - Symposium
346 l) l) H :l.
-
I
·QUATERNARY
I
- -- -
TERTIARY
' 50
~ - --
- 'l
FORT COOPER COAL MEAS URES
'----j ' - - ,,1 10 0
~J -
I
-
-1
1 50
~J
/
"
LATE
' -
'
'
I
20 0 1
-
:
.
0
. I
-
250
PERMIAN
Q SEAMS
-1
GOONYELLA UPPER .. . .
30 0
GR ~ PU
P L2
..
MORANBAH COAL M EA S URES
P TUFF
-
..
350
GOONYELLA RIDER } P LOWER 1 p SEAM P LOWER 2
--
-
GMR GM
GOONYELLA MIDDLE RIDER GOONYELLA MIDDLE
GML
GOONYELLA MIDDLE LOWER
GLR
GOONYELLA LOWER RIDER
4 00 ~ -
----
r
450
--
:JGL GOONYELLA LOWER Gt.S GOON YELL.A LOWER SPLIT
Figure 2. Stratigraphic column.
Bowen Basin 1 995 - Symposium
347
The Goonyella Lower (GL) Seam (Figure 2) is recognised as a major stratigraphic marker horizon throughout the northern Bowen Basin. It is correlated with the Dysart Upper 2 seam at Peak Downs, and the German Creek seam further south. The GL Seam reaches a maximum thickness of 7.0m in the north of the area thinning to the south. The GL Seam is characterised by abundant stone bands which reduce its potential as an underground mineable seam. Deeper Mines Department boreholes have intersected further seams to depths 150m below the GL seam. Analysis of these intersections indicate that the seams below the GL seam are either too high in ash or too thin to warrant further consideration. Figure 3 illustrates a generalised cross-section through the deposit from west to east. Structure contour plans of the GM seam floor (Figure 4) within the exploration area show that the seams generally strike N-S and dips uniformly to the east at 3 •. This dip and strike change towards the southern lease boundary where strike becomes NNW-SSE and dips at steeper to s·. Borehole evidence suggests that the structural deformation in the mining area is comparable to that of the neighbouring Goonyella Mine. Structure contour anomalies within the 20 year mine plan indicate the possibility of small scale thrust faults with throws of Sm or less. No igneous intrusions have been intersected within the Moranbah Coal Measures with a total of 230 holes now drilled. In the 20km strike length exposure of the GM Seam in the neighbouring Goonyella Mine, only a few thin dykes have been encountered.
COAL QUALITY
The GM seam was sampled into 3 main plies based on geologically correlatable bands distinguished in cores and with the aid of geophysical logs and which together constitute the ideal section. This subdivision comprises a bottom ply with the top at a thick stone band generally 1.3m to 1.6m above the base of the seam, a middle ply with the top at a thinner stone band, occurring a further 1.4m to 2.0m higher up in the seam, and an upper ply which includes the remaining portion of high quality coal at the top of the seam and is usually between 0.9m to 1.7m thick. This upper ply has been further split at a level some 4m from the floor of the seam to enable more accurate washability estimates to be obtained for a 4m working section. Raw coal ash for the GM seam decreases towards the north east of the deposit corresponding with an increase in ideal section thickness. The exclusion of the poorer quality transitional section at the top of the full seam results in a
PROPERTY Moisture (air dried) % Volatiles (daf) % Sulphur% Phosphorus % Fluidity (log 10 ddm) Dilatation % Reflectance %
RANGE 1.1-2.1 25-30 0.5-0.6 0.04 2.5-3.7 7-100 1.0-1.3
decrease in the ash content by several percent. Washed coal properties of the GM Seam "ideal section" include: The GM Seam product is basically identical to that of the coal which has been exported from the Goonyella Mine for over 20 years. It is a prime, medium volatile, high reactives, hard coking coal capable of producing high quality coke by itself, as well as constituting an ideal coke oven blend component. The resources favoured for early development at Moranbah North should produce a coal with slightly higher fluidity than the Goonyella product.
COAL RESOURCES
Calculated In situ Measured and Indicated Resources in the better quality northern area amount to 265Mt for the ideal working section. These resources occur at depths of <360m. Additional Inferred Resources at depths of up to 400m amount to 60Mt for the ideal section. Bowen Basin 1995 - Symposium
w
E
. . ll . ' 11
~ --··'"'U:lt.,i, _ _-·-.
.J~I(: . ··- -·
-... ;~l
BASE TERTIARY
- -~
=
0
~ Ill
=,
=
IIJ
....
Ill
en
'<
a
"l:S 0
....
Ill
c::
a
Vertical Exaggeration 6.7
Figure 3. Cross section W-E.
,
<1.---,-:-~
604000E 602000E 600000E ==-=------~~ =-----~...c.... c.=----------'- '-~=---,==== :::::::::::¥=== =====;-, 349
598000E
(
+
+
+
am 0 EH5;;...;;..;...~e~;..;....;~~~~aiaill SCALE 1: 50000
+
l j
I I I I I I I / I
/ 0 0
/ I
I
I
0
/o
I
/ I I
I I l
/
/
0
I I
)
j ' ' , \\ I ,r- - '-
0
0
_/
',
/
0
I
-
I
( \
\
\
I I
~ Figure 4. GM seam structure floor. Bowen Basin 1995 - Symposium
",
350
Measured and Indicated Reserves covered by the 30 year mine plan in the Feasibility Study amount to 165Mt.
FUTURE PROSPECTS Post feasibility drilling is currently being evaluated. Five coal quality holes
targeting the GM Seam were cored to the south of the mine plan area to delineate a zone of poor quality coal. These holes indicated the area of sub-economic yields to be limited to a narrow zone allowing the area with potentially mineable reserves to be extended towards the south. An MDL and ML application has been made with preparation in progress to start mine construction later this year pending final approval.
REFERENCES
BOS, F., 1995: Moranbah North Feasibility Study Volume 2, The Shell Company of Australia. BOS, F. & KNIGHT, A.S., 1994: Exploration in Preparation for Longwall Mining at Moranbah North, Queensland, The Shell Company of Australia. A Laws The Shell Company of Australia Limited
Bowen Basin 1995 - Symposium
351
THE MORANBAH SOUTH COAL PROJECT LOCATION
Moranbah South Coal Exploration Permit (EPC) 548 comprises an irregular, blocklike area of approximately 140km, situated in the central highlands of Queensland, approximately 180km west of Mackay, and 15km south-east of the Moranbah township (Figure 1). It is traversed by the Peak Downs Highway, which connects the hinterland with the coastal town of Mackay, as well as by the access roads to Moranbah, in a northerly direction, and Dysart, to the south. On its western side, Moranbah South is bordered by the Peak Downs East Mining Lease, which is held by BHP Australia Coal Pty Ltd (BHP), while the Shell Company of Australia Limited and BHP respectively acquired the exploration permits for the areas that lie directly north, viz. Moranbah (1994), and south, viz. Peak Downs East (1995).
EXPLORATION HISTORY
Utah Development Company Pty Ltd (UDC) conducted various exploration programs in the Moranbah area between 1966 and 1972, looking for possible opencut coking coal reserves in the then Authority to Prospect (A to P) 6C, which was later surrendered in favour of A to P 67C (Department of Minerals and Energy, Queensland, 1993). After completion of the survey, UDC successfully applied for a series of Special Coal Mining Leases (SCMLs), covering the most prospective opencut areas, while refinquishing potential underground mining areas, including Moranbah South. The Department of Minerals and Energy, Queensland, commenced exploration activities in the relinquished areas in 1973, conducting a twostage survey of the underground reserves: Stage 1: Thirty three holes were drilled on the eastern side of UDCs SCMLs between 1973 and 1978, to investigate potential underground resources within the Moranbah Coal Measures. Stage 2: "Windows" within the Tertiary cover, which had been identified during the first stage, were drilled in detail (72 holes non cored and 24 partly cored holes) in 1981 to ascertain the presence and define the extent of these potential opencut areas.
Iscor Australia Pty Ltd commenced with a three stage exploration program in Moranbah South in August 1994, after acquiring an exploration permit for coal for the area. Twenty eight stage 1 holes, out of a total of 38 (Figure 1), have been completed up to the compilation of this report. Holes are drilled on the western side of the EPC, where the coal measures are shallowest because of their eastward dip, on a two by one kilometre grid (two kilometres northsouth, along strike, and one kilometre east- west, across dip). The middle and lower parts of the Moranbah Coal Measures are fully cored, to enable good control over its stratigraphy, as well as to confirm the lateral continuity of the seams. All coal seams with a total thickness of 0.50m are sampled and analysed. Geophysical and geotechnical logging of all holes takes place, to respectively increase seam correlation control, and delineate the structural characteristics of the coal bearing succession.
GEOLOGY
General
Moranbah South comprises the low angle (6 °), eastward dipping Fort Cooper and Moranbah Coal Measures, of Permian age, which are unconformably overlain in the northern part of the exploration area by interbedded Tertiary basalt and sediments of irregular thickness. The Fort Cooper Coal Measures suboutcrops the pre- Tertiary surface in the area that is covered by the exploration permit, while the Moranbah Coal Measures suboutcrops more to the west, in the area covered by the Peak Downs East Mining Lease, allowing the main seams to be extracted by opencut methods. Bowen Basin 1995 - Symposium
352
SCALE 1:50,000
20'S
KEY ..I"".. Railway
.... ¥:1na1
0
100 km
22'S J U() km
Australia Ply Lid □ Peak Downs
East Mining Lease BHP Australia Lid Peak Downs East EPCBHP Australia Lid
- ". . ·':., . .. ,,. .....
".,
I
,, ,,
.,
, ,,
. ,. ,.·' .
,
,, ,,
,,
I
Figure 1. Locality map with planned borehole positions.
Bowen Basin 1995 - Symposium
353
TABLE 1. SUMMARY OF COAL SEAMS AND SPLITS IN THE MORANBAH COAL MEASURES
Total seam thickness (m)
R
?
IQ- Uooer
1.36
IQ-Lower
2.76
p
4.82
HwCreek
4.58
Harrow Creek Lower
6.78
Far northeast
Northern part
Southern part Seam
lnteneam
Splits
Thickness (m)
Total seam thickness (m)
lnteneam
Total seam thickness (m)
Splits
thickness (m)
lnteneam thickness (m)
?
17.64 46.50 41.98 28.44 Harrow Creek Lower
3.78
HCLSplit
1.08
DrtUooerC
0.86
DstUooerB
0.62
DstUooer A
0.62
DstRider
3.16
DstLower
2.48
HCLwrB
I
1.20
HCLwrA
I
1.10
9.74 16.26 9.94
26.96
Dysart
2.04
8.60
Upper
6.98 19.64
35.74
Dysart
7.30
11.10
The Tertiary succession, with a thickness of up to 93m, covers most of the northern part of the exploration area. A "window" is present in the northwestern part, in the area covered by the Moranbah airport, which is the area surveyed in detail by the Department of Minerals and Energy in 1981. No intrusions into the coal bearing successions have so far been found, which confirms existing exploration results, as well as reports from surrounding mines, that the Moranbah coalfields are basically intrusion free. The central part of Moranbah South is characterised by a series of north-westerly(?) trending, closely spaced faults, which resulted in the steplike displacement of the Permian successions. Total displacement is approximately 140m. Delineation of the structure by using borehole information is not possible at this stage, since holes are too widely scattered to be of real value.
Coal seams Eight coal seams, of variable thickness and quality, are present in the Moranbah Coal Measures, which reaches a stratigraphic thickness of at least 240m (Figure 2). Details of the seams are found in Table 1. They are arranged in chronological order from youngest (top) to oldest (bottom of table). Various other, thinly bedded coal seams are also present, but are too insignificant to include in this discussion. Characteristic is the northward splitting of various seams: (Figure 2). • the lower ply of the Harrow Creek seam splits of to form the Harrow Creek Split in the northwestern part of the EPC. •
the lower ply of the Harrow Creek Lower seam splits off in the central part, to be present as the Harrow Creek Lower Split in the north, after which the main seam splits again in the far northeast, to form the Harrow Creek Lower B (top) and Lower A (bottom).
Bowen Basin 1995 - Symposium
SOUTH
NORTH
TERTIARY STRATA
354 V
V
y
V
.,
V
.,
Basalt & unconsolidated sedimenL~
V
y
y
.. .... .... -- --------·-------Y
25m
V
V
Y
V
• vvvvv V
Y
V
V
V
LOX ,V yyyyy• •·············-···········-························· •vvvvvvvvvv
. ..,..,..,.,,.., V
V
V
Y
..........
LOX
............. ilililililililililil .............................................................. FORT COOPER COAL MEASURES
50m
Sandstone, interlayero:d coal, carbonaceous mudstone & tuffaceous material
Fair llill 4 • 8 m Fair Hill 4 m R • Seam (l.5 m • 3.5 m)
KEY MUDSTONE
g~
Light grey lo grey, ma~sive
SILTSTONE Light grey to grey, usually with greywhite arenaceous laminae and isolated thin fcrruginous bands SHALE
f=====~
Light grey to grey, laminate,
SHALE/MUDSTONE
Q • Lower (l • 3.5 m)
MORANBAH COAL MEASURES Sandstone - litho fc ldspat hic, silL~tone & shale - coal bearing st rata
l:::=:l ~
Dark grey to black, carbonaceo1L~
CLAY/CLAYSTONE
I~ ~ i
Not fully lithified
GRAVEL
••••
••••
:u:rrrow.Cr.f.ek (3.5 • 5.5 m) ··················:········::::::. .... . ... ······
·- ·- · aqow Creek Lower (1.5 • 4 m) ·• ... ::::::::::::::::::....
---------- '!'="':'."."'•;:::i;;;;;;, ""
P • luff (lime marker)
SAND/SILT
r7 ~
·- ·
-:
'7
·,·
~
,·
,·
'7
'7
llam,w Creek (3 • 3.5 m)
-·-·--·-·--·-·--·-·-·-·
~=~=~=~=~
M#M
Harrow Creek Lower (6 •7 m)
~··~.·~.·~.·~·
... ••.
(
• • • • Fine, unconsolidated, • • • • quartzitic
-.... .......... - ...... -...... -........ ......
..........
'11ia.~ Upper C (l m)
P • Seam (4 • 6 m)
.
. ~Z!::!:~%llt{{ii i;1E:: : :: :: : : ititiii~i·
SANDSTONE Grcywhite, medium grained, litho-fcldspathic with isolate well rounded siltstone pebbl1 layers and poorly developed thin carbonaceous plant/foss laminae l litho feldspatltic 2 Quartzitic 3Micaceo11s SANDSTONE
D
C7 LLl
·- ·- ·- ·-· -....... - -.... -. ...- .....
Dysart Upper (l • 2 m)
·-·-·-·-·-·-·-·-· -........... ..... ..... .... ·.·.·.·.·.·.·.·.·.· ....... ... ....... ........... ·.·.·.·-·.·.·.·.·.· ....... ...
·- ·- ·- ·- ·
Very fine 10 fine, unconsolidated, quartzitic
Greywhite,very coarse grained,quartzitic
BASALT
1..-~-..,
Dark grey to olive grl.-cn, phaneritic, amagdaloidal
TUFF
.. IJy$llrt-Ride.r,!1.5 - 4 m)
...... . . . . .......... •••••••····· ·······-·················•••••••··· ••••··· y~.Lowur-.(l.~~·~~)_'.·.·:::::::...............: ·- ·- ·- .- • Dysart (7 • 8 m) ·-··-·-· ............. ........ .... .. ... ..........
....... ...... ... ..... 1
::1 :11 Ii
. ........ .. ........ ••••• •••••. .·.·.·.·.·.·.·.·.•.· .......... .... •••• •••••• ..... .......... ........ .. .... ..... .. .... ...... ......... . ••••• ••••• .......... ........ •.·.•.·.•.·.·.·.·.· ... .. ..... ... .·.·.·.·.•.•.·.·.·.· •••••••••
White to cream coloured, reworked COAL
11
inferior
GERMAN CREEK FORMATION Sandstonc/quartzitic
Figure 2. Generalised stratigraphic columns idicating seam splitting (Moranbah South EPC 548). Bowen Basin 1995 - Symposium
355
•
the Dysart Upper splits into three plies, viz. the Dysart Upper C (top), Dysart Upper Band Dysart Upper A (bottom) .
the Dysart seam splits in the central part of the area to form the Dysart Rider (top), and the Dysart Lower (bottom), with the Dysart Rider splitting into the Dysart Rider B (top) and A (bottom) towards the east. Uncertainty exists over the continuity and nature of some of the seams in the upper part of the succession, due to the lack of information: the R seam\ seams? fall within the upper, air drilled part of the succession, while the Qseams had been eroded in the southern part as a result of intensive fluvial activity. •
Coal seams from the lower part of the Fort Cooper Coal Measures are also present, but contain numerous tuff and mudstone beds, rendering them uneconomic.
COAL QUALITY
Seam thickness and coal quality are the main parameters in the defining of possible mining seams within the Fort Cooper and Moranbah Coal Measures. To date, the P, Harrow Creek, and Dysart Rider seams have been defined as possible mining seams in the northern part of the exploration area and the P, Harrow Creek, Harrow Creek Lower and Dysart seams in the southern part. The occurrence and properties of these seams will be discussed next. To date, only limited analysis have been received and details will be included when possible. P seam
Working seam thickness of the P- seam varies between 3.37m and 3.85m, comprising bright, dull and coal- shaly bands, with scattered in- seam mudstone beds. It sub- outcrops in the vicinity of the airport and has a minimum overburden thickness of 140m in the south. Seam properties are shown in Table 2. The seam has a higher ash content than the other two seams, and is thus not regarded as a prime target. Harrow Creek seam
Total seam thickness for the Harrow Creek varies between 3.Sm and 4.Sm, with a minimum overburden thickness in the north of 60m, which increases to 170m in the south. The seam mainly comprises interbedded bright and dull coal bands, but is characterised by the presence of two thick in- seam mudstone beds with individual thicknesses exceeding 0.34m. These mudstone beds are present in the northern part of the exploration area but wedge out in a easterly and southerly direction. In the northern part of the area the roof and floor consist of carbonaceous mudstone. This indicates inferior mining conditions. In the southern part the roof is much stronger and consists of laminated sandstone/ shales. Seam properties are shown in Table 2. The thick in- seam stone bands lower the yield of a coking product considerable. Harrow Creek Lower seam
The Harrow Creek Lower seam is only present in the southern part of the area, reaching a thickness of approximately 6.78m. It comprises interbedded bright, dull and coal shaly beds, with numerous mudstone beds scattered throughout the seam. No analysis has so far been received, but the probability exists that a part of the seam could be mineable. Dysart Rider seam
The Dysart Rider is approximately 2.4m thick, with coal quality increasing from north to south. Numerous in- seam mudstone beds characterise the Bowen Basin 1995 - Symposium
356
TABLE 2. SEAM PROPERTIES OF THE P, HARROW CREEK AND DYSART LOWER SEAMS (WORKING SECTION). Physical properties Abrasion Index Noanalvsis No analvsis No analvsis
Harduove Gr Index No analysis No analvsis No analvsis
Relative d•nutv 1.45 1.47 1.38
Thickness 3.09 3.91 2.13
Seam p HanowCreek Dvsart Rider
Chemical properties Proximate •n•lmo VolMat Ash Moisture 24.7 9.5 0.6 22.1 9.5 0.6 20.3 9.5 0.4
Seam p HwCrk DrtRdr
H 4.4 4.4 4.5
C 79 83 79
Ultimate ...,..,, d.• 0
-
-
Specific Ene.-.v 32.7 32.5 32.6
s
N 1.89 1.92 2.00
0.59 0.57 0.55
Swellin2, cakin2 and plastometric properties Grey-
CSN Seam p HwC DRdr
Soft.T 394 402 420
Kin!
NA NA NA
8.6 7.7 7.9
Dllatometer test Cntr o/o DilaT CntrT 26 470 434 24 470 444 22 480 454
Ampo/o 98 82 64
Gieseler 11Jastometer test Ddnm ResoT PlasT SoftT NA NA NA NA NA NA NA NA NA NA NA NA
Roca
83 75 73
* NA = No analysis Petro2raphic properties Vitrinite 73 67 78
Seam p HanowCrk DvsartRdr
Exenite 0 0 0
Maceral comnomtjon Inertinite React SF 14 8 15 14 11 4
Reactives
Reflectance
79 77 78
1.20 1.28 1.45
Minerals 6 4 5
Properties of the anor2anic material Sm p HC DR
Si02 61.S 55.0 54.1
A12O3 22.1 32.1 32.8
Fc2O3 9.23 3.99 2.10
Ti02 1.30 1.91 1.52
P2O5 1.04 0.67 2.26
Initial deformation No analvsis No analvsis
Seam p HanowCreck
1'1~
~,t'D:..1-
···-'-
Ash comnosition Ml!O Na2O 0.27 1.39 1.99 0.70 2.50 0.25 0.38 0.54 3.53
eao
K2O 0.36 0.58 0.95
SO3 0.33 0.74 0.20
Ash fusion temoeratares H Sphere No analysis No analvsis No analvsis No analvsis
..., ____ ,__ ,_
Nn •-•••-'•
MnO
0.08 0.04 0.03
Ba 0.10 0.24 0.11
Sr 0.08 0.08 0.13
Glow 0 0 0
Flow No analvsis No analvsis
. . ,_ ---•--=-
seam in the northern part, but pinch out in a southerly direction. In the central part of the area, the seam consists mainly of bright coal, as confirmed by petrographic analysis. Analytical data received to date (Table 2) indicate a high phosphorous content, in the order of 0.3% (P in coal). Dysart The Dysart seam, which is only present in the southern part of the exploration area, is approximately 7.30m thick, mainly comprising interbedded bright, dull and coal shaly bands. Prominent mudstone beds are scattered throughout the seam, with a major tuff bed present in the middle. No results have been received so far, but the probability exists that a working section may be present within the seam.
COAL RESOURCES
Since the Moranbah South project is still in its first exploration stage, no reserve calculations have so far been conducted.
FUTURE PROSPECTS A pre- feasibility study will be conducted after the completion of stage 1 of
the drilling program. A decision will then be taken on the continuation of the exploration project. Borehole and analytical information will be used in the Bowen Basin 1995 - Symposium
357
study to define the most suitable mining area as well as the most probable mining seam to be targeted during stage two of the drilling program. Stage 2, if approved, is due to commence early next year (1996). Infill holes will be drilled in the defined area to define the structural and chemical composition on a doser grid. Holes will mostly be air drilled, except in the vicinity of the most probable mining seams. This will be cored and analysed. Geotechnical and geophysical logging of all holes will continue. The successful completion of phase 2 will see the commencement of phase 3, during which a detailed geological study of the proposed mining area will be conducted. Additional tests will be carried out during the second stage, on certain holes situated within the proposed mining area. These will include determination of the desorbable gas content of the coal seams, as well as the ease and possible ways in which excess gas can be drained. A seismic survey of the proposed mining area will be carried out to enable an assessment of the structural complexity of the area.
REFERENCES DEPARTMENT OF MINERALS AND ENERGY, QUEENSLAND, 1993: RA2780verview document- Moranbah South. Jean Britz and Kobus Swanepoel Iscor Australia Pty Ltd
Bowen Basin 1995 - Symposium
358
Bowen Basin 1995 - Symposium
359
NEWIANDS-EASTERN CREEK AREA LOCATION
Newlands-Eastern Creek area is located in Central Queensland, 125km (197km by road) west of Mackay and 77km south of Collinsville (Figure 1).
MINING LEASES
Newlands Coal Pty Ltd, a subsidiary company of MIM Holdings Limited, currently holds six Mining Leases in the area which consist of ML4748-Newlands, ML4754-Eastern Creek North, ML4755-Eastern Creek South, ML4771-Newlands South, ML4774-Newlands East and ML1076-Corridor for Eastern Creek Road (Figure 1).
MINE DEVELOPMENT HISTORY
Open cut mining operations are currently undertaken within two Mining Leases including Newlands and Eastern Creek South. MIM Group developed the mine as part of an expansion into large-scale coal production. The development began with Newlands Main deposit in 1981 and coal production commenced in 1983. As coal production from the Main deposit has gradually decreased because of increase of overburden thickness, Newlands North deposit (5km north of Main deposit) was developed in 1991 to maintain the desired level of coal production. Development of Eastern Creek South commenced after depletion of the Newlands North open cut reserves in 1994.
MINE OPERATION
Newlands Coal Pty Ltd operates the mine on behalf of NCA Joint Venture between Mount Isa Mine Limited (75%) and Agipcoal Australia Pty Ltd (25%). NCA consists of New lands mine, Collinsville mine and Abbot Point port coal loading facility. Newlands produces steaming coal and supplies coal to overseas markets in Japan, Asia and Europe. Annual production of washed coal is 4.6Mt and to achieve this, approximately 5.4Mt ROM coal are planned to be mined each year. Since the mine commenced in 1983, average clean coal production is 4.2Mt a year with a peak of production of 5Mt in 1986/87. An exploratory underground mine at Newlands has started in 1995 and the underground mine will boost coal production substantially in the near future. Newlands is a relatively short rail distance from Abbot Point, the large modern deep water coal loading facility located near Bowen, which is Australia's most northerly port.
OPEN CUT MINING METHODS
Land is cleared. Top soil is removed and stockpiled for rehabilitation. Overburden is drilled and blasted. Rotary drills (Driltech) and bulk explosive trucks are used in this operation. Removal of blasted overburden is a single operation where the coal seam is shallow and is able to be uncovered by the dragline alone. The removal becomes a two-stage operation in the downdip area where depth of the coal seam exceeds the dragline working level. The first stage is pre-stripping of overburden material ahead of dragline operation using rear-dump trucks (Dresser 830E) and shovel (Marion 301M) to provide a workable dragline bench (preferably 38m above the coal seam). The second stage i~ to expose the seam by two Bucyrus Erie 1370W draglines equipped with 46m buckets. At present, dragline 1 is in the New lands Main deposit and dragline 2 in Eastern Creek South. A continuous roster with three shifts a day is adopted for the pre-stripping operation. The same roster is also applied to the dragline operation. But this operation has one shift per week planned for maintenance and three public holidays for the yearly stoppages. Introduction of new excavation techniques has led to exceptionally high dragline productivity in recent years. Top of the exposed coal seam is cleaned up by a rubber-tyred bulldozer. The seam is drilled with a GD25C drill and blasted prior to mining. Bowen Basin 1995 - Symposium
360
EAST EAH CPEEX ,,ORTH ...__,, .
,-
I
~'"-.. I
!
II
, ~~~ ~◄s,;;:--.___ I
I
I
I
I
I
I
I
I
I
I
!
I I
I
I
I
, "-.. ' , ~ _ , C~e;--,
I
EAS TEAH CREEK SOUTH N..•7~~
_
_ J _ _ ___ _ _ _
' ,....._ -"b,o "'-10175
, ,__ .______
I
!
i I
I
I
I
L______J
I I
I I
I I I
LOCATION MAP
I
I I I I
I I
I I
I
II I
I I
I
i
~
-·-""~. .J
OJI
O
lklll
Figure 1. Newlands-E astem Creek area mining leases held by Newlands Coal Pty Ltd. Bowen Basin 1995 - Symposium
361
Coal is mined with one Hitachi UH801 hydraulic excavator and two Leibherr 994 loading units which all are backed up by front-end loaders when required. The coal is loaded into Cat 776 bottom-dump haulers (1 lOt capacity) and Kress haulers (200t capacity) and is transported to the elevated ROM dump station of the Coal Preparation Plant. There is a ROM stockpile area which is able to hold 300 000t of raw coal ready to undergo the preparation process.
GEOLOGY
Regional Geology
Newlands and Eastern Creek south deposits are located within the Rangal Coal Measures on the north western side of the Bowen Basin (Figure 2). Economic coal resources are contained within the Upper Newlands Seam (UNS) of Newlands and its equivalent Eastern Creek B (ECB) Seam of Eastern Creek South. The Rangal Coal Measures are late Permian in age, underlain by the older Fort Cooper Coal Measures and overlain by the Triassic Rewan Group. Both Coal Measures occupy the upper section of the Blackwater Group. The Tertiary Suttor Formation unconformably overlies the Permian and Triassic strata. Structural features in the region have been influenced by primary thrusting (the Burtqn Range Fault) from the north east. Major thrust faults and fold axes are oriented in a north-north west direction. Strata downthrow on the south western side of the thrust zone. Tension fractures including strike-slip faults strike north east and are generally parallel to the direction of principal tectonic stress. Igneous intrusions (Cretaceous in age) present as sills and dykes are commonly found in the region. The sills intrude both Newlands and Eastern Creek South deposits, but the dykes only occur in Eastern Creek South. The dykes tend to favour the tension fracture direction. The intrusions, especially sills, have destroyed large proportions of coal resources. Local Geology
Generally, Newlands and Eastern Creek South have similar geological formations.
Overburden. Overburden comprises primary Permo-Triassic rocks of the Rangal Coal Measures and Rewan Group, less dominant Tertiary strata of the Suttor Formation and minor intrusions. The Rangal sediments consist of a thin sequence of sandstones, siltstones, black carbonaceous mudstones and rider coal seams. These seams stratigraphically above UNS and ECB are of no economic significance. The Rewan Group has widespread outcrop and contains thick beds of greenish sandstones and siltstones. The sandstones form blocky jointed massive beds. The Suttor Formation was deposited as infill sediments and basalt flows in the Tertiary palaeochannels. The palaeochannels have incised the Permo-Triassic strata and washed out the coal seams in some areas. Basalt flows overlying unconsolidated sands and clays form capped mesas scattered throughout the area.
Coal Seams UNS of Newlands ranges from 5.7m to 7.2m in thickness averaging 6.5m (Figure 3). It comprises a generally dull top section (2.5-3m thick) with minor bright bands and a dominantly bright banded basal section (3.5-4m thick). Base of the top section is marked by a tuff aceous claystone band (3.3cm thick) which occurs consistently in the seam throughout the deposit. The basal section will be the working section for underground mining. Three rider seams rarely exceed 0.5m in thickness and split from UNS in the central and southern areas. UNS deteriorates in quality where the splits are ready to take off. ECB Seam of Eastern Creek south ranges from 4.5m to 6.5m in thickness averaging 5.4m (Figure 4). The top section of the seam (2-2.Sm thick) contains high ash coal and the basal section (2.9-3.4m thick) lower ash coal. As for Bowen Basin 1995 - Symposium
362
u
LEGEND
0 N
~ loull IT] Stdlmt11t1
0
z
,(
u
!J
CRETACEOUS
0
0 .,,
~ ll1wa11 f'ormotl011
X !,!
PERMl.l.H
0
w
Ra119al Cul Mto1ur11
[
0 N
Cl1motl1 111011d1to11t
~
TRI.A.SS IC
w
CD l11tru1lvt1
[
N
,(
~
Bleckwot,r Group
~
Back
Crttk
Orologlcol
Group
boundary
F'ault
•
Concaal1d
foult
Sy11cli11ol
oxh
Homutood
.
,
...... -,:.,
'7 Tt
,,
,
.. 5
.... -....
0
SCALE 5
\0
,s
l<1lotnt If r I
'Hlll•l •"t •••
' ..
A
u
r
N!:1rUNDS
/v.sruJf
CRZEX
SOUTH
~.:..:_-6-:::---
+++\ '++++\ ,' + + + + +\ ,+++++J : +++++:
~:::;:ll==r::::::: Pub
Tb
Tertiary
lie
Cltmotl1
,.,
Rt WOii
bault ,01\dlllllt f'errnotlo11
HORIZONTAL SCALE
IICH Rol\gol c.. 1 Mtosur,1 1'11b lloclcwoter Oroup Vtrtlcol : Horlzo11tol
0 ·••11oerol1011
A'
l :I
J
'
Klltrn1tre1
Figure 2. Regional geology of northern Bowen Basin. Bowen Basin 1995 - Symposium
363
SEAM SECTION
TYPICAL STRATIGRAPHY
TN,lis __ AG_E~
·tml Nor1hern
Cl ,_
2
Area
...
; ; ....
GROUI'/ FORMATION
TYPICAL STRATIGRAPHY
LITHOLOGY
SEAM SECTION
Southern
SUTTDII fOIIMATION
Area Wnkly c1m1nl1d nnd11on1 ind d1yston1 occulonil
PLY No.
PLY Ho.
hull llow
s UNSF z 0
E
:z: 0
~
Cl.l
~
C,
~
en
s
• 50
z
z
.. •· .
i
C,
:z: i:
i
.,o
g.. 0
r" -70
lllhlc undi lane 1nd
a.. c:...::, Gil Gil
<
a:
)-
UNSC
slll1lan1
:::::, CJ
a:
c.::,
.,o
:z: <
3: UJ
c::
.go
:z: 0
~
-1 00
J
r.l
en
:z: 0
~
- 110
~
en C,
3
·120
:z:
i
2
:II
•1JO
0
~
Mutrr Mudslllnr
0
m
ff 1wl1nd1 Rider I H1wl1nd1 Rider Z
RAN GAL X ~
ii cc
.... 0...
••
Thinly b1dd1d slllslan, 1nd undsllln•
COAL MEASURES
Upptr N1whnds Sum -170
0
Cl1ys1,n, gridlno lo 11ndslon1
m11r11 lbovt
llaor
FORT COOPER COAL MEASURES
Lowir H1wl1nd1 Sum
Figure 3. Typical stratigraphic sections Newlands area. Bowen Basin 1995 - Symposium
L!Cl!NO
[.'<:·:·.:J
S•ndrlon•
c::J
Slllalon•
~
Clay,ton•
rn
Ion•-• ,tow ot 1111
Tull
364
AGE
GROUPt FORMATION
LITHOLOGY
TYPICAL STRATIGRAPHY
SEAM SECTION
0
= = ..... >-
< >-
SUTTOR FORMATION
Friable sandslane and occasional basall llow
>-
POSSIBLE MINING
PLY No.
t...)
Cl'l Cl'l
<
=
SECTION
REWAN GROUP
>-
lithic sandslane
ECA Sill ECA Seam
lnterbedded sands1one and srllstone
z
RAHGAL
= ..... a..
COAL
< :i::
MEASURES 30
Carbonaceous claystone
Eastern Creek 8 Seam
40
Cubonaceaus clayslone and coal grading tu sill stone
.___ _....__ _ ____._45
Figure 4. Typical stratigraphic section Eastern Creek South. Bowen Basin 1995 - Symposium
melres aoove lloor
LEGEND
EZJ
Sandslon1t
c=J
Slllslone
~
Clay1tone
~
Carbonac1ou1 Clay1tone
~
BHall ,tow
365
UNS, base of the top section of ECB Seam is also marked by a tuffaceous claystone (3cm thick). Two thin rider seams are dirty or are present as black coaly mudstone beds. ECB splits in the northern area where its quality is deteriorating. The northern area could be of potential high ash coal resources whereas the central and southern areas contain lower ash coal resources.
Seam Floor Floor of the UNS and ECB Seam consists of strata within the lower section of the Rangal Coal Measures and the underlying Fort Cooper Coal Measures. The Fort Cooper is a sequence of sandstones, siltstones and a number of thick coal seams with dominant tuffaceous claystone bands. At Newlands, immediate floor of the UNS is a very thinly interbedded claystone and siltstone unit with coal wisps and laminae. It also includes the Lower New lands Seam (LNS) in the central area where this seam is about 2m below the UNS. LNS marks the top of the Fort Cooper Coal Measures and contains high ash coal and several weak tuffaceous claystone bands which have caused spoil stability problems. At Eastern Creek South, immediate floor of the ECB Seam is a thinly interbedded coal and claystone or siltstone unit underlain by a sequence of siltstone. The immediate floor is generally weak and intensive shearing is one of the factors which has contributed to this poor floor condition.
Structure Both Newlands and Eastern Creek South deposits appear to have been influenced by the same regional thrusting (the Burton Range Fault) from the north east, but degree of the rock deformation is different in each deposit. Strata deformation in Eastern Creek South tends to be more pronounced than that in Newlands as the Eastern Creek South deposit is geologically located adjacent to the thrust system. Reverse, thrust, normal and strike-slip faults have all been identified in Newlands and Eastern Creek South (Figure 5). A prominent north west trending thrust system is likely to form the eastern limit of the main underground mining area. Strata in Eastern Creek South have been strongly deformed by shearing. Fold structures in forms of mild anticlines, synclines and monoclines are also recognised in the area particularly in the Newlands deposit. Sills occur in the northern area of New lands and in the south western and north eastern corners of Eastern Creek South. The sills have intruded the coal seams and also the overburden. They have devolatilised or replaced the seams partly or totally. Dykes are commonly found in Eastern Creek south and there has been no indication that these igneous intrusions are likely to occur in Newlands. Both sills and dykes are irregular in shape (Figure 5). It is very difficult to delineate the extent of heat affected coal within or around the intruded areas.
COAL QUALITY
Top and basal sections of UNS and ECB are defined as mining working sections of the seams (Figure 3 and Figure 4). Geophysical downhole logs, detailed seam logs and coal quality of ply samples are used to determine these working sections. Both raw and washability analyses of coal ply composites representing the working sections have been undertaken. The washability data from the laboratory have been processed by computer using Sedgman package. The Sedgman output is the simulated quality of coal product from the Preparation Plant and is used in conjunction with coal reserves for short and long term mine scheduling. Full seam coal quality for Newlands deposit is inferior to that for Eastern Creek South. Newlands coal with raw ash up to 20.3% can be washed to give a product of 16.3% ash at 84% yield. It is possible to wash this coal to 14.5% ash product with significant loss of yield. Coal quality for Eastern Creek South is generally good over the deposit except in its northern area where the Bowen Basin 1995 - Symposium
366
EASTERN CREEK NOArH MLJ75,t
ll!~l--CDD I
NORTB
I
I
I
I
I
I
I
!
\ _ _ _ _ _ _ _ _- J
I
II I
,.• I
....t.I , I
••
NORTHERN UNDERGROUND
I I
I
_j LEGEND
---~---
NORKAL FAULT REVERSB OR THRUST FAULT
••• .111 •••
,, ,, I
,
........ ~
I
. I •.. II • I •■ I
I I
ERGROUNO,
~I
STRIEB-SUP P.AULT
t
ANTICLINE AXIS
•
SYNCLINB AXIS MONOCLINE AXIS
i
'-• I
NDUNDS SOV?B
DYKE
: :!
•I
SILL
'- I ------,--
•
.
-·-··,....\...
0,6
Figure 5. Newlands and Eastern Creek South structure. Bowen Basin 1995 - Symposium
0
367
quality becomes poorer due to seam thinning and splitting. But coal in the central and southern areas contains 15.3% raw ash and is readily washed to 12.3% ash at 87% yield. This coal provides a good source for blend with the poorer quality Newlands coal to maintain production of 14.5% ash sale specification. Below are the typical product quality specifications for Newlands operation.
Proximate Analysis (air dried) » »
» »
. . . . . . . . 2.3% 26.3% 14.5% 56.9%
Inherent moisture .. . Volatile matter . . . . . . Ash . . . . . . Fixed carbon
Total Moisture (as received)
. . . . . . 8.3%
Calorific Value (air dried) ..
. .. 6800Kcal/Kg
Total Sulphur (air dried) ..... .
0.5%
Hardgrove Grindability Index . .
. ..... . ..... 53
Ultimate Analysis (dry ash free) » » » » »
Carbon .. . . . . . . . Hydrogen .. Nitrogen .. Sulphur Oxygen
Size ..... .
. . . . . . . . . . 85.10% 5.10% 1.74% 0.50% 7.50% . . . . . . . . . -S0mm
Ash Fusion Temperatures (reducing atmosphere) » »
Initial deformation . . . . . . . 1550°C (approx.) Flow . . . . . . . . . . . . . . . . . . . . . . +1600°C
In addition, Newlands has flexibility .to produce other quality coals (high ash and low volatile) when requested by the customers.
COAL RESERVES AND RESOURCES
The remaining in situ coal reserves (to 80m depth) in the current operating open cuts are 21.SMt (measured) in Newlands Main deposit and 14.SMt (measured) in Eastern Creek South. Other sources of coal include Newlands Underground and satellite deposits (Figure 5) where a total of 162.9Mt (146.2Mt measured and 16.7Mt indicated) in situ resources is estimated for underground, highwall and open cut mining.
FUTURE MINE DEVELOPMENT
Newlands Underground is being developed. Exploratory stage of an underground mine has commenced. Construction of infra-structures and installation of portals have been completed. Coal production from the underground will start soon. Open cut mine development of the satellite deposits (Newlands South, Airstrip and Eastern Creek North) is planned in the future. At present, these deposits have undergone extensive exploration drilling. SPeou Newlands Coal Pty Ltd. Bowen Basin 1995 - Symposium
368
Bowen Basin 1995 - Symposium
369
NORWICHPARKCOALMINE LOCAT ION
The Norwich Park Mine is located some 250km south-we st of Mackay and extends over a strike length of 33km between the township s of Dysart and Middlem ount, (Figure 1). The mine covers the transition from the Moranba h Coal Measures in the north to the German Creek Formatio n in the south. The economic seams continue northwar ds into Saraji Mine and southwar ds to the German Creek Mine. The rail link to Hay Point runs northwar ds through Saraji and Peak Downs.
TENURE AND HOLDER
The Norwich Park mine is operated by the Central Queensla nd Coal Associates (CQCA) under Mining Lease 1782, which extends from the southern boundary of Norwich Park northwar ds to the Saraji Mine Industria l Area. The mine is one of four, large, open-cut mines currently operated by the CQCA, sited along the western rim of the northern Bowen Basin. The other mines, from south to north, are Saraji, Peak Downs and Goonyella-Riverside, the latter operated in conjuncti on with BHP Mitsui Coal Pty Limited.
DEVELOPMENT HISTOR Y
The economic coal seams at Norwich Park were discovere d as part of an extensive explorc;1tion programm e carried out by the Utah Developm ent Company in the 1960s. The programm e entailed traverse drilling along the western edge of the northern Bowen Basin under Authoriti es to Prospect 6C and 67C. The decision to proceed with Norwich Park Mine was made in April, 1977. The first coal was mined in June, 1979 and the first rail delivery of coal to the port of Hay Point took place the following month (BHP, 1994). Capacity for the mine is 4.7Mt of product coal per year.
MINING METHO DS
3 Coal is mined by open-cut, strip mining methods using five 48m draglines for overburd en removal (BHP, 1994). After blasting, the coal is removed by hydraulic excavator s or front end loaders and carried to the crushing station by a fleet of ten 109t and one 150t coal haulers. Parting is removed from the pit by three 130t rear dump trucks. The preparati on plant comprise s heavy media cyclones, spirals and flotation circuits.
Pit names, from north to south, are: • Lotus Creek, •
Campbell ,
•
Gilbert,
•
Leichhard t, and
• Roper. Only Gilbert and Roper Pits have been develope d at this time.
GEOLOGY
Norwich Park is located on the relatively undeform ed western limb of the northern Bowen Basin astride the boundary between the Collinsville Shelf and the Comet Platform. Economic coal seams pass laterally, south to north, from the upper section of the marine-in fluenced German Creek Formatio n into the lower section of the terrestrial Moranba h Coal Measures , via a gradual fades change (Figure 2). The four major stratigrap hic units in descendin g order are: • Fort Cooper Coal Measures, •
Macmillan Formatio n,
•
Moranba h Coal Measures, and
•
German Creek Formatio n. Bowen Basin 1995 - Sympos ium
370
r ■
".A.
LEGEND Operating Mine Deposit
Eungella Dam
Nebo West Extended
Wards We Wards Well ··
REG IONA L LOCALITY MAP 0
10
Figure 1.
Bowen Basin 1995 _ Sympo sium
~~ 20
30
40
'
371
STRATIGRAPHIC SUCCESS ION AND SEAM CORRELATION lsuc River Area
Peak Downs Mine
SaraJI Mine
Norwich Park Mine
-
GOONYELLA UPPER
-
GOONYELLA MIDDLE
GOONYELLA LOWER
Figure 2. The German Creek Formation contains abundant quartzose sandstone with lesser lithic sandstone, siltstone and mudstone. Throughou t much of Norwich Park the upper part of the formation also contains economic coal seams. The German Creek Formation is overlain by and grades laterally northwards into the Moranbah Coal Measures, which are characteris ed by quartz-poo r, labile sandstone, siltstone, mudstone and coal seams. The proposed Lotus Creek Pit marks the appropriate southern extent of the unit. The Macmillan Formation is a transgressiv e marine unit which, in the absence of the Moranbah Coal Measures, directly overlies the German Creek Formation. At the northern end of Norwich Park, the Macmillan Formation overlies the lower section of the Moranbah Coal Measures and grades laterally into the upper section. Tongues of Macmillan Formation sediments extend northwards to Harrow Creek in the Peak Downs mine. The rock unit comprises generally fine-graine d sediments and is recognised by the presence of bioturbated mudstone and siltstone and marine fossils. The Fort Cooper Coal Measures which overlie both the Macmillan Formation and the Moranbah Coal Measures, comprise labile sandstone, siltstone and thick seams of interbedde d coal, carbonaceo us mudstone and tuff aceous claystone. The Permian sequence is overlain unconform ably by 5 to 55m of poorly consolidate d Tertiary and Quaternary sediments comprising predomina ntly sand and clay, with irregular gravel beds and weathered basalt flows. There is a regional thinning of the unconsolid ated material in a northerly direction but localised thickening occurs in the vicinity of creeks which cross the lease, viz Scott, Rolf, Roper and Stephens Creeks. The depth of weathering tends to sub-paralle l the base of Tertiary and varies from 15 to 25m north of Leichhardt Pit to 25 to 50m in Leichhardt and Roper Pits. The Moranbah Coal Measures and German Creek Formation contain up to seven major coal-bearin g horizons. However, significant reserves are restricted to the Tieri and Dysart seams. Bowen Basin 1995 - Symposiu m
372
Coal seams present in descending stratigraph ic order are: NORTH
SOUTH
s
s
R
Q Pl
Ml (Pleiades)
P2
M2
Harrow Creek Upper
L (Aquila)
Tieri Harrow Creek Lower
J
Dysart T Rider
Dysart Rider
Dysart T
Dysart Upper N Dysart N
A generalised stratigraph ic column is presented as Figure 3. The Dysart seam is the main commercial seam at Norwich Park. It extends over the entire length of the lease and is subject to considerab le seam splitting and coalescence (Figures 2, 4, and 5). The Dysart interval contains from one to three seams and between 5 and 6m of coal. s (1 . 0 - 2.3m)
Mass i ve to bedded (120 .0 - 1215.0m)
COAL(0. 2m) Massive (7.0 - 12. 0m) COAL(0.3m) lnterbedded (B.0 • 14.0m) M1 (PLIEIAOES) (1 .2 - 2 . Sm) Bedded (2 . 0 - 7 . 0m)
:;4~.S1.:~ <::g~l . 3m) M3 (0 .3 - 1 . 0m)
LEGEND
Massive to bedded (115.0 - 29 . 0m)
-
r,~;?~-~~J Massive to bedded (21 .0 - 29 .0m)
j;:::::::::::::3
Coal Sands ton•
~
Siltstone
[l[IJ
C/aystone
TIEAI ( 1. 7 • 3 .0m) Laminated (0 .2 - 3 .15m) TIEAI LOWER (0.B • 1.3m)
lntarbedded to rnaa•lve (27 . 0 • 411.0m)
J
(0.3m)
lntarbadded to laminated (17 . 0 - 35 . 0m)
DYSART AIDER
(0.9 - 1.3m) Laminated (0.1 -1 9 . 0m)
OVSARTN <• .o - 5 . 2m)
Massive
GENERAL ISED STRATIG RAPHIC COLUMN NORWICH PARK
Figure 3.
Bowen Basin 1995 - Symposiu m
373
LOTUS CREEK PIT-+-CAM PBELL PIT---+-GIL BERT PIT+LEICH HARDT PIT+ROP ER
PIT
SCHEMAT IC LONG SECTION DYSART SEAM(S) NORWICH PARK
Figure 4. The main part of the Dysart seam is 2.Sm thick in the northern Lotus Creek Pit, increasing to 3.5 to 4.5m further south. The rider seam is 1.2 to I.Sm thick except in the far north, ~here it reaches 3m in thickness. In the absence of the Dysart Rider, the Dysart seam can be divided into three plies: • a stone-band ed upper ply, up to one metre thick, of dull to dull banded coal; •
a 2m thick, clean middle ply of dull-bande d to interbande d coal; and
• a lm thick, heavily stone-band ed, moderately bright basal ply. Strike swings from northwest in the northern pits to north-south in Leichhardt and Roper Pits. Dip is to the east but varies, from 2° to 4 • (or less) in Roper Pit, to 5 • in Campbell Pit, 8 • in Gilbert Pit (locally 13 °) and an average 11 • in Leichhardt Pit. A structurally complex area in Leichhardt Pit occurs in a northeaster ly trending zone approximat ely 2km wide, bounded by the Leichhardt South Fault to the south and the Norwich Fault to the north. The Leichhardt South Fault is a major, normal, step fault oriented north to northeast, with a throw of 11 to 30m down to the east. The Norwich Fault is a northeaster ly trending normal fault with a throw of 30 to 60m, down to the southeast. The area between these major faults contains numerous reverse and thrust faults which cause interseam thickening and seam repetition. Two north-east trending normal faults, with throws in the order of 10m down to the south-east, have been delineated in Roper Pit. The Dysart seams have suffered several periods of intrusion and coking. Most coked coal is associated with concordant , acid to intermedia te sills which intrude coal seams or adjacent roof strata. The sills are probably Cretaceous in age and extend over large areas of the lease. Minor coked coal is associated with discordant, basic, Tertiary dykes which preferentia lly intrude northeaster ly trending tension faults or joints. Structural features and coked areas are shown in Figure 5. Bowen Basin 1995 - Symposiu m
374
"" l '
I
'~
7 500000mN
~'~
\~~~ '
\
:.-\
'
7 495000mN
7 490000mN
7 485000mN
LU
E
0
8 7 480000mN
NORWICH PARK MINE DYSART SEAM SPLIT BOUNDARIES FAULTING and LIMITS OF COKED COAL
4
0
Fault, showing throw (m )
-~,.~~i ~'®
M ined Areas
~ Coked Coal 2
3
LU
E
0
4km
8
§
Figure 5.
Bowen Basin 1995 - Symposium
375
TABLE 1. NORWICH PARK COKING PRODUCT Chemical Analysis Total Moisture (as received) Volatile Matter (air dried) Ash (air dried) Sulphur (air dried) Crucible Swelling Number Phosphorus (in coal) Alkali (in ash) Dilatation Maximum Contraction Maximum Dilatation
10.0% 17.2% 9.9% 0.65% 9 0.03% 1.3% 24% +30%
Gieseler Plastometer Plastic Range Maximum Fluidity
55·c 25ddpm
Mean maximum Reflectance of Vitrinite Macera! Composition Vitrinite Exinite Semi-Fusinite Other Inertinite Mineral Matter
COAL QUALITY
1.60% 73% 0% 14 8% 5%
Production is currently confined to the Dysart seams in Gilbert and Roper Pits. A~erage quality of product coking coal is presented in Table 1. The coal is hard coking, low volatile, low fluidity, high swell and has excellent Coke Strength after Reaction (CSR). Norwich Park produces two other products: • an ultra low volatile (ULV) coal which, on an air dried basis has 16.5% volatiles, 11.5% ash, 0.62% sulphur and a swell of 8 to 9; and Scott Creek thermal coal which, on an air dried basis has 17.5% volatiles, 12.5% ash, 0.60% sulphur and 8 to 9 swell.
COAL RESOURCES AND RESERVES
In situ coal resources in seams greater than 0.7m thick to 60m depth and greater than 1.5m thick below 60m depth, as at 31 May, 1995, stood at:
Resource Category
Tonnes x 1000
Inferred
137 674
Indicated
263 490
Measured
187 761
Coal quality cut-off was 50% theoretical yield at 9.5% ash. Open-cut coal reserves to a depth of 90m, based on the same thickness and coal quality criteria, also at 31 May 1995, were: Reserves Category
Tonnes x 1000
Mineable In situ
225 960
Recoverable
196 959
Marketable
139 977
Estimation method was Irregular Block Kriging and factors applied were: •
Specific Gravity 1.41 to 1.47; Bowen Basin 1995 - Symposium
376
FUTURE DEVELOPMEN T
•
Mining Recovery 88.1%; and
•
Wash Plant Recovery 70.4% .
Plans for future development involve commencement of operations in presently unmined pits and broadening of the coal quality base to include coal from the Tieri seam.
ACKNOWLEDGMENTS Source material for this paper was derived largely from a presentation give to the Bowen Basin Geologists Group by KW O'Reilly (O'Reilly, 1988), updated and supplemented by data made available by the Planning, Exploration and Development Department of BHP Australia Coal Pty Limited in Brisbane.
REFERENCES
BHP AUSTRALIA COAL PTY LIMITED, 1994: Description of Operations. Prepared by Public Affairs Department, BHP Australia Coal Pty Limited. O'REILLY, K., 1988: The Geology of Norwich Park. Presentation given at the Bowen Basin Geologists Group Meeting, Norwich Park 22-11-88. BHP Australia Coal Pty Limited Report. UTAH DEVELOPMENT COMPANY LIMITED STAFF, 1985: Peak Downs Mine, Harrow Creek Trial Colliery, Saraji Mine and Norwich Park Mine. In, Bowen Basin Coal Symposium, Geological Society of Australia, Abstracts, 17, 287-290. BHP Australia Coal Pty Ltd.
Bowen Basin 1995 - Symposium
377
THE PEAK DOWNS MINE LOCATION
The Peak Downs Mine is located approximately 200km southwest of Mackay between the townships of Dysart and Moranbah (Figure 1). Developed pits extended over a 27km strike length of the Moranbah Coal Measures in a northwesterly direction from the northern end of Saraji Mine. The proposed Isaac River Mine, now considered part of Peak Downs, takes in the northernmost Heyford Pit and provides additional reserves for future expansion towards the Moranbah Airport. The economic coal seams are continuous southwards into Saraji and northwards into the Moranbah region and Goonyella/Riverside. Peak Downs is linked by rail to the port of Hay Point.
TENURE AND HOLDER
Mining is carried out by the Central Queensland Coal Associates (CQCA) under Mining Lease 1775. Peak Downs is one of four, large, open-cut mines operated by CQCA along the northwestern flank of the Bowen Basin. The other mines are Goonyella-Riverside, a combined operation with BHP Mitsui Coal Pty Ltd, Saraji and Norwich Park.
DEVELOPMENT HISTORY
During the 1960s the Utah Development Company drilled a wide strip of country along the western side of the northern Bowen Basin under Authorities to Prospect 6c and 67c. The economic seams at Peak Downs were discovered during this exploration. The Peak Down mine was constructed in 1970-72 with the first coal mined in April 1972, at a planned capacity of over 5Mt per annum of washed product coal. Open-cut mining has continued uninterrupted with current annual coal production of in excess of 6Mt. Between 1978 and 1986 the Harrow Creek Colliery operated as a trial underground mine using a bord and pillar mining system.
MINING METHODS
Mining is carried out by open-cut strip mining methods using six draglines, supplemented by a truck-shovel fleet for overburden removal and a smaller dragline for parting removal. The coal uncovered is blasted, mined by a face shovel or front end loaders and carried to the crusher station by 195t coal haulers. The coal is blended before processing in the wash plant, which utilises heavy media cyclones and flotation cells for beneficiation into a single coking coal product. For operational purposes the mine is divided into nine pits named, from north to south, Heyford, Winchester, Harrow Creek, Possum, Ripstone, Yura North, Wattle, Yura South and Boomerang (Figure 2).
GEOLOGY
Peak Downs is sited on the relatively undisturbed western limb of the northern Bowen Basin towards the southern end of the Collinsville Shelf. The Permian coal measures strata exhibit a gentle regional dip of 3 • to 6 • to the east. Economic coal seams occur in the wholly terrestrial Moranbah Coal Measures, a rock unit some 300m in thickness characterised by labile sandstone, siltstone, mudstone, tuffaceous claystone and coal. The Moranbah Coal Measures are underlain by the German Creek Formation, a marine-influenced formation represented by quartzose to liibile sandstone, siltstone, mudstone and a few thin coal seams; and overlain by the Fort Cooper Coal Measures which contain thick, uneconomic seams of interbanded coal, carbonaceous mudstone and tuffaceou_s claystone. Bowen Basin 1995 - Symposium
378
Collinsville r
■
LEGEND Operating Mine
•
Deposit
Eungel/s Dam
Nebo West Extended
REGIONAL
- ■HP
~~~"':~' ~bMuea
149
Figure 1.
Bowen Basin 1995 - Symposium
-
379
.rt ··· -- -
w
E
r~---fl
0
§ N -0
/ ciie;;.,e11 ••• .
........ __ ,:
7540000mN
... -· ,.-._)
.. ........___ ....
___/"-.-,_,- _
/_.-
~(
Q) \ Q) ;
7530000mN
o? :
i
PEAK DOWNS MINE PIT LAYOUT and LEASE HOLDINGS
~ (-/
~(
f ) ,.a_,/
Mined Areas
~
0
1
2
3
4Krm
/
:'
__
./
Figure 2.
Bowen Basin 1995 - Symposium
Saraji Mine
380
TABLE 1. PEAK DOWNS TYPICAL PRODUCT PROPERTIES. Chemical Analysis Moisture (air dried) Total Moisture (as received) Volatile Matter (air dried) Volatile Matter (dry ash free) Ash (air dried) Sulphur (air dried) Crucible Swelling Number Phosphorus (in coal) Alkali (in ash) Nitrogen (dry ash free) Ruhr Dilatometer Max Contraction Max Dilatation Gieseler Plastometer Maximum Fluidity Mean Max Reflectance of Vitrinite Maceral Composition Vitrinite Exinite Semi-fusini te Other Inertinite Mineral Matter HGI SE (air dried)
1.0% 10.0% 21.0% 23.5% 9.7% 0.60% 9
0.04% 1.4% 2.1% 25% +85% 350ddpm 1.40% 72%
0% 14% 9% 5% 95 7760Kcals/kg 32.5MJ/kg
In the north, remnants of Tertiary basalt flows overlie the Permian sequence while in the south, Quaternary sands and clayey sands up to 30m thick have accumulated along the course of Boomerang Creek. Seven coal-bearing horizons are recognised at Peak Downs, with seam splitting and coalescence common. Several laterally continuous, relatively thick mudstone partings in the major seams maintain thicknesses of 0.2 to 0.3m over tens of kilometres. The only seams currently mined are the Harrow Creek and Dysart seams. Each of the seams, in descending stratigraphic order, is briefly described below:•
The S-seam is the stratigraphically highest seam, and is the basal seam of the Fort Cooper Coal Measures. It is 3 to 4m thick, of high inherent ash and contains numerous thin claystone partings.
•
The R-seam is 1 to 2m thick and also of high inherent ash.
•
The Q-seam comprises one or two coal intervals, with the combined seam 2 to 3m in thickness.
•
The P-seam exhibits up to 3 seam splits and is associated with the P-tuff, a 1 to 2m thick unit which has regional correlation significance.
•
The Harrow Creek seam is up to 12m thick where fully coalesced, but divides progressively to north and south, producing up to five splits.
•
The Dysart Upper seam is represented by a single seam or up to three splits, attaining a maximum thickness of 3.Sm.
•
The Dysart Main seam reaches 6.Sm in thickness and divides into three splits.
A seam correlation diagram is presented as Figure 3 while Figure 4 shows seam subcrop locations. Bowen Basin 1995 - Symposium
381
17GI
ll'!lll 17111
174411
17GO
:17511
174'0
174V 17411
17111 1740
17447
17421
17115
l7Jl2
l7WO
lnl7
173a
17514
174411
-71
17515
17517
17111
17111
11'N1
l7lll!
NORTH
100
~-.. '•:- ., .• y-.,-_;-;;-..r.,yyyY
··:•
\
\
_____ ./I
Deplh in metres
200
20 kilomelres
300
STRATIGRAPHIC LONG SECTION PEAK DOWNS
Figure 3. Several major faults with throws up to 40m have been identified. Most are high-angle normal faults with trends east-west, north-south and northeast southwest (Figure 4). Fault frequency increases southwards. Shallow folding or warping occurs on a northeast-southwest orientation and appears to predate most faulting events. The Winchester Fault is a southeast to easterly trending normal fault downthrown to the east. It occurs between Heyford and Possum Pits on the eastern side of the lease and produces vertical displacements rangittg from 6m to 40m. The Possum Fault comprises three en-echelon segments extending northeast across the Peak Downs access road/railway corridor. Throw varies from 5 to 25m down to the south. The Ripstone Fault is oriented northeast and throw is 4 to 15m down to the north. It is recognised over a distance of at least 1.8km. The Yura North-Harrow Creek Graben is an offset and discontinuous structure running east-west across the lease. Blocks 150 to 300m wide are bounded by high angle, normal faults with throws of 3 to 20m. The Yura North Fault trends east-west. Throw is 3 to 9m down to the north. The Yura South Fault is an arcuate fault some 1.3km in length trending north to northwest. Throw is 10 to 25m down to the west. The Yura Structure, flanked on the northern side by the Boomerang Fault produces a marked indentation in the Dysart seam subcrop. Bowen Basin 1995 - Symposium
382
w
./ ___ ; i __ _ ( Cherwell ~
...\)
7540000mN
7530000mN
Saraji Mine
...
l
0
2 _....1.._....1.._...ia _
•4Km•
Figure 4.
Bowen Basin 1995 _ S ymposium
'
\
383
The Boomerang Fault is a complex system of discontinuous faults and fault blocks oriented east-west in the vicinity of the Yura Structure, then changing direction down-dip to east southeast. Throw varies from 6 to 17m down to the north. East-west oriented basic dykes, in part fault-related, have locally coked the coal seams. A trachyte sill has been intersected in recent exploration drilling in the vicinity of Harrow Creek.
COAL QUALITY
Peak Downs is a one product mine. Current production is derived from the Dysart and Harrow Creek seams. The product is a hard coking, medium volatile, bituminous coal with typical properties as shown in Table 1. The main attributes are high coke strength after reaction (74), low oven wall pressure exerted during coke making (<0.5psi) and low sulphur. There is an increase in coal rank with seam depth, with volatile matter and fluidity decreasing to the east.
COAL RESOURCES AND RESERVES
As at 31 May, 1995 total in situ coal resources at Peak Downs stood at:-
Resource Category
Tonnes x 1000
Inferred
25 515
Indicated
362 803
Measured
1 116 940
These figures relate to seams:greater than 0.7m thick to 60m depth; •
greater than 1.5m thick beyond 60 depth; and
•
with a cut-off of 50% theoretical yield at 9.5% ash.
Open-cut reserves, also at 31 May 1995, calculated to a 90m depth and using the same constraints as above, are as follows:Tonnes x 1000
Reserve Category
Mineable In situ
482 785
Recoverable
429 299
Marketable
280 489
Estimation method was Irregular Block Kriging and factors applied were:-
FUTURE DEVELOPMEN T
•
Specific Gravity
1.418 - 1.447;
•
Mining Recovery
88.9%; and
•
Plant Recovery
65.3%.
With a large reserves base, open-cut mining is expected to continue at Peak Downs for many years. In the near term, the imminent development of the Wattle North pit will augment production from existing pits. Underground prospects are presently under review as part of a broader investigation which includes the recently acquired Exploration Permit for Coal 564, Peak Downs East.
ACKNOWLEDGMENTS The information contained in this paper is sourced mainly from a
presentation given to the Bowen Basin Geologists Group by KW O'Reilly Bowen Basin 1995 - Symposium
384
(O'Reilly, 1994), supplemented by data made available by the Planning, Exploration and Development Department of BHP Australia Coal Pty Limited in Brisbane.
REFERENCES
BHP AUSTRALIA COAL PTY LIMITED, 1994: Description of Operations. Prepared by Public Affairs Department, BHP Australia Coal Pty Limited. O'REILLY, K, 1994 : The Geology of Peak Downs, Text of a Presentation given at The Bowen Basin Geologists Group Meeting at Peak Downs on 12 May, 1994. BHP Australia Coal Pty Limited Report. UTAH DEVELOPMENT COMP ANY LIMITED STAFF, 1985: Peak Downs Mine, Harrow Creek Trial Colliery, Saraji Mine and Norwich Park Mine. In, Bowen Basin Coal Symposium, Geological Society of Australia, Abstracts, 17, 287-290. BHP Australia Coal Pty Ltd
Bowen Basin 1995 - Symposium
385
THE PIPELINE COAL DEPOSIT LOCATION
The Pipeline coal deposit is located approximately 10km south-east of the town of Collinsville and immediately east of the Newlands/ Abbot Point railway line in the northern Bowen Basin. Tenure is currently held by Mount Isa Mines Limited (MIM) under Exploration Permit (Coal)253 which comprises two sub-blocks. An application for Mineral Development Licence covering the Pipeline deposit has been lodged with the Department of Minerals and Energy (Figure 1).
EXPLORATION HISTORY
EPC253, comprising 264 sub-blocks, was originally granted to MIM in 1979. Extensive exploration drilling identified numerous small coal occurrences including the Pipeline deposit. Major phases of exploration occurred between 1981 and 1983 by which time the main coal occurrences in the tenement had been identified. Mining of the Pipeline deposit had been reviewed briefly from time to time and, although regarded as the most prospective of all coal deposits within the tenement, no economic strategy had been determined . Follow-up drilling occurred on the Pipeline deposit during 1992/93. Exploration drilling within EPC253 totals 821 drillholes aggregating 46 630m of chip and slim core drilling. Other exploration techniques have included resistivity and ground magnetics surveys over several deposits. By 1985 major subblock relinquishments had reduced the area of the tenement to thirty sub-blocks contained in six groups covering the previously identified coal deposits. Further exploration was undertaken on the Pipeline deposit in 1992. This work was designed to improve the definition of coal seam structure and extent, the effect of igneous intrusions on the coal, provide samples for detailed coal quality analyses and provide large diameter drillcore for washability testing. An aerial survey was completed which provided for compilation of a detailed topographic basemap and photographic coverage of the deposit. Field mapping of railway cuttings to the west of the deposit was undertaken. All early drillholes were located in the field and then surveyed. Twenty holes were drilled comprising fifteen non-cored holes, two partly cored 62mm holes and three partly cored 150mm holes. All non-cored holes were geophysically logged. The Pipeline deposit is currently defined by 44 drillholes totalling 1305m(Figure 2). By 1994 EPC253 was due to expire and application for a mineral development licence was made over the Pipeline deposit.
GEOLOGY
The Pipeline deposit represents a small, shallow coal resource interpreted to be within the Permian age Moranbah Coal Measures (Scott, 1987), located approximately 2km west of the Collinsville Fault. The deposit comprises a single coal seam - the Q Seam - containing a low to medium quality steaming section and a high quality coking section. The steaming section overlies the coking section and results from devolatilisation caused by proximal igneous intrusions. Thickness of the steaming section is between 1.5-2.0m with the underlying coking section maintaining a thickness of about 3.0m over most of the deposit. A persistent mudstone parting averaging 0.30m thick has been identified, however, this parting does not necessarily separate the coking and thermal coal sections, however, it is generally identifiable across the deposit regardless of the effects of the intrusion. Some areas of the Pipeline deposit contain a coking section only, other areas contain the steaming section only, while in others varying thicknesses of both coal sections are present. The igneous intrusion has "overprinted" on the original internal coal seam structure/stratigra phy. The limits of the Pipeline deposit are defined by seam subcrop in the north and east, igneous intrusion to the west and 60m overburden thickness to the south. Overburden, below the base of weathering, consists of light grey, fine to medium, quartz-lithic sandstone, light grey siltstone and igneous bodies. Igneous rocks have usually decomposed to soft white clays, however, where a Bowen Basin 1995 - Symposium
386
,
:~
__ ,.../ __.,,-,'
\~
./
:
\~
)~
/ 1·' -'l • v•
/'-__/ e,e,,,..., .. ' A~
:~/,
,
__ _,
'
\,
i
a::
0
250 Kilometres
500
t
~
w
2
Q.
0 _,
~
Cl
N I
z ~
0
co
0
2
3
4
5
Kilometres
FIGURE 1
LOCATION OF PIPELINE DEPOSIT Figure 1. Location of Pipeline deposit. Bowen Basin 1995 - Symposium
551/r
\ \
\
\'6
\'c, \~
,~
\%-
\~ \-o \'<>
;;;
C
'"'
\~ \ \ \
t:: I.
0
\
\
~ I
... i., I ..
\ \ \
\
►
\ \
~
•
\
rJ'J
'<
9
',::I
,,,0... s::
9
LEGEND 2ool!!!las~o-. . . .-2il!o!!o!!!!!!!!!!!!!!!!!!400 metres
551/r
Surface contour level
MIM Drillhole
Block/Sub- block
Area of Mineoble Reeervea
FIGURE 2
DRILLHOLE LOCATION PLAN ~
Figure 2. Drillhole location plan.
00 ..:.i
388
fresh occurrence has been observed it is hard, grey-green, and crystalline containing disseminated pyrite. The base of weathering, as noted in drill-logs, is variable between 5-lSm thick. Preliminary testing of overburden samples indicates that overburden material does not have any potential for toxicity.
COAL QUALITY
While the Pipeline deposit can produce both coking and steaming coal, current evaluation suggests greater potential in combining both coke and steam sections to provide a washed product suitable for the PCI (Pulverised Coal Injection) market. Typical product analysis of the full seam is given in Table 1. TABLE 1. TYPICAL WASHED ANALYSIS - FULL SEAM Proximate Analysis (%ad) Inherent Moisture Volatile Matter Ash Fixed Carbon Washing Yield(%) Specific Energy (MJ/kg ad) Total Sulphur (%ad) HGI Ultimate Analysis (%daf) Carbon Hydrogen Nitrogen Ash Fusion Temperature ("C) Reducing Initial Deformation Hemisphere Flow
COAL RESOURCES
1.5 22.8 10.8 64.9 75 31.08 0.44 76 76.62 4.25 1.62 1220 1390 1460
The measured and indicated in situ coal resource contained in the Pipeline dep~sit is approximately 6 million tonnes at an overburden to coal ratio of <Sm /t. Mineable in situ reserves of 2.7Mt are comprised of 1.8Mt of co~ing coal and 0.9Mt of steaming coal at <30m depth.
FUTURE PROSPECT S Due to its small size and consequently short operating life, the concept of
mining the Pipeline deposit would be ideally suited to a contractor operation. Feasibility studies have considered trucking ROM coal to the Collinsville Coal Mine facilities or the establishment of mobile facilities with on-site rail load loading. At the present time MIM is continuing to assess various options and their potential for establishing a commercial mining venture for the Pipeline deposit. Further exploration is not c_o nsidered warranted at this stage.
REFERENCES
SCOTT, S.G., 1987: Stratigraphic Drilling in the Northern Bowen Basin. Geological Survey of Queenslana, Record, 1987/53. Phillip Sides Mount Isa Mines Limited
Bowen Basin 1995 - Symposium
389
THE POITREL COAL DEPOSIT LOCATION
The Poitrel coal deposit is located some 25km southeast of Moranbah and 150km south-west of Mackay (Figure 1). It extends over approximately lOKm from south of the Isaac River to within 7km of the Peak Downs Highway. The Peak Downs - Hay Point Railway passes to the east of the deposit. The coal measures are contained within a synclinal drag fold structure between the Isaac and New Chum Faults. To the east, the seams are repeated in the Mavis Downs and Daunia tenements. To the west and north, potentially economic coal occurs in the Wotonga and Morambah tenements.
EXPLORATION HISTORY
The Poitrel coal deposit was discovered by Thiess Peabody Mitsui Coal Pty Limited (subsequently BHP Mitsui Coal Pty Limited) in the late 1960s during exploration carried out under Authority to Prospect 3C. The company systematically mapped and drilled both the Moranbah and Rangal Coal Measures in the central-northern Bowen Basin and succeeded in locating the nearby Morambah and Wotonga deposits and the more distant Kemmis-Walker, Bee Creek, Suttor Creek, Lancewood, Wards Well and Riverside deposits. Grouped together, these deposits constitute what the company termed the Nebo Resource Area. Drilling of the Poitrel deposit to Measured Resources status was carried out during the early to mid 1970s and was followed by a mining study in 1976. Mining Leases 366 Mackay (Poitrel) and 261 Clermont (Winchester), since renumbered ML 4749 and ML 1791 respectively, were granted on 1 August 1978. Unfortunately, secured markets for the coal could not be negotiated at the time, leading to deferment of plans for development. Intermittent drilling programmes continued until 1981, at which time a second mining study was undertaken. The late 1980s saw a small number of additional core holes drilled to test coal product options. In 1994 the identification of potential new markets led to an updated mining study and a new deposit development strategy.
GEOLOGY
The geology of Poitrel has previously been discussed by Sedgman & Milligan (1975), Quinn (1985) and Mallett & others (1988). Poitrel is located in the northern Bowen Basin within the southern extension of the Burton Range Fault system, which represents the boundary between the structurally simple Collinsville Shelf and the deformed Nebo Synclinorium. The economic seams are contained within the Late Permian Rangal Coal Measures which lie within a shallow synclinal structure between the Isaac Fault to the west and the New Chum Fault to the east. Both faults are major, high angle thrust features with west-side-down vertical displacement of up to 300m for the Isaac Fault and 150m for the New Chum Fault. Dips within the coal measures strata range from flat lying to 10·, but dips above 6 • are rare. The area is divided into a series of fault blocks, usually one to several kilometres across, separated by conjugate fault sets displaying throws form several metres to 30m or more. The fault set trending north-north-west, subparallel to the New Chum Fault, appears to comprise mostly reverse faults associated with gentle anticlinal and synclinal folds. The set trending east-north-east are usually interpreted as normal faults. Internal disruption within fault blocks appears minimal. The Rangal Coal Measures are approximately 100m thick and are conformably underlain by the Fort Cooper Coal Measures and overlain by the Late Permian to Early Triassic Rewan Group. The Rangal Coal Measures comprise light grey, cross-bedded, fine to medium-grained, labile sandstones, grey siltstones, mudstones and coal seams. Cemented sections are common in the sandstones. Bowen Basin 1995 - Symposium
390
Collinsville ■
LEGEND Operating Mine
•
Deposit
S£4
,''". ~ ·
Eungel/a Dam :<
Nebo West Extended
220 _ _ _ _ __
Figure 1. Bowen Basin 1995 - Symposium
391
TABLE 1. POITREL COAL DEPOSIT TYPICAL PRODUCT COAL QUALITIES. Thermal Coking Chemical Analysis 2.4% 2.0% Moisture (ad) 22.0% 25.5% Volatile Matter (ad) 12.0% 8.7% Ash (ad) 0.35% 0.45% Sulfur (ad) 0.006% 0.060% Phosphorus (in coal) Gieseler Plastometer 413·c Initial Softening Temp. 451 ·c Max Fluidity Temp. 486°C Resolidification Temp. 73·c Plastic Range 1300ddpm Maximum Fluidity Petrographic Analysis 1.12% 1.16% Mean ~ax. Reflectance of Vitrinite Maceral Analysis 39% 61% Vitrinite 2% 3% Liptinite 50% 33% Inertinite 9% 3% Mineral Matter Other Properties 1 7 CSN (FSI) 30.70MJ/kg 30.00MJ/kg Specific Energy (ad) 71 HGI 14oo·c Initial Deformation Temp. (reducing atmos.)
Potentially economic coal occurs within two seams, the Leichhardt and Vermont seams. The Leichhardt seam, located 15-60m below the base of the Rewan Group, is a 4 to 6m thick seam of clean coal which is brighter towards the base. It contains two marker beds; a dark grey to brown mudstone parting approximately 4cm thick, approximately lm from the seam roof; and a brown tuffaceous band towards the seam floor. In general, the seam deteriorates in quality from north to south and from east to west. A stone-banded basal split some 0.Sm thick occurs in the north of the area. The Vermont seam is located 15-60m below the Leichhardt seam and comprises three plies:1
a 1.5-2.lm thick upper ply of clean, bright coal which is considered the only economic part of the seam;
2
a middle ply of high inherent ash, low yield, dull coal, some 1.2m thick, usually separated from ply 1 by a dark mudstone bed; and
3
an uneconomic basal ply of interbedded inferior coal, carbonaceous mudstone and tuffaceous claystone several metres thick. Ply 3 is separated from ply 2 by the Yarabbee Tuff Bed, a basin-wide marker bed of brown, weak, tuffaceous claystone which is taken as the boundary between the Rangal Coal Measures and the underlying Fort Cooper Coal Measures.
Along the course of the Isaac River and in the Winchester area, alluvial deposits of quartz sand and clays have accumulated above the Permo-Triassic sequence to depths of up to 22m. In the southeast a granodiorite boss has intruded the Fort Cooper Coal Measures outside the subcrop of the Rangal Coal Measures but little destruction of coal seams has resulted. Within the Poitrel resource area evidence of past intrusive activity is limited to minor dyke invasion of fault lineaments in the south. Depth of oxidation within the economic seams is usually between 12 and 25m. Figure 2 shows the surface geology of the Poitrel area, a typical stratigraphic section and coal brightness profiles for the Leichhardt and Vermont seams. Bowen Basin 1995 - Symposium
392
TYPICAL GRAPHIC LOQ8
LEICH HARDT SEAM
POITREL GEOLOGY
VERMOIIT SEAM
TYPICAL STRATIGRAPHIC IIECTlON
r~ I/
,-
} • ,,,
.(
-
•!
l \lllllN
'
:)~::~ •
I
I
411111
VERTICAL SCALE 0 211 40m
I
REFERENCE
-
Faun
ML17 WINCHES
- - -- Tertiary cover -
Rewan Group Ranga/ Coal AlfllJSUfflll
JII: FortCooper CoaJM11u ures Figure 2.
COAL QUALITY
The coal at Poitrel is medium volatile bituminous with moderate raw ash and low sulphur. The Leichhardt seam is capable of producing both thermal and metallurgical products while the top ply of the Vermont seam is primarily suited to coking uses. Typical product coal qualities are listed in Table 1.
COAL RESOURCES
Measured Resources calculated for the Poitrel deposit for seams considered to be economically mineable are: Tonnes (x10 3 ) Seam 134 000 Leichhardt 55 000 Vermont (top ply only) 189 000 TOTAL Recoverable coal reserves, to a depth of cover of 70m on the Leichhardt seam, are 83.9Mt at a prime ratio of 6.4 bcm/tonne. The calculations are based on a coal relative density of 1.4.
FUTURE PROSPECTS A small drilling programme is presently in progress to confirm coal quality for possible trial mining. Current plans involve a mining operation carried out in conjunction with the adjacent Daunia deposit of the Central Queensland Coal Associates, using joint infrastructure facilities.
REFERENCES
MALLETT, C.W., HAMMOND, R.L., LEACH, J.H.J., ENEVER, J.R. & MENGEL, D.C., 1988: Bowen Basin - Stress, Structure and Mining Conditions Assessment fo r Mine Planning. NERDDC Project No. 901 Final Report. CSIRO Institute of Minerals, Energy and Construction, Division of Geomechanics. QUINN, G.W., 1985: The Nebo Resource Area. In, Bowen Basin Coal Symposium, Geological Society of Australia Abstracts, 17, 261-274. SEDGMAN, J.B. & MILLIGAN, E.N., 1975: Poitrel-Burton Downs District. In, D.M. Traves & D. King, (Editors): Economic Geology of Australia and Papua New Guinea - 2: Coal. Australasian Institute of Mining and Metallurgy Monograph, 6, 134-137. BHP Australia Coal Pty Ltd. Bowen Basin 1995 - Symposium
393
SARAJIMINE LOCATION
Saraji Mine is located 250km by road south-west of Mackay with the industrial area sited 25km north of the mining township of Dysart (Figure 1). Peak Downs Mine borders Saraji to the north while Norwich Park Mine marks its southern boundary. The mine is connected by rail to the coastal ports of Hay Point, Dalrymple Bay, Port Clinton and Barney Point with the majority of coal exported via Hay Point (95%).
TENURE & HOLDER
The leases on which Saraji Mine operates, Mining Lease (ML) 1775 Peak Downs and ML 1782 Norwich Park (Figure 2), are held by the Central Queensland Coal Associates and are managed by BHP Australia Coal Pty Limited. The joint venture participants and their current interests are: •
DEVELOPMENT HISTORY
BHP
44.72%
QCT. Resources
27.78%
•
Mitsubishi
13.33%
•
AMP
8.61%
•
Pancontinental
5.56%
The Utah Development Company in the mid 1960s discovered seams of high grade coking coal along the western flank of the northern Bowen Basin under Authorities to Prospect 6C and 67C. The coal resources were evaluated, with title holdings subsequently reduced in size and the more significant deposits eventually converted to Special Coal Mining Leases (SCMLs). Mine construction commenced in 1972 and coal was first shipped from Hay Point in December 1974. Between 1974 and May 31, 1995 Saraji produced 90.4Mt of coking coal for export.
MINING METHODS
Saraji is an open cut coal mine with a current operational strike length of . 24km. The mine is divided into seven pits, named from north to south, Acacia, Bauhinia, Coolibah, Dogwood, Ebony, F!ddlewood and Grevillea (Figure 2). Tr,ere are five electric draglines (46m ) g_n~ one electric overburden shovel (33m ) which remove approximately 48x10 m (prime) to uncover 8Mt of raw coal per annum. The overburden shovel removes the top 15m of overburden which is transported by eight, 180t class rear dump trucks, across in-pit bridges, and used for regrading previous dragline spoil to a final profile on which reclaimed top soil is spread. In the northern half of the mine, this material comprises Cainozoic clays, sands and minor gravels. In the south, weathered and fresh Permian sediments predominate, supplemented by alluvium associated with surface drainage. Perched water tables occur where Cainozoic sediments are thickest, mainly in Acacia and Bauhinia Pits and at the southern end of Grevillea Pit adjacent to Phillips Creek (Dreschsler, 1982). When fresh Permian sediments requiring blasting lie beneath the unconsolidated sediments in Bauhinia and Grevillea Pits, floor preparation is undertaken by placing fresh Permian sediments on the pit floor via blasting or parting placement (Parminter & Toomey, 1992). This provides a stable base for the upper pass (Cainozoic material) of a two pass dragline operation. The dragline then operates from an in-pit bench and removes the Permian sandstones and siltstones after blasting. Bowen Basin 1995 - Symposium
394
Collinsville ■
.A
LEGEND Operating Mine , Deposit
Eungel/s Dam
Nebo West Extended
220 1 - - --
----
SARAJI
REGIONAL
~~~1:~ ! ~mwne
149
Figure 1.
Bowen Basin 1995 - Symposium
•
395
--
\
\
PIT LAYOUT
\
SARAJI
MINE
SCALE
p .____.,_...._......__.___,2y00m
I . {j
Mined Areas
••.,.•--'-- Fault Monocline
\
7525000mN
\ I
\
l
\
\
\
\ 7520COOmN
..
/•,
--··
I
)
..---·
_
751 SOOCrnN ••••H&o•••a.••••••• • • ••• ••• • • -- -- •
• • • • • u • • •••••••••••• • • ••• . . •••••••••••••••••• . . •••••••••••••••••••U••••••••••o•••• ••••
..
- - - -··
\
7510000mN
Figure 2.
Bowen Basin 1995 - Symposium
396
Coal is accessed from 11 ramps with an average grade of 4.5%. The coal haulage fleet currently comprises eight, 140t belly dump trucks, which deliver 7.8Mt per annum of feed to the ROM breaker station. Partings greate~ than 0.Sm thick are removed3 in-pit by either a hydraulic._3 excavator (13m ), front end loaders (9.2-18m ) or electric shovels (10.4m ). These units also load out the coal. Coarse plant reject is currently carted to spoil areas and disused ramps. Tailings dams have also been constructed with this material.
GEOLOGY
Saraji is located at the southern end of the Collinsville shelf, one of the structural elements of the Clermont Stable Block. The Permian sediments are relatively undisturbed with a gentle regional dip of 3 • to 5 • to the east. Minor faulting is common throughout Saraji, producing localised steepening of coal seam dips to >10° (Gruythuysen & O'Reilly, 1993). The four major Permian stratigraphic units in the lease area are, in descending order:Fort Cooper Coal Measures MacMillan Formation •
Moranbah Coal Measures German Creek Formation
The Fort Cooper Coal Measures directly overlie the MacMillan Formation and Moranbah Coal Measures. They have no current economic potential. The MacMillan Formation is a transgressive marine unit which in the absence of the Moranbah Coal Measures, directly overlaps the German Creek Formation. At Saraji it influences the chemical properties of seams that are in close proximity. The Moranbah Coal Measures (MCM) in part underlie the Fort Cooper Coal Measures and in part underlie and interfinger with the Macmillan Formation. They in turn overlie the German Creek Formation. The MCM Formation contains six coal bearing horizons. However, significant reserves are restricted to the Harrow Creek Upper and Dysart seams and their correlatives. Seam splitting and coalescence are common (Figures 3 & 4). At Saraji the German Creek Formation which underlies the MCM consists mainly of quartzose and labile sandstones, siltstones and mudstones. It also contains a few thin coal seams. The Perrnian sequence is unconformably overlain by up to 45m of poorly consolidated Tertiary and unconsolidated Quaternary sediments consisting predominantly of sand and clay with irregular gravel beds. Cainozoic alluvium is thickest along creeks which traverse west to east across the lease. These sediments can have a major impact in the operational area. The base of thick Cainozoic units in Acacia, Bauhinia and south Grevillea Pits act as aquifers which discharge at the highwall into the open pit. Perched water tables are generally 15 to 30m below the surface and require modified stripping methods when encountered. The majority of Permian coal seams in the area are major regional aquifers with larger flows occurring in the coked Harrow Creek Upper seam areas. A typical lithology profile of the Saraji overburden is illustrated in Figure 5. The interseam sequence between the Dysart and Dysart K seams constitutes a high proportion of highwall exposure. Sandstone is the dominant lithology within this interval in southern areas, occasionally extending down to and even eroding the top seams in Ebony Pit. Elsewhere, laminated to bedded siltstones with fine grained sandstone interbeds dominate the highwall. Seven depositional phases are evident in the Cainozoic sediments which cap the highwalls (Dreschsler, 1982). Weathering and alluviation of the sediments is evident, including at least three periods of lateritisation with associated Bowen Basin 1995 - Symposium
397
I I I I BOOMERANG I I I I I D70 I
I
I I I
ACACIA
BAUHINIA
COOLIBAH
DOGWOOD
EBONY
I FIDDLEWOOD I I I
![[[filll5iilllll!EElilll~D49 D19
I I
GREVILLEA
I I
SOUTHERN AREAS
w
D72
Dysart Seam Nomenclature Saraji Mine Figure 3.
STRATIGRAPHIC SUCCESSION AND SEAM CORRELATION Isaac River Area
Peak Downs Mine
Saraji Mine
Fort Cooper
Coal
Norwich Park Mine
Measures
+--
GOONYELLA UPPER
+--
GOONYELLA MIDDLE
+--
GOONYELLA LOWER
Figure 4.
Bowen Basin 1995 - Symposium
398
mottling. Deepest weathering within the mine occurs in association with thick Cainozoic sediments in Acacia, Bauhinia and Coolibah Pits. In contrast, the thick Cainozoic sediments in the south of Grevillea Pit directly overlie fresh massive sandstone and the base of weathering is relatively shallow. Past igneous activity has resulted in the intrusion of extensive thick sills which have coked the Harrow Creek Upper Seam downdip of Bauhinia Pit (Hughes Creek area) and throughout the area south of Phillips Creek. Two l.Sm wide dykes trend north-east across Ebony Pit with coked margins extending to 3m. Smaller dykes of similar orientation have been encountered in Bauhinia, Fiddlewood and Grevillea Pits.
COAL QUALITY
Saraji Mine is mainly a one product mine but has produced minor tonnages of a higher ash, lower volatile product. Current production is derived from the Dysart seams with minor tonnages sourced from J and Harrow Creek Lower seams. The product is a hard coking, medium to low volatile bituminous coal, with typical properties as shown in Table 1. The main attributes are high coke strength after reaction (CSR 73) low oven wall pressure exerted during coke making (- 0.5 psi) and low sulfur and phosphorus. Saraji blends through the ROM using volatile matter as the main quality indicator of coking properties. Washability characteristics and chemical properties are also considered. TABLE 1. TYPICAL PRODUCT COAL PROPERTIES. TYPICAL PROPERTIES Chemical Analysis Moisture (as received) Moisture (air dried) Volatile Matter (air dried) Ash (air dried) Sulfur (air dried) Crucible Swelling Number (FSI) Phostihorus (in coal) Alka i (in ash)
% % % % % %
Ruhr Dilatometer ·c Softening Temperature ·c Max. Contract10n Temperature ·c Max. Dilatation Temperature % Max. Contraction Max. Dilatation % Gieseler Plastometer ·c Initial Softeninf Temperature Tem~erature o Maximum Fluidity ·c ·c Reso idification ·c Plastic Ranfe Maximum luidity ddpm Petrographic Analysis V.Step V13 % Vl4 % VIS % V16 % V17 % Mean Maximum Reflectance of Vitrinite % Macera} Composition Vitrinite % Exinite % Semi-Fusinite % Other Inertini te % Mineral Matter %
Bowen Basin 1995 - Symposium
10.0 1.0 19.0 9.7 0.60 8.5 0.025 1.6
IN PIT RANGES
17.5-23.0 at yield 40%-95% 0.50-0.75 8.5-9.0 0.001-0.120 0.8-4.7
410 450 485 24 +65
10-160
435 475 505 70 160
30-2000
4 30 32 31 3 1.55 72 0 15 8 5
1.43 - 1.68
399
Typical Lithological Section of Saraji Overburden '
I T-1I CAINOZOIC
0-40m
00
Clays, sands and gravels
~111~
Weathered sediments 5-35m
1
Base of weathering (7-42m) DYSART "K" SEAM
lnterbedded siltstone and sandstone
3-40m
PERMIAN
Massive sandstone
111!11 11111111:11111111:111111
Dark grey siltstone/carbonaceous shale
DYSART "S" SEAM
--. 0-3m
_L DYSART LOWER 1 DYSART LOWER 2
Figure 5. Bowen Basin 1995 - Symposium
400
TABLE 2. COAL RESERVES (Product/Marketable t x 10 3 at 9.5% ash). SEAM Dysart Lower 3/2 Dysart Lower 1 Dysart Lower Split Dysart Dysart K J Seams Harrow Creek Lower Harrow Creek Upper P Seams QSeams TOTAL
LW-60m 872 746 2767 20 155 10 542 2512 616 23 361 16 507 0 78 078
60m-90m 1428 2355 2387 43 506 0 0 0 18 477 0 0 68153
90m-300m 1187 4052 3364 108 468 10 076 0 449 19 508 3729 0 150 833
Coal is processed through a preparation plant using dense media cyclones to clean 50 x 0.5mm feed and froth flotation cells to clean 0.5 x 0mm feed. Saraji produces 5.5Mt of product annually.
COAL RESERVES AND RESOURCES
Table 2 lists marketable coking coal reserves remaining at Saraji as at 31 May 1995. At that date open cut marketable reserves stood at 146.23Mt, out of a total Measured, Indicated and Inferred Resources base for the mine of 747.72Mt.
FUTURE DEVELOPMENT
Two proposed pits,Hakea Pit (south of Phillips Creek) and Ironbark Pit (east of Ebony Pit in the Harrow Creek Upper seam) are currently being evaluated to determine their suitability for scheduling into operational plans to assist in reducing strip ratios. Current stripping depths average 57 metres to the top of the main Dysart seam. The use of new fine circuit technology to increase coal recovery through the preparation plant is presently under appraisal.
REFERENCES
DRESCHSLER, M.K., 1982: Weathered Cainozoic Deposits and Highwall Stability. James Cook University Honours Thesis. GRUYTHUYSEN, P.M. & O'REILLY, K.W., 1993: The Geology of Saraji. Text of a Presentation Given to the Bowen Basin Coal Geologists Group 22 April 1993. BHP Australia Coal Pty Limited Report. PARMINTER, G.E. & TOOMEY, P.T., 1992: Dewatering and Subsequent Dragline Operations in Grevillea Pit. In, Third Large Open Pit Mining Conference, Mackay, Queensland. Australasian Institule of Mining and Metallurgy Publication, 8/92, 423-428. BHP Australia Coal Pty Ltd.
Bowen Basin 1995 - Symposium
401
SOUTHBLACKWATERCOALMINE LOCATION
The mine, coal processing plant, administratio n centre and engineering facilities are located 42km south of the township of Blackwater, in the Bowen Basin of Central Queensland. Blackwater has a population of about 8500 people and has well developed schools, hospital, sporting and other facilities. The town also services South Blackwater Coal Ltd, CRQ Cook, BACL Blackwater, CRQ Yarrabee and AQRM Jellinbah coal mines. Motel-type single peoples quarters are located at the mine site and in town, but most of the workforce is accommodate d in company housing in Blackwater. The modern deep water port of Gladstone is located 334 rail km east of the mine and provides South Blackwater and its customers ready access to an efficient coal loading facility.
TENURE AND HOLDER
South Blackwater Coal Ltd is an unlisted public company, owned 100% by Queensland Coal Trust Resources Limited (QCT), with its registered office in Brisbane. South Blackwater Ltd holds eleven Minin~ Leases, one MDL (155) and one EPC (261), covering approximately 355km .
DEVELOPMENT HISTORY
South Blackwater was originally developed in 1969 by Thiess Bros Pty Ltd to provide coking coal to the Japanese market following an extensive drilling program between 1966 and 1969. It initially consisted of a small open pit and an underground mine (Laleham Colliery). The first coking coal was exported to the Japanese Steel Mills in 1970 and production of coking coal averaged lmtpy in the early seventies. Expansion of the open-cut took place in 1979-80 with the addition of two large draglines and ancillary fleet. This allowed South Blackwater to increase production capacity to 2mtpy and to commence production and export of thermal and briquetting coal. The mine was acquired by CSR Ltd in January 1980 as a result of the takeover of Thiess Holdings Ltd. CSR upgraded the wash plant in mid 1987 to allow the concurrent production of premium coking coal with 6% ash and low ash, high energy thermal coal. The mine was acquired by Pennant Holdings Pty Ltd in August 1988 and the mine capacity was increased to over 2mtpy with significant improvements in productivity. The mine was acquired by QCT in 1990, and increased production to 2.7mtpy in 1994. After extensive drilling between 1987 and 1990, a number of feasibility studies were conducted north of the existing underground to prove sufficient reserves for a new longwall mine. As a result, further drilling and updated feasibility studies were conducted in 1992-93. In July, 1993, the Board of QCT Resources Ltd approved the expenditure to establish the Kenmare Longwall Mine. In August 1995 the pit bottom development was near complete, the ventilation and fan shaft commissioned , wash plant and handling facilities upgrade completed and development ready to commence on gateroad driveage. Longwall production is on schedule for July, 1996. Production at South Blackwater will increase to over 4mtpy in 1997.
MINING METHODS
Open Cut
To expose the coal for mining, open cut pits are excavated by two Bucyrus Erie 1370W draglines, supported by a mobile pre-stripping operation. Due to the midburden thickness between the main mineable seams two different multi pass techniques are used to uncover the Aries, Castor and Pollux/ Argo Bowen Basin 1995 - Symposium
402
seams. In the north where midburden is relatively thin (12-lSm) a spoil side chop method is used , while in the south where midburden thickness increases to 30-35m the extended key /inpit bench method is used. The midburden between Aries and Castor seam is only 2-6m thick so this material is removed by prestrip fleet before the dragline uncovers the Pollux/ Argo seam. Coal mining and prestripping are undertaken by two O & K 120C hydraulic shovels loading into 136t bottom dump trucks for the coal and 150t rear dump trucks for the over /mid burden. To maximise recovery, a contract augering operation was introduced in 1994 to mine areas that were no longer economic for traditional dragline methods. Sterilised zones of coal under drainage and access corridors were also recovered by the auger. Underground Mining
Laleham No. 1 : Bord and Pillar In Laleham No. 1 colliery, continuous miners are used cutting 2.8m of coal from the 3.6m thick Pollux seam. Coal is fed from the continuous miners to electric shuttle cars, which deliver the coal into breaker feeders incorporated in the underground conveyor system for transport to the coal preparation plant. Coal pillars are developed and these are subsequently mined by pillar split and fender extraction method utilising a Breaker Line Support (BLS) System. This mining system uses these mobile electric powered Blisss, to provide roof support and protection from goaf flushing. Mining conditions in Laleham are good with very low level of gas and only nuisance water. A decision was taken in 1994 to access and mine the overlying Aries seam r serves. Two interim drifts, one for man and materials and the second for the c nveyor system, were driven from the Pollux seam workings into the Aries s am. Two raise bore shafts were drilled between the seams to provide v ntilation. The Aries seam lies approx. 32m above the Pollux seam and it is 3. m thick.
nmare : Longwall Kenmare the coal will be extracted by the retreat longwall mining method fr m the Aries and the Pollux seams. The coal will be transported to the s rface by conveyor and stockpiled adjacent to the mine entrance. It will then sent by 3.6Mk long curved overland conveyor directly to the preparation nt for processing.
GEOLOGY
e South Blackwater operation is located in the southern central part of the wen Basin. The coal seams are part of the late Permian age Ranga Coal asures. e coal measures form the eastern limb and nose of the Memooloo Anticline. T e coal seams sub-crop along a north-south strike length of 20km within the m ning leases with a further 16km of sub-crop existing in the Exploration and Development areas. The coal measures have a general north-south strike and dip to the east typically between 3 • and 5 •. The coal measures are structurally simple except for the presence of minor faulting. Faults and narrow zones of faLllting, typically with vertical displacements of 5-lOm, form structural cc ntrols around which the mine is planned. TI e seams of commercial potential, occurring in the area are shown in dE scending stratigraphic sequence in the following table: :OAL SEAM NAMES
Aries Castor Polluxl
~ Argo
Orion J
RANGE OF THICKNESS (metres) 1.0-4.0 0.0-3.5
3.2-3.8 l
~ 4.5-5.3
0.5-1.5 J
Bowen Basin 1995 - Symposium
AVERAGE (metres)
3.4 1.5
3.6 4.9 1.2
403
The Aries and Pollux / Argo seams are the major coal seams mined. The Argo seam (Pollux and Orion seam coalesced) is the principal mining horizon in the southern area with a relatively thin Upper and Lower Aries and Castor seams forming an important but minor component of overall production from this area . In the northern area, the Aries and Pollux seams are the principal . mining horizons.
COAL QUALITY
Quality of the coal in situ is relatively uniform across the deposit which helps to ensure product coal is of a consistent quality conforming to customer specificatio ns. In situ product quality by seam basis (based on core values). SEAM
ARIES
CASTOR
POLLUX
ARGO
Proximate analysis (ADB) Inherent moisture Ash Volatile matter Fixed carbon CSN (Swell) Total sulphur Shecific energy (Kcal/kg) P osphorous
2.0 7.2 27.5 63.1 5.5 0.59 7734 0.04
2.2 12.6 27.2 58.0 4.0 0.62 7118 0.02
2.1 7.9 27.2 62.8 4.5 0.50 7600 0.05
2.3 8.3 27.3 62.1 5.0 0.66 7559 0.05
South Blackwater markets the following range of products:
Coking Coal Prime quality coking coal of low ash, low sulphur and medium volatile. Coked alone, it produces a high strength coke. When blended with other coals in the coke oven feed, it represents an ideal core coal which allows its low ash, low sulphur, low total alkali content and moderate fluidity to be used to advantage. •
A second coking coal product which is slightly higher in ash is also supplied to the steel industry as a blend component in coke oven feed.
Thermal Coal Low in sulphur with very high energy content. Its quality is complemen ted by consistent ash chemistry and excellent precipitato r performanc e with low particulate emissions. The size characterist ics and Hardgrove Grindabilit y Index of 65 ensure smooth handling and easy crushing of the coal.
Semi-soft Coking Coal This low ash product is able to be used by the steel industry either as a coal for Pulverised Coal Injection (PCI) or as a blend component in coke oven feed.
COAL RESOURCES AND RESERVES
The South Blackwater coal resources in the mining leases and exploration permits are estimated to be in excess of 2.1 billion tonnes.
AREAS
MEASURED INDICATE D INFERRED
TOTAL
(in million tonnes) OPEN CUT
Mininf leases EPC 2 1, MDL 155 Sub-total UNDERGR OUND
Mininf leases EPC 2 1, MDL 155 Sub-total TOTAL
101 119 220
49 49
552 85 637 857
373 735 1108 1157
100
101 168 269 1025 820 1845
100
2114
100
Bowen Basin 1995 - Symposiu m
404
...... .>!.•
SCAl£
0
1:2 500 000 SO
100
l<ilan..,_
~
Road -
11.ail-y ~Line
.... . ... ... _. ...... . ..... . . . ...... ... ... .... .... . ~"!
PACIJiJC OCBAN
I I._
South Blackwater locality map.
FUTURE DEVELO PMENT
With extensive coal resources, South Blackwater is continually examining ways to increase production from both the undergroun d and open cut reserves. As evaluations demonstrat e the economic viability of expanding production , then the mine capacity will be increased. Attila Kovago South Blackwater Coal Limited Bowen Basin 1995 - Symposiu m
Bowen Basin 1995 - Symposium
405
~-'-
South ',f\
~lackwate r
Vl
'<
51
"0 0 <ll
s:: 51
Bowen Basin 1995 - Symposium
407
408
Bowen Basin 1995 - Symposium
409
THE SOUTH WALKER CREEK COAL DEPOSIT LOCATION
The South Walker Creek coal deposit is located north of the Peak Downs Highway some 25km west of the township of Nebo and 120km south-west of Mackay (Figure 1). The deposit occupies a 12km strike length of the Rangal Coal Measures, following, in part, the course of Walker Creek. The resources extend in a north-westerly direction into the Walker Creek and Kemmis Creek coal deposits.
EXPLORATION HISTORY
Although the occurrence of coal in the area had been documented as early as 1887 (Goscombe, 1975), it was not until the 1960s that the true economic potential of the seams became apparent. In 1969, under Authority to Prospect 3C, Thiess Peabody Mitsui Coal Pty Limited (TPM), the predecessor of BHP Mitsui Coal Pty Limited, delineated the South Walker deposit during systematic mapping and drilling of the coal measure sediments. It represents one of a number of deposits located by TPM in the central-northern Bowen Basin which collectively comprised the Nebo Resource Area. The deposit was drilled to Measured and Indicated Resources status during the early 1970s and subjected to feasibility studies. Mining Lease (ML) 367 Mackay, since renumbered ML 4750, was granted over South Walker Creek and the adjoining deposits of Walker Creek and Kemmis Creek for a term of 21 years from 1 August 1978. However, plans for early development were suspended when secure export markets could not be obtained for the coal. South Walker Creek was subsequently tendered unsuccessfully three times during the late 1970s and early 1980s to supply coal to the Queensland Electricity Commission. In 1986, as a result of interest shown by potential customers, additional drilling was carried out, specifically to test an area of thick seam development. A geotechnical evaluation was run concurrently. Attention was again drawn to the deposit in 1994 after identification of possible new markets in Europe. An updated mining study has since been undertaken and a mining development strategy proposed.
GEOLOGY
South Walker Creek is located within the Nebo Synclinorium on the eastern flank of the Carborough Syncline in an area of fairly gentle structure. The Permo-Triassic strata dip west and south-west at 5° to 10· (Quinn, 1985). Economic coal occurs in the Rangal Coal Measures which are conformably underlain by the Fort Cooper Coal Measures and overlain by the Rewan Formation. The Rangal Coal Measures are approximately 150m thick and consist of light grey, fine to medium grained, labile sandstone, interbedded with grey siltstone, mudstone and coal. Regionally the Rangal Coal Measures contain two potentially economic seams, the Elphinstone and the Hynds, the latter containing the Yarrabee Tuff. At South Walker, however, the economic seam is the Main seam which splits to the north and south into the Main Tops and Main Bottoms. The Main Tops is best developed in the south and the Main Bottoms in the north (Figure 2). The Main seam could be broadly equivalent with the Elphinstone seam and the top part of the Hynds. The Hynds seam at South Walker has deteriorated to an uneconomic, thin and banded, carbonaceous horizon. The Main seam extends over a 2km strike length in the southern part of the deposit and comprises 10.5-14 m of mainly dull to dull-banded coal with minor mudstone partings which are commonly impregnated with pyrite and/or siderite. The immediate seam roof comprises 0.1-0.5m of carbonaceous mudstone, which grades upwards into mudstone, siltstone and fine sandstone. The floor comprises a fissile, shaly coal to coaly shale which grades to carbonaceous mudstone and grey mudstone or siltstone. Coal brightness profiles for the Main seam are presented in Figure 3. Bowen Basin 1995 - Symposium
410
LOCATION MAP 0
50 Kilometres
NORWICH PARK MINE
.BHP
LOCALITY MAP REFERENCE
0
~
Rangal Coal Measures
-t-
Fault Syncline
SCALE 3
6 Kms
Figure 1. Bowen Basin 1995 - Symposium
12
16-B
14
24
21
18
25
26
28
31 +- DRILL TRAVERSES
I
Rewan Group
o:j
0
~
~
::s o:j
Rangal Coal Measures
Ill
...::s
(ll
....
1,0 1,0
V1
HYNDS
IJ'J
'<
a
"O 0
...
Fort Cooper Coal Measures
(ll
s::
FORT
a
E] Sandstone
~=:3 .Shale ~
6BHP Figure 2.
Siltstone
~==l Dark Shale
~
rn ' '
i
Carb Shale Banded Coal
VERTICAL SCALE
Coal Tuff
0
50
100 metres
South Walker Creek Stratigraphic Sections and Seam Correlation
412
NORTH
7946
SOUTH
7945
7944
7938
7934
7936
7932
7930
7929 45.11
-
Bright (Vitrain orClarain)
~ Mudstone with coal bands or lenses
a l Bright Banded (Duroclarain)
t=d Tonstein
IC] lnterbanded (Midlustrous)
~ Siltstone
D D
Dull Banded (Clarodurain)
C8] Core loss - assumed coal
D
Inferior Coal (Stony)
Dull (Durain)
~ Carbonaceous Shale or Mudstone ~ Shale
7946/01 - Sample No. • Analytical Schedule A (A) - Analytical Schedule B (B) • Raw Coal Composite Analysis only
Calcite Pyrite, Marcasite Side rite
SOUTH WALKER CREEK - MAIN SEAM DETAILED SEAM SECTIONS and SAMPLE INTERVALS
Figure 3. Bowen Basin 1995 - Symposium
413
TABLE 1. SOUTH WALKER CREEK MAIN SEAM. Averase Properties Raw Coal llm Seam Thickness 8% Estimated Total Moisture Proximate Analysis (air dry basis) 2.2% Moisture 14.9% Ash 13.2% Volatile Matter 69.7% Fixed Carbon Miscellane ous Analyses 0.79% Total Sulfur 0.04% Chlorine 0.056% Phosphoru s (in coal) <0.1 ppm Arsenic CSN Ultimate Analysis (dry ash free basis) 89.5% Carbon 4.1% Hydrogen 1.7% Nitrogen 1.0% Sulfur 3.7% Oxygen Saecific Energy a b · db daf HGI Ash Fusion Temps Initial Deformatio n (Reducing Atmospher e) Hemis~her e (Reducing Atmospher e) Flow ( educing Atmospher e) Initial Deformatio n (Oxidising Atmospher e) Hemisgher e (Oxidising Atmospher e) Flow ( xidising Atmospher e) Ash Analysis SiO2 Ah03 Fe203 Ca0 MgQ Na20 K20 Ti02 Mm04 S03 P20s Ba0 Sr0 Zn0 Errors Sum
Typical Properties W aslied Coal 10% 1.2% 9.0% 13.3% 76.5% 0.49% 0.05% 0.051% <0.1 ~Rm 0.5- .5 90.6% 4.2% 1.6% 0.5% 3.0%
6893 kcal/kg 7048 kcal/kg 8460 kcal/kg 80
7670 kcal/kg 7770 kcal/kg 8547 kcal/kg 80
1245°C 144o·c 1455 ·c
1270°C 1530°C 1s5o•c
125o·c 144o·c 146o·c
131o·c 157o·c 1s8o·c
42 .00% 33.10% 10.10% 5.07% 1.70% 0.67% 1.04% 1.61% 0.89% 2.80% 0.88% 0.10% 0.03% 0.02% -0.01% 100.00%
44.20% 36.50% 5.31% 3.69% 0.91% 0.86% 1.25% 1.92% 0.05% 2.81% 1.31% 0.12% 0.41% 0.03% 0.63% 100.00%
Several dip-slip faults have been indicated by drilling, with orientation either north-east or north-west. Igneous intrusions have been encountere d but are not widespread . Alluvial sediments, generally 10-30m in thickness, have accumulate d on the flood plain of Walker Creek and comprise interbedde d quartz sands and clays with gravel beds at or near the base. Depth of oxidation in the economic seams averages 20m but varies from 12-30m. Figure 1 outlines the extent of the Rangal Coal Measures. Figure 4 shows drill traverses and faulting. Figure 5 presents typical geological cross-sectio ns. Bowen Basin 1995 - Symposiu m
414
F
SOUTH WALKER CREEK DRILL TRAVERSES AND RESERVE BOUNDARIES
/2' ,<•:;.
7 600000mN
SCALE
•:• ' \ ~
: : l:i i :; :i: l~2>
~-----~-----~......--~...__ __.i
Kilometres
'
•
7 595CXXlmN
REFERENCE
D
--
--
--16B
Limit of Opencut Reserves (?Orn Overburden lsopach) Limit of Underground Reserves Seam Subcrop Line Fault Drill Traverse Drill Traverse Baseline
7 585000mN w
E
§ LO i
w
E
§ ~
-0
Figure 4.
Bowen Basin 1995 - Symposium
415
TRAVERSE 25-A
<D
C
:.::i
ii 3742
0 RL 2223.4
™6 7942
3743
3598
3741
0 RL 2220.9
0
0
0
RL2221.2
RL2218.6
Rl2217.5
3627 3599
3942
0 0 RL 2217.7 RL 2217.7
RL 2217.8
-- ----------------------------- --------•i.si ------------73.6
NC
MAIN
1093
11 .9 TD 94.5
.
,,,,,
50.90
"'"""'""~
~!:~
st
TD 38.1
TD 45.7 TD 47.2
10. TD63.5
10.34 TD61
82.6
f ·9 32•6
0
>5.6 TD 79.2
TRAVERSE 25-B 3587 2141
3589
0 RL 2215
0 RL2216.5
0 Rl 2217.9
™5 7941
3917
3588
0 RL2214.5
0 RL 2214
O
28.4
MAIN
86.9 >7.6 TD 94.5
TRAVERSE 26 2125
3921
3646 2140
0 RL2211 .2
0
0
Rl 2210
RL 2209
7938 7937 3755
2127
0
0
Rl 2208 Rl 2206.5
0 RL2207.9
---------------- -------------------- - ------ ---------- --------------- - ---- -47.9 60.7 TD 59~f 7
TO 50.3
•
(I)
C
:.::i (I)
C/l
Scale 0
l1l
100 metres
cc
Figure 5. Bowen Basin 1995 - Symposium
South Walker Creek Typical Geological Cross-Sections
416
COAL QUALIT Y
The Main seam is a high energy semi-anth racite which could be marketed raw or beneficia ted to produce a high yield, low ash product for the export market (O'Reilly, 1993). Table 1 lists coal quality details for the raw coal and for an anticipate d plant product.
COAL RESERVES
Mineable coal reserves have been calculated at 83.8Mt to a depth of 70m at an average strip ratio of 5.7:1 (bcm/ton ne). At a stripping ratio cut-off of 8:1, open-cut reserves increase to 154Mt.
FUTUR E PROSPECTS Pre-devel opment drilling is currently underway in three areas of low
stripping ratio coal as part of a mining developm ent strategy. It is planned to extract a 100 000t bulk sample of coal for trial cargoes, which if successful, may lead to an ongoing mining operation .
REFERENCES
GOSCOMBE, P.W., 1975: Nebo District. In, D.M. Traves & D.King, (Editors): Economic Geology of Australia and Papua New Guinea - ~: Coal. Australasian Institute of Mining and Metallurgy, Monograph, 6, 137-148. O'REILLY, K.W., 1993: Geology of the Main Seam, South Walker Creek, Bowen Basin, Central Queensla nd. Australian Coal Geology, 9, 41-46. QUINN, G.W., 1985: The Nebo Resource Area. In, Bowen Basin Coal Symposiu m, Geological Society of Australia Abstracts, 17, 261-273. BHP Australia Coal Pty Ltd.
Bowen Basin 1995 - Sympos ium
417
THE SUITOR CREEK COAL DEPOSIT LOCATION
Mount Isa Mines Limited (75%) and Agipcoal Australia Pty Ltd (25%) hold Mining Lease 4761, (Mackay) covering the Suttor Creek coal deposit located approximately 200km by road west-south-west of the regional centre of Mackay and centred 17km due south of the Newlands Mine in central Queensland (Figure 1). Access to the lease is from the north and south and provided by all-weather roads. The Nebo-Mount Coolon road passes approximately 5km to the south of the southern lease boundary while the Glenden-Newlands sealed road provides access from the north.
EXPLORATION HISTORY
The Suttor Creek coal deposit was originally delineated by Thiess Peabody Mitsui (TPM), later Thiess Dampier Mitsui (TDM) and subsequently BHP Australia Coal Pty Limited. Mining Lease Application 411 was lodged in 1979 covering the main deposits in the Rangal Coal Measures and a satellite deposit - Suttor Creek West - in the Moranbah Coal Measures. Mining Lease 4761 was granted in July 1990. Mount Isa Mines Holdings Limited (MIM) acquired ML4761, comprising 6689 hectares, in November 1990. Thiess Peabody Mitsui commenced exploration drilling on the Suttor Creek coal deposit in 1965. Drilling by both TPM and the Queensland Department of Mines continued spasmodically until 1970. In 1977 Thiess Dampier Mitsui began major exploration programs within the lease area. This phase of exploration concluded in 1982 with the completion of a large diameter core program and geotechnical investigation. This drilling has been confined mainly to the basal 100m of the Rewan Group, the Rangal Coal Measures and the Fort Cooper Coal Measures. There has been no field exploration activity on ML4761 since its acquisition by MIM. Prior to 1979 exploration drilling accounted for 274 holes. From 1979 to 1982 more detailed exploration resulted in the completion of 1,194 drillholes. These included open, partly cored, fully cored and large diameter drillholes aggregating almost 51 000m. This drilling provided structural, hydrological, coal quality and geotechnical information. Geophysical wireline logs were run in about 15% of holes drilled (Theiss Dampier Mitsui, 1983; Oldroyd, 1986).
GEOLOGY
ML4761 lies near the eastern edge of the Collinsville Shelf, a structural subdivision of the Bowen Basin. The Collinsville Shelf is characterised by a shallow easterly regional dip, minor deformation and a relatively thin accumulation of sediments. It is adjoined by the Nebo Synclinorium to the east and the hinge line separating these structural elements is characterised by thrust faulting. Three major stratigraphic units comprise the Collinsville Shelf in the north Bowen Basin:•
the Triassic Rewan Group
•
the Upper Permian Blackwater Group
•
the Lower to Upper Permian Back Creek Group.
It is in the Blackwater Group that development of economic coal seams has occurred. The Blackwater Group being subdivided into the Rangal, Fort Cooper and Moranbah Coal Measures. The Rangal Coal Measures contain a single economic coal seam in this part of the Bowen Basin - the Leichhardt Seam or its equivalent. Coal seams are absent in the overlying Rewan sediments. The Permian-Triassic sediments may be intruded by igneous rocks of Cretaceous or Tertiary age and/or unconformably overlain by Tertiary basalts, sediments and Quaternary alluvium. Bowen Basin 1995 - Symposium
418
\
PORT ~
Townsville
'v
PACIFIC
OCEAN
Eungello Dom
SUTTOR
North
Germ an Creek 10
0
20
40
ki lo metres
FIGURE 1
GENERAL LOCATION PLAN
Figure 1. General location plan.
Bowen Basin 1995 - Symposium
z
z
0
0
E
E
i-----
---------
----
--------
-------- ----
_____ --;-
-- 8 ------
-. '
E -------
8
8
z
------
---------
z
E
§
•.
;,;
N
0
"'"',.._
ID
"'"',.._
'
I
I
1~
,W
1w ' a::
= 0
~ 11)
= = ... =
a::
0
~
:::>
(/)
Ill Ill
~
\0 \0 Ill 596 000--m
rJl
'<
e "0 0 Ill
-------
-------
------
FAULTS --......--- Normal 0
- - -,.- - -
1000
2000
Reverse Metres
Teeth on downthrown side
Figure 2. Drillhole locations and generalised structure.
3000
----
-------
--
----- --
--
~
\
FIGURE 2
DRILLHOLE LOCATIONS AND GENERALISED STRUCTURE
420
The dominant feature in the Suttor Creek coal deposit is a north-north-west trending thrust system known as the Suttor Fault, which has resulted in the repetition of the Leichhardt Seam. There are eastern and western deposits of shallow coal with a strike length of approximately twenty kilometres. The eastern block overthrusts the western block. The eastern deposit strikes north-west while the western deposit strikes north-north-west. Seam dips are highly variable, being steeper in the south, and varying from 3 • in the north to over 15 · in the central part of the eastern deposit. In several areas faulting is intense enough to severely limit the area of shallow coal reserves. Faults in the western deposit are normal, striking north-east with throws less than ten metres. In the eastern deposit, where seam dips are generally steeper, faulting is more intense with throws up to 25m encountered on both normal and reverse faults (Oldroyd, 1986). Figure 2 shows drillhole locations and generalised structure for the Suttor Creek deposit. Overburden consists of moderately strong sandstones and siltstones underlying Tertiary valley-fill basalts and sediments which incise the seam subcrop in places. A broad, thick band of alluvium flanks Suttor Creek. The Suttor Creek coal deposit is contained within the Leichhardt Seam which correlates with the Upper Newlands Seam. The Leichhardt Seam occurs from 3m to more than 55m below the base of the Rewan Group. It consists of mainly dull coal with a bright lower section and four persistent stone bands. Seam thickness averages 4m over the whole deposit, ranging from 3.5m to 5.0m.
TABLE 1. TYPICAL ANALYSIS. Proximate Anal):'sis (%ad) Inherent Moisture Volatile Matter Ash Fixed Carbon Specific Energy (MJ/kg ad) Total Sulphur (%ad) HGI Ultimate Analysis (%daf) Carbon Hydrogen Nitrogen Sulphur Oxygen Ash Fusion Temperature ("C) Oxidising Initial Deformation Hemisphere Flow ReducinP. Initial Deformation Hemisphere Flow Ash Analysis ( %) SiO2 AhO3 TiO2 Fe2O3 CaO MgO Na2O K2O Mm04 P2Os SO3
Bowen Basin 1995 - Symposium
2.6 26.1 14.0 57.3 28.66 0.37 56 84.84 4.83 1.69
0.41
8.23
+1600 +1600 +1600 1500 +1600 +1600 57.2 36.2
1.7 1.9
0.7 0.3 0.2 0.7
0.01 0.6 0.1
421
COAL QUALITY
The Leichhardt Seam coal is classified as medium volatile bituminous. It is similar to the Upper Newlands Seam in rank, proximate analysis, energy, sulphur and HGI and therefore aimed at the export thermal coal market. Due to a general increase in mineral matter in the seam, overall coal quality deteriorates from north to south within the deposit. Coal quality is variable over the Suttor Creek deposit. Some of this variability may be due to sampling discrepancies. Energy is slightly higher in the eastern deposit while mineral matter (inherent and banded form) is highly variable. The seam has a high swelling lower ply similar to the Upper Newlands Searn. Table 1 provides a typical analysis for Suttor Creek coal.
COAL RESOURCES
Currently quoted measured in situ thermal coal resources for the Suttor Creek deposit are:•
Opencut (to a 60m highwall)
38Mt
•
Underground
91Mt
FUTURE PROSPECTS The coal reserves contained in the Suttor Creek deposit are favourably located relative to the existing Newlands operation. Feasibility plans have identified reserves within the Suttor Creek deposit which would be amenable to a dragline operation while other reserves are more suited to a truck/excavator operation. Future exploration required to define the feasibility of exploitation of this coal deposit also includes:•
definition of seam structure, fault frequency and displacement
•
investigation of seam floor strata
•
assessment of groundwater inflows into proposed mining areas
•
infill structural and quality drilling
•
adequate definition of the areal extent of Tertiary basalts
Ultimately, development of the Suttor Creek deposit will be largely dependent upon its inclusion into the Newlands mine plan.
REFERENCES
OLDROYD, G.C. & others, 1986: Suttor Creek - An Assessment of the Project and MIM Options. Volume 1. November 1986. THEISS DAMPIER MITSUI, 1983: Assessment of the Rangal Coal Measures Suttor Creek Coalfield. Phillip Sides Mount Isa Mines Limited
Bowen Basin 1995 - Symposium
422
Bowen Basin 1995 - Symposium
423
THE THEODORE NORTH DEPOSIT LOCATION
The Theodore North Coal Deposit is close to the town of Theodore on the Dawson River, 170km south-west of the port of Gladstone (Figure 1).
EXPLORATION HISTORY
Exploration of the Theodore deposit was started in the sixties by the Queensland government and Thiess Brothers Pty Limited (Thiess) and Mines Administration Pty Limited (Minad). These companies combined to form Theodore Coal Pty Ltd in 1972 and the two original Authorities to Prospect for coal (APl 7C AND AP24C) were consolidated into a single tenement AP202C. CSR Limited acquired Theodore Coal and The Shell Company of Australia joined the project in 1980. Shell increased its interest to 100% in 1988. Exploration was conducted during a number of large drilling campaigns, the last one during the period 1979 to 1982. Originally it was the intention to operate a number of draglines along the full strike length of the Theodore deposit. However, due to the steep dips it was decided to concentrate initial mining in the northernmost portion of the Theodore North deposit (45 SOON to 52 200N) applying the truck and shovel method. Exploration was adjusted to this mining method by drilling to depths of up to 180m. A description of the Theodore South deposit is presented separately. Although a Mining Lease was granted in 1984, the decision to start mining had to be postponed dur to the generally low prices and high development costs.
GEOLOGY
The Theodore Coalfield is in the south-east corner of the Bowen Basin (Figure 2). The coal occurs in the upper Permian Baralaba Coal Measures. The coal seams at Theodore are the southerly extensions of seams of coking coal being mined at Moura and Kianga. However, due to the southerly decrease in rank the seams at Theodore North are a source of high quality steaming coal. Table 1 summarises the stratigraphic succession in the Theodore North coalfield. The two rock units of importance are the Kaloola Member and the Baralaba Coal Measures. The Kaloola Member consists of up to 150m of tuffaceous, lithic sandstone with interbeds of silicified siltstone, mudstone and vitric tuff. The beds are very hard and resistant to weathering, leading to the formation of a prominent ridge on the eastern side of the coalfield. In the Theodore North area this ridge is known as the Malakoff Range. Thin coal seams <0.Sm thick and high in ash occur in the Kaloola Member. The Baralaba Coal Measures are between 200m and 350m thick and consist of feldspathic, lithic sandstone with interbeds of grey siltstone, mudstone, shale and coal (Figure 3). The average thickness of the Baralaba Coal Measures in the Theodore North coalfield is 250m. The elastic sediments in the upper part of the Baralaba Coal measures are generally more argillaceous and consist mainly of siltstone with minor TABLE 1. STRATIGRAPHY OF THE THEODORE NORTH COALFIELD. AGE Triassic
GROUP Mimosa
Upper Permian
Blackwater
Upper /Lower Permian
FORMATION Rewan Baralaba Coal Measures Kaloola Member Gyranda
Back Creek
Bowen Basin 1995 - Symposium
THICKNESS to 560m
200-350m to 150m to 900m to 1545m
424
NORTH GOONYELLA RIVERSIDE GOONYELLA MORANBAHNORTH~~vz.. GROSVENOR
BLAIR ATHOL RWICH GERMAN C OAKYC GREG GORDONSTO
:,
ENS
Rockha ARRABEE LINBAH EAST
QLD THEODORE NORTH THEuDORE SOUTH
~ COKING COAL
~:: : ~:•:i COKING & THERMAL COAL 1:.:.:.:..:;.: j
THERMAL COAL
•
OPERATING MINE
C
PROSPECT
~
COALPORT
~
POWER STATION
Figure 1. Theodore North, locality map. Bowen Basin 1995 - Symposium
'N
425 0,,.._ ► ~;/
24 0
..,/ i , { I( "_J/(.t; :; r~,··1·.,;._·:,;:-;/ tr'r•. };r;:~::-://:,\~•·~._/i."-~:'r;..;. .~:- · ,.- --:';·"\ ✓ ~1~ ,
11
(~t '._~~--~ :;
s......
1' :~.l . !t ··•.<"r' , ~!~~, l"'.. .. • / 0 :· : ,
.
'....
......
V
w V v ." y y w V V V
...
V
~ \' ~
V.,
V
V
11 ., Vy V V
~ V; V
O
v
V • V •
11 • V . V
O
v •., •., • •• •
v"v"'v"v"v•..-24°00•5.-
V
V
...
0
Scole
0
:)O
100
21°s
Kilometres
2205
·g; :~-~.1-J?\Ij?t}fj:}:~~~\\~i~.r~-~: . ;\.:,;~\~?--:?/~)··:--:~ ~~~~~~i ~~i~;~i~~: <I.
.. ,. ,
• \ .('.'}-
~✓
,•."''
• I •• • "'1 ... • ,.. l
BASIN
'
.,: - • "_ (
:£:1:-1~:}iif't}J{'~;7
BOWEN
~ ~
~
}J.:tr/\:;;: r, ,-----, .:. / ))\?lY
0 ' f",A. •• • '
2305 .' ·';- · , l.•) .' , ·,'• ;;,.•_',')Y,•,:- , ,•,•,, ;
/
•
••
(
•
,. • ' •
V
V
V
V
V
V
V
"
V
V {\.' "\,
V
V
V
V
V
V
V
V
\
VVVIV),
,.~ tt l:~!Ii;~~t~I; 1){{{\t:t;;ftti:ii!ilililll~11llliiililill1!1 , .. Theodore North Coalfield "' .., ,,, v"v" ~ "... _: ·.1 .... :' . . >. ·\_··---; 1/! .... ·; :/,_?~·,· : ..... , , ;:... ).r;,- /, ' , - 1 ···:· t ·v·v•v• v •v ~v•v•vv:v:v:v:v :v:v ~ >-<..:.'; ;_:~!:!'<~~ ~::;. .~=--- ~:!;/:. ~ , · <:•,. 0
4
25 o5 ' •. . •,
.:: =.:: ·-:
:•
:-\
J° •
••
~ •
, · · _.' / S • , • ; , : ; , • ' '\° '
-
'
"•< ' • , • ,
-
-;'{Yf/Jtf.(1J{~};{}xx: •i h:;~\cj~;~}i~~i~~~~~~~i=i:i/l~ I
•• • •
• :\ V
V
V
V
V
V
V
V
V
V
V
V
V
V
V
:··r··~.>:-•
:·:;
·;_·_It..._ .
•· . - . . . :. • .
:::::::::;::::::::::::::{ ::
:\\;i?~:
vv v V v v v v v v v v v vv vvvv vv vvvvvv".,".," ., ".,".,"v"v" ...
· ~·· · .· ..
., i,:.- .' ~ Theo_d_or~ _S?u_th_ ~o.ol!i~l~<V:•
.. { -..:<-< ·.--:-. •_:_:- : . : . .•· ... . :•· .
"v"v,.v"v1Jv"v"vvvvvvvvv'
':: •
.• ;:
~
V
V
V
:
: · . : ·.: • V :
I'.•.·
·.•
✓
_'
,#...._
V
V
V
. V
V
y
V
V
V : V: V: V: V: V: V: V: y: V V
V
V
V
V
V
V
V
V
V
V
V
V
V
V
V V V V V Vy V V
11vvvvvvvvv • C ra cow ,. " v v
' •• : : :• :
V
1/VVVvVVVVV"I v v v ... v v v v v v v
: . "
vvvvvvvvv ·:. • - :vvvvv vvvvv vvvvvvvvv • vvvvvvvvv .. :
,: ,:
·· : : •
,
V ... V V V V V Vy V \ " V V V V V V V
:
v "'v "v "v"v"v"v"· .,v,,,• ... v11v vv v v v , · V V V V V V V V V -vvvv vvvv v
..·;_ ·.:-----~-_.. ·_;· .-.- ._-..\\<:}t;ii{i:
:ompiled from Mopping by Geologists of Bureau of Minero I Resources Geological Survey of Queensland Mines Administration Ply Limited Company Utah Development Thiess Dom pier Mitsui Cool Pty Ltd
Foul!
-X: Cool Mine I -+- Synclinal Axis I
Triassic
Sediments
Baralaba
Coal Measures
.,. ...... \ ~)'
:~~:
Gyranda Formation Upper- Lower Permian Marine Sediments of Back Creek Gr oup Lower Permian Volca ni c s and Sediments
Figure 2. Theodore coalfield - regional geological setting. Bowen Bas i n 1995 - Symposium
426
GN 11 Rewan
Formation
X
t =:=:==J
Clay
1-2
C:=J Sand stone 3
Baralaba Coal Measures
Ett::f=j
Shale
~
Siltstone
-
Cool
r:::1=:j
Sandstone /Siltstone lnterbedded
P§ ~
Sandstone /Shale lnterbedded
~ ~
Shale /Siltstone Inter bedded
~ ~
Shale/Cool lnterbedded
4-5 . . .. . .. .
6-7
8A
88
Siltstone/ Shale lnterbedded Bose of weathering
9
10
Kaloola Member
11
GN 11 - a fully - cored stratigraphic hole drilled by the Queensland Department of Mines on line 51 OOON
Figure 3. Lithological column - Baralaba Coal Measures. Bowen Basin 1995 - Symposium
427
sandstone. The lower part of the sequence is more arenaceous and consists of sandstone which becomes coarser and more poorly sorted towards the base of the sequence. Fossil wood is common throughout the coal measures and commonly occurs as residual material in the surface soil. There are twelve separate coal seams in the Baralaba Coal Measures, numbered Seam X at the top of the sequence and, in descending stratigraphic order, Seams 1-11. Seam 11 marks the base of the coal measures. The thickest coal seam in the Theodore North coalfield between 45 SOON and 52 200N is 7.lm thick, and the average seam thickness is 2.8m. The average aggregate coal thickness in the proposed mining sequence (Seams 1-7) is 17.9m. Seam splitting and coalescence is common at Theodore North. The numerous seam splits and combinations are identified by coupling the seam numbers eg. where Seams 6 and 7 are combined the combination is known as Seam 6-7. Where consistent splits are identified, these are indicated by an alpha suffix, eg. Seam lA. The correlations are based on a series of fully cored stratigraphic and geotechnical holes backed up with appropriate geophysical logging. The Theodore coalfield is located on the eastern limb of the south-plunging Mimosa syncline (Figure 2). The Mimosa syncline is a broad and slightly asymmetric depositional fold which controls the regional dip of the Baralaba Coal Measures in the area. In the Theodore North coalfield, dips of the coal seams range from 11 • to 18 •. In the area between 45 SOON and 52 200N, dips range from 11 • to 15 • (Figure 4). The Baralaba Coal Measures strike between 340° and 360°. A dipmeter sonde was run in 20 drill holes to obtain more detailed information on the bedding of the various rock types. The results showed that bedding dips in the interburden ranged from 5 • to 15 • towards the west. The variations in dip are due to cross bedding in the sandstones. Two major joint sets are known to be present in the Theodore North coalfield. These have been determined from angle drillholes and also from mapping in the trial mining pit. They dip at 80°±20· towards 60°±30° and 130°±30°. There is very little structural deformation of the Baralaba Coal Measures between 45 SOON and 52 SOON. Only one noteworthy fault has been identified and this is at 46 BOON. It has been interpreted as a scissors fault dipping 40° to 340° with normal downthrow to the north ranging from Sm to 45m. A smaller fault of similar nature occurs at 49 200N.
COAL QUALITY
The coal seams at Theodore North consist mainly of equal proportions of dull and bright coal. Most seams contain brighter coal towards the base. The coal is low in inherent ash, but the presence of stone bands affects the quality of some seams. The coal seams were sampled according to their appearance and brightness in the coal core. Stone Bands 0.lm or greater in thickness were sampled separately. Stone bands 0.3m or greater in thickness were excluded from the composite analysis of the coal seam. The quality of the coal in the Theodore North coalfield has been determined by the laboratory analysis of slim core coal samples. Core sizes are nominally 50mm and 62mm. All laboratories at which analytical work was carried out are registered with the National Association of Testing Authorities, Australia (NATA). Testing procedures were in accordance with Australian Standard "AS1038". Where a particular test was not covered by AS1038, the appropriate British Standard or ASTM Standard was used. The average raw coal quality for the measured resources is shown in Table 2.
COAL RESOURCES
The coal reserves reported herein are for the area 45 SOON to 52 200N. In all, 676 holes have been drilled north of 45 SOON. Coal core was taken from 496 of Bowen Basin 1995 - Symposium
428
TABLE 2. AVERAGE COAL QUALITY OF MEASURED RESOURCES, 45 SOON-52 200N (AIR DRIED, RAW COAL IN SITU) Proximate Analysis Moisture% Ash% Volatile Matter% Fixed Carbon %
4.8 14.2 30.6 50.4
Fuel Ratio Total Sulphur % Specific Energy (MJ/kg) Calorific Value (kcal/kg) Nitrogen% (dry basis) Phosphorous % Chlorine% Arsenic (ppm as As2Ch) Fluorine (ppm) Hardgrove Grindability Index Crucible Swelling Number Relative Density
1.6 0.58 27.47 6560 1.6 0.035 0.03 2.4 75 53 1 1.40
Ash Fusion Temperatures (°C) a) Reducing Temperature: Deformation Spherical Hemisphere Flow
1210 1350 1370 1430
b) Oxidising Atmosphere: Deformation Spherical Hemisphere Flow Ultimate Analysis (dry ash-free basis) Carbon% Hydrogen% Nitrogen% Sulphur% Oxygen% (by difference) Carbon Dioxide %
1290 1430 1440 1470 81.24 5.17 1.86 0.83 10.90 0.65
Moisture Holding Capacity % at 30"C and 97°C Relative Humidity
5.4
Ash Analysis SiOi % AliQ3 % Fe2O3% TiOi % Mn3O4 % CaO% MgO% Na2O% Ki0% P2Os % 503%
53.68 24.82 9.68 1.10 0.10 3.14 1.63 0.33 1.59 0.57 0.10
Silica Ratio
79
Base/acid in Coal
0.2
Maceral Analysis (Percentages by Volume) Vitrinite % Resinite % Sporinite % Fusinite % Semi-Fusinite % Inerto-Detrinite % Mineral Matter % Ro(max)
61.8 1.2 1.7 2.4 20.0 4.0 8.9
Bowen Basin 1995 - Symposium
0.67
=
0
~
II
= = ... = ....
•••
·::a, ,1c, .,UU•
II
{II
RL 2120
\C \C UI
.,_
Cl)
1
,,e.
'--=
.,,a ...s:: 0
{II
a
Figure 4. Typical drill-li ne cross-s ection 49800N.
430
these holes. The coal reserves have been calculated from 561 cored coal seam intersections from these drillholes. Although drilling has been carried out in the Theodore North coalfield since 1966, the great bulk of the meterage has been drilled since July 1980. This most recent drilling has been planned around the development of a deep terrace mining operation. Drill lines are spaced nominally 300m apart. Coal resources have been calculated for Seams 1 to 7. Resources for Seams X, 8,9, 10 and 11 do not form part of the proposed mine plan and have not been reported. The in situ coal resources between 45 SOON and 52 200N are: Million Tonnes 154.71 83.6 238.3
Measured (to 290m) Indicated Class 1 (to 400m) TOTAL
Further 'large' coal tonnages are inferred at depths greater than 400m.
FUTURE PROSPECTS The feasibility of developing the Theodore North deposit has been examined regularly since granting of the Mining Lease. So far, none of the available options appears attractive enough to justify development. Pre-requisites for mining are the selection of the optimum mining technique that successfully handles the relatively steep dips and establishment of infrastructure at reasonable costs. Various options are actively being pursued and a development decision will be taken as soon as a profitable project can be envisaged.
REFERENCE
Proposal for the development of an export coal mining operation at Theodore North - 1982. Frans Bos The Shell Company of Australia Limited
Bowen Basin 1995 - Symposium
431
THE THEODORE SOUTH DEPOSIT LOCATION
The Theodore South Coal Deposit is located 10 to 30km south of the town of Theodore on the Dawson River, 170km south-west of the port of Gladstone (Figure 1).
EXPLORATION HISTORY
Exploration of the Theodore deposit was started in the sixties by the Queensland government and Thiess Brothers Pty Limited (Thiess) and Mines Administration Pty Limited (Minad). These companies combined to form Theodore Coal Pty Ltd in 1972 and the two original Authorities to Prospect for coal (APl 7C AND AP24C) were consolidated into a single tenement AP202C. CSR Limited acquired Theodore Coal and The Shell Company of Australia joined the project in 1980. Shell increased its interest to 100% in 1988. Exploration was conducted during a number of large drilling campaigns, the last one during the period 1979 to 1982. Originally it was the intention to operate a number of draglines along the full strike length of the Theodore deposit. However, due to the steep dips it was decided to concentrate initial mining in the northernmost portion of the Theodore North deposit (45 SOON to 52 200N) applying the truck and shovel method. Being located further away from the existing infrastructure the Theodore South area was given a lower priority. Apart from some small scale exploration in areas with potential for open cut mining, the area has seen little field activity until 1994 when drilling was conducted to investigate the deeper coal resources. This work will continue in future to determine the feasibility of longwall mining of Theodore.
GEOLOGY
The Theodore Coalfield is in the south-east corner of the exposed Bowen Basin (Figure 2). The coal occurs in the upper Permian Baralaba Coal Measures. The coal seams at Theodore are the southerly extensions of seams of coking coal being mined at Moura and Kianga. However, due to the decrease in rank to the seams at Theodore South are a source of high quality thermal coal. Table 1 summarises the stratigraphic succession in the Theodore South coalfield. The two rock units of importance are the Kaloola Member and the Baralaba Coal Measures. The Kaloola Member consists of up to 150m of tuffaceous, lithic sandstone with interbeds of silicified siltstone, mudstone and vitric tuff. The beds are very hard and resistant to weathering, leading to the formation of a prominent ridge on the eastern side of the coalfield. In the Theodore area this ridge is known as the Malakoff Range. Thin coal seams less than 0.Sm thick and high in ash occur in the Kaloola Member. The Baralaba Coal Measures are between 200m and 350m thick and consist of feldspathic, lithic sandstone with interbeds of grey siltstone, mudstone, shale and coal (Figure 3). The average thickness of the Baralaba Coal Measures in the Theodore South coalfield is 250m. TABLE 1. STRATIGRAPHY OF THE THEODORE SOUTH COALFIELD AGE
GROUP
Triassic
Mimosa
Upper Permian
Blackwater
Upper/Lower Permian
FORMATION
Rewan Baralaba Coal Measures Kaloola Member Gyranda
Back Creek
Bowen Basin 1995 - Symposium
THICKNESS
to 560m 200-350m to 150m to 900m to 1545m
432
BLAIR ATHOL WICHP GERMAN C OAKYCR GREG GORDONSTO
:,
ARRABEE Rockha LINBAH EAST H
QLD ..
·. :. THEODORE NORTH ·:· THEODORE SOUTH
...
~ COKING COAL
~-:•:-;:•:i COKING & THERMAL COAL l:.: : .:::q THERMAL COAL ■
OPERATING MINE
C
PROSPECT
..__ COAL PORT
~
POWER STATION
Figure 1. Theodore South, locality map. Bowen B asin 1995 - Symposium
433
22°s
BOWEN BASI N \ \
• Borolobo
\
~
'
\
• Moura
A)
\
r
\
~
:;1
2 5°5
~ h e o d o re
. "
~
~
!.~~iii' •,/:c:- : ·; - ;- }
,
_,,
'c
.. .
:)
t~:~
.-.. \ :/:.:'_. ·._:·:(-:: ;~:/\_.-:\
' ~ --~
.-
. .
•. \,.: : -·-•: ·.:
•.
:
\
•
:
:
·.-·-·-·--.· .
.. . .·. - .
.. .
. .... ..
WtJ}?}:{Jtj_'\~}:;-t:f!;Jih~f~{iid{~f)\·j)(/!I"/;?;ttX[i~; :ompi led from Mopp ing by Geologists of Bureou of Minero! Resources Geolo9 icol Survey of Oucenslond Mines Adminis1rotion Ply Lim i ted Utoh Development Company Th iess Dampi er Mitsu i Cool Pty Ltd
Fault
')<: I
Cool
Mine
-+- Synclinol Axis I
Jurossic
Sediments
Triassic
Sediments
Baralaba
Coal Measures
Gyranda Formation Upper - Lower Permian Marine Sediments of Back Creek Group Lower Permian Volcanics and Sediments
Figure 2. Theodore coalfield - regional geological setting. Bowen Basih 1995 - Symposium
434
.:.Ji:k;,:. ·:~• -· ···'-=·--·-.
~ 5::; ~ -
Coal
■I
Conglomerate
D
"'
KIA ORA CONGLOMERATE LENS
Sandstone
Shale Mudstone
....L
.... .
i::;;;;'-::·· .. '·-
SEAM 1
lI./f)~
4.0m Coal Coal Shale lnterbeds
SEAM 2
3.5m Coal
SEAM 3,4
7.0m Coal
SEAM 5
3.0m Coal
SEAM 6
3.5m Coal
Minor Coal Fragments
·o.- .o .·.· SEAM 7
:- o-: a:-
SEAM 8
2.5m Coal
2.sm Coal
SEAM 9A SEAM 9B
SEAM 10
2.sm Coal
SEAM 11
-~ /-.\".' .
-~: _..,. r:'.'· -:-,... _
__
Scale 1 : 5000
Figure 3. Composite geological column. Bowen Basin 1995 - Symposium
435
The elastic sediments in the upper part of the Baralaba Coal measures are generally more argillaceous and consist mainly of siltstone with minor sandstone. The lower part of the sequence is more arenaceous and consists of sandstone which becomes coarser and more poorly sorted towards the base of the sequence. The Theodore coalfield is located on the eastern limb of the south-plunging Mimosa Syncline, a broad slightly asymmetric downwarp which controls the regional dip of the Baralaba Coal Measures. In the Theodore South area, the coal measures dip at angles of 7° to 14 • to the west and have a regional strike averaging 335 •. The average dip is approximately 11 • with local variations due to seam splits, differential compaction or structural disturbance. Twelve coal seams are present in the area. These seams are designated in descending stratigraphic order from Seam 1 to Seam 12 (Figure 3). Seam splitting and coalescence is common and results in a number of seam combinations with significant thickness variations. Some seam combinations attain thicknesses of more than 15m and where shallow are attractive open cut targets. In the Theodore South area the seams of most consistent thickness and quality are Seam 3/4 and Seam 6. The thickness of the No. 3/4 Seam within the potential underground mining area in the Theodore South area ranges from approximately 5.18m to 8.72m. The average seam thickness is 7.0m. Seam 6 is slightly thinner than Seams 3 / 4 , but ranges from 3.39m to 6.65m in thickness. A smaller area of low ash reserves of average thickness of between 10.16m and 12.2m is situated between 9 500mN and 11 000mN. The majority of low ash reserves are situated between 14 000mN and 23 500mN where the seam averages approximately 5.25m in thickness. Faulting in the Theodore South area appears to be minimal. Previous work has identified three areas of structural irregularity but there has been insufficient work to date to define the position orientation and throw of these features with certainty at depth. Drilling near subcrop has previously defined a 20m to 50m normal fault striking north-east-south-w est at approximately 23 450mN. (THlO) Faulting is also suspected along lines 22 000mN, 15 l00mN and 14 900mN although additional exploration is required to confirm this. Minor distortion of structure contours and evidence of bedding plane slip between seams suggests that the seams may be folded in places. Little information is available however, as to the orientation of any fold structures. A number of zones of heat affected coal measures have been identified along the outcrops of Seams 3/4 and 6 where natural burning of the coal has baked and brecciated the roof strata. Burnt coal has been identified to depths of up to 70m in places but in some areas the top of the seam only has been affected.
COAL QUALITY
The coal seams at Theodore South consist mainly of equal proportions of dull and bright coal. Most seams contain brighter coal towards the base. The coal is low in inherent ash, but the presence of stone bands affects the quality of some seams. The coal seams were sampled according to their appearance and brightness in the coal core. Stone Bands 0.lm or greater in thickness were sampled separately. Stone bands 0.3m or greater in thickness were excluded from the composite analysis of the coal seam. The quality of the coal in the Theodore South coalfield has been determined by the laboratory analysis of slim core coal samples. Core sizes are nominally 50mm and 62mm. All laboratories at which analytical work was carried out are registered with the National Association of Testing Authorities, Australia (NATA). Testing procedures were in accordance with Australian Standard "AS 1038". Where a particular test was not covered by AS 1038, the appropriate British Standard or ASTM Standard was used. Bowen Basin 1995 - Symposium
436
The typical raw coal quality for the 3/4 and 6 seams is shown in Table 2. The raw coal quality of these two seams have the following properties: •
extremely low raw coal ash
•
high volatile matter content
TABLE 2. TYPICAL COAL QUALITY OF 3/4 SEAM(AIR DRIED, RAW COAL IN SITU) Proximate Analysis Moisture% Ash% Volatile Matter% Fixed Carbon % Fuel Ratio Total Sulphur % Specific Energy (MJ/kg) Calorific Value (kcal/l<g) Phosphorous % Chlorine% Arsenic (ppm as As2C>J) Fluorine (ppm) Hardgrove Grindability Index Crucible Swelling Number Relative Density Ash Fusion Temperatures (°C) a) Reducing Temperature: Deformation Spherical Hemisphere Flow b) Oxidising Atmosphere: Deformation Spherical Hemisphere Flow Ultimate Analysis (dry ash-free basis) Carbon% Hydrogen% Nitrogen% Sulphur% Oxygen % Chy difference) Caroon Dioxide % Moisture Holding Capacity% at 30°C and 97°C Relative Humidity Ash Analysis SiO2% Ah03% Fe2O3 % TiO2% Mn3O4 % CaO% Mg0% Na2O% K2O% P2Os% 503%
Maceral Analysis (Percentages by Volume) Vitrinite % Resinite % ) Sporinite % Fusinite % Semi-Fusinite % ) Inerto-Detrinite % Mineral Matter % Ro(max)
Bowen Basin 1995 - Symposium
5.6 5.6 33.6 55.2 1.6 0.22 28.34 6770 0.03 0.02 <1.0 na 52 na 1.30 1350 1360 1370 1380 1350 1360 1370 1380 . 80.20 4.87 1.87 0.25 12.81 na 8.0 37.2 25.5 10.5 1.60 0.12 15.2 1.0 0.65 0.25 1.30 1.30 62 2 2
31 3
0.65
THEODORE
LINE
605
SOUTH
17550N
603
604
l6oaj6o7
ol
RL 2120 10 ·19 95 · 90 104 · 70 I ·90C
....s::
a
89 · '5 l · UC
TD6l ·O
i TDIZ4 · ZO
6
:~!::~
TOI05 ·0
II)· 55 6·69C IZZ· Z4
;~ :; ; 1· 19C
T0147·0
46 · 76 Z·l◄C
MOC
◄ I · 90
~!:!;
~~ : ~~ z.ooc 44 • 7 0 2· 15C
41 · 85 1- m
~;::~ z.eoc :
SCALE 0
50
100
ll(TRU
Figure 4. Typical drill-line cross section 17550.
: :~ l • OOC
602
438
•
high heat value
•
very low sulphur content
A typical cross section is shown in Figure 4.
COAL RESOURCES
Preliminary resource calculations have been conducted for the zone 13 0OON to 25 000N. The in situ coal resources for this area are: Million tonnes
Measured (to 60m)
37
Measured and indicated (60m-400m)
247
Total
284
FUTURE PROSPECTS Shell Australia is committed to the continued evaluation of the Theodore South deposit for its longwall and open cut mining potential. Further drilling and feasibility studies are planned and the title will be upgraded to a Mineral Development Licence in the near future. Frans Bos & Christopher Wallin For The Shell Company of Australia Limited
Bowen Basin 1995 - Symposium
439
THE TOGARA NORTH COAL PROJECT EPC 550 (Togara North) was granted to the Togara North Joint Venture on 16 March 1994 after the group's successful bid for the area as part of the Queensland Department of Minerals and Energy's RA55. The Joint Venture comprises Savage Resources Ltd 3311.3%, Mitsui Mining Company Ltd 3311.3%, Hyosung Corporation 8¼%, Dongbu Corporation 8¼%, Yukong Limited 8¼%, and Korean Mining Promotion Corporation 8¼%. Savage Resources, through its subsidiary Janmex Ltd, is the operator.
LOCATION
The Togara North EPC overlies an area of 475km2 and is approximately 30km south of the township of Comet, Central Queensland, in the southern part of the Bowen Basin (Figure 1). Nearby operations include Blackwater Mine 30km to the north-east, South Blackwater Mine 30km to the south-east and Ensham Mine 45km to the north.
EXPLORATION HISTORY
A number of exploration drilling programmes have been carried out in the Togara area since the late 1960s. The first was conducted by Bellambi Coal Company. Three of the holes drilled during that programme were within EPC 550. The company was seeking coking coal, but when only thermal coal was encountered, the area was relinquished. The Queensland Department of Mineral Resources then conducted three drilling programmes between 1977 and 1983 which delineated coal resources to a depth of approximately 300m. An Authority to Prospect (A to P) was granted to Theiss Bros Pty Ltd in 1979 (later transferred to South Blackwater Coal Ltd) over a large area along the eastern portion of EPC 550. About 10 holes were drilled in the south eastern part of the current EPC 550 by South Blackwater Coal Pty Ltd, who were searching for potential open cut thermal coal at that time. EPC 461 (adjacent to EPC 550 in the south-east) is now all that remains of this A to P as the rest has been relinquished. Prior to 1994 a total of 133 holes had been drilled within the current boundary of EPC 550 that provided a drill hole spacing of about 2km throughout the area. In 1994, the Joint Venture partners completed a 63 hole exploration drilling programme at Togara North. The programme comprised 53 holes which recovered HQ diamond core from the Pollux Seam and its roof and floor strata. Nine non-core holes were also completed. All holes were geophysically logged by BPB Slimline Instruments, and coal core was analysed at ACIRL's Emerald laboratory.
GEOLOGY
Regional geology in the vicinity of Togara North is dominated by the Comet Ridge, an anticlinal high to the east of EPC 550, and the Denison Trough to the west (Figure 1). The Comet Ridge extends from about 30km north of the township of Comet to 50km south south-east of Comet. The axis of the ridge contains no coal as the Rangal Coal Measures have been uplifted and eroded . Togara North is located near the southern extremity of the western limb of the Comet Ridge. There are six major stratigraphic units in the Togara North region, ranging in age from Quaternary to Late Permian. The oldest formations that have been intersected by drill holes at Togara North are the Fair Hill and Burngrove formations which are of Late Permian age. Overlying these formations are the coal-bearing Rangal Coal Measures, also of Late Permian age. Conformably overlying the Rangal Coal Measures is the Triassic Rewan Group, which in tum is unconformably overlain by Tertiary and Quaternary sequences (Figure 2). The Rangal Coal Measures are the main coal bearing unit of economic significance in the region. The formation reaches a maximum thickness of about 105m in the Togara area and consists predominantly of sandstone and siltstone with rare thin claystone interbeds. Coal seams in the formation in Bowen Basin 1995 - Symposium
440 Depth (m)
~ ~--~-o
12°
GERMAN CREEK o
24°
OLD •- ~I I
OAKY CREEKo
- ---
l
►
0C! c(
.:= 0C!
V
..... t-
50
V V
V V V
\
\
V V
V V
V V
V V
V
V V
V V
V V
Thick basolt flows with thin cloy(stone) interbeds. Unconsolidated sond at base of Tertiary in ports of area.
I
GORDONSTONE 0
""\ C
C±ill] Sandstone
'
100
□ Siltstone
3: n, -4
..... ;:;:;
Rewan
a2
Group
V\ c(
t-
150
Siltstone with thin sondstone interbeds.
~j
0
m
:z
LJ Claystone Carbonaceous
~ Claystone ~ Basalt
m
Sond unconsolidated
200 :z
Rangal
iE 0C!
Coal
Aries 1 Seom Aries 2 Seom Aries 3 Seom CostorSeom
c(
..... c..
Measures
250
POLWXSEAM
Orion Seom
Figure 2. Generalised stratigraphic column.
•
Subcrop
D Extent 20 Kilometres
40
Figure 1. Location map. descending stratigraphic order are the Aries, Castor, Pollux and Orion Seams, of which only the Pollux Seam is of economic importance at Togara North. The thickness and quality of each seam varies considerably near the Comet Ridge. The Aries Seam is split into three seams (Aries 1, 2 and 3 seams) which are usually present and generally occur within 5m-10m of each other (Figure 3). Aries 1 and 2 seams are approximately equal in thickness (0.4m) while Aries 3 is generally thicker (0.7m). To the south the Aries 2 and 3 seams each split into a further two seams. The three seams do not coalesce and are always greater than lm apart. They are consistently about 20m-30m above the Pollux Seam. The Castor Seam, where. present, occurs between the Aries seams and the Pollux Seam. It is present in the central-western parts of EPC 550 but is sporadic in occurrence and is present in less than half of the area. The Castor Seam varies in thickness from 0.4m to 2.3m but is generally less than lm thick, and deteriorates to carbonaceous claystone in parts of the area. It occurs close to the Aries 3 Seam in parts of the area and migrates downwards towards the Pollux Seam towards the east, eventually lensing out (Figure 3). The Pollux Seam (PO) is between 4m and 8m thick over most of the area and is more than 6m thick throughout an area of about 25km2 within EPC 550. The seam comprises dull coal with minor bright bands, although the basal 2m contains a moderate proportion of bright bands. The seam contains several thin claystone bands that have been useful for ply recognition and Bowen Basin 1995 - Symposium
441
WEST 01011
D1005
, \
I
D1050
\
D1D04A
EAST
I
\ \
"" \ . ARIES 2 ,--c:-c-:r - ARIES 3 !"""'.,..-_
CASTOR : :
-
□. Clay Basalt Sandstone §
D-
Claystone
D
220
Legend Coal
V
□- Siltstone
@
Pollux Seam Thickness (m)
Carbonaceous
~ Claystone
240
POLWX 134511111N
I Location of Section I
Figure 3. Seam correlation diagram. correlation. The seam has been subdivided into 7 plies (POA-POG) on the basis of often subtle but reasonably consistent changes in coal density and character as indicated by geophysical log responses (Figure 4). The full ply sequence is present only where the Pollux Seam is more than 7m thick and a decrease in seam thickness is generally the result of the upper plies being absent. The lower plies appear to be relatively uniform in thickness and continuity throughout the EPC. Correlation of.plies from hole to hole demonstrated that the basal 3 plies (POA, POB and POC) were able to be correlated throughout the area because thin claystone bands separating the plies were reasonably continuous. The claystone band separating POB and POC is especially distinct, as it has a significantly higher gamma response than the rest of the seam (Figure 4). It is easily recognisable as a speckled, tuffaceous claystone about 2cm-3cm thick. This band represents the only recognisable marker band in the Pollux Seam. The upper half of the seam tends to contain very few claystone bands, and recognition of plies is often difficult even with geophysical logs. The Orion Seam occurs directly below the Pollux Seam. Seam thickness is reasonably consistent, rarely exceeding 0.5m. It is relatively extensive and recognised over most of the exploration area. The Orion Seam occurs between 0.5m and 6.0m below the Pollux Seam. The distance between the two seams is often<lrn but the seams do not appear to coalesce within EPC 550 (Figure 3).
COAL QUALITY
Aries 1 Seam coal quality appears to be quite uniform, but not of particularly good quality. It comprises a dull to stony coal which deteriorates locally to carbonaceous claystone. The Aries 2 Seam is mainly a stony coal or carbonaceous claystone a_n d its ash content appears to be slightly higher than Aries 1 Seam. As the Aries 2 Seam thickens to the south, the raw ash content is about 11 %. The Aries 3 Seam generally comprises a dull coal with bright Bowen Basin 1995 - Symposium
442
DEPTH (m)
GAMMA LOG
HIGH RESOLUTION PLY No. & PLY DENSITY LOG THICKNESS - - , - - - - , - - - , , - - - , (m)
CALIPER LOG
COAL QUALITY DENSITY LOG
ASH ,i;
J
l
,so
0.72 POG
~ 0.36 POA C ~ · ..___ ~~ ~~~£~~:t:=l:~u "Fl-----tc=~ =¼:=~{:1==t----:t:~~.::::;,,=;==l---:~~~===i- 100
200
175
1.0
2.0
omtcc
API mm
3.0
1.0
2.0 A.R.D gm/cc
3.0
0
10
20
30
ASH~ (air dried basis)
/5
Figure 4. Coal ply subdivision and typical geophysical responses, Pollux seam. bands which occasionally deteriorates to carbonaceous claystone. The Castor Seam often deteriorates to carbonaceous claystone in parts of the area. The Pollux Seam is a potential source of low ash, low sulphur, high energy thermal coal. At this stage only raw coal properties have been tested on a ply by ply basis. Generally, the seam tends to have two high ash plies at the top and bottom of the seam : POG and POA (Figure 4). The remainder of the seam is usually low in ash, although a zone of higher ash coal is often present in the middle of the seam in either the POC or POD plies. Plies POB, POE and POF tend to be relatively low in ash. Throughout the central lease area, where the Pollux Seam attains a thickness up to 8m, the majority of the Pollux Seam coal is of a high quality, where the raw ash content varies between 7.7% and 13.1 %.
COAL RESOURCES
Exploration at Togara North in 1994 delineated a large underground resource of potentially mineable thermal coal within the Pollux Seam. The total area drilled was subdivided into several resource definition blocks, on the basis of depth of cover and Pollux Seam thickness. The limits of resource estimates were the Pollux Seam subcrop on the east and the limit of 1km spaced drilling elsewhere. Resources were extrapolated three hundred metres past the last data point. The resource underlies an area of approximately 44km2 in the south-central part of the EPC where the seam is generally between 4m and 8m thick (average thickness 6.Sm). In this area indicated coal resources in the Pollux Bowen Basin 1995 - Symposium
443
654000£
TABLE 1. INDICATED COAL RESOURCES, POLLUX SEAM.
♦ Togoro North JV
drm hole, Stage 1{1994)
x De~ortment of Minerals and Energy drill hole
Thickness lunge (m) Depth Range (m) <100
Resource Block No.
>5.0m
B 0.54
A 2.08
Ash• (%)
7.34
7.41
Thickness (m)
4.31
6.17
R.D.
1.29
1.3
Tonnes x 10'
3.03
16.71
E 0.88
D 2.97
21.01 1.64 1.45
16 3.83
C 19.76 11.73
Resource Block No. Alea (m' x JO')
Ash•(%) 1hickness (m) R.D.
TOTAL (tonnes X 10')
666 OOOE
X
Alea (m 2 x 1O')
100-200
2.Sm-5.0m
1.39
6.7 1.35
15.83
178.47
19.74
x \
\
,.,
\
~
qf 196.41
200-300
H
F
1.11
13.17
14.16
12.6
3.24
6.41 14 .74
>300
Ash•(%) Thickness (m) R.D. 3.97 TOTAL
Figure 5. Coal resources, Pollux Seam. Seam total 366Mt to a depth of 300m, of which 309Mt are within the thick coal (>Sm) section (Table 1). Additional in situ resources (in the order of 140Mt; Block J) occur to the north of the main part of the deposit, but coal quality deteriorates substantially towards the southern boundary of EPC 550, and there is little likelihood of mineable reserves being delineated in that area (Block K), where inferred resources of high ash coal may total 80Mt (Figure 5). Resource estimations are presented in Table 1 and the resource block areas used for resource estimation are defined in Figure 5.
FUTURE PROSPECTS The results of the 1994 exploration programme at Togara North were considered sufficiently encouraging to proceed with the second exploratory phase. Future exploration will provide a large and sound coal quality database upon which to base the selection of the most likely underground working section and provide a detailed delineation of the resource. Selected washability testing of working section composites is planned, to study washability characteristics of Pollux Seam coal and establish what benefits are provided by beneficiating Togara North coal.
J Gaskell Exploration and Development Savage Resources Limited - Operator of the Togara North J.V. K Whitby McElroy Bryan Geological Services Pty Ltd Bowen Basin 1995 - Symposium
Bowen Basin 1995 - Symposium
445
THE VALERIA COALFIELD LOCATION
The Valeria Coalfield is located 30km south-west of Capella and 55km north-west of Emerald (Figure 1). Sealed roads link Capella with Rockhampton via the Capricorn and Peak Downs Highways and Mackay via the Peak Downs Highway. The Emerald - Blair Athol rail line passes within 12km of the coalfield.
Figure 1. Location map.
EXPLORATION HISTORY
Exploration for coal in the northern portion of the Denison Trough began with Mines Administration Pty. Limiteq under ATP 52C. This title was granted in 1968 over an area of 1400km . In 1969, after transfer of the title to Blair Athol Coal Pty. Ltd., a major regional exploration drilling program commenced. This involved reconnaissance drilling on a 3.2km square grid throughout the ATP. During this phase, a shallow, 30m thick interval of banded coking coal was intersected within Early Permian sediments (Lower Reids Dome Beds). This discovery, at a time when export coking coal markets were growing rapidly, dramatically shifted the exploration effort onto prospect evaluation. The find was termed "Rapid Evaluation Area No.I", later abbreviated to Area 1. By 1971, 500 boreholes, half of them cored, had defined a complex resource of low rank, high ash (raw), soft coking coal. However, feasibility studies found the resource to be uneconomic and exploration was suspended. Bowen Basin 1995 - Symposium
446
In 1983, ATP 418C was granted to the Blair Athol Coal Project Joint Venture over part of the original title area (96 sub-blocks). The title became EPC 418 in 1990 and now covers 64 sub-blocks. Recent exploration programs have focussed on shallow coal bearing sequences located east of Area 1. Based on this work, large reserves of open cut, export grade thermal coal have been defined (Areas 7 and 8). Valeria Project activities are managed by Pacific Coal Pty. Limited on behalf of the following Blair Athol Coal Project Joint Venture partners:
GEOLOGY AND COAL RESOURCES
Queensland Coal Pty. Limited
57.195 %
Arco Coal Australia Inc.
17.527 %
Arco Resources Limited
13.889 %
EPDC (Australia) Pty. Ltd.
7.9723%
J.C.D. Australia Pty. Ltd.
3.4167%
The Valeria Coalfield lies at the northern tip of the Denison Trough, on the western margin of the Bowen Basin. Wilson (1972) informally described this area as the Capella Embayment. The axis of this structure is aligned with the north-west to south-east axis of the Denison Trough. Within this embayment, Early Permian non-marine sediments overlie granitic and metamorphic basement rocks of the Anakie Inlier. These sediments are overlain by widespread alluvial deposits and minor basalt, laterite and silcrete. The total thickness of Permian sediments preserved in the embayment is unknown, although over 1200m of section has been intersected in drillholes. A composite stratigraphic column and geological map of the coalfield are presented as Figures 2 and 3 respectively. The Permian depositional history of the Valeria area is complex. Palynological and sedimentological studies have led to the current understanding, which interprets a broad range of depositional environments from Early Permian to early Late Permian times. A schematic representation of these environments (as derived by Edenborough, 1985) is shown in Figure 4. Each of the mapped Permian units is discussed below. Lower Reids Dome beds
Initial high energy fluvial activity in the Early Permian deposited coarse polymictic sands and gravels derived from highlands to the west and north-east. These basal sediments form the Lower Coal Measures. They fine upwards into a prograding delta unit comprising dark mudstones and minor limestone (Barren Unit). Later, a return to widespread fluvial conditions, in concert with an unstable tectonic regime, led to the development of coal forming environments over a large area (Upper Coal Measures). Most of the five coal seams formed in this period are thin and commonly split, but in isolated areas, thick coal accumulations (up to 36m in the Capella Seam) occur. The Area 1 deposit includes this zone of thick soft coking coal. The extent of preserved coal measures is controlled by major structural features. Most of the mineable coal resources are contained within a north-north-west trending synclinal trough (Western Syncline) which lies between the subcrop zone in the west and a complex fault block in the east. Dips range from 6.5 • to 13.5 • on the western flank and from 7° to above 15 • adjacent to the fault zone. The main seam (Capella Seam) comprises a group of six coal plies which occur as a single contiguous interval in part of the syncline. Away from this area, these plies variably split and coalesce, thinning and separating to the north, south and east. Three other thin seams (Llandillo, Gardner and Anakie) occur below the Capella Seam. A fourth seam (Slateford Seam) is preserved above the Capella Seam in the deeper parts of the syncline. Interburden Bowen Basin 1995 - Symposium
447
between each of these seams averages 30-40m. Individual seam thicknesses average 1.8-2.Sm. Upper Reids Dome beds Recent palynological evidence (Price, 1995) suggests that a coal bearing sequence conformably overlying the Upper Coal Measures may be a lateral equivalent of the Cattle Creek Formation. Although marine conditions (which define the extent of the Cattle Creek Formation) did not extend north into the Capella Embayment, the presence of occasional spinose acritarchs suggests proximity to a marine environment. Price assigned this unit to the uppermost part of the Reids Dome beds, as a paralic equivalent of the Cattle Creek Formation. These sediments are similar to those of the Lower Reids Dome beds. Four thin non-coking coal seams have been correlated, subcropping along a strike length of around 20km. A coal resource area (Area 4C) covers zones of seam thickening near subcrop. The coal measures strike NNW-SSE and dip to the east beneath the younger Aldebaran Sandstone. The structure is represented simply as an easterly dipping monocline, over which dips range from 5 • in the north to 12 • in the SEQUENCE
Ita
AREA
==.,,.~rd
mudl.,,.Wilhlftnor «al
-----
APPO U~a,,.,,..,
Al.DE.8Af¥.N SN«BTONE
0..
SEAM
BIOSTRATIGRAPHIC UNIT
<AatlZMnd:1..-., lllatare llt'Clrn.mlDNwilnmnll' ran-cdclr,gcoal IUffll
APP3.U Al'PU.1 APP3.2
MallmU'TI Thldv-..t .,305ffl
APPU APP:U.U
(C.tl•Cf'Nlkaq,M. rwa,biulf '? lPPER REDS OOtiE BEDS ( Pvalc:....,. o, ca■•Cl'NIQ
I
AH1.1.a.J
UHcMl'dl..,._lilla..,., ~ - llt'CI ~ coal
UP11.U
Al'f/'1.1.LI
z !§;
LOWE~ FEDS DClME. BEDS
~ ~
1, _ca,o ___
~ ~
lll•bM, tor"IQIDm••a. and WNk tD lll'DnlW cddng coala
FMlal.Ulllmt...-,ce: aanm..,..,
Mallmu,,~ 200n
APPl.1
Al'Pl.1
APP!.1
1,,_..,, Pnidll•danl'ft.dl!Dl'lland ........... ,,IN'VlfflnCDrll
~l'Ndcnal , .cm ,._ ~Coal ....... Vllllyll-dlltapllinundlDWlf'ld congllll'TWW.tawiit,mlnarlil\a.,,.llt'CI 1iar,rtNIIUIT9
llt..dlTUffl~>211m
AETREATMTK>lJ'TM ~
GN'lllllliDrlla • dol'la; galltlro
~w w a:
ANMtE liETAtrilDfFI-ICS GRCllf' lrdfllr_,lllad ld'iat. .-,IZI•
Q.
llt'CI tatc lgneoi.a l"Odcl
Q.
Figure 2. Stratigraphic column.
Bowen Basin 1995 - Symposium
-
448
'I!
I I
I Q.Jatemary
MdPemian Early Pernian
0evorian PIOl8f020ic ID
Elliy Cambrian
--
c=J
744DCBlrnN
AIL!Yial Sediments
lnct.Jrated sediments, tik:race, basalt flows
!B]]][] UPPER ALDEBARAN SANDSTONE
Em IRI
ALDEBARAN SANDSTONE UPPER REIDS OOME BEDS LOWER REIDS DOME BEDS Upper Coal Meaourn Barren UM
Lower Coal Meaourn
CJ
RETREAT BATHOLITH
-
ANAKIE METAMORPHIC$ GROUP 74,0IXIGrnN
7 QIDOD_.
74ZIDOD~
VALERIA
'I!
II I
Figure 3. Valeria coalfield geology. Bowen Basin 1995 - Symposium
449
south. Seam thickness and quality deteriorate to the north. The uppermost seam (La Poule Seam) occurs in up to six splits, with the main interval averaging 4.5m in thickness. Below this lies the Bum Seam, which typically comprises two 2m splits and two minor bands. The Kettle Seam comprises up to six separate plies, with a main interval thickness of 6.2m (limited in extent). Two other splits average 3.5m and 2.4m in thickness. The lowermost seam (Selma Seam) occurs as two splits, each averaging 1.5m in thickness. Aldebaran Sandstone
An angular unconformity and an abrupt change from lithic-quartz to quartzose sandstones defines the boundary between the Upper Reids Dome beds and the Aldebaran Sandstone. In places, the base of the unit is bioturbated and contains rare shell fragments. This formation outcrops in the east of the coalfield. Within the sequence, three coal seams dip to the east at between 2 • and 15 • (average 2 °-6 °). The structure is relatively simple, although folding and minor faulting has modified the regional trend in some places. Two zones amenable to open cut mining have been termed Area 7 and Area 8. The uppermost seam (Rider Seam) averages l.lm in thickness and occurs in Area 8 and the north of Area 7. It commonly lies close to the Theresa Seam (interburden <lm). The most important coal interval in the sequence is the Theresa Seam, averaging 4.5-6.Sm in thickness, and present throughout the two defined resource areas. A zone of intense splitting coincides with the floodplain of Theresa Creek. The lowermost seam (Carbine Seam) generally occurs as either of two splits of a Sm thick interval. The Upper Split (3-4m thick) is dominant in Area 7 South, with the Lower Split (2-3m thick) dominant to the north. Interburden A'
... •
• •
• D
• •
■- .....
■ a..,.. .......... . _.....
__
Figure 4. Cross-section showing depositional environments.
Bowen Basin 1995 - Symposium
450
between the Theresa and Carbine Seams increases from around Sm in the north (Area 8) to 40m in the south. Upper Aldebaran Sandstone
Biostratigraphic dating of sediments overlying the Theresa Seam suggests that a hiatus occurred in the latter part of the Early Permian. Above this break, a similar style and provenance of sedimentation resumed and continued into the Late Permian. This unit, informally referred to here as the Upper Aldebaran Sandstone, is preserved over a small area in the east of the coalfield. A single coal seam (Retro Seam) occurs in this unit. It typically exists as two splits, each l - 2m thick. The coal contains extremely high sulphur levels (up to 9.7% raw) .
COAL QUALITY
Important coal quality parameters for the main seams in each of the three defined coal resource areas are discussed briefly below . Although the coals show variations in type and rank between sequences, all classify in ASTM terms as High Volatile B Bituminous. The Area 1 coals are broadly described as low rank, high fluidity, moderate to high swell, high volatile coals. As they are highly banded, raw ash is high (20-40% ad), although inherent mineral matter is low . Hence, washed product theoretical yields are poor, averaging around 50% for a two product scenario. The coal is unusual in the Australian context in that it is a low rank coking coal. Its properties place it in a similar category to indigenous Japanese high fluidity, soft coking coals, suitable only as a blend component with higher rank coking coals in conventional coke making. Sangster (1991) considered the coal to be similar to some of the coals from the Greta Coal Measures in New South Wales. Indicative product coal qualities for Area 1 coking coal are presented in Table 1. A middling thermal coal product could also be produced, with similar quality to the thermal coals higher in the geological sequence. Alternatively, the coking properties could be sacrificed in favour of a single thermal product. The Area 4C resource is of limited economic potential. No more than the following outline of coal quality is necessary. From the limited analytical data on record, La Poule, Kettle and Burn Seam raw coal contains low to moderate ash and sulphur, and should be amenable to simple washing to produce a high energy thermal product. Coal rank as indicated by vitrinite reflectance (Ro max) is in the range 0.72-0.75%. In Areas 7 and 8, both the Theresa and Carbine Seams have no coking properties, contain low to moderate ash, and moderate to high volatiles and energy. Hence they are potential sources of coal for power generation. Rank variations, both laterally and between the seams, are minor, with reflectance averaging 0.66-0.68% (Ro max). The coal is characterised by high liptinite content (9-12% dmmf) and approximately equal amounts of vitrinite TABLE 1. AREA 1 COKING PRODUCT QUALITY. Capella Seam
Total Moisture(% ar) Moisture (% ad) Ash(% ad) Volatile Matter(% ad) Total Sulphur (% ad) Phosphorus (% ad) CSN
Max. Fluidity (dd/min) Vitrinite Reflectance (Ro max, %)
Bowen Basin 1995 - Symposium
10.0 3.3
7.9 35.7 0.67 0.005 7 1040 0.75
Llandillo Gardner & Anakie Seams 10.0 2.5 8.8 37.8 0.63 0.009
7.5 7500 0.72
451
and inertinite. This proportion of liptinite accounts for the relative toughness of the coal. Raw coal quality for the two major seams is presented in Table 2.
TABLE 2. AREA 7/8 RAW COAL QUALITY.
Moisture (% ad) Ash(% ad) Volatile Matter(% ad) GCV (kcal/kg ad) Total Sulphur (% ad) Chlorine (% ad) HGI
Theresa
Carbine
4.5 13.4 32.9 6595 0.70 0.02 37
4.5 10.4 32.3 6895 1.04 0.04 44
The coal is amenable to beneficiation using simple jig washing methods, with an optional spirals circuit for improved energy yield and sulphur reduction. A single, low ash, high energy thermal product can be achieved at a high process yield. Table 3 shows the combined seam product specification.
COAL RESOURCES
Coal resources and mineable in situ reserves for each of the main coal resource areas are listed in Table 4.
TABLE 3. AREA 7/8 PRODUCT COAL QUALITY. 9-12 4.5 8.1 34.1 7090 0.70 0.04 25
Total Moisture (% ar) Moisture (% ad) Ash(% ad) Volatile Matter(% ad) Calorific Value (kcal/kg ad) Total Sulphur (% ad) Chlorine (% ad) HGI40Abrasion Index (mg/kg) Ash Fusion Temperatures (reducing) Deformation (°C) Hemisr,here ( °C) Flow ( C)
1540 >1600 >1600
TABLE 4. COAL RESOURCES AND RESERVES. Project Area
Area 7 & 8
Area4C
Area 1
Seam
Status
Coal In Situ Resources (Mt)
Mineable In Situ Reserves (Mt)
Rider Theresa Carbine TOTAL La Poule Kettle Burn TOTAL Slateford Capella Llandillo Gardner Anakie TOTAL
Measured Measured Measured
2 118 89
65 41
209
106
25 29 32
12 15 16 43 3 103 2 1 2 112
Meas+ Ind Meas+ Ind Meas+ Ind
86
Measured Measured Meas+ Ind Meas+ Ind Meas+ Ind
Bowen Basin 1995 - Symposium
4 207 27 28 30 296
452
REFERENCES
EDENBOROUGH, S.J., 1985: The Reids Dome Beds-Ca~lla, Central Queensland. Bowen Basin Coal Symposium. Geological Society of Australia. Abstracts, 17, 53-57. PRICE, P.L., 1995: Borehole Samples from the Valeria Exploration Permit, Northern Denison Trough. APG Consultants Report 145/72. SANGSTER, J.W., 1991: A Quality Assessment of Valeria Area 1 Coal. Pacific Coal Pty Limited Report. WILSON, R.G., 1972: Geology and Evaluation of Coal Deposits in ATP 52C Ca~lla. Volume 1 - Regional Geology and Summary of Reserves. CRA Exploration Pty. LimitecfReport.
RDC Smith Pacific Coal Pty Limited
Bowen Basin 1995 - Symposium
453
THE WINCHE STER SOUTH COAL DEPOSI T LOCATION
Winchester South is located 30km south-south-e ast of Moranbah in the north central Bowen Basin (Figure 1). The Isaac River crosses the north-eastern side of the area, and the Peak Downs rail line traverses the north-western portion. Peak Downs mine lies 10km to the west. Winchester South is located 200km west-south-we st of Mackay and 196km by rail from Dalrymple Bay Coal Terminal.
North Goonyella
221
Norwich Paik
231
1411
Figure 1. Location map.
EXPLORATION HISTORY
The Winchester South area was first explored in the 1960s by Utah Development Company as part of Authority to Prospect (ATP) 6C, and later ATP 67C. Only small reserves of non-coking coal were established and the ATP was relinquished in 1973. In the late 1970s, the Department of Mines carried out a reconnaissanc e drilling program which outlined a new area of coal suitable for opencut mining. In 1980, the Queensland Government invited applications from companies for the exploration and subsequent development of the thermal coals at Winchester South. A joint venture comprising BP Australia Ltd (50%), Drayton Mining Development Proprietary Limited (25%) and Westfield Limited (25%) was successful and on 2 April 1981 they were awarded ATP 352C. BP Australia Ltd was appointed manager of the project. There followed an intensive exploration program which consisted of the drilling of 1012 slim (partly cored) holes and 20 large (150mm and 2m) holes. Features of the geological investigations were:
Bowen Basin 1995 - Symposium
454
gravity and seismic surveys; •
eight 2m cores to obtain a bulk sample for coal handling, washability and combustion studies; two lines (of 5km total length) of open-holes at 50m centres to assist in structural inter-pretation.
On 6 March 1989, the Authority to Prospect became ATP 16CR. The proclamation of the Mineral Resources Act on 1 September 1990 resulted in ATP 16R becoming Exploration Permit Coal (EPC) 486. CRA Limited acquired BP Australia Ltds coal interests in late 1989. Management of the project was consequently transferred from BP Australia Ltd to Queensland Coal Pty Limited (a subsidiary of CRA Limited) in March 1992. In 1995, an adjoining EPC (EPC 574) was granted. The current joint venture comprises: Queensland Coal Pty Limited
50%
Drayton Mining Development Proprietary Limited
25%
Westfield Limited
25%
The Winchester South project is managed by Pacific Coal Pty Limited, a subsidiary of CRA Limited.
GEOLOGY
Winchester South lies on the western side of the northern Bowen Basin. Upper Permian and Lower Triassic strata dip regionally towards the east. The sediments at Winchester South lie within a north-north-westerly trending syncline (the Winchester South Syncline). Superimposed on this structure is a pattern of major and minor faulting which generally parallels the axis of the Winchester South Syncline (Figures 2 and 3). Winchester South contains three major Permo-Triassic units. In ascending chronological order these are the Permian Fort Cooper Coal Measures, the Upper Permian Rangal Coal Measures and the Triassic Rewan Group. The Fort Cooper Coal Measures are approximately 350m thick and contain high to very high ash coal, in seams heavily banded with tuffaceous claystone. The Rangal Coal Measures are approximately 40-80m thick and contain low to moderate ash coal seams, and grey sandstones and siltstones. The boundary with the underlying Fort Cooper Coal Measures is taken at the top of a bed named the Yarrabee Tuff Bed, which is usually found within the Vermont Seam. The Yarrabee Tuff Bed divides the Vermont Seam into a Vermont Upper Seam and Vermont Lower Seam. The Vermont Lower Seam is composed of interbanded coal and tuffaceous mudstone. Seam thickness ranges from 3.5m to 4.5m within the syncline, with seam splitting and coalescence resulting in thickness ranges from 2m to 12m elsewhere. The base of the Vermont Lower Seam is gradational, especially in the thicker seam sections. The Yarrabee Tuff bed ranges in thickness from 0.2m to 2.3m and averages 1.3m. It consists of soft mudstones and tuff aceous claystones and has a characteristically high natural gamma response which is recognisable over large areas of the Bowen Basin. The top of the Yarrabee Tuff Bed marks the base of the Rangal Coal Measures. The Vermont Upper Seam averages 1.5m thickness and thickens to the south of the EPC due to an increased number of stone bands. The Vermont Upper Seam is also predominantly dull with minor bright bands. The interburden thickness to the overlying Leichhardt Seam ranges from 15 to 34m and averages 29m. Bowen Basin 1995 - Symposium
455
148"20'
148"1S
WINCHESTER SOUTH .6
\
~
\
2000 m
22"1S
Figure 2. Structure, stratigraphy and site layout. EAST
WEST RANGAI.CM
A
FORT CCXlPERCM
A'
100m
200m
3 00m
WESTERN
WWCHESTE R
BLOCK
SCUTH SYNCl.lE
Figure 3. Representative cross-section. The coal seam of primary interest in the Winchester South deposit is the Leichhardt Seam which occurs towards the middle of the Rangal Coal Measures (Figure 4). The Leichhardt Seam is generally between 4.0 and 5.0m thick in the syncline and ranges from 1.2 to 6.0m. West of the syncline in the Western Block, the seam is either thin, banded or split. The Leichhardt Seam is predominantly dull with minor bright bands, and has a few thin stone bands near its middle and base. A thin (<lrn thick) coal seam is developed above the Leichhardt Seam in places. The roof of the Leichhardt Seam is usually silty mudstone with a sharp boundary. The floor is gradational over about 0.Sm and consists of interbanded carbonaceous shale and coal. The Rewan Group contains no coal and is distinguished by moderately hard grey-green lithic sandstone and red brown mudstone beds. The boundary Bowen Basin 1995 - Symposium
456
DEPTH
1D
GEOLOGICAi. AGE
-c
-
.....---
S'TR'TIJAPJIMC
~
~ . ...TfflNi
FEWANOAOl.P (,.,Cool)
Ds#OITCM
m a
.
UNNAM ED AIOEJI -
,. 40
. . ,.
INfS.EOOEO•oa.m l,UMJITOM:JN.motE•.., CIMQJUCEOACU'l'l'TDMI
[ I I -•-
-•
~OA-.offc:M:
1;1;1 _.....
-
LEICMHAll'.JT
....
urn,
...._..._ ...._ _ ""'a.ll"lmal ..,,.)
IWfJM.(X),11_
V"°'ONT
. . ,.
·:.--::: ]-
UPPER .....
/_
_
RlRTCOOPER
"""'--•
... -- ,
(5Dmltidl;)
l OWEACEAM V"°'ONT
....._.PUT
I""'""
Figure 4. Stratigraphic column.
with the underlying Rangal Coal Measures is taken as the uppermost carbonaceous bed, or at the colour change to the grey sandstones and siltstones of the Rangal Coal Measures. Tertiary and recent sediments occur mainly in the southern part of EPC 486 and consist of unconsolidated sands, gravels and clays. They range up to 40m thick near the southern boundary of the EPC. Depth of oxidation is typically 20m, but is shallower to the north. Geological structure at Winchester South is characterised by the regional easterly dip of 5 •. This regional dip is interrupted by two major north-north-westerly trending thrust faults which have folded the strata to form a large synclinal structure, the Winchester South Syncline. This syncline contains the mineable in situ reserve. Maximum depth to the Leichhardt Seam within the syncline is 130m. The western fault is the Isaac Fault. This is a thrust fault, east side up, and ranges in throw from more than 350m in the northern end of EPC 486, to 100m over the central and southern portions of the area. The Isaac Fault at Winchester South may have a large strike-slip component, as suggested by an abrupt change in character in both the Leichhardt and Vermont Seams across the fault. On the western limb of the Winchester South Syncline there is a zone of low angle thrust faulting approximately 500m wide associated with the Isaac Fault. Within this zone there is multiple repetition of the coal seams and relatively steep dips (up to 20"). Displacement ranges from local seam thickening to tens of metres, and may be accompanied by relatively steep dips. As a result of this multiple thrusting there are a number of sub-parallel seam subcrops along the western margin of the Winchester South Syncline. Large scale faulting also occurs on the eastern edge of the syncline. These faults appear to be predominantly high angle reverse faults and parallel those on the western limb. Throws on the eastern faults range up to 100m and they commonly truncate the Leichhardt Seam subcrop. Bowen Basin 1995 - Symposium
457
Within the bulk of the Winchester South Syncline however, the incidence of faulting appears moderate with both reverse and normal faults being identified. North-north-westerly faults with throws of up to 50m occur. A large Cretaceous stock of granodiorite outcrops in the north-east portion of EPC 486. The size of this igneous intrusion is approximately 4km (north-south) by 3km (east-west). The exposed portion of the stock measures about 20m high by 200m in circumference and contains two quarried faces. Elsewhere there are very few intrusions intersected within the coal seams.
COAL QUALITY
Coal from the Leichhardt Seam is mainly a moderate ash, dull, low volatile, low sulphur thermal coal with weak coking properties. Raw ash generally increases from north to south and from east to west. Specific energy is highest in the east. Typical product coal properties are presented below.
LEICHHARDT SEAM INDICATIVE PRODUCT COAL QUALITY 2.2 12.3 21.7 63.8 2.94 0.42 85.7 1.5 1360 76 30.0
Moisture(% ad) Ash(% ad)
Volatile Matter(% ad) Fixed Carbon(% ad) Fuel Ratio (FC:VM) Total SulRhur (% ad) Ultimate Carbon (% daf) CSN IDT (Reducing Atmosphere ·c) HGI SE (MJ /kg ad)
Petrographic studies of the raw coal show that it contains on average 32% vitrinite, 3% liptinite, 54% inertinite and 11 % mineral matter (mainly clays).
COAL RESERVES
The mineable in situ reserves (in Mt) within the Winchester South Syncline are tabulated below.
DEPTH TO LEICHHARDT SEAM Seam Leichhardt Vermont Upper Vermont Lower TOTAL
REFERENCES
o-som 104
57 121 282
No depth limit 141 72
145 358
ANDERSON, J.C., 1988: A Review of Winchester South Coal Resources. BP Australia Ltd Report. ANDERSON, J.C. & DAVIES, J.G., 1982: Winchester South Re-interpretation of the Geological Structure. BLAYDEN, I.D., 1983: Geological Assessment - Leichhardt Seam "Northern Block". DAVIES, J.F., SIPPE, P.C., TILL, V.S. & MACDONALD, E., 1983: Winchester South, Queensland, A to P 352C, A Reassessment. BP Australia Ltd Report. FLUOR AUSTRALIA PTY LIMITED, 1980: Winchester South Technical Report. OGG, J.W., 1987: A Review of Coal Quality at Winchester South, Report to Drayton Investments Pty Ltd. JR Wilton Pacific Coal Pty Limited Bowen Basin 1995 - Symposium
458
Bowen Basin 1995 - Symposium
459
THE WOLFANG COAL DEPOSIT LOCATION
The Wolfang coal resource is located 270km south-west of Mackay and 10km north of the township of Clermont in Central Queensland. The Peak Downs Highway and Gregory Development Road join at the southern end of the mining lease area (Figure 1). The Blair Athol coal mine is located 10km east of the Wolfang coal resource.
EXPLORATION HISTORY
The Wolfang Basin was discovered by Dampier Mining Company in 1978 during regional exploration for Witwatersrand-type gold deposits within Authority to Prospect 1559M. Initially, ground gravity surveys were conducted wherever Permian rocks were suspected. As a result of this work, 38 diamond drill holes were sited to intersect the margins of the inferred Permian basins with the aim of intersecting auriferous basal Permian conglomerates. Five Permian basins were delineated, of which the Wolfang Basin was one. Subsequently, the then Queensland Department of Mines evaluated the coal resources of the Wolfang Basin by further gravity surveys and the drilling of 23 diamond drill holes. The Mines Department reserved the area for tender and on 28 May 1980, White Industries Limited (Whites) was granted Authority to Prospect 294C over the area for a period of three years. A joint venture was then formed between Whites (55%) and Mitsubishi Development Pty Ltd (45%). The joint venture proceeded to drill 60 000m at 302 sites, with 326 core samples extracted for coal analysis.
231
klll
Wollan9 BaNl
....
Figure 1. Location map.
Bowen Basin 1995 - Symposium
460
Features of the geological investigations were: •
gravity, magnetics, EM, resistivity and seismic reflection surveys;
•
large diameter (200mm) coring to obtain a 22t bulk sample for coal handling, washability and combustion studies;
•
fuiry cored, oriented slim cored holes for geotechnical studies;
•
establishment of water bores for groundwater studies.
Mining Leases (MLs) 1874 and 1980 were granted to the joint venture company (Clermont Coal Mines Limited) in March 1983. Whites interest was acquired by Exxon Coal and Minerals Australia Ltd (Exxon) in February 1989. The MLs became 1884 and 1904 respectively with the proclamation of the Mineral Resources Act in 1990. In 1994, Queensland Coal Pty Limited (a subsidiary of CRA Limited) and ARCO Resources Limited acquired Exxons share of the joint venture. The current joint venture consists of: Queensland Coal Pty Limited
35.50%
ARCO Resources Limited
19.50%
Mitsubishi Development Pty Ltd
45.00%
The Wolfang Project is managed by Pacific Coal Pty Limited, a subsidiary of CRA Limited.
GEOLOGY
The coal reserves at Wolfang are located within the Wolfang Basin which is situated adjacent to the western margin of the Bowen Basin. The Wolfang Basin is an elongate north-south trending Early Permian basin approximately 5.0km long and 1.5km wide, developed on basement Anakie Meta-morphics and overlain unconformably by Late Permian sediments and Tertiary sediments and basalts. The Wolfang Basin formed within a zone where Early Permian extension along east-west axes interacted with a north-north-west trending tectonic corridor emanating from the Denison Trough and passing into the Anakie Inlier. This interaction resulted in the development of the half graben Wolfang Basin. Within the Wolfang Basin, the basement is of an irregular shape with the thickest accumulation of Permian sediments being in excess of 428m adjacent to the western edge of the basin. The western limit is sharply defined by high angle thrust faulting against the metamorphics. This thrust zone has resulted in the western side being upthrown in excess of 210m in places. Four other thrust faults have been identified in the deposit, with throws ranging from 20m to 100m. The local western margin of the Bowen Basin, called the Clermont Stable Block, is an inlier of the Anakie Metamorphics Group. This sequence consists of Proterozoic to Early Cambrian schists, phyllites, slates and quartzites, and forms the basic element of the Clermont Stable Block. The Early Permian sequence unconformably over-lying the basement is characterised by sandstones and siltstones in the south and conglomerate in the north. This sequence is equivalent to the Reids Dome Beds. The coal measures of the Wolfang Basin are of Early Permian age, equivalent to the nearby Blair Athol Coal Measures and to the Collinsville Coal Measures. The Wolfang Coal Measures comprise coal seams, sandstones, siltstones, conglomerates and shales, and developed unconformably on the Wolfang Conglomerate during the Early Permian. Figure 2 displays a cross-section through the basin. A section of Late Permian sediments is found throughout the basin, and consists of micaceous claystones and sandstones. These sediments have suffered considerable reworking and consequently are poorly consolidated. Bowen Basin 1995 - Symposium
461
EAST
WEST
A'
A
Figure 2. Representative cross-section. PERIOD Quoltnwy lo Torlllry
SEAM
FORMATION ,,.,.. fob.1"'110.J•-...... bnll'l..-,.d •IIIIIIWlnl...,dll/ ,,,,.,.,,,'11dna,.,, . . .
,t v 'i i , \'. N :v:;·v\v. •i:= l..twxlfllonnity
---
Blenheim Sub-Group
~ - . . . , , dapt- and
__ --
~
l..twxlfllonnily
..,
Wolfang Coal lluaur"
~··~~
Wol,ng~{1¥11agelhictntA26111)
l..twxlfllonnily
Anlldell.,.mo,pt,ico T~l-dldtaD,~. - - nl~MlllM
Figure 3. Stratigraphic column. Bowen Basin 1995 - Symposium
462
During the Tertiary, unconsolidated sediments of reworked Late Permian sediments and meta-morphics were deposited. Overlying the sediments are up to four basalt flows of Miocene age. A simplified stratigraphic column is shown in Figure 3. The general basin structure within the coal measures reveals dips of 2° to 10· to the west from the eastern subcrop, and 1 • to 5 • to the north and south from the southern and northern subcrops respectively. The coal in the Wolfang Basin is located within a number of seams. These are (in descending order) the Cowrie, Prospect, Wolfang Upper, Wolfang and Lower. The Cowrie Seam ranges in thickness from 0.2m to 3.2m, and averages 2.8m. It contains numerous shale bands and high sulphur. The Prospect Seam is high ash (up to 28% adb) and ranges in thickness from 0.4m to 12.4m and averages 6.8m. The Wolfang Upper Seam comprises dull coal and ranges in thickness from 0.4m to 4.Sm, averaging 2.6m. The Wolfang Seam is the primary seam and consists of two sections, labelled (in descending order) WFl and WF2. The WFl section is a homogeneous coal section with no stone plies and averaging 15.8m in thickness. The WF2 section is higher ash and averages 14.4m in thickness. The WFl section is contiguous with the WF2 section over most of the basin. The Wolfang Lower Seam is high ash and highly banded. It is often split into two plies of around 2m thickness.
COAL QUALITY
The Wolfang Seam contains in excess of 90% of the marketable coal reserves within the Wolfang Basin. Predicted Wolfang product coal quality is as follows: Total Moisture % Moisture (ad) % Ash (ad)% Volatile Matter (ad) % Sulphur (ad) % Calorific Value (ad) kcal/kg HG Ultimate Analysis Carbon (daf) % Hydrogen (daf) % Nitrogen (daf) %
COAL RESOURCES
83.8 4.9 1.9
The measured coal resources and mineable in situ reserves are presented below: Measured Coal Resources (Mt) Wolfang Seam Other Seams Total Mineable In situ Reserves (Mt) Wolfang Seam Other Seams Total
REFERENCES
14.5 6.0 9.3 27.4 0.30 6770 154
183 27 210 176 12 188
CLERMONT COAL MINES LIMITED, 1981: The Geology of Wolfang Basin ATP 294C. CLERMONT COAL MINES LIMITED, 1986: Clermont Project - Technical Feasibility Report. CLERMONT COAL MINES LIMITED, 1990: Clermont Coal Project - Class III-S Study. PACIFIC COAL PTY LIMITED, 1994: Clermont Coal Project - Due Diligence Report. R Wilton Pacific Coal Pty Limited Bowen Basin 1995 - Symposium
463
YARRABEECOALMINE LOCATION
The Yarrabee Mine is located approximately 40Km north of the2town of Blackwater in Central Queensland. The area covers some 15km of Rangal Coal Measures. The location of the Yarrabee Mine is shown in Figure 1.
TENURE AND HOLDER
Yarrabee Mine, which is located within ML 1770, is owned and operated by Yarrabee Coal Company Pty Ltd (Yarrabee Coal), a subsidiary of Resource Management and Mining Pty Ltd (RMM). RMM is a privately owned company registered in Queensland.
DEVELOPMEN T HISTORY
The Yarrabee Mine deposit was first discovered in 1966 and the mine commenced production using opencut methods in 1981 under the management of CSR Limited. Yarrabee Coal purchased the mine from CSR Limited in 1989.
MINING METHODS
Yarrabee Mine is operated as an opencut mine. Hard overburden is drilled and blasted, while the softer overburden is ripped with dozers. The overburden is removed and backfilled into mined out areas using a fleet of excavators and trucks which are assisted by Caterpillar D9 and D10 dozers. Mined areas are progressively rehabilitated. Coal is blasted and loaded by front-end loaders into 85t rear dump trucks for transport to the preparation plant. At the preparation plant, run-of-mine coal is crushed prior to stockpiling at the mine. Careful mining methods and blending ensure that the crushed coal meets customers requirements. Product coal is hauled 37km to the Boonal rail siding for loading onto trains operated by the Queensland Government Railways. Current production is 300 000tpa, the majority of which is exported to Europe.
GEOLOGY
Yarrabee Mine covers an area of Rangal Coal measures within the Perrnian age Bowen Basin which have been the focus of coal exploration since the mid 1970s. Exploration has shown that the area is structurally complex with normal, thrust and strike-slip faulting and folding effecting the location and distribution of coal bearing strata. The principal rock types are sandstone, siltstone, mudstone and coal with the Yarrabee Tuff forming the base of the formation. The Rangal Coal Measures have been weathered to an average depth of 20m. A thin veil of Tertiary and/or Quaternary sediments occurs in some parts of the lease. The area is characterised by structural deformation more severe than that found in most other coal deposits in the Bowen Basin. The only coal seam mined to date is the Pollux Seam, however there are four seams of significance in the area. These have been correlated in stratigraphic order as the Aries, Castor, Pollux and Pisces. The coal is of semi-anthracite rank. Local thickening and repetition of the Pollux Seam occurs throughout the area due to low angle thrust faulting. The Aries and Castor seams are a thin and rarely exceed lm in thickness. The Pollux Seam has an average thickness of 4m and is the most consistent seam in the area in terms of thickness and coal quality. The lowest seam correlated is the Pisces Seam which consists of a thick sequence of interbanded coal and mudstone. The Pisces Seam is associated with the Yarrabee Tuff bed (Matheson, 1990), a significant gamma marker, and has only been intersected in a small number of holes.
COAL QUALITY
The Pollux Seam is classified as semi-anthracite and is characterised by low volatile matter (9%-11 % air dried basis). The seam consists of three plies Bowen Basin 1995 - Symposium
464
690000
720000
110000
100000
0
0
0 0 0
0 0 0
('I')
('I')
",....
",....
ML 1770 YAARABEE 0 0 0 0
0 0 0 0
(\J
(\J
,.... "
,.... "
0 0 0 0
0 0 0 0
....
....
",....
-0
",....
"' 0
a:
,...,
::,
"'
J:
n.., 11) 11)
0
0 0 0 0
-,:
0
0 0
0
0
",....
",....
0 0 0 0
0 0 0 0
Blackwater
Cl
to Rockhampton
('I') ,....
Boonal Siding
690000
700000
710000
Figure 1. Location of Yarrabee mine.
Bowen Basin 1995 - Symposium
120000
Cl
,.... ('I')
465
TABLE 1. TYPICAL PRODUCT COAL QUALITY.
Parameter
Total moisture Volatile matter Ash Total sul~hur Specific nergy (gross)
Value (as received) 9.0% 8.8% 9.7% 0.79% 28.81MJ/kg
based on ash content which is higher at the top and base. Typical product coal analysis for the main product sold is summarised in Table 1.
COAL RESOURCES
Coal resources have been previously stated as 4Mt in situ of Measured class and 13Mt in situ of Indicated class for the Pollux Seam.
FUTURE DEVELOPMEN T
Currently defined mine areas are planned to be exhausted in three years. Mining areas are progressively moving to the south of the lease.
REFERENCES
MATHESON, S. G., 1990: Definition of the Yarrabee Tuff Bed. In Bowen Basin Symposium 1990, 233-235. Greg Jones JB Mining Services Pty Ltd
Bowen Basin 1995 - Symposium
466
Bowen Basin 1995 - Sympos ium
467
YARRABEE SOUTH COAL DEPOS IT - MDLA 160 LOCATION
MOLA 160 Yarrabee South is located immediately south of the Yarrabee Mine lease and approximately 35km north north-east ~f the town of Blackwater in Central Queensland. The area covers some 30km of Rangal Coal Measures. The location of MOLA 160 Yarrabee South is shown in Figure 1.
EXPLORATION HISTORY
Exploration of the area was previously undertaken under the titles of ATP 123C Yarrabee South and ATP 190 Strathconan. These areas were variously held by Theiss Bros Pty Limited (Theiss), CSR Limited (CSR), MIM Holdings Limited (MIM) and Mines Administratio n Pty Ltd (Minad) prior to Yarrabee Coal Company Pty Ltd (Yarrabee Coal) gaining access to the area in 1993. The Yarrabee Mine deposit to the north was first discovered in 1966 and the mine commenced production using opencut methods in 1981. Drilling in the Yarrabee South area was commenced by Theiss in 1973 and in the Strathconan area by Minad in 1976. Exploration for the most part has included openhole and cored drilling with a significant proportion of the holes being geophysically logged. The suite of geophysical logs usually include gamma, density and caliper, while neutron and dipmeter were recorded for some of the holes. Several surface geophysical surveys have been conducted, with the more recent Sirotem survey over the CSR area highlighting some of the major structures. The following table summarises the drilling that has been undertaken in over 20 years of exploration within MOLA 160.
GEOLOGY
MOLA 160 covers an area of outcropping Rangal Coal measures within the Permian age Bowen Basin which have been the focus of coal exploration since the mid 1970s. Exploration has shown that the area is structurally complex with normal, thrust and strike-slip faulting and folding effecting the location and distribution of coal bearing strata. The principal rock types are sandstone, siltstone, mudstone and coal with the Yarrabee Tuff forming the base of the formation. The Rangal Coal Measures have been weathered to an average depth of 20m. A thin veil of Tertiary and/or Quaternary sediments occurs in some parts of MOLA 160. The coal is of semi-anthraci te rank, while the area is characterised by structural deformation more severe than that found in most other coal deposits in the Bowen Basin. The main coal seam explored to date is the TABLE 1. DRILLING STATISTICS WITHIN MOLA 160.
Year
1976 1977 1978 1980 1986 1973 1974 1975 1977 1978 1978 1980 1981 1986 1993/94 1995
Tenement Number and Holder
EPC 190 Minad EPC 190 Minad EPC 190 Minad EPC 190 CSR EPC 190 CSR EPC 123 Theiss/MIM EPC 123 Theiss/MIM EPC 123 Theiss/MIM EPC 123 Theiss/MIM EPC 123 Theiss/MIM EPC 123 Theiss/MIM EPC 123 CSR/MIM EPC 123 CSR/MIM EPC 123 CSR/MIM Yarrabee Coal Yarrabee Coal TOTAL
Meterage (m) Total Core 0/Hole 1246 217 1029 1737 27 1710 3035 50 2985 1783 20 1764 414 0 414 1047 0 1047 434 56 378 1073 35 1038 1440 143 1297 28 7 21 60 12 48 868 0 868 1334 0 1334 1813 37 1776 2851 45 2806 3273 4 3269 22434 652 21782
Bowen Basin 1995 - Symposium
No.of Holes
16 28 54 25 7 37 8 23 26 1 2 8 15 33 54 61 398
468
690000
720000
710000
700000
0
0 0
0 0 0
0 0 ('t')
('t')
V I'-
I'-
0 0 0 0
0 0 0 0
V
C\J
C\J
V
V
I'-
I'-
MOLA 160 YARRABEE SOUTH
0
0
0 0
0 0 0
0
....
....
u
V I'-
V I'-
ID
a
a:
,..., :::, ID
I
..,
('")
"'"'-,::
0 0 0
0 0 0
0
0
0
0 V I'-
V I'-
0 0 0 0
0 0 0 0
Blackwater
m
to Rockhampton
('t')
I'-
Boonal Siding
690000
700000
710000
Figure 1. Location of Yarrabee South. Bowen Basin 1995 - Symposium
720000
m
('t')
I'-
469
SOUTH
NORTH ARIES Seam 1.Om
Orn
ARIES Seam 2.9m CASTOR Seam 2 . 1m
CASTOR Seam O. 9m
5Om
POLLUX Seam 3 . 2m ORION Seam O.9m 1OOm
POLLUX Seam 4 . 3m ORION Seam O.6m
Unnamed seam PISCES Seam YARRABEE TUFF
15Om
Section compiled from Holes ROO5, R4O1 , R178 VIRGO Seam 2OOm Section compiled from Hole SCOO1
Figure 2. Yarrabee South stratigraphy.
Bowen Basin 1995 - Symposium
470 705000
710000
I\)
"
I\)
t.n 0 0 0
t.n 0 0 0
"
A
A
-<
a,
-, -, a,
cr
(1) (1)
• • "
"
A
A
I\)
I\)
0 0 0 0
••• •
0 0 0 0
r~
\. \ ~
' \
MOLA 160 YARRABEE SOUTH \
·t
\•
-u
·\
\
.
<;..,..., • \ ~
)
';: Cored coal seam•
tJ)
"'
';
! :
\\. •
" A
t.n 0 0 0
" A
c.n
0 0 0
705000
Figure 3. Major structural elements. Bowen Basin 1995 - Symposiu m
710000
471
Pollux Seam, however there are six seams of significance in the area. These have been correlated in stratigraphic order as the Cancer, Aries, Castor, Pollux, Orion and Pisces. A schematic representation of the stratigraphy is shown in Figure 2. The Cancer seam has only been recognised in a few holes in the eastern portion of MDLA 160. The Aries and Castor seams only reach a thickness exceeding 1m in the southern portion of MDLA 160. The Pollux Seam has an average thickness of 3.6m and is the most consistent seam in the area in terms of unfaulted thickness and coal quality. The Orion seam is thin and rarely exceeds 1m in thickness. The lowest seam correlated within MDLA 160 is the Pisces Seam which consists of a thick sequence of interbanded coal and mudstone. The Pisces Seam is associated with the Yarrabee Tuff (Matheson, 1990), a significant gamma marker, and has only been intersected in a small number of holes, mostly in the southern portion of MDLA 160. The geological structure of potentially commercial coal seams within MDLA 160 is dominated by the presence of two major structures which have been named the Yarrabee Anticline and the Beantree Fault. The location of these structures is shown on Figure 3. The location of the Beantree Fault is determined from the interpretation of drillhole data as well as a Sirotem study reported by Rutter (1986) where he describes it as Fault A. The Yarrabee Anticline is a north-south oriented anticline which extends south from ML 1770 Yarrabee into the northern part of MDLA 160 where it is truncated by the north-east-south-west trending Beantree Fault. This major right-slip transverse fault has a horizontal displacement of over 1km. The presence of the Yarrabee Anticline has not been confirmed south of the Beantree Fault. Local thickening and repetition of coal seams occur throughout the area due to low angle thrust faulting. The precise orientation of these thrust faults is not confirmed, although it is thought that they are aligned NW /SE similar to that observed at Yarrabee and Curragh Mines. The coal occurring in MDLA 160 is classified as semi-anthracite and is characterised by low volatile matter (9% - 11 % air dried basis) and varying ash. The Pollux Seam is consistently the better quality coal. Typical in situ air dried analyses for coal from the various seams tested are outlined in Table 2.
COAL QUALITY
TABLE 2. TYPICAL IN SITU COAL QUALITY (AIR DRIED BASIS). ecific Total Volatile Ash Noof Seam Matter Su~hur ~ ner~ Holes Thickness ( o),.,. (MJ/kg,.,. (%) (%) (m)* Tested 11 20 2.0 5 Aries Seam 11 28 1.3 7 Castor Seam 30 0.6 10 12 26 3.6 Pollux Seam . 9 27 5.3 3 Pisces Seam *The seam thickness is an average of the coal thickness (excluding parting exceeding 0.5m) from all drillholes where the seam is recorded. No correction is made for dipping or fault thickened coal. **Total sulphur and specific energy have not been tested for all holes. Coal resources have been previously stated as 9Mt in situ of Indicated class for the Pollux Seam. No coal resources have been re-calculated since that reported by the company in 1986. Seam
COAL RESOURCES
REFERENCES
MATHESON, S. G., 1990: Definition of the Yarrabee Tuff Bed. In, Bowen Basin Symposium 1990, Geological society of Australia, Queensland Division, Brisbane, 233-235. RUTTER, H., 1886: Results of Sirotem Study at Yarrabee. Confidential company report. Greg Jones JB Mining Services Pty Ltd Bowen Basin 1995 - Symposium
472
Bowen Basin 1995 - Symposium