Au carrefour
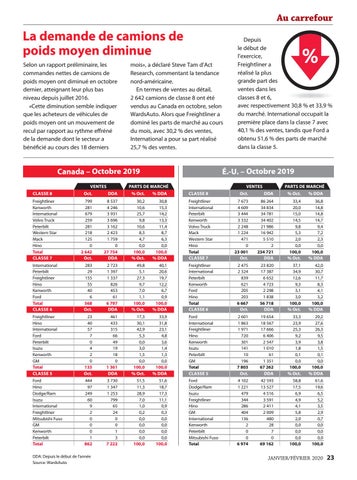
La demande de camions de poids moyen diminue Selon un rapport préliminaire, les commandes nettes de camions de poids moyen ont diminué en octobre dernier, atteignant leur plus bas niveau depuis juillet 2016. «Cette diminution semble indiquer que les acheteurs de véhicules de poids moyen ont un mouvement de recul par rapport au rythme effréné de la demande dont le secteur a bénéficié au cours des 18 derniers
mois», a déclaré Steve Tam d’Act Research, commentant la tendance nord-américaine. En termes de ventes au détail, 2 642 camions de classe 8 ont été vendus au Canada en octobre, selon WardsAuto. Alors que Freightliner a dominé les parts de marché au cours du mois, avec 30,2 % des ventes, International a pour sa part réalisé 25,7 % des ventes.
Canada – Octobre 2019 VENTES CLASSE 8
É.-U. – Octobre 2019
PARTS DE MARCHÉ
VENTES
Oct.
DDA
% Oct.
% DDA
CLASSE 8
Freightliner Kenworth International Volvo Truck Peterbilt Western Star Mack Hino Total CLASSE 7
799 281 679 259 281 218 125 0 2 642 Oct.
8 537 4 246 3 931 3 696 3 162 2 423 1 759 0 27 754 DDA
30,2 10,6 25,7 9,8 10,6 8,3 4,7 0,0 100,0 % Oct.
30,8 15,3 14,2 13,3 11,4 8,7 6,3 0,0 100,0 % DDA
International Peterbilt Freightliner Hino Kenworth Ford Total CLASSE 6
283 29 155 55 40 6 568 Oct.
2 723 1 397 1 337 826 453 61 6 797 DDA
49,8 5,1 27,3 9,7 7,0 1,1 100,0 % Oct.
Freightliner Hino International Ford Peterbilt Isuzu Kenworth GM Total CLASSE 5
23 40 57 7 0 4 2 0 133 Oct.
461 433 315 66 49 19 18 0 1 361 DDA
Ford Hino Dodge/Ram Isuzu International Freightliner Mitsubishi Fuso GM Kenworth Peterbilt Total
444 97 249 60 9 2 0 0 0 1 862
3 730 1 347 1 253 799 65 24 0 0 1 3 7 222
DDA: Depuis le début de l’année Source: WardsAuto
Depuis le début de l’exercice, Freightliner a réalisé la plus grande part des ventes dans les classes 8 et 6, avec respectivement 30,8 % et 33,9 % du marché. International occupait la première place dans la classe 7 avec 40,1 % des ventes, tandis que Ford a obtenu 51,6 % des parts de marché dans la classe 5.
PARTS DE MARCHÉ
Oct.
DDA
% Oct.
% DDA
Freightliner International Peterbilt Kenworth Volvo Truck Mack Western Star Hino Total CLASSE 7
7 673 4 609 3 444 3 332 2 248 1 224 471 0 23 001 Oct.
86 264 34 834 34 781 34 402 21 986 16 942 5 510 2 234 721 DDA
33,4 20,0 15,0 14,5 9,8 5,3 2,0 0,0 100,0 % Oct.
36,8 14,8 14,8 14,7 9,4 7,2 2,3 0,0 100,0 % DDA
40,1 20,6 19,7 12,2 6,7 0,9 100,0 % DDA
Freightliner International Peterbilt Kenworth Ford Hino Total CLASSE 6
2 475 2 324 839 621 205 203 6 667 Oct.
23 820 17 387 6 652 4 723 2 298 1 838 56 718 DDA
37,1 34,9 12,6 9,3 3,1 3,0 100,0 % Oct.
42,0 30,7 11,7 8,3 4,1 3,2 100,0 % DDA
17,3 30,1 42,9 5,3 0,0 3,0 1,5 0,0 100,0 % Oct.
33,9 31,8 23,1 4,8 3,6 1,4 1,3 0,0 100,0 % DDA
Ford International Freightliner Hino Kenworth Isuzu Peterbilt GM Total CLASSE 5
2 601 1 863 1 971 720 301 141 10 196 7 803 Oct.
19 654 18 567 17 666 6 406 2 547 1 010 61 1 351 67 262 DDA
33,3 23,9 25,3 9,2 3,9 1,8 0,1 0,0 100,0 % Oct.
29,2 27,6 26,3 9,5 3,8 1,5 0,1 0,0 100,0 % DDA
51,5 11,3 28,9 7,0 1,0 0,2 0,0 0,0 0,0 0,0 100,0
51,6 18,7 17,3 11,1 0,9 0,3 0,0 0,0 0,0 0,0 100,0
Ford Dodge/Ram Isuzu Freightliner Hino GM International Kenworth Peterbilt Mitsubishi Fuso Total
4 102 1 221 479 344 286 404 136 2 0 0 6 974
42 593 13 527 4 516 3 591 2 411 2 009 480 28 7 0 69 162
58,8 17,5 6,9 4,9 4,1 5,8 2,0 0,0 0,0 0,0 100,0
61,6 19,6 6,5 5,2 3,5 2,9 0,7 0,0 0,0 0,0 100,0
JANVIER/FÉVRIER 2020
23