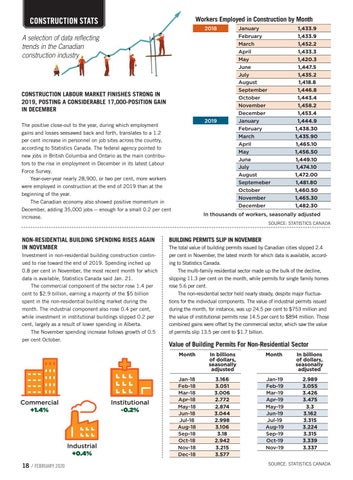
Workers Employed in Construction by Month
CONSTRUCTION STATS
2018
A selection of data reflecting trends in the Canadian construction industry
CONSTRUCTION LABOUR MARKET FINISHES STRONG IN 2019, POSTING A CONSIDERABLE 17,000-POSITION GAIN IN DECEMBER 2019
The positive close-out to the year, during which employment gains and losses seesawed back and forth, translates to a 1.2 per cent increase in personnel on job sites across the country, according to Statistics Canada. The federal agency pointed to new jobs in British Columbia and Ontario as the main contributors to the rise in employment in December in its latest Labour Force Survey. Year-over-year nearly 28,900, or two per cent, more workers were employed in construction at the end of 2019 than at the beginning of the year. The Canadian economy also showed positive momentum in December, adding 35,000 jobs -- enough for a small 0.2 per cent increase.
January February March April May June July August September October November December January February March April May June July August Septemeber October November December
1,433.9 1,433.9 1,452.2 1,433.3 1,420.3 1,447.5 1,435.2 1,418.8 1,446.8 1,443.4 1,458.2 1,453.4 1,444.9 1,438.30 1,435.90 1,465.10 1,456.50 1,449.10 1,474.10 1,472.00 1,481.80 1,460.50 1,465.30 1,482.30
In thousands of workers, seasonally adjusted SOURCE: STATISTICS CANADA
NON-RESIDENTIAL BUILDING SPENDING RISES AGAIN IN NOVEMBER Investment in non-residential building construction continued to rise toward the end of 2019. Spending inched up 0.8 per cent in November, the most recent month for which data is available, Statistics Canada said Jan. 21. The commercial component of the sector rose 1.4 per cent to $2.9 billion, earning a majority of the $5 billion spent in the non-residential building market during the month. The industrial component also rose 0.4 per cent, while investment in institutional buildings slipped 0.2 per cent, largely as a result of lower spending in Alberta. The November spending increase follows growth of 0.5 per cent October.
Commercial +1.4%
Institutional -0.2%
Industrial +0.4% 18 / FEBRUARY 2020
BUILDING PERMITS SLIP IN NOVEMBER The total value of building permits issued by Canadian cities slipped 2.4 per cent in November, the latest month for which data is available, according to Statistics Canada. The multi-family residential sector made up the bulk of the decline, slipping 11.3 per cent on the month, while permits for single family homes rose 5.6 per cent. The non-residential sector held nearly steady, despite major fluctuations for the individual components. The value of industrial permits issued during the month, for instance, was up 24.5 per cent to $753 million and the value of institutional permits rose 14.5 per cent to $894 million. Those combined gains were offset by the commercial sector, which saw the value of permits slip 13.5 per cent to $1.7 billion.
Value of Building Permits For Non-Residential Sector Month
In billions of dollars, seasonally adjusted
Month
In billions of dollars, seasonally adjusted
Jan-18 Feb-18 Mar-18 Apr-18 May-18 Jun-18 Jul-18 Aug-18 Sep-18 Oct-18 Nov-18 Dec-18
3.166 3.051 3.006 2.772 2.874 3.044 2.998 3.106 3.18 2.942 3.215 3.577
Jan-19 Feb-19 Mar-19 Apr-19 May-19 Jun-19 Jul-19 Aug-19 Sep-19 Oct-19 Nov-19
2.989 3.055 3.426 3.475 3.3 3.162 3.315 3.224 3.315 3.339 3.337
SOURCE: STATISTICS CANADA