Empowering the geospatial community www.gim-international.com
Issue 5 2025 Volume 39
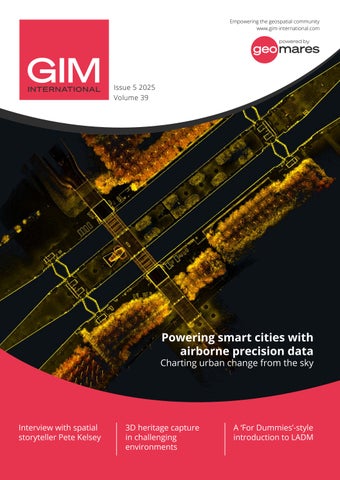
Powering smart cities with airborne precision data
Charting urban change from the sky
Interview with spatial storyteller Pete Kelsey
3D heritage capture in challenging environments
A ‘For Dummies’-style introduction to LADM