JANUARY 2026

JANUARY 2026
Austin kicked off 2026 with a notable start to the New Year
The City of Austin recorded 383 single-family home sales in January, a decrease of 13 3% from the previous year.
While volume dipped, the market showed signs of a price floor as the median sales price settled at $590,000, representing a 4.3% increase year-over-year. The average sales price followed suit, rising slightly to $778,033 (+0.8%).
Price per square foot averaged $336, mirroring the seasonal shifts seen in previous years. Active inventory continues to be a key story; as of early February, there are 1,999 active listings. Months of supply currently sits at 5.22, trending toward the 6-month threshold of a balanced market.
Buyers: Selection is high, and the " power shift" remains in your favor. With over five months of supply, you have the luxury of choice and room for negotiation; however, fresh, well-positioned homes are moving quickly.
Sellers: The early-year influx of new listings means fresh inventory to choose from. Homes that are realistically priced and well-presented are the ones winning multiple offers, while others are becoming "lessons in patience."
At 5.22 months, Austin's supply levels have recovered from the seasonal December dip. This metric confirms that the power shift we discussed throughout late 2025 is the new normal for early 2026.
$400k–$499k: This segment sits at 4.8 months of supply, indicating a market that is still fairly active but moving toward balance.
$500k–$599k: This range is seeing a significant inventory build-up at 8.0 months of supply, offering buyers substantial leverage and choice.
$600k–$699k: Supply remains lower in this bracket at 4.3 months, as buyers seek value just above the median price point.
$700k–$799k: Currently the tightest segment among these tiers at 3.8 months of supply.
$800k–$1.19M: These luxury-adjacent tiers average roughly 5.5 months of supply.
$1.2M–$1.39M: Inventory stretches slightly further here to 5.8 months.
$1.4M+: The high-end market is well-supplied at 7.8 months, requiring premium presentation and strategic patience from sellers
Negotiations Continue
Price adjustments remain a critical tool for success In January, 54% of all active listings featured at least one price reduction
The Gap: The average price reduction is holding steady at 9% off the original asking price Outcome: Homes that adjust their price are moving under contract after a median of 35 days following the drop
List-to-Close: For the total market, homes are closing at 90 81% of their original list price This ~9% gap is the data-backed justification for buyers to negotiate hard, particularly on listings that have surpassed the 30-day mark
Note: A 18% spike in expired listings is a clear signal that the market is rejecting initial pricing or poorly positioned homes that don't align with current buyer leverage To avoid becoming a statistic, sellers must launch as the "shiny penny " perfect condition and sharp price to stand out against the noise of leftover inventory
The "New Spring" market has officially arrived, but it’s landing in a landscape where buyers are significantly more selective than in years past.
New Listings: January saw 797 new listings enter the Austin market, down 15.4%.
New Under Contracts: Despite the year-over-year dip in new supply, buyer demand remains resilient. 617 homes went under contract last month, up 6.9%.
The Entry Level ($200k - $399k): 92 homes closed in this range The vast majority of activity here was concentrated in the $300k–$399k bracket, which recorded 70 sales
The Mid-Market ($400k - $699k): This remains the most active portion of the Austin market, accounting for 138 total sales The $400k–$499k segment was the single most productive price point of the month with 63 closings
The Move-Up Market ($700k - $999k): 77 homes sold in this tier, split between the $700k–$799k bracket (36 sales) and the $800k–$999k bracket (41 sales)
The Luxury Tier ($1M+): Austin's high-end market continues to find its footing, with 74 total sales recorded over the million-dollar mark The $1 4M+ segment led this group with 45 closings, outperforming the lower luxury brackets
The Early Spring Push & Inventory Realities
Looking at the trajectory from November through January, the Austin market has moved from a balanced stalemate into a high-inventory "Spring Thaw" that arrived ahead of schedule
November 2025 (The Balance): The market entered the holiday season with supply and demand in almost perfect lockstep, recording 579 new listings and 617 new under contracts This period was marked by a steady backlog of inventory that gave buyers early leverage December 2025 (The Seasonal Squeeze): As expected, the holiday freeze saw new supply plummet by over 34% to 383 new listings However, buyer demand remained surprisingly resilient with 497 homes going under contract, causing a temporary seasonal tightening of inventory
January 2026 (The Early Thaw): The market "woke up " with a vengeance in January New listings surged to 797, a 108% increase from December, as sellers rushed to position themselves for the new year Buyers met this supply with intent, as new under contracts climbed to 617, a 24% increase month-over-month
The Backlog Warning: While activity is high, the " power shift" is underscored by a rising graveyard of mispriced listings Expired listings hit 864 in January, an 18% increase year-overyear, following a heavy November where 816 listings failed to sell This confirms that while the market is moving, buyers are aggressively rejecting any inventory that isn't priced or positioned with precision from day one
Days on Market: The median DOM now sits at 57 days, a 90-day high that highlights the divide between the "shiny pennies" that sell fast and the stale inventory becoming "lessons in patience"
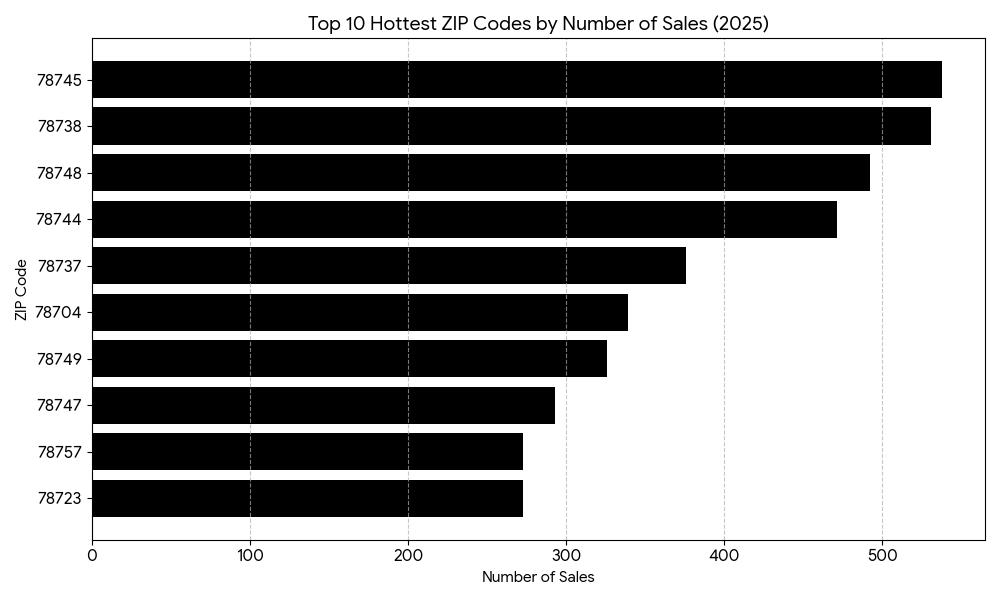
Austin’s Hottest ZIP Codes: Where the 2025 Market Peaked
While the broader Austin market spent 2025 finding its footing, certain pockets of the city remained high-velocity hubs for activity. These ten ZIP codes represent the true "heat map " of demand, where the most single-family transactions occurred throughout the year.
South Austin Dominance: ZIP codes 78745 and 78748 were major engines for the city's sales volume, recording 538 and 492 sales respectively. Their blend of classic Austin character and relative mid-market accessibility continues to make them a top priority for buyers.
Suburban Surge: 78738 (covering parts of Bee Cave and Lakeway) took the second-highest spot with 531 sales, signaling that the pull toward West Austin’s schools and amenities remains incredibly strong.
Entry-Level & Growth Hubs: ZIP code 78744 in Southeast Austin also saw significant traction with 471 sales, serving as a critical entry point for buyers looking to stay within the city limits.
These high-volume areas reflect where buyers found the best balance of value, location, and inventory in 2025. For sellers in these ZIP codes, the high transaction count is a promising sign of continued liquidity, even as the market shifts toward a more balanced environment.
January
February
March
April
May
June
Compass RE is a licensed real estate broker All material is intended for informational purposes only and is compiled from sources deemed reliable but is subject to errors omissions changes in price condition sale or withdrawal without notice No statement is made as to the accuracy of any description or measurements (including square footage) This is not intended to solicit property already listed No financial or legal advice provided Equal Housing Opportunity Photos may be virtually staged or digitally enhanced and may not reflect actual property conditions
July
August
September
October
November
The Average DOM shows the number of days a property was on the market before it sold. An upward trend in DOM indicates a move toward a Buyer’s market.
The Sold Price vs. Original List Price reveals the percentage of the Original List Price properties sold for.
Over six months of For Sale inventory indicates a Buyer’s market. Less than six months of inventory indicates a Seller’s market.