*To provide the most accurate snapshot of market conditions, we revise our historical data in cases where new information is uncovered after the fact.
* **Typically, state and local unemployment data lags federal data by one month. However, the 2025 federal government shutdown (October/November 12, 2025) resulted in a disruption of normally scheduled data releases. This reflects the most current data available as of the time of this report.
VACANCY CREEPS UP DESPITE DIMINISHING DEVELOPMENT PIPELINE
At the end of 2025, industrial vacancy across the Sacramento market stood at 7.4%. This reflects a slight uptick from the 7.2% rate that was in place just three months ago, and a more substantial increase from the 6.5% rate of a year ago. Vacancy inched upward in three of four quarters in the past year, driven by both an increase in availability (both direct and sublease), and the impact of new construction.
While new development has been on the decline over the past few years, the market still added more than 1.3 million square feet (MSF) of new product in 2025—much of which was speculative. This reflects a continued tapering of construction activity and the lowest amount of new product delivered since 2019 (when just 235,000 SF of new product came to market). However, the intervening period from 2020 through 2024, saw builders add nearly 18.1 million square feet (MSF) of space to market in the largest industrial development wave of at least the past 40 years.
This wave was set in motion by a national surge in demand for eCommerce fulfillment and modern distribution and logistics space that played out in Sacramento starting in the late 2010s that drove local vacancy levels as low as 3.6% by Q1 2022
and that helped drive local asking rents from an average of just $0.49 per square foot (PSF), on a monthly triple net basis at the end of 2017 to $0.78 PSF by Q4 2022. Rent growth of nearly 40% in the span of just five years helped to unleash an aggressive wave of development that increased Sacramento’s industrial inventory by 10.0% between 2020 (when the local market size was 160.6 MSF) and now (the current market size is 179.4 MSF).
Market timing, of course, is the greatest challenge and risk for all developers. Though industrial construction typically has the fastest speed to market (usually anywhere from two to 12 months for concrete tilt-up), planning and permitting can add anywhere from four to 24 months to the process. In the five intervening years since this most recent development wave exploded, the demand for eCommerce fulfillment spiked and has significantly dissipated both nationally and locally. Meanwhile, though there remains a steady pipeline of distribution and logistics deals in the marketplace, demand has decreased both in terms of the number of active tenants and in the size of their requirements.
That said, in Q4 the Sacramento industrial market recorded 312,000 SF of positive net absorption, its strongest showing of the past year. But this was not enough to bring the market into positive territory for the year; all told, Sacramento recorded -252,000 SF of negative net absorption in 2025. This compares to
Sacramento Industrial Market
All Classes of Product Q4 2025
Sacramento Industrial Market: Vacancy/Average Asking Rents
546,000 SF of occupancy gains in 2024, 1.2 MSF in 2023, 2.9 MSF in 2022, and an astounding 7.8 MSF in 2021 (the highest level of net absorption locally we have ever recorded).
New demand has been cooling while we are also seeing an increase in space givebacks. While local vacancy now stands at 7.4%, total availability in the market (which includes vacant and non-vacant space being marketed) now stands at 9.9%. The last time it crossed the 9.0% threshold was in 2017. Sublease availability doubled over the course of 2025; we are now tracking 3.8 MSF of sublease availability across the region. One year ago, sublease availability stood at just 1.9 MSF of product. Keep in mind that following the 2008 Great Financial Crisis (GFC), industrial sublease availability also spiked. But it peaked in Q1 2010 at 2.5 MSF. But while the economy clearly continues to face headwinds, mostly from economic uncertainty over tariff policy, the current uptick is a bit of an anomaly. Ten properties account for more than half of the currently available sublease space. While a couple of these are associated with user bankruptcies, most are coming from users looking to consolidate after taking too much space (in at least a couple of these cases, users have pulled back for issues related to tariff costs).
The good news heading into 2026 is that the construction pipeline is nearly empty. We are currently tracking just 231,000 SF of product under construction. This includes Buzz Oates’ 181,000 SF speculative development in Elk Grove, but the remainder of this total are build-to-suits that already have tenants lined up.
While we anticipate a few currently proposed industrial projects to go forward in the year ahead, we anticipate 2026 to be a year in which development will be
dominated by build-to-suits or by smaller, divisible speculative projects. This is critical given that new deal activity has increasingly focused on smaller service users. Perhaps more accurately we should report that deal size is reverting to historic norms before the recent spike of large eCommerce fulfillment and bulk warehouse mega-users helped to drive local average deal sizes upward in the early 2020s.
Source: Gallelli Real Estate; Costar Group
RENT GROWTH INCREASINGLY
CHALLENGED BY HITTING THE WALL
The current average asking rent for industrial space in the Sacramento region is $0.83 PSF, up slightly (2.5%) over the $0.81 rate of a year ago. Since the explosive rental rate growth of a few years ago, rents have stabilized at roughly the current rate over the past three years.
This metric has essentially hit a wall. Slowing levels of demand certainly play into this, but there is another major factor at play here. Most industrial (and retail) deals are transacted regionally on a triple net basis, meaning that in addition to rent tenants are responsible for the cost of property taxes, insurance, and maintenance. While the average asking rent for industrial space has doubled since 2015, net expenses have effectively done so over roughly the past five years.
Ultimately, this puts a limit on how much rental rate growth a property can command. It remains to be seen whether the overall economy will cooperate heading into 2026, but an emptying development pipeline should bode well for maintaining market equilibrium heading into next year. In the meantime, we are hearing anecdotally of more concessions on longer term deals with free rent being the primary offering.
This challenge is likely to get worse before it gets better. While both property taxes and insurance have been on the upswing, the major culprit has been utilities. Or, more specifically, power. Rising demand for power driven by AI data centers are impacting electrical rates nationally. According to the Federal Reserve Bank, the average price of electricity per kilowatt hour in the U.S. climbed from $0.17 to $0.19 through the first six months of 2025 alone. The U.S. Energy Information Administration forecasts utility prices to increase between 12% and 18% over the next year.
A good rule of thumb is that the amount of electricity needed to power 100,000 homes is one megawatt (MW). The amount needed for one million homes is one gigawatt (GW). While existing data centers typically need about 1.0 MW of power, the new wave of AI data centers need far more. The largest data centers currently being built need up to 5.0 GW. The challenge is significant enough that Microsoft is spending $16 billion to reopen the Three Mile Island nuclear power plant in Pennsylvania, though at full capacity it will produce about 835 MW.
The latest data from technology intelligence firm ABI Research indicate that there were 1,427 data centers in North America as of the end of 2025, but this number is expected to grow to 1,803 data centers by the end of 2030. The Pew Research Center reports that in 2024 (the latest data available), data centers across the USA consumed 183 terawatt hours of electricity. This equates to more than 4% of the nation’s total electrical demand, or the equivalent of Pakistan’s annual electricity usage. They also forecast electrical consumption for US data centers to grow by 133% over the next five years.
While power plant production has been ramped up significantly under the Trump administration it is unlikely that US infrastructure will be able to keep up with AI-fueled demand in the near-term assuming current projections. Without some sort of policy intervention, this is a challenge that will increasingly impact businesses and consumer alike.
LOOKING AHEAD
With development levels falling off, we expect 2026 to be a year in which industrial vacancy stabilizes in the Sacramento market. While we expect demand to remain somewhat muted, we anticipate a return to occupancy growth barring any significant worsening of economic conditions.
The good news is that initial economic uncertainty regarding tariff impacts appears to be fading, though heightened geopolitical tensions threaten to ratchet up another round of trade discord. Consumer spending held up better in 2025 than most early economist predictions, though there are some concerning warning signs. According to the Federal judiciary, personal and business bankruptcies were up 10.6% annually through November 2025 (the latest data available) and consumer debt levels exceeded a record $18.5 trillion in Q3 2025 according to the Federal Reserve. The good news is some of this was driven by mortgage originations (i.e. “good debt”) with residential real estate picking up slightly. The bad news is this also reflects an increase in credit card balances (i.e. “bad debt”) of more than $24 billion in Q3 2025 with American consumers now holding a record $1.23 trillion in credit card debt. Worse yet, the average interest rate on that debt is now at 24% (up from 16% four years ago). The Trump administration has floated the idea of an interest rate cap of 10.0% on credit cards, though that idea is sure to face immense resistance from the banking community and likely major challenges in the courts if implemented.
The good news is that unemployment remains near 50-year lows. The bad news is it has been slowly ticking upward with employment growth having virtually flatlined over the final half of 2025. While US stock indices are all at or near historic highs, nearly all the gains of 2025 have been driven by more than $1.2 trillion in AI investment over the past year. To put this in perspective, that is roughly the annual GDP of Saudi Arabia. This has sparked growing concerns of a potential AI investment bubble akin to what we saw with internet businesses in the tech wreck of 2000. That said, dot.com stocks at that time were trading more than 50X annual earnings, while AI stocks today are trading at roughly 35X to 40X earnings. Those values are decidedly frothy, but not necessarily in the danger zone now. Lastly, heightened geopolitical tensions and internal political division have emerged at the top of most economist concerns heading into 2026.
In other words, the only thing certain with any economic forecast for the year ahead is uncertainty. That said, with a current industrial vacancy rate of 7.4%, the market is not far from a place of equilibrium between supply and demand. Most analysts point to 5.0% to 6.0% as being a place of equilibrium—where there is enough available space to accommodate economic growth, but not so much as to impede sustainable rent growth. Sacramento’s industrial marketplace is well poised to hold its own should the market remain soft for most of the year, or for speedy recovery should we enter the next up cycle by the end of the year.
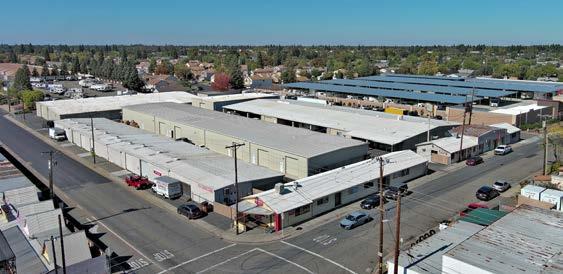
5920 Rosebud Lane, Sacramento, CA
about gallelli real estate
Gallelli Real Estate is a private firm that specializes in commercial real estate services and property management. We believe that as a boutique firm whose understanding of the business runs as deep as our core values, our advantage is large. We take pride in our unique approach to offer more individual solutions that address the ever changing needs of our clients and the industry. After all, our success is measured by the success of our clients and the strength and longevity of our relationships.