Q2 26 market overview
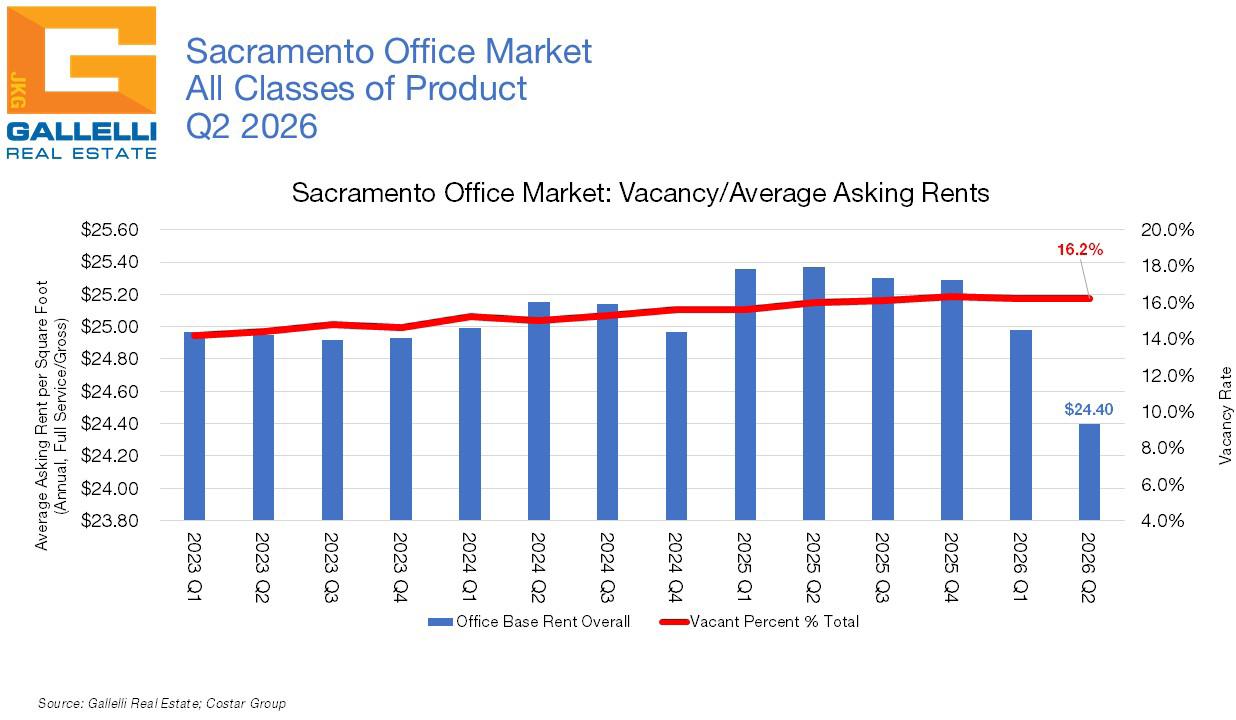
$24.40 PSF
Average Asking Rate (Full Service Annual)
*Typically, state and local unemployment data lags federal data by one month. However, the 2025 federal government shutdown (October/November 12, 2025) resulted in a disruption of normally scheduled data releases. This reflects the most current data available as of the time of this report. (June 2026) (May 2026)
POSITIVE NUMBERS TO START 2026 DESPITE GROWING
ECONOMIC UNCERTAINTY
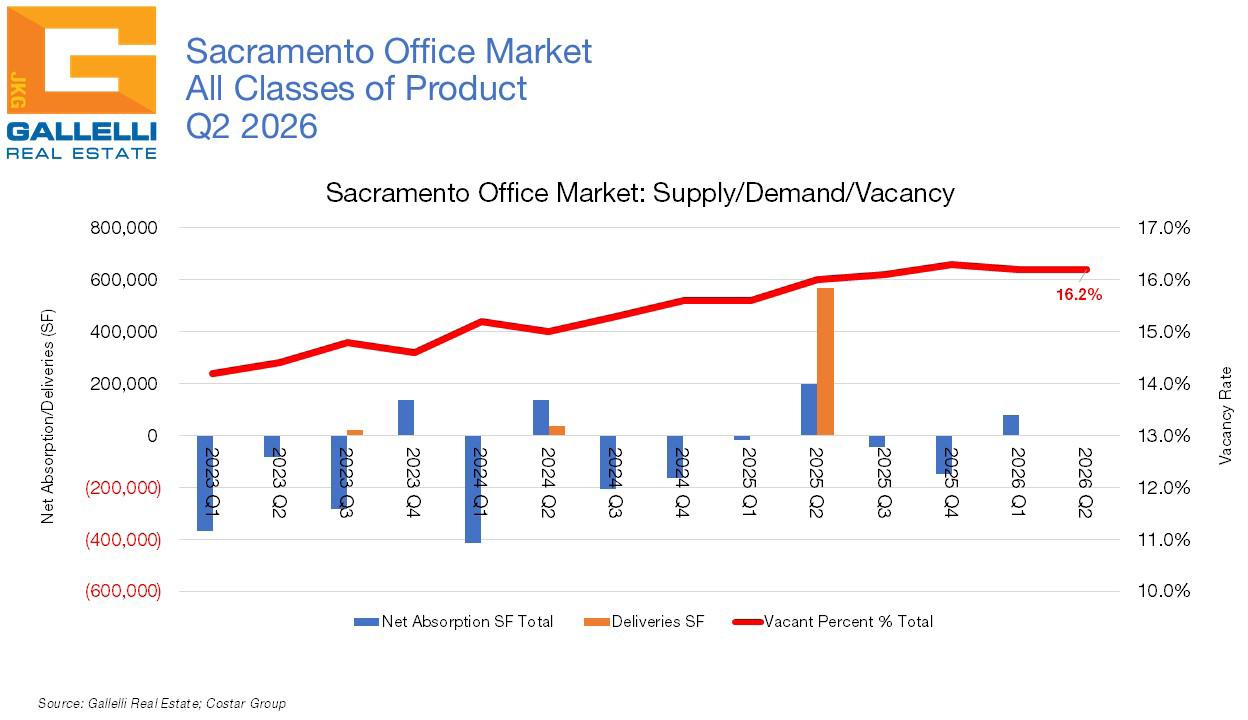
As of Q2 2026, office vacancy in the Sacramento region stood at 16.2%. Leasing activity in Q2 remained subdued, with the market recording only 544,000 square feet (SF) of total deal activity (gross absorption). This reflects a significant slowdown from the 885,000 SF of total deal activity we tracked in Q1. Those deals at the start of 2026 were enough to translate into modest positive net absorption (+81,000 SF) and a modest decline in overall vacancy (from 16.3% to 16.2%). This did not occur in Q2 with most leasing focused on renewals, relocations or downsizing translating into flat occupancy growth. In Q2 2026, the market recorded a negligible -1,000 SF of negative net absorption as vacancy remained steady at 16.2%.
But while these numbers may paint a humdrum picture, the news is not all bad. The good news is that our brokers report that tenant touring activity was on the upswing as the quarter ended—a trend that we have confirmed across the brokerage community. This late quarter uptick in activity includes multiple deals expected to close in early Q3 2026 that will likely swing occupancy growth back to positive territory.
Meanwhile, sublease availability in the region continues to decrease. We are now tracking roughly 734,000 SF of total sublease space on the market in the region, down from a peak of 1.6 million square feet (MSF) of space on the market in Q1 2023. Only 235,000 SF of this space is currently vacant, the lowest amount of vacant sublease availability the market has seen since Q2 2020. Though a 20% gulf in asking rents remains between direct and sublease availability locally, most of the recent decline in sublease space has not come from bargain hunting tenants. Most of this reduction continues to come from tenants withdrawing their sublease listings as their existing leases expire, with the space reverting to direct availability from their landlords.
And lastly, in what is expected to be a boost to local submarkets where the State of California has its greatest presence, after six years of remote and hybrid schedules, most State of California workers returned to office a minimum of four times per week starting July 1st. This is likely to be a significant boost to Downtown in particular, where government workers have historically accounted for between 40,000 and 50,000 employees in this submarket alone. Despite making strides in recent years, retail, restaurant and other service-business amenities in the Downtown core have yet to fully recover from the 2020 pandemic and its aftermath. Additionally, most analysts anticipate that the return of these workers may very well result in an uptick in State real estate requirements in the months ahead.
Since May 2024, as part of its 2019 specific plan, the State of California has been moving agencies from leased space across the region into the new 1.25 MSF May Lee Office Complex in Downtown’s new River District. The net effect of this initiative has been a decline in public sector leasing over the past 15 months with many of the leased spaces formerly occupied by State agencies still vacant. However, a 2025 California State Auditor report confirms that multiple departments lack the square footage and physical workstations required to house employees four days a week, including the California Department of Public Health and the Employment Development Department. In some cases, employees have been given exemptions to the returnto-office order while departments attempt to tackle the logistical challenges. We anticipate that, in many cases, this will result in new lease requirements for some impacted State of California departments.
Q2 2026 MARKET REVIEW
While overall occupancy growth in Q2 was flat overall, there were some winners and losers.
The Highway 50 submarket surpassed all other trade areas in the region in terms of occupancy growth over the past three months, recording 51,000 SF of positive net absorption. Vacancy here now stands at 24.2%, down from last quarter’s 24.6% reading (the highest level we have tracked since we began keeping statistics in 1998). For years, Highway 50 was among the top local goto markets for large block corporate users with tenancy dominated by insurance companies, healthcare, financial services and public sector users with a strong presence of administrative back office and call center locations. These uses were the most impacted by the move towards remote and hybrid work, with Highway 50 among the region’s hardest hit trade areas in recent years. While it is too soon to say that the market has turned a corner, there are several encouraging signs that market stabilization is on its way in the form of office conversions.
Late last year, the Folsom Cordova Unified School District purchased the former 102,000 SF Dignity Health billing office at 3215 Prospect Park Drive to convert to a new 500-student high school. In 2024, Rancho Cordova ranked among the top five fastest growing cities in California among those with populations over 30,000. That momentum is expected to continue with at least 27 new home communities in various stages of development across the city. Against this backdrop, the City of Rancho Cordova is now reportedly negotiating with the owners of as many as a dozen empty or underused office buildings in the city for conversion to multiple other uses ranging from libraries and community centers to facilities centered around the planned 7,500 seat indoor pro soccer arena and sports-anchored Entertainment district, Downtown Dova slated to open in late 2027 at Kilgore Road and Trade Center Drive.
Of the region’s 12 distinct trade areas, five recorded positive net absorption in Q2. Following Highway 50 were El Dorado Hills (+33,000 SF), Midtown/East Sacramento (+17,000), Elk Grove/South Sacramento (+11,000 SF) and Yolo County (+2,000 SF).
At the other end of the scale, both the Arden/Howe Watt and the Roseville/ Rocklin submarkets recorded -28,000 SF of negative net absorption each. In both cases, move-outs outpaced move-ins with modest impacts on overall vacancy. Vacancy in the Arden/Howe/Watt submarket inched upward from 16.1% to 16.5% in Q2 while the Roseville/Rocklin trade area saw this metric climb from 11.7% to 12.0%.
NEW SPECULATIVE CONSTRUCTION REMAINS A RARITY
No new projects were delivered to market in Q2 2026. In fact, the last new office product to come online was the first two buildings of the Aggie Square biotechnology, life science and tech incubator project in the East Sacramento submarket one year ago. Completed buildings here account for 570,000 SF of space, of which much was pre-leased prior to delivery. However, nearly 200,000 SF of space remains available at this project which has prompted the delay of a planned third building at the development for now.
Unless there is a medical component, speculative development of office product is simply off the table locally for now. The strongest driver of local tenant demand continues to be smaller professional and medical users, especially in the region’s stronger suburban submarkets.
As this report went to press, there were only two projects currently under construction in the region; both of which are primarily build-to-suits. Buzz Oates’ 38,000 SF Riverpoint North Corporate Center Building B in West Sacramento will be occupied by California American Water upon its scheduled completion in September 2027. Meanwhile, Dignity Health’s new 92,000 SF campus at 3185 McCarthy Way in Folsom is scheduled for delivery in February 2027. Dignity Health is offering 15,000 SF of availability at this project currently, though this space is expected to be accounted for before the completion of construction.
OVERALL ASKING RENTS DIP SLIGHTLY
DESPITE IMPROVED NET ABSORPTION & DEAL ACTIVITY
Despite the significant leasing headwinds of the last five-plus years, office rents in the Sacramento region have generally held their own. But if rents have generally held their own, concession packages have been climbing in recent years with one of month free on an annual term not uncommon. Meanwhile, tenant improvement allowances have also increased with our brokers reporting anecdotally some projects offering $60.00 or more PSF for some first generation spaces. But it appears that rents, at least for Class A space, may have finally hit the wall.
As recently as Q4 2025 the market recorded overall rent growth of 1.28%. That appears to have changed entering 2026. Asking rents as of Q1 2026 were down -1.50% from where they stood a year earlier and that decline increased in Q2. More troublesome for landlords is that these numbers are not adjusted for inflation, which is currently running hot at 4.2% (as of May 2026) and likely to stay elevated as long as oil supplies are disrupted by the Iran war.
The current average asking rate for office space is $2.03 per square foot (PSF) on a monthly full service basis (or $24.40 PSF annually). That metric is down -3.8% from where it stood a year ago, driven entirely by a decrease in the asking rate for Class A space.
The average rent for Class A office space now stands at $2.42 PSF monthly ($29.00 annually), down -5.8% from the recorded rates of $2.56 PSF monthly ($30.77 PSF annually) one year ago. Meanwhile, both Class B and C rents remained flat overall, with both recording statistically negligible gains. The current average asking rate for Class B space across the Sacramento region is $1.96 PSF monthly ($23.57 PSF annually), while it is $1.62 PSF monthly ($19.47 PSF annually) for Class C properties.
IS THE AI JOB APOCALYPSE NARRATIVE OVERBLOWN?
We continue to work through an overhang of space that came back to market in the aftermath of the pandemic and shifting office work trends. Data indicates that the reversion towards more traditional in-office work patterns continues to occur, though clearly hybrid work is a substantial and permanent part of the landscape now. But while most major markets began showing signs of recovery by 2024,
the Sacramento market has struggled to build consistent momentum. First the local challenges came from the region’s largest office tenant, State of California, giving back large blocks of space as it consolidated into its new Downtown campus. In recent months, the challenge (a national one) has increasingly come from weak job creation and uncertainty over AI and its likely impact on officeusing employment.
Here is where we have good news and bad news. A year ago, the messaging from tech CEOs was largely that AI was going to create seismic shifts in the workforce, with Anthropic CEO Dario Amodei stating that AI would eliminate half of entry level white collar jobs. That tone has radically shifted over the past 12 months, especially as public opinion of AI has increasingly shifted into negative territory and backlash. In June 2026, Amodei stated that while the possibility of “enduring job loss” remains, that his warnings were to give policymakers and the private sector the best chance of adapting. Also in June, OpenAI CEO Sam Altman told Bloomberg, “We’ve underestimated how much we’re going to be able to keep people at the center of everything.”
These shifts in tone are substantial—the narrative has shifted from a potential worker replacement scenario to one in which workers keep their jobs and get a productivity boost.
But is the tonal shift merely a cynical move to win back a public frightened by the original worker replacement scenario promised to the investor class that sank trillions into AI investment? Or are we just starting to get a better understanding of the role of AI in the workplace beyond hype, promises and theorizing and starting to understand its actual capabilities and limitations?
The jury is still out. But there is growing evidence that the AI as job destroyer narrative may be somewhat overblown. EY-Parthenon, Ernst & Young’s global strategy consulting arm, recently released a report that found the percentage of global CEOs that believed AI investments would result in significant headcount reductions fell from 46% in January of 2025 to just 20% in May of this year. This shift appears to be driven by corporate users finding that while AI tools may help boost worker productivity and eliminate many redundant tasks, but that automation without human expertise can only go so far. As Neil Thompson, Director of MIT’s Computer Science and Artificial Intelligence Lab told a recent Goldman Sachs panel, “For AI to meaningfully affect jobs, it must be able to perform a task when given the right information, have access to that information, and be cost effective. That’s often a tall order… Even with perfect information, AI doesn’t have a 100% task success rate. And we’ve found that, in many cases, an AI system is too expensive to run at the level of precision required.”
This is not to say there has not already been and will continue to be labor market disruption. Consultancy firm Forrester forecasts that AI will cost 6.1% (10.4 million) of U.S. jobs by 2030. But they also suggest that AI will have a stronger role in influencing rather than replacing roughly 20% (34.1 million) of US jobs during this period. Meanwhile, Goldman Sachs economists predict that AI will disrupt roughly 9% of the workforce (15 million), but that these losses will be distributed across at least a 10-year adoption period with most workers finding new employment within a year. They also anticipate that new occupations enabled by AI will increasingly become where these employees land. One recent study seems to support this thesis.
In June, financial technology firm Ramp and workforce intelligence company Revelio Labs released a white paper that looked at AI spending and bill pay data for 21,559 firms across the United States. The paper linked AI spending (based on corporate card transaction data) to workforce headcount registries
and found that companies with high-intensity spending (averaging at least $34 per employee monthly) grew employee headcounts by 10.2% on average within two years of adoption. They also found low-intensity users saw no significant workplace change.
But if fears of AI driving widespread employment destruction may be moderating, concerns remain as to whether there may be an AI bubble on Wall Street. US stock indices remain at or near historic highs, driven overwhelmingly by AI investment as opposed to more broad-based economic growth with many seeing parallels to the dot-com run-up of the late 1990s and the ensuing “tech wreck” of 2000.
The Shiller PE Ratio, or CAPE ratio (Cyclically Adjusted Price-to-Earnings) is a valuation measure that divides a company’s or market index’s current price by the average of its previous ten years of earnings, adjusted for inflation. Created by Nobel Prize winning economist Robert Shiller, it has emerged over the last 30 years as the premier measure for evaluating possible market bubbles. The highest level ever recorded by this index was 44.19 in December 1999. The next month is when the 2000 tech crash occurred. As of July 2026, this index stood at 42.18, the highest level ever recorded outside of the dot-com bubble run-up. There are some significant differences; primarily in that most of today’s larger AI players have legitimate revenue and earnings (unlike many of the late-90s dot-coms). Meanwhile, AI technology seems to be yielding real productivity gains. However, there is growing evidence that many enterprises are struggling to generate returns on AI investments and that a significant share of AI firm “profitability” is coming from circular investments within the industry and bloated valuations.
But bubbles are nearly impossible to call out in advance. Alan Greenspan called out the dot-com bubble when he warned of “Irrational exuberance.” The only problem is his warning came in 1996, and the Nasdaq would go on to triple over the next three and a half years before peaking. Likewise, bubbles can deflate on their own via market corrections (or a series of them), without taking down the entire stock market and greater economy. Just keep in mind that when it comes to AI, the risk of an investment bubble bursting (and not wholesale employment destruction from AI adaptation) is increasingly landing on economists’ near-term risk lists.

LOOKING AHEAD
Heading into the final half of 2026, the economic outlook remains cloudy. As of July 2026, hostilities had resumed in the Middle East with energy prices back on an upward trajectory. Inflation, which fell during the June ceasefire to 3.5%, will be heading in the wrong direction for now. The Federal Reserve will be under increasing pressure to raise interest rates to respond, with bond yields already climbing upward as this report went to press. It remains to be seen how long the current conflict disrupts energy supply chains, but most energy industry analysts
agree that even with an immediate settlement, gas prices are not likely to get back to pre-war levels before 2027.
To date, consumers have weathered these challenges largely because 2026 was a bumper tax refund season that helped to counterbalance some of the real income shock caused by the Iran war. But US consumers have also been drawing down savings and racking up more debt to offset higher costs. That said, monthly retail sales numbers have been dropping, consumer confidence metrics have been near all-time lows, personal bankruptcies are up 11.9% through March 2026 (the latest data available from the Administrative Office of the U.S. Courts) and household debt as of end of Q1 stood at an all-time high of $18.8 trillion.
If there is good news here, it is that credit card balances during this same period fell by $25 billion to $1.25 trillion as more consumers looked towards home equity loans to pay off high interest rate credit cards. The American economy has remained resilient despite the American consumer being in what appears to be a fragile place. Should energy prices resume an upward spiral, low- and middle-income consumers might not get a chance to rebuild their savings buffers over the final half of the year which could lead to a further erosion of consumer spending.
The good news is that as cloudy as the economic outlook may currently be, most forecasters see a declining risk of recession ahead. The Survey of Professional Forecasters is the oldest quarterly survey of macroeconomic forecasts in the United States. The results from the Q2 2026 forecast are that the consensus view of economists was that real GDP would expand by 2.2% overall in 2026 (down 0.3% from last quarter’s survey). Forecasters anticipate a slight uptick in unemployment from 4.4% to 4.5% by year-end with sluggish, though positive, job growth averaging 35,000 per month through the remainder of the year (they predict this to increase to 65,000 monthly jobs in 2027). The consensus view of economists was that the US will record an annual inflation rate of 3.2% by the close of this year, up from their previous estimate of 2.8%. However, only 23% of respondents believed recession was likely in the next four quarters.
Improved hiring is one of the reasons for optimism; according to the Bureau of Labor Statistics (BLS), there were 6.6 million jobs available in the US as of the end of 2025. That number increased to 7.6 million as of May 2026 (BLS’ monthly Job Openings and Labor Turnover Report lags unemployment data by one month). It’s a significant jump that, if sustained, should see employment growth improving over the second half of 2026.
Record corporate profits are likely one factor behind the recent spike in job openings. According to the Bureau of Economic Analysis, corporate profits reached a record $4.43 trillion in Q1 2026, up from $4.35 trillion in Q4 2025, accounting for 12.4% of US GDP, the highest level since Q2 2021 and second highest since 1947. The other theory is that companies that had been holding off on hiring as they rolled out their own AI tools are now getting a better understanding of the current limits of these technologies.
The good news is that we anticipate modest improvement in office leasing activity across the Sacramento region over the final half of 2026, with smaller professional and medical users continuing to be the most active sector of the market. New construction will remain almost entirely focused on build-to-suits, which will not be factor in driving higher vacancy levels, but higher occupancy rates instead. The little speculative development taking place locally is entirely focused on medical office, which current demand levels can support. However, this will be playing out against the continued backdrop of heightened economic uncertainty and challenging consumer economics.
OFFICE MARKET STATISTICS: Criteria based on: 10,000 SF and above, does not include owner occupied, Existing, Under Construction, Proposed, Final Planning
Folsom

GALLELLI BROKER TEAMS







bsessions@gallellire.com



kkuhn@gallellire.com





ebenoit@gallellire.com