
market
$1,839/UNIT
774 UNITS 2,031 UNITS 4.2% 6.4%
2,031 UNITS
Direct Vacancy Rate Quarterly Net Absorption Annual Net Absorption (Last Four Quarters) Sacramento
Average Asking Rate
VACANCY FALLS AS CONSTRUCTION PIPELINE HITS TEN
YEAR LOW
(June 2026) 4.2%
2026)
*Typically, state, and local unemployment data lags federal data by one month. However, the 2025 federal government shutdown (October/November 12, 2025) resulted in a disruption of normally scheduled data releases. This reflects the most current data available as of the time of this report.
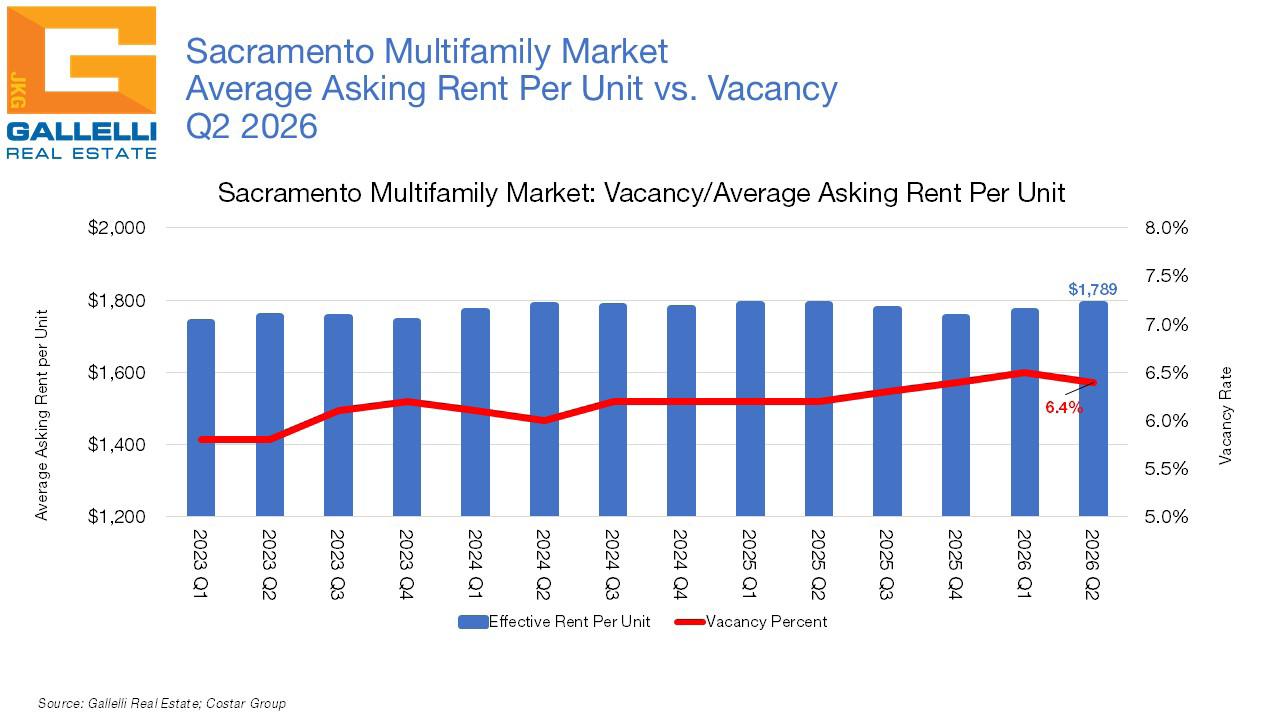
Multifamily vacancy in the Sacramento region stood at 6.4% as of the close of Q2 2026, down from the revised 6.5% reading of three months ago, though still elevated from the 6.2% rate posted a year ago. Vacancy had been on a steady upward trajectory since hitting a local record low of just 3.0% in Q2 2021. Against this backdrop, the Sacramento multifamily market recorded aggressive rental rate growth, posting 10.5% growth by Q3 2021 (the highest level we have on record since we began surveying the market in 2000). Since midyear 2021, builders have added nearly 17,000 new units, increasing the local apartment inventory by nearly 11.6%. Not surprisingly, over the past 20 quarters (five years), vacancy in the region has only decreased three times (including this quarter) as the market worked through absorbing new product. But the development pipeline has been shrinking considerably over the past two years. There were 41 projects accounting for 6,227 new apartment units under construction in Q2 2024. Today the number of multifamily units under construction has fallen to just 32.6% of that total with 17 projects totaling 2,031 units in development. And, for the first time in two years, vacancy fell this quarter.
The market recorded positive net absorption to the tune of 774 units. All twelve of the Sacramento
region’s individual submarkets recorded positive occupancy growth this quarter, a phenomenon that has not occurred since 2019, though only a few recorded gains more than 50 units. Still, vacancy remained steady or declined in all but two trade areas in Q1. The two exceptions included West Sacramento, where 21 units of positive net absorption were outpaced by the delivery of 60 new units, sending vacancy upward from 6.9% to 7.6%. The Natomas/North Sacramento submarket experienced the same trend with 191 units of positive net absorption outpaced by the delivery of 263 new units. Vacancy in this trade area inched up from 7.8% to 8.3% even though this market led all others in the region in terms of occupancy growth this quarter.
Following the Natomas/North Sacramento, the local trade area to post the greatest gains in Q2 was South Sacramento. South Sacramento recorded 171 units of positive net absorption. New construction slightly outpaced this with 180 units of new product, but this was not enough to move the vacancy needle, which remained at 6.0%.
The Downtown market, which has been the epicenter of new development in recent years (accounting for nearly one third of the last decade’s new construction) had only one new project come online in Q2 (delivering 41 units) while tenants took down 111 units. Vacancy here fell from 11.5% to 11.0% over the past three months.
The Folsom market saw multifamily vacancy fall from 6.9% to 6.5% this quarter as tenants took down 79 formerly vacant units. The Roseville/Rocklin submarket recorded 59 units of positive net absorption as vacancy fell from 6.1% to 5.7%. In Rancho Cordova vacancy fell from 6.1% to 5.7% as the market absorbed 42 formerly vacant units. None of these trade areas had any new product delivered this quarter.
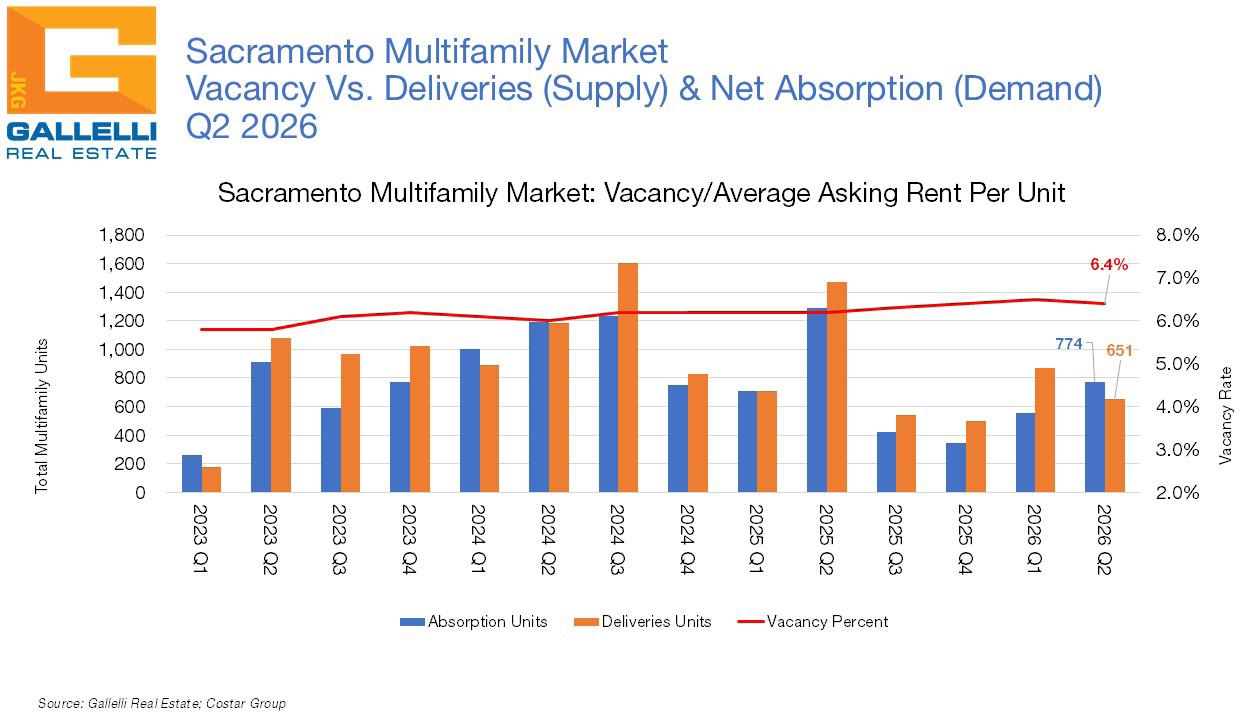
DEVELOPMENT PIPELINE HITS TEN YEAR LOW
At its peak (in Q2 2023), there were 46 projects with 7,649 new apartment units under development in the construction pipeline. That number has since come back to earth. As of the close of Q2 2026, there were just 17 projects under construction accounting for 2,031 units underway locally—a 10-year low. By the time of this report’s release, that number will increase to 19 projects totaling 2,801 units under development (there were two new complexes about to start construction as this report went to press). While there are a few additional projects likely to move forward over the next three months, the development pipeline is likely to shrink further by Q3 2026 with nine projects accounting for 1,019 units slated for delivery in the weeks ahead.
RENT GROWTH STILL FACING HEADWINDS
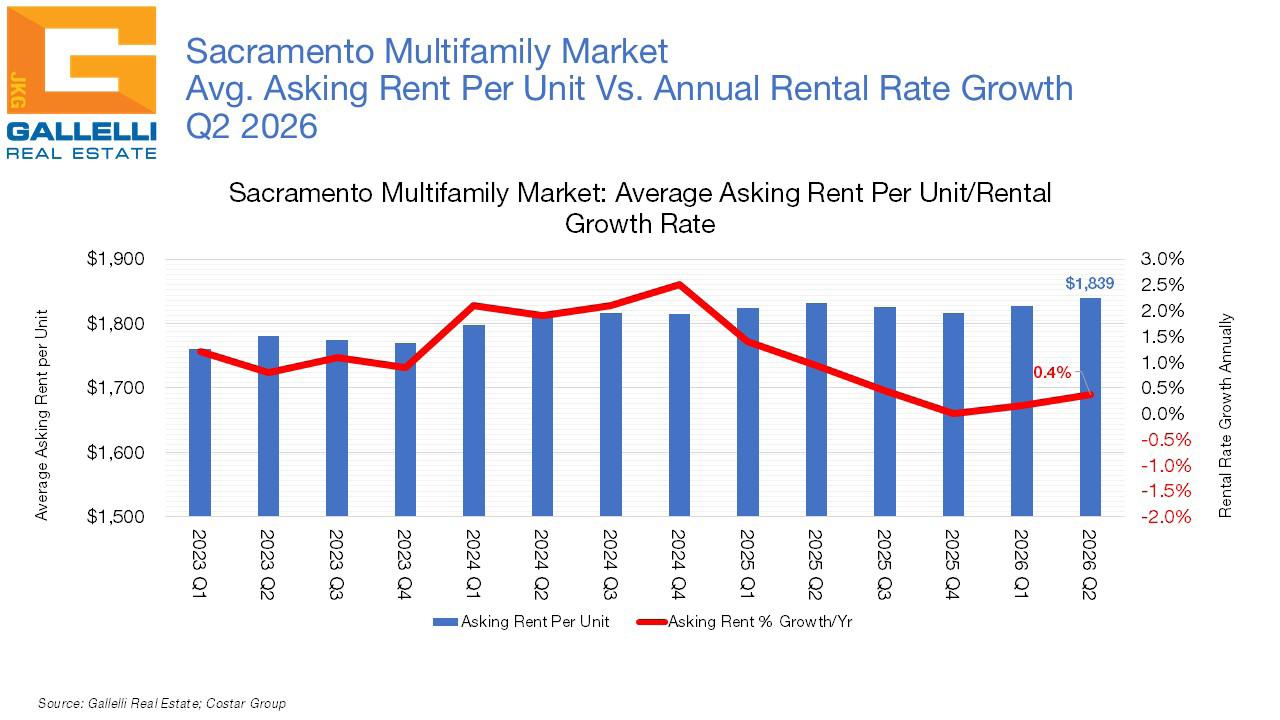
The current average asking rent for multifamily product in the Sacramento region is $1,839 per unit. This metric has climbed just 0.4% over the past year. Keep in mind that the most recent inflation data readings indicate that the consumer price index (CPI) increased year-over-year by 3.5% in June 2026.
Rental rate growth in the region over the past two years has slowed to a crawl and largely not kept pace with inflation. Some of the pressure on rent has been the issue of a more competitive rental environment with vacancy above the 6.0% level, but that is not the primary issue at play here. While vacancy in the Sacramento region had been on a clear upward trajectory for
Q2
26 multifamily market report
number of years, it was coming off of record lows and never crossed the 7.0% mark (though at the submarket level—particularly in the region’s most active new development markets (Downtown, Natomas/North Sacramento, West Sacramento) this has not been the case.
Most real estate economists believe that the ideal vacancy rate for a healthy apartment market is between 5.0 and 7.0%. In tight markets with sub-5.0% vacancy, where demand significantly outpaces supply, you get outsized rental rate growth. Fantastic news for landlords in the short-term but eventually rents hit the affordability wall for tenants. This is precisely what happened in the Sacramento market a few years ago when from Q1 2014 (4.8% vacancy) through Q2 2022 (4.4% vacancy) occupancy in the region never fell below 95.0%. The average rent of Q1 2014 was $1,080 per month. By Q2 2022 it was $1,751 per month. That is a 61.7% growth rate over the course of eight years, reflecting 7.8% annual growth during a time in which overall inflation averaged 2.4%. Rents were bound to hit a brick wall. They did, but this has been exacerbated by inflation.
In 2022 as the nation began to experience the outsized wave of post-pandemic inflation, rental rate growth in the region fell from an annual rate of 8.5% in Q1 2022 to just 1.3% a year later. As that wave was being brought back under control by 2024, we saw rent growth tick back up to 2.6% by Q4 2024. But as inflation started to increase in 2025 under pressure from tariff policies, rent growth again began to erode, flatlining at 0.0% by Q4 of last year. The inflationary impacts of the current war in Iran do not bode well for rent growth in the immediate term, but they also have made it even more difficult for new development to move forward with already elevated construction costs climbing even higher.
Here is the good news; the competitive landscape for landlords in the region will benefit from a diminished development pipeline and what we think will be the start of a trend of vacancy heading back towards the 5.0% mark. The bad news is that elevated inflation is likely with us through the end of 2026 as even if a lasting peace and an end to the energy shock were to develop immediately (a prospect that seems unlikely as this report went to press), it would take four to five months for stabilization and a return to normalcy in the supply chain.
One of the advantages of investment in multifamily real estate is that with typical annual lease terms of one year, apartment landlords usually can react to inflationary pressures much more quickly than those who own office, industrial or retail real estate where lease terms typically are longer. But the current challenge for local landlords is that the market had just gone through a period of some of the most aggressive rent growth in its history right before the US economy entered a period of two inflationary waves in just a few years. Rental rate growth, for now, is going to be difficult for landlords to achieve without pricing out their tenants.
LOOKING AHEAD
Heading into the final half of 2026, the economic outlook remains cloudy. As of July 2026, hostilities had resumed in the Middle East with energy prices back on an upward trajectory. Inflation, which fell during the June ceasefire to 3.5%, will be heading in the wrong direction for now. The Federal Reserve will be under
increasing pressure to raise interest rates to respond, with bond yields already climbing upward as this report went to press. It remains to be seen how long the current conflict disrupts energy supply chains, but most energy industry analysts agree that even with an immediate settlement, gas prices are not likely to get back to pre-war levels before 2027.
To date, consumers have weathered these challenges largely because 2026 was a bumper tax refund season that helped to counterbalance some of the real income shock caused by the Iran war. But US consumers have also been drawing down savings and racking up more debt to offset higher costs. That said, monthly retail sales numbers have been dropping, consumer confidence metrics have been near all-time lows, personal bankruptcies are up 11.9% through March 2026 (the latest data available from the Administrative Office of the U.S. Courts) and household debt as of end of Q1 stood at an all-time high of $18.8 trillion.
If there is good news here, it is that credit card balances during this same period fell by $25 billion to $1.25 trillion as more consumers looked towards home equity loans to pay off high interest rate credit cards. The American economy has remained resilient despite the American consumer being in what appears to be a fragile place. Should energy prices resume an upward spiral, low- and middleincome consumers might not get a chance to rebuild their savings buffers over the final half of the year which could lead to a further erosion of consumer spending.
The good news is that as cloudy as the economic outlook may currently be, most forecasters see a declining risk of recession ahead. The Survey of Professional Forecasters is the oldest quarterly survey of macroeconomic forecasts in the United States. The results from the Q2 2026 forecast are that the consensus view of economists was that real GDP would expand by 2.2% overall in 2026 (down 0.3% from last quarter’s survey). Forecasters anticipate a slight uptick in unemployment from 4.4% to 4.5% by year-end with sluggish, though positive, job growth averaging 35,000 per month through the remainder of the year (they predict this to increase to 65,000 monthly jobs in 2027). The consensus view of economists was that the US will record an annual inflation rate of 3.2% by the close of this year, up from their previous estimate of 2.8%. However, only 23% of respondents believed recession was likely in the next four quarters.
Improved hiring is one of the reasons for optimism; according to the Bureau of Labor Statistics (BLS), there were 6.6 million jobs available in the US as of the end of 2025. That number increased to 7.6 million as of May 2026 (BLS’ monthly Job Openings and Labor Turnover Report lags unemployment data by one month). It’s
a significant jump that, if sustained, should see employment growth improving over the second half of 2026.
Record corporate profits are likely one factor behind the recent spike in job openings. According to the Bureau of Economic Analysis, corporate profits reached a record $4.43 trillion in Q1 2026, up from $4.35 trillion in Q4 2025, accounting for 12.4% of US GDP, the highest level since Q2 2021 and second highest since 1947.
Another theory is that many corporations that had pulled back on hiring as they embraced new AI tools are discovering that while these tools may help to boost productivity and eliminate many redundant tasks, that automation without human expertise can only go so far. Ernst & Young-Parthenon recently released a report that found the percentage of global CEOs that believed AI investments would result in significant headcount reductions fell from 46% in January of 2025 to just 20% in May of this year. Meanwhile, Goldman Sachs economists predict that AI will disrupt roughly 9% of the workforce (15 million), but that these losses will be distributed across at least a 10-year adoption period with most workers finding new employment within a year. They also anticipate that new occupations enabled by AI will increasingly become where these employees land.
But while we anticipate a mixed economic picture through the remainder of the year, we see the next six months as a time of rebalancing for the multifamily market. Supply pressures, both nationally and locally, are easing significantly. Elevated
construction costs are likely to translate into significantly reduced development levels over the next few years. But the economic conditions creating headwinds for rental rate growth are more likely to be measured in months. Meanwhile, leasing fundamentals are likely to continue to improve for a couple of reasons. Nationally, elevated home prices and mortgage rates continue to challenge the residential market and the movement of tenants towards home ownership. Locally, Sacramento has the additional advantage of now being California’s fastest growing large city. Though the latest U.S. Census Bureau estimates for 2025 reflect California losing 229,000 residents (for the first time since the pandemic), there is another migration story occurring in the Golden State. Except for San Diego, California’s coastal cities are all seeing population declines with most of those residents not leaving the state but moving inland. Sacramento led all California cities of more than 300,000 people in terms of population growth last year with an estimated 7,000 new residents. Other localities within the top 20 cities include Folsom, Lincoln, Rancho Cordova, and Wheatland.
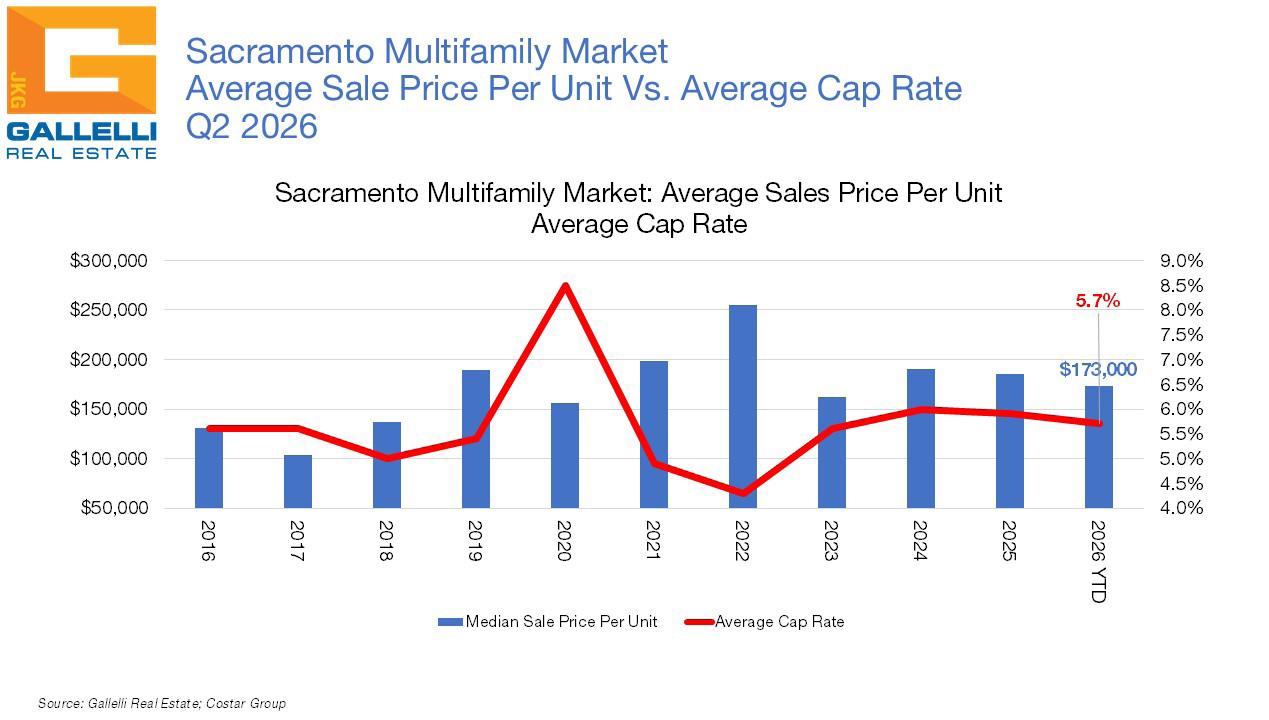
We anticipate absorption levels to remain steady or increase over the final half of the year, with improving vacancy fundamentals paving the way for a return to rental rate growth in 2027. This convergence of factors is likely to spur increasing multifamily investment interest and activity following the last few years in which deal flow was muted.
26 multifamily market report
5241
5800
4661
10930
999
2732
3310

GALLELLI BROKER TEAMS







bsessions@gallellire.com



kkuhn@gallellire.com





ebenoit@gallellire.com