Net Absorption (Last 4 Quarters) Under Construction ±1,000,000 SF ±221,000 SF (±122,000) SF 7.5%
Absorption
*Typically, state, and local unemployment data lags federal data by one month. However, the 2025 federal government shutdown (October/November 12, 2025) resulted in a disruption of normally scheduled data releases. This reflects the most current data available as of the time of this report.
THE RETURN OF LARGER DEALS
As of the midyear 2026 mark, industrial vacancy in the Sacramento region stood at 7.5%, after two consecutive quarters that had seen this metric on the upswing. It is not uncommon for us to revise these numbers as more information becomes available to our analysts. Typically, this is due to late responses from market participants to our quarterly survey of more than 3,900 properties across the region or deals closing at the end of quarter. Last quarter, we had initially reported vacancy at having reached 8.1%, its highest reading since 2016, and negative net absorption to the tune of -599,000 square feet (SF). However, while deal activity was sluggish for the majority of Q1, our analysts discovered a couple of offmarket deals that closed at the end of quarter that not only required a revision of our numbers but pointed towards an unfolding positive trend we increasingly saw playing out in Q2.
Our revised data for Q1 2026 reflects positive occupancy gains to the tune of 208,000 SF and a closing vacancy rate of 7.6%. These metrics improved with Q2 activity to the current vacancy rate of 7.5%, with another 221,000 SF of positive net absorption recorded over the last three months. The reality is that since roughly February of this year, industrial deal activity has turned a significant corner in the Sacramento region. It is not just that the region’s recent upward swing in
vacancy has reversed, but that after roughly 24 months in which deals above 100,000 SF in size were few and far between, larger deals are back.
Among the larger deals we tracked in the past few months were Pacific Coast Producers’ lease of nearly 400,000 SF at 2030 Hansen Way in Woodland, the Redwood Beverage Group’s lease of 237,000 SF at 3525 Carlin Drive in West Sacramento (which they will be occupying in Q4), Peak Energy’s lease of 183,000 SF at Metro Air Park in the Natomas/Northgate submarket and SJ Distributors’ lease of 134,000 SF of cold storage space at 3045 Mulvany Place among others. Other recent larger deals include a 275,000 SF lease from Ryder in the Sunrise submarket, Lennox’ lease of 118,000 SF at 4905 Serna Drive at Metro Air Park in Natomas/Northgate and L&U Granite’s lease of 117,000 SF of space at the Belvedere Logistics Center in Power Inn.
After nearly two years in which deal activity was almost entirely driven by smaller users focused on footprints of 50,000 SF or less, the current wave of larger requirements is much more in line with traditional industrial usage patterns in the region.
In the two decades prior to the explosion of eCommerce fulfillment and large user requirements that ruled the market by the late 2010s, industrial leasing in the Sacramento region was largely by a mix of small (50,000 SF or less) and midsize (50,000 SF to 250,000 SF) users with contractors, food production/
processing, regional distribution and logistics players largely driving larger deal activity. Those users were largely eclipsed in the late 2010s and early 2020s by a wave of mega space requirements more than 250,000 SF or more from eCommerce fulfillment and large distribution warehouse and logistics users became commonplace. That wave largely died out the last couple of years, with local market activity largely driven by smaller users favoring divisible multitenant projects as opposed to larger bulk warehouse buildings but Sacramento’s traditional midsize users were largely absent. Until now.
Early indications are that this trend has legs. Our brokers report an influx of 100,000 SF to 200,000 SF requirements in the market as well as increased touring activity, much of it from players that have largely been postponing moves in recent months against the backdrop of heightened economic uncertainty. But while the big picture economic outlook may remain cloudy, the economy has remained resilient.
FLEX VS. WAREHOUSE
PERFORMANCE
We track 179.3 million square feet (MSF) of space across the Sacramento region that we break down into two basic classifications; flex product accounts for 10.7% of the local inventory with 19.3 MSF of product. Warehouse properties
(and their subtypes) account for the rest; just over 159.9 MSF of space.
The current vacancy rate for warehouse product in the region is 7.4%, up from last quarter’s revised reading of 7.6%. While this remains elevated from the 6.6% reading of one year ago, the market has now posted two consecutive quarters of declining vacancy and occupancy growth. While the overall market recorded positive net absorption to the tune of 221,000 SF in Q2, warehouse product outperformed that number. The warehouse market recorded 249,000 SF of total occupancy growth in the last six months for a total of 553,000 SF of positive net absorption through the first six months of 2026. The current average asking rent for warehouse space across the Sacramento region is $0.75 per square foot (PSF) on a monthly triple net basis ($8.96 PSF annually). This metric is down slightly from the $0.76 PSF monthly rate recorded exactly one year ago ($9.15 PSF annually).
Flex vacancy increased slightly in Q2 2026, from 8.1% to 8.3%. Flex product in the region recorded negative net absorption to the tune of -27,000 SF over the last three months. Flex space in the region has now posted occupancy declines for six consecutive quarters. Since hitting a low of 6.3% in Q3 2024, vacancy for flex space in the Sacramento valley has been on the rise. Not surprisingly, rents have been facing stiff headwinds. The current average asking rent for flex space is $1.06 PSF on a monthly triple net basis ($12.73 PSF annually), down from $1.09 PSF a year ago ($13.13 PSF annually).
SUBMARKET REVIEW
We divide the Sacramento market into 16 unique industrial trade areas. Nine of these recorded occupancy gains in Q2.
In terms of positive net absorption, the Natomas/Northgate submarket led all other trade areas in the region with 254,000 SF of occupancy growth as vacancy here fell from 12.2% to 11.1%. Much of this came from deals at newer projects like Metro Air Park. Natomas/Northgate has emerged as one of the region’s leading submarkets for new development and, along with West Sacramento, has been one of the focal points for modern logistics distribution since the 2010s.
But while newer product drove demand in Natomas/Northgate this quarter, the opposite was true for the quarter’s other big winner. The McClellan submarket recorded 140,000 SF of positive net absorption in Q2 as vacancy levels here dropped from an already low 5.3% to a tight 4.5%. Most of the product in this trade area is situated in the former McClellan Air Force base, which was repositioned as an industrial park and business incubator following its closure and realignment in 2001. Most of the inventory here ranges from 35 to 50 years old, but this is also the region’s most affordable trade areas—especially for users that can utilize unconventional or white elephant space. Other submarkets in the black in Q2 include the Sunrise trade area (vacancy here fell from 6.8% to 6.3% on the strength of 58,000 SF of positive net absorption), Folsom/El Dorado Hills (vacancy declined from 6.8% to 5.7% with the absorption of 57,000 SF of formerly vacant product), Power Inn (where 49,000 SF of occupancy gains drove vacancy down from 5.2% to 5.1%), and Auburn/Newcastle (where vacancy now stands at 6.4% down from 7.6% thanks to the backfilling of 34,000 SF of space).
The West Sacramento submarket was the only local trade area to record occupancy declines of more than 100,000 SF. A few larger moveouts outpaced new leases this quarter with the market recording negative net absorption to the tune of -105,000. Vacancy increased from 10.6% to 11.0% in what has been the third consecutive quarter of rising vacancy since the market hit a cyclical low of 6.7% in Q3 of last year.
Other markets in the red this quarter include the Mather submarket (where vacancy now stands at 9.9% following Q2’s negative net absorption of -75,000 SF), the Roseville/Rocklin trade area (here vacancy inched up from 6.8% to 7.2% thanks to 61,000 SF in space givebacks), and the Davis/Woodland market (where occupancy loss of -45,000 SF translated into vacancy inching up from 4.5% to 4.8%). All other markets in our survey experienced negligible swings in occupancy of 25,000 SF or less in either direction.
CONSTRUCTION PIPELINE DOMINATED BY BUILD-TO-SUITS
It is too soon to tell if recent leasing momentum will hold and vacancy levels will continue to fall locally, but new construction will not be a major factor through the remainder of 2026.
We are currently tracking just over one million square feet of new space in the development pipeline, but these projects are overwhelmingly dominated by build-to-suit projects that are already accounted for and that will immediately translate into occupancy growth upon their completion.
The largest project currently underway is a build-to-suit 663,000 SF warehouse for Costco at Buzz Oates’ Metro Air Park project in the Natomas/Northgate submarket. This project will be fully occupied upon its scheduled delivery in October 2027.
Buzz Oates is also nearing completion on a 181,000 SF speculative multitenant building in Elk Grove that will come online in August 2026. This is the largest project scheduled to come online through the remainder of 2026. Other notable projects with 2026 delivery dates include a 55,000 SF build-to-suit at 3031 2nd Street in Davis that will come online later this quarter and a 24,000 SF multitenant building at 3730 Happy Lane in the Mater trade area slated for Q4 completion.
Other projects underway include a 78,000 SF Speculative multitenant warehouse at 3777 Cypress Point Court in El Dorado Hills that will be delivered in Q1 2027 and a build-to-suit 150,000 SF data center for Prime Data Centers at 2408 AK Street in McClellan Park that will be completed in early 2028.
LOOKING AHEAD
Heading into the final half of 2026, the economic outlook remains cloudy. As of July 2026, hostilities had resumed in the Middle East with energy prices back on an upward trajectory. Inflation, which fell during the June ceasefire to 3.5%, will be heading in the wrong direction for now. The Federal Reserve will be under increasing pressure to raise interest rates to respond, with bond yields already climbing upward as this report went to press. It remains to be seen how long the current conflict disrupts energy supply chains, but most energy industry analysts agree that even with an immediate settlement, gas prices are not likely to get back to pre-war levels before 2027.
To date, consumers have weathered these challenges largely because 2026 was a bumper tax refund season that helped to counterbalance some of the real income shock caused by the Iran war. But US consumers have also been drawing down savings and racking up more debt to offset higher costs. That said, monthly retail sales numbers have been dropping, consumer confidence metrics have been near all-time lows, personal bankruptcies are up 11.9% through March 2026 (the latest data available from the Administrative Office of the U.S. Courts) and household debt as of end of Q1 stood at an all-time high of $18.8 trillion.
If there is good news here, it is that credit card balances during this same period fell by $25 billion to $1.25 trillion as more consumers looked towards home equity loans to pay off high interest rate credit cards. The American economy has remained resilient despite the American consumer being in what appears to be a fragile place. Should energy prices resume an upward spiral, low- and middle-income consumers might not get a chance to rebuild their savings buffers over the final half of the year which could lead to a further erosion of consumer spending.
The good news is that as cloudy as the economic outlook may currently be, most forecasters see a declining risk of recession ahead. The Survey of Professional Forecasters is the oldest quarterly survey of macroeconomic forecasts in the United States. The results from the Q2 2026 forecast are that the consensus view of economists was that real GDP would expand by 2.2% overall in 2026 (down 0.3% from last quarter’s survey). Forecasters anticipate a slight uptick in unemployment from 4.4% to 4.5% by year-end with sluggish, though positive,
Sacramento Industrial Market
All Classes of Product Q2 2026
Sacramento Industrial Market: Median Price PSF/Average Cap Rate
Source:GallelliRealEstate;CostarGroup
job growth averaging 35,000 per month through the remainder of the year (they predict this to increase to 65,000 monthly jobs in 2027). The consensus view of economists was that the US will record an annual inflation rate of 3.2% by the close of this year, up from their previous estimate of 2.8%. However, only 23% of respondents believed recession was likely in the next four quarters.
Improved hiring is one of the reasons for optimism; according to the Bureau of Labor Statistics (BLS), there were 6.6 million jobs available in the US as of the end of 2025. That number increased to 7.6 million as of May 2026 (BLS’ monthly Job Openings and Labor Turnover Report lags unemployment data by one month). It’s a significant jump that, if sustained, should see employment growth improving over the second half of 2026.
Record corporate profits are likely one factor behind the recent spike in job openings. According to the Bureau of Economic Analysis, corporate profits reached a record $4.43 trillion in Q1 2026, up from $4.35 trillion in Q4 2025, accounting for 12.4% of US GDP, the highest level since Q2 2021 and second highest since 1947.
Another theory is that many corporations that had pulled back on hiring as they embraced new AI tools are discovering that while these tools may help to boost productivity and eliminate many redundant tasks, that automation without human expertise can only go so far. Ernst & Young-Parthenon recently released a report that found the percentage of global CEOs that believed AI investments would result in significant headcount reductions fell from 46% in January of 2025 to just 20% in May of this year. Meanwhile, Goldman Sachs economists predict that AI will disrupt roughly 9% of the workforce (15 million), but that these losses will be distributed across at least a 10-year adoption period with most workers finding new employment within a year. They also anticipate that
new occupations enabled by AI will increasingly become where these employees land.
The good news is that ongoing deal activity and active tenant requirements in the marketplace should drive stronger industrial leasing activity across the Sacramento region over the final half of 2026. With minimal new deliveries and much of the space currently under construction in the region already leased, new development will not be a factor in driving higher vacancy levels, but higher occupancy rates instead. However, this will be playing out against the continued backdrop of heightened economic uncertainty and challenging consumer economics. Still, we anticipate continued modest occupancy gains and declining vacancy levels over the next six months barring any further macroeconomic shocks.
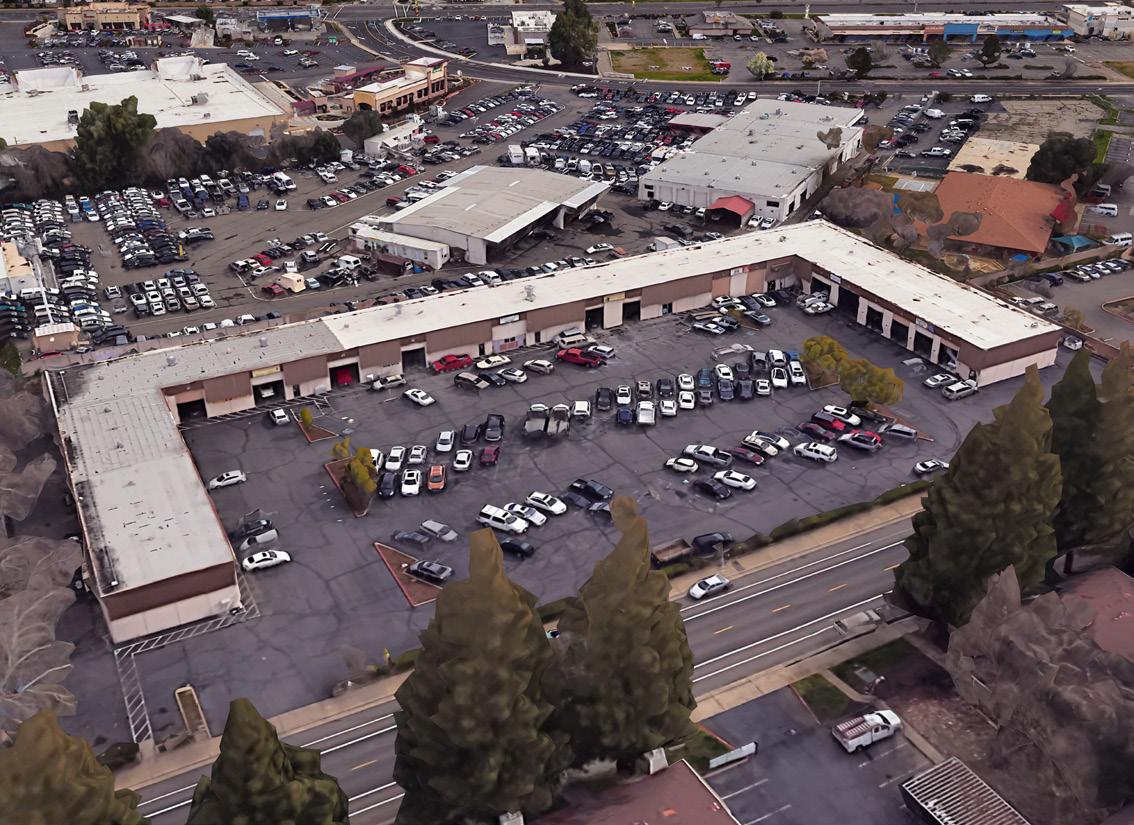
2301 Vehicle Drive Rancho Cordova, CA
Select Sacramento Region Industrial Leases - Select Deals Q2 2026 - Past 12 Months
about gallelli real estate
Gallelli Real Estate is a private firm that specializes in commercial real estate services and property management. We believe that as a boutique firm whose understanding of the business runs as deep as our core values, our advantage is large. We take pride in our unique approach to offer more individual solutions that address the ever changing needs of our clients and the industry. After all, our success is measured by the success of our clients and the strength and longevity of our relationships.