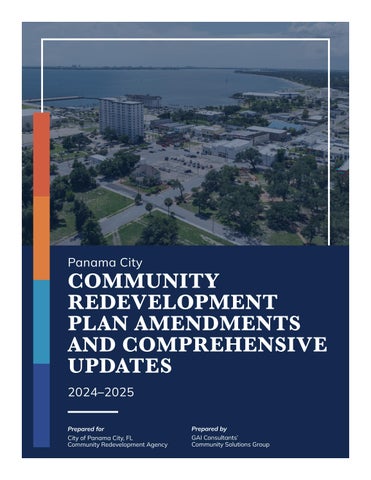
Panama City COMMUNITY REDEVELOPMENT PLAN AMENDMENTS AND COMPREHENSIVE UPDATES
2024–2025
ACKNOWLEDGMENTS
Jonathan H. Hayes | Executive Director
Brandy Waldron | Deputy Executive Director
Lena Webb | CRA Program Manager
Michelle Zirkle | CRA Program Manager
Lori Sagehorn | CRA Administrative Technician
Panama City Community Redevelopment Agency
501 Harrison Avenue
Panama City, Florida 32401 (850) 691.4603
PROJECT TEAM
Laura Smith, MPA, CRE, FRA-RA | Urban Analytics Director
Natalie Frazier, MBA, FRA-RA | Urban Analytics Manager
John Jones, AICP, FRA-RP | Planning Manager
Hannah Hollinger, LEED AP O+M | Senior Planner
Britney Broxton, MPA | Project Analyst
Dawn Welsh, CNU-A, LEED AP | Senior Project Planner
Community Solutions Group, GAI Consultants, Inc.
618 East South Street, Suite 700 Orlando, FL 32801
(321) 319.3088
INTRODUCTION & OVERVIEW
CHAPTER ONE:
INTRODUCTION & OVERVIEW
PANAMA CITY COMMUNITY REDEVELOPMENT AGENCY HISTORY
Overview
The City of Panama City (“City”), a vibrant coastal city in northwest Florida, is strategically positioned between the City of Tallahassee and the City of Pensacola, Florida. Nestled on the shores of St. Andrews Bay, it serves as the county seat of Bay County (“County”), Florida.
Encompassing 35 square miles on the Florida Panhandle, the City is well connected by several major highways, including U.S. Highway 98, North Highway 231, and the Lynn Haven Parkway. One notable feature of the City is that it is bisected by U.S. Highway 231, which runs through the heart of the City, providing a crucial northeast-southwest route for residents and visitors alike.
The City is known for its abundant supply of fresh water, attractive housing options, and a wide range of recreational activities, such as fishing and water sports. The City also offers vibrant arts and entertainment scenes, all within a charming small-town setting—creating an exceptionally attractive living environment that caters to diverse lifestyles.
Renowned for its rich history, vibrant arts, diverse culture, and environmental attractions, the City boasts several historic neighborhoods. The City recognized the significant areas of the downtown that were in need of redevelopment and dedicated investment. To address this need and preserve the City’s downtown beauty and community
well-being, the Downtown Improvement Board (“DIB”) was established in 1974 under City Resolution No. 1973-04-10 and Florida Statute Chapter 74-571.
In 1983, the City completed a Finding of Necessity ("FON") study to delineate the boundaries of a Community Redevelopment Area (“CRA”), which resulted in the City forming the Community Redevelopment Agency (“Agency”) under Chapter 163, Part III, Florida Statutes (“Chapter 163” or “Redevelopment Act”). The goal of this effort was to improve neighborhoods through strategic improvements, address blight, enhance infrastructure, and foster economic growth, while promoting reinvestment and redevelopment within the CRA.
While the initial Community Redevelopment Plan was created and adopted in 1984 to guide the economic and developmental revitalization within the City's downtown, the Agency has since established three additional CRAs: St. Andrews CRA in 1989, Downtown North CRA in 1993, and the Millville CRA in 2004.
The Agency undertakes redevelopment activities and strategies in accordance with the Community Redevelopment Plan developed for each
CRA in accordance with the Redevelopment Act, funded by the growth in local property taxes within their respective boundaries. Altogether, the four CRAs encompass a total of 3.74 square miles across the City.
Mission of the Agency
The Agency’s mission includes revitalizing the City through targeted investment and thoughtful planning. Its focus is on eliminating blight to create cleaner, safer neighborhoods; upgrading infrastructure to support future growth; boosting economic development to attract businesses and jobs; and empowering communities to shape a vibrant, thriving future.
Generally, Agencies have three primary benefits in promoting redevelopment, such as the following:
1. A master planning approach and implementation strategy for each CRA;
2. Tax Increment Financing (“TIF”), which diverts future property tax revenues from participating taxing authorities, the County
and City, to the trust fund specifically established for redevelopment projects and programs;
3. Increased eligibility for federal and state grants that can be used for infrastructure improvements, business development, and priority acquisition.
By operating on a TIF funding model, the Agency is able to reinvest increased property tax revenue from revitalized areas directly back into those communities. This approach allows the Agency to fund essential projects that support local businesses, improve walkability and public spaces, and enhance infrastructure and community amenities without raising taxes elsewhere. As property values rise, so does the available funding- creating a self-sustaining cycle of growth and improvement.
In accordance with Chapter 163, the Agency's operational term will “sunset” in 2044 after 60 years of operation as a Dependent Special District.
Purpo se of the Redevelopment Plan
The purpose of these 2025 Community Redevelopment Area Plan Amendments and Comprehensive Updates (“2025 Plan”) is to provide an update of the most recent Downtown CRA and Millville CRA Redevelopment Plan(s), as well as to provide a modification and update to include adopted expansions of the Downtown North and St. Andrews CRAs.
This 2025 Plan recaps basic contents, projects, and milestones to strengthen the foundation for renewed objectives, programs, and proposed funding allocations going forward.
Chapter 163 emphasizes the importance of maintaining the existing tax base through purposeful redevelopment actions. In this case, this 2025 Plan, described in some detail on the pages that follow, concludes with a series of recommended investments or activities and a proposed funding allocation for each CRA district, aligned with projected TIF revenues.
PANAMA CITY REDEVELOPMENT AREAS
The City of Panama City Community Redevelopment Agency ("Agency") administers redevelopment programs and strategies within four distinct Community Redevelopment Areas ("CRA"), as defined in the following descriptions and illustrated in the map on the following page (see Figure 1).
Downtown CRA (1984)
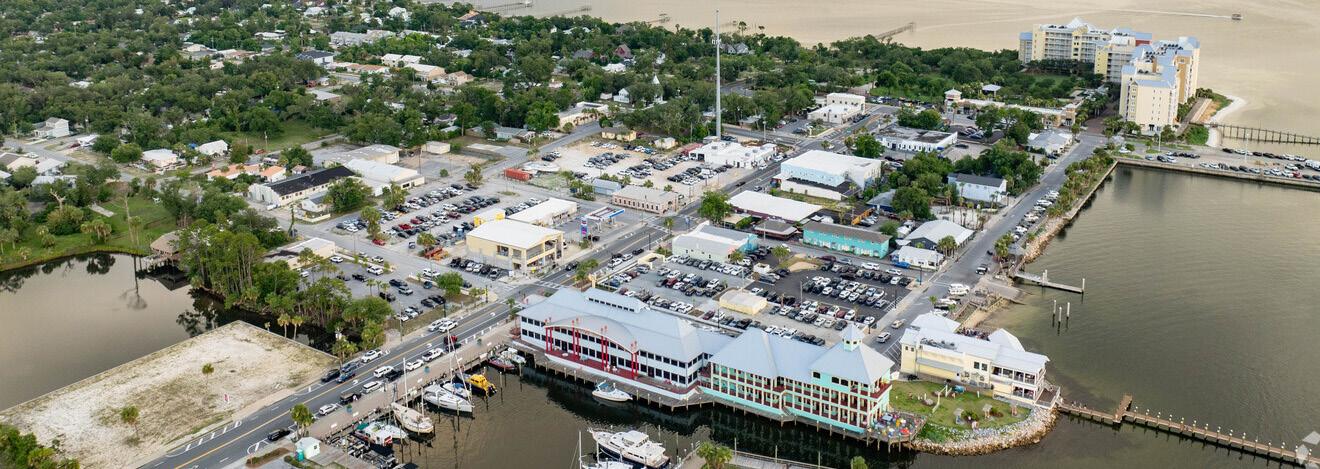
Originally known as "Harrison" and "Park Resort" in the 1800s, downtown became the focal point of the City due to its waterfront location, commercial shipping access, local jail, and post office. Following creation of the Agency in 1983, the Downtown CRA Redevelopment Plan was developed and adopted in 1984 to serve as the foundational guide for the future economic and physical redevelopment of the Downtown CRA. Spanning approximately 145 acres, the Downtown CRA is nestled between Massalina Bayou to the east and St. Andrews Bay to the southwest. Notable landmarks within the Downtown CRA include the Panama City Marina, City Hall, and the Martin Theater. Over time, the Downtown CRA has evolved into a business core and community arts hub for the City.
St. Andrews CRA (1989)
The St. Andrews CRA was established in 1989 to revitalize the City's St. Andrew Bay Community. Expanded in 2025 after completion of a Finding of Necessity ("FON") study, it now includes areas east and west of the original boundary. Known for its strong waterfront connection, the St. Andrews CRA boasts numerous boats, docks, and traditional fishing village architecture along St. Andrews
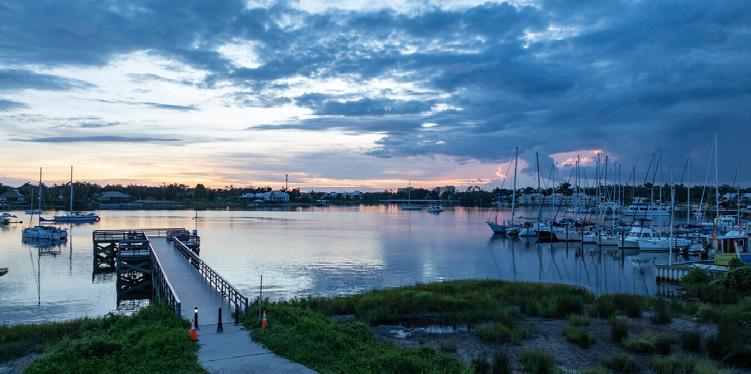
Bay. The area offers extensive shoreline and park space, enjoyed by residents and visitors alike. Today, the St. Andrews CRA covers approximately 644 acres and features anchor developments, such as the St. Andrews Marina, which serves as a central landmark in this CRA.
Located east of Foster Avenue, the St. Andrews CRA stretches south to St. Andrews Bay and north along both sides of W. US Hwy. 98 until Molitor Avenue. The St. Andrews CRA, being a Designated Waterfront Florida Partnership Community, affords the Agency access to technical assistance, training, education, and limited financial support to implement community-designed vision plans. With the Agency’s support, several St. Andrews CRA projects have transformed the area into a vibrant arts and dining destination.
Downtown North CRA (1993)
The Downtown North CRA was established in 1993 to revitalize the northern part of the City's downtown. The Downtown North CRA did not initially include any areas beyond 12th Street North. Based on an FON study conducted in 2008, the City Commission unanimously approved expanding the original Downtown North CRA boundaries from 12th Street North to U.S. Hwy. 231 between McKenzie Avenue and Mercedes Avenue.
The Downtown North CRA was subsequently expanded three (3) more times: first in 2018 to incorporate the area generally
bound by W 12th Street, U.S. Hwy. 231, and McKenzie Avenue; then in 2021 to incorporate the Panama City Mall located on the north side of U.S. Hwy. 231; and finally again in 2021 to incorporate the area generally east of Mercedes Avenue, south of U.S. Hwy. 231, north of E. 13th Street, and west of the City’s western boundary. Today, the Downtown North CRA spans approximately 1,248 acres and encompasses major anchor developments, such as the Ascension Sacred Heart Bay and the Martin Luther King Recreation Center.
Millville CRA (2004)
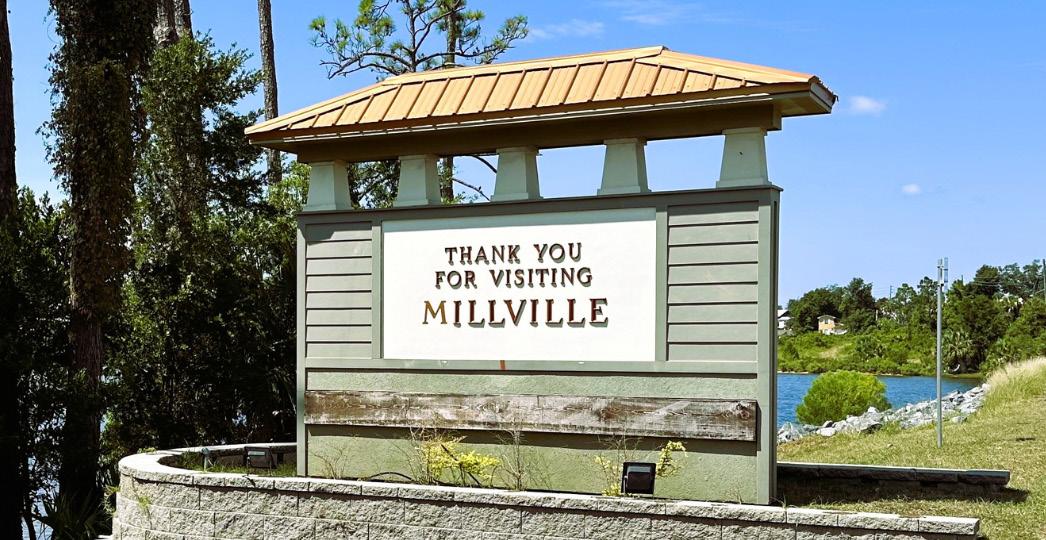
Millville, an urban neighborhood just outside the City's downtown, is known for its historic sawmills and shipyard industries. It features walkable streets, traditional homes, and a lush tree canopy. The community enjoys extensive waterfront access along Watson Bayou. The Millville CRA was established in 2004, with the objective of revitalizing the City's Millville neighborhood. Spanning 681 acres, the Millville CRA is bound by 7th Street to the north, Everitt Avenue to the east, Cherry Street to the south, and Watson Bayou to the west. A small portion of the Millville CRA, located on the western side of the Watson Bayou, encompasses the neighborhood around Cove Point Drive. The Millville CRA encompasses the southeastern area of the City and is designated as a Waterfronts Florida Partnership Community. The Millville CRA contains major anchor developments such as the historic shipyard, Daffin Park, the Millville Cemetery, Whittington Park, the Millville Waterfront Park, and the Snug Harbor Boat Launch.
Legend
Panama City Municipal Boundaries
Downtown CRA
St. Andrews CRA
Downtown North CRA
Millville CRA
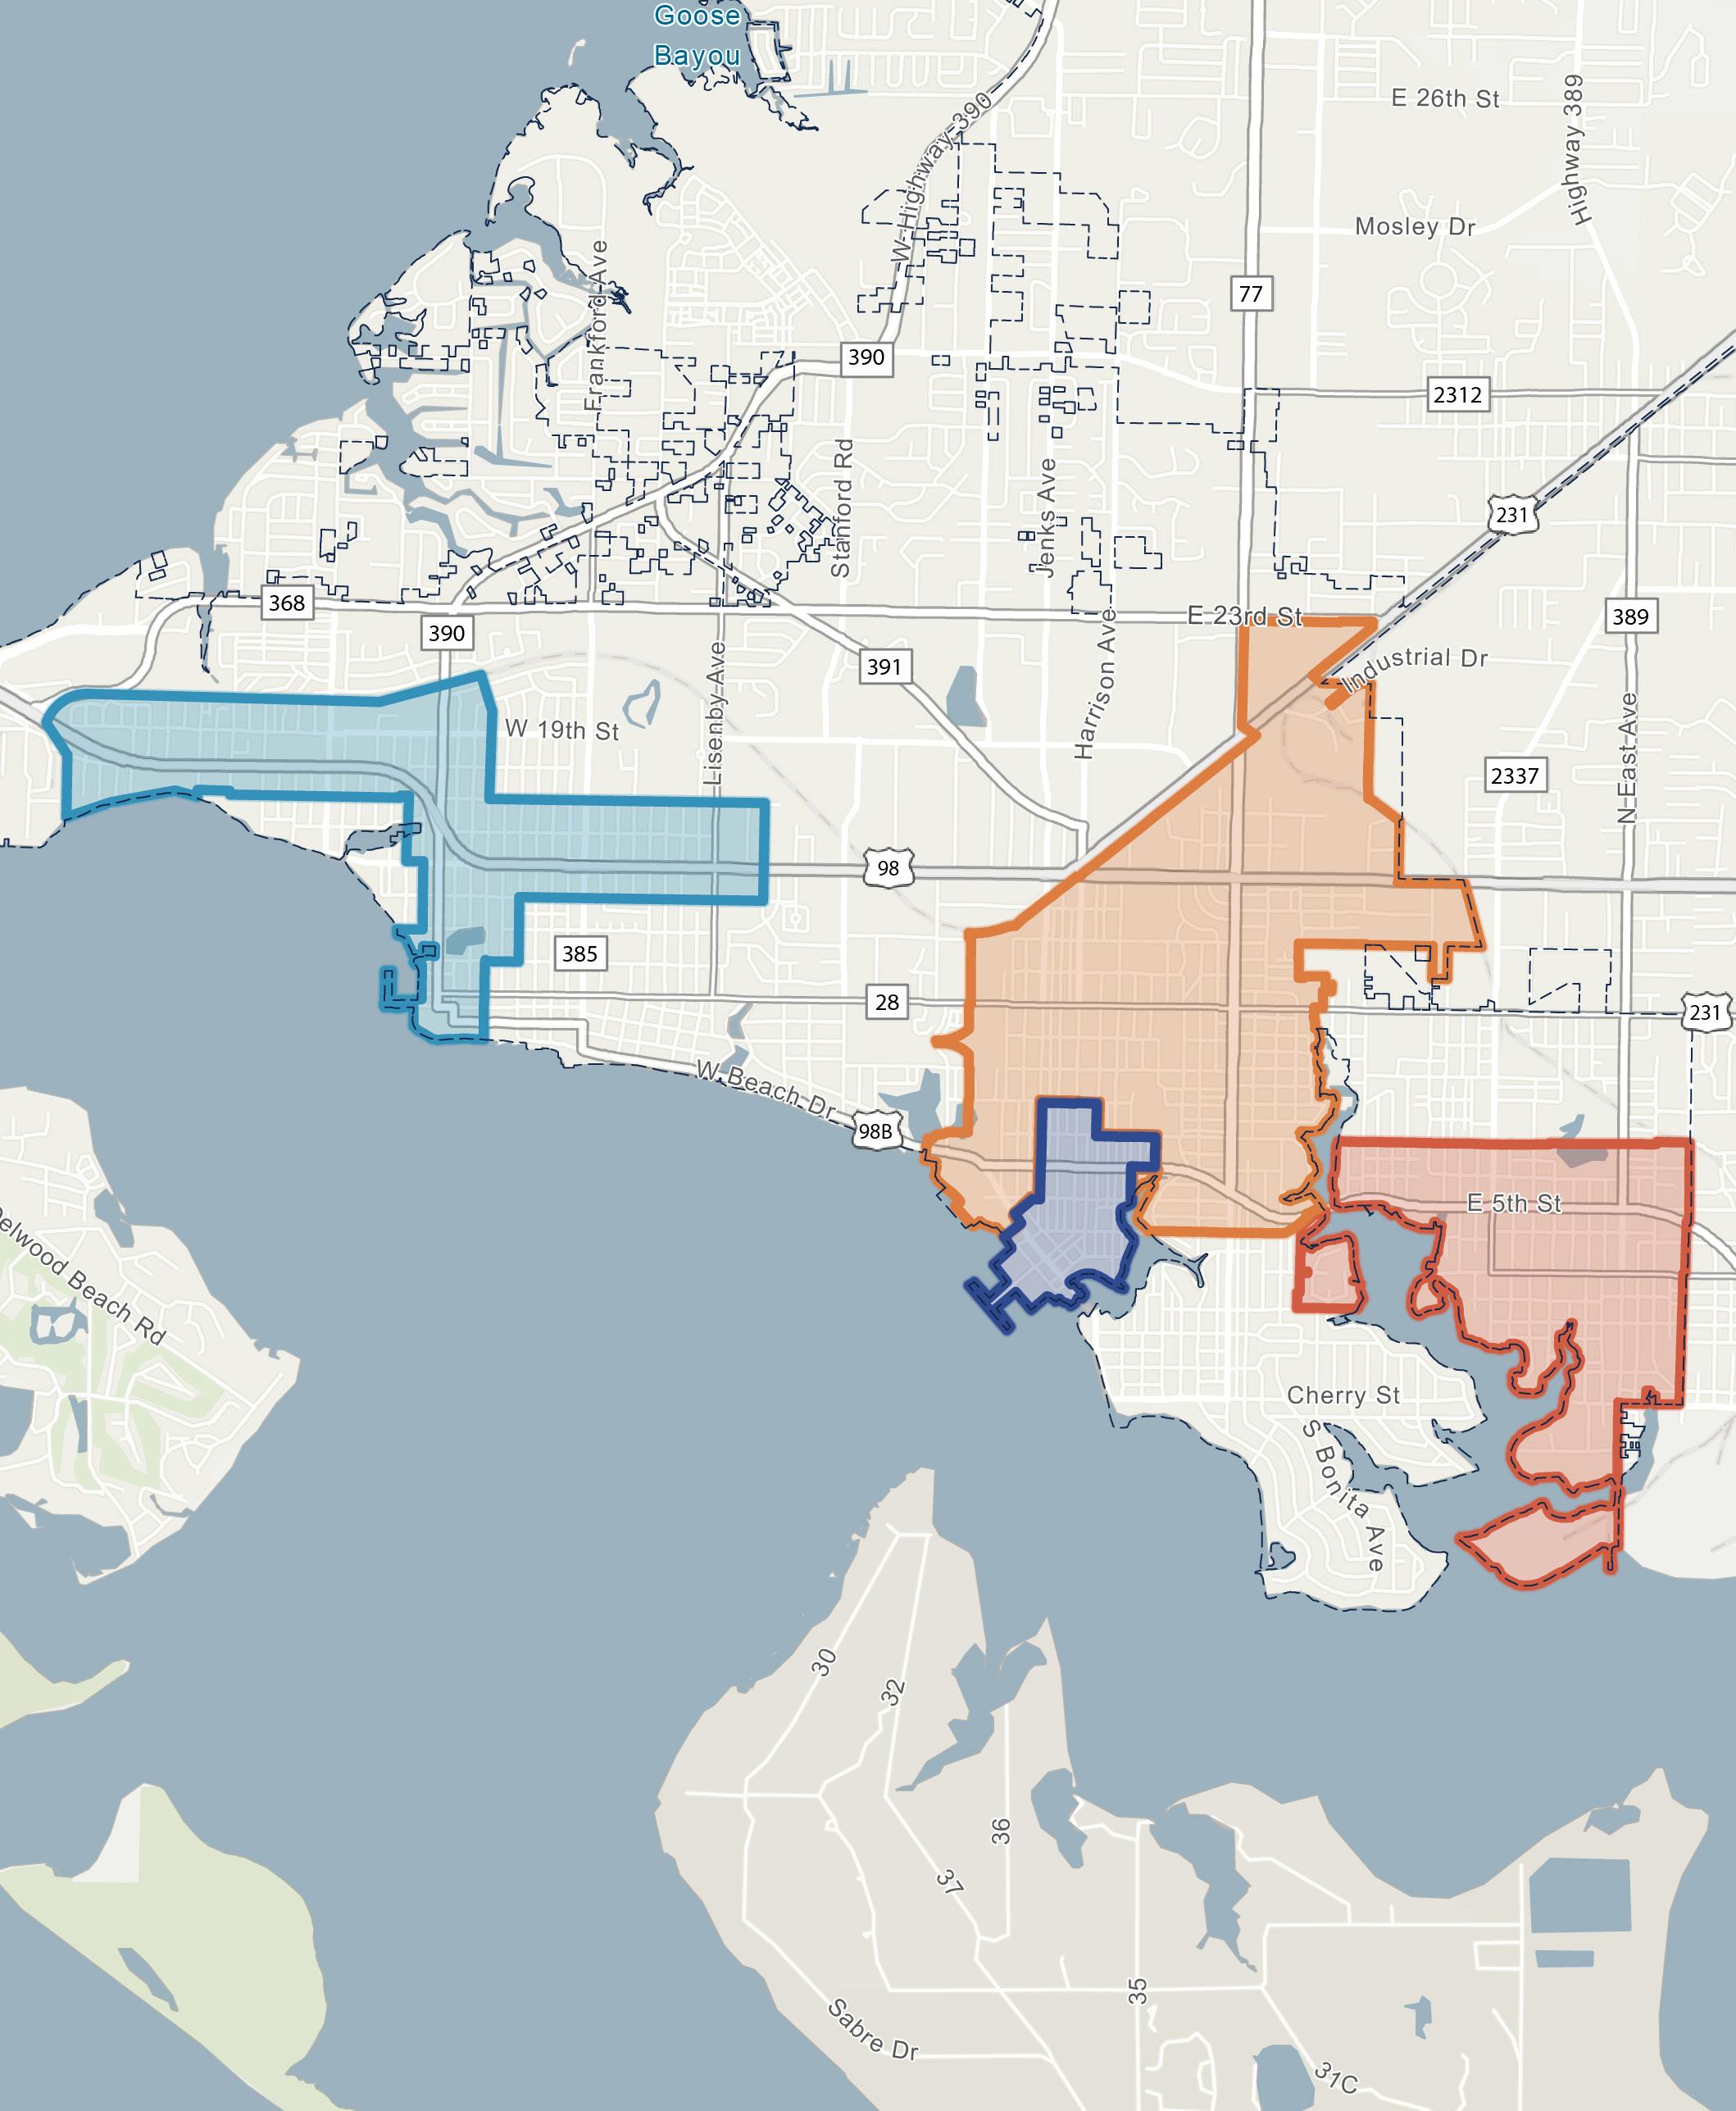

Figure 1. PANAMA C r A MAP
PRIOR PLANS AND STUDIES
The City and Agency have developed and adopted detailed planning documentation and neighborhood and redevelopment district-specific implementation plans. These documents serve as the foundational basis for the redevelopment strategies to be developed for each district, ensuring their timely implementation. The prior plans reviewed as part of this 2025 Plan include the following:
Panama City Planning Documents and Studies
2018
Comprehensive Plan
The City, pursuant to Chapter 163, Part II of the Florida Statutes, produced a long-term Comprehensive Plan in 2018 that contained goals, objectives, and policies that addressed pressing community needs. These needs included providing adequate public services, developing a safe transportation and infrastructure system, maintaining the environment and providing recreation opportunities, and ensuring intergovernmental facilitating to ensure project delivery. All new community plans must be consistent with the goals, objectives, and policies outlined in the 2018 Comprehensive Plan.
Long-Term Recovery Plan
In October 2018, Hurricane Michael disrupted six of the City’s essential services: transportation; food, water, shelter; communication; energy; health and medical services; and safety. Two years later, the City released the Recovery Action Plan, a roadmap outlining actionable resources to address the immediate critical community needs within these six affected lifelines.
These lifelines were subsequently consolidated into four “lines of effort”: restore and improve safety and security, rebuild and enhance hazard-resilient infrastructure and utilities, support a thriving economy, and create a community with a high quality of life.
Serving as an annex to the Recovery Action Plan, the Long-Term Recovery Plan is a roadmap addressing recovery and redevelopment needs, while identifying key partnerships, funding, and resource requirements. With a vision extending to 2050, the Long-Term Recovery Plan aims to strategically promote growth across each of the City’s four lines of effort, while focusing on master planning, economic development and effective communication.
Strategic Vision for Downtown and its Waterfront
As part of the Long-Term Recovery Plan projects, the Strategic Vision for Downtown and its Waterfront plan provides direct goals and actions to guide future growth while preserving history and developing a strong sense of community.
The Strategic Vision for Downtown and its Waterfront plan was developed by the City through data collection, site visits, and community workshops and meetings. The community meetings revealed that residents desired a more vibrant downtown area, and improved access to the Waterfront. The plan concludes with 10 Cornerstone Ideas for Downtown, outlining priorities, funding sources, and responsibilities for partners and government entities.
Panama City Neighborhood Plans
The Panama City Neighborhood Plans (“Neighborhood Plans”) are the final piece to the LongTerm Recovery Plan projects. The Neighborhood Plans build on the 10 Cornerstone Ideas for Downtown. These plans cover Millville, St. Andrews, and Glenwood. While highlighting that these neighborhoods include the CRAs of the Panama City Community Redevelopment Agency, the Neighborhood Plans extend further to offer broader ideas for the defined areas. To develop each Neighborhood Plan, the City held several community meetings to gather input and define the vision.
While retaining the 10 Cornerstone Ideas for Downtown, the City identified three consistent themes through community input in Millville, St. Andrews, and Glenwood, outlining the communities’ visions and priorities for the future. These themes are: creating complete neighborhoods, creating great streets, and creating resilient open spaces and infrastructure.
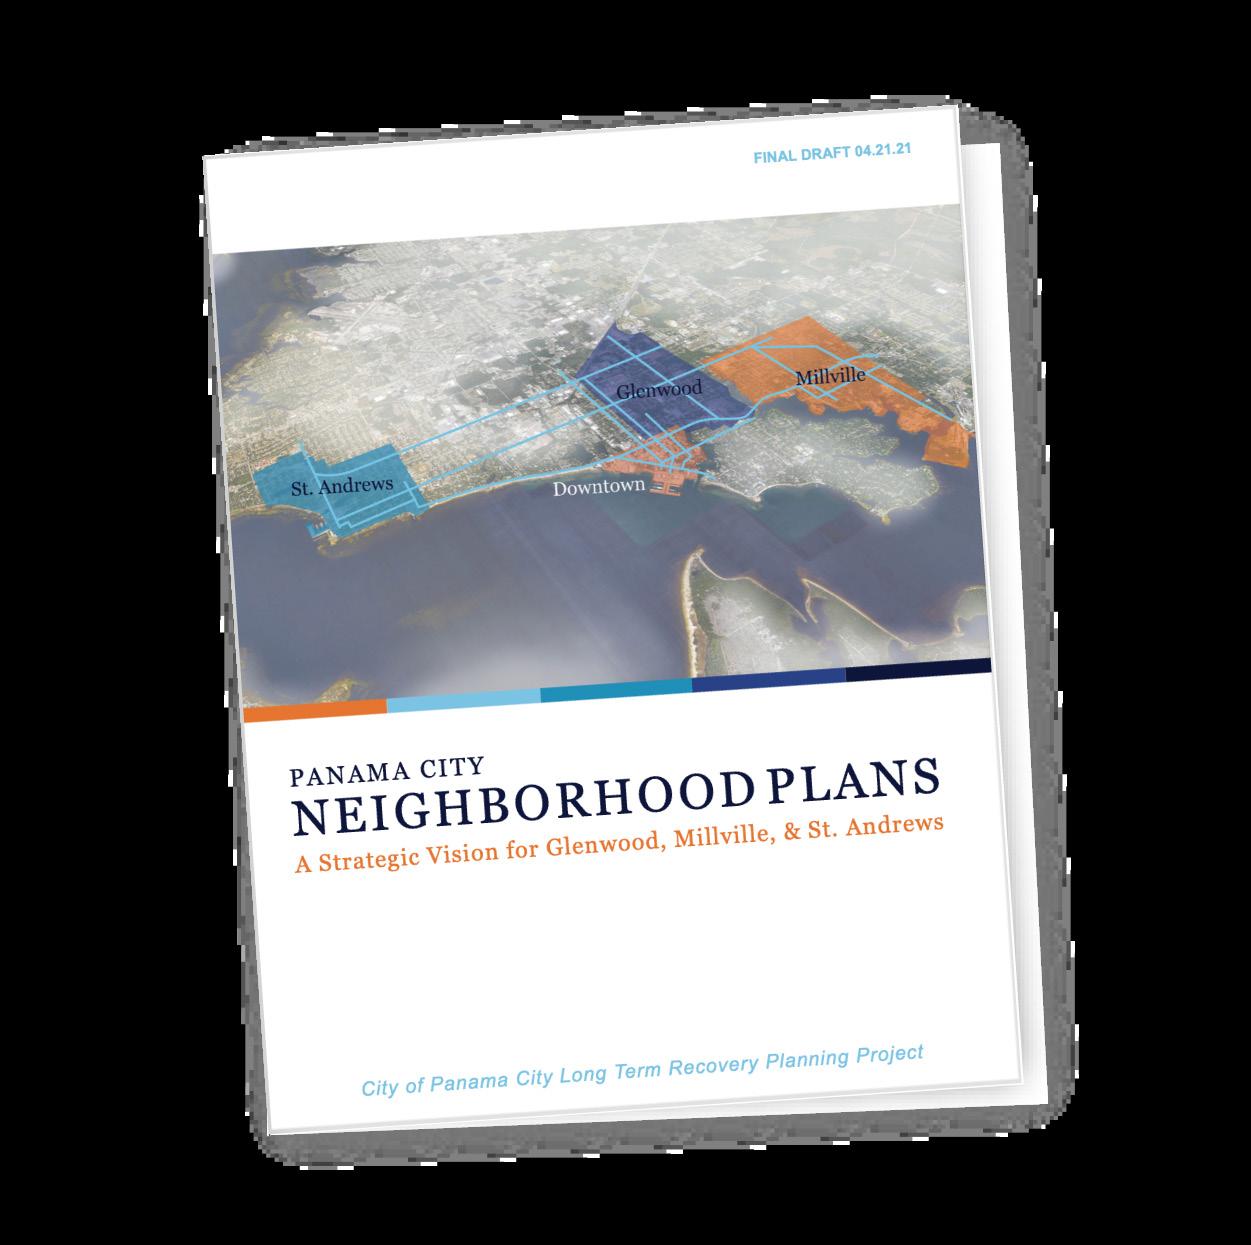
The Neighborhood Plans conclude with a list of next steps to implement the communities’ goals and visions, including investing in improvements, removing investment barriers, and leveraging existing assets.
Redevelopment Area
Specific Planning Documents and Studies
Downtown CRA Community Redevelopment Plan(s)
The City’s first Community Redevelopment Plan was adopted in 1984 (“1984 Plan”), which outlined the future economic and physical redevelopment of the Downtown CRA. After its adoption, the 1984 Plan led to several achievements and profitable investments into the Downtown CRA’s tourism economy, cultural appearance, parking availability, and small business activity.
While there was success with the 1984 Plan, an analysis conducted in the late 2000s found that the aggregate assessed value of real properties had decreased between 2007 and 2011. This led to the updating of the 1984 Plan, culminating in the 2012 Downtown CRA Community Redevelopment Plan Update (“2012 Plan”).
The 2012 Plan acknowledged that the redevelopment of the Downtown CRA is an ongoing effort, hindered by blighting influences that have affected growth for years. It aimed to translate the community’s visions into a structured series of actionable strategies to help the Agency make informed decisions toward achieving a vibrant and economically sustainable Downtown CRA.
The 2012 Plan identified three specific goals for the Downtown CRA that were of the highest priority and essential to the plan:
1. Redeveloping the marina into a multi-use civic and commercial destination (Highest Priority).
2. Collaborating with other county/regional entities to coordinated economic development strategies (Essential).
3. Continuing investment in capital improvements such as streetscapes, area-wide storm water system and parking facilities (Essential).
The 2012 Plan also included TIF projections through 2034, designed to support the planning and development of the proposed projects and goals.
St. Andrews CRA Community Redevelopment Plan(s)
The 1989 St. Andrews Community Redevelopment Plan (“1989 Plan”) addressed the need to revitalize the area following a decline in business activities in the mid-1980s, largely due to several waterfront businesses and charter fishing companies relocating to the emerging Panama City Beach.
The 1989 Plan aimed to transform the area into a historic landmark that promotes tourism, business, and recreation. As part of this effort, the area was designated a Waterfront Florida Partnership Community, providing the St. Andrews CRA and local leadership with access to new resources and grants. The 1989 Plan successfully improved the streetscape, attractions, lighting, and parking.
However, despite achieving most of its goals within the set timeframe, challenges such as insufficient infrastructure investments, high business turnover, and ongoing public safety concerns persisted.
In 2017, the City began updating the 1989 Plan. The development of the 2018 St. Andrews Community Redevelopment Plan (“2018 Plan”) involved a threepart community engagement process to understand the broader perceptions and concerns for the St. Andrews CRA.
This process included an online survey, in-person stakeholder interviews, and a community open house, which led to the creation of the 3-Point Action Plan to guide reinvestment and redevelopment in the St. Andrews CRA:
1. Redeveloping the St. Andrews Marina into a vibrant public space and working waterfront, connecting it to the neighborhoods.
2. Strengthening the neighborhoods through improved bike and pedestrian facilities and connections to the historic waterfront.
3. Developing incentive programs designed to facilitate desired redevelopment projects.
In 2024, the Agency commissioned an FON study to examine areas on the east and west side of the St. Andrews CRA, resulting in expansion of the St. Andrews CRA to include the areas east and west of the original boundary.
Downtown North CRA Community Redevelopment Plan(s)
The original Downtown North Redevelopment Plan was adopted in 1993 (“1993 Plan”) to address the ongoing decline of the City’s African-American community within the Downtown North CRA boundaries. Many of the projects outlined in the 1993 Plan were successful, which led to significant investment and economic growth in the Downtown North CRA and adjacent neighborhoods.
However, a 2008 FON revealed that areas outside the Downtown North CRA also exhibited conditions of Slum and Blight. This led to the expansion of the Downtown North CRA borders followed by amendment and update of the Downtown North CRA Plan in 2009.
The 2009 Downtown North CRA Plan Amendment and Update (“2009 Plan”) was adopted following an extensive 8-month community visioning process. By integrating the FON with community perspectives, seven overarching themes were identified: Land Use, Housing, Recreation and Open Space, Neighborhood Character and Identity, Community Facilities and Amenities, Circulation and Connectivity, and Economic Development. The 2009 Plan, with a 20-year outlook, outlines how future land use designations, neighborhood rehabilitation, environmental preservation, and economic development can support the community’s growth.
In 2014, the Panama City Cultural Heritage Tourism District Plan was developed, outlining the blueprint for creating a Cultural Heritage Tourism District within
the Downtown North CRA. The plan comprises a Feasibility Study, Master Implementation Plan, and a District Community Model. Its primary intent is placemaking, combining urban planning, design, and economic development. It recognizes the link between arts, culture, and urban revitalization. Based on data and community input, the plan includes two land use scenarios and proposes several projects to achieve the cultural district concept, along with success indicators and implementation steps.
In 2018, an FON was conducted on an area adjacent to the Downtown North CRA, located south of U.S. Hwy. 231 and bordered by Entra Drive to the west, West 12th Street to the south, and McKenzie Avenue to the east. The study identified several characteristics of Slum and Blight within the defined area, which led to the expansion of the Downtown North CRA boundaries in 2019.
In 2021, an FON study was conducted on a 71.5-acre lot located northwest of U.S. Hwy. 231, primarily focused on the Panama City Mall site. The FON study identified several Slum and Blight conditions, which indicated the area qualified for inclusion in the Downtown North CRA; this led to the expansion of the Downtown North CRA boundaries in 2021.
Moreover, another FON study was conducted in 2021 to examine conditions in the area on the east side of the Downtown North CRA, generally east of Mercedes Avenue, south of U.S. Hwy 231, north of E 13th Street, and west of the City’s eastern boundary. The FON identified several Slum and Blight conditions, which
indicated the area qualified for inclusion in the Downtown North CRA; this led to further expansion of the Downtown North CRA boundaries in 2021.
Millville CRA Community Redevelopment Plan(s)
Following the completion of the 2002 Panama City Strategic Master Plan, an FON was conducted for the Millville neighborhood. The FON study determined that the neighborhood exhibited characteristics of blight, which led to the recommendation that the area be established as a CRA and develop a Redevelopment Plan to guide redevelopment programs and strategies in accordance with the Redevelopment Act.
As a result, the 2004 Millville Redevelopment Plan (“2004 Plan”) was initiated. Developing the 2004 Plan required a thorough understanding of the area’s existing conditions. Information was gathered from various sources, including previous studies, site visits, public workshops, and interviews with City staff, citizens, and property owners in the Millville CRA.
The 2004 Plan divided the Millville CRA into four distinct sub-areas. The four sub-areas include: the Residential Neighborhoods, the Business U.S. Hwy. 98 Corridor, the Traditional Town Center, and the Waterfront. They were determined on the basis of having similar land-use compositions, physical characteristics, and functions.
In the Residential Neighborhoods, the most significant issues identified were the absence of residential zoning, inadequate code enforcement, and incomplete streetscapes. The Business U.S.
Hwy. 98 Corridor was marked by poorly maintained businesses and neglected vacant properties. The Traditional Town Center faced challenges with poor connectivity to surrounding neighborhoods and deteriorating infrastructure. Lastly, the Waterfront area was adversely affected by unattractive streetscaping and the presence of gas tanks and a sewage plant.
Overall, the 2004 Plan outlined 11 concept plan elements and recommendations for the Millville CRA with several reinvestment objectives and action strategies, including infrastructure investment and beautification, continued planning, protection of the waterfront, and enhancement of residential areas.
In 2009, the City applied for the Waterfronts Florida Partnership Program for a designated area within Millville. Later that year, Millville was awarded the designation of a Waterfront Florida Partnership Community. The area received technical and financial support for two years and continued to receive support as a graduate community thereafter.
The City developed the Forward Momentum: Millville Waterfront Vision Plan, with the primary vision of creating community access to the Millville waterfront, including physical and visual access, as well as recreation and business opportunities. Forward Momentum: Millville Waterfront Vision Plan reviewed previous Millville plans and outlined the goals, objectives, and strategies for the new designation, focusing on public access, environmental protections, and hazard mitigation.
PAST PRIORITIES AND GUIDING PRINCIPLES
The past priorities and guiding principles for the Agency and the four CRAs were shaped by input from the previous plans and studies.
Further, the City, along with its residents, business owners, and property owners, were significantly impacted by the devastation caused by Hurricane Michael in 2018.
In 2019, the City initiated the planning phases of its longterm recovery and rebuilding program. This involved a multiyear planning and community input process- consisting of over 100 public planning meetings and workshops, including 18 special focus groups, 3 town hall meetings, and several online workshops.
This extensive public input and planning process solidified the four critical focus areas, which have remained a major focus based on project progress throughout the four CRAs. These focus areas include:
Safety and Security
▪ Ensure safe and clean streets for residents.
▪ Provide access to highquality healthcare facilities.
▪ Foster a culture of safety and security for everyone.
Key and Vital Infrastructure
▪ Restore infrastructure to enhance access to the City’s amenities and commercial centers.
▪ Implement strategies to restore, modernize, and make the City’s energy, water, and wastewater systems more resilient.
Economy
▪ Develop resources to support a diverse and vibrant economy.
▪ Reclaim the City’s role as the primary economic engine of the Panhandle.
Quality of Life
▪ Invest in an attractive and affordable housing market for the City’s workforce.
▪ Provide accessible community services to all residents and visitors.
▪ Honor the City’s unique sense of place.
▪ Establish the City as the premier destination for arts and culture in the Panhandle.
TIMELINE OF AGENCY ACCOMPLISHMENTS
2010-2011 2012-2013
Downtown CRA
▪ Completed 4th & Grace Parking Lot.
▪ Completed McKenzie Park Gateway Fountain Renovation.
St. Andrews CRA
▪ Administered the commercial grant program for signage, awnings, landscape.
▪ Continued the preservation projects of the Villa Gateway Park and historic fountain at the Oaks by the Bay Park.
▪ Initiated and completed the Bayview Streetscape Project.
▪ Completed Historic Villa Gateway.
Downtown North CRA
▪ Implemented the Clearing Vacant Parcel program.
▪ Awarded a highway beautifications grant with FDOT for MLK.
▪ Provided grant to avoid utility shut off at A.D. Harris Learning Village.
▪ Revitalized old Coca-Cola factory.
▪ Completed Jenks Corridor Improvement Project.
Millville CRA
▪ Established the Millville Waterfront Vision and identified potential projects.
▪ Initiated the Derelict Vessel Initiative.
▪ Facilitated Improvement Assistance Program.
Downtown CRA
▪ Produced Panama City Lighthouse design.
▪ Facilitated Gulf Coast State College Intern Partnership.
▪ Implemented Economic Garden Pilot Project.
St. Andrews CRA
▪ Completed Lion Plaza Project.
▪ Demolished trailer park.
▪ Initiated Bayview Avenue Boardwalk and Signage Enhancement Project.
▪ Revitalized a community garden.
Downtown North CRA
▪ Directed the Cleanup and Abatement (CAP) program.
▪ Administered the sidewalk improvement program.
▪ Managed the Jenks Corridor improvements.
▪ Oversaw Ink Trax winning a Florida Redevelopment Association Award.
▪ Began planning the Cultural Heritage Tourism District.
▪ Welcomed A.D. Harris Learning Village with Florida Department of Health - Bay County.
▪ Initiated Glenwood MLK Recreation Center Splash Pad Project.
Millville CRA
▪ Designated Waterfronts Florida Program community.
▪ Facilitated biannual community clean up days.
2014-2015
Downtown CRA
▪ Covered licensing fees to local businesses through the Music Matters initiative.
▪ Placed benches on Harrison Avenue.
St. Andrews CRA
▪ Performed public improvement projects parking facilities.
▪ Improved general public areas like the Bayview Avenue parking lot, lighting, CRA storage building, and museum signage.
Downtown North CRA
▪ Acquired eatery and nightclub.
▪ Special Economic Development Grant- Bay Medical/Sacred Heart System.
▪ Provided Residential Improvement Assistance to those who cannot financially afford to participate in the current Residential Grant program.
Millville CRA
▪ Replaced storm water pipe and dredging a section of the Watson Bayou Waterfront.
▪ Purchased and maintained planters outside of businesses on 3rd Street.
▪ Installed local veteran home ramp.
2016-2017
Downtown CRA
▪ Demolished site on 209 East 6th Street.
▪ Facilitated ramp installation grant.
▪ Completed Phase 1 of the Harrison Avenue Beautification Project.
St. Andrews CRA
▪ Improved Bayview Avenue parking and landscaping.
▪ Installed three lighting fixtures on 10th Street.
▪ Improved Oaks by the Bay landscaping and irrigation.
Downtown North CRA
▪ Demolished shotgun homes for future single-family homes and retail.
▪ Partnered with Boys and Girls Club of Bay County to provide swim lessons and aquatic safety.
Millville CRA
▪ Leveled out areas identified by Public Works and proposed kayak launch and the removal of kudzu.
2018-2019 2020-2021
Downtown CRA
▪ Facilitated grants for commercial places for exterior improvements.
St. Andrews CRA
▪ Established three-point action plan for CRA plan update.
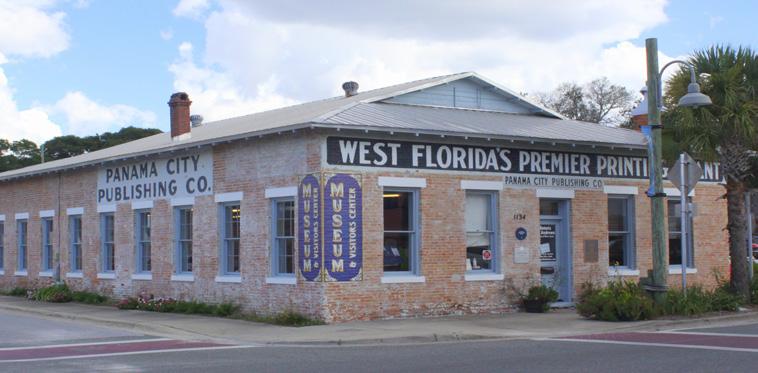
▪ Panama City Publishing Co. Museum was approved for the National Register.
▪ Administered the Pedestrian Safety Campaign.
▪ Encouraged residents to reclaim their yard/gardens through the Yard of the Month program.
▪ Facilitated community cleanups.
Downtown North CRA
▪ Relocated the AfricanAmerican Cultural Center (AACC) to the A.D. Harris Learning Village.
▪ Expanded CRA boundary.
▪ Initiated Owner-Occupied Rehabilitation Program and Housing Assistance Program
▪ Grants for commercial places for replacements.
Millville CRA
▪ Completed the Millville Waterfront Park: Kayak Launch.
▪ Facilitated grants for commercial places for exterior improvements.
Downtown CRA
▪ Downtown Post Office received funds for new landscaping.
▪ License Plate Recognition Program was initiated.
▪ Hosted Employ Bay Youth.
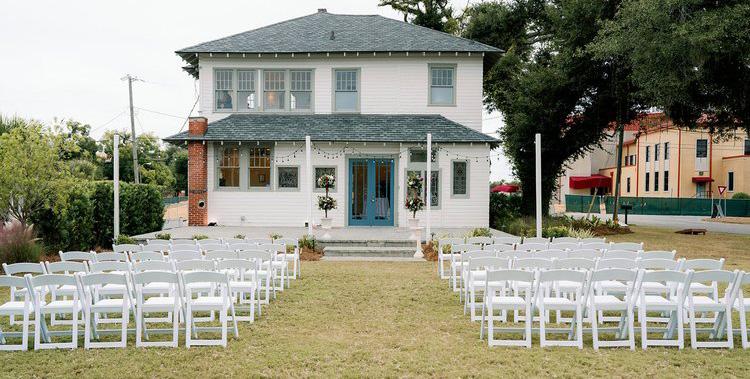
▪ Contributed to the restoration of the historic Sapp House.
St. Andrews CRA
▪ Replaced the publishing company museum flooring and roof.
▪ Continued Waterfront Partnership program.
▪ Upgraded the Azalea Ct. Apartments with energy efficient windows and HVAC systems
Downtown North CRA
▪ Entered into an MOU for $100,000 with Public Works for the purpose of implementing the Cleanup and Abatement program.
▪ Partnered with World Changers to develop a youth volunteer opportunity.
Millville CRA
▪ Supported residential and commercial improvements through grants.
2022
Downtown CRA
▪ Began the distribution of “No Trespass Decals” to reduce crime and protect small businesses.
▪ Continued the Harrison Streetscape Project.
St. Andrews CRA
▪ Added the Panama City Publishing Co Museum to the National Register of Historic Places.
▪ Received FDOT Beautification Grant for landscaping.
Downtown North CRA
▪ Expanded the CRA Boundary.
▪ Opened the A.D. Harris Gym.
Millville CRA
▪ Completed renovations to Kraft Field.
2023 2024
Downtown CRA
▪ Continued the Harrison Streetscape Project.
St. Andrews CRA
▪ Applied for USDA Farmers Market Grant and approved grant matching funds.
▪ Began parking lot improvements in collaboration with the city.
▪ Acquired a vacant lot that will be used by FDOT for a new storm water facility.
Downtown North CRA
▪ Continued renovations to the A.D. Harris Gym.
▪ Continued work on the streetscaping projects funded by the FDOT Beautification Grant.
Millville CRA
▪ Initiated plans to renovate Millville Waterfront Park.
▪ Collaborated with the City to initiate a project to revitalize Daffin Park.
Downtown CRA
▪ Created walk thru for public access between parking and Harrison Avenue.
▪ Continued McKenzie Park renovations and installed accessible public restroom facilities to McKenzie Park.
▪ Created a crosswalk, connecting Gateway Park to McKenzie Park.
St. Andrews CRA
▪ Continued the Beck Avenue landscaping and beautification.
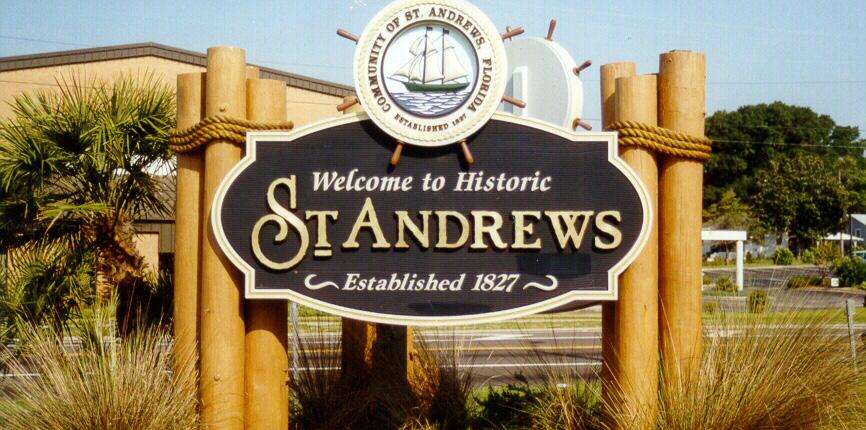
▪ Completed the St. Andrews Gateway Signage Project.
Downtown North CRA
▪ Launched a Glenwood community revitalization project at East 9th Court in collaboration with World Changers.
▪ Completed the MLK Jr. Blvd Median Beautification project which enhanced the medians with Florida-friendly plants, boosting visual appeal and environmental sustainability.
▪ Contracted Retail Strategies to attract commercial interest
Millville CRA
▪ Commenced construction on the Millville Waterfront Park.
▪ Began Daffin Park renovations
▪ Collaborated with FDOT for the Millville U.S. Hwy. 98 Beautification project.
CURRENT AGENCY PROJECTS AND PROGRAMS
Current Projects
In addition to the completed projects described on the prior pages, there are currently 10 ongoing projects across the Agency’s 4 CRAs. At the time this 2025 Plan was produced, these projects include:
Downtown CRA
▪ McKenzie Park Improvement Projects: The Downtown CRA is updating McKenzie Park with new benches, swings, and trash cans. Estimated completion is June 2025.
▪ Downtown Breezeway Project: The renovation of the building at 447 Harrison Avenue into a commercial space will address parking issues. The project is expected to finish in October 2026.
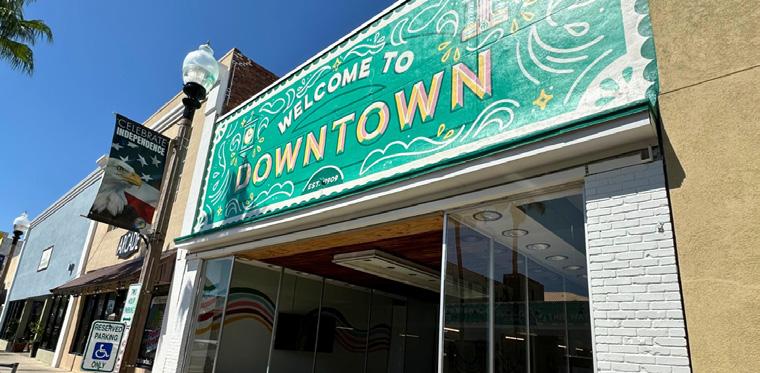
▪ Downtown Wayfinding Signage Project: Aiming to enhance the Downtown CRA’s identity by creating new streetscape elements that align with the historic Martin Theatre. Estimated completion for 2025.
St. Andrews CRA
▪ Beck Avenue FDOT Beautification: With partnership funding from the FDOT, the St. Andrews CRA is in the process of landscaping and beautifying Beck Avenue. The project is expected to be completed by December 2025.
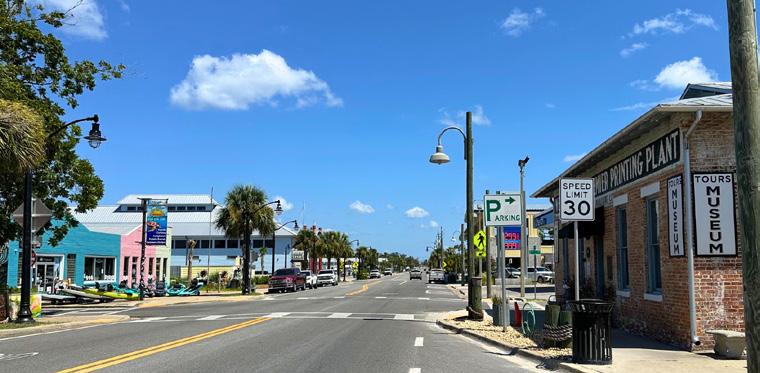
▪ Bayview Boardwalk Project: Funded by a grant from The Rebuild Florida Hometown Revitalization Program, the Agency aims to restore and expand the wooden boardwalk over the bay to attract businesses. Funding is dedicated through 2026.
Downtown North CRA
▪ 15th Street and MLK Boulevard Development Opportunity: The Downtown North CRA, in partnership with Retail Strategies, aims to attract new commercial interest, including a grocery store, to create a mixed-use commercial and residential area in the Glennwood community. Expected completion is October 2027.
Millville CRA
▪ Millville Waterfront Park: This three-phase project includes plans for a fully developed park with an amphitheater for community events. Phase I is expected to be completed by September 2025.
▪ Daffin Park: The Daffin Park Renovation, a collaborative project, includes major clubhouse renovations, a new football field and basketball court, and upgrades to the youth baseball field. Estimated completion is February 2025.
▪ Millville U.S. Hwy. 98 FDOT Beautification Project: Focused on enhancing the
gateway entrance to the Millville CRA, this project adds Florida-friendly landscaping to both sides of the road. Estimated completion is June 2025.
▪ Millville Gateway Sign Project: The project’s goal is to renovate the existing gateway sign, which has weathered over time. The project is anticipated to be completed by October 2025.
Current Programs
The Agency’s current development opportunities to encourage business investment include:
1. Tax Increment Rebate Program– Offers financial incentives through tax increment rebates for eligible developments like mixed-use projects, affordable housing, and environmental cleanups to encourage private sector redevelopment and public improvement.
2. Request for Proposals/ Invitations to BID– The Agency invites community and partners to bid on projects based on cost and other factors, focusing on outcomes, performance, and deliverables. Additionally, the Agency conducts a formal solicitation process for contractors to bid on projects within the CRA.
MAJOR THEMES
Throughout the formation of this 2025 Plan, as well as during the multi-year planning and community input process previously described, eight overarching major goals were identified. These goals are to be used as a planning framework for the Agency to help enhance the character and to embrace opportunities that exist within each CRA. These major goals include:

Support Economic Growth, Job Creation, and Small Business Development
The goal to support economic growth, job creation, and small business development includes diversifying jobs, incentivizing public and private investments in businesses, and offering educational opportunities to increase job preparedness.
Actions to achieve this goal and its objectives include formulating economic development strategies while maintaining the appropriate administrative, financial, and programmatic measures. This goal encourages the Agency’s four CRAs to continuously update plans and increase community-wide partnerships throughout the process. Since the Agency is divided into four areas with unique needs and communities, addressing issues that span across each CRA benefits from coordination, transparency, and a willingness to work together.
Additionally, it includes collaboration with private and public sector entities such
as investors and educational institutions. Finally, it focuses on investing in infrastructure to improve the physical features of businesses, increasing their attractiveness for mixed-use, commercial, and economic development and redevelopment. Ultimately, this goal aims to make each CRA a more competitive place to live and work.

Expand Housing Opportunities
The goal to expand housing includes incentivizing the development of various housing types, including multi-family housing and infill housing. While supporting the development of new housing, the goal also includes the objective to increase the availability of workforce and affordable housing. Additionally, it aims to redevelop or improve existing housing, improving the community’s image and furthering attractiveness to residents and investors. Finally, the goal includes strategies for residents to access homeownership opportunities, including financial literacy and life management skills, increasing community stabilization.


Improve Infrastructure, Mobility, and Connectivity
The vision for improving infrastructure, mobility, and connectivity focuses on the community’s infrastructure providing a safe and adequate multi-modal transportation system. Objectives include
upgrading current infrastructure such as modernizing roads, expanding pedestrian connections and bike lanes, and addressing parking issues. Additionally, the goals and objectives include improving regional connectivity through upgraded public transportation options. Improving infrastructure so that residents have access to a variety of transportation options increases activity throughout the community, supports businesses, and increases safety and security throughout the CRA areas.

Enhance Public Safety
The goals to enhance public safety is a two-fold approach throughout the CRA areas. First, the goal aims to expand safety programmatic efforts throughout the CRA by collaborating with local law enforcement and community entities. These efforts aims to reduce community-wide crime and increase residential awareness and proactive efforts. Second, the goal aims to improve infrastructure throughout the CRA areas to promote safe, walkable environments.

Activate and Improve the Waterfront
Following Hurricane Michael in 2018, securing the City, its coastline, and infrastructure remains a top priority. The goal to activate and improve the waterfront builds on existing plans and intends to guide
development by formulating how to find a balance between industrial, recreational, and natural restoration areas along the St. Andrew Bay, Massalina Bayou, Watson Bayou, and Lake Ware. This involves addressing current infrastructure problems and conditions, such as implementing a flood resilient shoreline, addressing stormwater runoffs, and restoring existing wetlands and floodplains.
However, concurrent with the goals to improve waterfronts throughout the CRA areas, the goal also aims to open the waterfront by adding and improving public access points. These include implementing boat and kayak launches, improving public trails, and incentivizing business development along the shorelines to support the creation of mixed-use public spaces with connections to the waterfront.

Enhance Open Spaces, Recreation, and Community Spaces
To enhance open spaces, recreation, and community spaces, the goal is to enhance the aesthetics of the CRA areas to create a sense of place and identity. The objectives include improving streetscapes and developing cohesive wayfinding and signage that will create a community identity and clear boundaries for each CRA area. Additionally, the goal envisions improved infrastructure around open spaces, such as parks, plazas and civic spaces, to increase public activity
throughout the community. Finally, the goal aims to increase recreational opportunities through improved facilities and by connecting recreation spaces to schools, community centers, and accessible transportation options.

Promote Cultural Identity and History
The goal to promote cultural identity and history derives from the CRA areas’ rich history that has contributed to shaping the identity of the City. Objectives within this goal include pursuing the designation of properties on the National Historic Registration and working with community organizations to preserve and maintain historic sites. Combining investment in the history of the CRA areas, while also investing in public art and cohesive wayfinding throughout the community, will support a community and cultural identity and a sense of pride among the residents.

Advance Sustainability and Resilience
Advancing sustainability and resiliency throughout the community became of key importance following Hurricane Michael in 2018. The City’s vitality and quality of life are closely tied to the surrounding water and natural ecosystems, prompting improvements in infrastructure. Objectives within this goal include supporting resilient building practices
and the installation of tree canopies and solar lighting in open spaces to reduce heat and energy consumption. These improvements also further efforts toward making public facilities and service infrastructure safe, secure, and capable of withstanding future disasters while continuously serving the community.
These major goals are further customized for each CRA and are detailed with specific objectives and action strategies in the following sections of this 2025 Plan. These guidelines help the Agency evaluate projects and programs for potential implementation, addressing the opportunities and challenges faced by the four CRAs.
REQUIRED CONTENTS OF THE REDEVELOPMENT PLAN
Review of Current Conditions and Programs
The 2025 Panama City CRA Redevelopment District Plan Amendments and Comprehensive Updates (“2025 Plan”), implemented through a series of resolutions and ordinances, describe a variety of needs, programs, or projects to be funded primarily through incremental receipts of property tax revenue throughout the four discrete CRAs. Such receipts have generally been referred to as tax increment financing (“TIF”).
This 2025 Plan recaps the progress made since the Agency was created in 1983, updating certain infrastructure considerations and much of the socio-economic data to reaffirm the major priorities and focus of the initiatives. The analysis and input of stakeholder or interested parties, along with an extensive series of studies from the City, have helped to shape the policy context in which the Agency will implement redevelopment programs and strategies within the CRAs.
This 2025 Plan contemplates investments in infrastructure and other related activities, but also places an emphasis on roads and pedestrian connectivity, parks, public spaces, housing, public safety, and a variety of other investments.
To emphasize, a Community Redevelopment Plan is a framework for future action. It is not a detailed blueprint with a list of stipulations and provisions, although those will likely follow as the framework
is implemented. Since it is a framework, this 2025 Plan should not be confused as a master development plan with a discrete set of directives and specifications. In its entirety, this 2025 Plan, formally recorded and adopted, codifies a commitment to thoughtful principles and objectives. This comes together as a broadly outlined series of strategic initiatives or general commitments. Viewed as a means of establishing priorities within a certain context, the most effective community Redevelopment Plan is flexible, but coordinated, to achieve a defined mission.
The Redevelopment Act, allowing the creation of redevelopment areas and the agency responsible for the Redevelopment Plan, along with the local government’s adopted comprehensive plan, serve as external controls and assurances that the undertakings identified in Community Redevelopment Plans remain in conformance with their broader mission. In effect, only activities identified in a Community Redevelopment Plan can benefit from a Redevelopment Trust Fund’s TIF dollars.
Required Contents of a Redevelopment Plan
In a very simply described and summarized process for adopting and amending a Community Redevelopment Plan, it is necessary that a local government and its Agency evaluate the physical, social and economic attributes of a specific area and make a determination
that it satisfies multiple criteria. This determination would allow the local government to adopt and implement a redevelopment strategy and utilize all the powers available to its Agency.
Toward assuring compliance with the larger mission and responsibilities of the Agency and an implementable Redevelopment Plan, the Redevelopment Act outlines both the contents of the legally sufficient Redevelopment Plan and the general framework for its adoption. The particulars of this 2025 Plan and the means by which it will be adopted, like their predecessors, adhere to the current legal requirements.
The Redevelopment Act, according to Chapter 163.360, Florida Statutes, prescribes that all adopted plans:
a. Conform to the comprehensive plan for the county or municipality as prepared by the local planning agency under the Community Planning Act.
b. Be sufficiently complete to indicate such land acquisition, demolition and removal of structures, redevelopment, improvements, and rehabilitation as may be proposed to be carried out in the CRA; zoning and planning changes, if any; land uses; maximum densities; and building requirements.
c. Provide for the development of affordable housing in the area or state the reasons for not addressing in the plan the
development of affordable housing in the area. The county, municipality, or Community Redevelopment Agency shall coordinate with each housing authority or other affordable housing entities functioning within the geographic boundaries of the redevelopment area, concerning the development of affordable housing in the area.
The Redevelopment Act, according to Chapter 163.362, Florida Statutes, prescribes that each community Redevelopment Plan shall:
i. Contain a legal description of the boundaries of the CRA and the reasons for establishing such boundaries shown in the plan.
ii. Show by diagram and in general terms:
a. The approximate amount of open space to be provided and the street layout.
b. Limitations on the type, size, height, number, and
proposed use of buildings.
c. The approximate number of dwelling units.
d. Such property as is intended for use as public parks, recreation areas, streets, public utilities, and public improvements of any nature.
iii. If the redevelopment area contains low or moderate income housing, contain a neighborhood impact element which describes in detail the impact of the redevelopment upon the residents of the redevelopment area and the surrounding areas in terms of relocation, traffic circulation, environmental quality, availability of community facilities and services, effect on school population, and other matters affecting the physical and social quality of the neighborhood.
iv. Identify specifically any publicly funded capital projects to be undertaken within the CRA.
v. Contain adequate safeguards that the work of redevelopment will be carried out pursuant to the plan.
vi. Provide for the retention of controls and the establishment of any restrictions or covenants running with land sold or leased for private use for such periods of time and under such conditions as the governing body deems necessary to effectuate the purposes of this part.
vii. Provide assurances that there will be replacement housing for the relocation of persons temporarily or permanently displaced from housing facilities within the CRA.
viii. Provide an element of residential use in the redevelopment area if such use exists in the area prior to the adoption of the plan or if the plan is intended to remedy a shortage of housing affordable to residents of low or moderate income, including the elderly, or if the plan is not intended to remedy such shortage, the reasons therefore.
ix. Contain a detailed statement of the projected costs of the redevelopment, including the amount to be expended on publicly funded capital projects in the CRA and any indebtedness of the CRA, the county, or the municipality proposed to be incurred for such redevelopment if such indebtedness is to be repaid with increment revenues.
x. Provide a time certain for completing all redevelopment financed by increment
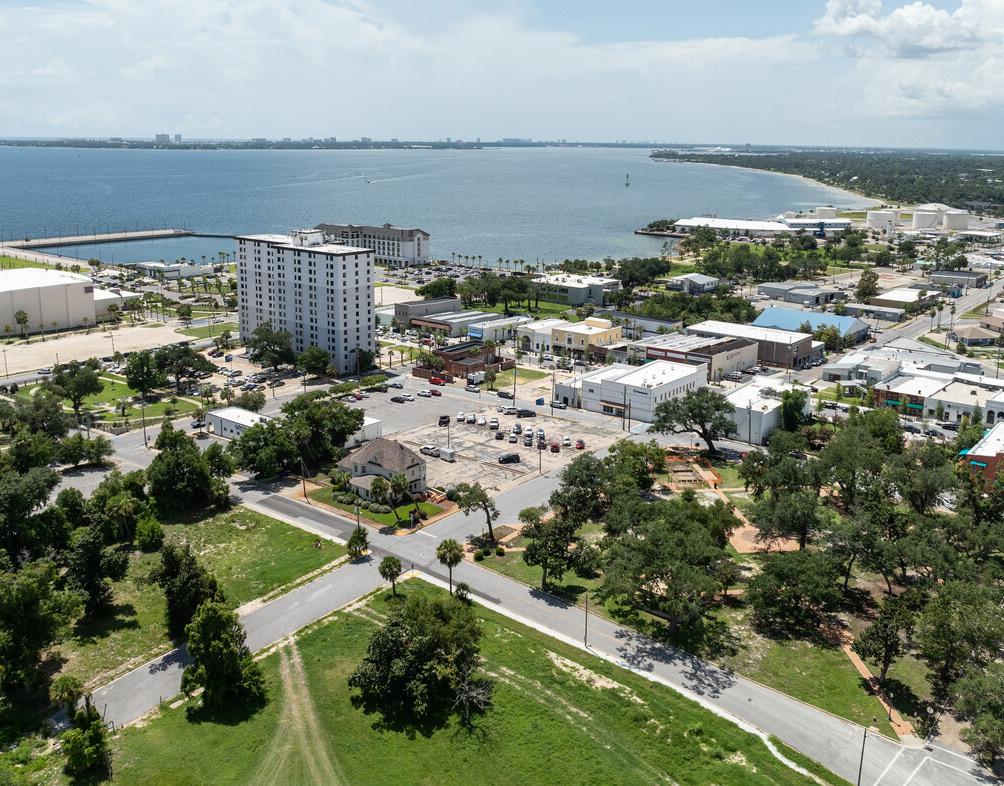
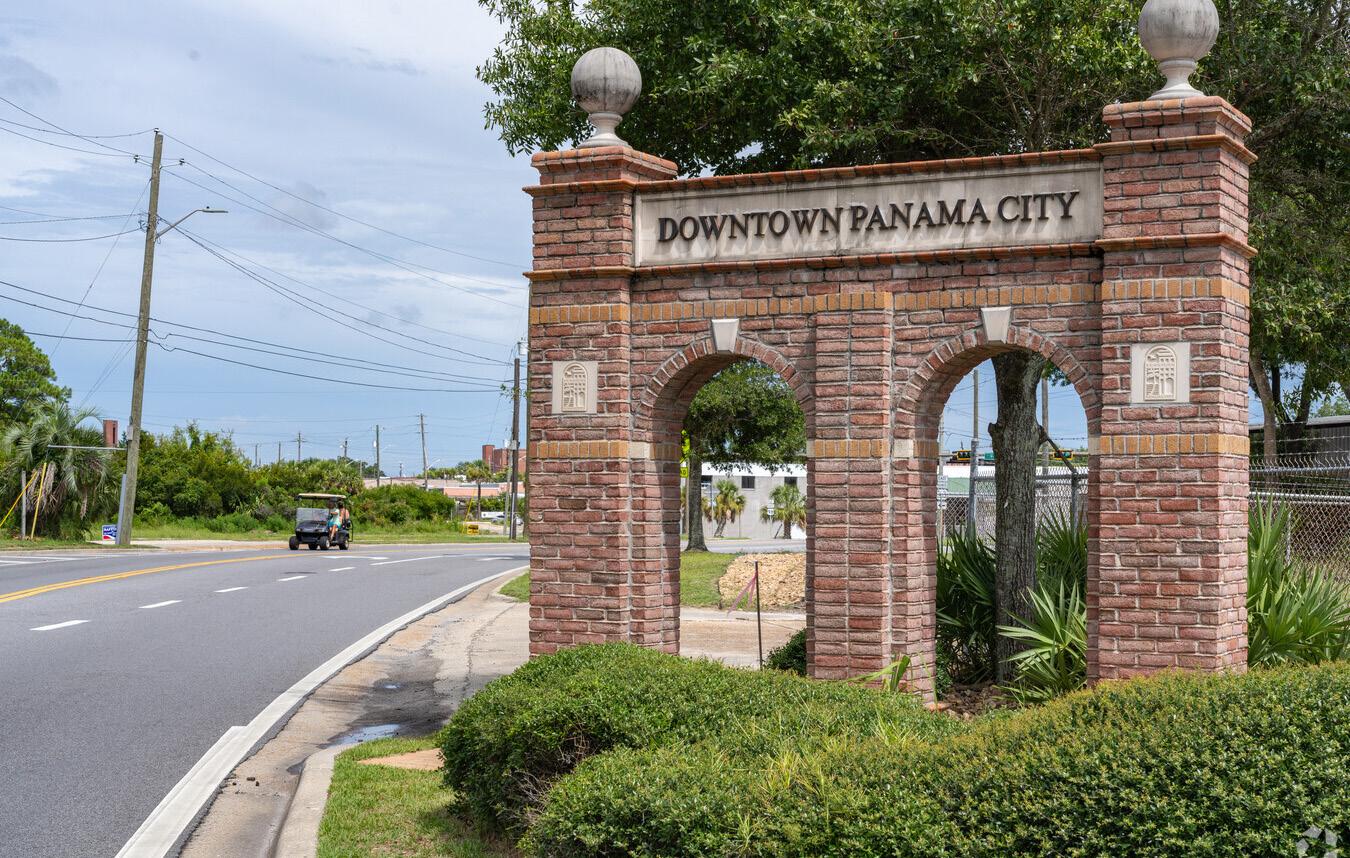
DOWNTOWN PANAMA CITY | SOURCE HOMES.COM
revenues. Such time certain shall occur no later than 30 years after the fiscal year in which the plan is approved, adopted, or amended pursuant to s. 163.361(1). However, for any agency created after July 1, 2002, the time certain for completing all redevelopment financed by increment revenues must occur within 40 years after the fiscal year in which the plan is approved or adopted.
This 2025 Plan documents required compliance with Chapter 163.
To fulfill its many responsibilities, the Agency has many powers. These enumerated powers acknowledge the status of the Agency as a functioning governmental entity but one that stands apart in its supportive mission of the redevelopment area. These enumerated powers tend to reaffirm the Agency’s specific duties in the pursuit of development and redevelopment while separating its financial obligations from those of the associated general government.
These enumerated powers for the Agency as outlined in Chapter 163.370 include, but are not limited to:
a. To make and execute contracts and other instruments necessary or convenient to the exercise of its powers under this part.
b. To disseminate slum clearance and community redevelopment information.
c. To undertake and carry out community redevelopment and related activities within the CRA.
d. To provide, or to arrange or contract for, the furnishing or repair by any person or agency, public or private, of services, privileges, works, streets, roads, public utilities, or other facilities for or in connection with a community redevelopment; to install, construct, and reconstruct streets, utilities, parks, playgrounds, and other public improvements; and to agree to any conditions that it deems reasonable and appropriate which are attached to federal financial assistance and imposed pursuant to federal law relating to the determination of prevailing salaries or wages or compliance with labor standards, in the undertaking or carrying out of a community redevelopment and related activities, and to include in any contract let in connection with such redevelopment and related activities or provisions to fulfill such of the conditions as it deems reasonable and appropriate.
Although any associated generalpurpose government and any of its property owners or citizens, as taxpayers, are intended to benefit from the activities of the Agency, they are insulated from its financial obligations.
Further, certain operating and capital expenses of an associated general government, are not to be absorbed through funds flowing into the Agency's Redevelopment Trust Fund. Despite that insularity, the Agency exports many financial and community benefits well beyond its legally defined boundaries.
Authorized Redevelopment Trust Fund Expenditures
After approval of a Community Redevelopment Plan, there may be established for each Agency created under F.S. Chapter 163.356 a redevelopment trust fund. Funds allocated to and deposited into this fund shall be used by the Agency to finance or refinance any community redevelopment it undertakes pursuant to the approved Community Redevelopment Plan.
In October 2019, the Redevelopment Act of 1969, was amended to further clarify authorized expenditures of the redevelopment trust fund. One of the most significant components of the 2019 amendment is that funds cannot be spent on promotional and marketing activities.
Per F.S. Chapter 163.387(6), effective October 1, 2019, moneys in the redevelopment trust fund may be expended for undertakings of a CRA as described in the Community Redevelopment Plan only pursuant to an annual budget adopted by the board of commissioners of the CRA and only for the purposes specified.
The annual budget of a CRA may provide for payment of the following expenses:
1. Administrative and overhead expenses directly or indirectly necessary to implement a Community Redevelopment Plan adopted by the agency.
2. Expenses of redevelopment planning, surveys, and financial analysis, including the reimbursement of the governing body or the CRA for such expenses incurred before
the Redevelopment Plan was approved and adopted.
3. The acquisition of real property in the redevelopment area.
4. The clearance and preparation of any redevelopment area for redevelopment and relocation of site occupants within or outside the CRA as provided in s. 163.370.
5. The repayment of principal and interest or any redemption premium for loans, advances, bonds, bond anticipation notes, and any other form of indebtedness.
6. All expenses incidental to or connected with the issuance, sale, redemption, retirement, or purchase of bonds, bond anticipation notes, or other form of indebtedness, including funding of any reserve, redemption, or other fund or account provided for in the ordinance or resolution authorizing such bonds, notes, or other form of indebtedness.
7. The development of affordable housing within the CRA.
8. The development of community policing innovations.
9. Expenses that are necessary to exercise the powers granted under s. 163.370, as delegated under s. 163.358.
Consistency with the Comprehensive Plan
This 2025 Plan was prepared in a manner consistent with the Goals, Objectives, and Policies of the Bay County Comprehensive Plan and City of Panama City Comprehensive Plan.
Community Redevelopment Plan Approval
In accordance with Chapter 163.360, Florida Statutes, the Agency shall submit any Redevelopment Plan it recommends for approval together with its written recommendations, to the local planning agency and then to the City Commission of the City of Panama City.
The Agency Governing Board (City Commission) shall hold a public hearing on this 2025 Plan after public notice thereof by publication in a newspaper having a general circulation in the area of operation of the County or City. The notice shall describe the time, date, place, and purpose of the hearing, identify generally the Redevelopment Area (CRA) covered by this 2025 Plan, and outline the general scope of the Redevelopment Plan under consideration.
Following such a hearing, the governing board may approve the Redevelopment Plan therefore if it finds that:
1. A feasible method exists for the location of families who will be displaced from the CRAs in decent, safe, and sanitary dwelling accommodations within their means and without undue hardship to such families;
2. The Redevelopment Plan conforms to the overall Goals, Policies and Objectives of the City’s adopted Comprehensive Plan;
3. The Redevelopment Plan provides due consideration to the provision of adequate park and recreational
areas and facilities that may be desirable for neighborhood improvement, with special consideration for the health, safety, and welfare of children residing in the general vicinity of the site covered by the Redevelopment Plan; and,
4. The Redevelopment Plan will afford for the maximum opportunity, consistent with the sound needs of the county or municipality as a whole, for the rehabilitation or redevelopment of the CRA by private enterprise.
Upon approval by the City Commission of the City of Panama City, this 2025 Plan shall be considered in full force and effect for the respective Community Redevelopment Areas and the City may then cause the Agency to carry out the implementation of this 2025 Plan.
Duration of the Redevelopment Plan
The provisions of this 2025 Plan shall remain in effect and serve as a guide for the Agency’s future redevelopment activities in the Community Redevelopment Areas through 2044.
Amendment to the Redevelopment Plan
This 2025 Plan may be modified, changed, or amended at any time by the City Commission of the City of Panama City upon the recommendation of the Agency, provided that if modified, changed, or amended after the lease or sale of property by the Agency, the modification may be consented to by the developer or redevelopers of such property or the developers or redevelopers' successors in interest affected
by the proposed modification. This means that if a developer acquired title, lease rights, or other form of development agreement from the Agency to a piece of property within a Community Redevelopment Area with the intention of developing it in conformance with the Redevelopment Plan, any amendment substantially affecting the developer's ability to proceed with that development may require the developer's consent.
When considering modification, changes, or amendments in the Redevelopment Plan, the Agency will take into consideration the recommendations of interested area property owners, residents, and business operators. Any proposed minor changes in the Redevelopment Plan will be communicated by the agency responsible to the affected property owner(s).
Safeguards and Retention of Control
The Redevelopment Plan is the guiding document for future development, redevelopment, as well as ancillary programs, projects and activities in and for the Community Redevelopment Areas. To assure that redevelopment will take place in conformance with the projects, goals, and policies expressed in this plan, the Agency will utilize the regulatory devices, instruments, and systems used by the City to permit development and redevelopment within its jurisdiction.
These regulatory devices, etc., include, but are not limited to, the adopted Comprehensive Plan, the Land Development Code, the Zoning Code, adopted
design guidelines, performance standards, and City-authorized development review, permitting, and approval processes.
In accordance with Florida Statutes and Interlocal Agreements with Bay County Government, the City Commission of the City of Panama City retains the vested authority and responsibility for:
1. The power to grant final approval to Community Redevelopment Plans and modification.
2. The power to authorize issuance of revenue bonds as set forth in Section 163.385, F.S.
3. The power to approve the acquisition, demolition, removal, or disposal of property as provided in Section 163.370(3), F.S., and the power to assume the responsibility to bear loss as provided in Section 163.370(3), F.S.
The Agency Governing Board shall be fully subject to the Florida Sunshine Law and will convene, at publicly noticed meetings, on a regularly scheduled meeting basis in a public forum. The Agency shall file an Annual Report with the State Auditor General’s Office and with the City. This report shall contain a programmatic overview of the activities of the Agency as allowed by the Redevelopment Plan.
In addition to an annual audit as part of the City’s Annual Comprehensive Financial Report (“ACFR”), the Agency shall also be audited annually by a third-party auditor. The findings of the audit shall be presented at a meeting of the Agency and such findings shall be forwarded to the State Auditor General’s Office by March
31 of each year for the preceding year, which shall run from October 1 through September 30.
The ACFR and third-party audit of the Agency shall be provided to the City and the City Clerk’s Office for public review and availability. Legal notice in a newspaper of general circulation shall be provided to inform the public of the availability for review of the Annual Audit Report and the Annual Report. The Agency shall provide adequate safeguards to ensure that all leases, deeds, contracts, agreements, and declarations of restrictions relative to any real property conveyed shall contain restrictions and/or covenants to run with the land and its uses, or other provisions necessary to carry out the goals and objectives of the Redevelopment Plan.
Severability
Should any provision, section, subsection, sentence, clause, or phrase of this 2025 Plan be declared by the courts to be invalid or unconstitutional, such declaration shall not affect validity of the remaining portion or portions of this 2025 Plan.
[ THIS PAGE INTENTIONALLY LEFT BLANK ]
DOWNTOWN COMMUNITY REDEVELOPMENT AREA
CHAPTER TWO:
DOWNTOWN COMMUNITY REDEVELOPMENT AREA
DOWNTOWN CRA SUMMARY
Overview
The Downtown Community Redevelopment Area (“Downtown CRA”) was established in 1984 with the objective to revitalize the City's downtown. The Downtown CRA is approximately 145 acres, nestled between the Massalina Bayou to the east and St. Andrews Bay to the southwest, as illustrated in the following map (see Figure 2). The Downtown CRA shares its northern boundary with the Downtown North CRA.
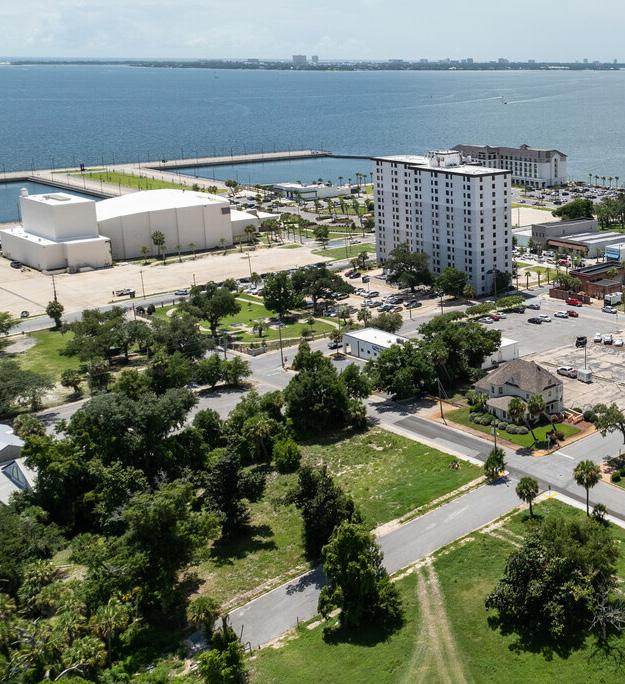
The Downtown CRA encompasses several key landmarks, including the Panama City Marina, which serves as a hub for boating and waterfront activities. The Panama City City Hall, Bay County Clerk of Courts, and the Martin Theater, are also situated within the Downtown CRA.
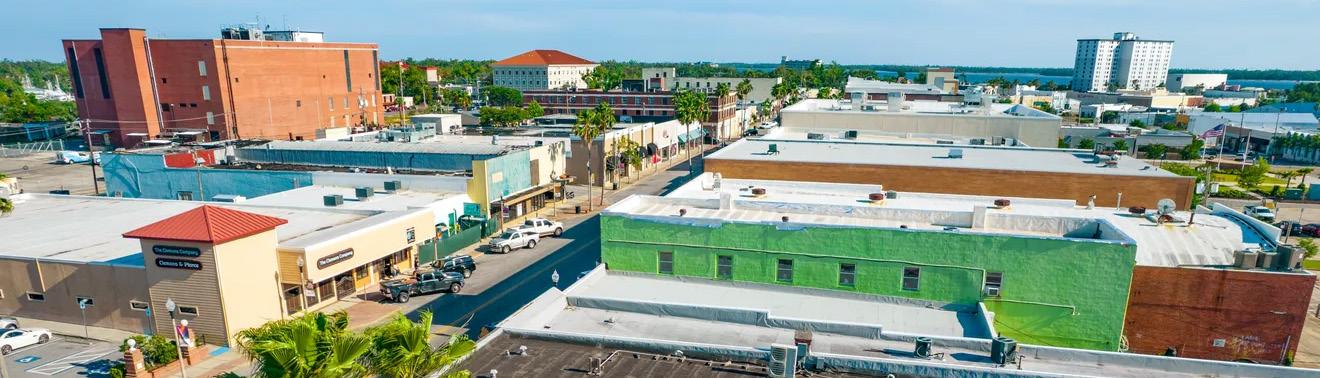
In addition, the Downtown CRA also contains the Downtown Improvement Board (“DIB”), which was established in 1973. In addition, major roadways within the Downtown CRA include U.S. Hwy. 98, with Harrison Avenue considered the main street, featuring several local businesses.
History
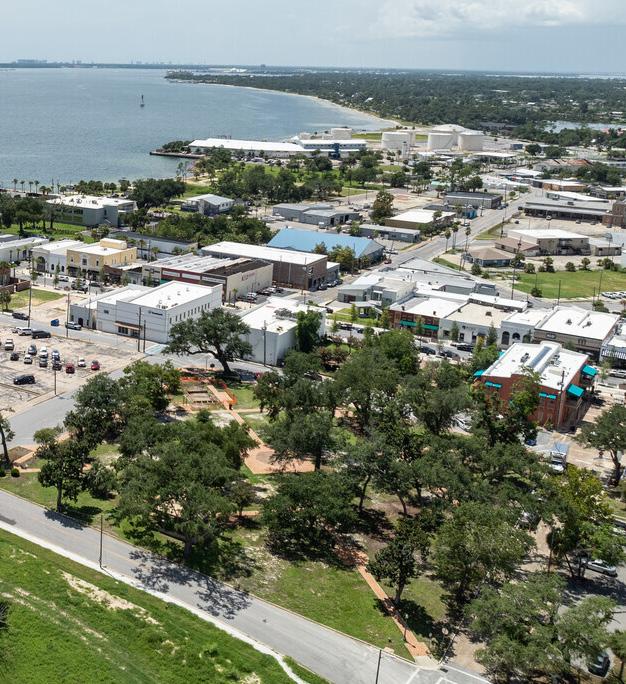
In the 1800s, the area now known as the Downtown CRA was referred to as “Harrison” and “Park Resort.” When Panama City was established, the downtown area became the focal point due to its advantageous waterfront location, which facilitated commercial shipping, along with the presence of the local jail and post office. The heart of the downtown area was centered around McKenzie Park, giving rise to the name “Park Resort.”
In the early 1900s, businesses began to extend north from the coast and centralized into the downtown area, gradually forming the city. Between 1900 and 1910, schools and churches were established, the economy flourished, and more residents moved to the area. The following decade saw the establishment of banks, a public library, city lighting, phone service, and an ice plant. In 1913, Panama City became the seat of the newly formed Bay County.
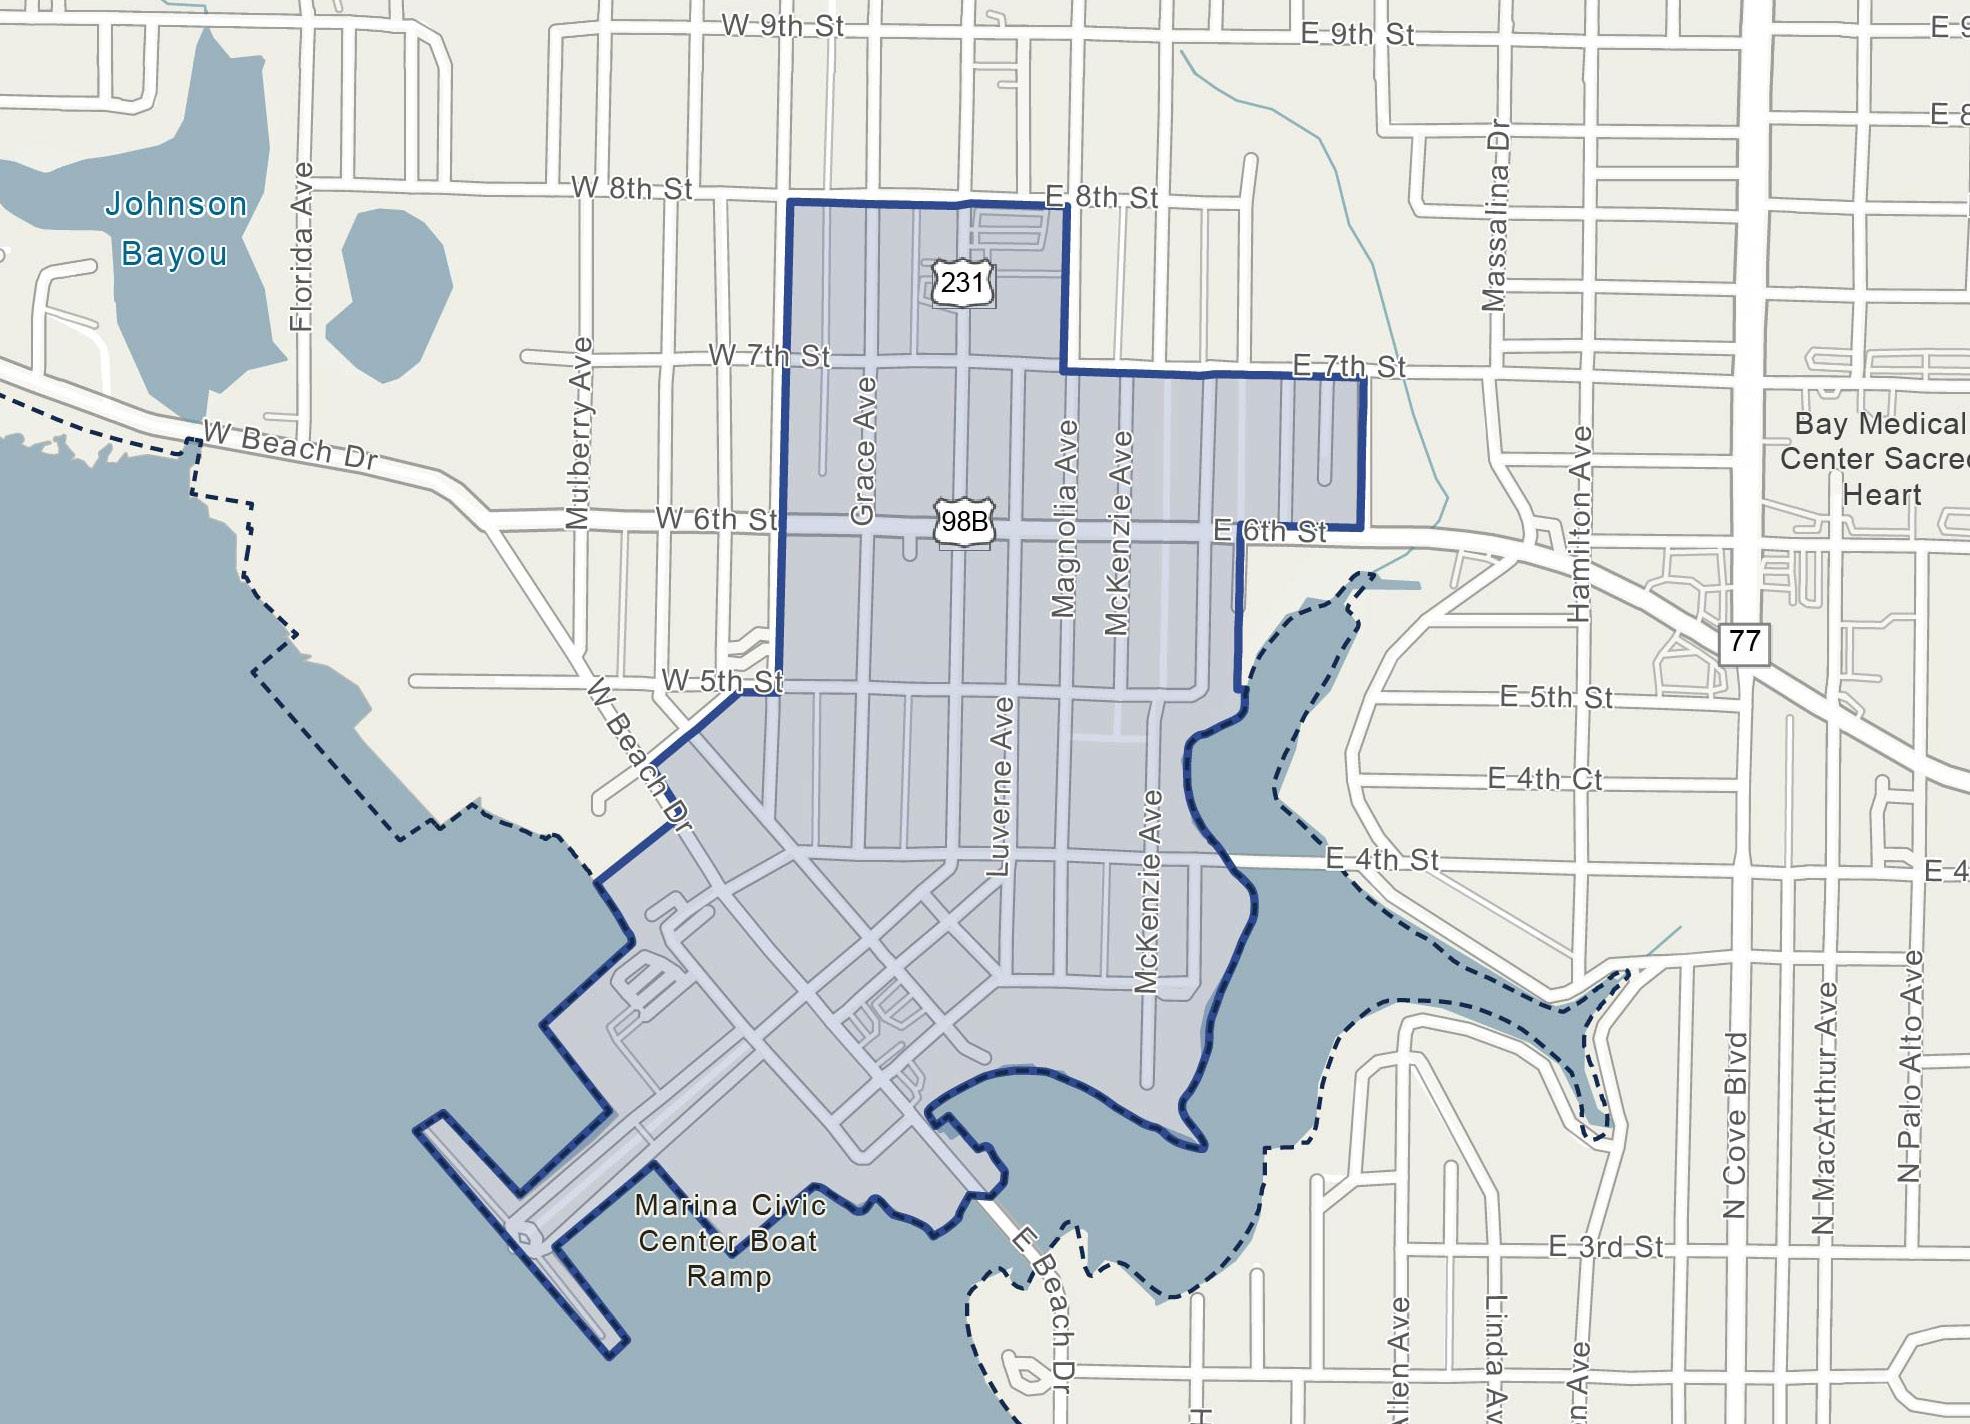
Figure 2. DOWNTOWN C r A MAP
The Panama City Community Redevelopment Agency (“Agency”) was established in 1983, followed by the adoption of the Downtown CRA Redevelopment Plan in 1984 to serve as the foundational guide for the future economic and physical redevelopment of the Downtown CRA. The plan aimed to enhance the urban design quality of the area, encourage retail and small business activity on primary streets, and broaden the range of community events to activate the downtown and strengthen its tourism appeal. This plan outlined the vision for the next 20 years.
In 2012, the plan was updated to address recent issues of Slum and Blight, prepare for new development, and recover from the 2008–2009 economic crisis, which had constrained investors and construction project startups. This updated plan has since guided projects in the Downtown CRA, helping it grow into a core business and community hub.
The 1984 and 2012 Downtown CRA Redevelopment Plan(s) have served as the primary guides for the Agency’s activities within the Downtown CRA to-date.
In response to Hurricane Michael in 2018, Panama City produced the Neighborhood Plan, featuring a strategic vision of three neighborhoods within the City, as well as the Strategic Vision for Panama City’s Historic Downtown and its Waterfront Plan. These plans addressed issues of urban sprawl and recovery. The Strategic Vision Plan highlighted the difficulty for downtown businesses to generate a critical mass of activity before the storm, a problem that became more pronounced afterward. It also addressed potential development opportunities regarding the Marina, along with infrastructure and connectivity within the Downtown CRA.
The major priorities, objectives, and goals outlined in both plans have served as crucial guidelines for the Downtown CRA’s goals and objectives in this 2025 Plan, as detailed in the following pages.
Past Accomplishments
Since establishing the Downtown CRA in 1984, the Agency has been instrumental in driving economic growth, bolstering small businesses, and improving infrastructure.
Through transformative projects, innovative initiatives, enhanced safety measures, and community engagement, the Agency has been a key force in the revitalization and advancement of the Downtown CRA.
Notable accomplishments within the Downtown CRA related to the Agency’s past priorities and guiding principles include:
Safety and Security
▪ Enhanced police presence through a collaborative effort with the Downtown CRA.
Key and Vital Infrastructure
▪ Supported transformative projects, such as updating the Marina Master Plan and the Panama City Lighthouse.
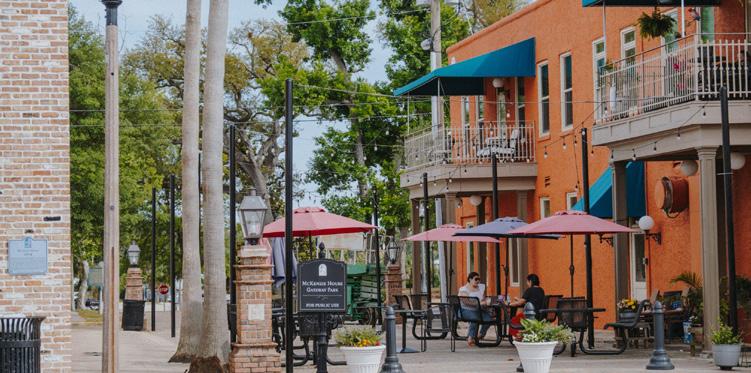
▪ Maintained a commitment to improving streetscapes and park spaces, including renovating McKenzie Park, enhancing sidewalks, and creating inviting public areas.
▪ Focused on improving accessibility and mobility through initiatives like the Harrison Avenue Streetscape Project, which enhances transportation infrastructure, ensures safe pedestrian pathways, and promotes multi-modal connectivity.
DOWNTOWN PANAMA CITY | SOURCE HOMES.COM
▪ Undertook revitalization efforts through demolitions and subsequent land improvements.
Economy
▪ Supported new and small businesses by providing training tools like the Economic Garden Pilot Project and funding assistance through initiatives like Music Matters, which covers licensing fees for local businesses to host performances by publishers and songwriters.
▪ Addressed employment challenges caused by COVID-19 by launching the Employ Bay Youth (“EBY”) initiative.
▪ Funded residential and commercial improvements through various grant and incentive programs, acting as catalysts for redevelopment efforts by residents, businesses, and private investors. These programs were particularly helpful in repairing hurricane damage.
Tax Base Trends and Estimates
The Downtown CRA was established in 1984 with a base year taxable value of $26,787,527. Over the 10-year period from 2015 to 2024, total taxable value for all properties within the Downtown CRA grew at a Compound Annual Growth Rate (“CAGR”) of 4.4%, experiencing a 54% increase in taxable value from $58,883,012 in 2015 to $90,827,582 in 2024. Over the same 10-year period, annual Tax Increment Financing (“TIF”) revenue collections within the Downtown CRA has
grown at a CAGR of 9.2%. This represents a 140% increase, rising from $259,384 in 2015 collections to $622,744 in 2024. Since 2015, the total TIF revenues collected in the Downtown CRA have amounted to nearly $2,970,973.
Table 1 below illustrates the 10-year historic collections in total taxable value and total tax increment, as well as the total annual TIF revenues generated by the Downtown CRA, assuming a 95% contribution rate from both the City and County. The table also illustrates projected collections from 2025 through 2044, the Agency’s operational "sunset" date, over 5-year increments.
This 2025 Plan estimates that the Downtown CRA will generate approximately $24,118,000 in TIF revenue to the Agency’s Redevelopment Trust Fund from 2025 through 2044, the Agency’s sunset date. This equates to approximately $1,205,900 in average annual increment over the 20-year projection period.
The TIF revenue may be used for projects and programming that address the goals, objectives, and strategies of this 2025 Plan. For further details on the TIF projections for the Downtown CRA, please refer to Section 6, Financial Analysis of this document.
Collections(4)
Est. $ 3,837,300 2030–2034 Est. $ 5,182,300 2035–2039 Est. $ 6,741,700 2040–2044 Est. $ 8,356,700 20-Year Collections Through Agency’s Sunset(5) $ 24,118,000
Source: Bay County Property Appraiser; Florida Department of Revenue (FDOR); GAI Consultants. Notes: (1) Reflects prior year Final taxable value in tax increment area according to FDOR. (2) Reflects the total taxable value within
(5) Reflects projected 20-year
from 2025 to 2044, the Agency’s sunset date—further detailed in Section 6, Financial Analysis.
TA ble 1. DOWNTOWN C r A TAX i NC re M e NT T re
DOWNTOWN CRA MAP SERIES
Existing Land Use
Existing Land Use designations are classifications of property that describe the current use of the property. The Florida Administrative Code (“FAC”) requires Property Appraisers to classify each parcel of real property to indicate its use as determined for valuation purposes. This use is reflected in the Department of Revenue
(“DOR”) use codes applied to each real property on tax assessment rolls and depicts the existing use of the property.
The map below illustrates the Existing Land Use of parcels within the Downtown CRA, with the legend detailing the distribution of total land acres by Existing Land Use designation (see Figure 3).
Within the Downtown CRA’s approximately 145 total land acres, the predominant Existing Land Use designation is Commercial, which comprises the largest share of total land area at 49.7%, followed by Governmental and Residential land uses with 29.9% and 9.4%, respectively, of this total share.
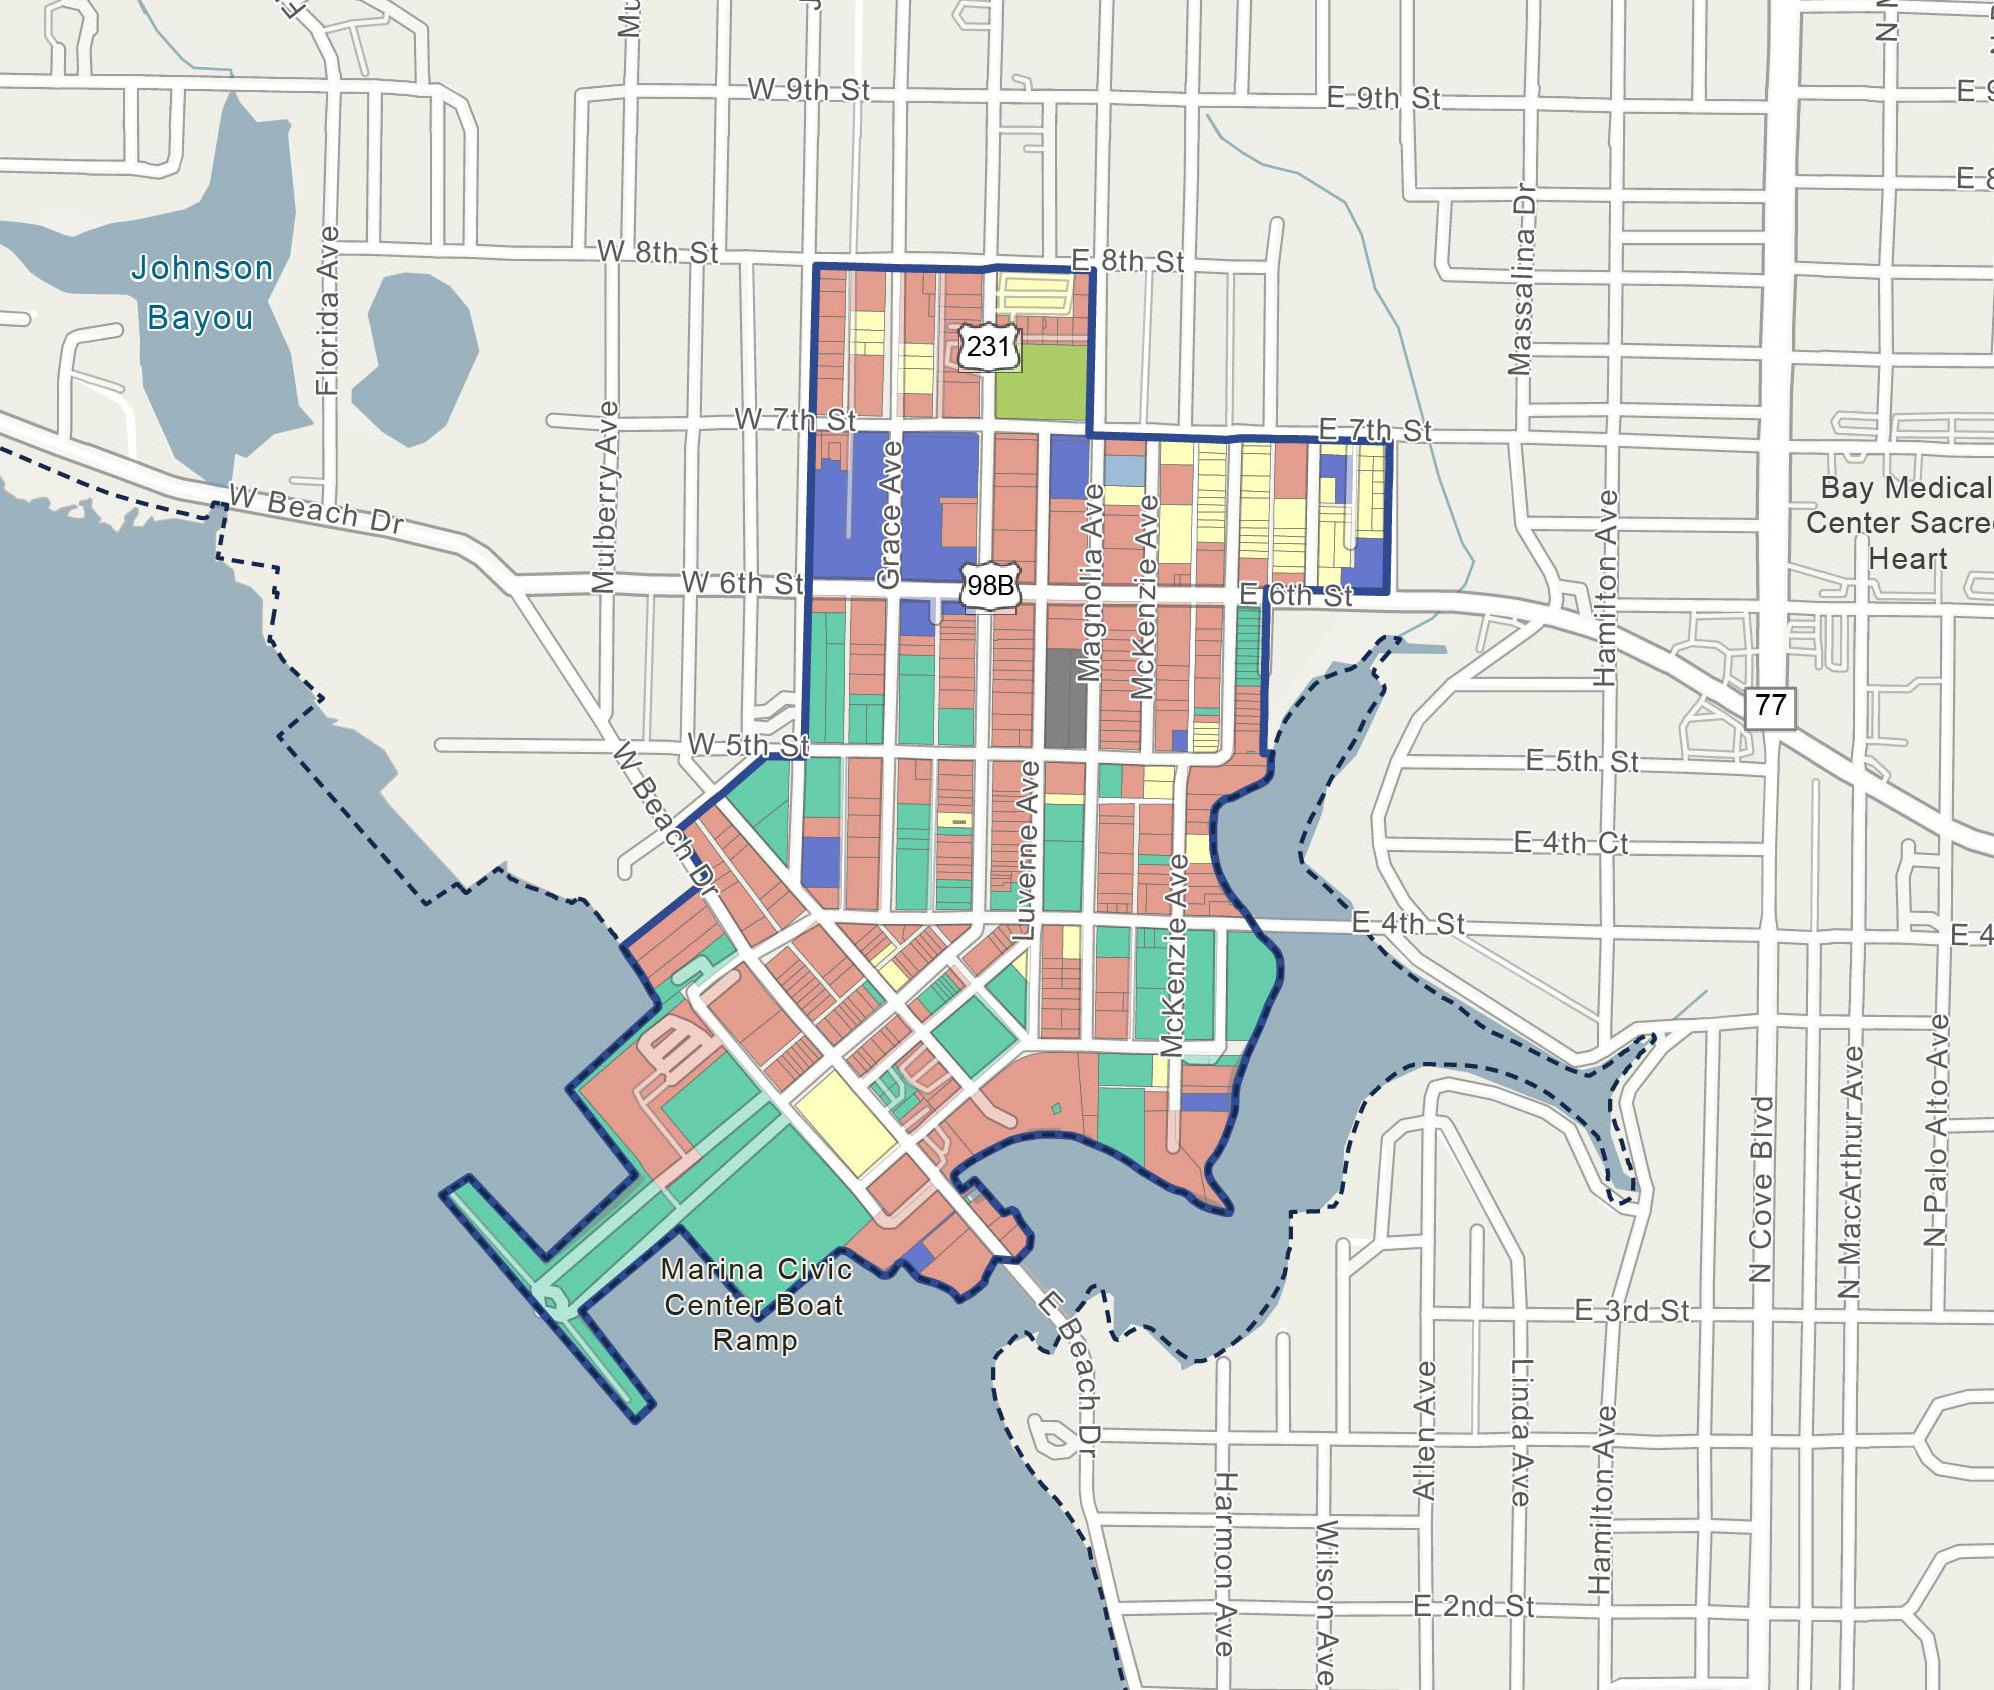
Figure 3. DOWNTOWN
Future Land Use
Future Land Use designations are classifications of property that categorize permissible levels of intensity and/or density of development, in accordance with policies of the City’s Comprehensive Plan and the requirements of the City’s Land Development Regulations.
The map below illustrates the Future Land Use of parcels within the Downtown CRA, with the legend detailing the distribution of total land acres by Future Land Use designation (see Figure 4).
Within the Downtown CRA’s approximately 145 total land acres, the predominant Future
Land Use designation is MixedUse, which comprises the largest share of total land area at 98.9%. The only remaining Future Land Use designation, representing McKenzie Park in downtown, was Recreation with 1.1% of this total share.
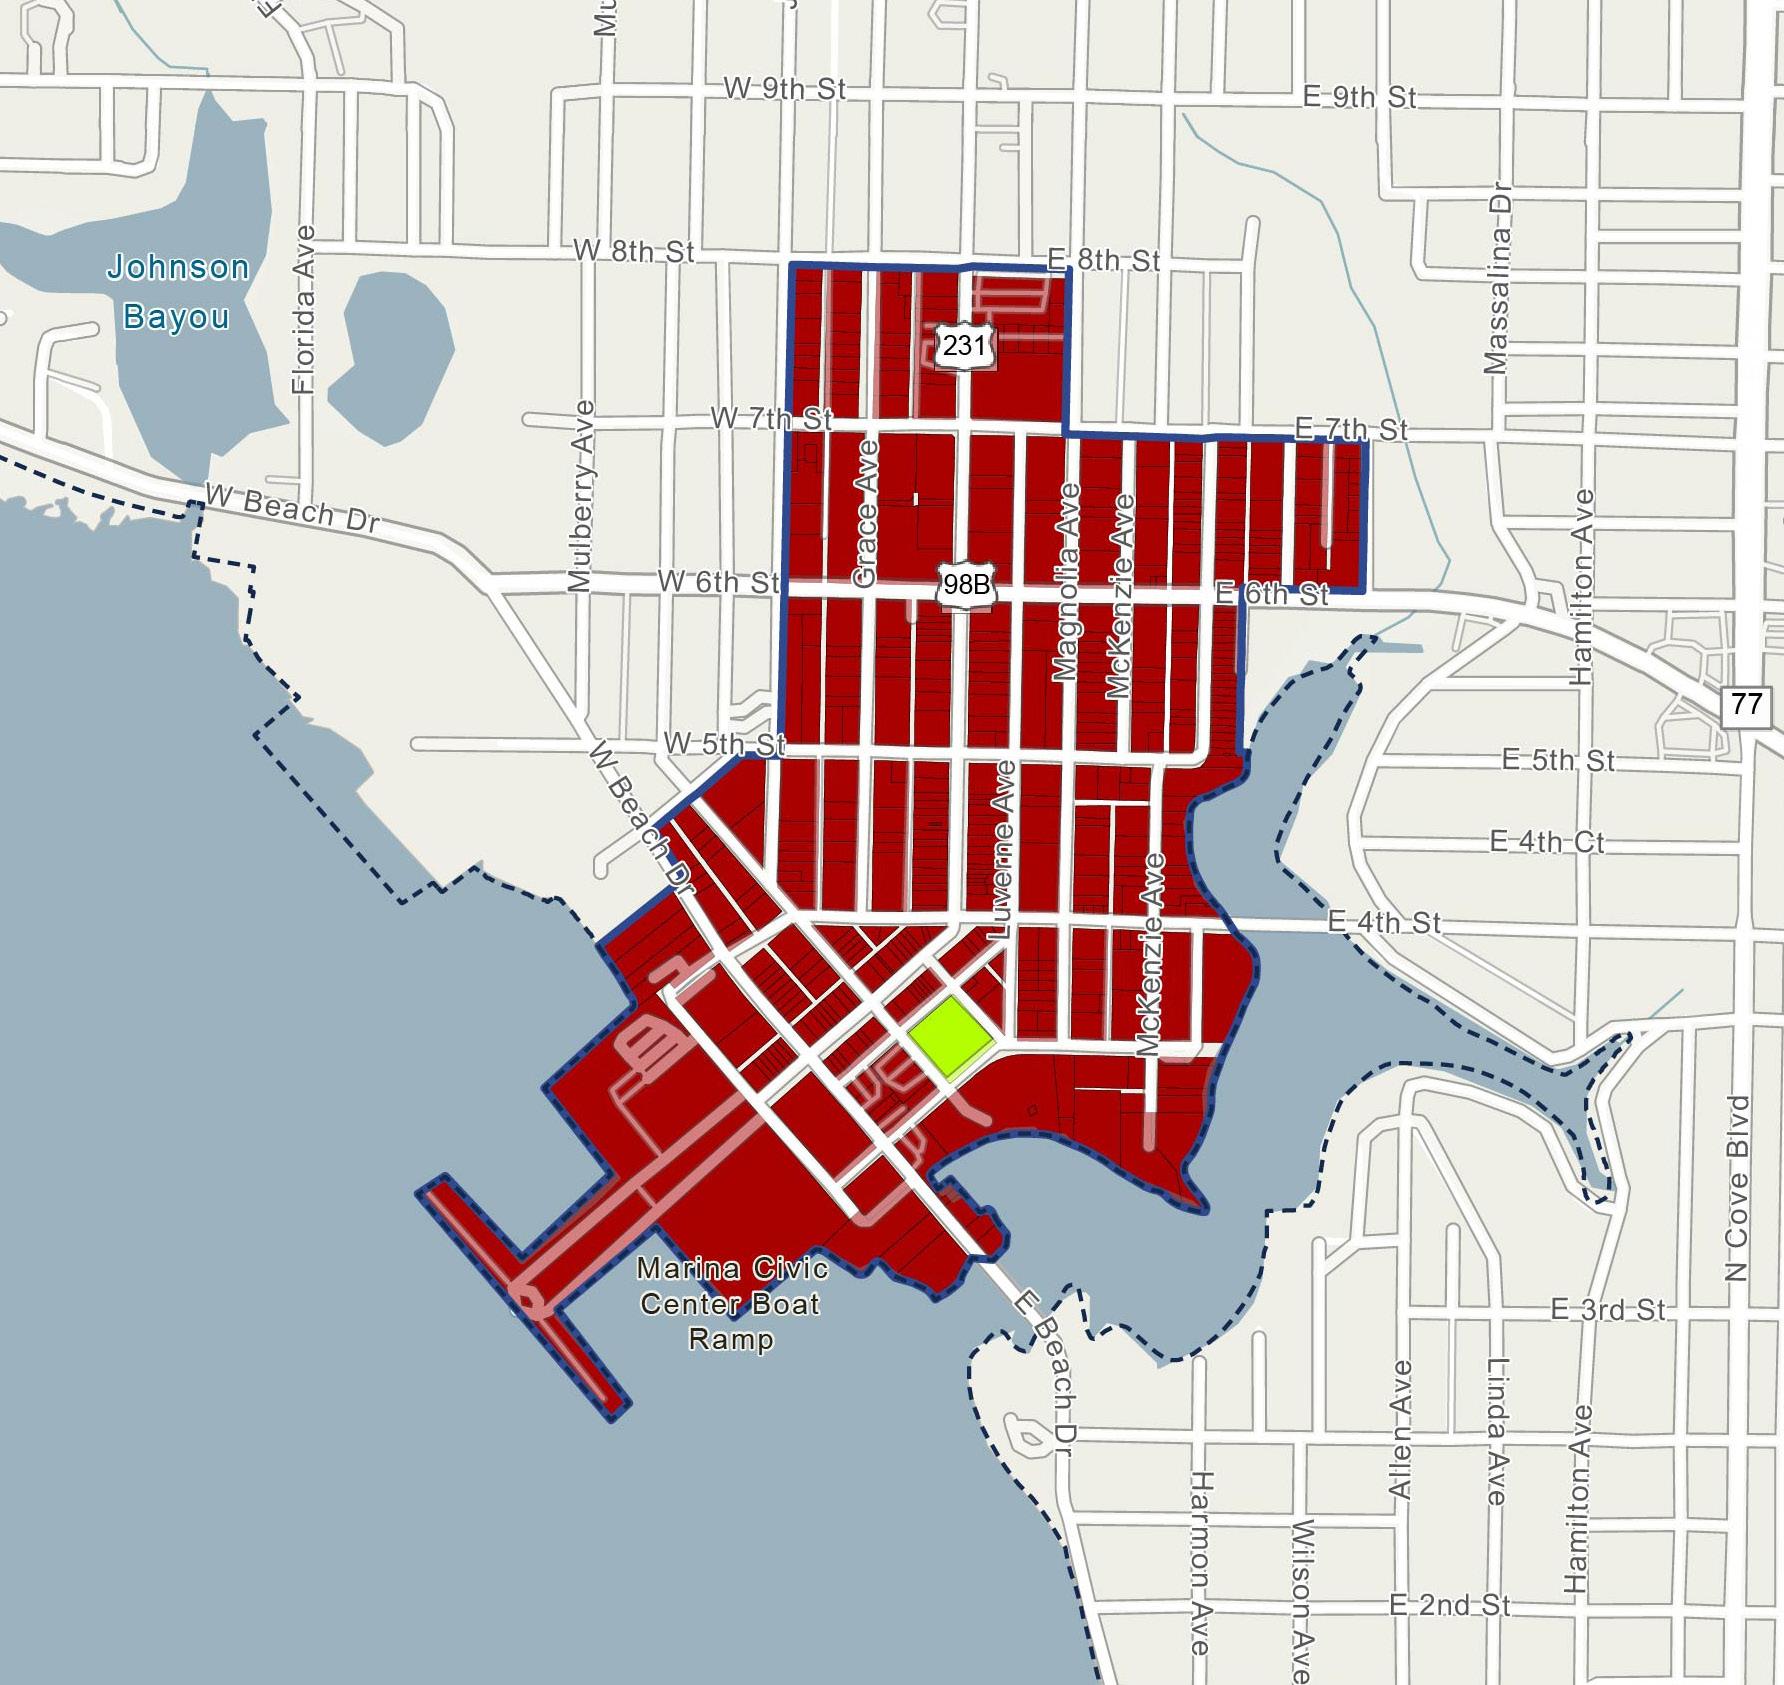
Figure 4. DOWNTOWN C r A F u T ure l AND u S e MAP
Zoning
Zoning classifications describe the permitted uses and development standards applicable to a specific property, in accordance with policies of both the City’s Comprehensive Plan and the requirements of the City’s Land Development Regulations.
The map below illustrates the various Zoning classifications within the Downtown CRA, with the legend detailing the total land acres distribution by Zoning classification (see Figure 5).
Within the Downtown CRA’s approximately 145 total land acres, the predominant Zoning
classification is Downtown District, which comprises the largest share of total land area at 89.3%, followed by Downtown Center and Recreation with 9.7% and 1.0%, respectively, of this total share.
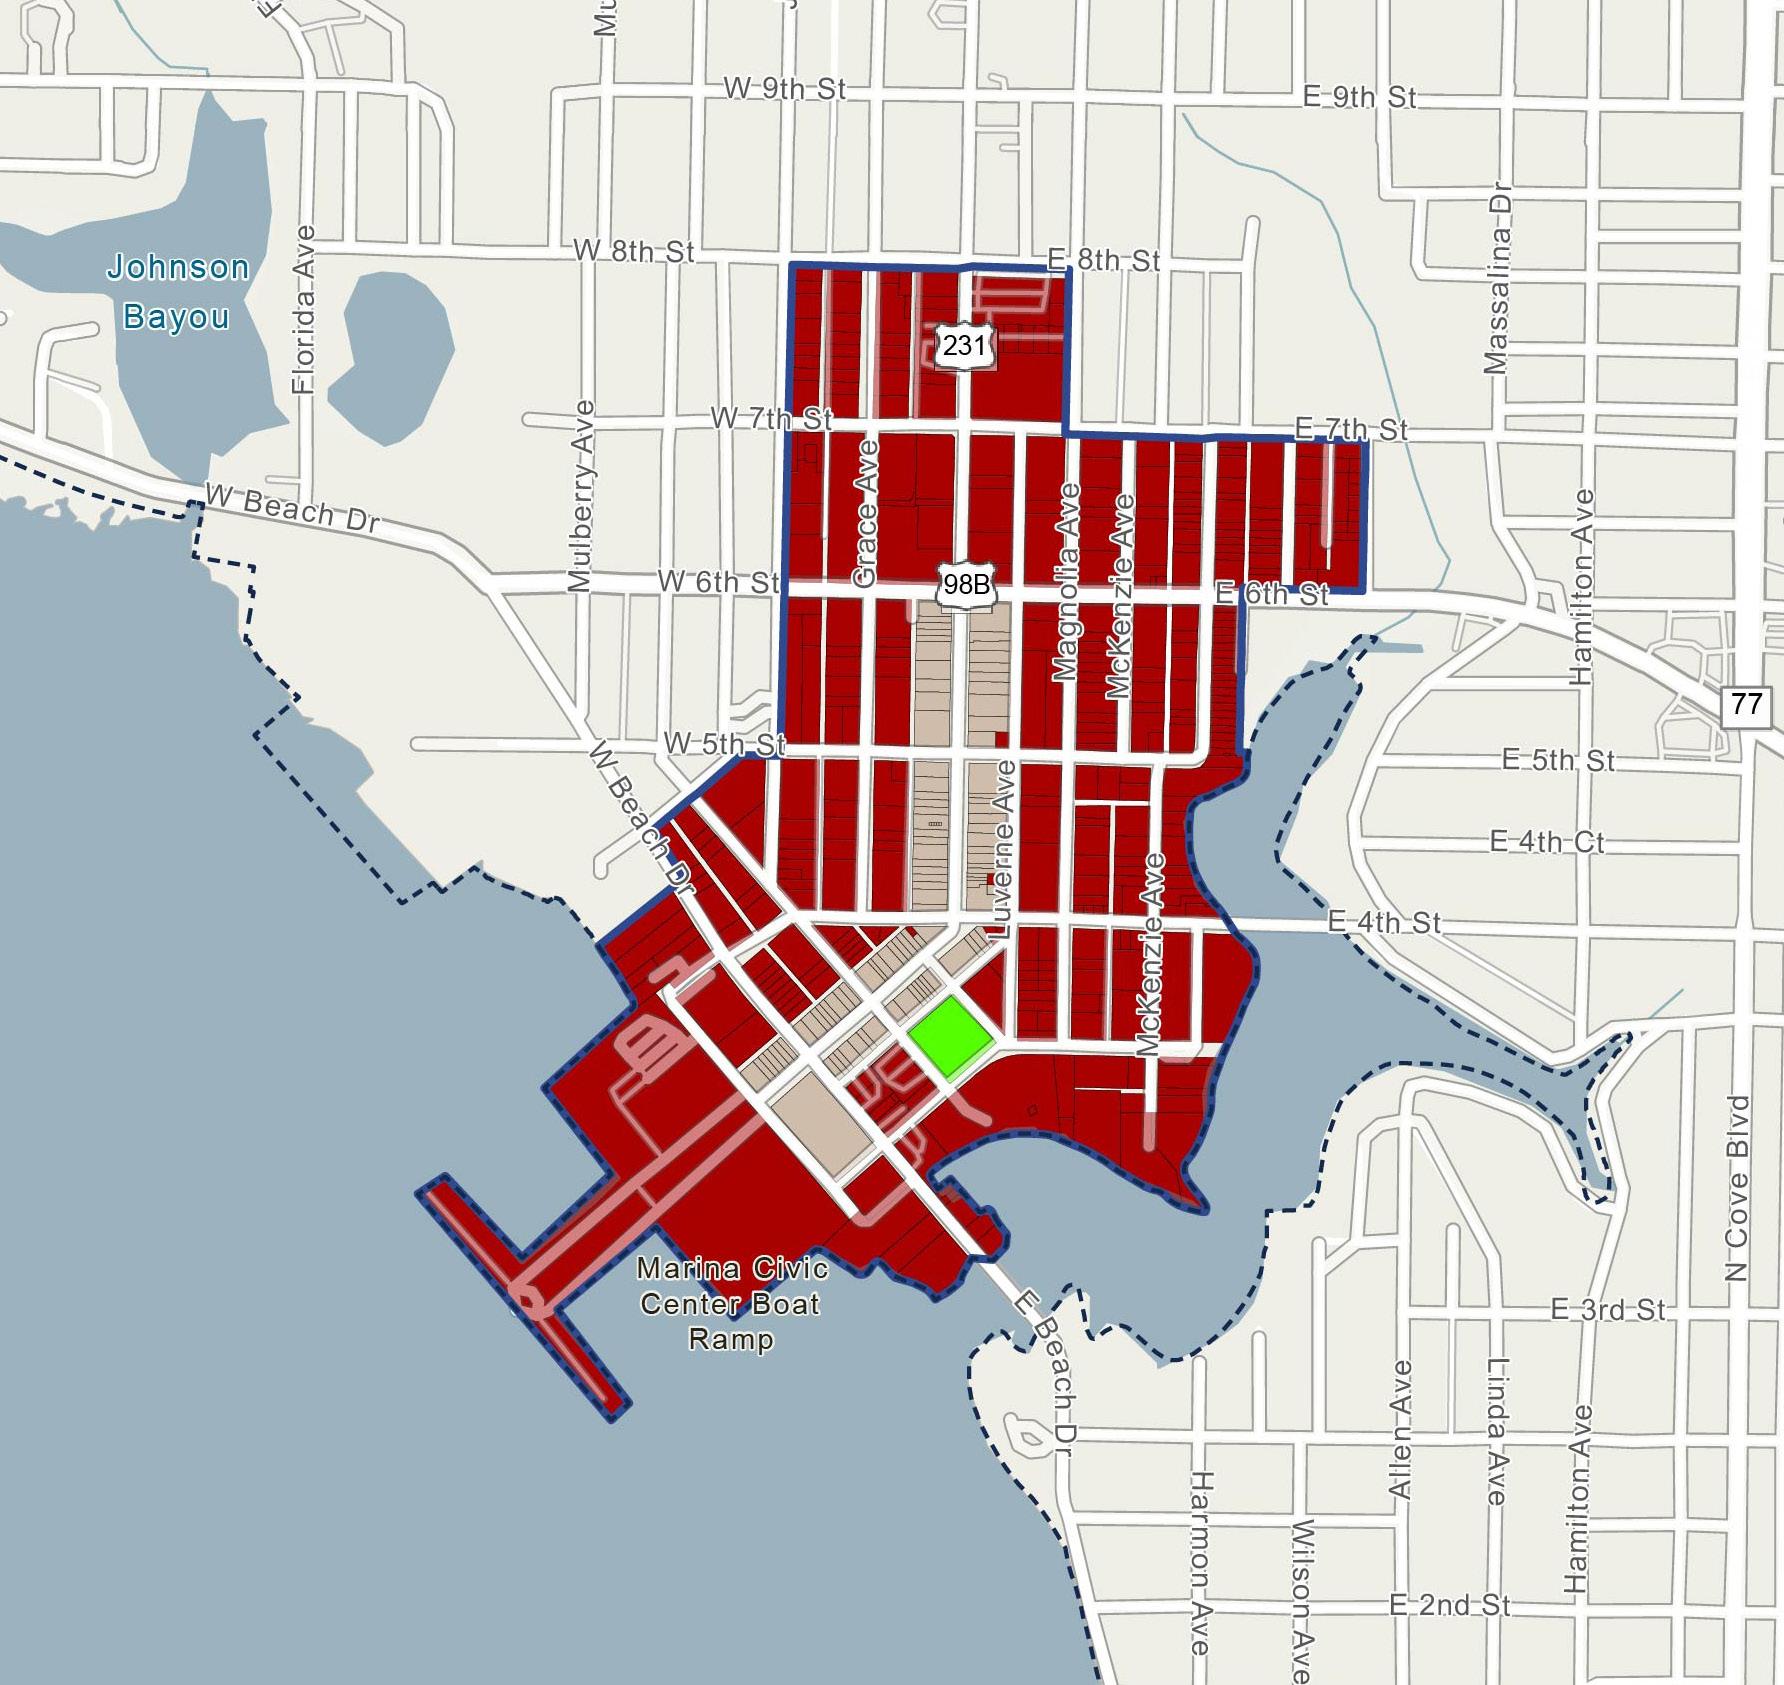
Figure 5. DOWNTOWN C r A ZON i N g MAP
City-Owned Parcels
City-Owned parcels are those located within the Downtown CRA that are owned by the City. These parcels may be utilized by the City and Agency to facilitate the implementation of redevelopment goals and strategies identified within this 2025 Plan.
The map below illustrates the City-Owned parcels within the Downtown CRA, with the legend detailing the distribution of total land acres by DOR classification (see Figure 6).
There are approximately 36 City-Owned parcels within the Downtown CRA, representing 8.1% of the total parcels in the area. Additionally, these 36 CityOwned parcels cover a total of 29 acres, which is approximately 20.0% of the total acreage within the Downtown CRA.
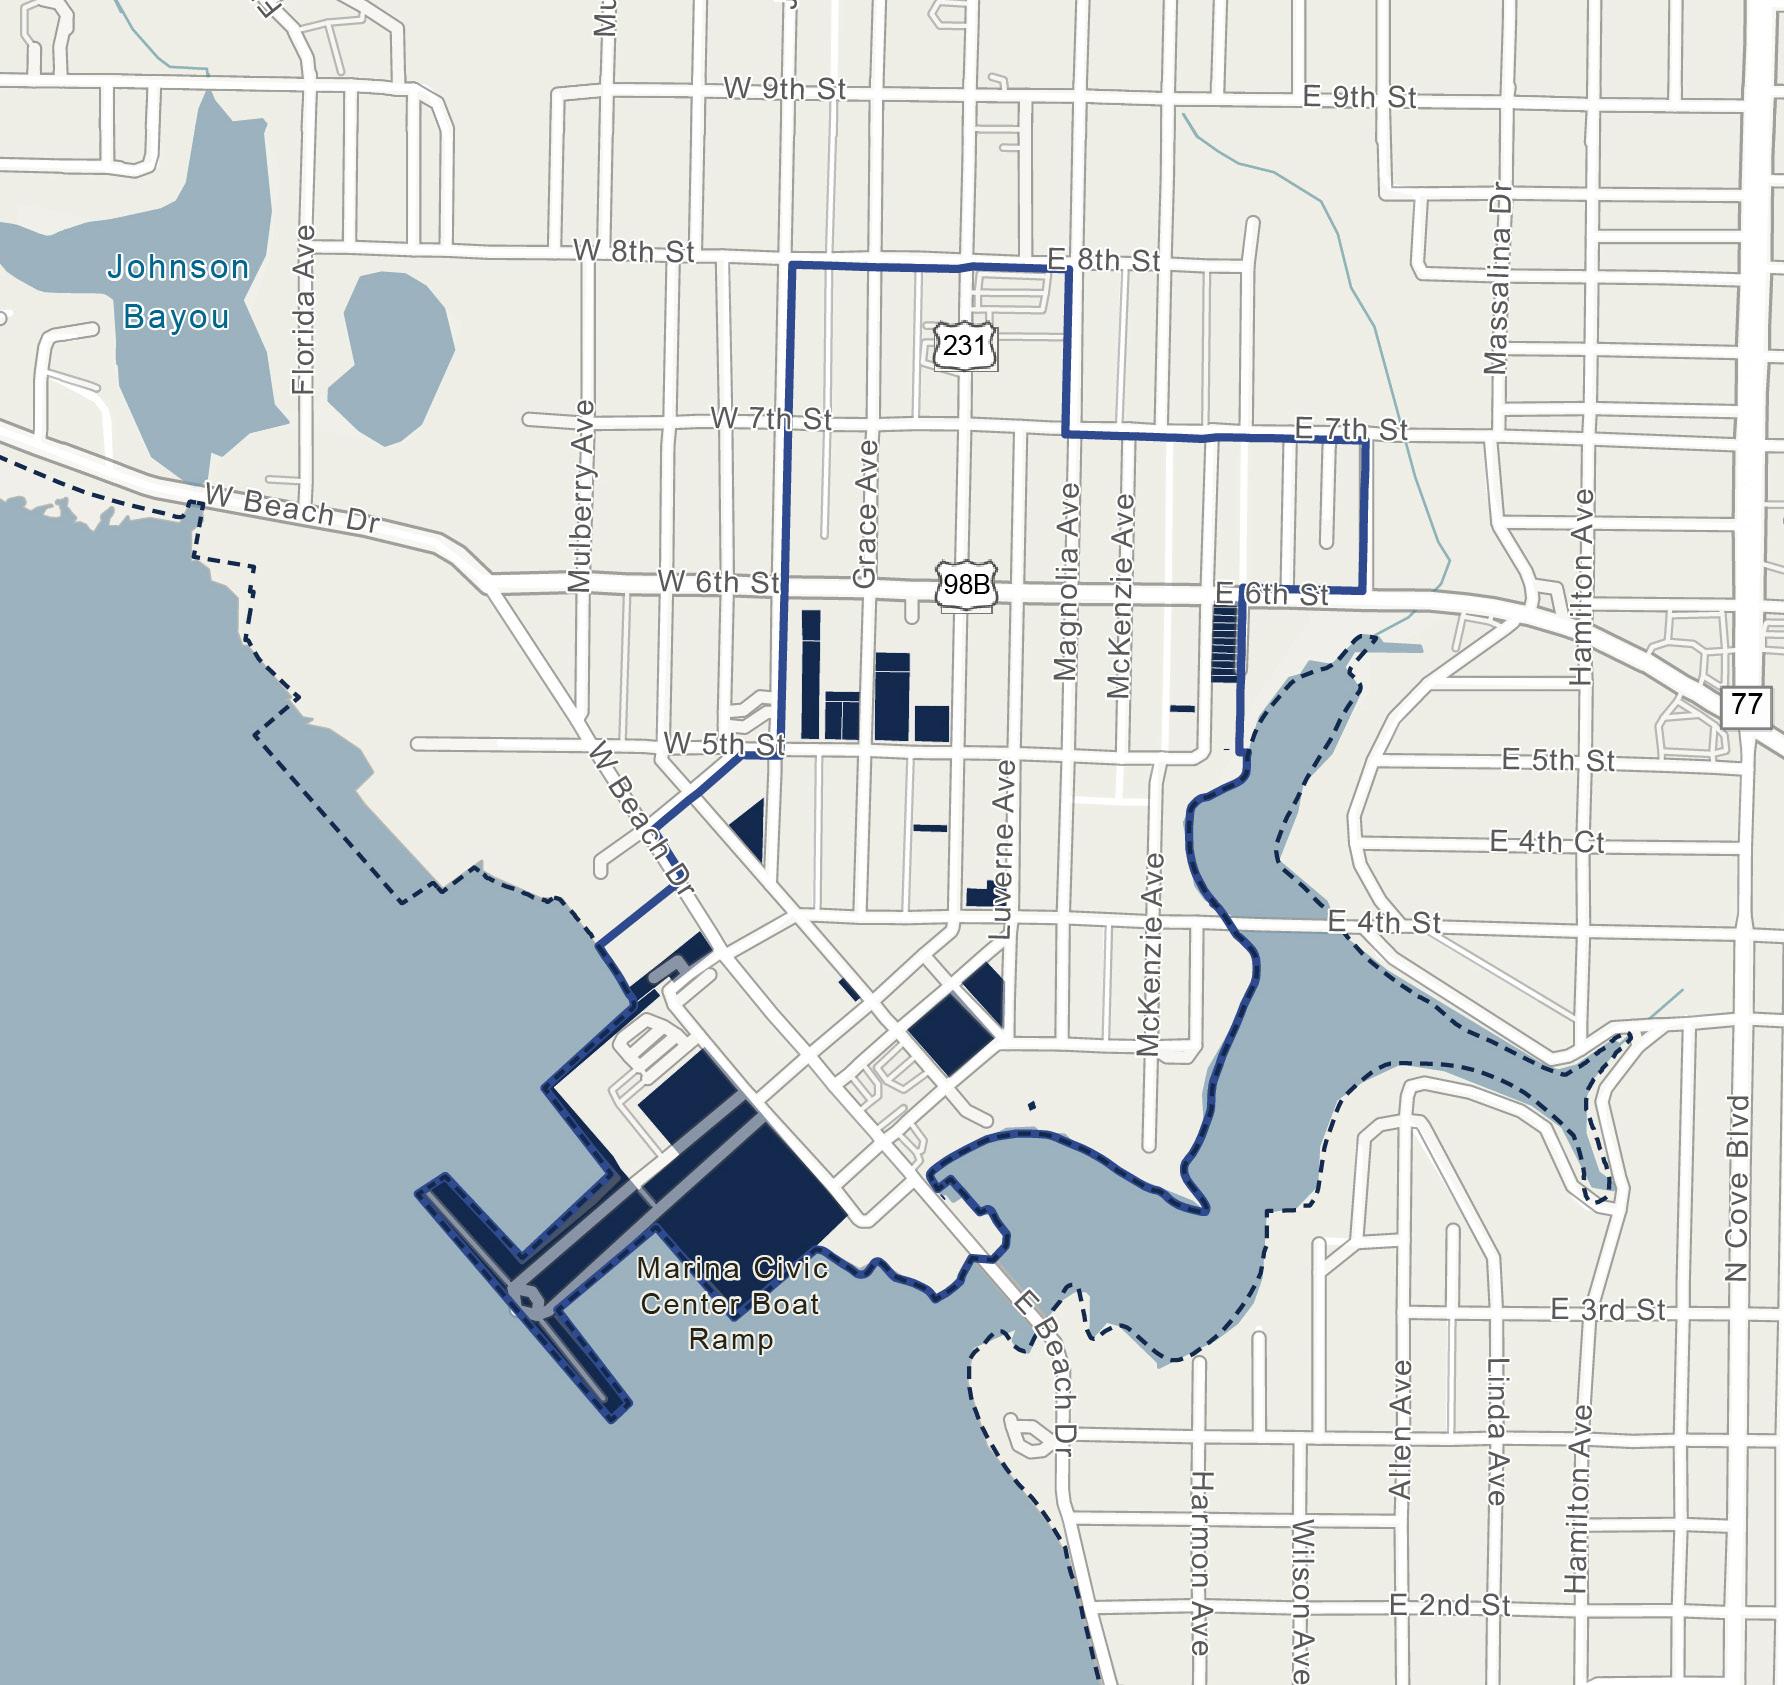
Figure 6. DOWNTOWN CRA CITY-OWNED PROPERTIES MAP
Vacant Parcels
Vacant parcels are those within the Downtown CRA that are undeveloped and/or do not have a built structure upon them. The three categories of vacant parcels within the Downtown CRA include: Vacant Residential, Vacant Commercial, and Vacant Governmental, representing
redevelopment opportunities in their respective land use categories. To note, the Vacant Governmental parcels may be utilized by the City and Agency to facilitate the implementation of redevelopment goals and strategies identified in this 2025 Plan.
The map below illustrates the vacant parcels by DOR code within the Downtown CRA, with the legend detailing the distribution of total land acres by vacant parcel classification (see Figure 7). The majority of vacant land within the Downtown CRA is primarily made up of Vacant Commercial.
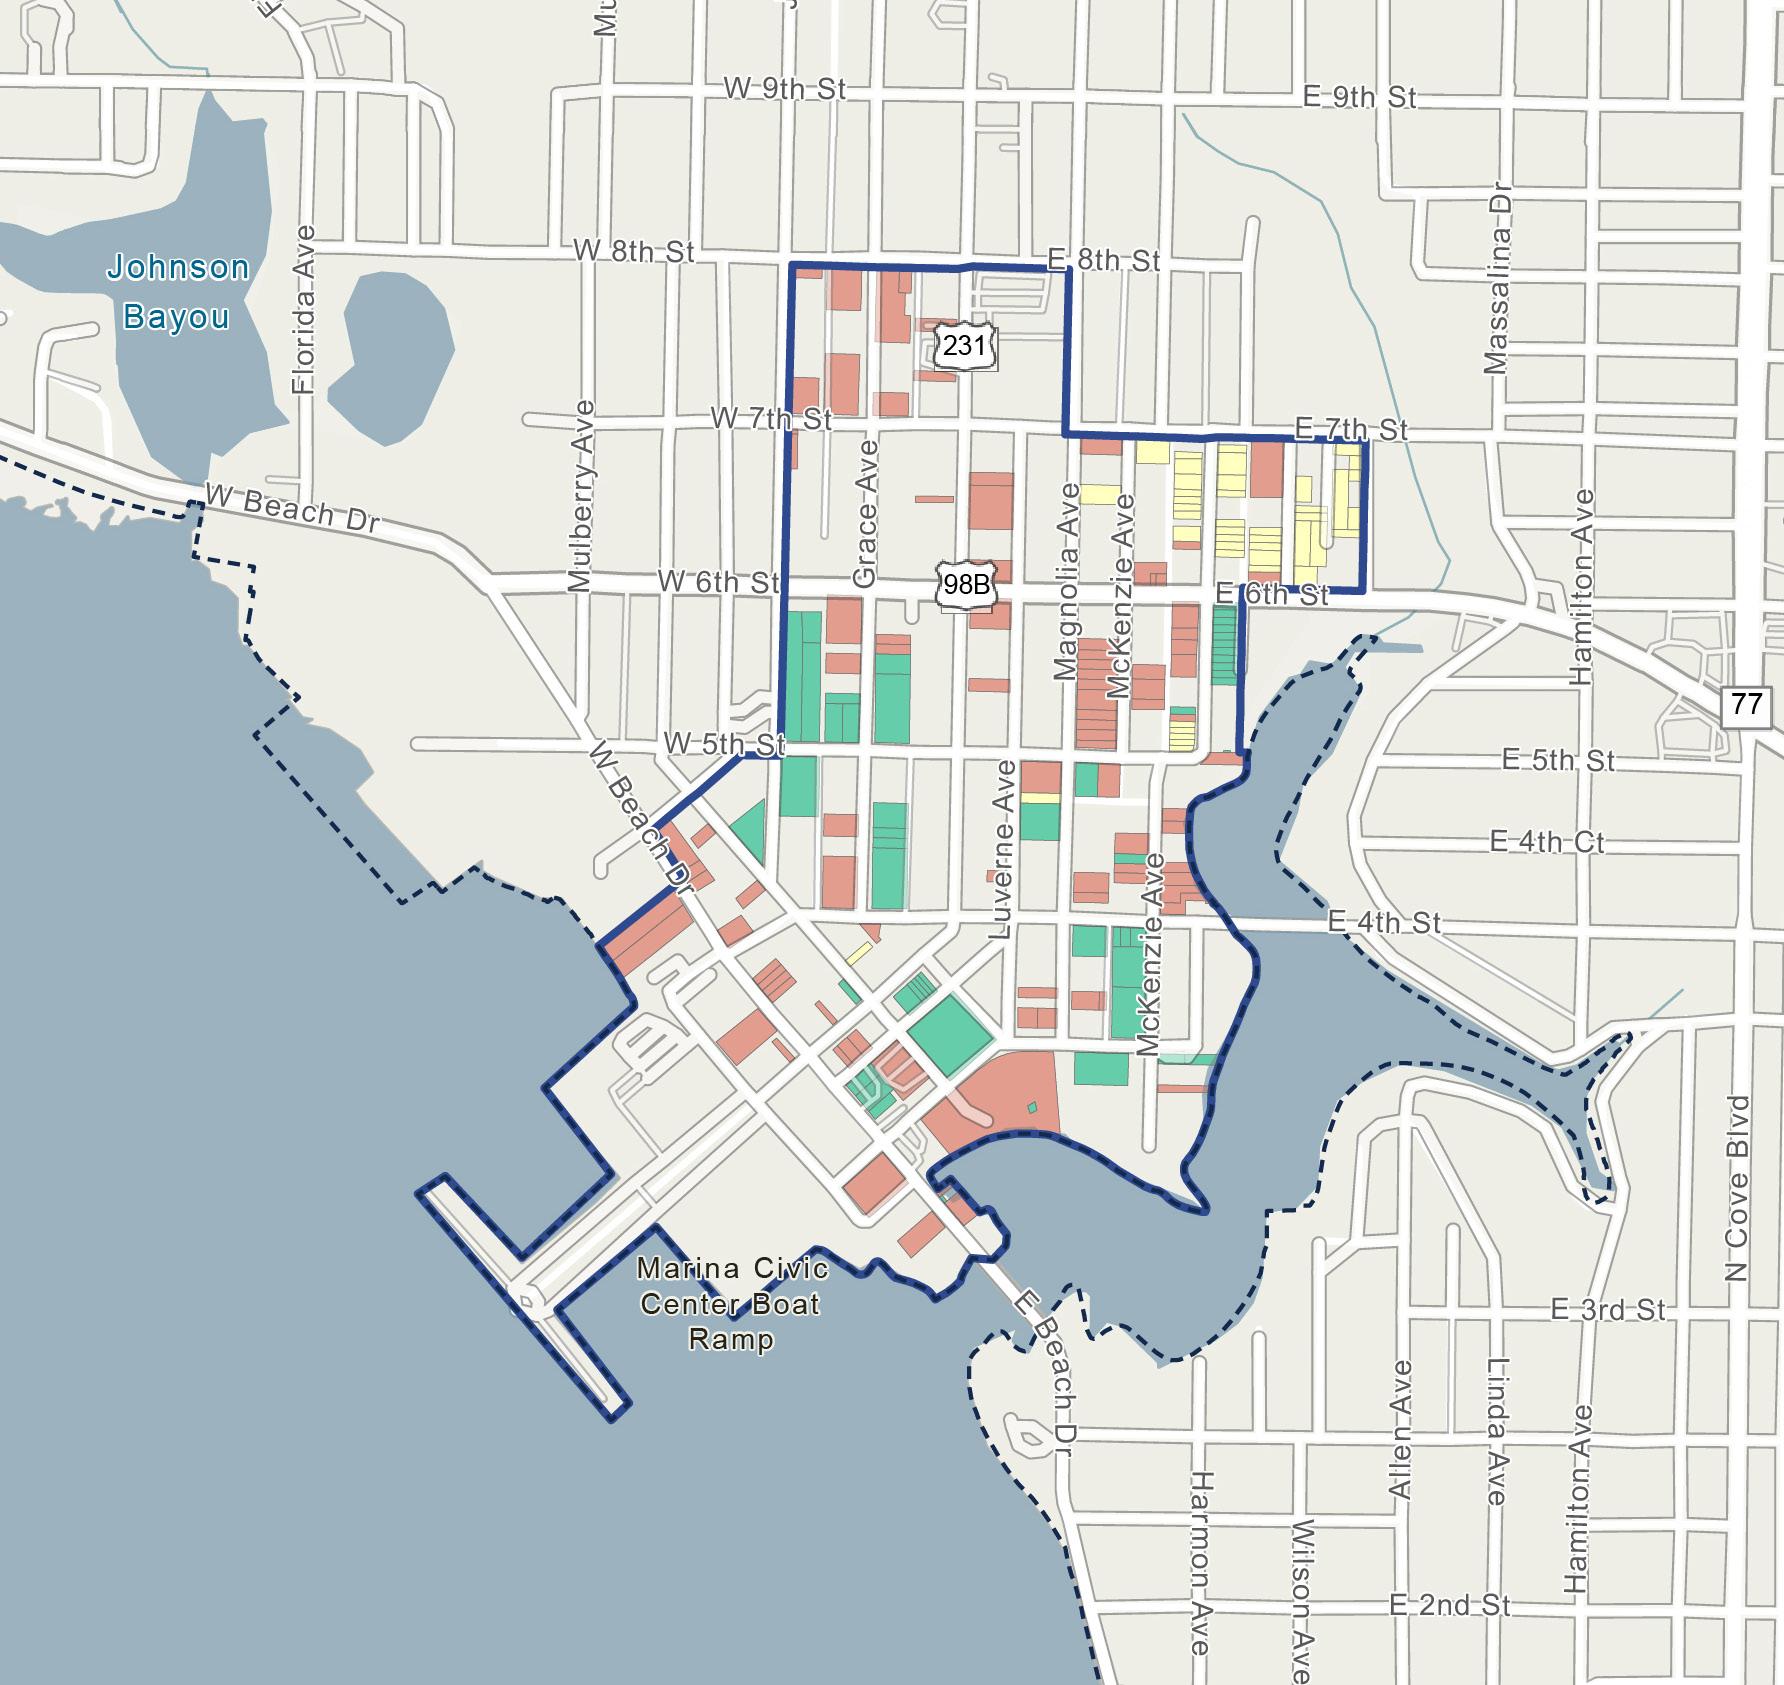
Figure 7. DOWNTOWN C r A VACANT PA rC el S MAP
MARKET ASSESSMENT AND DEMOGRAPHIC PROFILE
Overview
There are many key market characteristics, along with demographic and socioeconomic indicators to consider when assessing the overall market supporting demand within the Downtown CRA, these include:
▪ Market Performance
▪ Population
▪ Age Distribution
▪ Housing Characteristics
▪ Race and Ethnicity
▪ Academic Achievement
▪ Income Characteristics
▪ Employment and Business Activity
As of year-end 2024, the Downtown CRA is home to a population of 160 persons— composing 0.5% of the total population within the City. The population density in the Downtown CRA is 696 persons per square mile, with a median age of nearly 43 years old. Total population within the Downtown CRA has experienced a negative CAGR of 1.4% since 2010: from 195 persons in 2010 to 160 persons in 2024.
There are about 76 total housing units within the Downtown CRA—composing 0.4% of the total housing units within the City. Total housing units within the Downtown CRA also experienced a negative CAGR since 2010 at 2.1%: from 103 housing units in 2010 to 76 housing units in 2024. Of the 76 housing units within the Downtown CRA as of year-end 2024, nearly 56% are renteroccupied with the remaining 44% owner-occupied units. As of year-end 2024, the housing unit vacancy rate within the Downtown CRA is 17%.
In addition, roughly 63% of the total population within the Downtown CRA make up the working-class population, typically defined as persons between the ages of 20 and 64. Over 79% of the total population within the Downtown CRA have obtained their high school diploma or greater, with nearly 11% obtaining a bachelors’ degree or a more professional/ graduate degree.
Population within the Downtown CRA is predominately White at 47%, closely followed by Black/ African-American with 39%; with approximately 8.1% of the population identify as Hispanic ethnicity, as of year-end 2024.
The Downtown CRA is also home to 2,625 total employees and 263 business as of year-end 2024. Total employment within the Downtown CRA composes 7.5% of the total employment within the City. Total employment within the Downtown CRA has experienced a positive CAGR of 2.6% since 2010: from 1,498 total employees in 2010 to 2,625 total employees in 2024.
As of year-end 2024, the dominate industry sectors within the Downtown CRA’s employment market include
public administration, health care and social assistance, and professional and technical services—combined, these industries compose about 48% of the total Downtown CRA employees. In addition, the unemployment rate within the Downtown CRA at 8.2% is greater than that of the City at 5.1%, as of year-end 2024.
As of year-end 2024, the Downtown CRA is made up of approximately 1.5 million square feet (“SF”) of combined commercial uses (i.e., office, retail, and industrial/flex)—composing 9.4% of the City’s combined commercial space. In addition, the Downtown CRA contains approximately 230 for-rent multifamily residential units and 144 hotel rooms, composing 4.0% and 8.3% of the City’s for-rent residential market and hotel market, respectively. The table below illustrates the year-end 2024 market characteristics for the Downtown CRA’s commercial, for-rent residential, and hotel market(s); see Table 2
The graphs and figures on the following page illustrate the year-end 2024 demographic and socio-economic characteristics of the Downtown CRA.
Downtown CRA Demographic and Socio-Economic Characteristics
RACE & ETHNICITY
Total population comprises 0.5% of the total population within Panama City.
POPULATION in the Downtown CRA EMPLOYEES in the Downtown CRA
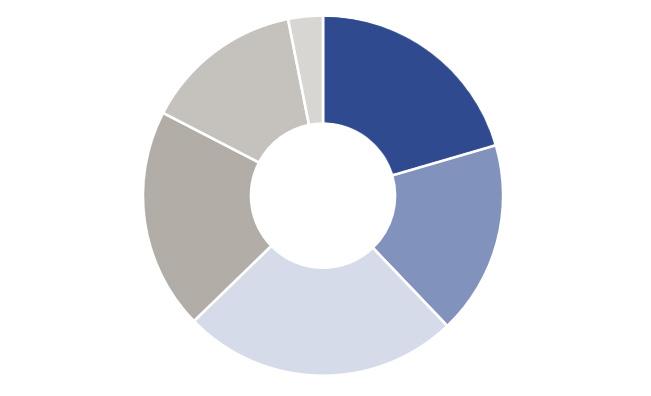
CHARACTERISTICS

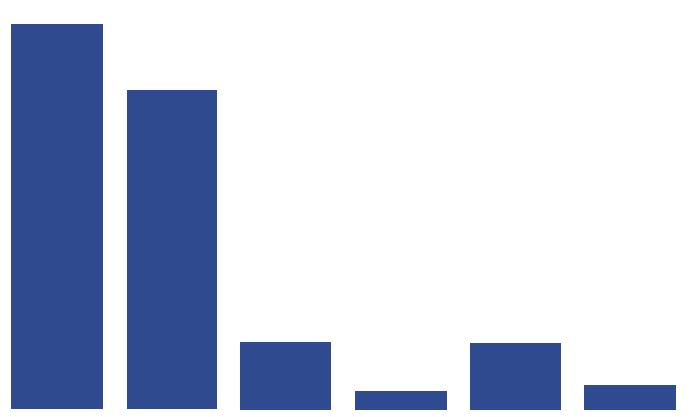
2,625
Represents an employee to population ratio of 16.4 persons per job, and comprises 7.5% of the total employees within Panama City.


CHARACTERISTICS

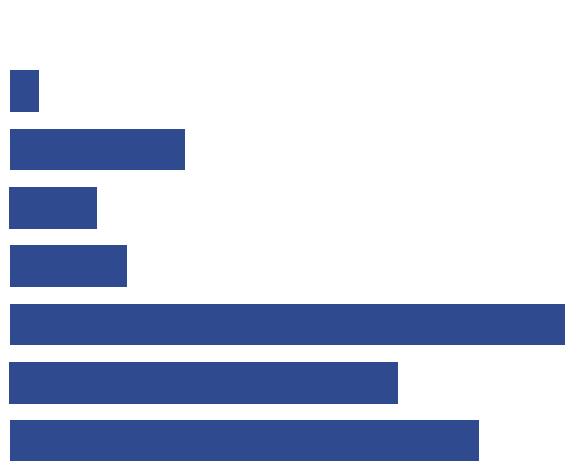
GOALS, OBJECTIVES, AND ACTION STRATEGIES
As a part of this 2025 Plan, major goals, objectives, and action strategies were identified specifically for the Downtown CRA. The action strategies for achieving each objective are outlined beneath their respective objectives below.
The Agency’s major goals in this 2025 Plan include creating:
1. Support Economic Growth, Job Creation, and Small Business Development

2. Expand Housing Opportunities
3. Improve Infrastructure, Mobility and Connectivity
4. Enhance Public Safety
5. Activate and Improve the Waterfront
6. Enhance Open Spaces, Recreation and Community Facilities
7. Promote Cultural Identity and History
8. Advance Sustainability and Resilience
These major goals, objectives, and action strategies guide the Agency in evaluating projects and programs for potential implementation to address the opportunities and challenges facing the Downtown CRA.
Support Economic Growth, Job Creation, and Small Business Development
To support economic growth, job creation and small business development, the objectives and strategies listed are intended to support the Downtown CRA's current businesses, residents, and employees by investing and enhancing residential and commercial spaces.
Objective 1: Develop desired plans that will support future projects.
▪ Update the Downtown CRA Redevelopment Plan to address many of the issues present in the community.
▪ Create a Parking Support Plan for both public and private facilities to provide a strategy for increased parking demands and creating better access to public parking garages, surface lots, and on-street parking. Parking adaptations should include:
– Develop and adopt standards to accommodate reduced parking requirements within the Downtown CRA and provide flexible spaces for compact cars and other modes of transportation.
– Assemble properties in the Downtown CRA to solicit developer interest
in developing mixed-use parking structures.
– Encourage all new large developments to provide structured and shared parking as opposed to surface lots where feasible.
– Encourage shared parking and access between adjacent properties in commercial and mixed-use areas.
– Provide combined residential and commercial parking requirements in new mixed-use developments.
– Identify areas for event related spill-over and recreational vehicular parking.
– Prepare a parking location map and install clear signage to designated parking areas.
Objective 2: Collaborate on Economic Development and Tourism.
▪ Collaborate with community partners and identify corporate and institutional partners to attract and recruit higher wage jobs in tandem with EDA policies regarding aerospace and technologybased industries. Existing opportunities include:
– Bay County Economic Alliance: Functions as a public/private partnership with the goals of creating quality jobs and increasing the wealth of the community.
– Panama City Beach Chamber: Works to promote the area as a place to do business through marketing and promotions and helps develop a plan and marketing strategy for the Downtown CRA.
– Bay County Chamber of Commerce: Assists existing businesses with the resolution of any problems and provides new businesses with information about the Downtown CRA.
– Bay County Tourist Development Council: Assists economic development through the promotion of a positive image, increasing tourism and coordinating marketing efforts of the total tourism community.
– Universities, Colleges and Technical Schools: Links job-generating opportunities, programs, and strategies to the marine, aerospace, high tech and coastal resource industries, through collaboration with the public school system, Gulf Coast State College, Troy University, Florida State University, University of West Florida, and the Tom P. Haney Technical Center should be explored.
– Other City CRAs: Efforts should be supported in collaborating with the City’s other CRA’s to find common initiatives in which leveraging resources will benefit the City as a whole. This could be in the areas of the marina’s development, job generating/training programs, a wellness trail connecting neighborhoods, and possible education and social service programs.
– Acquire or receive strategic properties, including vacant buildings, and support necessary site preparation,
to facilitate redevelopment, entrepreneurship and job creation.
– Develop projects when necessary to catalyze investment, fill gaps, or address community needs.
Objective 3: Attract and encourage mixed-use, commercial, economic development and redevelopment.
▪ Support business through innovation and programming, including an Economic Garden to grow locally-owned businesses through education, technology investments and transfers.
▪ Recognize arts and culture as economic drivers, as a creative workforce is drawn to environments that support a variety of events, programs and facilities enhancing the quality of life.
▪ Link jobs to marina development, including boat and engine repairs, electronics, refurbishment skills, and other marina-related work.
▪ Partner with educational institutions and training providers to support workforce development.
▪ Promote, support and grow small business development.
▪ Support technical assistance, workforce development and mentorship programs.
Objective 4: Attract Developers through New or Enhanced Policies.
▪ Preparing RFP’s for targeted redevelopment properties.
▪ Consideration of potential grants for or related to impact fees and other potential financial barriers to new development and redevelopment.
▪ Provide targeted incentives such as TIF, grants, and fee waivers to stimulate improvements or private investment.
Objective 5: Revise City Codes and Development Approvals Processes.
▪ Assist with the update of Downtown development codes and land use policies.
▪ Design guidelines and sign guidelines to establish specific building, façade, and sign recommendations that will address materials, colors, awnings, landscaping, pedestrian amenities, parking arrangements, and architectural details.
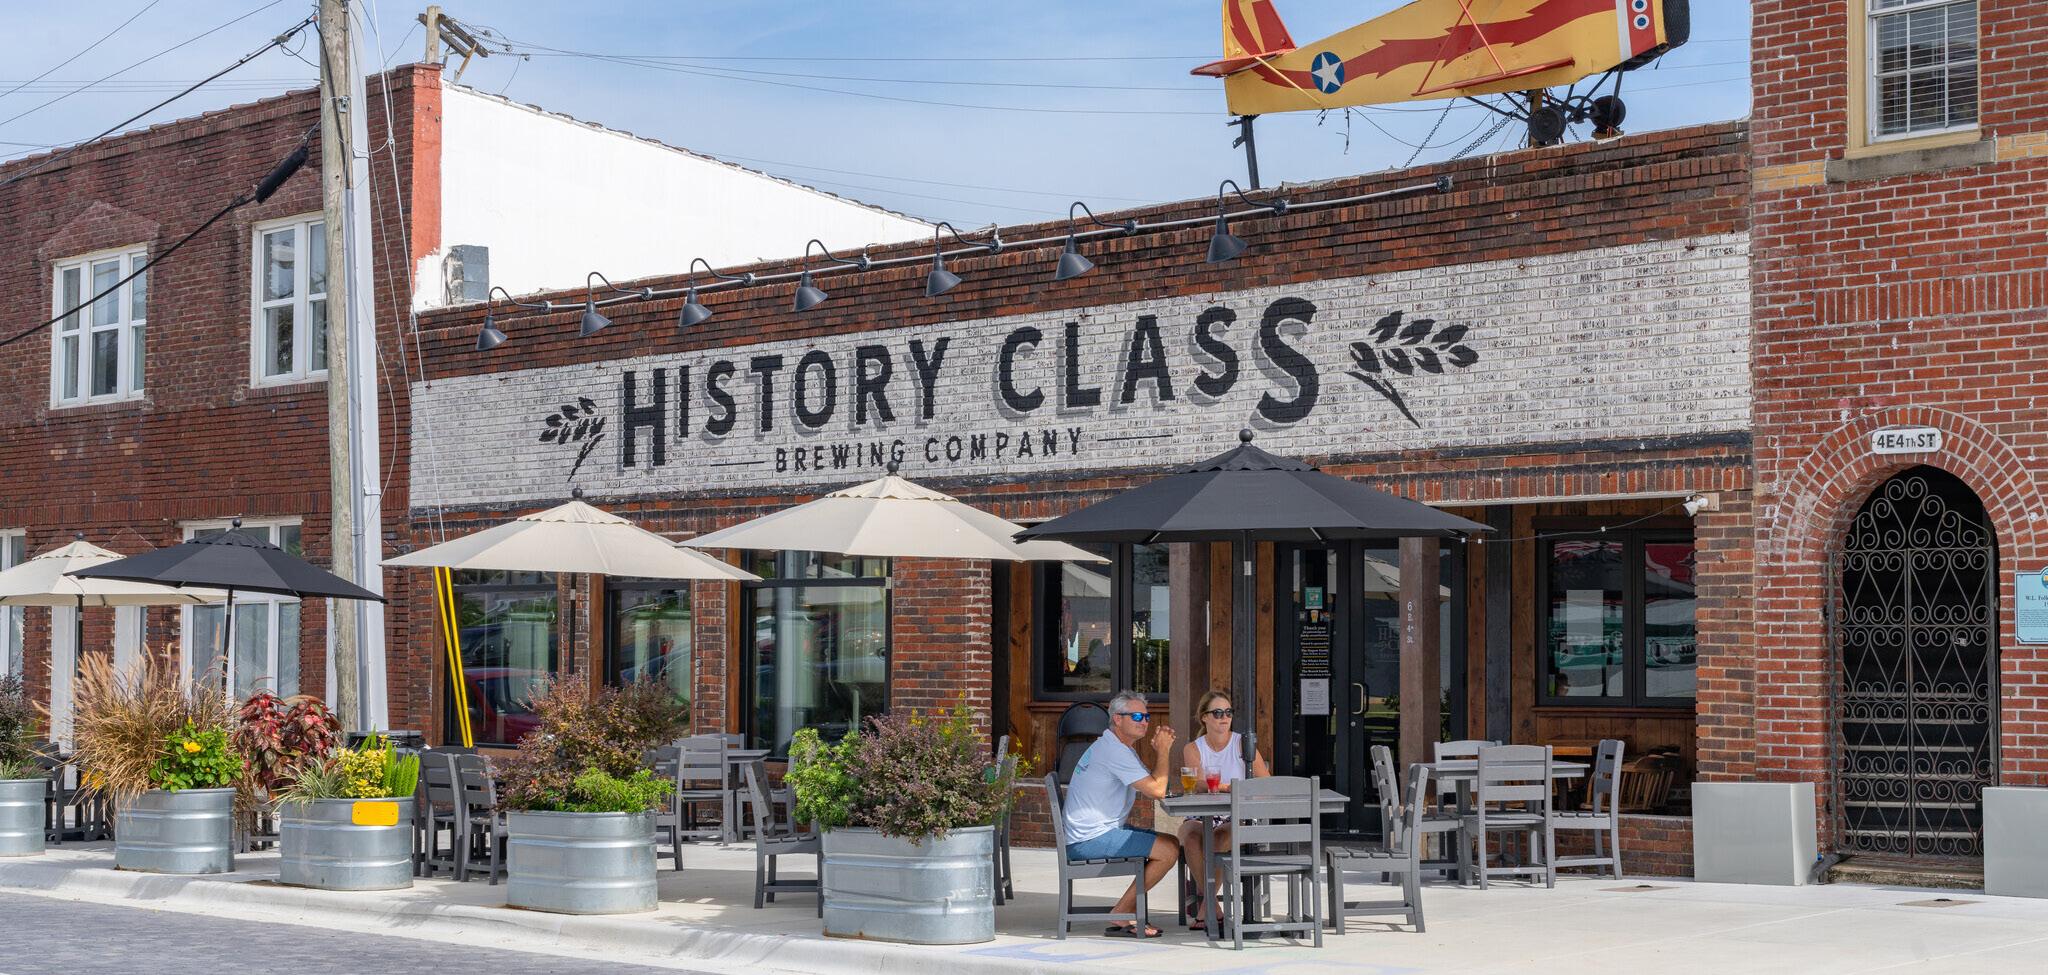

Expand Housing Opportunities
To expand housing opportunities, the objectives and strategies listed are intended to support mixed-use housing opportunities and encourage adaptive reuse of land to support the Downtown CRA's residents.
Objective 1: Support development of affordable and workforce housing.
▪ Incentivize residential infill, rehabilitation and affordable mixed-use housing.
▪ Collaborate with volunteer services to assist with residential repairs and improvements.
▪ Promote mixed-income

housing on strategic redevelopment sites, including housing above retail.
Objective 2: Redevelop vacant properties to encourage adaptive reuse, infill development, and to improve the investment image of the community.
▪ Provide relocation assistance to residents and businesses displaced by redevelopment projects, ensuring equitable transitions and minimizing hardship during community transformation, particularly for seniors.
Improve Infrastructure, Mobility, and Connectivity
▪ Accept land donations or acquire parcels to support residential goals.
▪ Purchase available lots for new workforce homeownership units.
To improve infrastructure, mobility, and connectivity, the objectives and strategies listed are intended to support the Downtown CRA's neighborhoods by providing necessary infrastructure and transportation improvements.
Objective 1: Encourage physical improvements to commercial and residential properties.
▪ Provide increased Commercial and Residential Redevelopment Grants or Loans.
▪ Use grants to attract new retail, particularly a grocery store; restaurants; offices/ jobs; arts and culture destinations; university/higher learning sites.
▪ Provide additional support for more intense residential developments, offering a variety of housing options, both for-sale and rental products.
▪ Implement complete streets with lighting, sidewalks, and bike lanes and/or pedestrian paths.
Objective 2: Support Neighborhood Stabilization.
▪ Encourage the collaborative support of both public and
private educational providers.
▪ Strengthen the K-12 offerings of the public schools, charter schools and community schools.
▪ Establish an arts campus in the Downtown CRA.
Objective 3: Provide and/ or Encourage Public Realm Improvements.
▪ Continue to partner with others to develop community mixeduse spaces and pubic open spaces.
▪ Enhance experience by creating lively and distinctive places, where the many functions of community life take place and where people feel a sense of ownership and connectedness.
▪ Support the pedestrian and vehicular connection of destinations with one another to avoid having them function in isolation.
Objective 4: Provide Access and Mobility Support.
▪ Integrate smart infrastructure and emerging technologies— such as broadband/fiber networks, EV charging stations, and real-time transit systems—into projects funded by the CRA to improve long-term functionality and competitiveness.
▪ Support upgrading and modernizing roads, stormwater systems, and utility infrastructure.
▪ Connect Harrison Avenue to the parking lots on Grace Avenue and Luverne Avenue.
▪ Undertake accessibility/ADA improvements where needed.
▪ Implement a tree-lined waterfront promenade that links open spaces and recreational opportunities.
▪ Invest in road realignments, initiation of a trolley or shuttle service for full-time or parttime services, and/or remote parking facilities.
▪ Improve regional connectivity through upgraded public transit, complete streets, and expanded pedestrian and bicycle networks.

▪ Prioritize pedestrian connections to McKenzie Park, Martin Theater, City Hall, and the Marina.
Enhance Public Safety
▪ Address parking issues and invest in new parking facilities.
To enhance public safety, the objectives and strategies listed are intended to support the Downtown CRA's community and partners to ensure safe streets and provide safety initiatives.
Objective 1: Enhance policing and community strategies to mitigate crime.
▪ Support innovative policing and explore other avenues to leverage resources to address these influences.
▪ Encourage innovative collaboration with the City's Police Department to increase foot patrols, bicycle/segway patrols, and vehicle patrols to help reduce the negative influence of the problems.
▪ Collaborate to create and sustain a Business Watch Program.
▪ Support Crime Prevention Through Environmental Design (CPTED) principles into improvements and projects funded by the CRA.
▪ Create a consortium of social service providers to address common issues and support social service needs while being sensitive to the impacts on local businesses and neighborhoods.
▪ Partner with local law enforcement and community organizations to support proactive public safety initiatives and community policing efforts.
Objective 2: Secure and repair infrastructure to support safety initiatives.
▪ Secure and clean up buildings in disrepair, enforce codes.
▪ Harden power lines and add pedestrian lighting to neighborhoods and streets.
▪ Improve lighting, visibility, and pedestrian infrastructure to enhance safety in public spaces.
▪ Support programs and facilities that reduce loitering, illegal dumping, and vandalism through strategic activation of underutilized spaces.
▪ Encourage the redevelopment of blighted or abandoned properties that contribute to unsafe conditions.
▪ Install or improve security infrastructure (e.g., cameras, emergency call stations) in key public areas when appropriate.
▪ Promote safe, walkable, and accessible environments through streetscape improvements and trafficcalming measures.
Objective 3: Implement maintenance of ROWs and Vacant Properties.
▪ Implement rights-of-way and vacant properties maintenance program(s) surpassing City minimum maintenance standards in accordance with maintenance agreement between City and Agency.
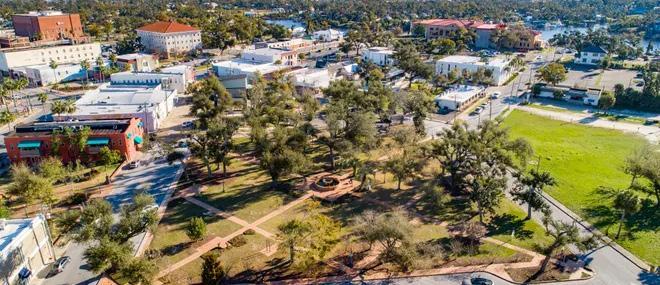
DOWNTOWN PANAMA CITY MCKENZIE PARK | SOURCE PANAMA CITY NEWS HERALD

Activate and Improve the Waterfront
To activate and improve the waterfront in the Downtown CRA, the objective and strategies listed are in intended to encourage updating plans that support local businesses and create a thriving public space around the Panama City Marina.
Objective 1: Support and initiate improvements to the waterfront.
▪ Support public waterfront access and water-dependent businesses.
▪ Implement flood-resilient shoreline design.
▪ Secure strategic waterfront parcels to enhance public access and amenities.
▪ Support redevelopment of the Marina Civic Center site and promenade as a public gathering space with potential commercial and recreational uses.
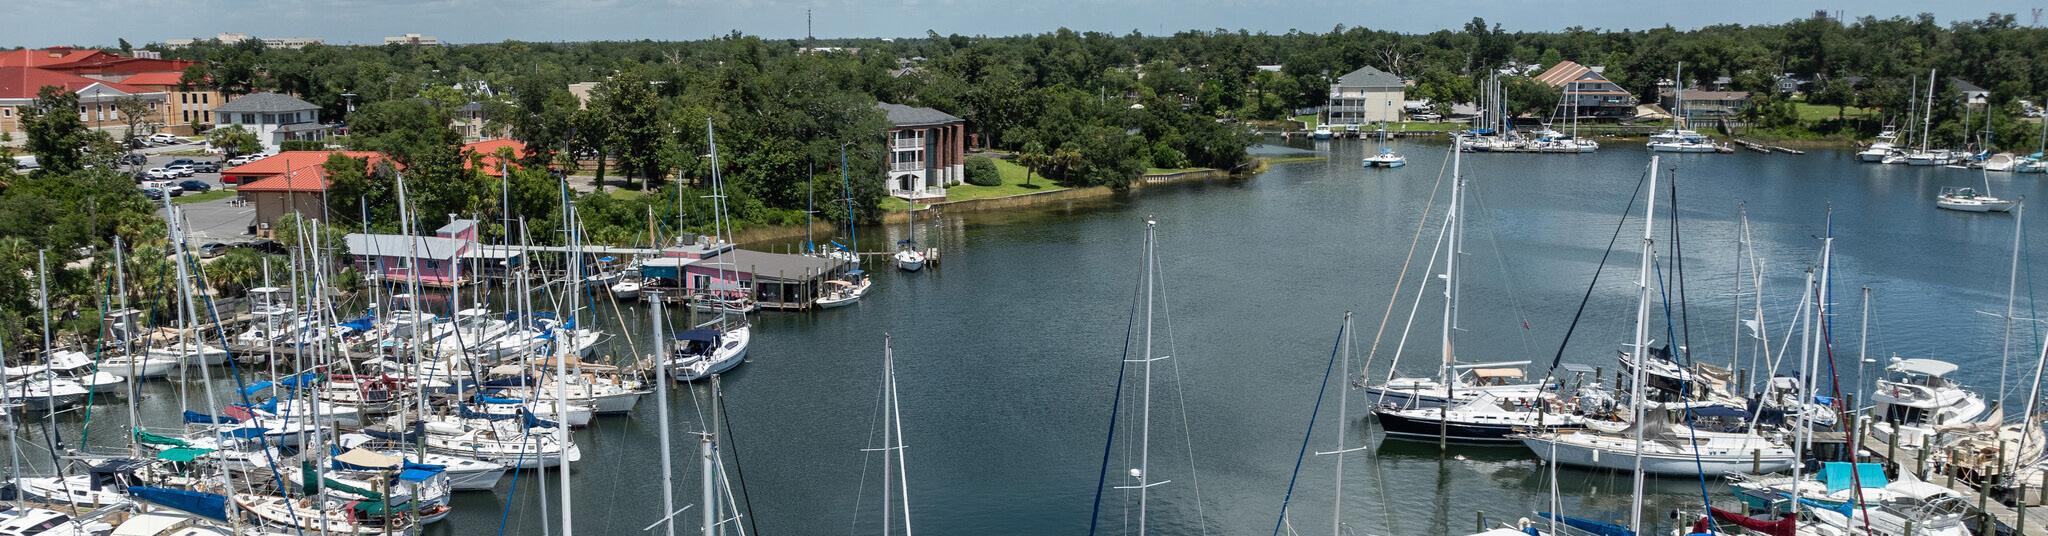

Enhance Open Spaces, Recreation, and Community Facilities
To enhance open spaces, recreation, and community facilities, the objectives and strategies listed are intended to support the continuation of streetscape projects, while focusing on developing a comprehensive signage program and functional community spaces.
Objective 1: Continue to Improve and Maintain Streetscapes.
▪ Enhance the aesthetics to increase the area’s walkability and appeal for pedestrians, creating a “sense of place.”
▪ Continue enhancements along the business heavy corridors to support business retention and recruitment.
Objective 2: Create an Enhanced Wayfinding Signage System.
▪ Locate wayfinding signage, directional signage to parking lots, and signage near intersection entry points and be designed in a consistent and easily identifiable manner.
▪ Install a comprehensive
directional signage system for the Downtown CRA.
▪ Develop a unified signage system that emphasizes a coherent theme for the entire Downtown CRA.
Objective 3: Re-imagine Community Facilities and Recreation.
▪ Locate sites for desired recreational facilities such as splash pad, skateboard park, and dog parks.
▪ Connect the intended Downtown Stormwater/ Resiliency Plan with open spaces to create “water smart parks or mini parks” and green streets suitable for recreation.
▪ Expand and improve parks, plazas, and civic spaces.
▪ Improve, develop and maintain recreation buildings, facilities and spaces.
▪ Acquire or re-purpose land for public recreation.
▪ Maintain and enhance CRA improvements and vacant properties to support safe, attractive, and functional public spaces.
▪ Integrate play spaces, seating, and walking paths into park designs.
▪ Enhance aesthetics through use of decorative lighting in parks and along roadways, seasonally or year-round.
DOWNTOWN PANAMA CITY MARINA | SOURCE COSTAR GROUP

Promote Cultural Identity and History
To promote cultural identity and history, the objectives and strategies listed are intented to support historic preservation efforts through community education programs and implementing streetscape designs that will promote a community identity.
Objective 1: Support Historic Preservation.
▪ Explore tools to increase protections on historic structures and incentivize preservation/reuse of buildings, like the Marie Hotel.
▪ Link the various sites and points of interest in the different CRA’s to create an attractive “historical trail” to

be enjoyed by residents and visitors alike.
▪ Provide education about these tools to the Historical Society, property owners and others.
▪ Connect historic elements through physical preservation, new design, arts and cultural programs.
▪ Install public art, wayfinding, and historic interpretation.
Advance Sustainability and Resilience
▪ Recognize and preserve the unique heritage of the district through plaques, murals, and interpretive displays.
▪ Develop cohesive design standards that reflect neighborhood identity and reinforce sense of place.
▪ Support community-based historic preservation efforts.
To advance sustainability and resilience, the objectives and strategies listed are intended to develop and implement plans that create energy efficient infrastructure throughout the Downtown CRA with a focus on the Marina.
Objective 1: Implement Master Stormwater Plan and System.
▪ Develop a new master plan to build or modify the stormwater system for the Downtown CRA to allow for redevelopment.
▪ Include the necessary elements to construct a system for the entire Downtown CRA drainage basin in the master plan.
▪ Allow property owners to build out their lots without using on-site storm water facilities, removing regulatory barriers to development.
▪ Create a potential revenue source for managing the stormwater system beyond the life of the Downtown CRA.
▪ Build stormwater capacity with green infrastructure.
Objective 2: Update Marina Master Plan and Redevelop Existing Marina.
▪ Provide public access to coastal resources.
▪ Utilize the marina’s size and location for a variety of public and private development opportunities.
▪ Combine a mix of civic and commercial to encourage use as a regional destination.
Objective 3: Promote CRAwide resiliency infrastructure upgrades.
▪ Consider the development of the master stormwater pond as a recreational attraction and amenity for citizens.
▪ Promote tree planting, incorporate native landscaping and renewable energy upgrades.
▪ Support energy-efficient and resilient building practices.
▪ Support resilience planning for flood-prone areas.
▪ Install solar lighting in parks, trails, and public spaces to reduce energy use and enhance safety.
▪ Implement urban heat mitigation strategies such as expanded tree canopy, shaded streetscapes, and reflective surfaces to improve livability and address climaterelated impacts.
CONCEPTUAL MASTER PLAN
The Conceptual Master Plan for the Downtown CRA illustrates the general locations of the previously installed capital improvements and proposed capital improvements and programming identified in
the Capital Projects and Programming Worksheet, further detailed in Section 6, Financial Analysis of this document (see Figure 8). Specific proposed capital improvements illustrated below include a
waterfront promenade, EcoPark for stormwater filtration, diverse housing infill, mixeduse development to attract residents, and safer streetscapes and intersections to enhance walkability and bike paths.
Downtown CRA
Proposed Waterfront Promenade
Proposed Plaza
Infill Development
Mixed-Use Infill Development
Proposed Roundabout(s)
Safe Streetscape(s)
Potential Parking Garage(s)
Proposed Protected Bike/ Cycle Tracks
Proposed Pedestrian/ Streetscape Improvement
Proposed Multi-Use Path/ Waterfront Promenade
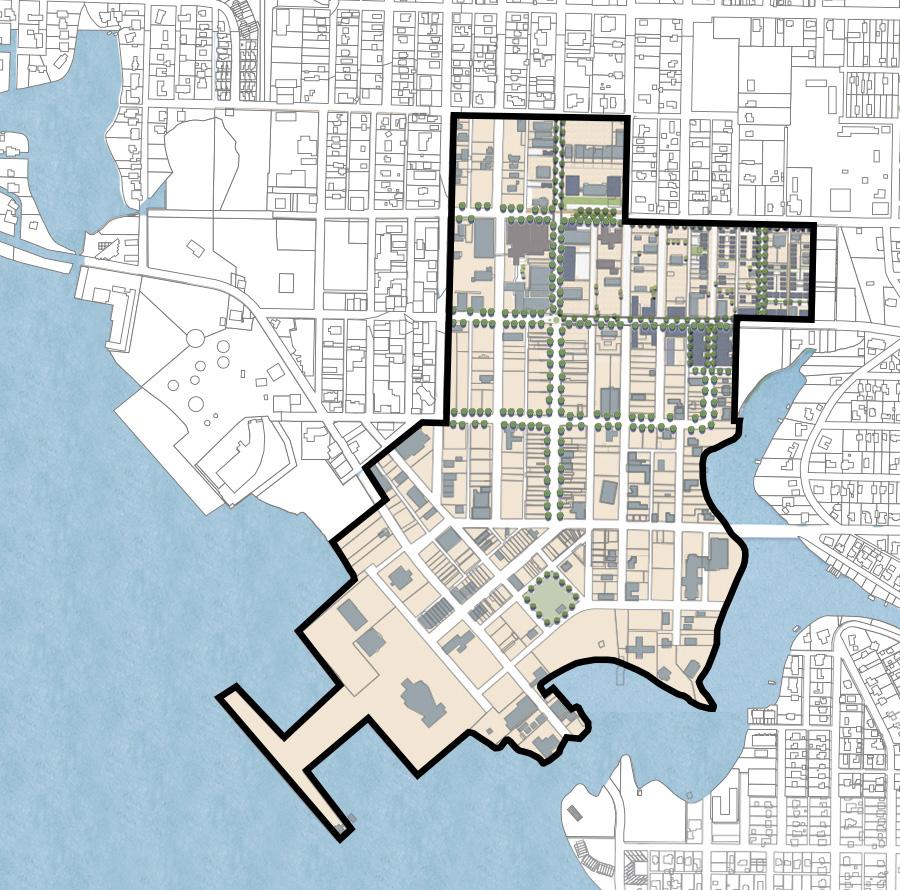
[ THIS PAGE INTENTIONALLY LEFT BLANK ]
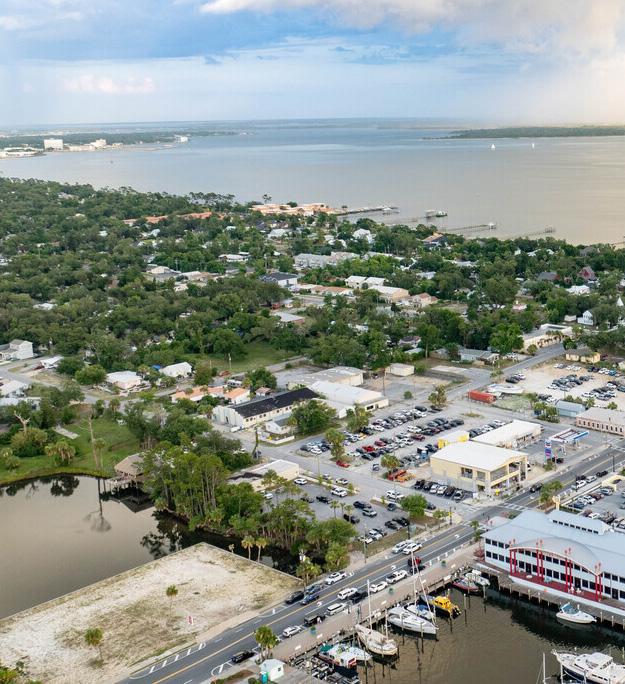
ST. ANDREWS COMMUNITY REDEVELOPMENT AREA
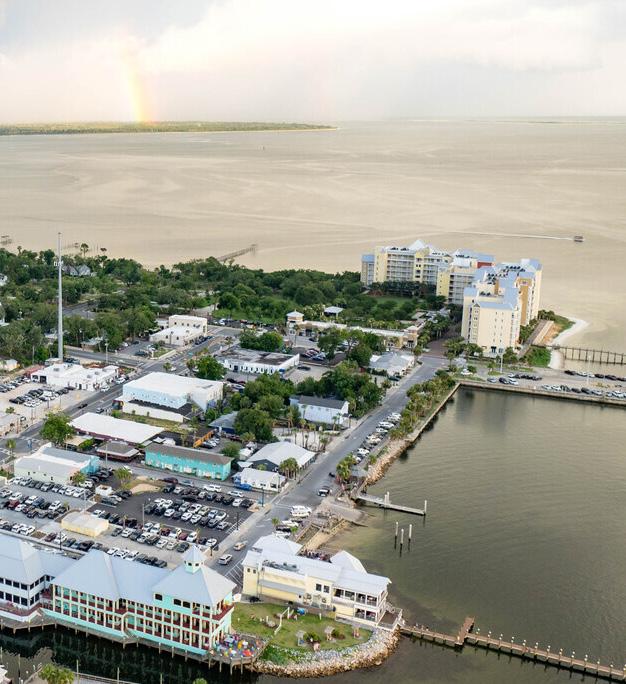
CHAPTER THREE:
ST. ANDREWS COMMUNITY REDEVELOPMENT AREA
ST. ANDREWS CRA SUMMARY
Overview
The St. Andrews Community Redevelopment Area (“St. Andrews CRA”) was established in 1989 with the objective to revitalize the City’s St. Andrew Bay Community. In 2024, an FON study was conducted and adopted, expanding the St. Andrews CRA to include areas east and west of the original boundary. Known for its strong waterfront connection, the St. Andrews CRA boasts numerous boats, docks, and traditional fishing village architecture along St. Andrews Bay. The area offers extensive shoreline and park space, enjoyed by residents and visitors alike. Today, the St. Andrews CRA is approximately 644 acres, as illustrated in the following map (see Figure 9).
The St. Andrews CRA includes the St. Andrews Marina, a major anchor development, and is designated as a Waterfronts Florida Partnership Community. Major roadways within the St. Andrews CRA include U.S. Hwy. 98 and Beck Avenue, considered the main street, featuring several local businesses.
History
St. Andrews’ history dates back to the 1780s with European settlers arriving during the Spanish period.
By 1862, it became a key saltmaking area in Florida, leading to industrial growth. In the early 1900s, St. Andrews became vital to Panama City’s growth due to its waterfront and investors like the Gulf Coast Development Company. However, in the 1980s, the community declined as charter fishing and waterfront businesses moved to Panama City Beach. Recognizing the need for revitalization, the Panama City Community Redevelopment Agency (“Agency”) designated St. Andrews as a Community Redevelopment Area in 1989.
The St. Andrews CRA originally encompassed about 188 acres, sitting along a 3/4-mile segment of Beck Avenue, running north from St. Andrews Bay. A significant event in St. Andrews’ history was its designation as a Waterfront Florida Partnership Community, which provided financial resources and technical grants. These grants help the St. Andrews CRA implement community-designed visions for the waterfront area. In 2012, the Partnership reorganized as a non-profit organization with goals to preserve historical, cultural, and environmental
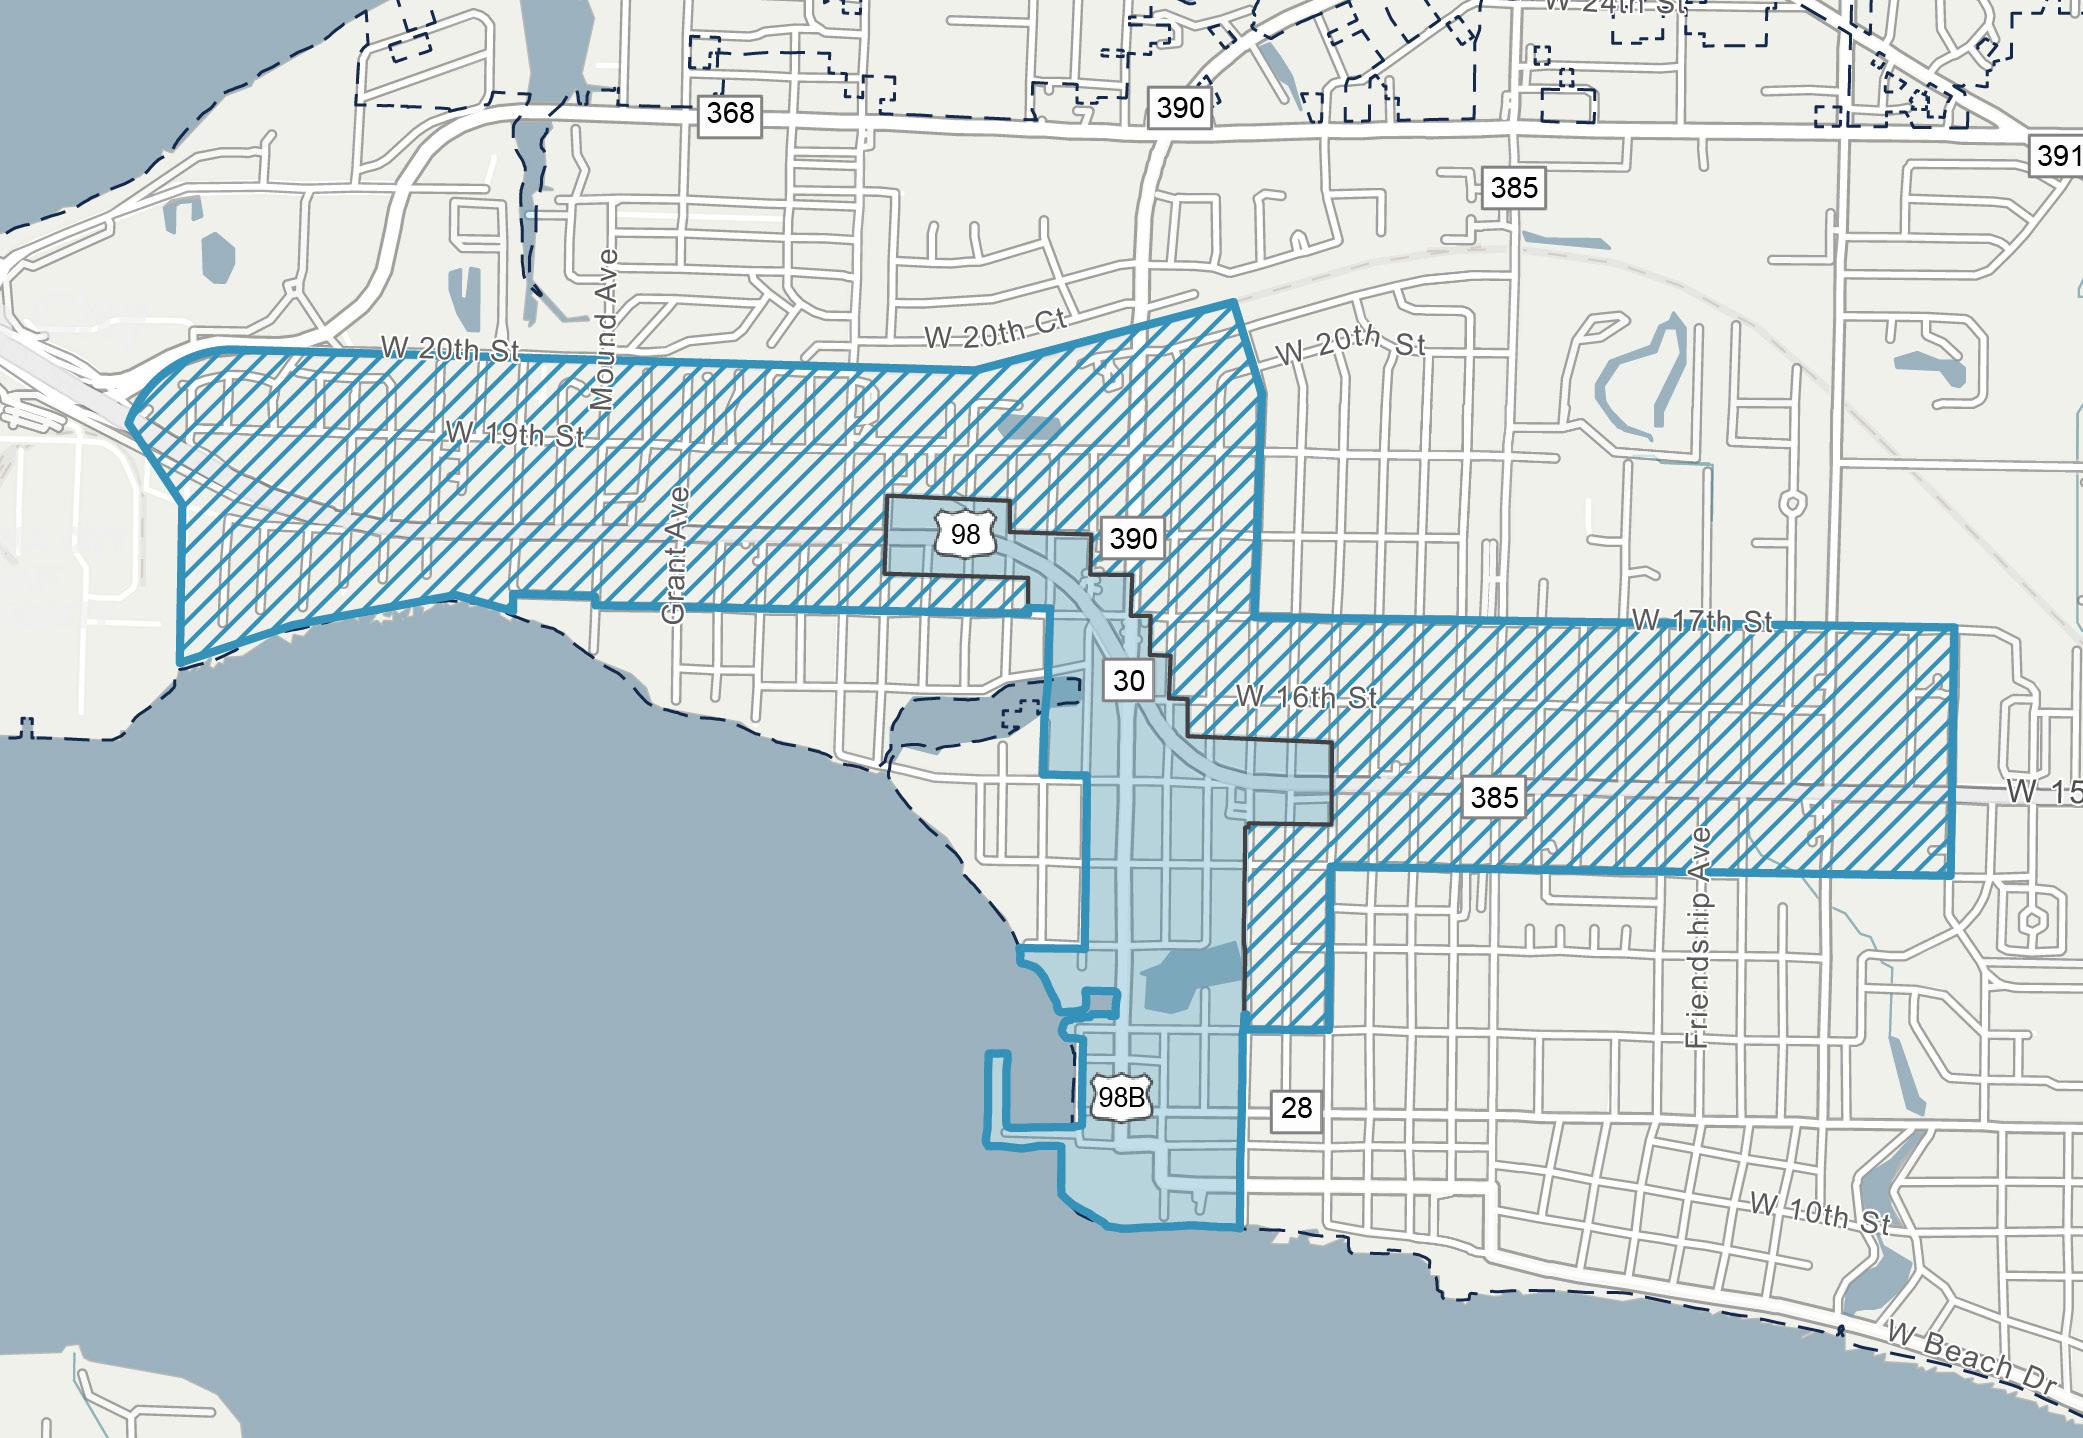
Legend
Panama City
Municipal Boundaries
St. Andrews CRA
1989 Boundary
St. Andrews CRA
2024 Expansion
Figure 9. ST. AND re WS C r A MAP
resources, advocate for public/ private partnerships, and foster community engagement.
The St. Andrews CRA’s initial Community Redevelopment Plan was adopted in 1989 and featured multiple capital projects, which had primarily been completed by 2017. However, problems of Slum and Blight continued, requiring the 2018 St. Andrews Community Redevelopment Plan Update.
The 1989 and 2018 St. Andrews CRA Redevelopment Plan(s) have served as the primary guides for the Agency’s activities within the St. Andrews CRA to-date.
In 2024, an initiative was undertaken by the Agency to evaluate selected areas for consideration of inclusion within the St. Andrews CRA and an update of the St. Andrews CRA Redevelopment Plan. The Agency recognized the need to stimulate private sector reinvestment in targeted areas and to address and implement long-term redevelopment, rebuilding and recovery initiatives.
An FON study was conducted in late 2024 (“2024 FON”), attached hereto within the Appendix, which documented existing conditions within two targeted expansion areas, West Expansion Area and East Expansion Area, to determine if the targeted expansion areas qualified for potential inclusion within the existing St Andrews CRA in accordance with F.S. Chapter 163.340 (7), (8).
The 2024 FON found that the West Expansion Area demonstrated one condition of “Slum” (F.S. Chapter 163.340, (7) (c)) and five conditions of “Blight” (F.S. Chapter 163.340, (8) (a), (b), (d), (e), and (k)). Based on the observation of the presence of
Slum and Blight conditions as defined by F.S. Chapter 163.340, (7), (8), there were sufficient findings to justifiably consider inclusion of the West Expansion Area within the St. Andrews CRA. Further, the 2024 FON found that the East Expansion Area demonstrated one condition of “Slum” (F.S. Chapter 163.340, (7) (c)) and five conditions of “Blight” (F.S. Chapter 163.340, (8) (a), (b), (d), (e), and (k)). Based on the observation of the presence of Slum and Blight conditions as defined by F.S. Chapter 163.340, (7), (8), there were sufficient findings to justifiably consider inclusion of the East Expansion Area within the St. Andrews CRA.
The 2024 FON was presented to, and accepted by, the Agency on April 8, 2025, after which the City Commission of the City of Panama City, in accordance with F.S. Chapter 163.355, Florida Statutes, and by adoption of Resolution 20250408.1 found that the conditions within two targeted expansion areas examined in the 2024 FON meet certain criteria described in F.S. Chapter 163.340(7), (8), and that there is a need for the expansion of the St. Andrews CRA to address the conditions of Slum and Blight identified within the two targeted expansion areas.
This 2025 Plan memorializes the aforementioned St. Andrews CRA boundary changes that have been adopted; IT serves as a modification and update of the St. Andrews CRA Redevelopment Plan and specifies the redevelopment strategies, desired improvement projects, and proposed implementation steps.
In response to Hurricane Michael in 2018, Panama City produced the Neighborhood Plan, featuring
a strategic vision of three neighborhoods within the City including St. Andrews, as well as the Strategic Vision for Panama City’s Historic Downtown and its Waterfront Plan. These plans addressed issues of urban sprawl and recovery. The Neighborhood Plan highlighted the need for revitalization and reinvestment in the Glenwood, Millville, and St. Andrews areas. The plan aimed to address decline, enhance infrastructure, and support economic growth, making these areas more vibrant and resilient. The major priorities, objectives, and goals outlined in both plans have served as crucial guidelines for the St. Andrews CRA’s goals and objectives in this 2025 Plan, as detailed in the following pages.
Past Accomplishments
Since establishing the St. Andrews CRA in 1989, the Agency has worked to restore, emphasize, and contribute to St. Andrew’s unique historic character. The St. Andrews CRA has also worked toward encouraging tourism, economic development, small business formation and retention, neighborhood retail, and waterdependent recreational activities within Panama City.
Notable accomplishments within the St. Andrews CRA related to the Agency’s past priorities and guiding principles include:
Key and Vital Infrastructure
▪ Provided support through its commercial grant program that funded signage, awnings, landscaping upgrades and more.
▪ Started a Yard of the Month program to encourage residents to reclaim their yard/ gardens.
▪ Completed Bayview Avenue Streetscape projects including under-grounding of utilities, sidewalk development, lighting, stormwater, landscaping, and traffic flow.
Economy
▪ Established a Waterfront Partnership which opened up new financial resources and technical grants to the St. Andrews CRA.
Quality of Life
▪ Prioritized the preservation of historical icons, including: The Lion Fountain, a planter in Oaks by the Bay Park and the centerpiece of Lion Plaza; the Old Villa Hotel, maintained as the cornerstone of Villa Gateway Park, a pocket park for public waterfront access; and the Panama City Publishing Co. Museum, approved for the National Register which showcases historic documents and art.
Tax Base Trends and Estimates
The St. Andrews CRA was established in 1989 with a base year taxable value of $15,932,884. Over the 10-year period from 2015 to 2024, total taxable value for all properties within the St. Andrews CRA grew at a Compound Annual Growth Rate (“CAGR”) of 4.0%, experiencing a 48% increase in taxable value from $67,941,087 in 2015 to $100,321,646 in 2024.
Over the same 10-year period, annual Tax Increment Financing (“TIF”) revenue collections within the St. Andrews CRA has grown at a CAGR of 6.9%. This represents an 95% increase, rising from $420,300 in 2015 collections to $820,600 in 2024. Since 2015, the total TIF revenues
collected in the St. Andrews CRA have amounted to $5,025,900. In 2025, an FON was adopted which expanded the St. Andrews CRA to include areas east and west of the original boundary.
Table 3 below illustrates the 10-year historic collections in total taxable value and total tax increment, as well as the total annual TIF revenues generated by the St. Andrews CRA, assuming a 95% contribution rate from both the City and County for the original St. Andrews CRA, and a reduced 74% contribution from the County for the expansion areas. The table also illustrates projected collections from 2025 through 2044, the Agency’s
operational sunset date, over 5-year increments. This 2025 Plan estimates that the St. Andrews CRA will generate approximately $42,597,800 in TIF revenue to the Agency’s Redevelopment Trust Fund from 2025 through 2044. This equates to about $2,129,890 in average annual increment over the 20-year projection period.
This TIF revenue may be used for projects and programming that address the goals, objectives, and strategies of this 2025 Plan. For further details on the TIF projections for the St. Andrews CRA, please refer to Section 6, Financial Analysis of this document.
TA ble 3. ST. AND re WS C r A TAX i NC re M e NT T re NDS AND e ST i MAT e S
$ 12,216,800
Est. $ 15,930,500 20-Year Collections Through Agency’s Sunset(5) $ 42,597,800
Source: Bay County Property Appraiser; Florida Department of Revenue (FDOR); GAI Consultants. Notes: (1) Reflects prior year Final taxable value in tax increment area according to FDOR (2) Reflects the total taxable value within the increment area less the St. Andrews CRA’s base year value(s) of: $15,932,884 (1989 Original) and $167,378,938 (2024 Expansion Area). (3) Assumes a 95%
rate from both Panama City and Bay County for the original St. Andrews CRA parcels, and assumes a reduced 74%
from the County for the expansion area. (4) Reflects historic 10-year total collections from 2015 to 2024. (5) Reflects projected 20-year collections from 2025 to 2044, the Agency’s sunset date—further detailed in Section 6, Financial Analysis.
ST. ANDREWS CRA MAP SERIES
Existing Land Use
Existing Land Use designations are classifications of property that describe the current use of the property. The Florida Administrative Code (“FAC”) requires Property Appraisers to classify each parcel of real property to indicate its use as determined for valuation purposes. This use is reflected in the Department of Revenue
(“DOR”) use codes applied to each real property on tax assessment rolls and depicts the existing use of the property.
The map below illustrates the Existing Land Use of parcels within the St. Andrews CRA, with the legend detailing the distribution of total land acres by Existing Land Use designation (see Figure 10).
Within the St. Andrews CRA’s approximately 644 total land acres, the predominant Existing Land Use designation is Residential, which comprises the largest share of total land area at 52.5%, followed by Commercial and Governmental with 27.3% and 9.7%, respectively, of this total share.
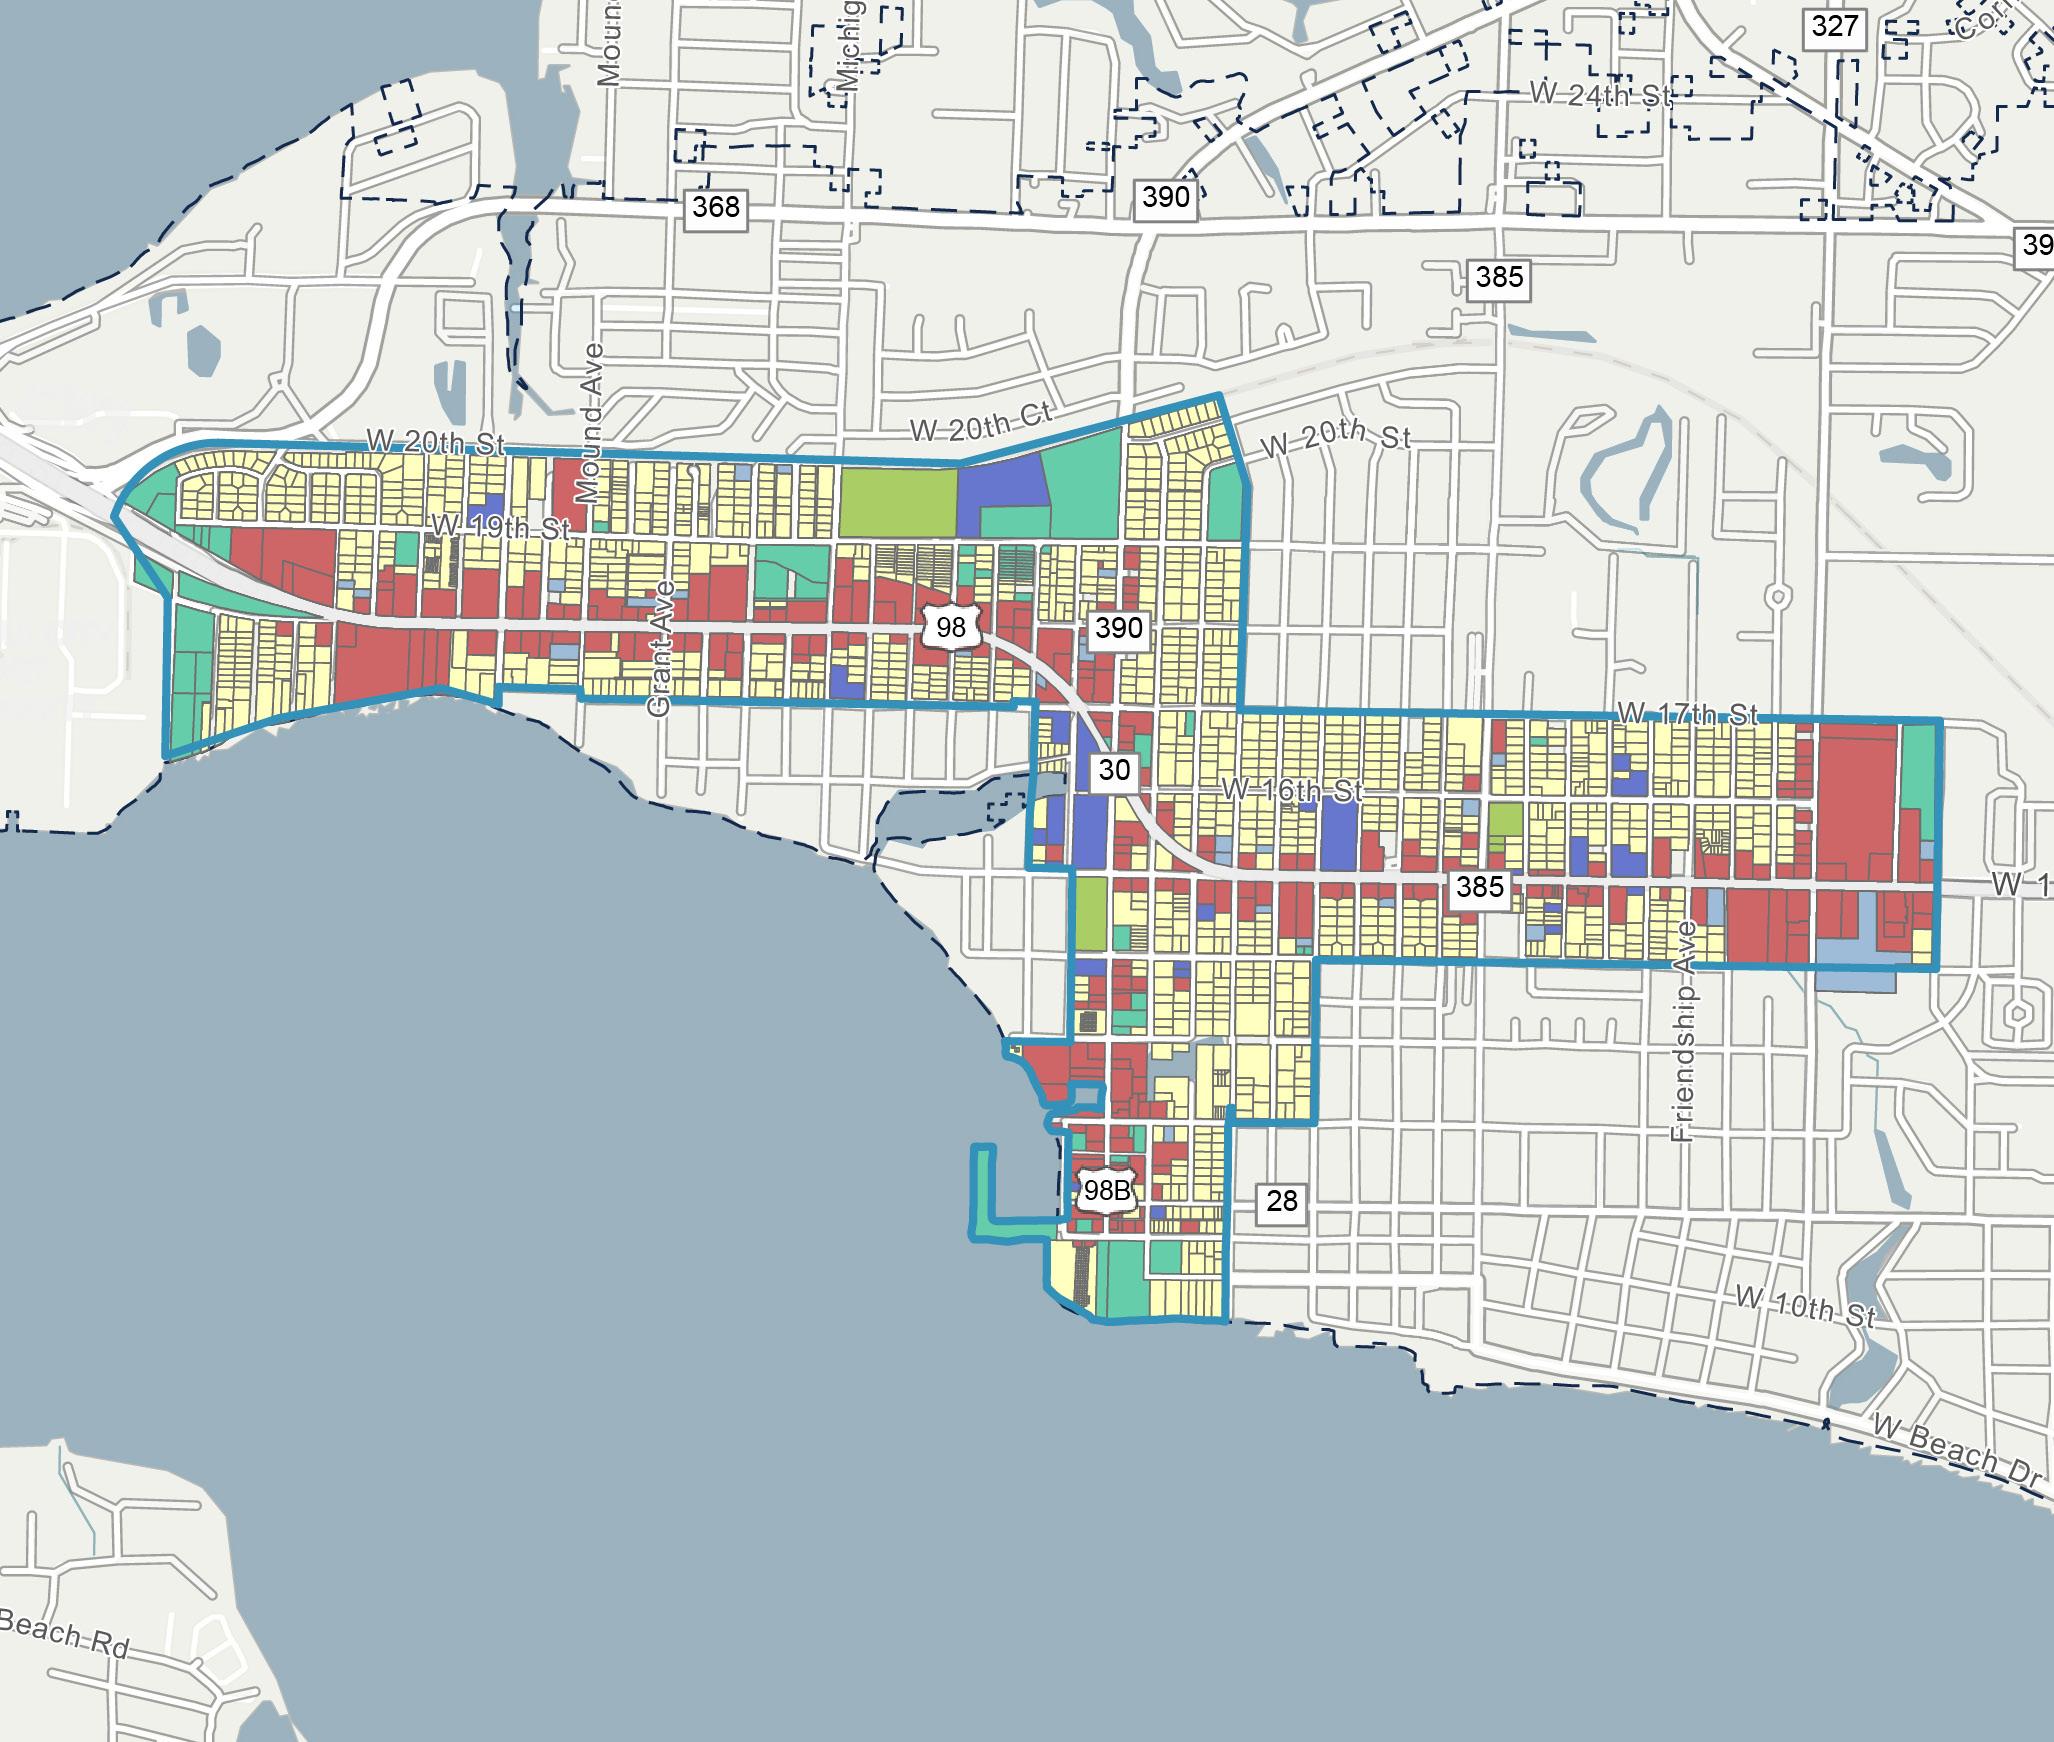
Figure
Future Land Use
Future Land Use designations are classifications of property that categorize permissible levels of intensity and/or density of development, in accordance with policies of the City’s Comprehensive Plan and the requirements of the City’s Land Development Regulations.
The map below illustrates the Future Land Use of parcels within the St. Andrews CRA, with the legend detailing the distribution of total land acres by Future Land Use designation (see Figure 11).
Within the St. Andrews CRA’s approximately 644 total land acres, the predominant Future
Land Use designation is the City Neighborhood Planning Area, which comprises the largest share of total land area at 27.0%, followed by Residential and General Commercial with 21.3% and 19.2%, respectively, of this total share.
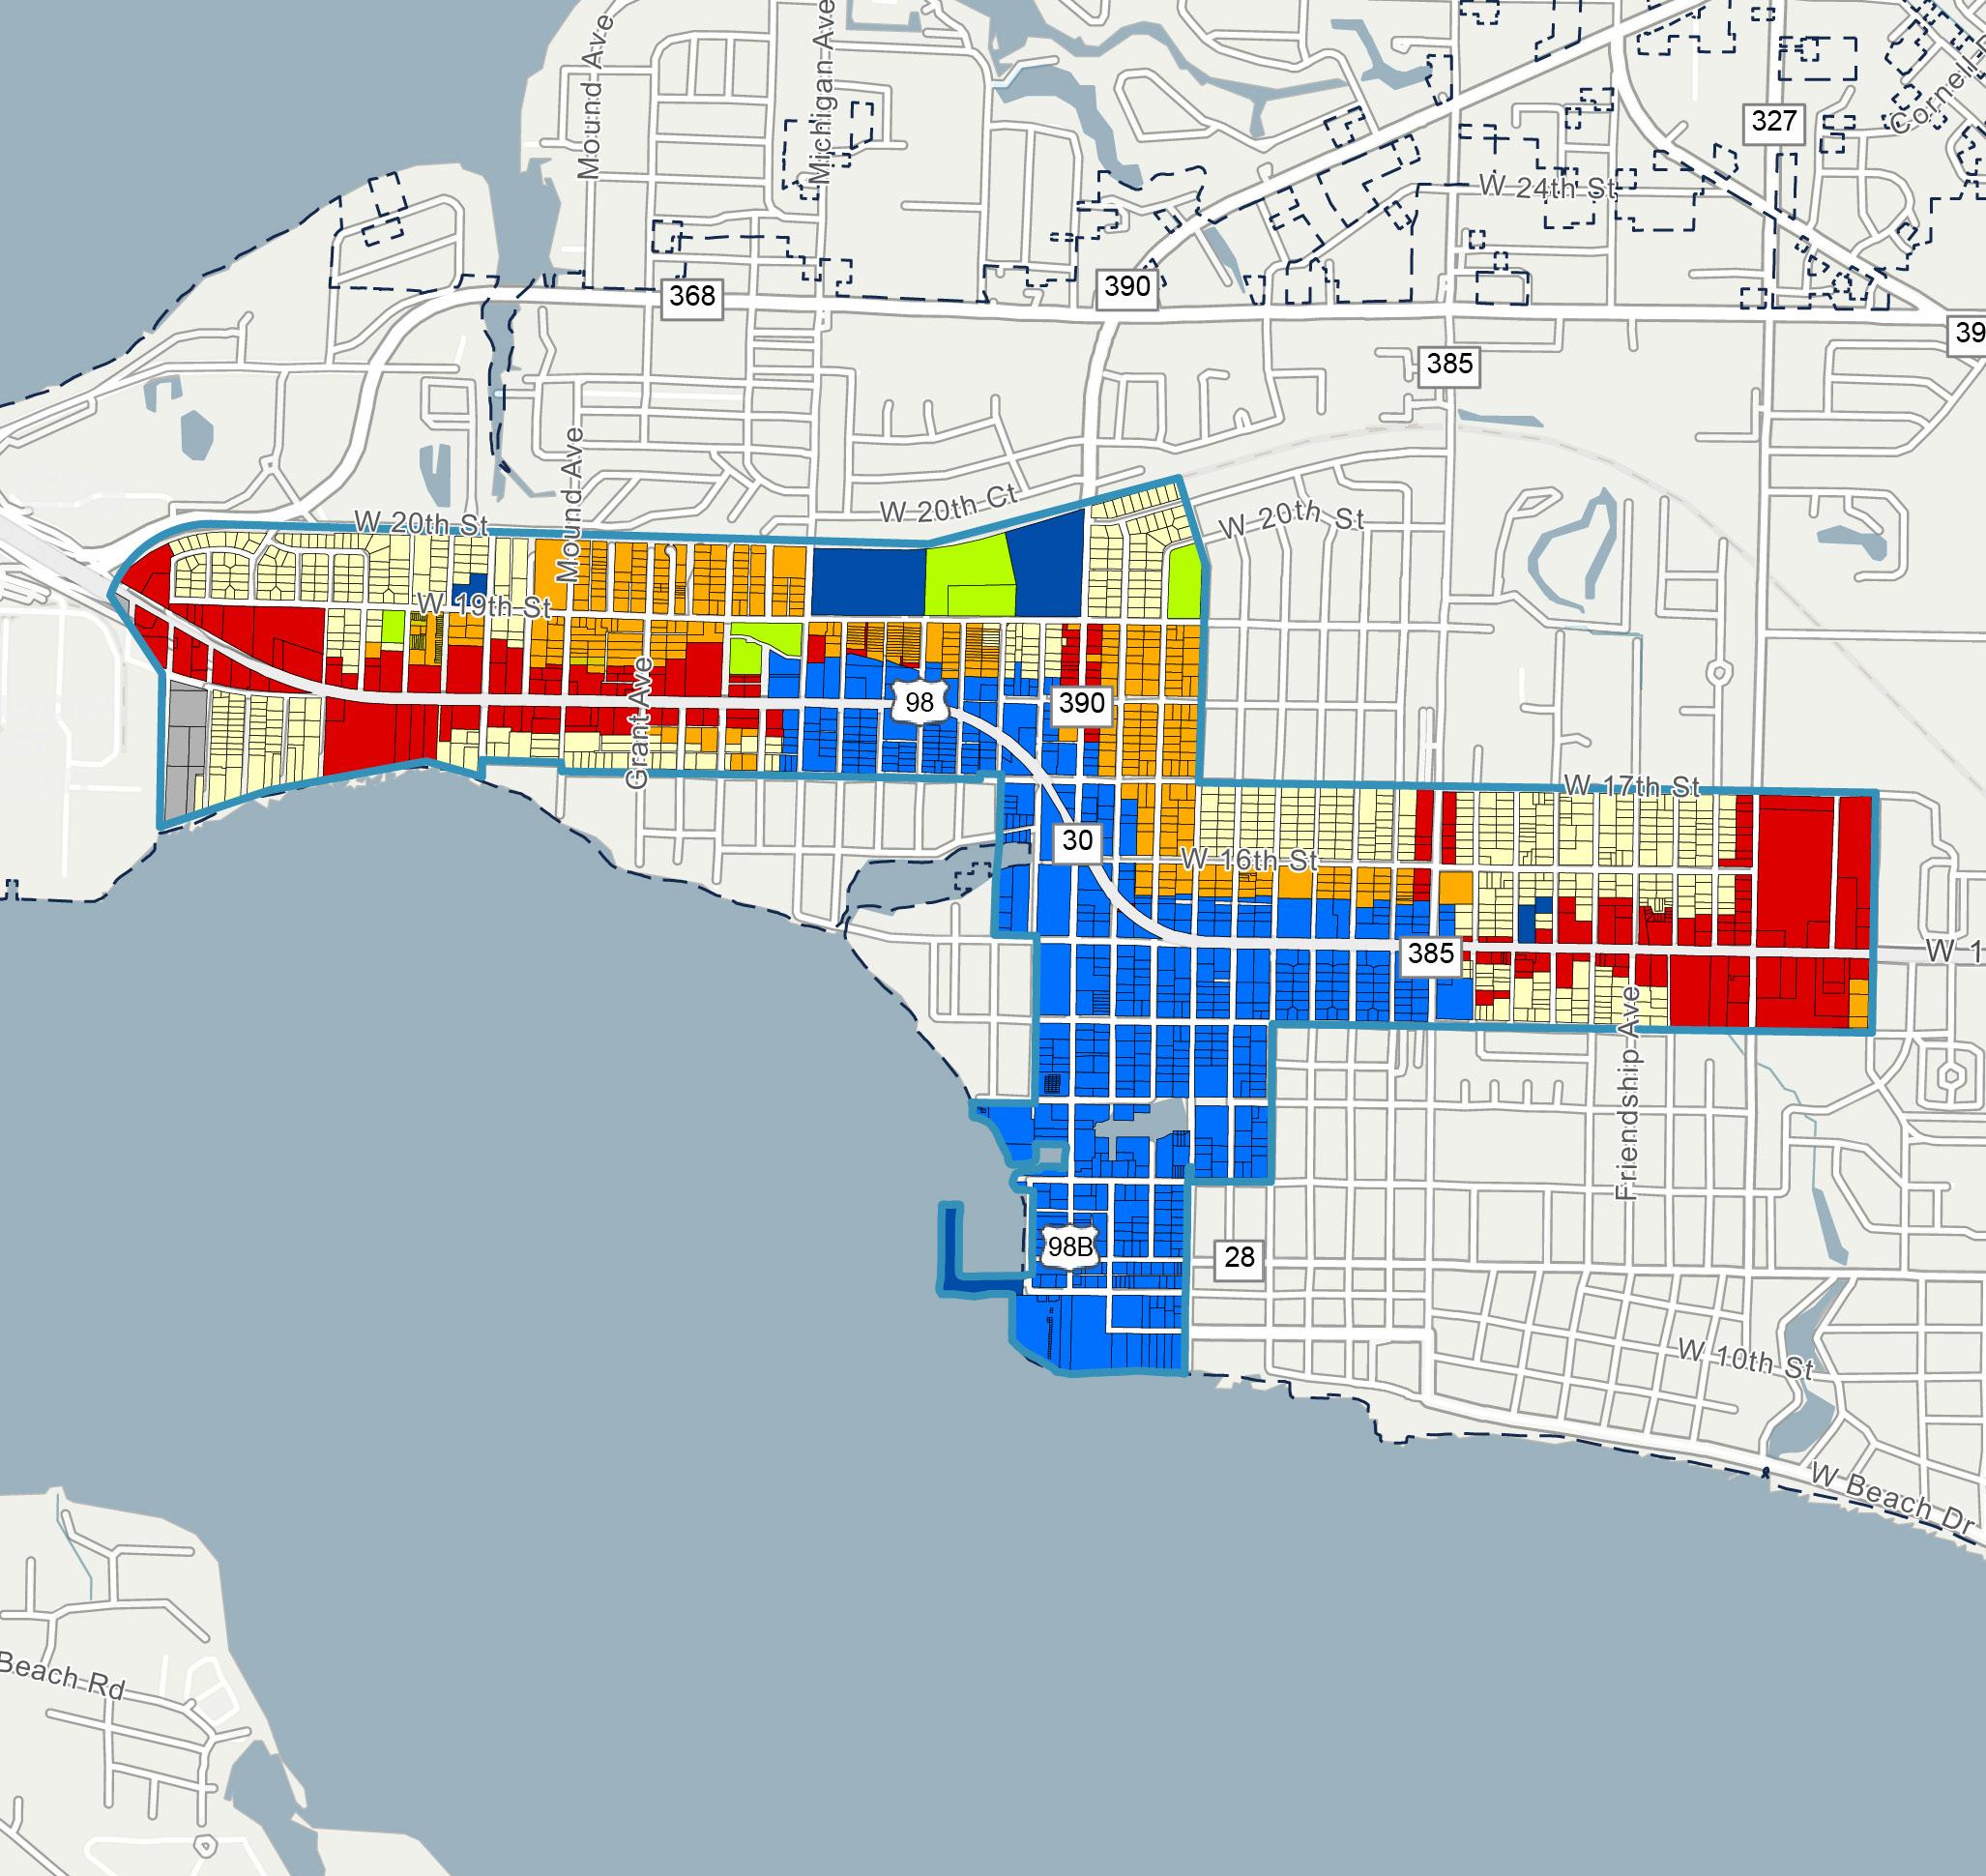
Figure 11. ST. AND re WS C r A F u T ure l AND u S e MAP
Zoning Zoning classifications describe the permitted uses and development standards applicable to a specific property, in accordance with policies of both the City’s Comprehensive Plan and the requirements of the City’s Land Development Regulations.
The map below illustrates the different Zoning classifications of parcels within the St. Andrews CRA, with the legend detailing the distribution of total land acres by Zoning classification (see Figure 12).
Within the St. Andrews CRA’s approximately 644 total land
acres, the predominant Zoning classification is Residential-1, which comprises the largest share of total land area at 23.7%, followed by General Commercial2 and Neighborhood General with 18.7% and 16.4%, respectively, of this total share. Legend
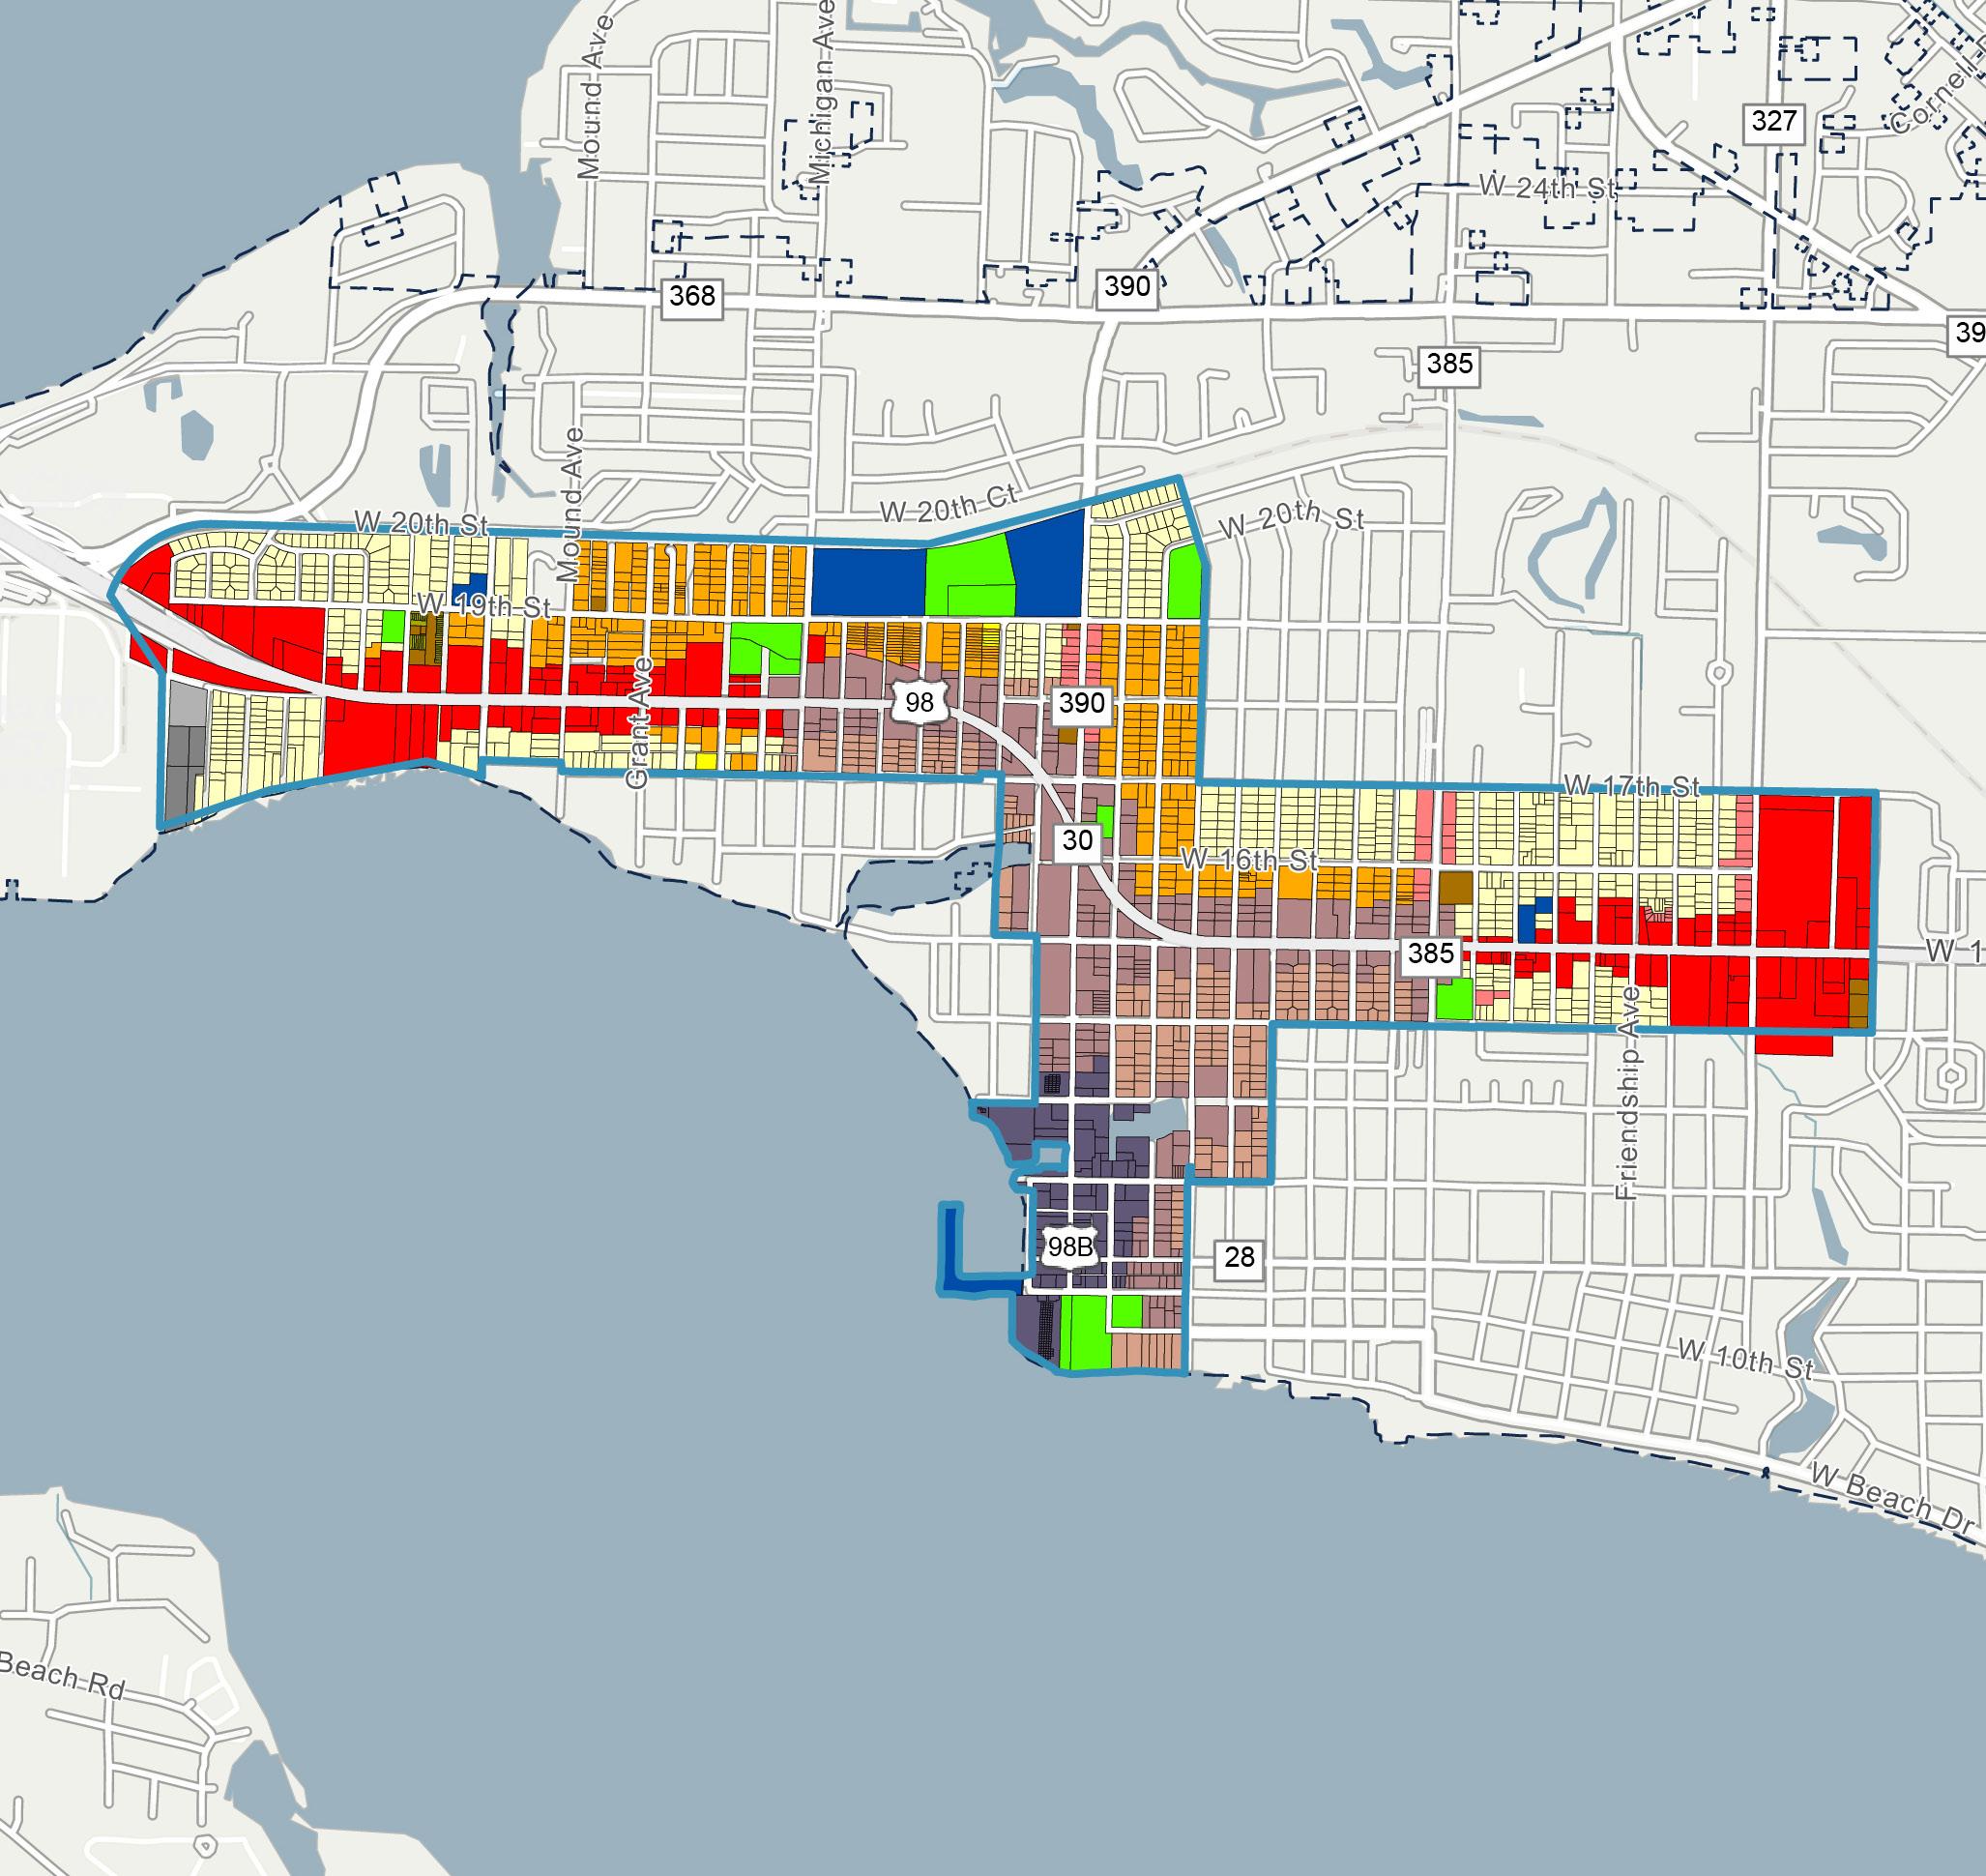
Figure 12. ST. AND re WS C r A ZON i N g MAP
City-Owned Parcels
City-Owned parcels are those located within the St. Andrews CRA that are owned by the City. These parcels may be utilized by the City and Agency to facilitate the implementation of redevelopment goals and strategies identified within this 2025 Plan.
The map below illustrates the City-Owned parcels within the St. Andrews CRA, with the legend detailing the distribution of total land acres by DOR classification (see Figure 13).
There are approximately 49 City-Owned parcels within the St. Andrews CRA, representing
2.5% of the total parcels in the area. Additionally, these 49 City-Owned parcels cover a total of 39.9 acres, which is approximately 6.2% of the total acreage within the St. Andrews CRA.
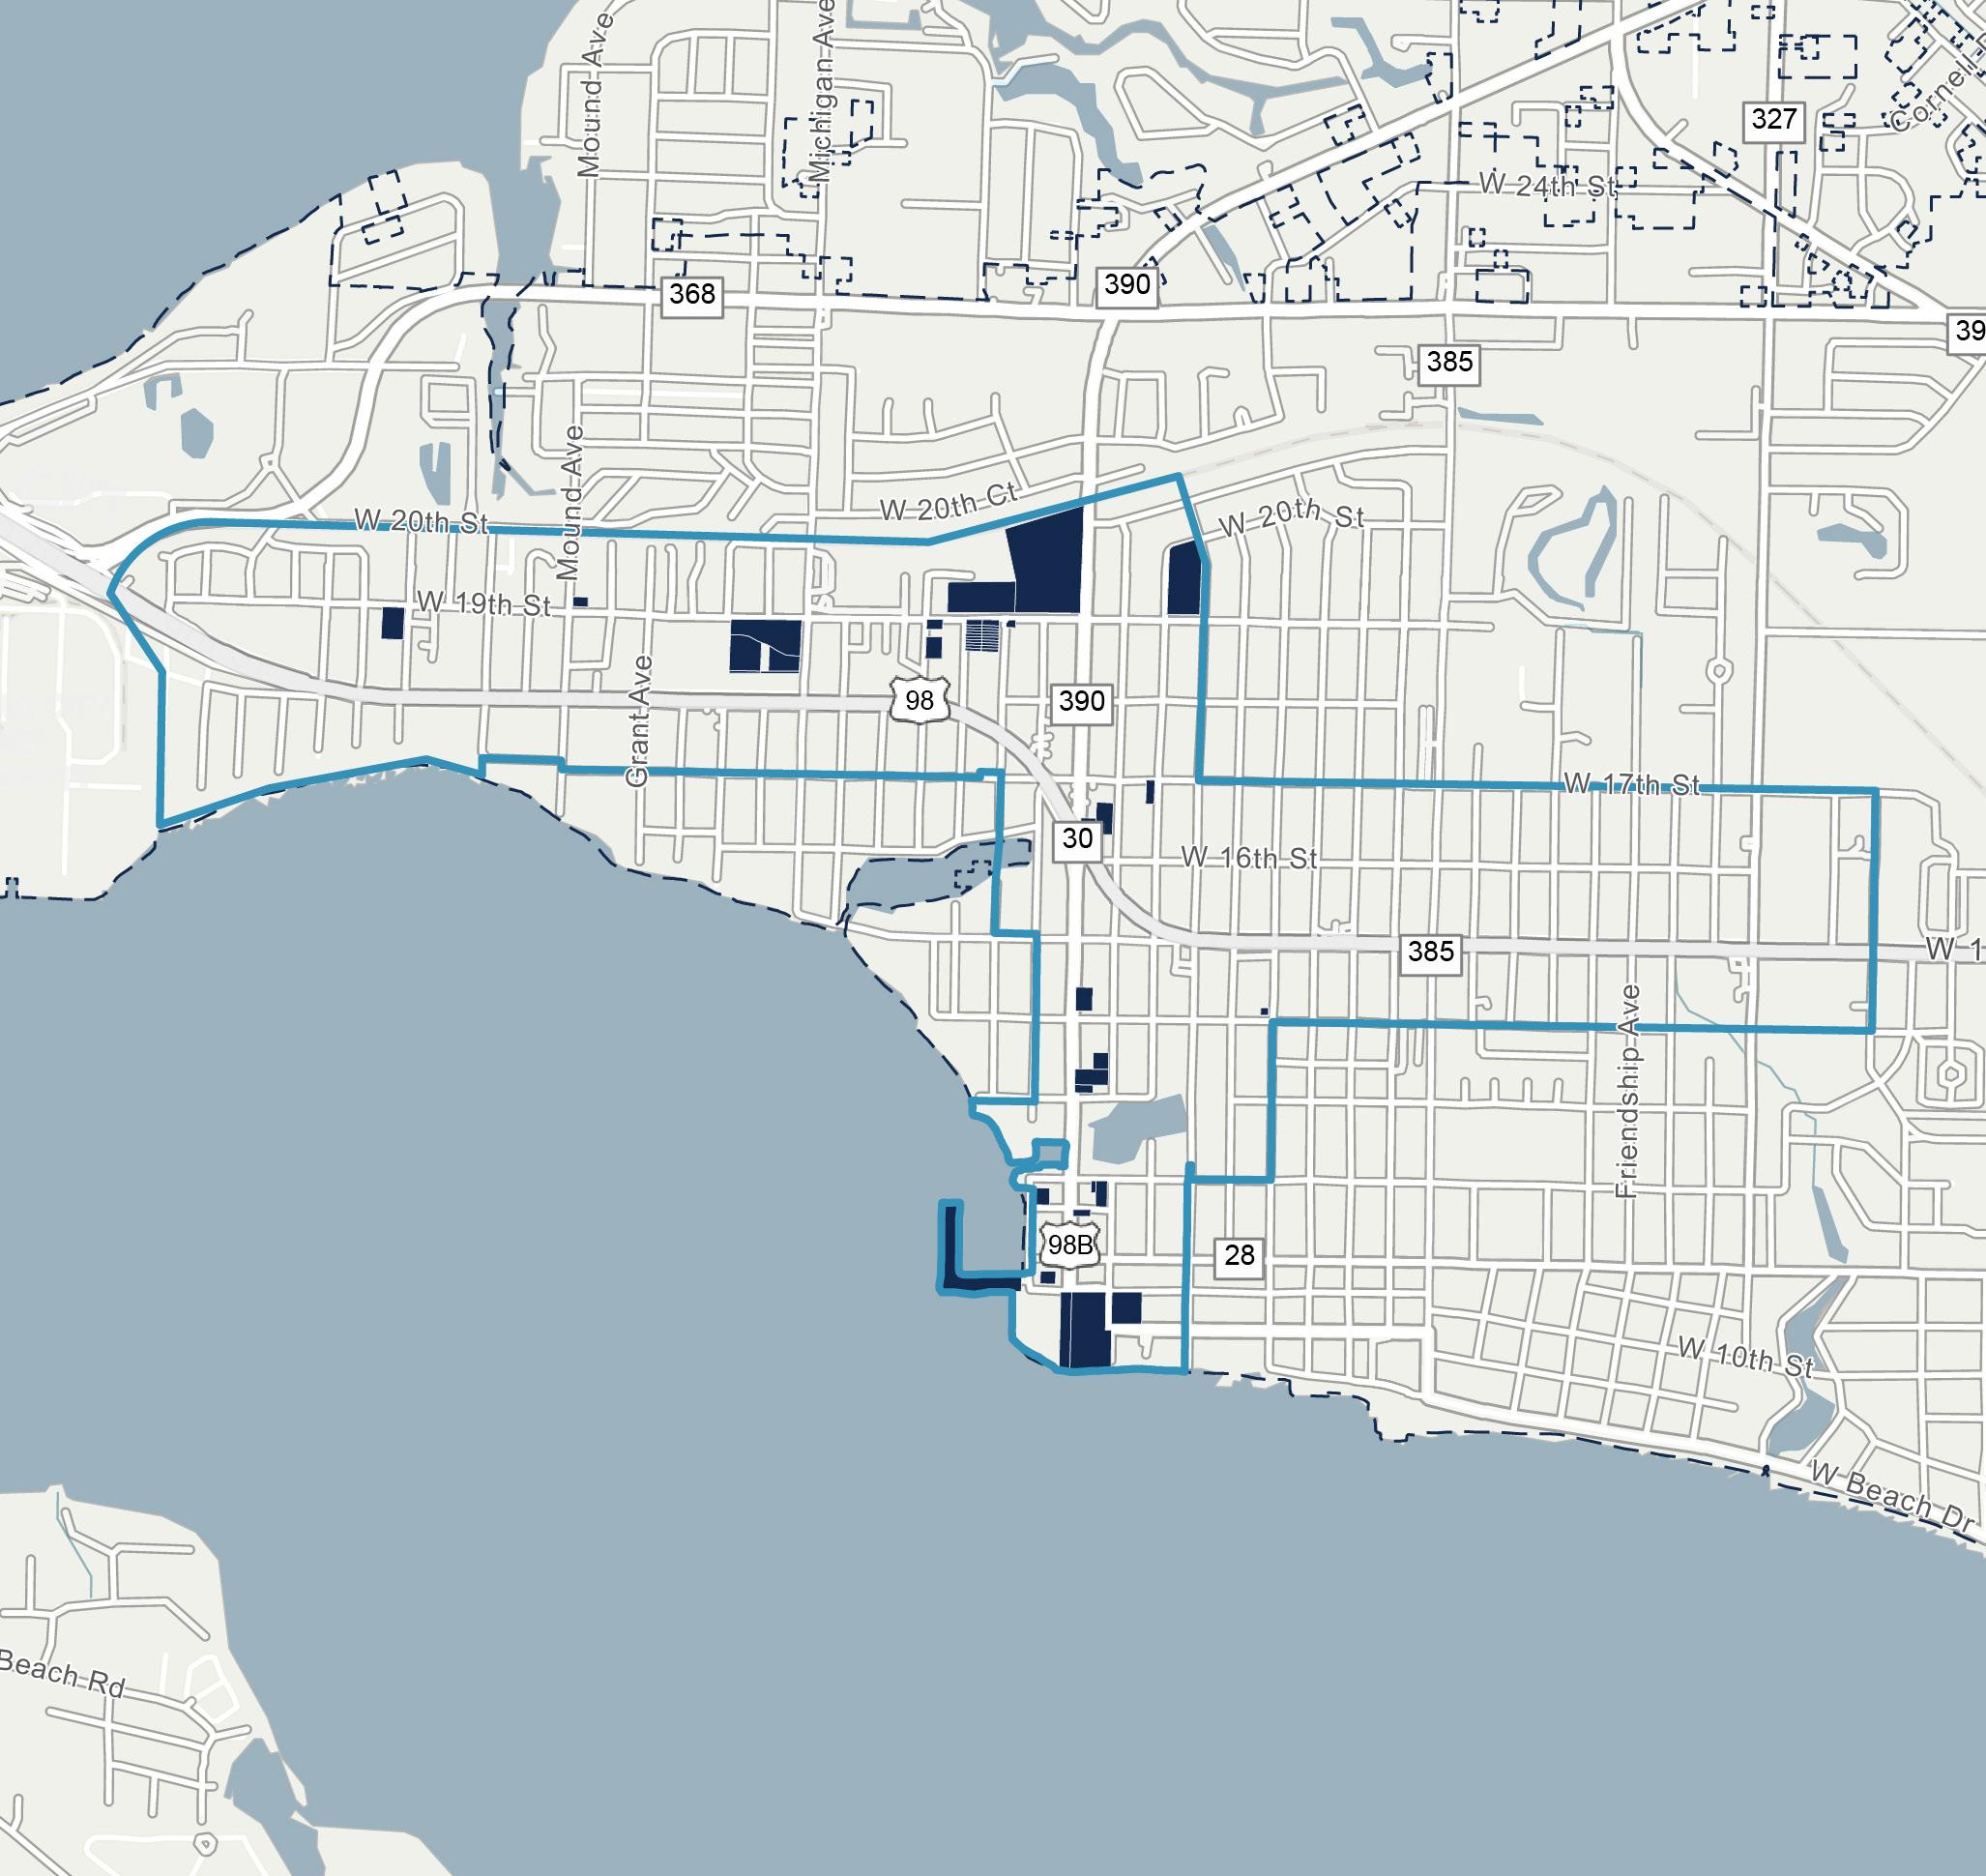
Figure 13. ST. ANDREWS CRA CITY-OWNED PROPERTIES MAP
Vacant Parcels
Vacant parcels are those within the St. Andrews CRA that are undeveloped and/or do not have a built structure upon them. The three categories of vacant parcels within the St. Andrews CRA include: Vacant Residential, Vacant Commercial, and Vacant Governmental, representing
redevelopment opportunities in their respective land use categories. To note, the Vacant Governmental parcels may be utilized by the City and Agency to facilitate the implementation of redevelopment goals and strategies identified in this 2025 Plan.
The map below illustrates the vacant parcels by DOR code within the St. Andrews CRA, with the legend detailing the distribution of total land acres by vacant parcel classification (see Figure 14). The majority of vacant land within the St. Andrews CRA is primarily Vacant Residential.
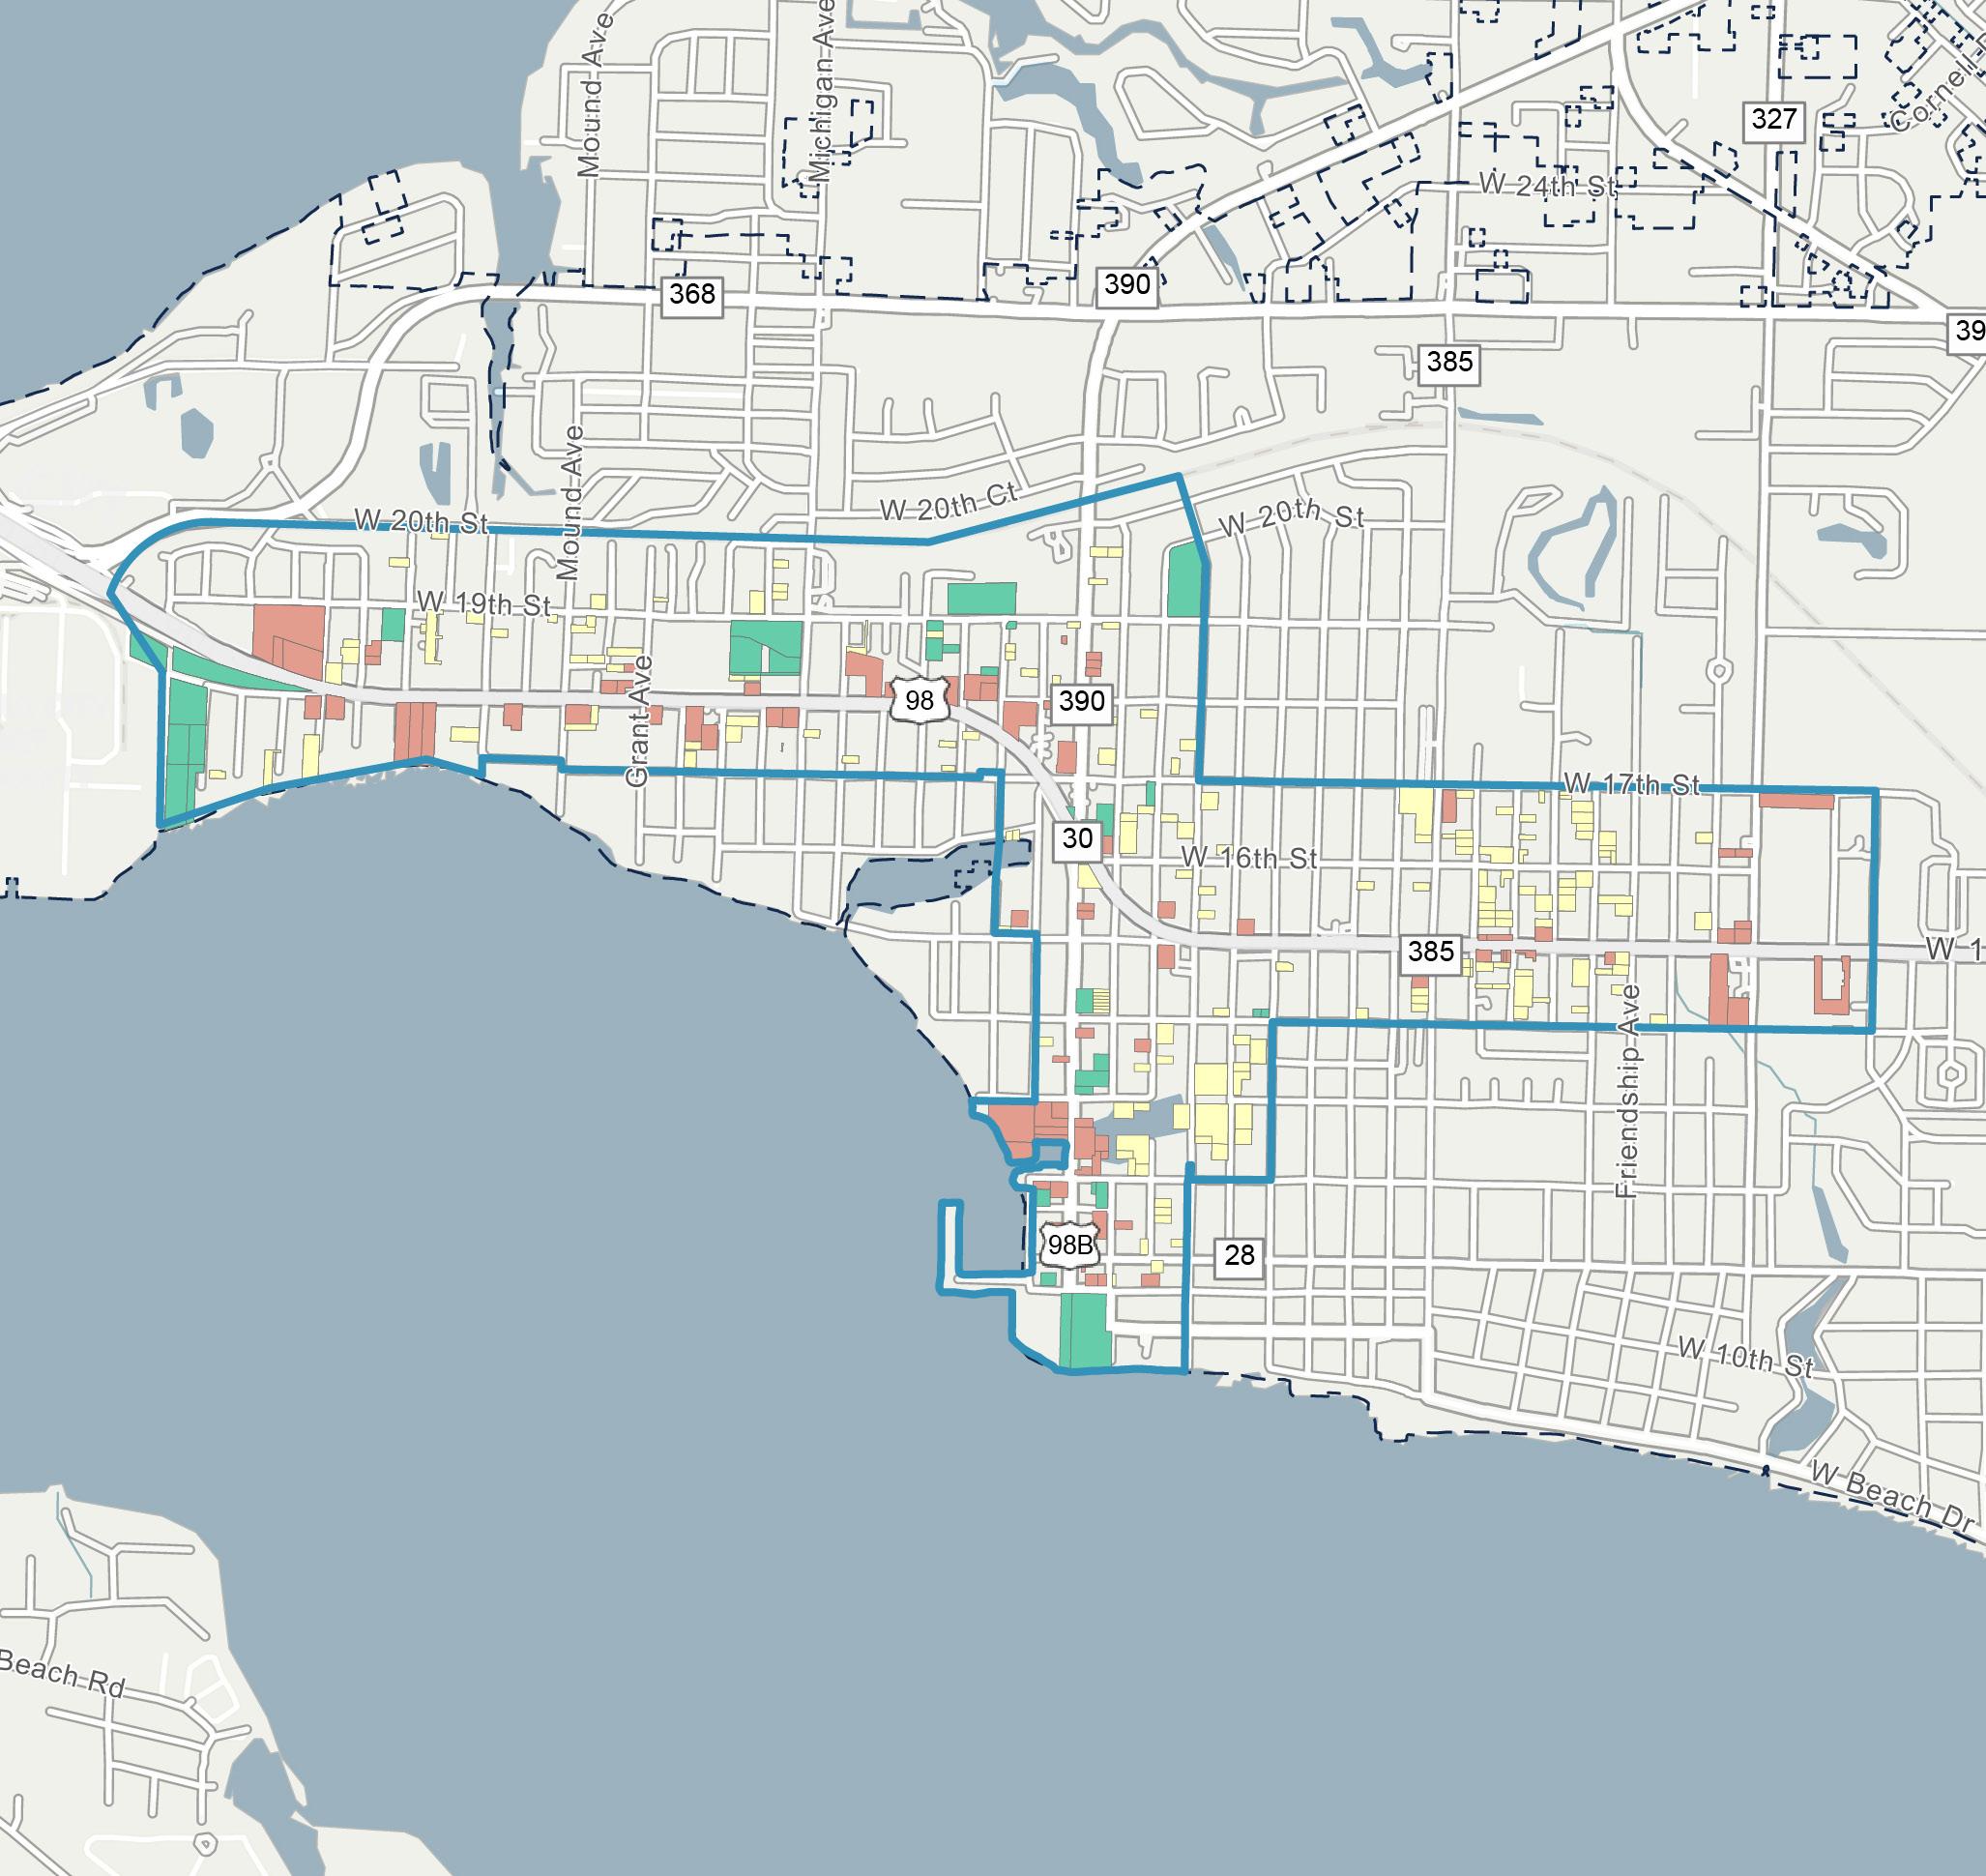
Figure 14. ST. AND re WS C r A VACANT PA rC el S MAP
MARKET ASSESSMENT AND DEMOGRAPHIC PROFILE
Overview
There are many key market characteristics, along with demographic and socioeconomic indicators to consider when assessing the overall market supporting demand within the St. Andrews CRA; these include:
▪ Market Performance
▪ Population
▪ Age Distribution
▪ Housing Characteristics
▪ Race and Ethnicity
▪ Academic Achievement
▪ Income Characteristics
▪ Employment and Business Activity
As of year-end 2024, the St. Andrews CRA is home to a population of 3,530 persons— composing 10% of the total population within the City. The St. Andrews CRA has a population density of 2,556 persons per square mile, with a median age of 42 years old. Total population within the St. Andrews CRA has as experienced a negative CAGR of 0.1% since 2010: from a total population of 3,590 persons in 2010 to 3,530 persons in 2024.
There are about 1,750 total housing units within the St. Andrews CRA—composing 10% of the total housing units within the City. Total housing units within the St. Andrews CRA experienced a negative CAGR since 2010 at 0.5%: from nearly 1,870 housing units in 2010 to 1,750 housing units in 2024. Of the 1,750 housing units within the St. Andrews CRA as of yearend 2024, approximately 52% are owner-occupied with the remaining 48% renter-occupied units. As of year-end 2024, the housing unit vacancy rate within the St. Andrews CRA is 17%.
In addition, roughly 60% of the total population within the St. Andrews CRA make up the working-class population, typically defined as persons between the ages of 20 and 64. Almost 92% of the total population within the St. Andrews CRA have obtained their high school diploma or greater, with nearly 25% obtaining a bachelors’ degree or a more professional/graduate degree.
Population within the St. Andrews CRA is predominately White at 61%, followed by Black/African-American with 15%; approximately 18% of the population identify as Hispanic ethnicity, as of year-end 2024.
The St. Andrews CRA is also home to 3,090 total employees and 347 business as of year-end 2024. Total employment within the St. Andrews CRA composes 8.8% of the total employment within the City. Total employment within the St. Andrews CRA has experienced a positive CAGR of 5.8% since 2010: from 1,320 total employees in 2010 to 3,090 total employees in 2024.
As of year-end 2024, the major industry sectors, dominating the employment market within the St. Andrews CRA include
accommodation and food services, retail trade, and educational services—combined, these industries compose 47% of the total St. Andrews CRA employees. In addition, the unemployment rate within the St. Andrews CRA at 4.6% is less than that of the City at 5.1%, as of year-end 2024.
As of year-end 2024, the St. Andrews CRA is made up of approximately 1.26 million square feet (“SF”) of combined commercial uses (i.e., office, retail, and industrial/flex)—composing 7.9% of the City’s combined commercial space. In addition, the St. Andrews CRA contains approximately 245 for-rent multi-family residential units, composing 3.9% of the City’s forrent residential market. The St. Andrews CRA contains 460 hotel rooms as of year-end 2024. The table below illustrates the yearend 2024 market characteristics for the St. Andrews CRA’s commercial, for-rent residential, and hotel market(s); see Table 4
The graphs and figures on the following page illustrate the year-end 2024 demographic and socio-economic characteristics of the St. Andrews CRA.
St. Andrews CRA Demographic and Socio-Economic Characteristics POPULATION in the St. Andrews CRA
3,530
Total population comprises 10% of the total population within Panama City.
1.38
HOUSING CHARACTERISTICS
2.4
1,750 HOUSING UNITS in the St. Andrews CRA

The total housing units within the St. Andrews CRA make up approximately 10% of the total housing units within Panama City.
EDUCATION

3,090
EMPLOYEES in the St. Andrews CRA
Represents an employee to population ratio of 0.9 persons per job, and comprises 8.8% of the total employees within Panama City.
UNEMPLOYMENT RATE
1,633
1,401

OUTFLOW(1)
51 Employed and Living in the Area
CHARACTERISTICS
$319,640 Average Home Value
$29,457 Per Capita Income
$42,159 Median Disposable Income
$46,634 Median Household Income

GOALS, OBJECTIVES, AND ACTION STRATEGIES
As a part of this 2025 Plan, major goals, objectives, and action strategies were identified specifically for the St. Andrews CRA. The action strategies for achieving each objective are outlined beneath their respective objectives below.
The Agency’s major goals in this 2025 Plan include creating:
1. Support Economic Growth, Job Creation, and Small Business

Development
2. Expand Housing Opportunities
3. Improve Infrastructure, Mobility and Connectivity
4. Enhance Public Safety
5. Activate and Improve the Waterfront
6. Enhance Open Spaces, Recreation and Community Facilities
7. Promote Cultural Identity and History
8. Advance Sustainability and Resilience
These major goals, objectives, and action strategies guide the Agency in evaluating projects and programs for potential implementation to address the opportunities and challenges facing the St. Andrews CRA.
Support Economic Growth, Job Creation, and Small Business Development
The support economic growth, job creation, and small business development, the objectives and strategies listed are intended to support the St. Andrews CRA's current businesses, residents, and employees by investing and enhancing residential and commercial spaces.
Objective 1: Prioritize infrastructure improvements and amenity installation that will facilitate new development.
▪ Evaluate reinvestment of TIF revenues generated from specific projects to facilitate the accelerated installation of improvements or amenities that will mitigate projects’ potential impacts and/or enable the realization of redevelopment objectives.
▪ Attract and encourage mixed-use, commercial, and economic development and redevelopment by supporting tourism, seafood, and creative economy sectors.
▪ Acquire or receive strategic properties, including vacant buildings, and support necessary site preparation, to facilitate redevelopment, entrepreneurship, and job creation by securing key commercial parcels to support economic activity.
▪ Develop projects when necessary to catalyze investment, fill gaps, or address community needs.
Objective 2: Evaluate alternate funding sources to supplement the Redevelopment Trust Fund for infrastructure projects.
▪ Evaluate opportunities to partner with the City to provide cost sharing and/ or funding support for infrastructure improvements, capital projects, and programs that implement shared redevelopment and economic development objectives.
▪ Identify alternate funding sources for projects and programming to supplement the Redevelopment Trust Fund (i.e., grant funding, non-profit organizations, and private sector partnerships).
▪ Provide targeted incentives such as TIF, grants, and fee waivers to stimulate improvements or private investment.
Objective 3: Develop Incentive Programs designed to facilitate desired redevelopment projects.
▪ Coordinate proposed private sector development with public sector improvements to identify shared development objectives.
▪ Utilize TIF incentives for private sector improvements that implement redevelopment strategies.
▪ Identify potential sites for mixed-use development and collaborate with property owners on outreach efforts.
▪ Streamline and fund commercial and residential grant programs for applicants.
▪ Identify potential publicprivate partnerships (“P3”) for targeted development and parking facilities’ development.
Objective 4: Modify zoning to match the overall neighborhood vision.
▪ Replace general commercial zoning on neighborhood corridors.
▪ Collaborate with City to revise building setbacks; add parking setbacks and adjust parking ratios; and add walkability support standards.

▪ Encourage “missing middle” housing types.
Objective 5: Formulate economic development strategies that provide St. Andrew CRA residents access employment opportunities.
▪ Partner with educational institutions and training providers to support workforce development.
Expand Housing Opportunities
▪ Support technical assistance, workforce development and mentorship programs.
▪ Promote, support and grow small business development.
To expand housing opportunities, the objectives and strategies listed are intended to support mixed-use housing opportunities and encourage adaptive reuse of land to support the St. Andrews CRA's residents.
Objective 1: Incentivize infill housing on vacant lots to make the area more complete.
▪ Develop buildings that follow the pattern established by existing precedents, with shopfronts and streetoriented buildings defining a pleasant pedestrian environment in the St. Andrews CRA.
▪ Encourage residential ownership, improvement, and investment.
▪ Collaborate with City to update zoning codes that specify the placement and massing of buildings, and include building design standards to ensure quality, durability, and agreeable proportions.
▪ Encourage townhome and multifamily infill housing.
▪ Provide incentives for affordable mixed-use housing.
Objective 2: Redevelop vacant and boarded properties to encourage adaptive reuse, infill development, and to improve the investment image of the community.
▪ Accept land donations or acquire parcels to support residential goals.
▪ Provide relocation assistance to residents and businesses displaced by redevelopment projects, ensuring equitable transitions and minimizing hardship during community transformation.
▪ Preserve historic residential fabric.
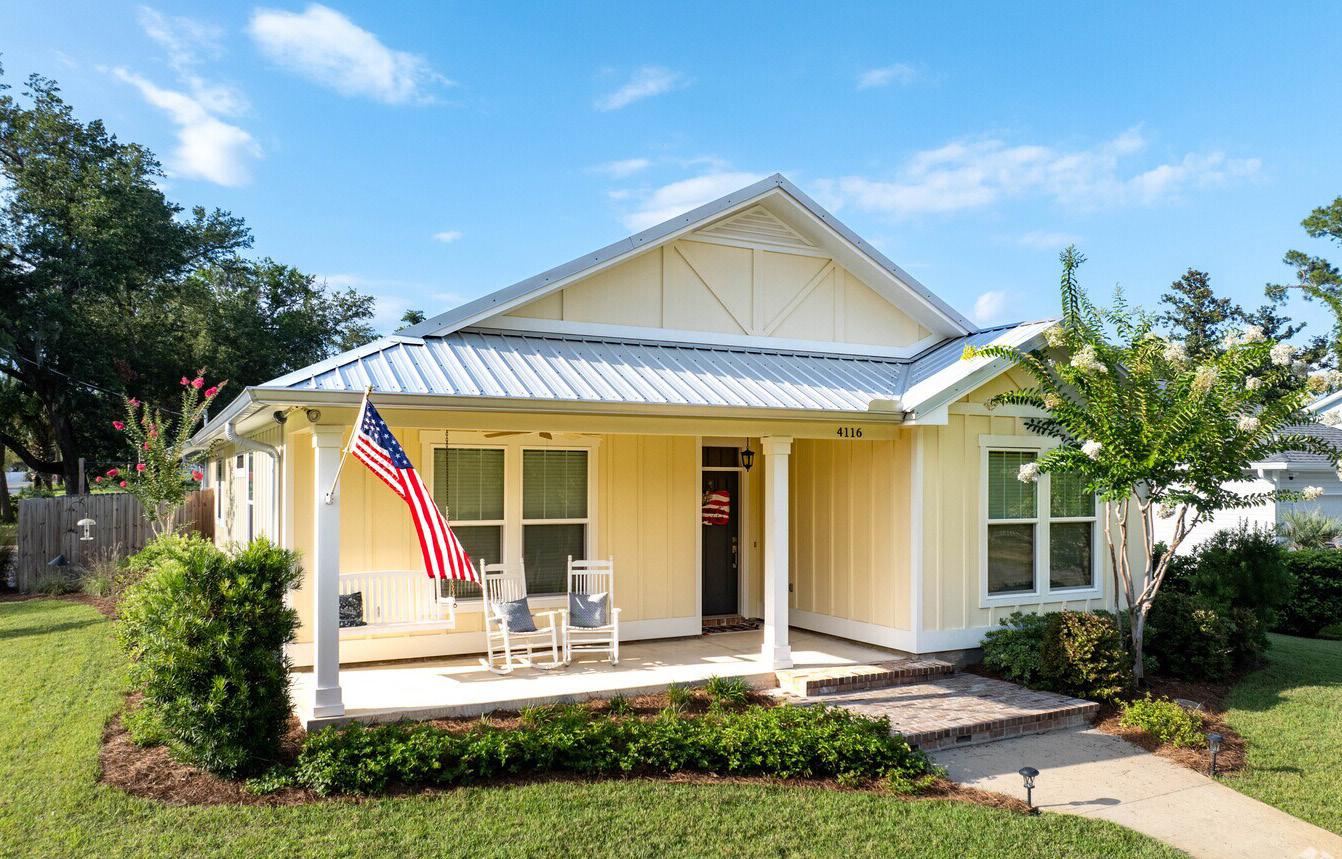

Improve Infrastructure, Mobility, and Connectivity
To improve infrastructure, mobility, and connectivity, the objectives and strategies listed are intended to support the St. Andrews CRA's neighborhoods by providing necessary infrastructure and transportation improvements.
Objective 1: Address parking issues and invest in new parking facilities to support local business and boating activities.
▪ Periodically evaluate all existing public parking areas within the St. Andrews CRA to identify and prioritize potential improvements. Potential improvements may include: resurfacing/grading; stormwater improvements; lighting improvements; signage improvements; accessibility (ADA) improvements; parking space configuration/ delineation.
▪ Collaborate with the City to provide run shuttles from remote parking lots near U.S.

Hwy. 98 to make best use of existing parking resources.
▪ Develop new parking locations that preserve the historic setting.
▪ Consider surface lots and parking structures on Cityowned parcels.
▪ Create a parking garage which could provide needed parking for existing businesses.
Objective 2: Provide and/ or Encourage Public Realm Improvements.
▪ Support upgrading and modernizing roads, stormwater systems, and utility infrastructure.
Enhance Public Safety
– Integrate smart infrastructure and emerging technologies— such as broadband/fiber networks, EV charging stations, and real-time transit systems—into projects funded by the CRA to improve longterm functionality and competitiveness.
▪ Implement complete streets with lighting, sidewalks, and bike lanes.
▪ Improve regional connectivity through upgraded public transit, complete streets, and expanded pedestrian and bicycle networks.
To enhance public safety, the objectives and strategies listed are intended to support the St. Andrews CRA's community and partners to ensure safe streets and provide safety initiatives.
Objective 1: Enhance Public Safety throughout the St. Andrews CRA.
▪ Support Crime Prevention Through Environmental Design (CPTED) principles into improvements and projects funded by the CRA.
▪ Partner with local law enforcement and community organizations to support proactive public safety initiatives and community policing efforts.
▪ Support programs and facilities that reduce loitering, illegal dumping, and vandalism through strategic activation of underutilized spaces.
▪ Increase safety on and along roads for pedestrians, cyclists, and motorists by reducing tractor trailer traffic.
Objective 2: Secure and repair infrastructure to support safety initiatives.
▪ Identify and demolish decrepit and unsound structures which contribute to blight and pose safety and health risks.
▪ Improve lighting, visibility, and pedestrian infrastructure to enhance safety in public spaces.
▪ Implement rights-of-way and vacant properties maintenance program(s) surpassing City
minimum maintenance standards in accordance with maintenance agreement between City and Agency.
▪ Encourage the redevelopment of blighted or abandoned properties that contribute to unsafe conditions.
▪ Install or improve security infrastructure (e.g., cameras, emergency call stations) in key public areas when appropriate.
▪ Promote safe, walkable, and accessible environments through streetscape improvements and trafficcalming measures.

Activate and Improve the Waterfront
To activate and improve the waterfront in the St. Andrews CRA, the objectives and strategies listed are intended to encourage updating plans that support local businesses and create a thriving public space around St. Andrews Marino.
Objective 1: Increase water access and recreational opportunities through infrastructure improvements and investments.
▪ Develop an iconic space by adding needed facilities and infrastructure.

▪ Make kayaks accessible to the community to increase water activities.
▪ Develop waterfront paths for kayaks.
▪ Preserve working waterfront and seafood docks.
▪ Develop public waterfront amenities and connections.
▪ Integrate flood and storm surge protection measures.
▪ Acquire key parcels to ensure continued waterfront access and use.
Enhance Open Spaces, Recreation, and Community Facilities
To enhance open spaces, recreation, and community facilities, the objectives and strategies listed are intended to support the continuation of streetscape projects, while focusing on developing a comprehensive signage program and functional community spaces.
Objective 1: Strengthen the St. Andrews CRA through improved bike and pedestrian facilities and connections to the historic waterfront.
▪ Connect the waterfront area with a combination of safe bicycle routes and pedestrian networks.
▪ Prepare a trail plan connecting to planned and existing regional trail network(s).
Objective 2: Evaluate and prioritize streetscaping opportunities.
▪ Identify, evaluate, and prioritize locations for streetscape updates, new sidewalk connections, and improvements to existing pedestrian ways and paths. Initial roadways for consideration include: Beck Avenue; Bayview Avenue; 11th Court; 12th Street; 14th Street; 15th Street, and U.S. Hwy. 98.
▪ Include at least one streetscape, sidewalk, or neighborhood connection improvement project in each
years’ CRA Annual Work Plan, contingent on the availability of funding sources.
▪ Coordinate with Bay County Transportation Organization and FDOT’s 10-Year Capital Improvement and Roadway Resurfacing Program on the U.S. Hwy. 98 streetscape design and installation.
Objective 3: Improve existing open spaces and include new open spaces and green infrastructure.
▪ Improve Oaks by the Bay, Villa Gateway Park and other public waterfront spaces by improving the canopy cover, lighting, and other amenities in Oaks By the Bay Park. Restore waterfront areas.
▪ Enhance aesthetics through use of decorative lighting in parks and along roadways, seasonally or year-round.
▪ Enhance small parks with trails, shade structures, and recreation features.
▪ Improve, develop and maintain recreation buildings, facilities and spaces.
▪ Maintain and enhance CRA improvements and vacant properties to support safe, attractive, and functional public spaces.
▪ Acquire or re-purpose land for public recreation.
▪ Address flood prone areas and increase resiliency through the Green BlueFramework, including the following initiatives:
– Develop a comprehensive coastal resiliency plan.
– Extend bicycle connections to adjacent neighborhoods to strengthen network.
– Restore wetlands and trails in Sweet Bay Preserve.
Objective 4: Redevelop the St. Andrews Marina into a vibrant public space and working waterfront.
▪ Redesign the St. Andrews Boardwalk to be a “flexible space” that can accommodate Community Events, the Farmers Market, etc.
▪ Design a non-motorized launch from transient slips at the St. Andrews Marina.

Promote Cultural Identity and History
To promote cultural identity and history, the objectives and strategies listed are intented to support historic preservation efforts through community education programs and implementing streetscape designs that will promote a community identity.
Objective 1: Invest in arts, culture, and sense of community.
▪ Install public art, wayfinding, and historic interpretation.
▪ Develop cohesive design standards that reflect neighborhood identity and reinforce sense of place.
▪ Highlight maritime and neighborhood history with signage.
▪ Improve entry to the St. Andrews CRA on Beck Avenue as a gateway area with neighborhood signage, public art, and improved streets and public spaces.
▪ Recognize and preserve the unique heritage of the district through plaques, murals, and interpretive displays.
▪ Support community-based historic preservation efforts.
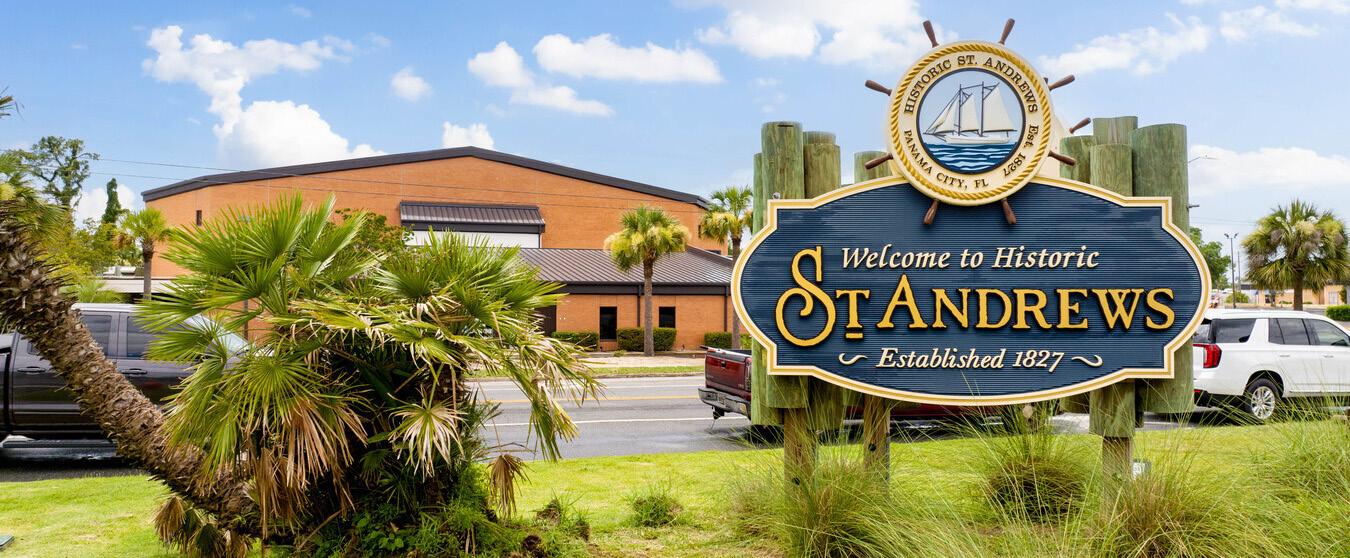

Advance Sustainability and Resilience
To advance sustainability and resilience, the objectives and strategies listed are intended to develop and implement plans that create energy efficient infrastructure throughout the St. Andrews CRA with a focus on the Marina.
Objective 1: Promote CRAwide resiliency infrastructure upgrades.
▪ Build stormwater capacity with green infrastructure.
▪ Promote tree planting, incorporate native landscaping and renewable energy upgrades.
▪ Support energy-efficient and resilient building practices.
▪ Support resilience planning for flood-prone areas.
▪ Install solar lighting in parks, trails, and public spaces to reduce energy use and enhance safety.
▪ Implement urban heat mitigation strategies such as expanded tree canopy, shaded streetscapes, and reflective surfaces to improve livability and address climaterelated impacts.
HISTORIC ST. ANDREWS GATEWAY SIGN | SOURCE HOMES.COM
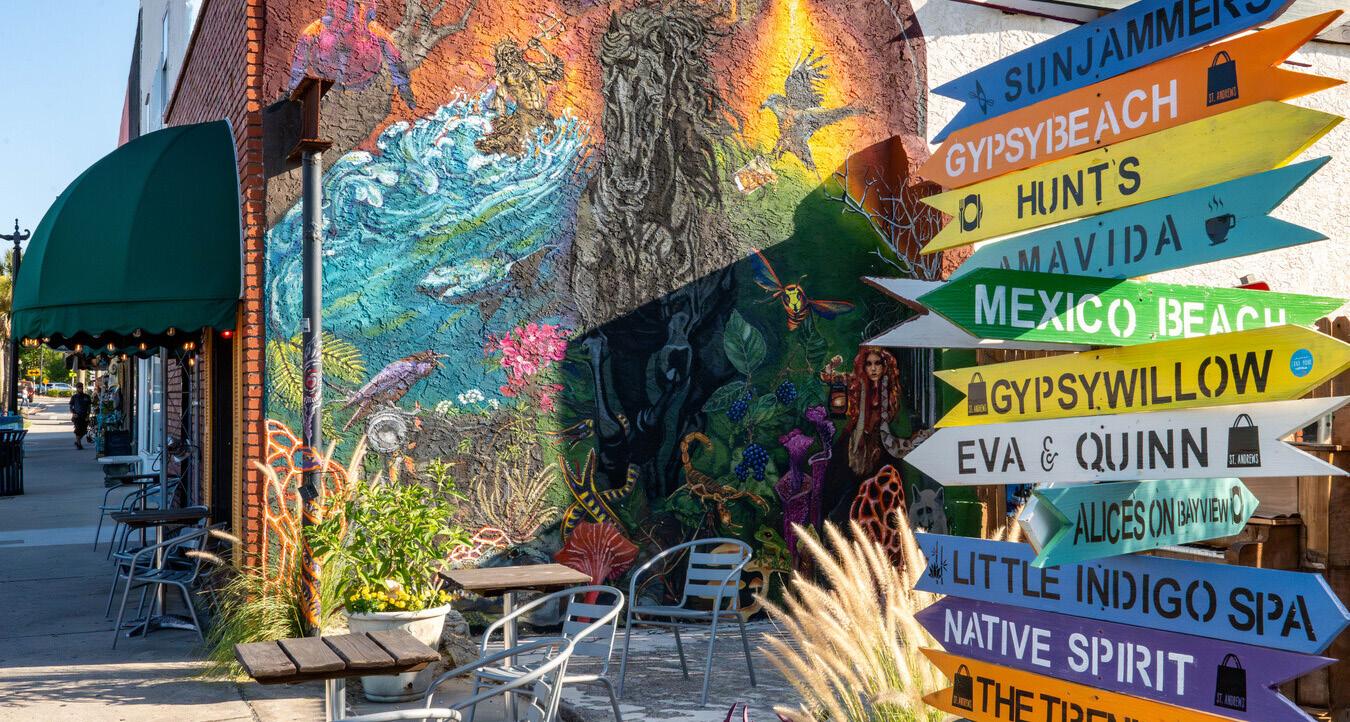
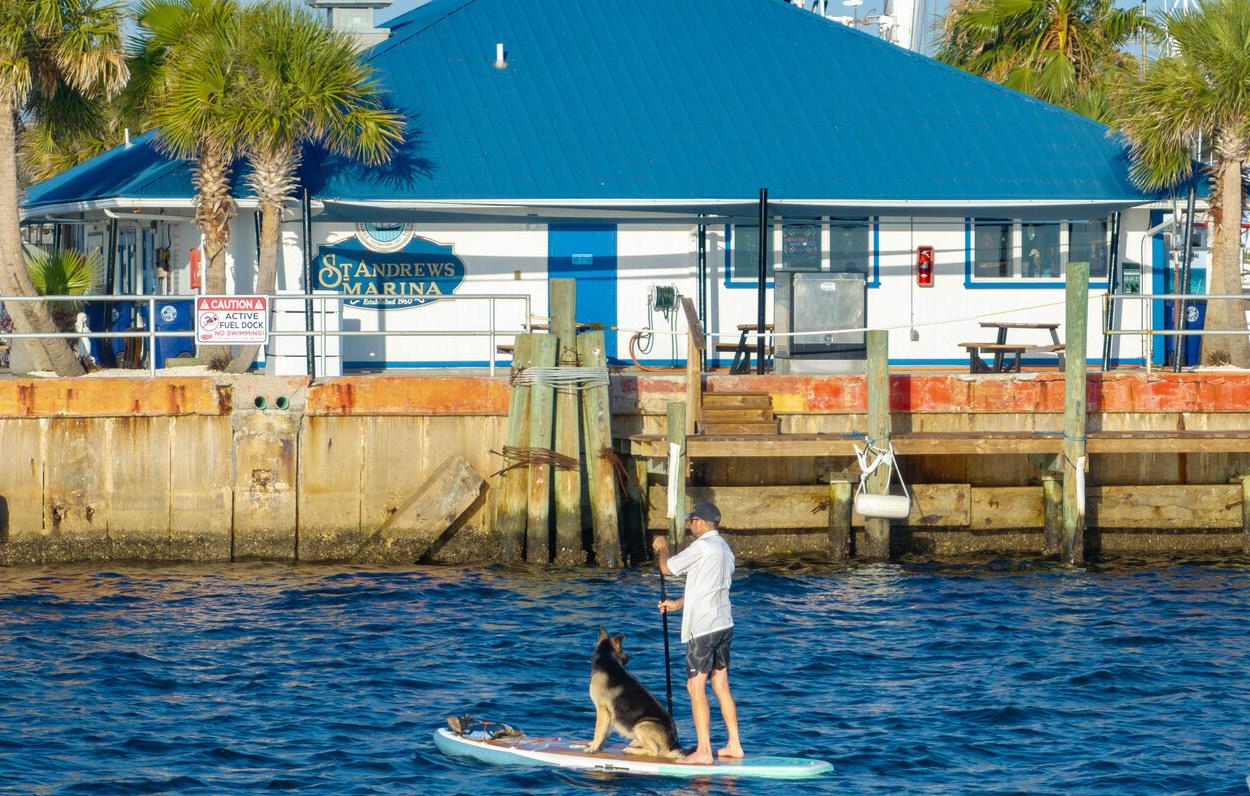
CONCEPTUAL MASTER PLAN
The Conceptual Master Plan for the St. Andrews CRA illustrates the general locations of the previously installed capital improvements and proposed capital improvements and programming identified in the Capital Projects and Programming Worksheet, further detailed in Section 6, Financial Analysis of this document (see Figure 15).
Specific proposed capital improvements illustrated below include proposed redevelopment focus areas, intersection and parking enhancements to improve pedestrian safety, as well as multi-use trails, protected bikeways, and bike facilities to enhance walkability and bike paths.
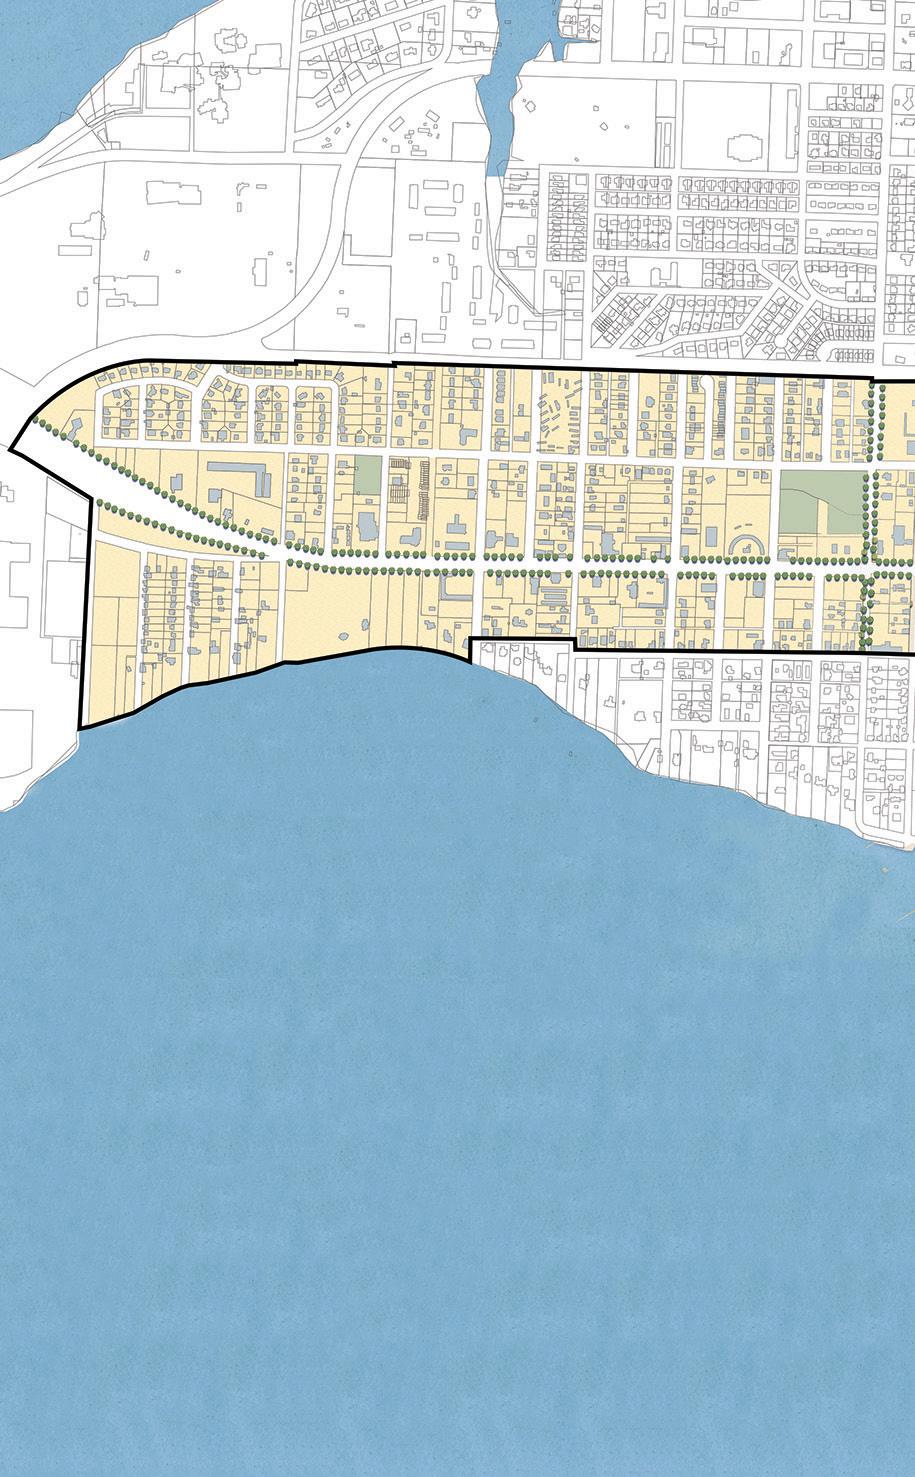
Legend
St. Andrews CRA
Intersection Improvements
Redevelopment Focus Area
Proposed Parking Improvements
Proposed Protected Bike/Cycle Tracks
Proposed Multi-Use Path
Proposed Pedestrian/ Streetscape Improvement
Additional Pedestrian/Bike Connection
Figure 15. ST. AND re WS C r A CONC e PT uA l MAST er P l AN
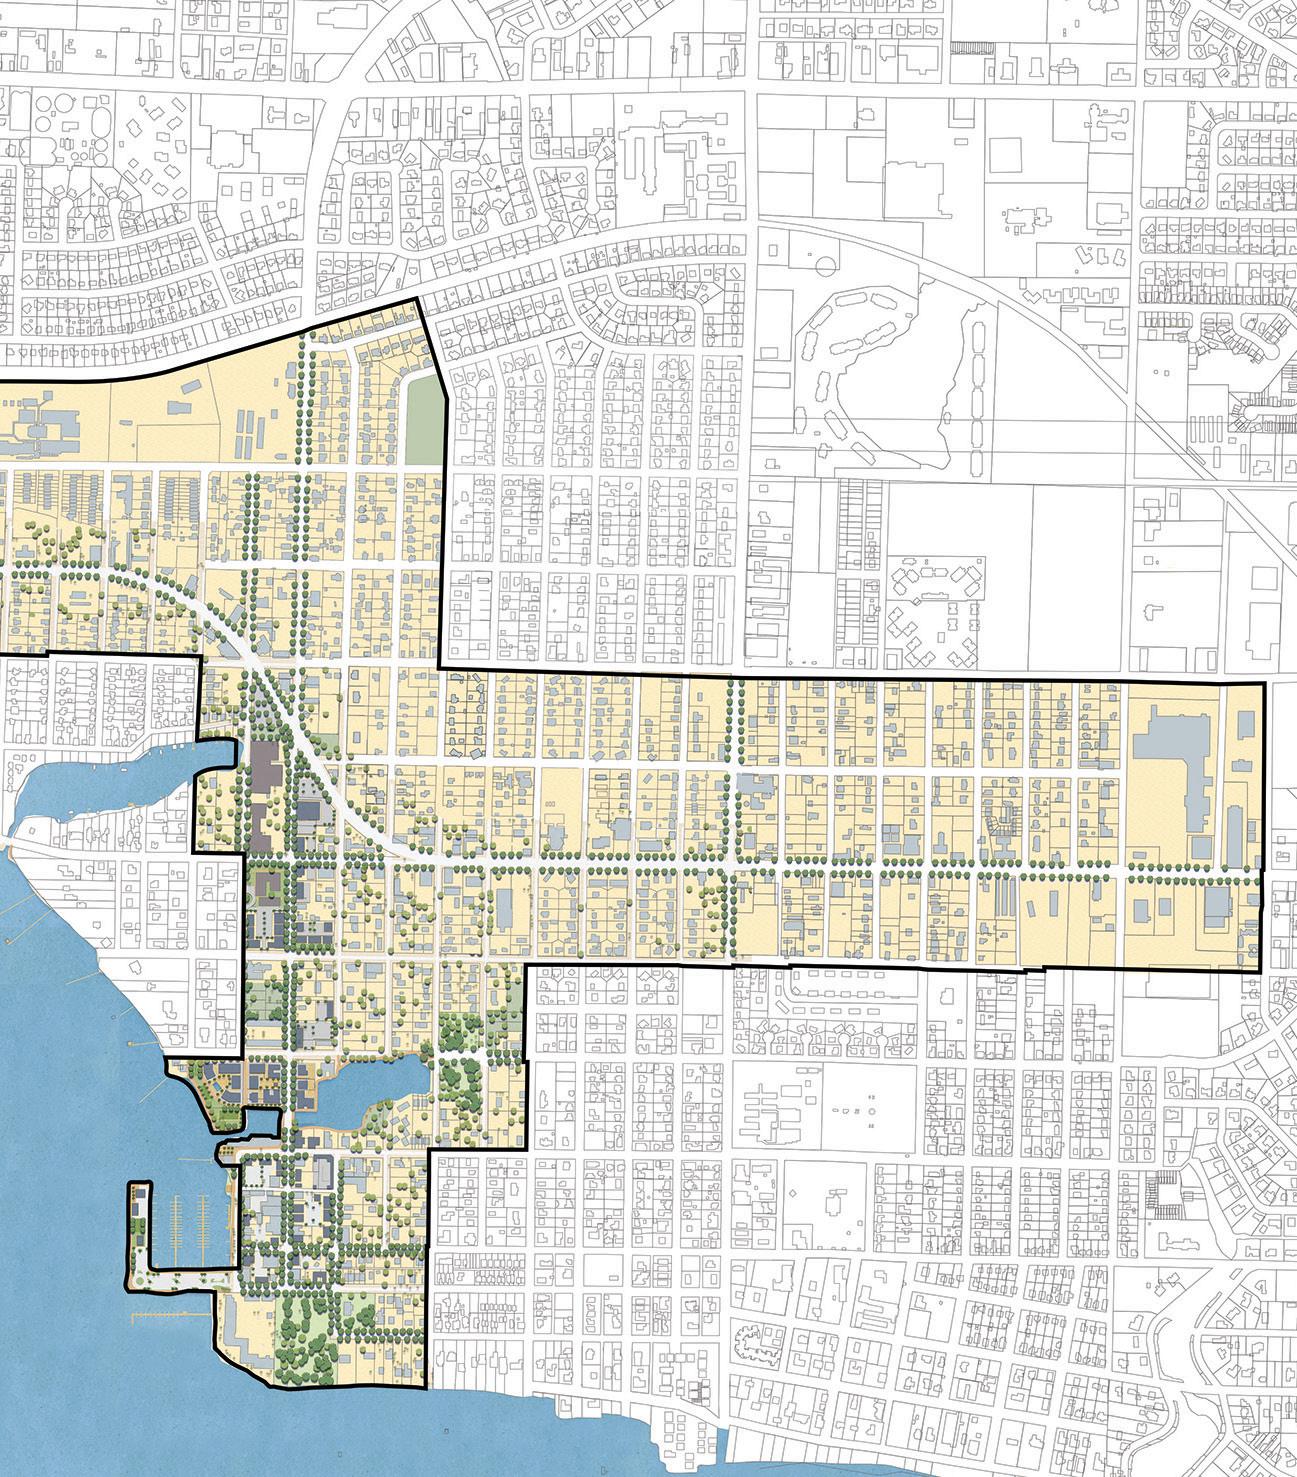
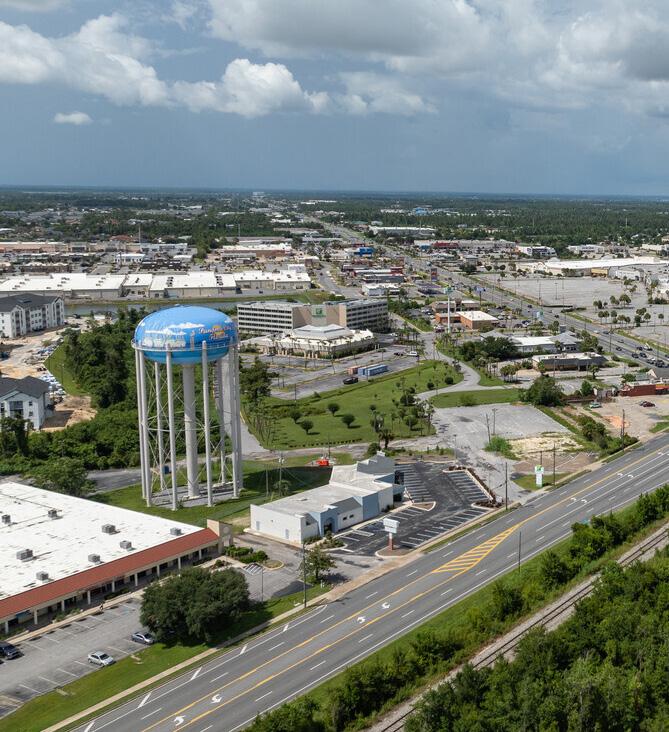
DOWNTOWN NORTH COMMUNITY REDEVELOPMENT AREA
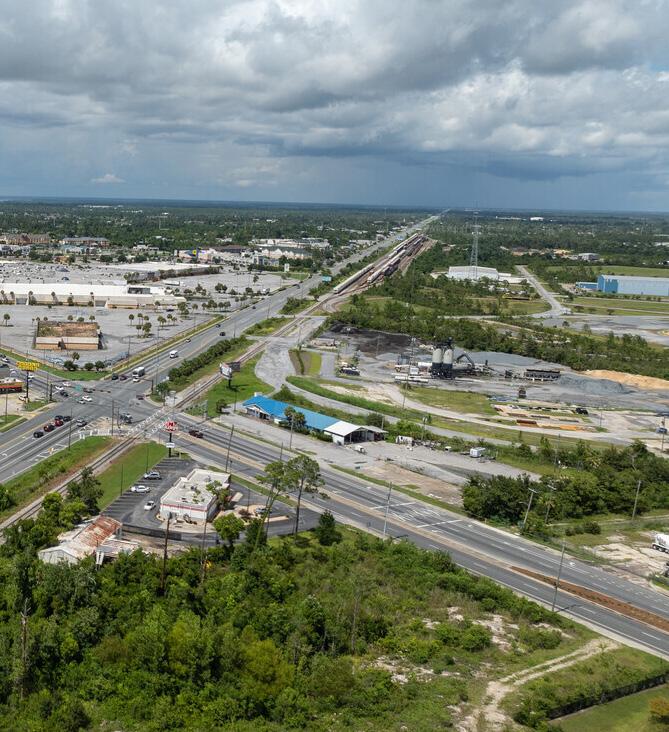
CHAPTER FOUR:
DOWNTOWN NORTH COMMUNITY REDEVELOPMENT AREA
DOWNTOWN NORTH CRA SUMMARY
Overview
The Downtown North Community Redevelopment Area (“Downtown North CRA”) was established in 1993 with the objective to revitalize the northern part of the City's downtown. The original Downtown North CRA did not include areas beyond 12th Street North. Based on an FON study conducted in 2008, the City Commission unanimously approved expanding the original Downtown North CRA boundaries from 12th Street North to U.S. Hwy. 231 between McKenzie Avenue and Mercedes Avenue.
The Downtown North CRA was subsequently expanded three more times: first in 2018 to incorporate the area generally bound by W 12th Street, U.S. Hwy. 231, and McKenzie Avenue; then in 2021 to incorporate the Panama City Mall located on the north side of U.S. Hwy. 231; and finally again in 2021 to incorporate the area generally east of Mercedes Avenue, south of U.S. Hwy. 231, north of E. 13th Street, and west of the City’s eastern boundary. Today, the Downtown North CRA spans approximately 1,248 acres, as illustrated in the following map (see Figure 16).
The Downtown North CRA includes major anchor developments such as the Ascension Sacred Heart Bay and the Panama City Mall. Additionally, the Downtown North CRA encompasses major thoroughfares, such as U.S. Hwy. 98, State Road ("SR") 389, and U.S. Hwy. 231.
Legend
Panama City
Municipal Boundaries
Downtown North CRA
1993 Boundary
Downtown North CRA
2008 Expansion
Downtown North CRA
2018 Expansion
Downtown North CRA
2021 Expansion A
Downtown North CRA
2021 Expansion B
History
The history of the Downtown North CRA stretches back to the 1930s, when businesses in Panama City grew significantly outside of the Millville and St. Andrews area and into the area north of the City's downtown. The area north of the City's downtown and its primary neighborhood
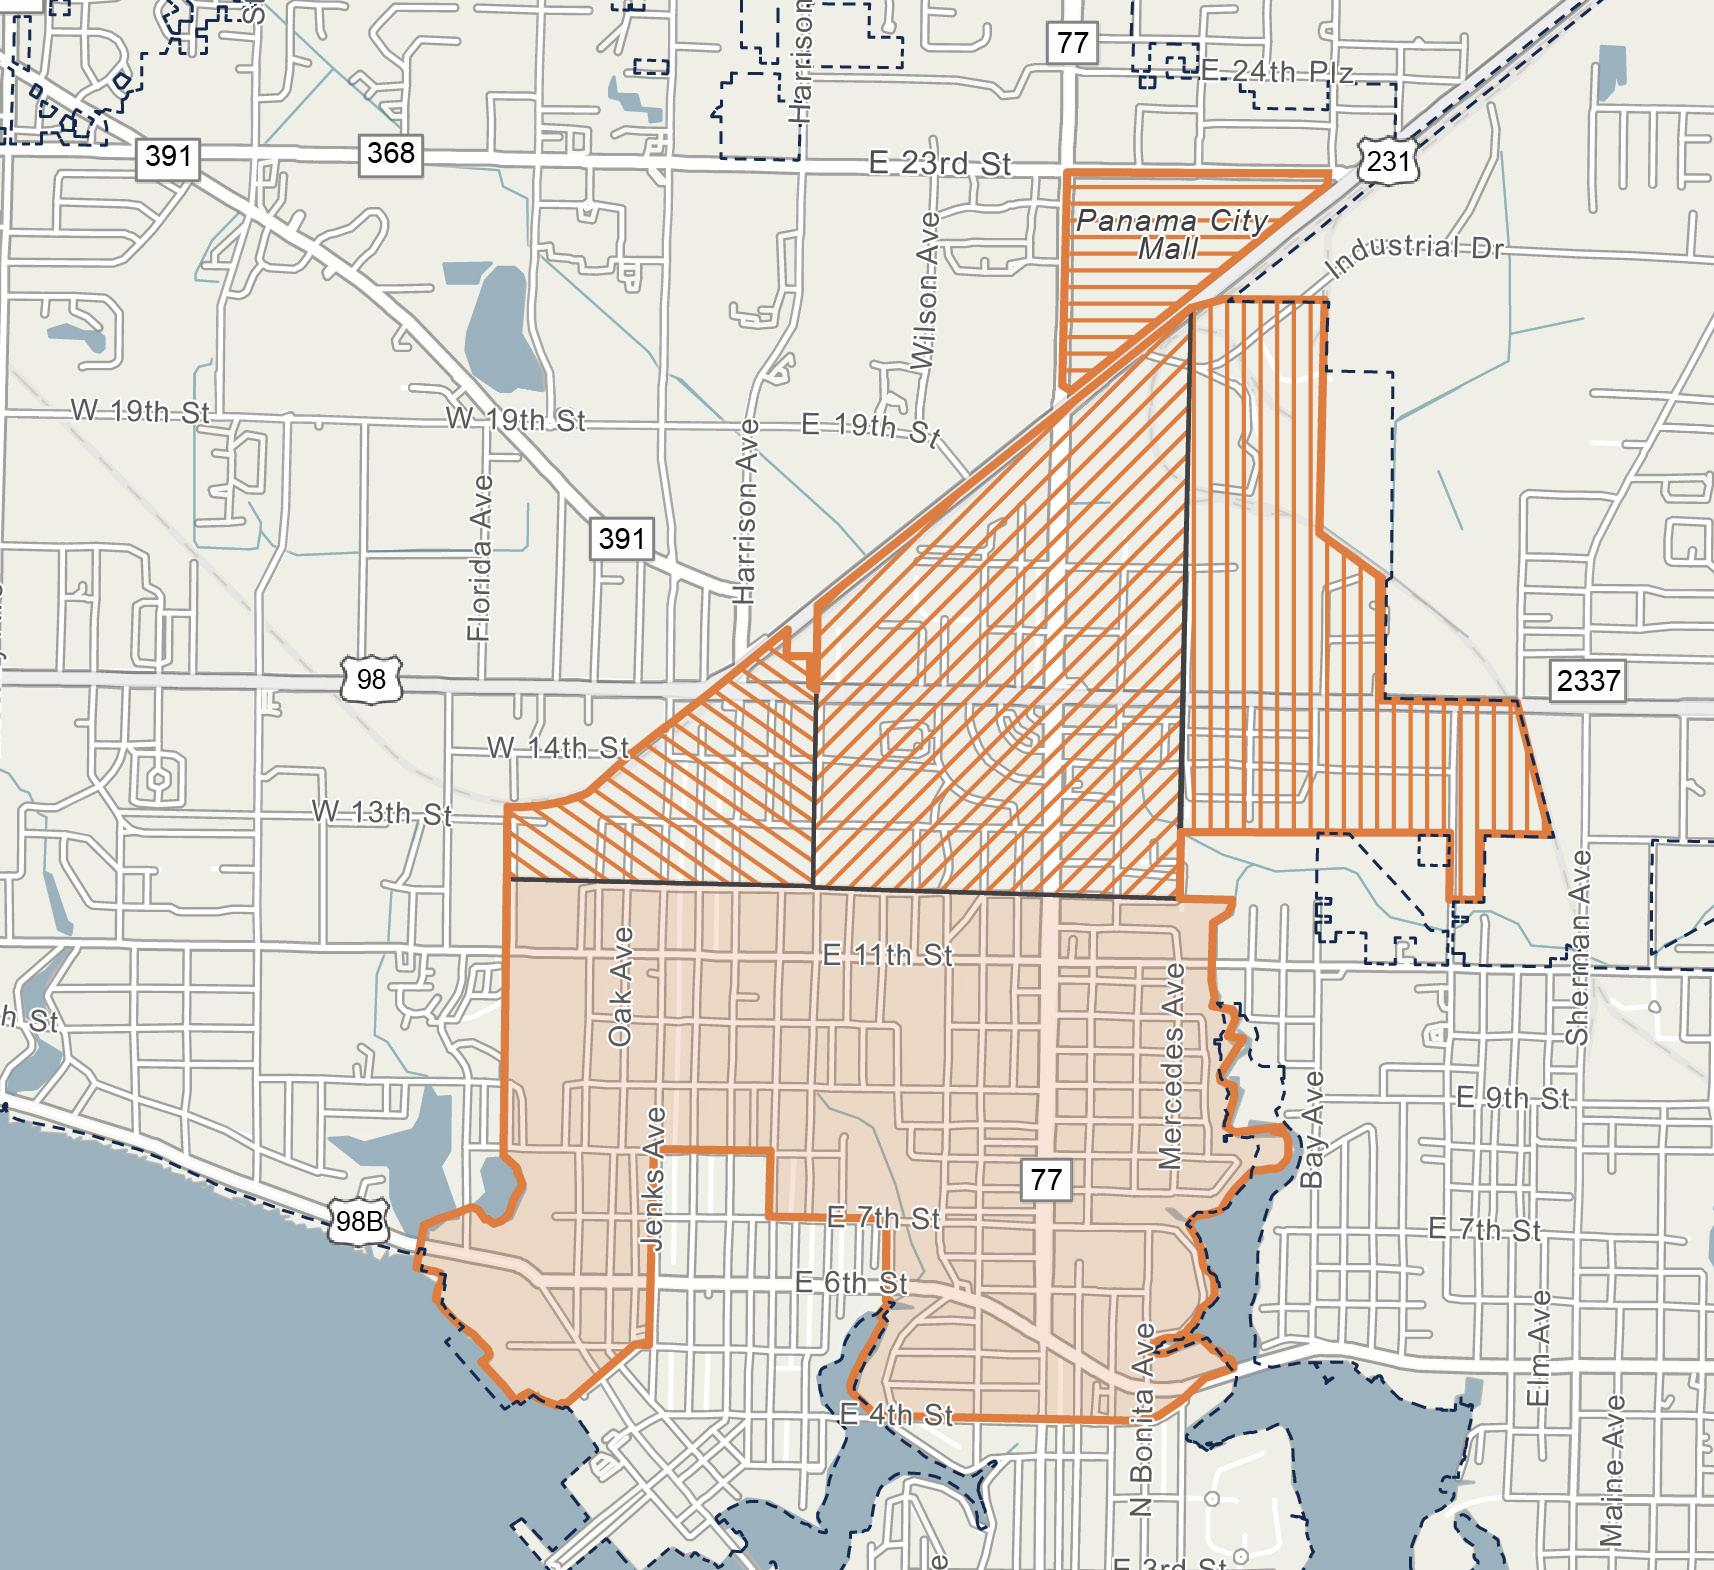
Figure 16. DOWNTOWN NO rTH C r A MAP
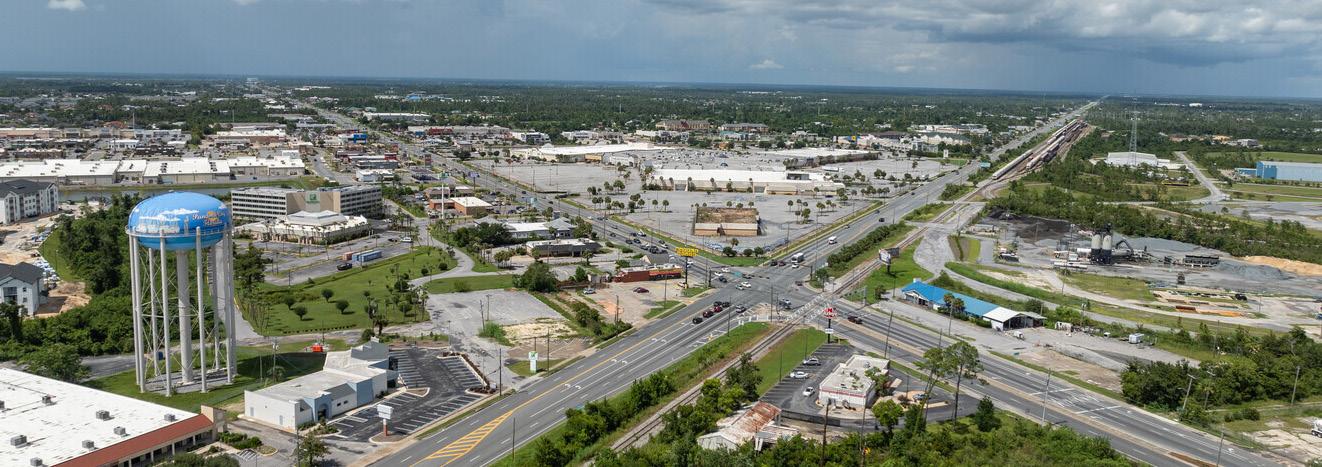
was a predominately Black and African-American community.
During the 1950s and 1960s, the area was defined by civil rights and civic initiatives, with multiple local organizations pushing to improve the area for its residents. The improvements included providing better opportunities for local businesses, community garbage collection, implementing streetlights, providing City water and sewage disposal, paving and repairing roads, and providing better neighborhood security. Thus began the start of community redevelopment in the area and the advancement of welfare for the community’s residents.
Approximately 10 years after the creation of the Agency in 1983, an FON in 1993 was conducted for the area north of the City's downtown and resulted in the establishment of the Downtown North CRA. The first Downtown North Redevelopment Plan was created and adopted in 1993 ("1993 Plan"). The original goal of the Downtown North CRA was to address the continual decline of the City's African-American community. Since the 1993 Plan, significant progress has been
made on many projects through efforts such as the Greater Glenwood Revitalization and Visioning Initiative in 2003.
The Downtown North CRA was the third CRA to be added to the Agency. Since being established in 1993, the Downtown North CRA has been expanded four times- in 2008, 2018, and twice in 2021. The Downtown North CRA is currently the largest of the Agency’s CRAs. However, the Downtown North CRA Redevelopment Plan was not modified and updated following the 2018 expansion nor were the two 2021 expansions due to the extensive damage and overwhelming impacts of Hurricane Michael to the CRAs, the City, and the panhandle of Florida more broadly. The observations of the FON studies conducted for each of the three expansions of the Downtown North CRA, which occurred in 2018 and 2021, as well as the adoption process for each expansion are detailed below.
Expansion 1 (2018 FON): The expansion area generally bound by W 12th Street, U.S. Hwy. 231, and McKenzie Avenue.
The 2018 FON, attached hereto within the Appendix, found that the expansion area demonstrated one condition of “Slum” (F.S. Chapter 163.340, (7) (a)) and five conditions of “Blight” (F.S. Chapter 163.340, (8) (b), (c), (e), (k), and (m)). Based on the observation of the presence of Slum and Blight conditions as defined by F.S. Chapter 163.340, (7), (8), there were sufficient findings to justifiably consider inclusion of the expansion area within the Downtown North CRA.
The 2018 FON was presented to, and accepted by, the Agency on September 13, 2018, after which the City Commission of the City of Panama City, in accordance with F.S. Chapter 163.355, and by adoption of Resolution 20180925.3 found that the conditions within the targeted expansion area examined in the 2018 FON meet certain criteria described in F.S. Chapter 163.340(7), (8), and that there is need for the expansion of the Downtown North CRA to address the conditions of Slum and Blight identified within the targeted expansion area.
DOWNTOWN NORTH PANAMA CITY | SOURCE HOMES.COM
Expansion 2 (2021 FON): The expansion area includes the Panama City Mall, located on the north side of U.S. Hwy. 231.
The 2021 FON, attached hereto within the Appendix, found that the expansion area demonstrated one (1) condition of “Slum” (F.S. Chapter 163.340, (7) (c)) and five (5) conditions of “Blight” (F.S. Chapter 163.340, (8) (a), (b), (d), (e), and (m)). Based on the observation of the presence of Slum and Blight conditions as defined by F.S. Chapter 163.340, (7), (8), there were sufficient findings to justifiably consider inclusion of the expansion area within the Downtown North CRA. The 2021 FON was presented to, and accepted by, the Agency on February 8, 2022, after which the City Commission of the City of Panama City, in accordance with F.S. Chapter 163.355 and by adoption of Resolution 20220208.5 found that the conditions within the targeted expansion area examined in the 2021 FON meet certain criteria described in F.S. Chapter 163.340(7), (8) and that there is need for the expansion of the Downtown North CRA to address the conditions of Slum and Blight identified within the targeted expansion area.
Expansion 3 (2021 FON): The expansion area generally east of Mercedes Avenue, south of U.S. Hwy. 231, north of E 13th Street, and west of the City’s eastern boundary.
The 2021 FON, attached hereto within the Appendix, found that the expansion area demonstrated two conditions of “Slum” (163.340, (7) (a), and (c)) and seven (7) conditions of “Blight” (163.340, (8) (a), (b), (c),
(d), (e), (f), and (m)). Based on the observation of the presence of Slum and Blight conditions as defined by F.S. Chapter 163.340, (7), (8), there were sufficient findings to justifiably consider inclusion of the expansion area within the Downtown North CRA. The 2021 FON was presented to, and accepted by, the Agency on February 8, 2022, after which the City Commission of the City of Panama City, in accordance with F.S. Chapter 163.355, and by adoption of Resolution 20220208.5 found that the conditions within the targeted expansion area examined in the 2021 FON meet certain criteria described in F.S. Chapter 163.340(7), (8), and that there is need for the expansion of the Downtown North CRA to address the conditions of Slum and Blight identified within the targeted expansion area.
This 2025 Plan serves as a modification and update of the Downtown North CRA Redevelopment Plan; it further memorializes the aforementioned Downtown North CRA boundary changes that were made in 2018 and 2021 and specifies the redevelopment strategies, desired improvement projects, and proposed implementation steps.
Past Accomplishments
Since establishing the Downtown North CRA in 1993, the Agency has been a dynamic force in shaping the cultural, economic, and social landscape of the Downtown North CRA. Boasting significant achievements across various fronts, the Agency has played a pivotal role in fostering cultural and heritage building, revitalizing blighted areas, establishing local partnerships,
enhancing safety measures, and engaging the community.
Notable
accomplishments within the Downtown North CRA related to the Agency’s past priorities and guiding principles include:
Safety and Security
▪ Enhanced police presence through a joint initiative with the Downtown CRA and the City's Police Department.
▪ Improved connectivity and transportation safety with a sidewalk improvement program, highway beautification measures, and debris clearing, particularly on MLK Jr. Blvd and via the Jenks Corridor Improvement Project.
Key and Vital Infrastructure
▪ Implemented measures to revitalize blighted areas such as establishing the Clearing Vacant Parcel Program and Cleanup and Abatement (“CAP”) Program.
▪ Prioritized revitalization through land acquisitions and demolitions.
Economy
▪ Funded residential and commercial improvements through a variety of grant and incentive programs.
Quality of Life
▪ Established a cultural and historical center to celebrate the community’s heritage and provide a space for cultural events, exhibits, and educational programs.
▪ Revitalized iconic community destinations to establish its unique identity while planning for culturally and historically significant places, including the Cultural Heritage Tourism District, the A. D. Harris Learning Village, and the old
Coca-Cola factory renovation for new use.
▪ Created numerous partnerships: Partnered with the City of Panama City Community Development Department to provide Residential Improvement Assistance to individuals who cannot financially afford to participate in the current Residential Grant program; Partnered with the Gulf Coast Workforce Board to carry out its CAP Program; Partnered with the Boys and Girls Club of Bay County to provide swim lessons and aquatic safety.
Tax Base Trends and Estimates
The Downtown North CRA was established in 1993 with a base year taxable value of $44,483,072. The Downtown North CRA was subsequently expanded in 2008 with a base year taxable value of $26,152,791, then again in 2019 with a base year taxable value of $12,534,490, and twice in 2021 with a combined base year taxable value of $47,525,578.
Over the 10-year period from 2015 to 2024, total taxable value for all properties within the entirety of the Downtown North CRA grew at a Compound Annual Growth Rate (“CAGR”) of 1.6%, experiencing a 17% increase in taxable value from $223,045,772 in 2015 to $261,371,711 in 2024.
Over the same 10-year period, annual Tax Increment Financing (“TIF”) revenue collections within the Downtown North CRA has grown at a CAGR of 0.3%. This represents a 2.9% increase, rising from $1,231,700 in 2015 collections to $1,267,300 in 2024.
Since 2015, the total TIF revenues collected in the entirety of the Downtown North CRA have amounted to $9,408,700.
Table 5 below illustrates the 10-year historic collections in total taxable value and total tax increment, as well as the total annual TIF revenues generated by the Downtown North CRA, assuming a 95% contribution rate from both the City and County for the Downtown North CRA, and a reduced 85% contribution from the County for only the 2021 Expansion Area(s). The table also illustrates projected collections from 2025 through 2044, the Agency’s operational sunset date, over 5-year increments.
This 2025 Plan estimates that the entirety of the Downtown North CRA will generate approximately $58,047,000 in TIF revenue to the Agency’s Redevelopment Trust Fund from 2025 through 2044. This equates to about $2,902,350 in average annual increment over the 20-year projection period.
This TIF revenue may be used for projects and programming that address the goals, objectives, and strategies of this 2025 Plan. For further details on the TIF projections for the Downtown North CRA, please refer to Section 6, Financial Analysis of this document.
Source: Bay County Property Appraiser; Florida Department of Revenue (FDOR); GAI Consultants. Notes: (1) Reflects prior year Final taxable value in tax increment area according to FDOR. (2) Reflects the total taxable value within the increment area less the Downtown North CRA's base year value(s) of: $44,483,072 (1993 Original); $26,152,791 (2008 Expansion Area); $12,534,490 (2019 Expansion Area); $47,525,578 (2021 Expansion Area(s)). (3) Assumes a 95% participation rate from both Panama City and Bay County. (4) Reflects historic 10-year total collections from 2015 to 2024. (5) Reflects projected 20-year collections from 2025 to 2044, the Agency’s sunset date—further detailed in Section 6, Financial Analysis.
DOWNTOWN NORTH CRA MAP SERIES
Existing Land Use
Existing Land Use designations are classifications of property that describe the current use of the property. The Florida Administrative Code (“FAC”) requires Property Appraisers to classify each parcel of real property to indicate its use as determined for valuation purposes. This use is reflected in the Department of Revenue
(“DOR”) use codes applied to each real property on tax assessment rolls and depicts the existing use of the property.
The map below illustrates the Existing Land Use of parcels within the Downtown North CRA, with the legend detailing the distribution of total land acres by Existing Land Use designation (see Figure 17).
Within the Downtown North CRA’s approximately 1,248 total land acres, the predominant Existing Land Use designation is Residential, which comprises the largest share of total land area at 33.4%, followed by Commercial and Governmental with 27.5% and 14.1%, respectively, of this total share. Legend
City Municipal Boundaries
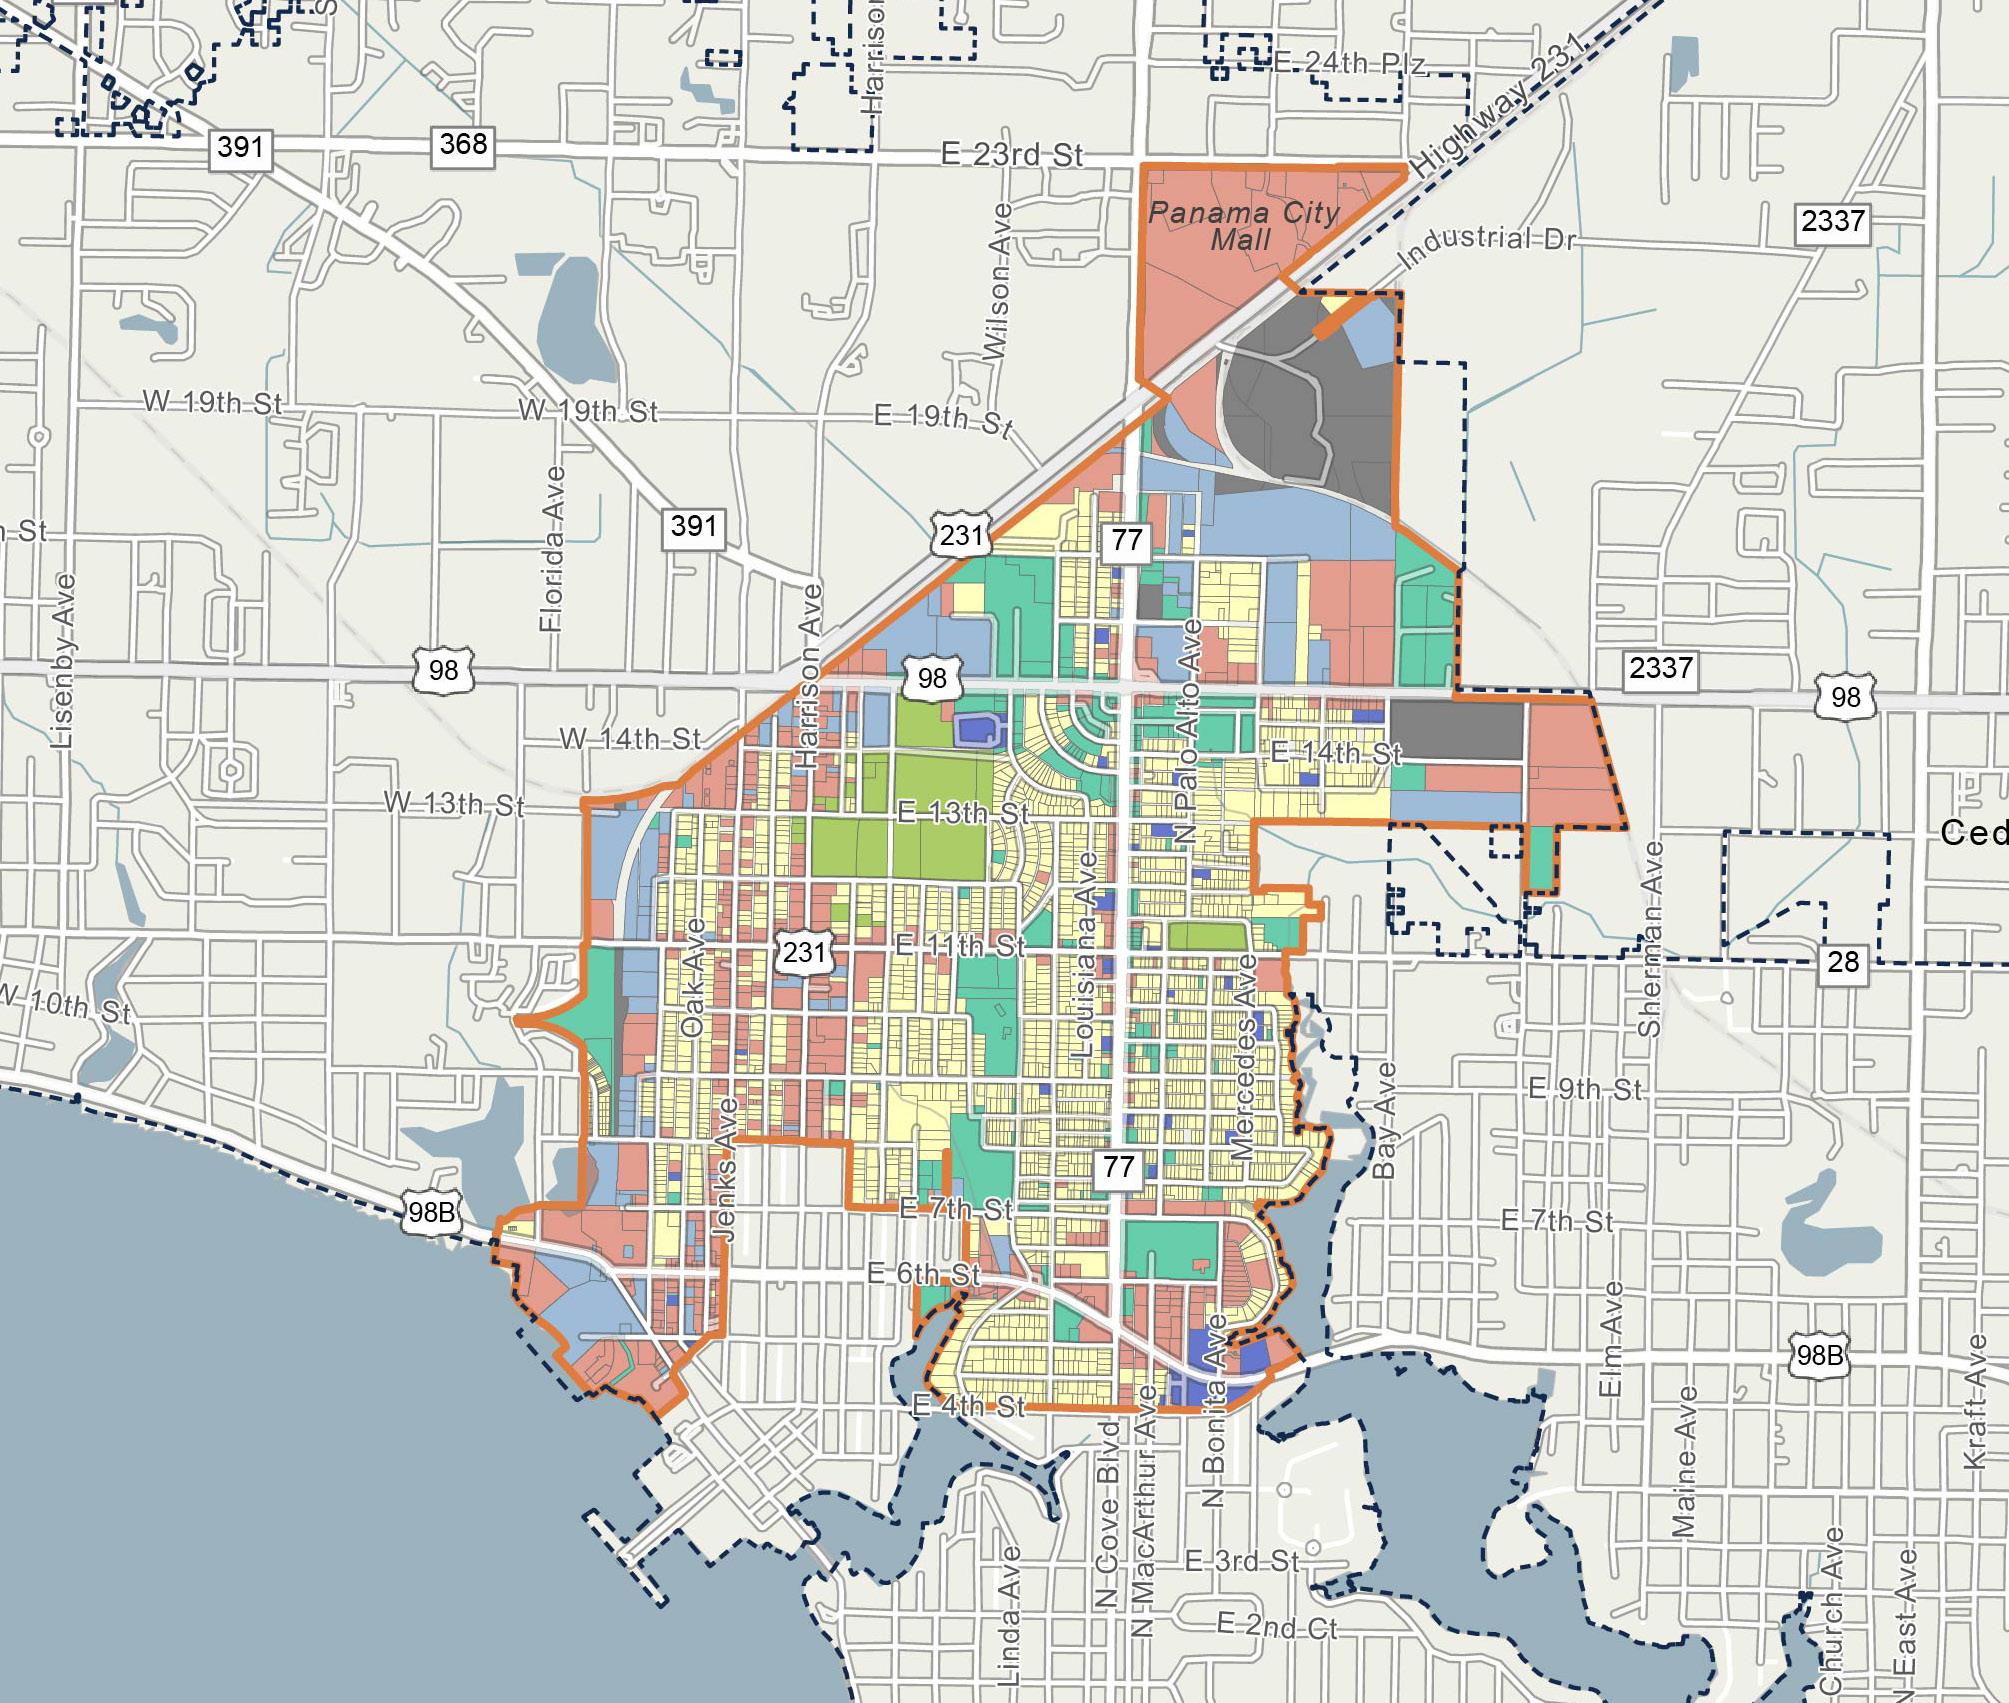
Figure 17. DOWNTOWN
Future Land Use Future Land Use designations are classifications of property that categorize permissible levels of intensity and/or density of development, in accordance with policies of the City’s Comprehensive Plan and the requirements of the City’s Land Development Regulations. The map below illustrates the Future Land Use of parcels within the
Downtown North CRA, with the legend detailing the distribution of total land acres by Future Land Use designation (see Figure 18).
Within the Downtown North CRA’s approximately 1,248 total land acres, the predominant Future Land Use designation is City Neighborhood Planning Area, which comprises the largest share of total land area at
49.5%, followed by Industry and General Commercial and MixedUse with 22.1%, 6.3%, and 6.3%, respectively, of this total share.
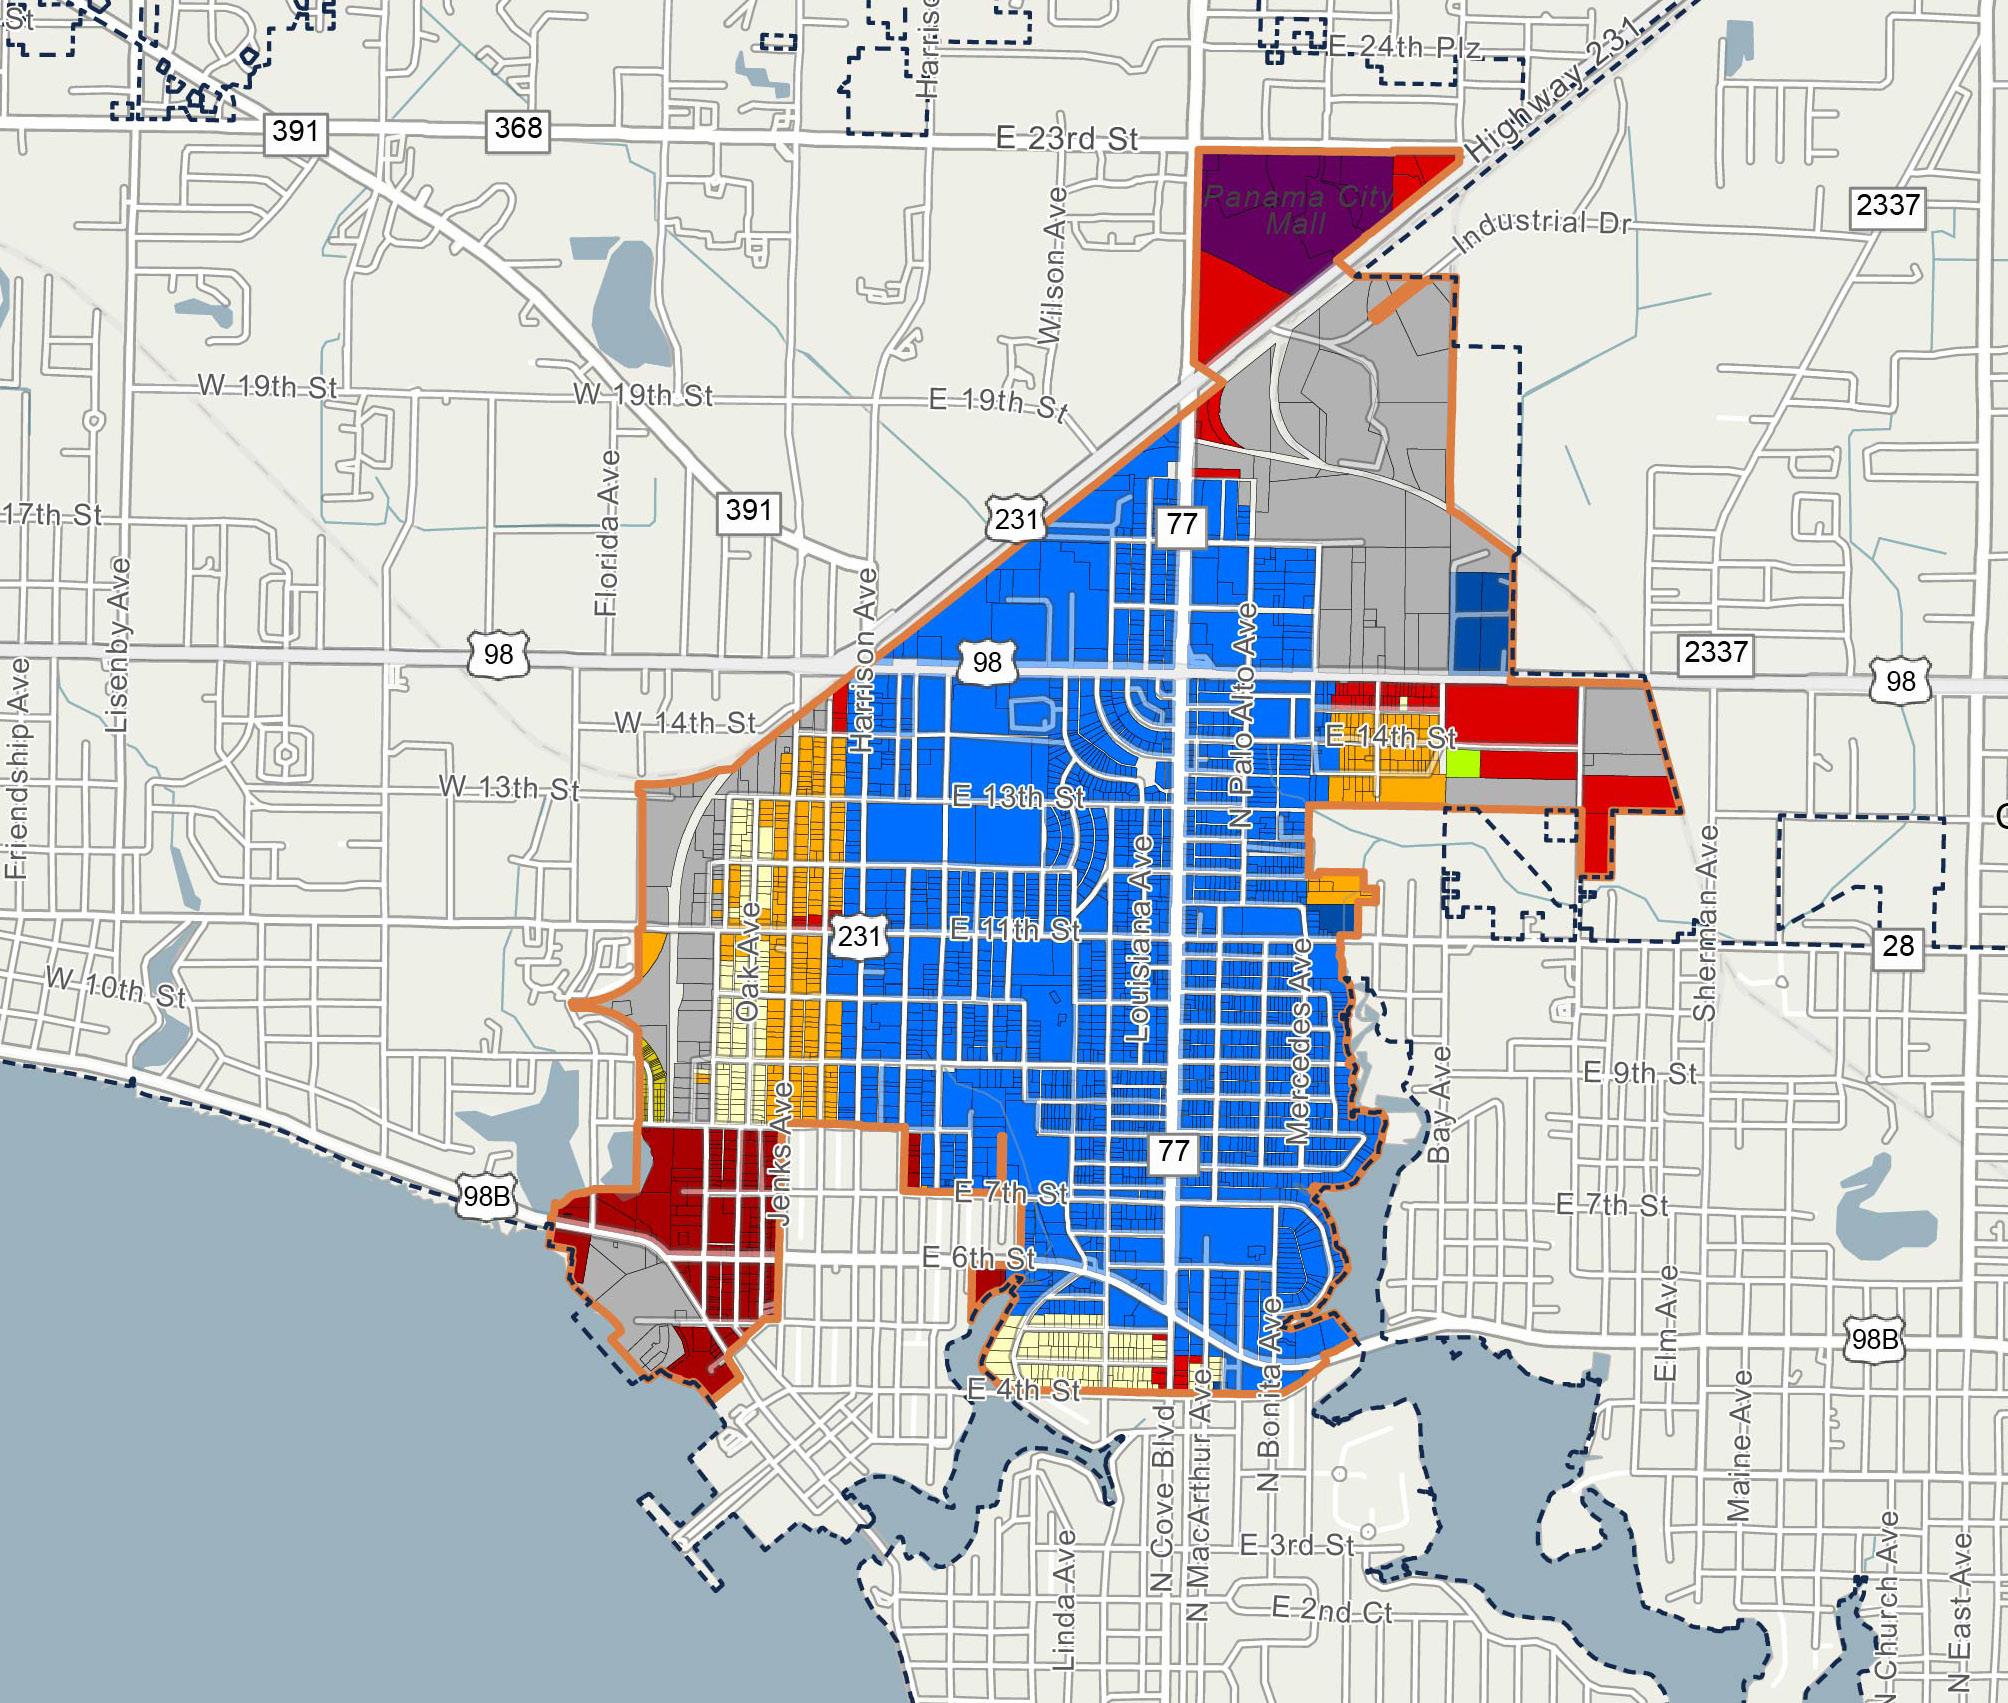
Figure 18. DOWNTOWN
Zoning
Zoning classifications describe the permitted uses and development standards applicable to a specific property, in accordance with policies of both the City’s Comprehensive Plan and the requirements of the City’s Land Development Regulations.
Legend
Panama City Municipal Boundaries
Downtown North CRA
Acres Downtown Center
The map below illustrates the different Zoning classifications of parcels within the Downtown North CRA, with the legend detailing the distribution of total land acres by Zoning classification (see Figure 19).
Within the Downtown North CRA’s approximately 1,248 total
land acres, the predominant Zoning classification is Neighborhood General, which comprises the largest share of total land area at 21.7%, followed by Neighborhood Residential and Heavy Industry with 18.7% and 12.7%, respectively, of this total share.
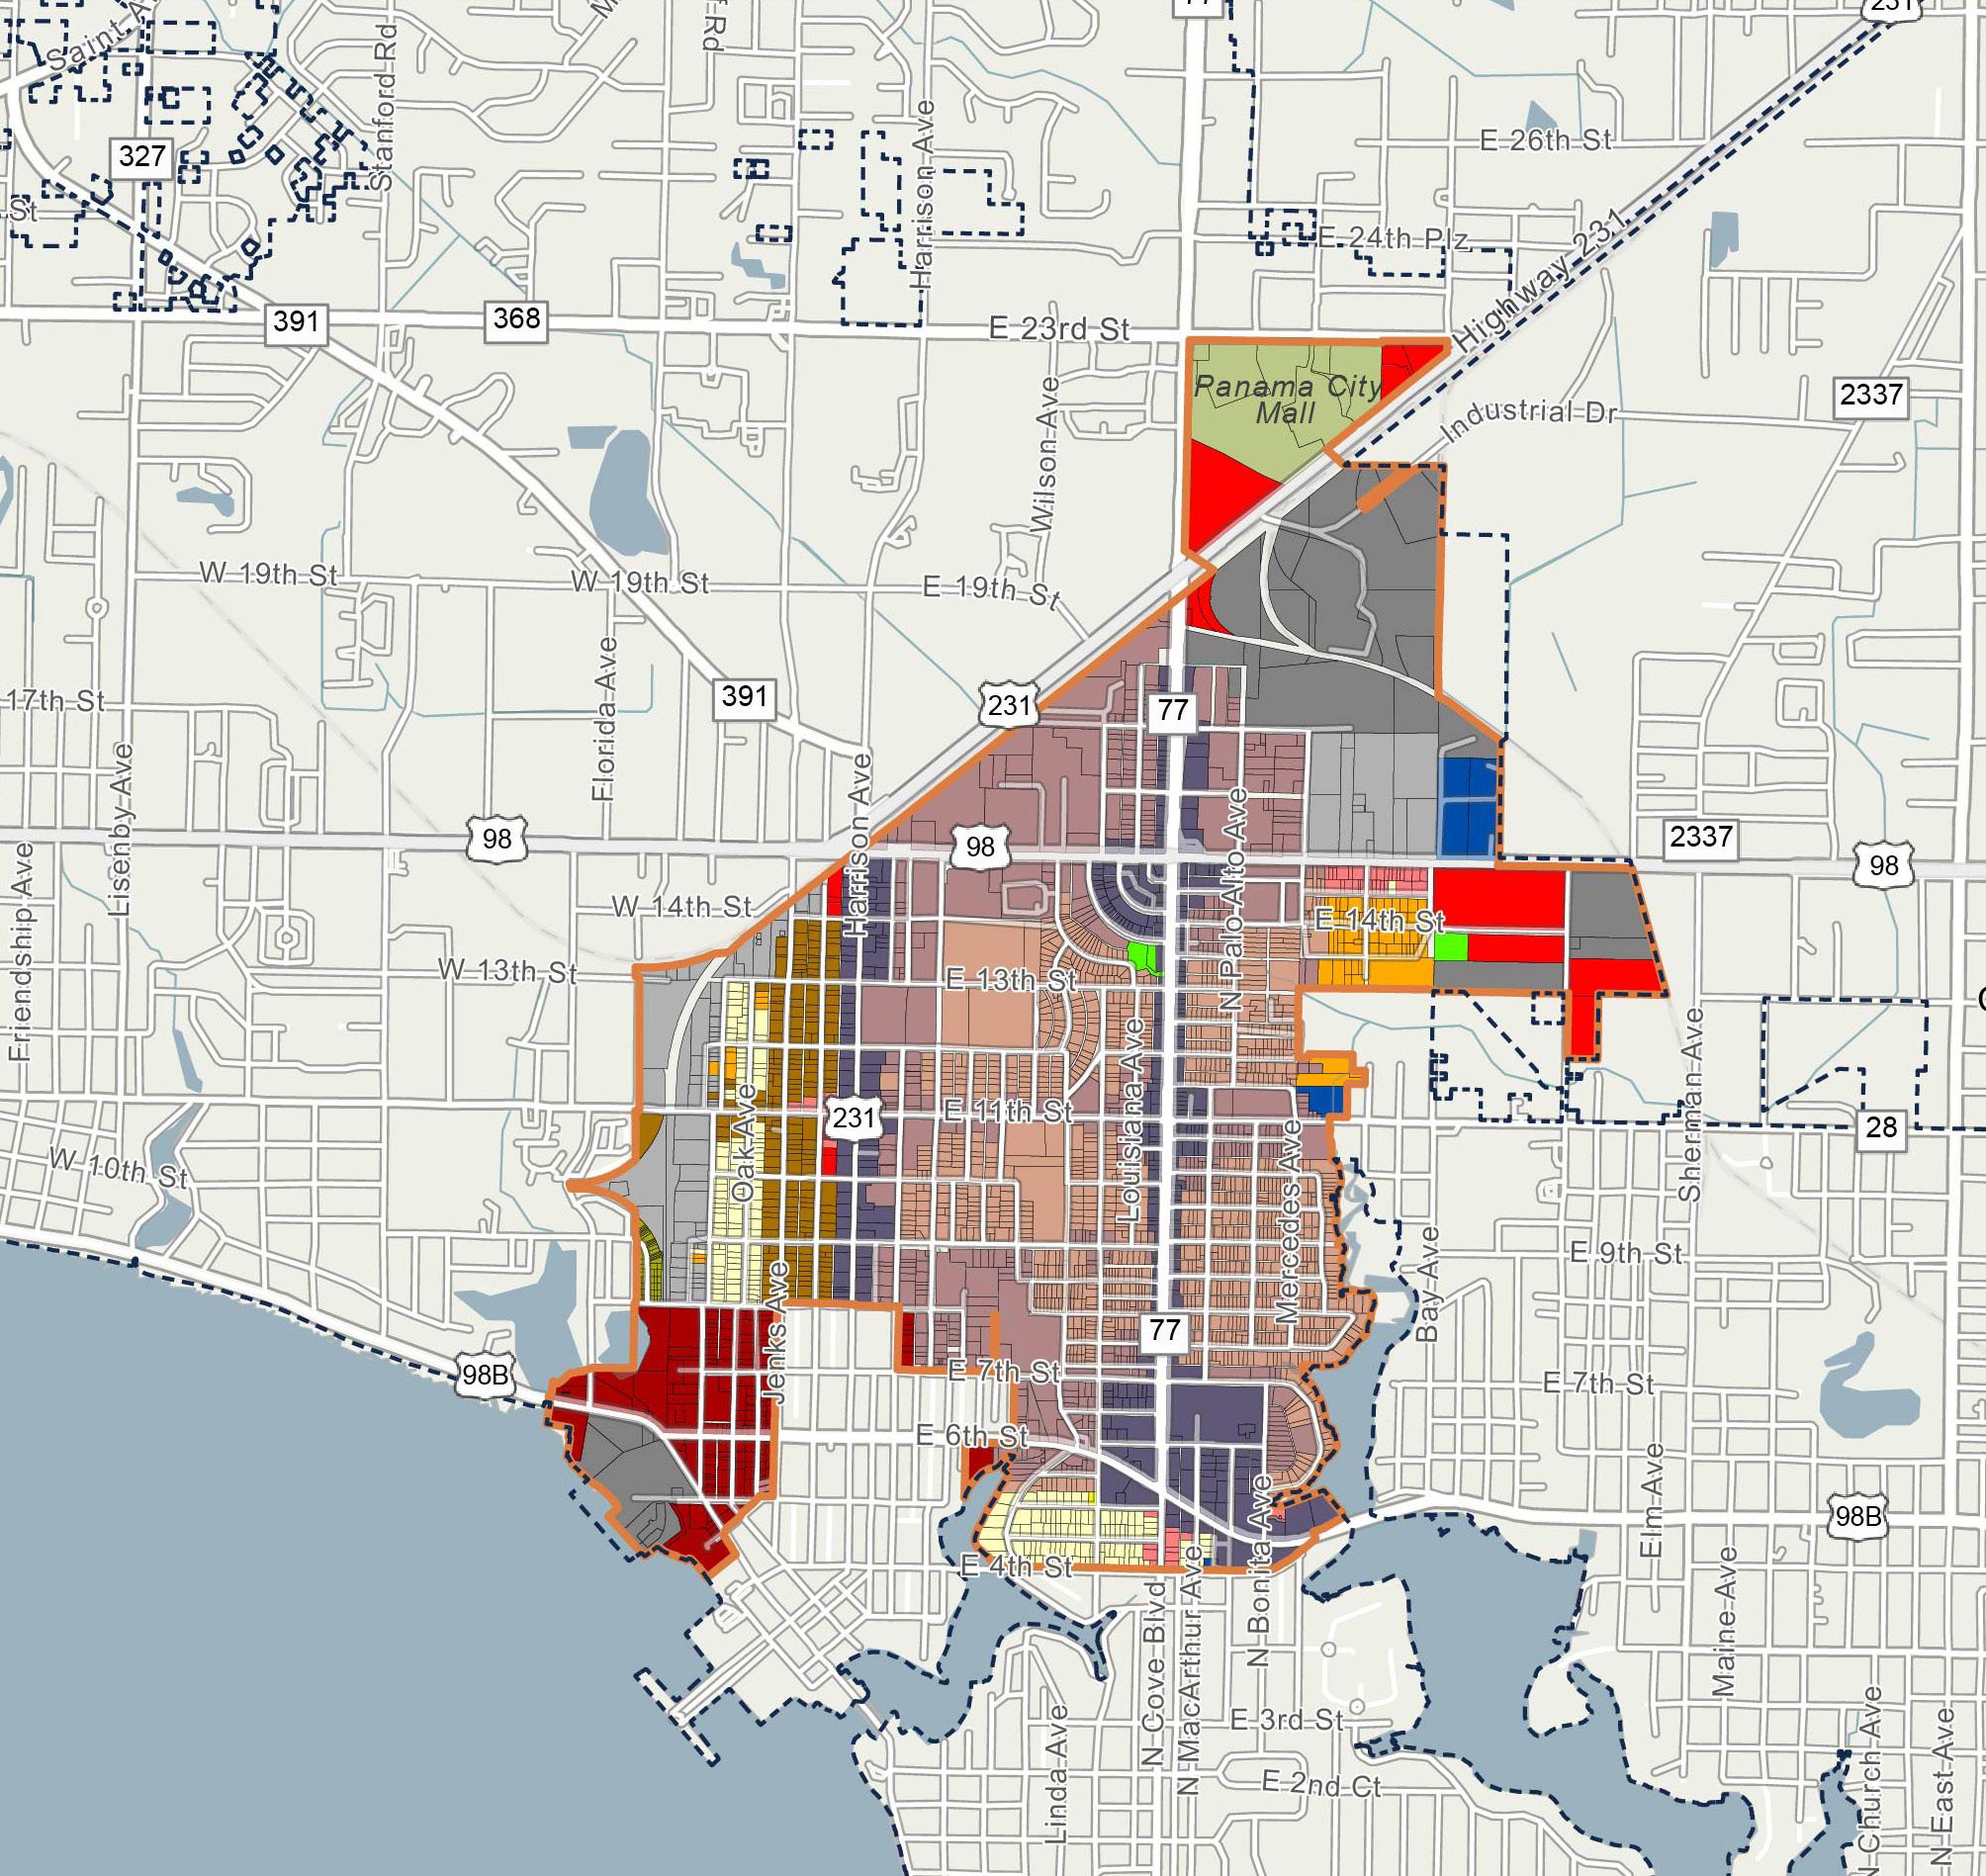
Figure 19. DOWNTOWN NO rTH C r A ZON i N g MAP
City-Owned Parcels
City-Owned parcels are those located within the Downtown North CRA that are owned by Panama City. These parcels may be utilized by the City and Agency to facilitate the implementation of redevelopment goals and strategies identified within this 2025 Plan.
Legend Panama City Municipal Boundaries
Downtown North CRA 1,248 Acres
City-Owned Properties 5.8%
The map below illustrates the City-Owned parcels within the Downtown North CRA, with the legend detailing the distribution of total land acres by DOR classification (see Figure 20).
There are approximately 124 City-Owned parcels within the Downtown North CRA,
representing 4.5% of the total parcels in the area. Additionally, these 124 City-Owned parcels cover a total of 72.5 acres, which is approximately 5.8% of the total acreage within the Downtown North CRA.
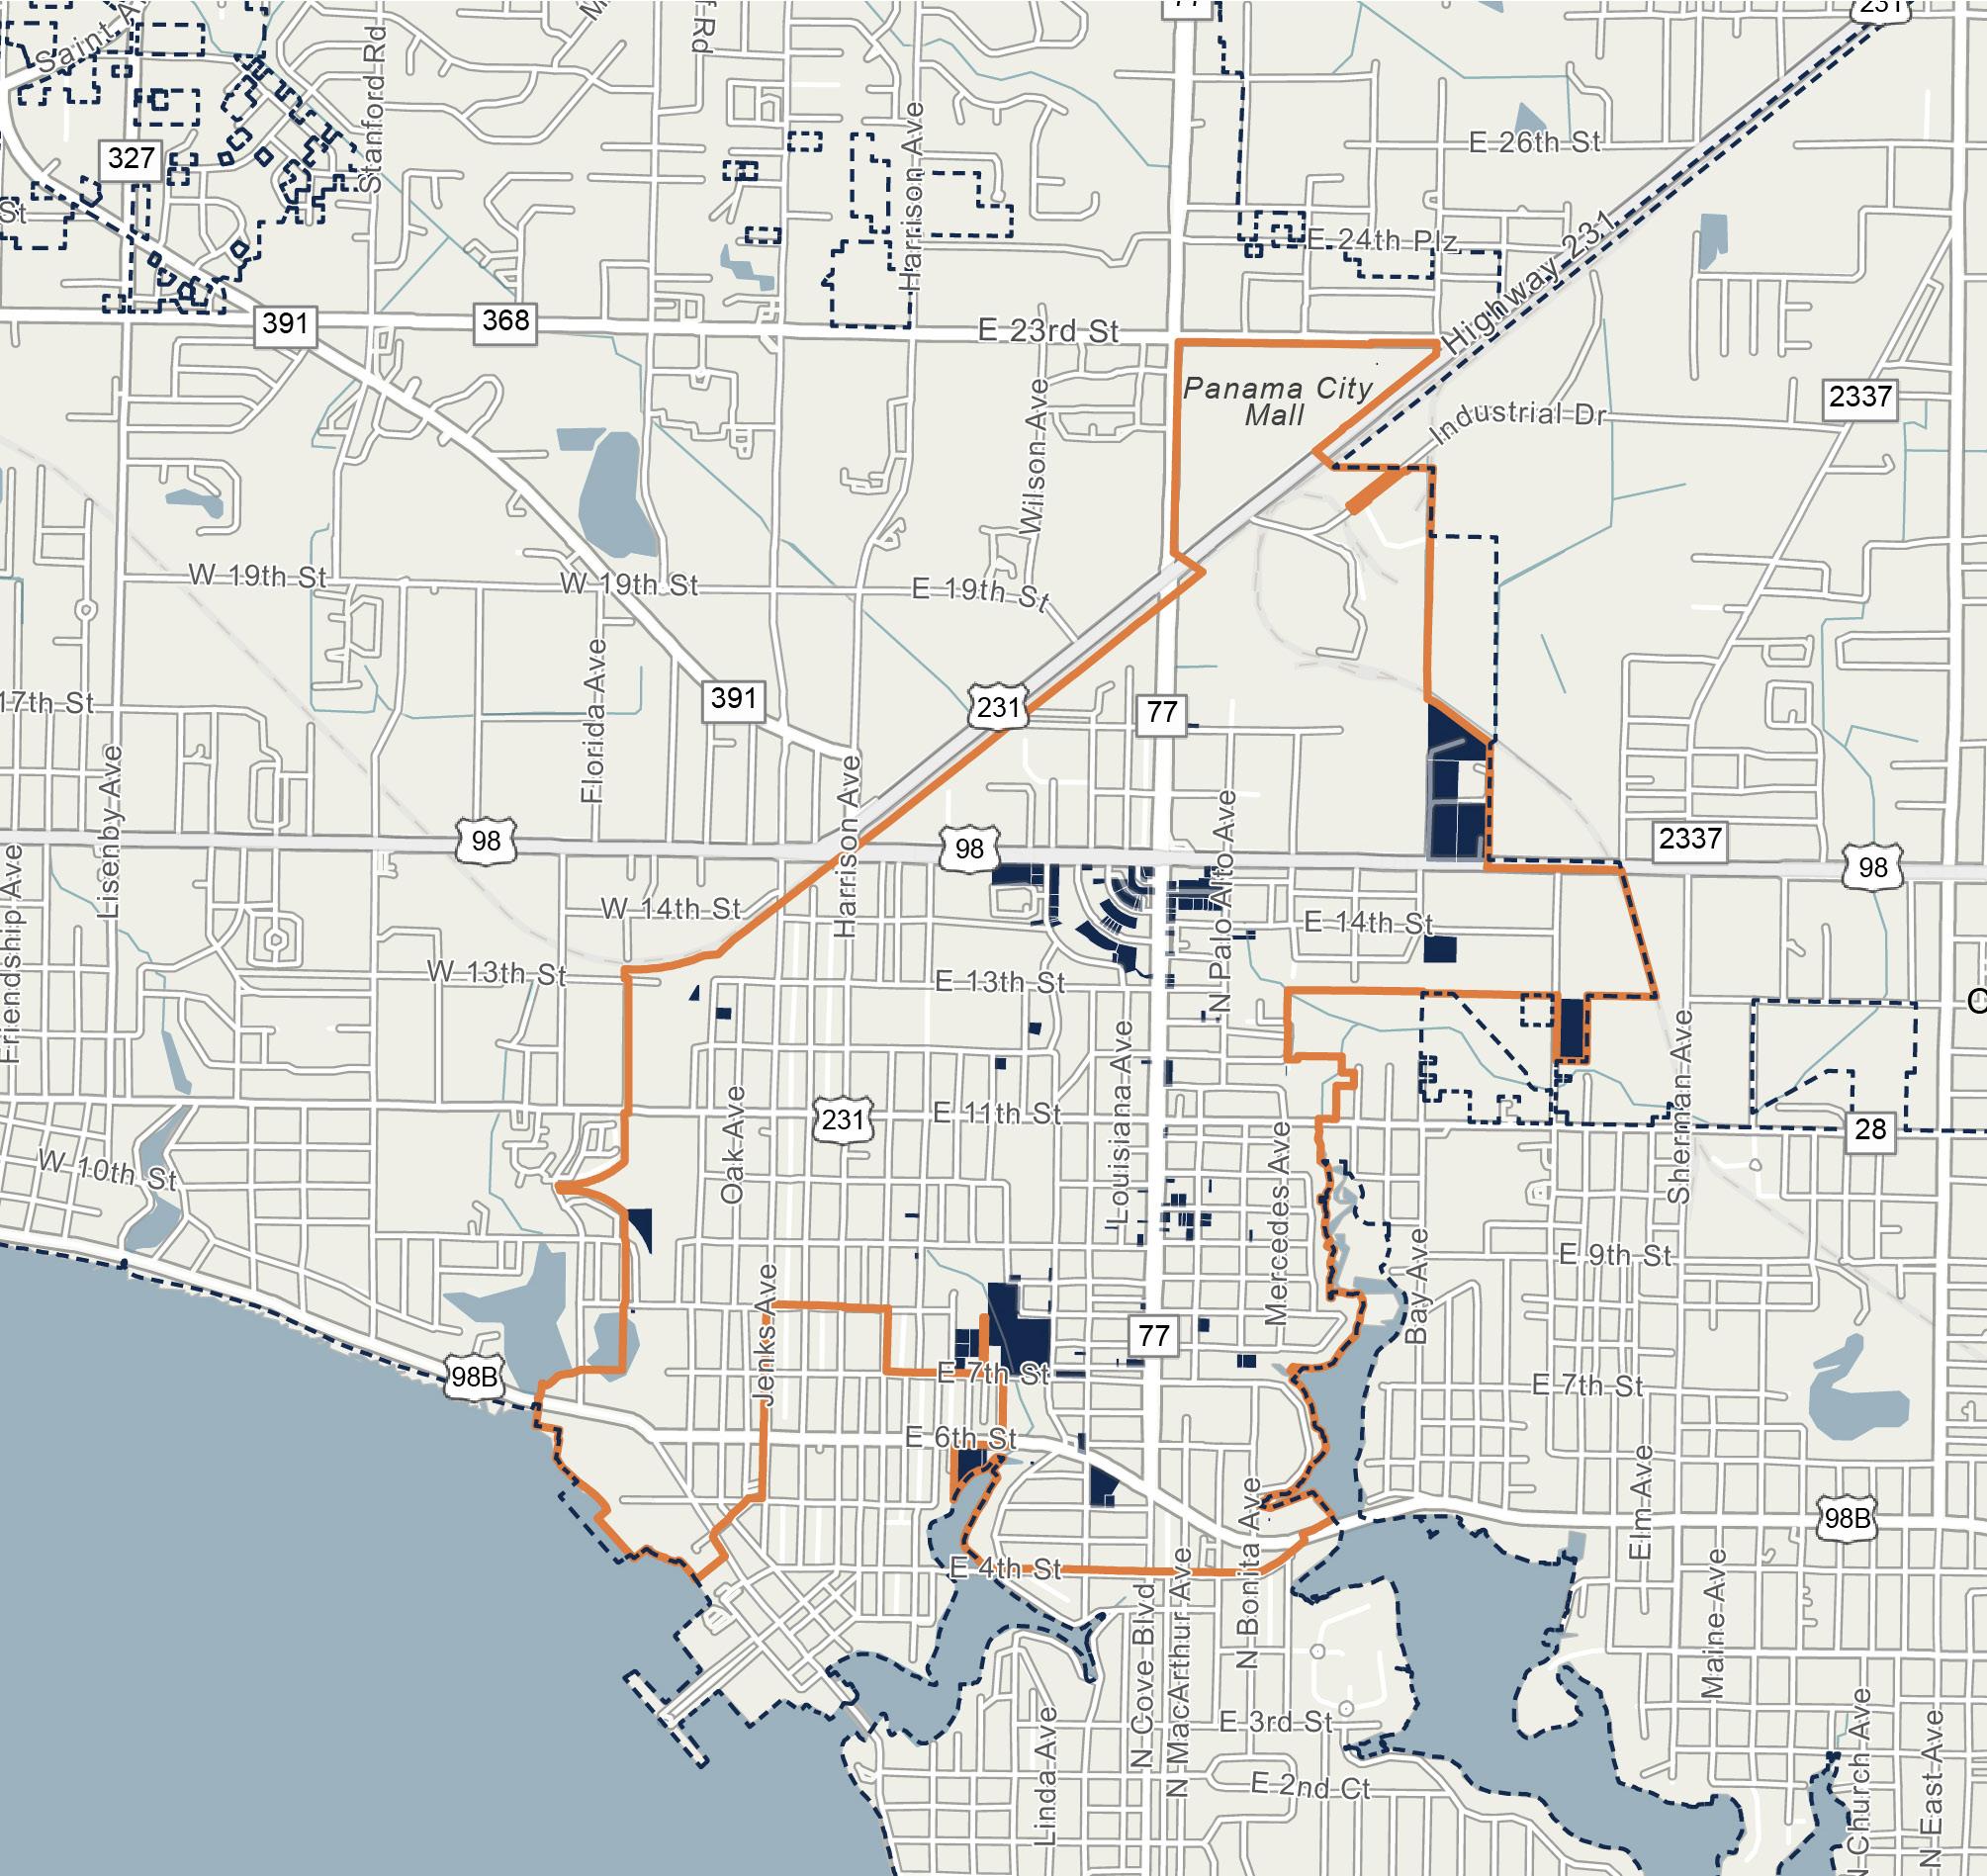
Figure 20. DOWNTOWN NORTH CRA CITY-OWNED PROPERTIES MAP
Vacant Parcels
Vacant parcels are those within the Downtown North CRA that are undeveloped and/or do not have a built structure upon them. The four categories of vacant parcels within Panama City include: Vacant Residential, Vacant Commercial, Vacant Industrial, and Vacant
Governmental, representing redevelopment opportunities in their respective land use categories. To note, the Vacant Governmental parcels may be utilized by the City and Agency to facilitate the implementation of redevelopment goals and strategies identified in this 2025 Plan.
The map below illustrates the vacant parcels by DOR code within the Downtown North CRA, with the legend detailing the distribution of total land acres by vacant parcel classification (see Figure 21). The majority of vacant land within the Downtown North CRA is primarily Vacant Residential.
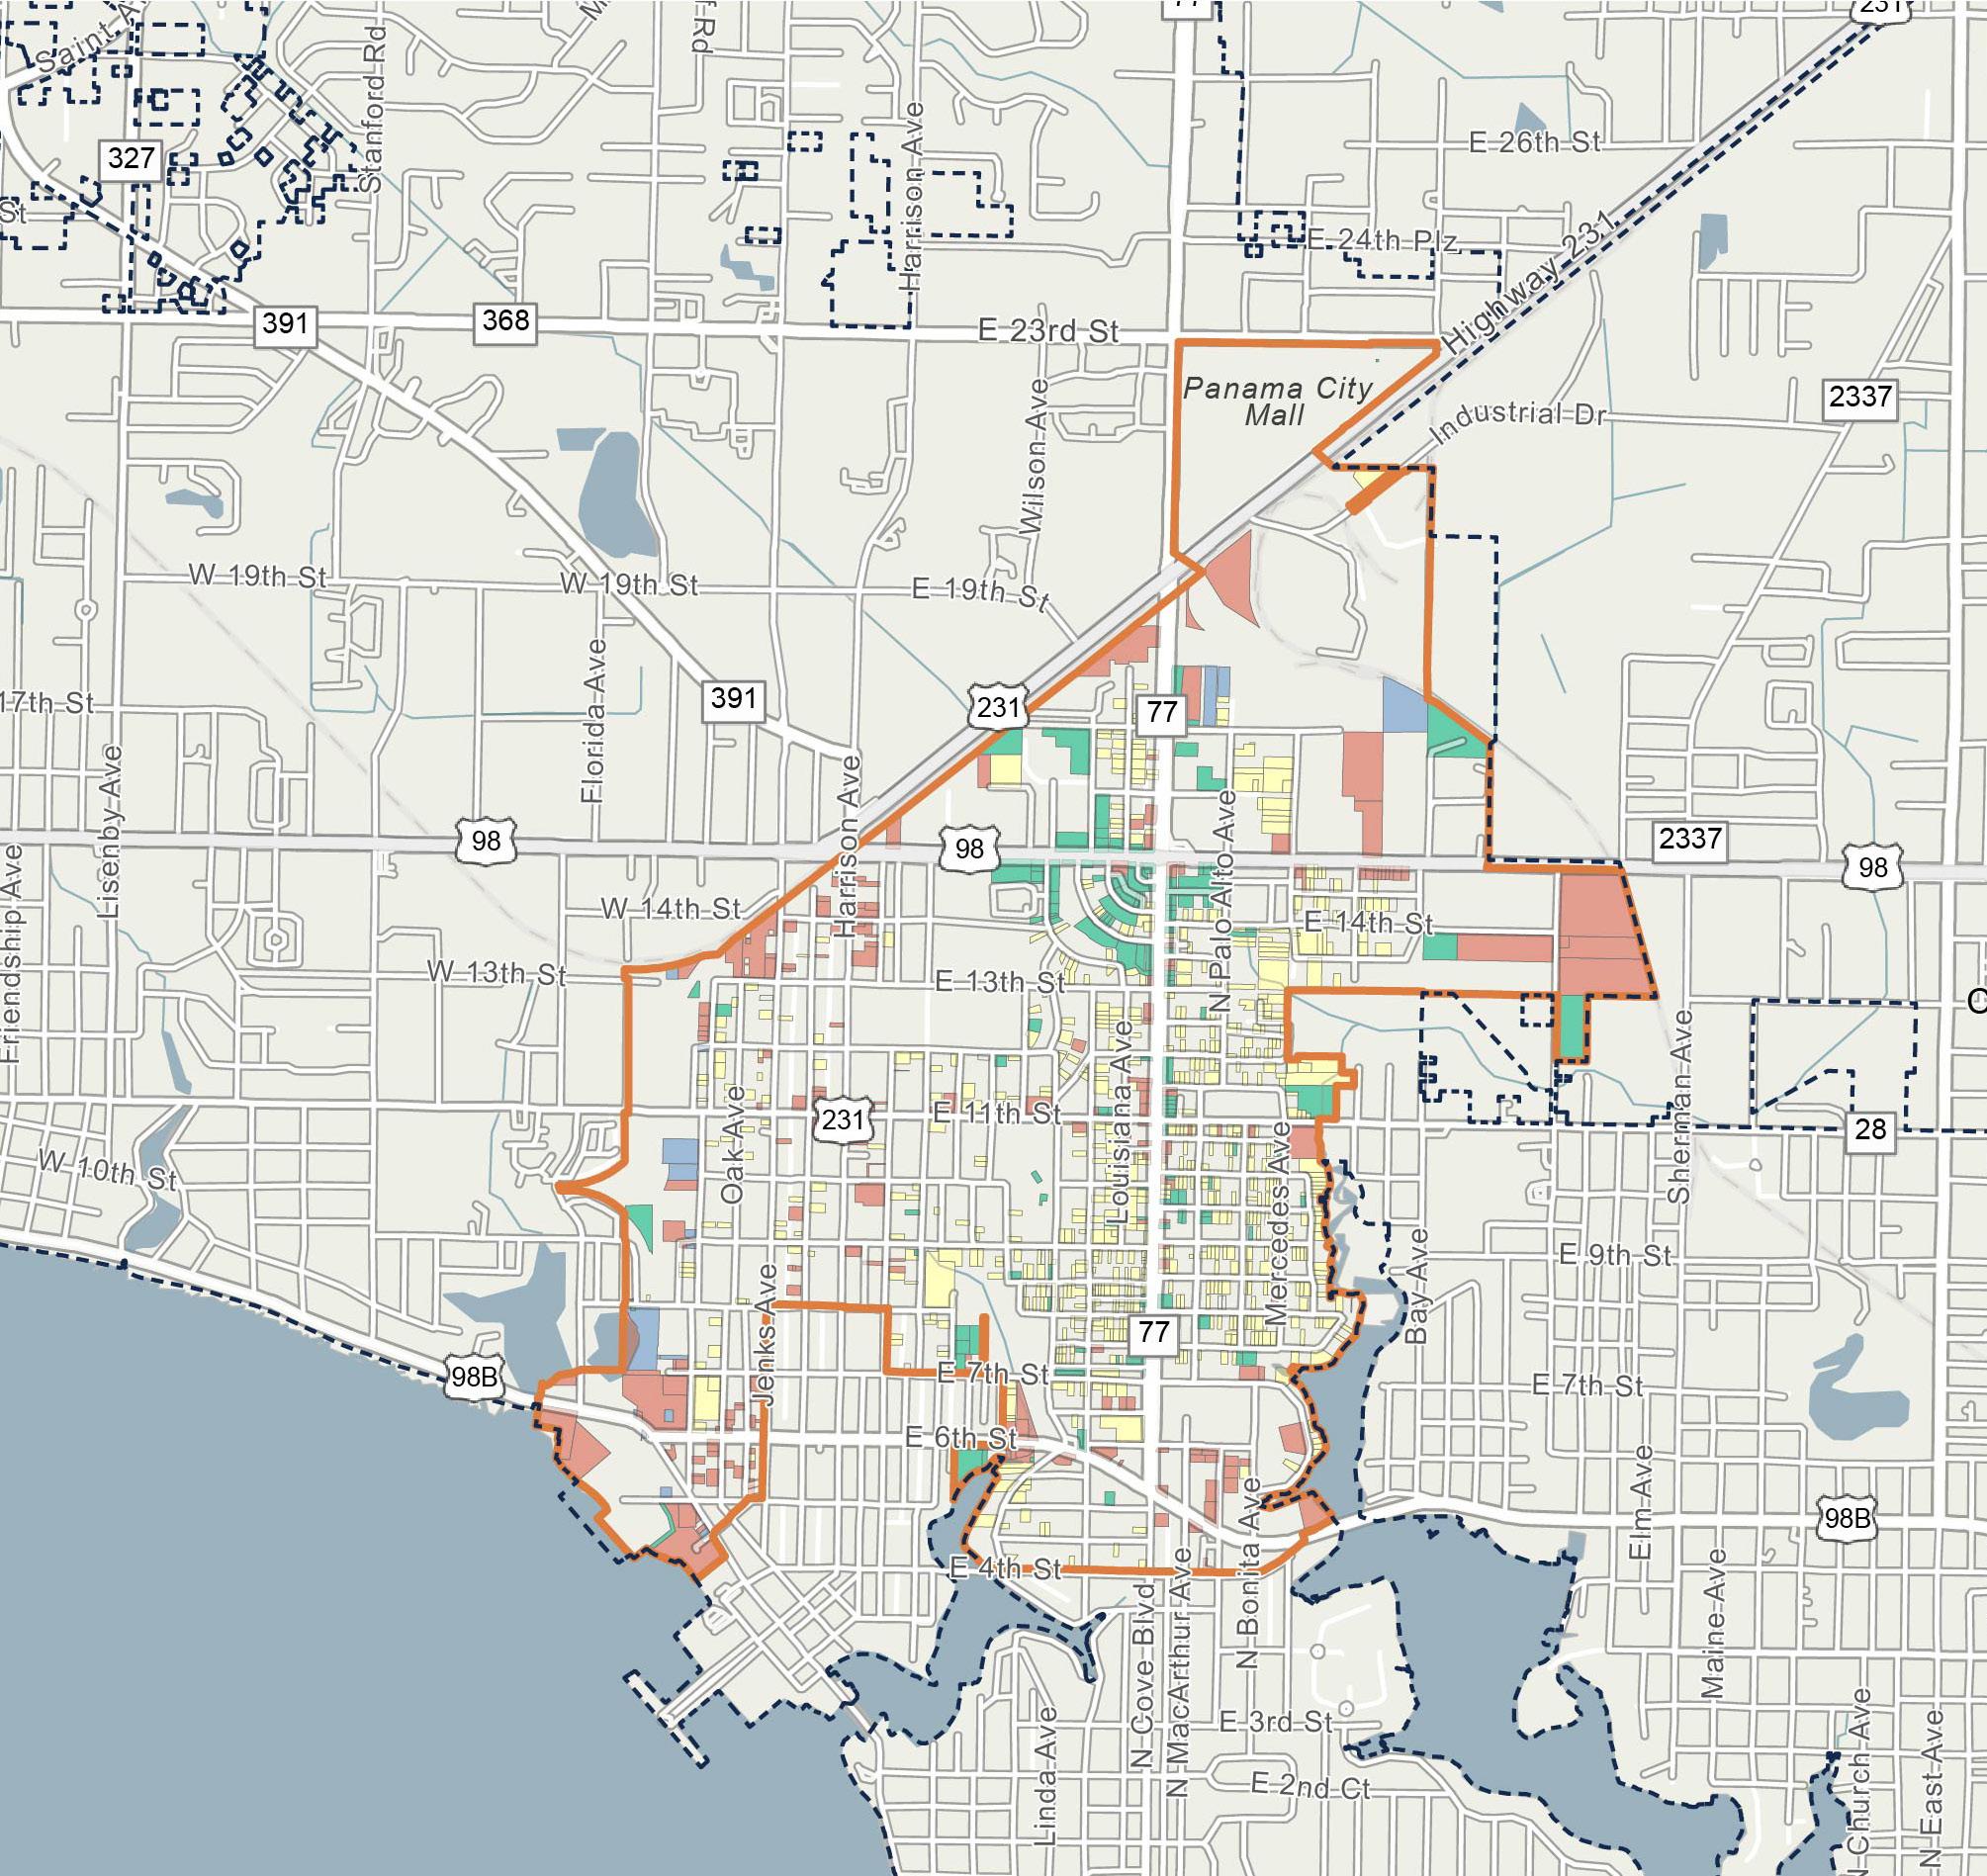
Figure 21. DOWNTOWN NO rTH C r A VACANT PA rC el S MAP
[ THIS PAGE INTENTIONALLY LEFT BLANK ]
MARKET ASSESSMENT AND DEMOGRAPHIC PROFILE
Overview
There are many key market characteristics, along with demographic and socioeconomic indicators to consider when assessing the overall market supporting demand within the Downtown North CRA, these include:
▪ Market Performance
▪ Population
▪ Age Distribution
▪ Housing Characteristics
▪ Race and Ethnicity
▪ Academic Achievement
▪ Income Characteristics
▪ Employment and Business Activity
As of year-end 2024, the Downtown North CRA is home to a population of 2,490 persons— composing 7.3% of the total population within the City. The Downtown North CRA has a population density of 1,275 persons per square mile, with a median age of nearly 41 years old. Total population within the Downtown North CRA has experienced a negative CAGR of 1.2% since 2010: from a total population of 2,950 persons in 2010 to 2,490 persons in 2024.
There are about 1,270 total housing units within the Downtown North CRA— composing 7.5% of the total housing units within the City. Total housing units within the Downtown North CRA experienced a negative CAGR since 2010 at 2.0%; from 1,700 units in 2010 to 1,270 units in 2024. Of the 1,270 housing units within the Downtown North CRA, nearly 57% are renter-occupied with 43% owner-occupied units. As of year-end 2024, the housing unit vacancy rate within the Downtown North CRA is 25%.
In addition, roughly 58% of the total population within the Downtown North CRA make up the working-class population, typically defined as persons between the ages of 20 and 64. Nearly 84% of the total population within the Downtown North CRA have obtained their high school diploma or greater, with almost 14% obtaining a bachelors’ degree or a more professional/graduate degree.
Population within the Downtown North CRA is predominately White at 44%, closely followed by Black/African-American with 40%; approximately 11% of the population identify as Hispanic ethnicity, as of year-end 2024.
The Downtown North CRA is also home to 7,020 total employees and 529 business as of yearend 2024. Total employment within the Downtown North CRA composes 20% of the total employment within the City, and has experienced a negative CAGR of 1.3% since 2010: from 8,580 total employees in 2010 to 7,020 total employees in 2024.
As of year-end 2024, the major industry sectors, dominating the employment market within the Downtown North CRA include health care and social
assistance, public administration, and retail trade—combined, these industries compose approximately 59% of the total Downtown North CRA employees. In addition, the yearend 2024 unemployment rate within the Downtown North CRA at 6.1% is greater than the 5.1% in the City.
As of year-end 2024, the Downtown North CRA is made up of approximately 2.5 million square feet (“SF”) of combined commercial uses (i.e., office, retail, and industrial/flex)—composing 15% of the City’s combined commercial space. In addition, the Downtown North CRA contains approximately 324 forrent multi-family residential units and 323 hotel rooms, composing 5.1% and 18% of the City’s for-rent residential market and hotel market, respectively. The table below illustrates the yearend 2024 market characteristics for the Downtown North CRA’s commercial, for-rent residential, and hotel market(s): see Table 6
The graphs and figures on the following page illustrate the year-end 2024 demographic and socio-economic characteristics of the Downtown North CRA.
Downtown North CRA Demographic and Socio-Economic Characteristics
2,490
POPULATION in the Downtown North CRA
Total population comprises 7.3% of the total population within Panama City.
2.5
1,270 HOUSING UNITS in the Downtown North CRA

The total housing units within the Downtown North CRA make up approximately 7.5% of the total housing units within Panama City.

EDUCATION 16% No High School Diploma
High School Diploma/GED
Associates Degree
Bachelor’s Degree+
7,020
EMPLOYEES in the Downtown North CRA
Represents an employee to population ratio of 2.8 persons per job, and comprises 20% of the total employees within Panama City.

6,149 Employed in the Area and Live Outside 889
UNEMPLOYMENT RATE INFLOW/ OUTFLOW(1) Live in the Area, Employed Outside
101 Employed and Living in the Area
INCOME CHARACTERISTICS
$253,832 Average Home Value
$23,179 Per Capita Income
$30,901 Median Disposable Income
$35,000 Median Household Income


GOALS, OBJECTIVES, AND ACTION STRATEGIES
As a part of this 2025 Plan , major goals, objectives, and action strategies were identified specifically for the Downtown North CRA. The action strategies for achieving each objective are outlined beneath their respective objectives below.
The Agency’s major goals in this 2025 Plan include creating:
1. Support Economic Growth, Job Creation, and Small Business Development
2. Expand Housing Opportunities
3. Improve Infrastructure, Mobility and Connectivity
4. Enhance Public Safety
5. Activate and Improve the Waterfront
6. Enhance Open Spaces, Recreation and Community Facilities

7. Promote Cultural Identity and History
8. Advance Sustainability and Resilience
These major goals, objectives, and action strategies guide the Agency in evaluating projects and programs for potential implementation to address the opportunities and challenges facing the Downtown North CRA.
Support Economic Growth, Job Creation, and Small Business Development
To support economic growth, job creation and small business development, the objectives and strategies listed are intended to support the Downtown North CRA's current businesses, residents, and employees by investing and enhancing residential and commercial spaces.
Objective 1: Formulate economic development strategies that provide Downtown North CRA residents with access to employment opportunities.
▪ Develop programmatic and strategic partnerships between institutional entities to encourage additional training and service for the Downtown North CRA’s youth.
▪ Promote green industries and training programs for greencollar jobs and seek grants for green-collar job training.
▪ Partner with non-profit organization and agencies to offer workshops, seminars, and training programs that will help increase the skills of the working population.
▪ Communicate with current industry and business operators within the Downtown North CRA to identify specific needs and barriers to growth that can be resolved by the local educational and training institutions, government agencies, and other private sector businesses.
▪ Work with the Parks, Culture, and Recreation Department to institute programs to educate residents about basic life management skills, such as financial management and homeownership awareness.
▪ Work with the City, County, and the Chamber of Commerce to establish a business assistance program to attract and retain businesses, expand training and mentorship opportunities, and increase job accessibility.
▪ Partner with educational institutions and training providers to support workforce development.
▪ Support technical assistance, workforce development and mentorship programs.
Objective 2: Attract and encourage mixed-use, commercial, economic development and redevelopment.
▪ Attract grocery, healthcare, and mixed-use projects.
▪ Provide targeted incentives such as TIF, grants, and fee waivers to stimulate improvements or private investment.
▪ Acquire or receive strategic properties, including vacant buildings, and support necessary site preparation, to facilitate redevelopment, entrepreneurship and job creation.
▪ Develop projects when necessary to catalyze investment, fill gaps, or address community needs.
▪ Consider the Southwest Corner of MLK Jr. Boulevard and 15th Street as the intersection for a mixed-use center to provide community desired amenities.
▪ Seek opportunities to develop incentives and form partnerships between developers and residents that encourage local participation.
▪ Promote, support and grow small business development.
Objective 3: Establish a set of priorities within the appropriate administrative framework required for successful program implementation.
▪ Work closely with neighborhood leaders, the City, the County, and other pertinent institutions and organizations

to develop annual work plans to update and review the community’s concerns and progress.
▪ Coordinate any information about plans, projects, and programs that will be have an impact or be undertaken in the Downtown North CRA.
Expand Housing Opportunities
▪ Work with the City to utilize Geographic Information System (“GIS”), providing a more user-friendly format for integrating outside data and upgrading internal networking and services.
To expand housing opportunities throughout the Downtown North CRA, the objective is to improve neighborhoods by increasing housing opportunities and supporting investments and home-owner education opportunities.
Objective 1: Redevelop vacant and boarded properties to encourage adaptive reuse, infill development, and to improve the investment image of the community.
▪ Introduce multi-family housing and mixed uses at strategic locations to increase diversity in housing stock.
▪ Propose Infill Housing Redevelopment Program that encourages the construction of new affordable singlefamily homes. The program, as contemplated, might offer:
– Grants for or toward impact fees and other financial barriers inhibiting new development and redevelopment. .
– Up to $50k in purchase assistance for buyers of homes built through this program.
▪ Encourage infill and rehabilitation of housing.
▪ Contact absentee landlords and owners of vacant properties to determine their interest in redevelopment.
▪ Support and facilitate efforts in developing affordable housing in the Downtown North CRA through partnerships.
▪ Provide relocation assistance to residents and businesses displaced by redevelopment projects, ensuring equitable transitions and minimizing hardship during community transformation.
Objective 2: Promote programs that support investment in residential development, enhance property values, and cultivate positive perceptions of housing.
▪ Collaborate with local developers, the Chamber of Commerce, and the City to create a strategy for attracting investment into the Downtown North CRA.
▪ Engage with non-profit and faith-based housing development organizations to explore potential opportunities for housing development and partnership.
▪ Involve the neighborhood associations, business groups, non-profit developers, local Realtors, and City staff in the decision-making process related to housing provisions in the Downtown North CRA.
▪ Promote the formation of a Landlord/Tenant Association to encourage and support the landlords in providing the best quality service to their renters.
▪ Participate in events to disseminate information about Agency programs available in the Downtown North CRA.
▪ Accept land donations or acquire parcels to support residential goals.
▪ Collaborate with volunteer services to assist with residential repairs and improvements.
Objective 3: Increase homeownership opportunities and education.
▪ Partner with non-profit organizations to initiate education and counseling programs that assist existing and prospective homeowners with life skills.
▪ Collaborate with the City to streamline the development review process for housing
redevelopment and development.
▪ Partner with local banks to create incentives such as increased points added to credit scores and lower mortgage payments for potential buyers who complete a homebuyer’s education program.

Improve Infrastructure, Mobility, and Connectivity
▪ Partner with local schools to provide financial literacy and life management training programs for the community.
To improve infrastructure, mobility, and connectivity, the objectives and strategies listed are intended to support the Downtown North CRA's neighborhoods by providing necessary infrastructure and transportation improvements.
Objective 1: Enhance mobility by providing increased access to a safe and adequate multi-modal transportation system.
▪ Support upgrading and modernizing roads, stormwater systems, and utility infrastructure by integrating smart infrastructure and emerging technologies—such as broadband/fiber networks, EV charging stations, and real-time transit systems— into projects funded by the CRA to improve longterm functionality and competitiveness.
▪ Coordinate regional transit and bike access.
▪ Implement complete streets with lighting, sidewalks, and bike lanes.
▪ Improve regional connectivity through upgraded public transit, complete streets, and expanded pedestrian and bicycle networks.
▪ Work with residents to identify inadequately designed bus transit routes and evaluate the location of bus stops in relation to pedestrian needs.
▪ Collaborate with the County to ensure that new neighborhood activity centers are well served by transit as
the community grows and develops.
▪ Improve user comfort and visibility of bus stops by installing lighted bus shelters, benches, trash receptacles, signage, etc.
▪ Collaborate with the City to investigate the feasibility of providing dedicated shuttle service to connect various activity centers in the Downtown North CRA to surrounding neighborhoods and the entire City
Objective 2: Increase pedestrian mobility in the Downtown North CRA to connect adjoining areas and to create a safe and convenient system of pedestrian and biking routes.
▪ Develop or expand trail systems for pedestrians and bicycles that connect neighborhoods to parks, schools, commercial areas, and community destinations.
▪ Improve pedestrian circulation and safety along the major corridors, employing a combination of streetscape elements, such as directional signage, landscaped medians, traffic calming, and sidewalks.
▪ Design the proposed Martin Luther King Jr. Boulevard Linear Park and Multi-
Use Trail Greenway using Crime Prevention Through Environmental Design (“CPTED”) principles and accommodate a diverse range of activities that encourage pedestrian walkability, such as civic plazas, visual landmarks, and passive recreational uses.
▪ Encourage land clustering, where appropriate, to create a compact neighborhood form that supports pedestrian friendly environments.
▪ Identify key destinations within the Downtown North CRA and enhance their visibility to pedestrians through architectural design, strategic building placement, landscaping, and directional signage.
▪ Support the improvements identified by the Bay County TPO Bicycle and Pedestrian Master Plan that fall within Downtown North CRA.
Objective 3: Support and develop policy and code enforcement to incentive City beautification and revitalization.
▪ Work with the Code Enforcement Department to identify vacant sites that have a detrimental impact on the investment image and the tax
base of the community, and work with the City to clean up these properties.
▪ Address concerns regarding absentee landlords who do not provide adequate service to the residents of their property.
▪ Work with the Community Development Department and Code Enforcement Division to identify occupied properties with code violations and contact property owners to facilitate repairs.

▪ Develop policies and enforce regulations that hold absentee landowners accountable for the maintenance and upkeep of their properties.
▪ Work with community and faith-based organizations to generate community support in pursuing beautification efforts in the neighborhood.
▪ Work with City staff to formalize policies and procedures for integrating public art into public realm projects.
Enhance Public Safety
▪ Develop a unified funding strategy for the arts, including grants, sponsorships, adopta-street programs, and tax appropriations.
▪ Collaborate with the City to establish a Public Arts Commission to lead, implement, and manage the public arts program.
To enhance public safety, the objectives and strategies listed are intended to support the Downtown North CRA's community and partners to ensure safe streets and provide safety initiatives.
Objective 1: Expand public safety programmatic efforts in the Downtown North CRA to provide a safe and secure environment for the residents.
▪ Work with the City, educational institutions, faithbased organizations, and other nonprofit organizations to organize neighborhood outreach drives to inform and educate residents about: (1) Emergency preparedness; (2) Reporting illegal activities; and (3) Housekeeping issues to prevent code violations and fire accidents in the neighborhood.
▪ Collaborate with the City's Police Department, Fire Department, and residents to address crime and fire emergency issues, and strengthen the policecommunity partnership to create safer streets that are more attractive to businesses and residents.
▪ Initiate community-based activities involving the
youth and public safety staff to generate support and participation in local anti-crime programs, and to improve public relations with the City's Police Department.
▪ Encourage neighborhoods throughout the Downtown North CRA to institute Neighborhood Watch programs.
▪ Support Crime Prevention Through Environmental Design (CPTED) principles into improvements and projects funded by the CRA.
▪ Partner with local law enforcement and community organizations to support proactive public safety initiatives and community policing efforts.
Objective 2: Secure and repair infrastructure to support safety initiatives.
▪ Improve lighting, visibility, and pedestrian infrastructure to enhance public space safety.
▪ Support programs and facilities that reduce loitering, illegal dumping, and vandalism through strategic activation of underutilized spaces.
▪ Encourage the redevelopment of blighted or abandoned properties that contribute to unsafe conditions.
▪ Install or improve security infrastructure (e.g., cameras, emergency call stations) in key public areas when appropriate.
▪ Promote safe, walkable, and accessible environments through streetscape improvements and trafficcalming measures.
▪ Implement rights-of-way and vacant properties maintenance program(s) surpassing City minimum maintenance standards in accordance with maintenance agreement between City and Agency.

Activate the Waterfront
To activate and improve the waterfront in the Downtown CRA, the objective and strategies listed are in intended to encourage updating plans that support local businesses and create a thriving public space along the Watson Bayou..
Objective 1: Support and initiate improvements to the waterfront, with a focus on Watson Bayou.
▪ Develop or assist with public trails to Watson Bayou.

▪ Create shoreline parks and launch points.
▪ Integrate nature-based solutions for erosion and flooding.
▪ Secure land to enable public access to the waterfront.
▪ Support dredging of Watson Bayou to provide boat access.
Enhance Open Spaces, Recreation, and Community Facilities
To enhance open spaces, recreation, and community facilities, the objectives and strategies listed are intended to support the continuation of streetscape projects, while focusing on developing a comprehensive signage program and functional community spaces.
Objective 1: Improve streetscape along commercial and residential areas within the Downtown North CRA.
▪ Prioritize streetscape projects of the following corridors in conjunction with other planned improvements:
– Primary Commercial Corridors: U.S. Hwy. 231, Harrison Avenue.
– Community Commercial Corridors: 15th Street, U.S. Hwy. 98.
– Downtown Transition Corridors: Jenks Avenue, 7th Street.
– Neighborhood Connectors: Martin Luther King Jr. Boulevard, 11th Street.
▪ Design a unified theme for streetscape improvements along major thoroughfares.
▪ Provide adequate street lighting in the Downtown North CRA, incorporating lighting design standards for all public improvements.
▪ Emphasize links to area parks, trails, schools, commercial centers, and community facilities.
▪ Accentuate significant intersections with urban design elements where neighborhood connector streets meet primary corridors.
▪ Encourage shared parking between adjacent uses along the commercial corridors to reduce excessive curb-cuts and create a safer environment for both pedestrians and automobiles.
▪ Work with the Florida Department of Transportation (“FDOT”), review the FDOT “Livable Communities” policies, and pursue its application on the Martin Luther King Jr. Boulevard.
Objective 2: Develop an interconnected parks and recreation system that enhances the Downtown North CRA’s aesthetic and provides increased public access to a range of recreational activities.
▪ Enhance aesthetics through use of decorative lighting in parks and along roadways, seasonally or year-round.
▪ Conduct neighborhood workshops to assess the need for expansion of the Martin Luther King Jr. Recreation Center and evaluate the feasibility of locating a community park and/or sports complex at this location.
▪ Pursue the design and construction of a linear park and multi-use trail system along Martin Luther King Jr. Boulevard that will serve as a pedestrian connector linking the Downtown North CRA’s activity centers.
▪ Pursue the restoration of Watson Bayou and examine the feasibility of introducing water-based activities.
▪ Partner with the local schools and churches to form jointuse agreements that serve the Downtown North CRA’s recreational needs, e.g., utilizing their facilities for additional recreation and cultural facilities.
▪ Participate in special events, such as the Glenwood community barbecue, nature
study tours, outdoor concerts, inter-neighborhood sports event, etc., at the Downtown North CRA’s recreational facilities and parks to disseminate information about Agency programs available in the Downtown North CRA.
▪ Upgrade Henry Davis Park and enhance visual and physical access from Martin Luther King Jr. Boulevard.
▪ Upgrade stormwater retention ponds.
▪ Preserve existing tree canopies.
▪ Improve park safety, lighting, and accessibility.
▪ Review residential property inventory to identify opportunities for development of neighborhood parks and initiate acquisition of privately-owned vacant lots, as well as dilapidated or uninhabitable structures.
Objective 3: Form strategic partnerships to strategically locate and utilize community facilities to provide a high level of service.
▪ Initiate discussions with the City, neighborhood associations, faithbased organizations, and community agencies to create a one-stop resource center that provides residents and businesses with updated information on local and regional services and programs.
▪ Improve, develop and maintain recreation buildings, facilities and spaces.
▪ Acquire or re-purpose land for public recreation.
▪ Maintain and enhance CRA improvements and vacant properties to support safe, attractive, and functional public spaces.
▪ Initiate discussions with the City, neighborhood associations, faithbased organizations, and community agencies to create a one-stop resource center that provides residents and businesses with updated information on local and regional services and programs.
▪ Develop a newsletter to disseminate information about the Downtown North CRA’s accomplishments, status of proposed projects, and resources available to residents and businesses.
▪ Work with the City and the County to ensure consistency between planning efforts and help align various budgets, goals, and priorities of the City and County to support the Downtown North CRA.
▪ Support the City to install new water transmission lines in the Downtown North CRA.
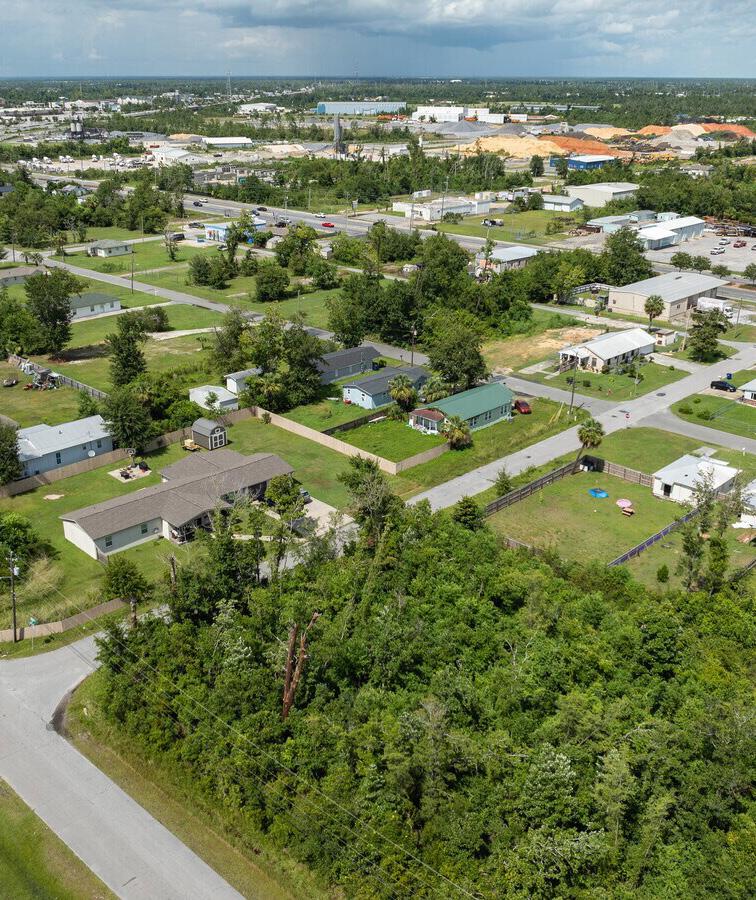

Promote Cultural Identity and History
To promote cultural identity and history, the objectives and strategies listed are intented to support historic preservation efforts through community education programs and implementing streetscape designs that will promote a community identity.
Objective 1: Establish neighborhood identity and improve neighborhood interconnectivity.
▪ Establish an area-wide gateway and directional signage system to neighborhoods and major centers of activity, including major gateways such as:
– Primary Gateways: (1) U.S. Hwy. 231- and Mercedes Avenue; (2) U.S. Hwy. 98 and Mercedes Avenue; (3) McKenzie Avenue and 15th Street East.
– Secondary Gateways: (1) Martin Luther King Jr. Boulevard and 15th Street East; (2) Martin Luther King Jr. Boulevard and 11th Street East; (3) Martin Luther King Jr. Boulevard and 7th Street East; (4) Jenks Avenue and 7th Street West.
– Neighborhood Gateways: (1) Martin Luther King Jr. Boulevard and 13th Street East; (2) Martin Luther King Jr. Boulevard and 9th Street East; (3) Wilson Avenue and 9th Street East; (4) Harrison Avenue and 9th Street East.
▪ Initiate streetscape improvements to create a cohesive urban form throughout the Downtown North CRA.
▪ Install public art, wayfinding, and historic interpretation.
▪ Upgrade the infrastructure and amenities of the Downtown North CRA,
including enhancements to Henry Davis Park and the installation of new streetlights, to ensure public improvements are in place to support new development and anticipated population growth.
▪ Recognize and preserve the unique heritage of the district through plaques, murals, and interpretive displays.
▪ Develop cohesive design standards that reflect neighborhood identity and reinforce sense of place.
▪ Support community-based historic preservation efforts.
▪ Support revitalization of the Glenwood African-American Cultural Center through installations, exhibits, and curated spaces within existing facilities or with other cultural institutions.
Objective 2: Collaborate with community entities to promote historical preservation and community involvement to create a sense of place and identity.
▪ Work with the City and community organizations to initiate programs that promote African-American culture and heritage.
▪ Partner with not-for-profit organizations to establish youth programs to help with housing renovations and construction to instill a sense of pride in their neighborhood.
▪ Identify, restore, and preserve historic buildings as tourist attractions and for historical and/or cultural uses.
▪ Collaborate with the Bay County Historical Society to create a historic site directory.
▪ Participate in events that resurrect the Downtown North CRA’s activities of the past, such as the Emancipation Day parade, Thanksgiving Football Bowl, May Day, etc., to disseminate information about Agency programs available in the Downtown North CRA.
▪ Encourage residents to become active participants and members of existing cultural affairs organizations and events.
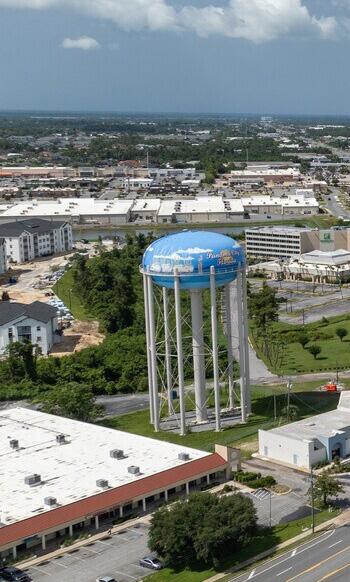

Advance Sustainability and Resilience
To advance sustainability and resilience, the objectives and strategies listed are intended to develop and implement plans that create energy efficient infrastructure throughout the Downtown North CRA.
Objective 1: Promote CRAwide resiliency infrastructure upgrades, with a focus on the Massalina Bayou Stormwater Park
▪ Build stormwater capacity with green infrastructure.
▪ Consider a new stormwater park that extends the Bayou, restores natural drainage, provides needed stormwater absorption, and creates frontage for new development.
▪ Promote tree planting, incorporate native landscaping and renewable energy upgrades.
▪ Support resilience planning for flood-prone areas.
▪ Support energy-efficient and resilient building practices.
▪ Install solar lighting in parks, trails, and public spaces to reduce energy use and enhance safety.
▪ Implement urban heat mitigation strategies such as expanded tree canopy, shaded streetscapes, and reflective surfaces to improve livability and address climate-related impacts.
▪ Connect stormwater park(s) with the surrounding neighborhoods and development with a trail/ and multi-use path to make this amenity accessible to many residents.
▪ Work with the City’s Engineering Division and Utilities Division to upgrade the water and sewer system to better serve the Downtown North CRA.
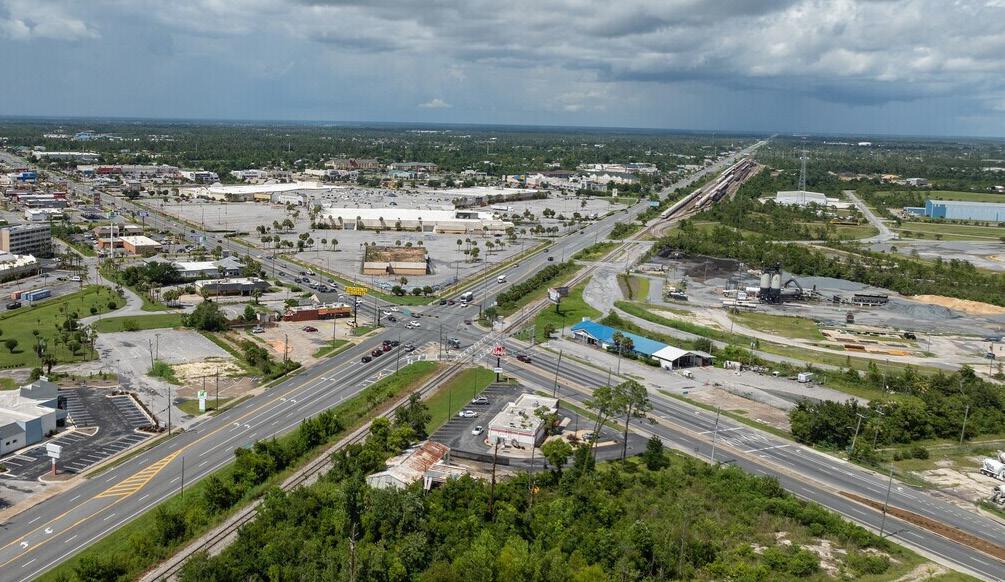
DOWNTOWN NORTH PANAMA CITY | SOURCE HOMES.COM
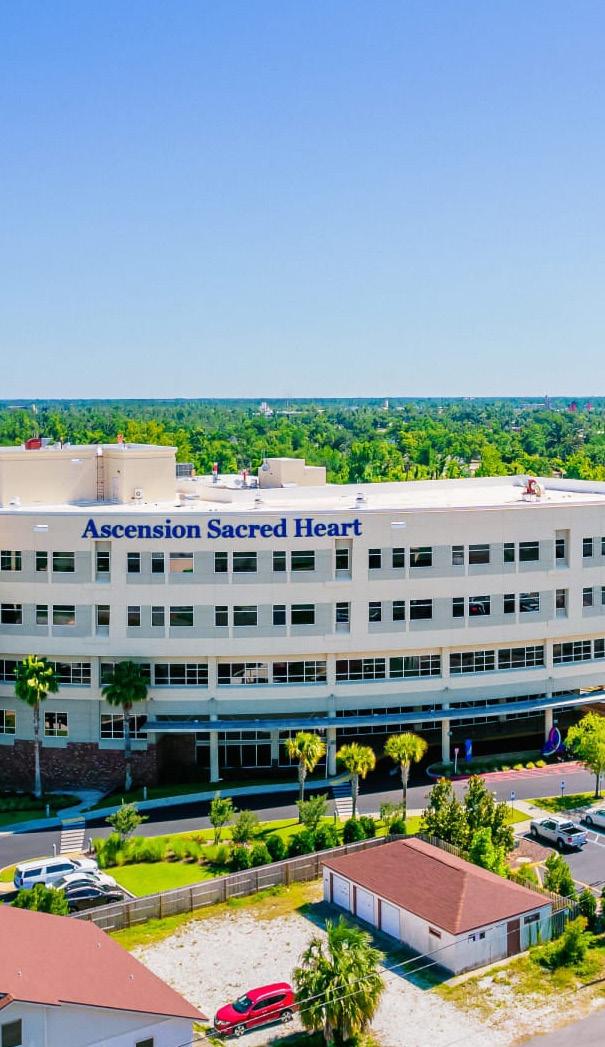
CONCEPTUAL MASTER PLAN
The Conceptual Master Plan for the Downtown North CRA illustrates the general locations of the previously installed capital improvements and proposed capital improvements and programming identified in the Capital Projects and Programming Worksheet, further detailed in Section 6, Financial Analysis of this document (see Figure 22).
Specific proposed capital improvements illustrated below include redevelopment focus areas, a primary gateway in the Cultural District, multi-modal transit and pedestrian trails, the Cultural District Park, and safer streetscapes and intersections to enhance walkability and bike paths.
Downtown North CRA
Primary Gateway
Multi Modal Transit/Pedestrian
Cultural District Park
Intersection Improvements
Redevelopment Focus Area
Proposed Protected Bike/ Cycle Tracks
Proposed Multi-Use Path
Proposed Pedestrian/ Streetscape Improvement
Additional Pedestrian/Bike Connection
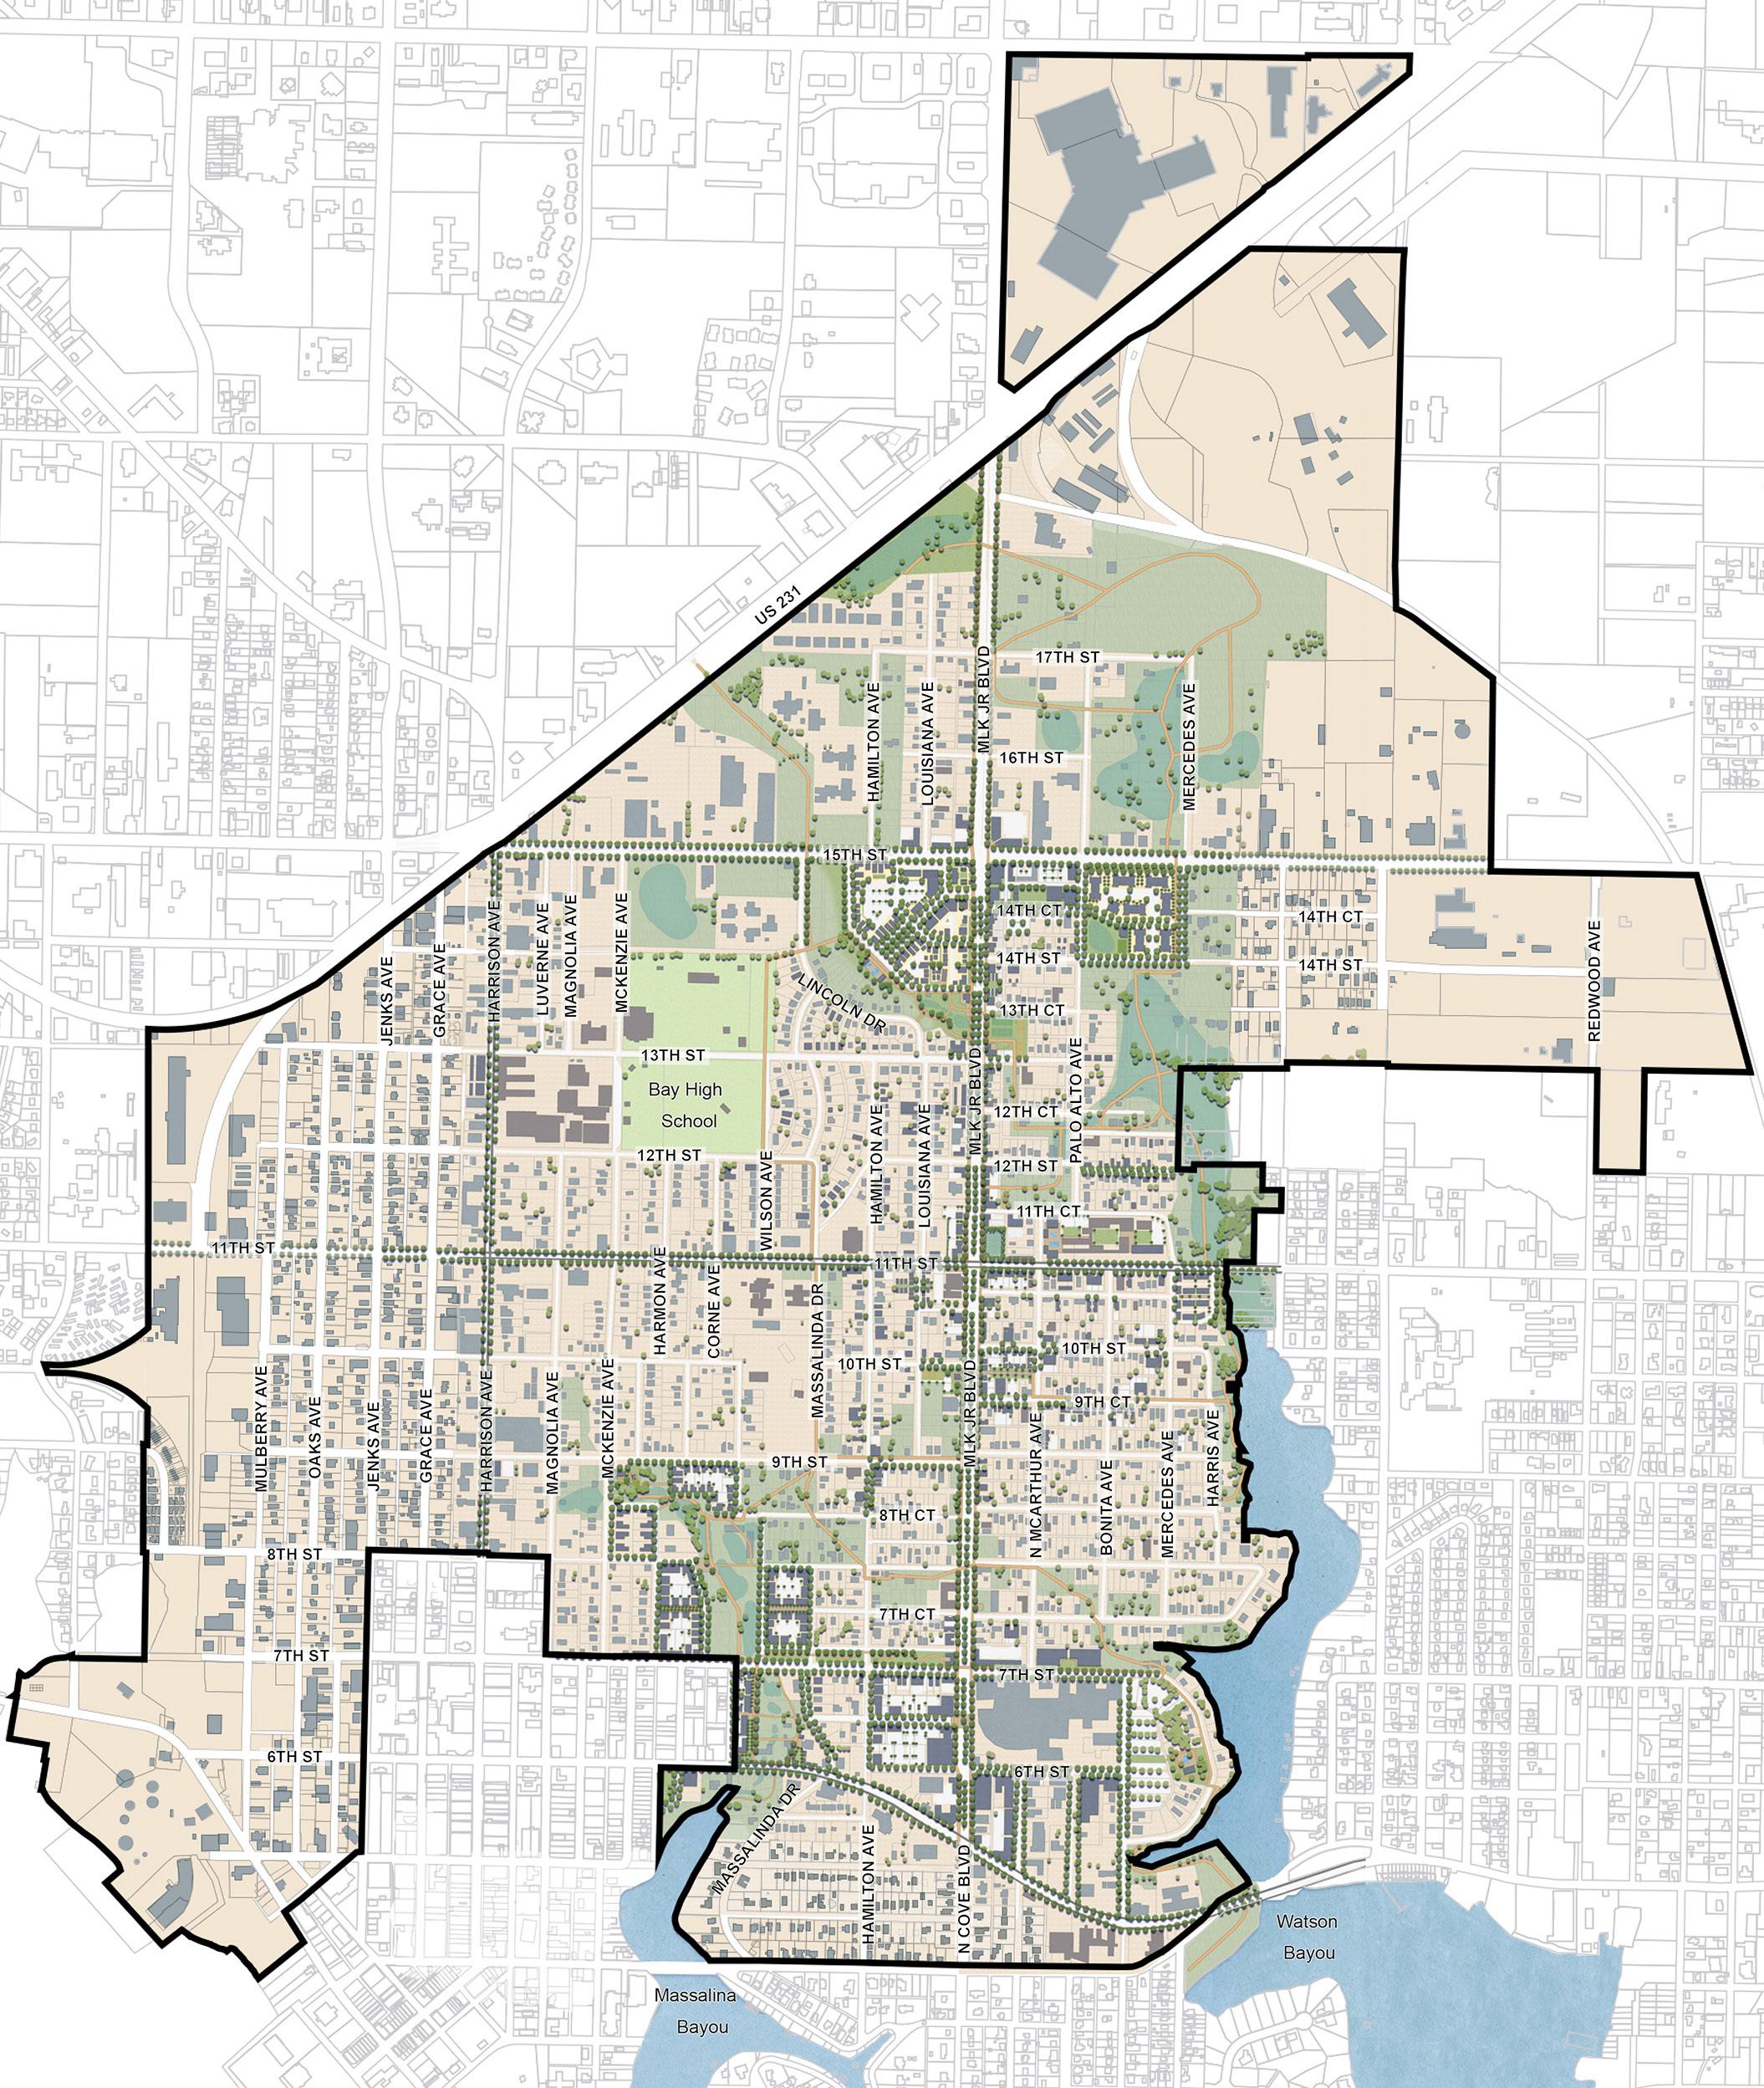
Figure 22. DOWNTOWN
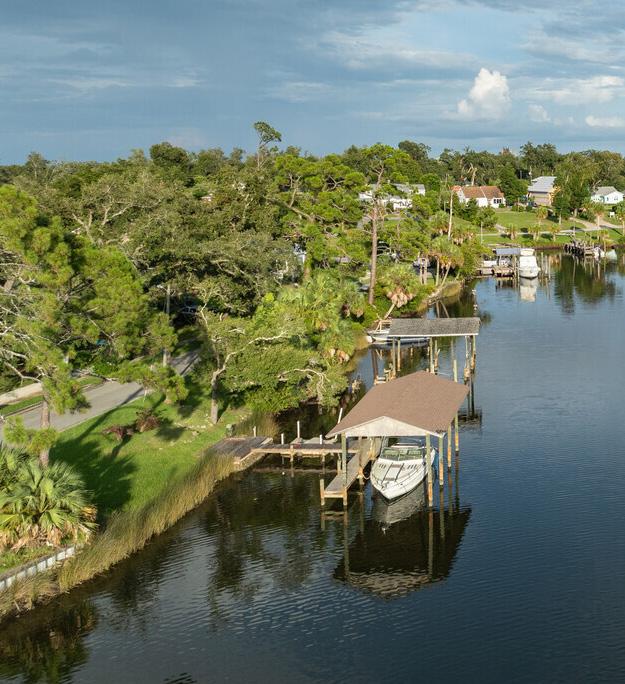
MILLVILLE COMMUNITY REDEVELOPMENT AREA
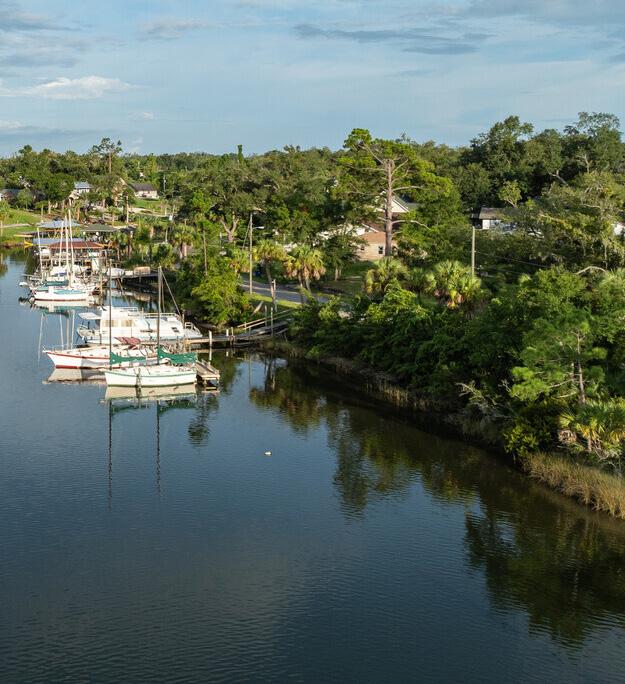
MILLVILLE COMMUNITY REDEVELOPMENT AREA
MILLVILLE CRA HISTORY
Overview
The Millville Community Redevelopment Area (“Millville CRA”) was established in 2004, with the objective to revitalize the Millville neighborhood within the City. This urban area is renowned for its historic sawmills, shipyard industries, walkable streets, and traditional homes, along with extensive waterfront access along Watson Bayou. The Millville CRA is bound by 7th Street to the north, Everitt Avenue to the east, Cherry Street to the south, and Watson Bayou to the west, with a small portion of the Millville CRA located on the west side of the Watson Bayou encompassing the Cove Point Drive neighborhood. The Millville CRA is approximately 681 acres, as illustrated in the following map (see Figure 23).
The Millville CRA encompasses the southeastern area of the City. The Millville CRA contains major anchor developments, such as the historic shipyard, Daffin Park, the Millville Waterfront Park, the Millville Cemetery, Whittington Park, the Millville Pier, and the Snug Harbor. In addition, major roadways within the Millville CRA include U.S. Hwy. 98 and State Road 389.
History
The awakening of the Millville area began in the early 1900s when Henry Bovis, a French Canadian with lumber interests surveyed the area and developed a mill on the Watson Bayou. Those looking for work during that time flocked to the area and resulted in the area’s rapid growth. By 1910, the port in Millville became one of the busiest in the Florida region, and the area officially became incorporated in 1913.
Most notably, in 1918, the Panama City Chamber of Commerce lobbied for a shipyard in Millville, and the U.S. Shipping Board Emergency Corporation signed a contract to construct eight barges at the Millville site. Four hundred people were employed at the shipyard. In 1926, St. Andrews, Millville, and Panama City were consolidated, merging the Downtown Marina, St. Andrew’s waterfront industries, and Millville’s shipyard into a successful economy.
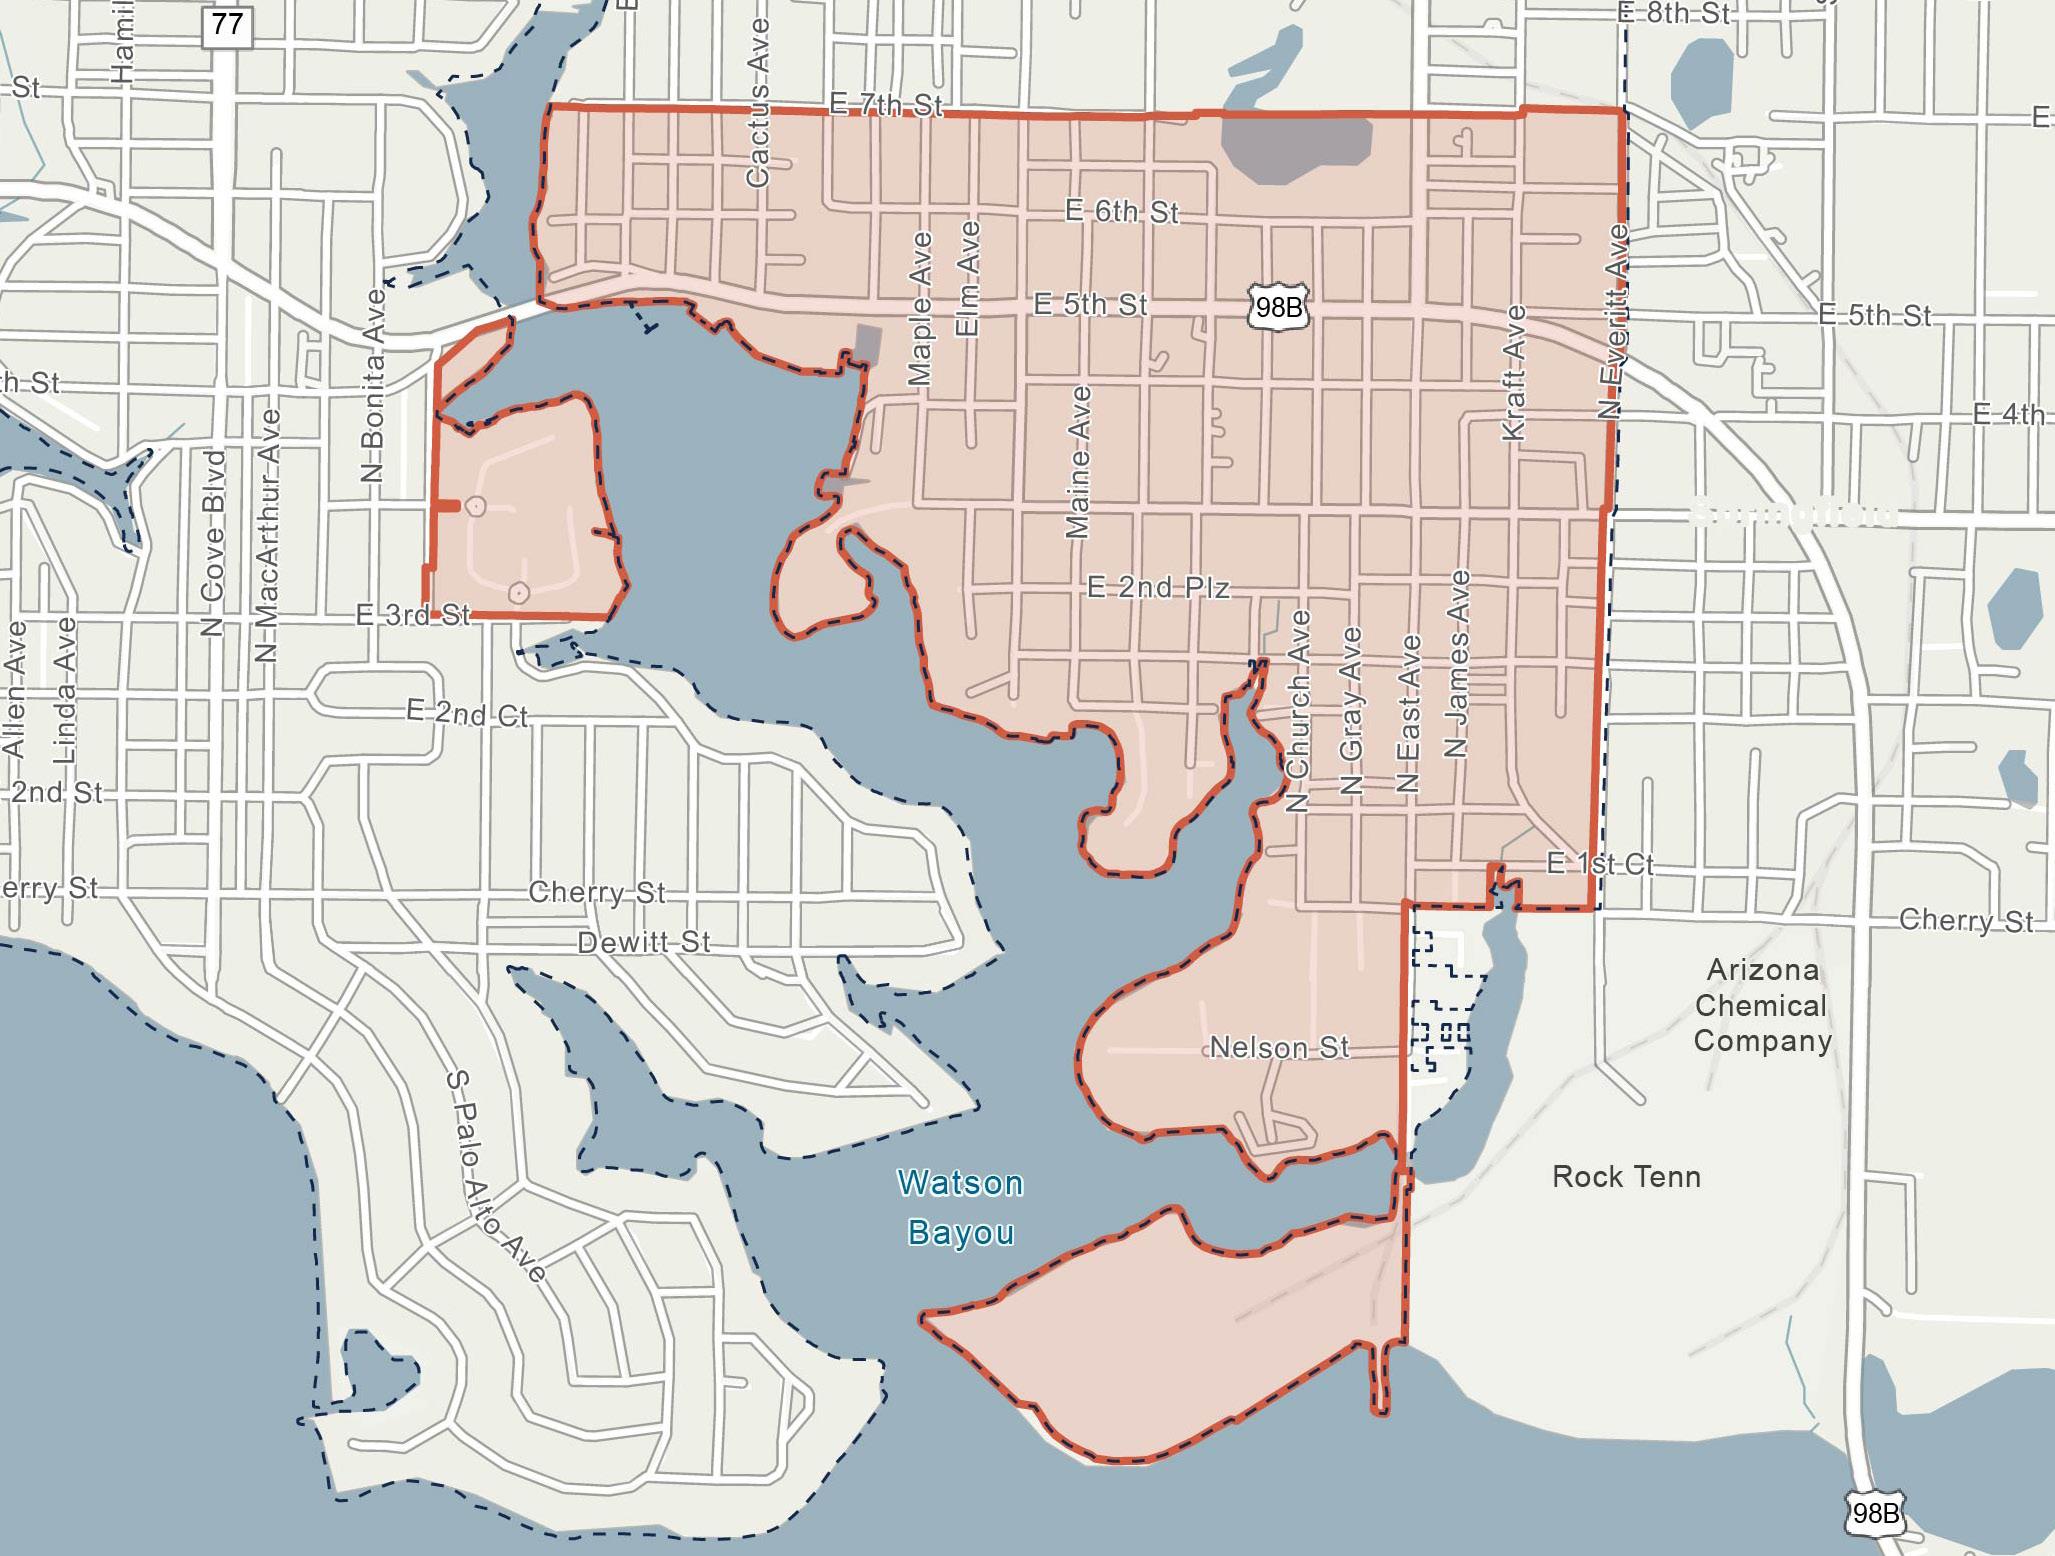
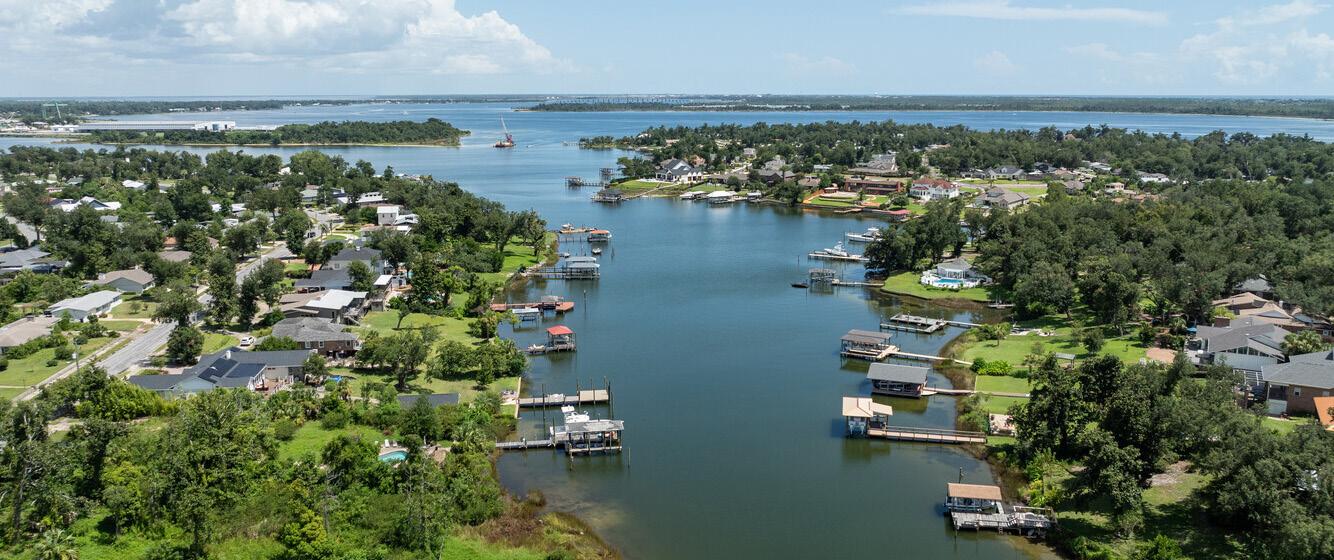
Despite its early history, Millville was the newest Redevelopment Area to be added by the Agency. In 2004, an FON study was initiated for the Millville neighborhood finding that the area was characterized by severe Slum and Blight across its neighborhoods, businesses, infrastructure, and waterways, resulting in the establishment of the Millville CRA. Subsequently, the Agency initiated the creation and adoption of the Millville CRA Redevelopment Plan in 2004 ("2004 Plan").
In 2009, to support its ongoing efforts to revitalize the Millville neighborhood, the City applied for acceptance to the Waterfronts Florida Partnership Program for an area located in the historic Millville community. Millville was accepted as a Waterfronts Florida Partnership Community in August 2009. The Millville CRA received technical and financial assistance during a 2‐year designation cycle and continued support as a graduate community from the Waterfronts Florida Partnership Program.
The City designated a program manager and appointed the Millville Community Alliance as the Waterfronts Florida Partnership Committee to oversee waterfront revitalization efforts.
The 2004 Plan has served as the primary guide for the Agency’s activities within the Millville CRA to-date.
In response to Hurricane Michael in 2018, the City produced the Neighborhood Plan, featuring a strategic vision of three neighborhoods within the City including Millville, as well as the Strategic Vision for Panama City’s Historic Downtown and its Waterfront Plan. These plans addressed issues of urban sprawl and recovery. The Neighborhood Plan highlighted the need for revitalization and reinvestment in the Glenwood, Millville, and St. Andrews areas. The plan aimed to address decline, enhance infrastructure, and support economic growth, making these areas more vibrant and resilient. The major priorities, objectives,
and goals outlined in both plans have served as crucial guidelines for the Millville CRA’s goals and objectives in this 2025 Plan, as detailed in the following pages.
Past Accomplishments
Since establishing the Millville CRA in 2004, the Agency has worked to establish and restore key areas in the community, such as the Watson Bayou Waterfront Park and Daffin Park, while also preserving the district’s historic attributes. The Agency has worked to obtain grants and investments to ensure a prosperous economic, residential, and recreational future.
Notable accomplishments within the Millville CRA related to the Agency’s past priorities and guiding principles include:
Safety and Security
▪ Initiated efforts to clear waterways in Watson Bayou of derelict vessels, which eliminated blight, removed navigation hazards, pollution sources, and potential crime and vagrant activity through the Derelict Vessel Initiative
MILLVILLE NEIGHBORHOOD IN PANAMA CITY | SOURCE HOMES.COM
Key and Vital Infrastructure
▪ Facilitated grants for commercial and residential places for replacements.
Economy
▪ Established a Waterfront Partnership which opened up new financial resources and technical grants within the Millville CRA.
Quality of Life
▪ Participated in multiple community engagement events, including community clean ups, Movie in the Park, and Christmas Parade to disseminate information about programs available with the Millville CRA.
▪ Added a community fishing pier to the design of Millville Waterfront Park to enhance the availability of community spaces.
Tax Base Trends and Estimates
The Millville CRA was established in 2004 with a base year taxable value of $42,398,300. Over the 10-year period from 2015 to 2024, total taxable value for all properties within the Millville CRA grew at a Compound Annual Growth Rate (“CAGR”) of 5.6%, experiencing a 72% increase in taxable value from $76,009,870 in 2015 to $130,657,110 in 2024.
Over the same 10-year period, annual Tax Increment Financing (“TIF”) revenue collections within the Millville CRA has grown at a CAGR of 12.2%. This represents a 216% increase, rising from $271,637 in 2015 collections to $858,255 in 2024. Since 2015, the total TIF revenues collected in the Millville CRA have amounted to about $4,113,700.
Table 7 below illustrates the 10-year historic collections in total taxable value and total tax increment, as well as the total annual TIF revenues generated by the Millville CRA, assuming a 95% contribution rate from both the City and County. The table also illustrates projected collections from 2025 through 2044, the Agency’s current operational sunset date, over 5-year increments.
This 2025 Plan estimates that the Millville CRA will generate approximately $35,126,800 in TIF revenue to the Agency’s Redevelopment Trust Fund from 2025 through 2044, the Agency’s
sunset date. This equates to approximately $1,756,340 in average annual increment over the 20-year projection period.
The TIF revenue may be used for projects and programming that address the goals, objectives, and strategies of this 2025 Plan. For further details on the TIF projections for the Millville CRA, please refer to Section 6, Financial Analysis of this document.
858,300 10-Year Historic Collections(4) $ 4,113,900
Est. $ 5,405,300
Est. $ 7,477,000 2035–2039 Est. $ 9,878,200 2040–2044 Est. $ 12,366,300 20-Year Collections Through Agency’s Sunset(5) $ 35,126,800
Source: Bay County Property Appraiser; Florida Department of Revenue (FDOR); GAI Consultants. Notes: (1) Reflects prior year Final taxable value in tax increment area according to FDOR. (2) Reflects the total taxable value within the increment area less the Millville CRA’s 2003 base year value of $42,398,300. (3) Assumes a 95% participation rate from both Panama City and Bay County. (4) Reflects historic 10-year total collections from 2015 to 2024. (5) Reflects projected 20-year collections from 2025 to 2044, the Agency’s sunset date—further detailed in Section 6, Financial Analysis.
MILLVILLE CRA MAP SERIES
Existing Land Use
Existing Land Use designations are classifications of property that describe the current use of the property. The Florida Administrative Code (“FAC”) requires Property Appraisers to classify each parcel of real property to indicate its use as determined for valuation purposes. This use is reflected in the Department of Revenue
(“DOR”) use codes applied to each real property on tax assessment rolls and depicts the existing use of the property.
The map below illustrates the Existing Land Use of parcels within the Millville CRA, with the legend detailing the distribution of total land acres by Existing Land Use designation (see Figure 24).
Within the Millville CRA’s approximately 681 total land acres, the predominant Existing Land Use designation is Residential, which comprises the largest share of total land area at 53.7%, followed by Governmental and Commercial with 18.4% and 13.4%, respectively, of this total share.
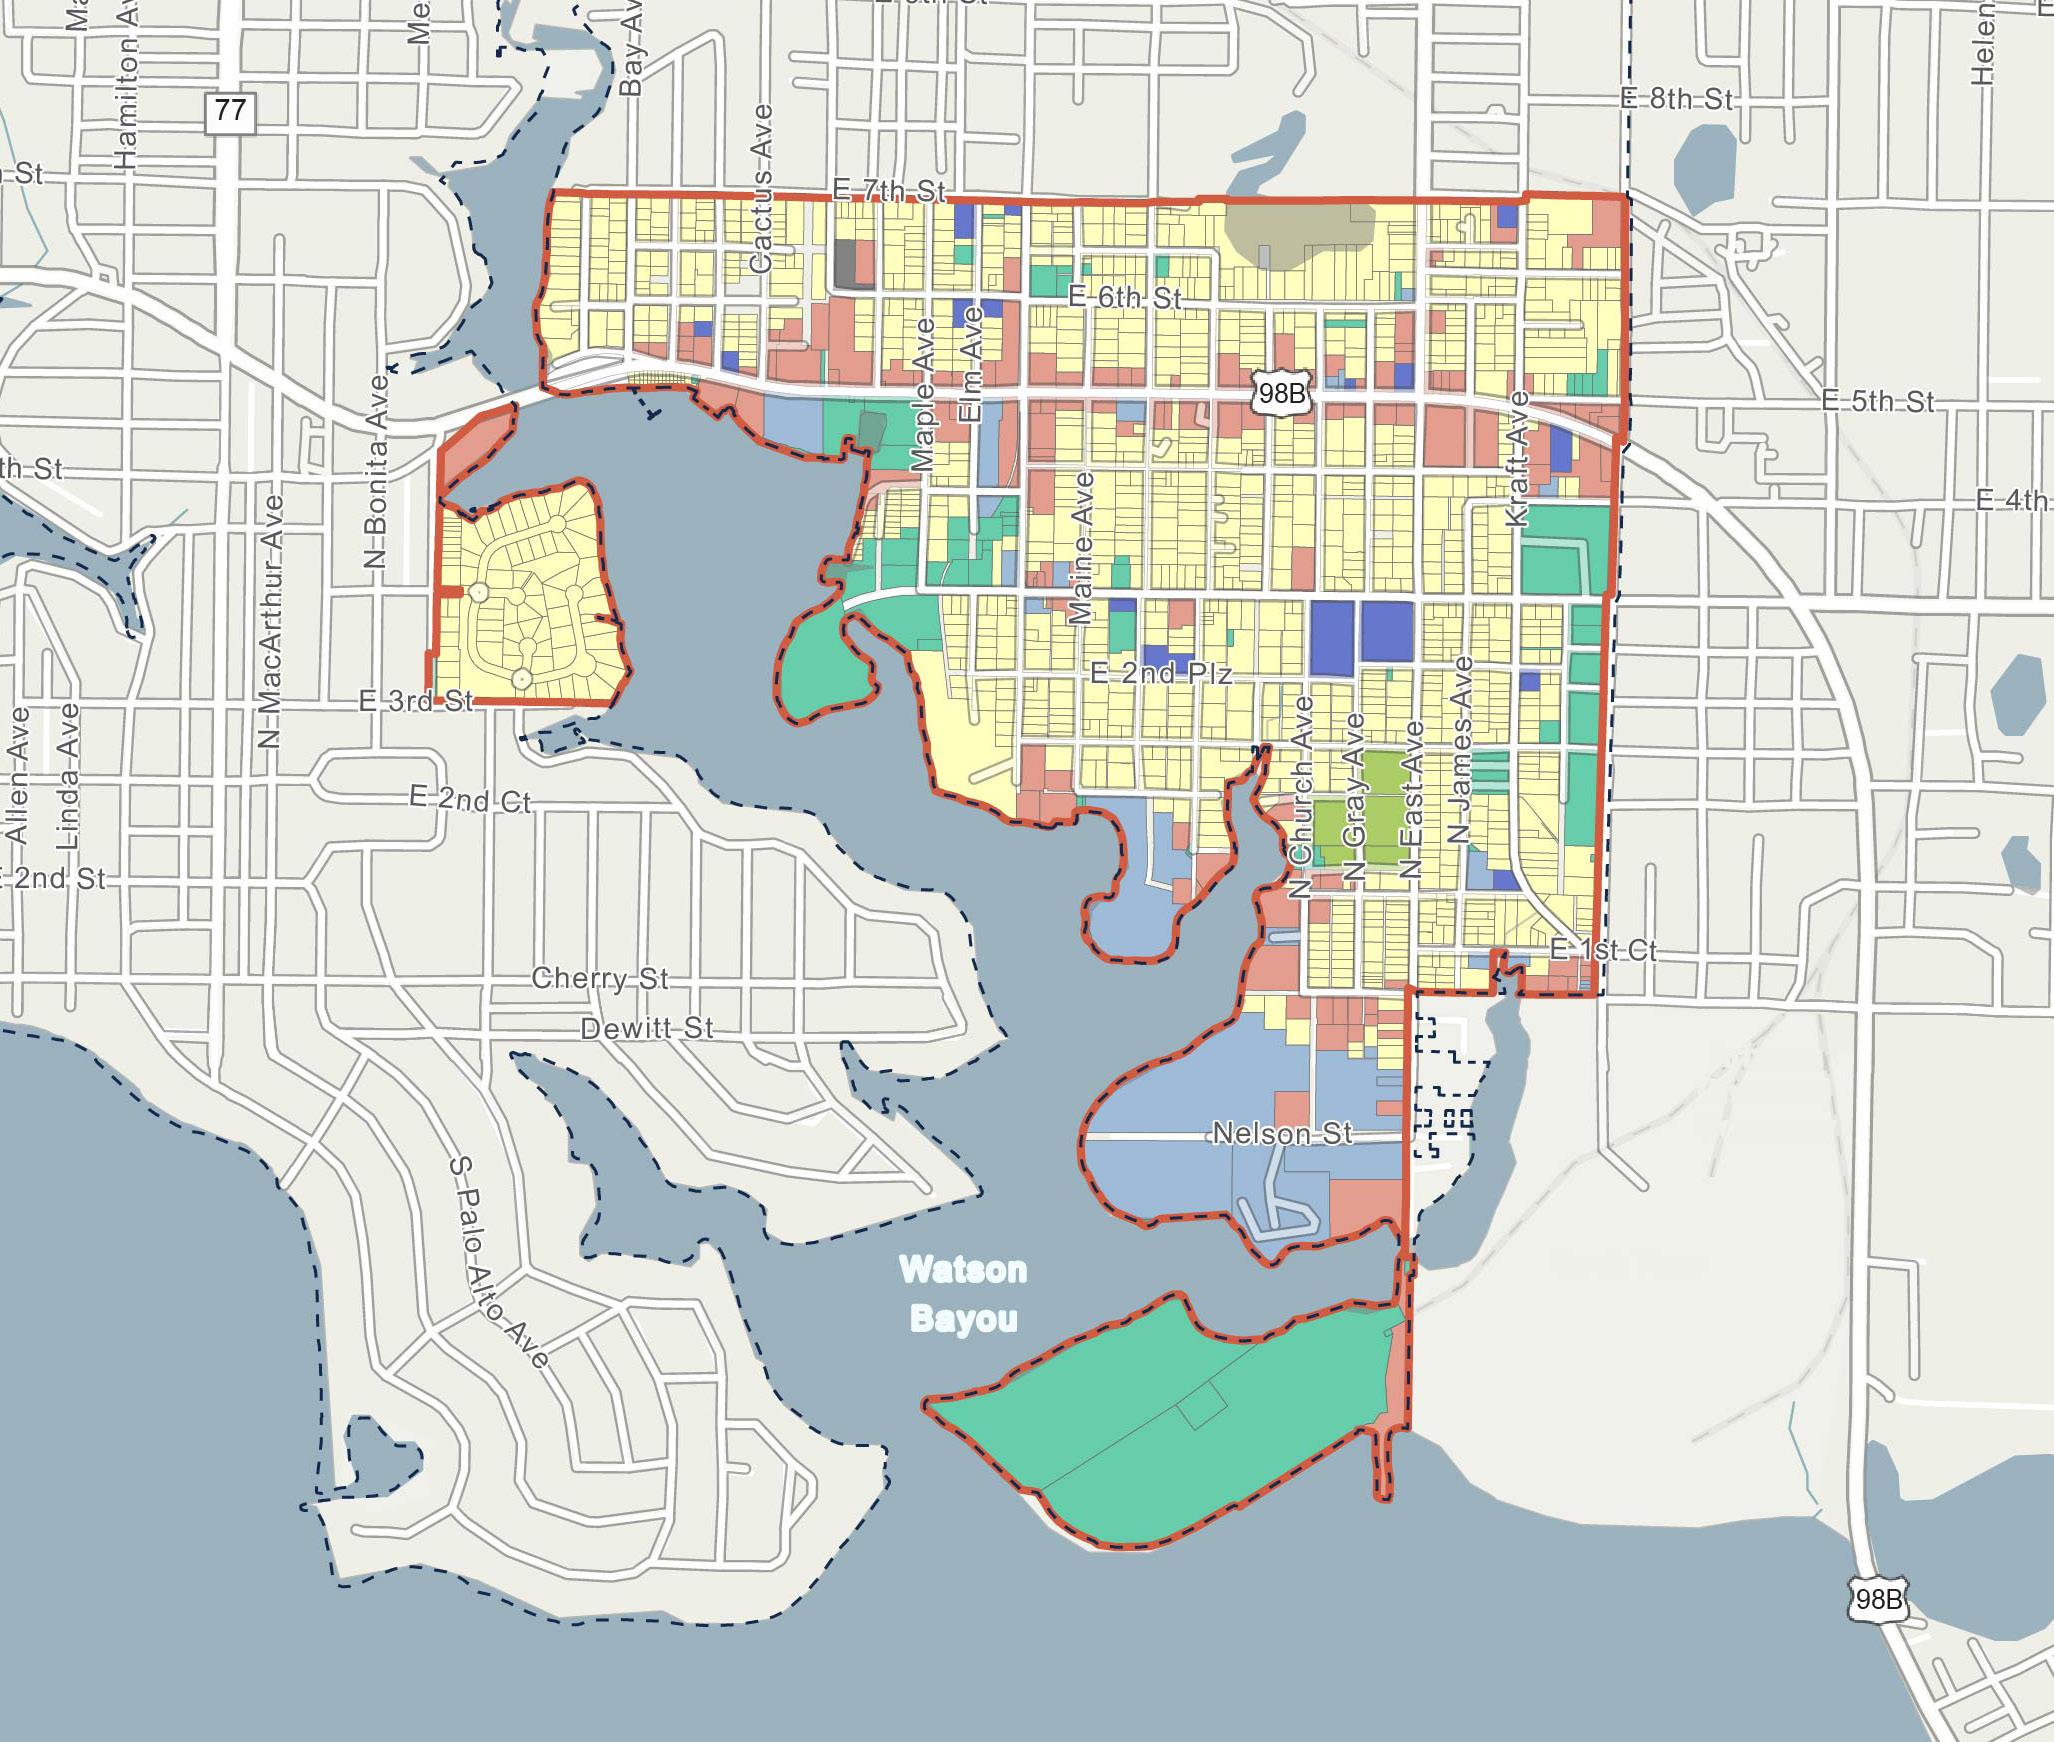
Figure 24. M illV ille
Future Land Use
Future Land Use designations are classifications of property that categorize permissible levels of intensity and/or density of development, in accordance with policies of the City’s Comprehensive Plan and the requirements of the City’s Land Development Regulations.
The map below illustrates the Future Land Use of parcels within the Millville CRA, with the legend detailing the distribution of total land acres by Future Land Use designation (see Figure 25).
Within the Millville CRA’s approximately 681 total land acres, the predominant Future
Land Use designation is the City Neighborhood Planning Area, which comprises the largest share of total land area at 69.9%, followed by Industry and Residential with 23.5% and 5.3%, respectively, of this total share. Legend
CRA 681 Acres
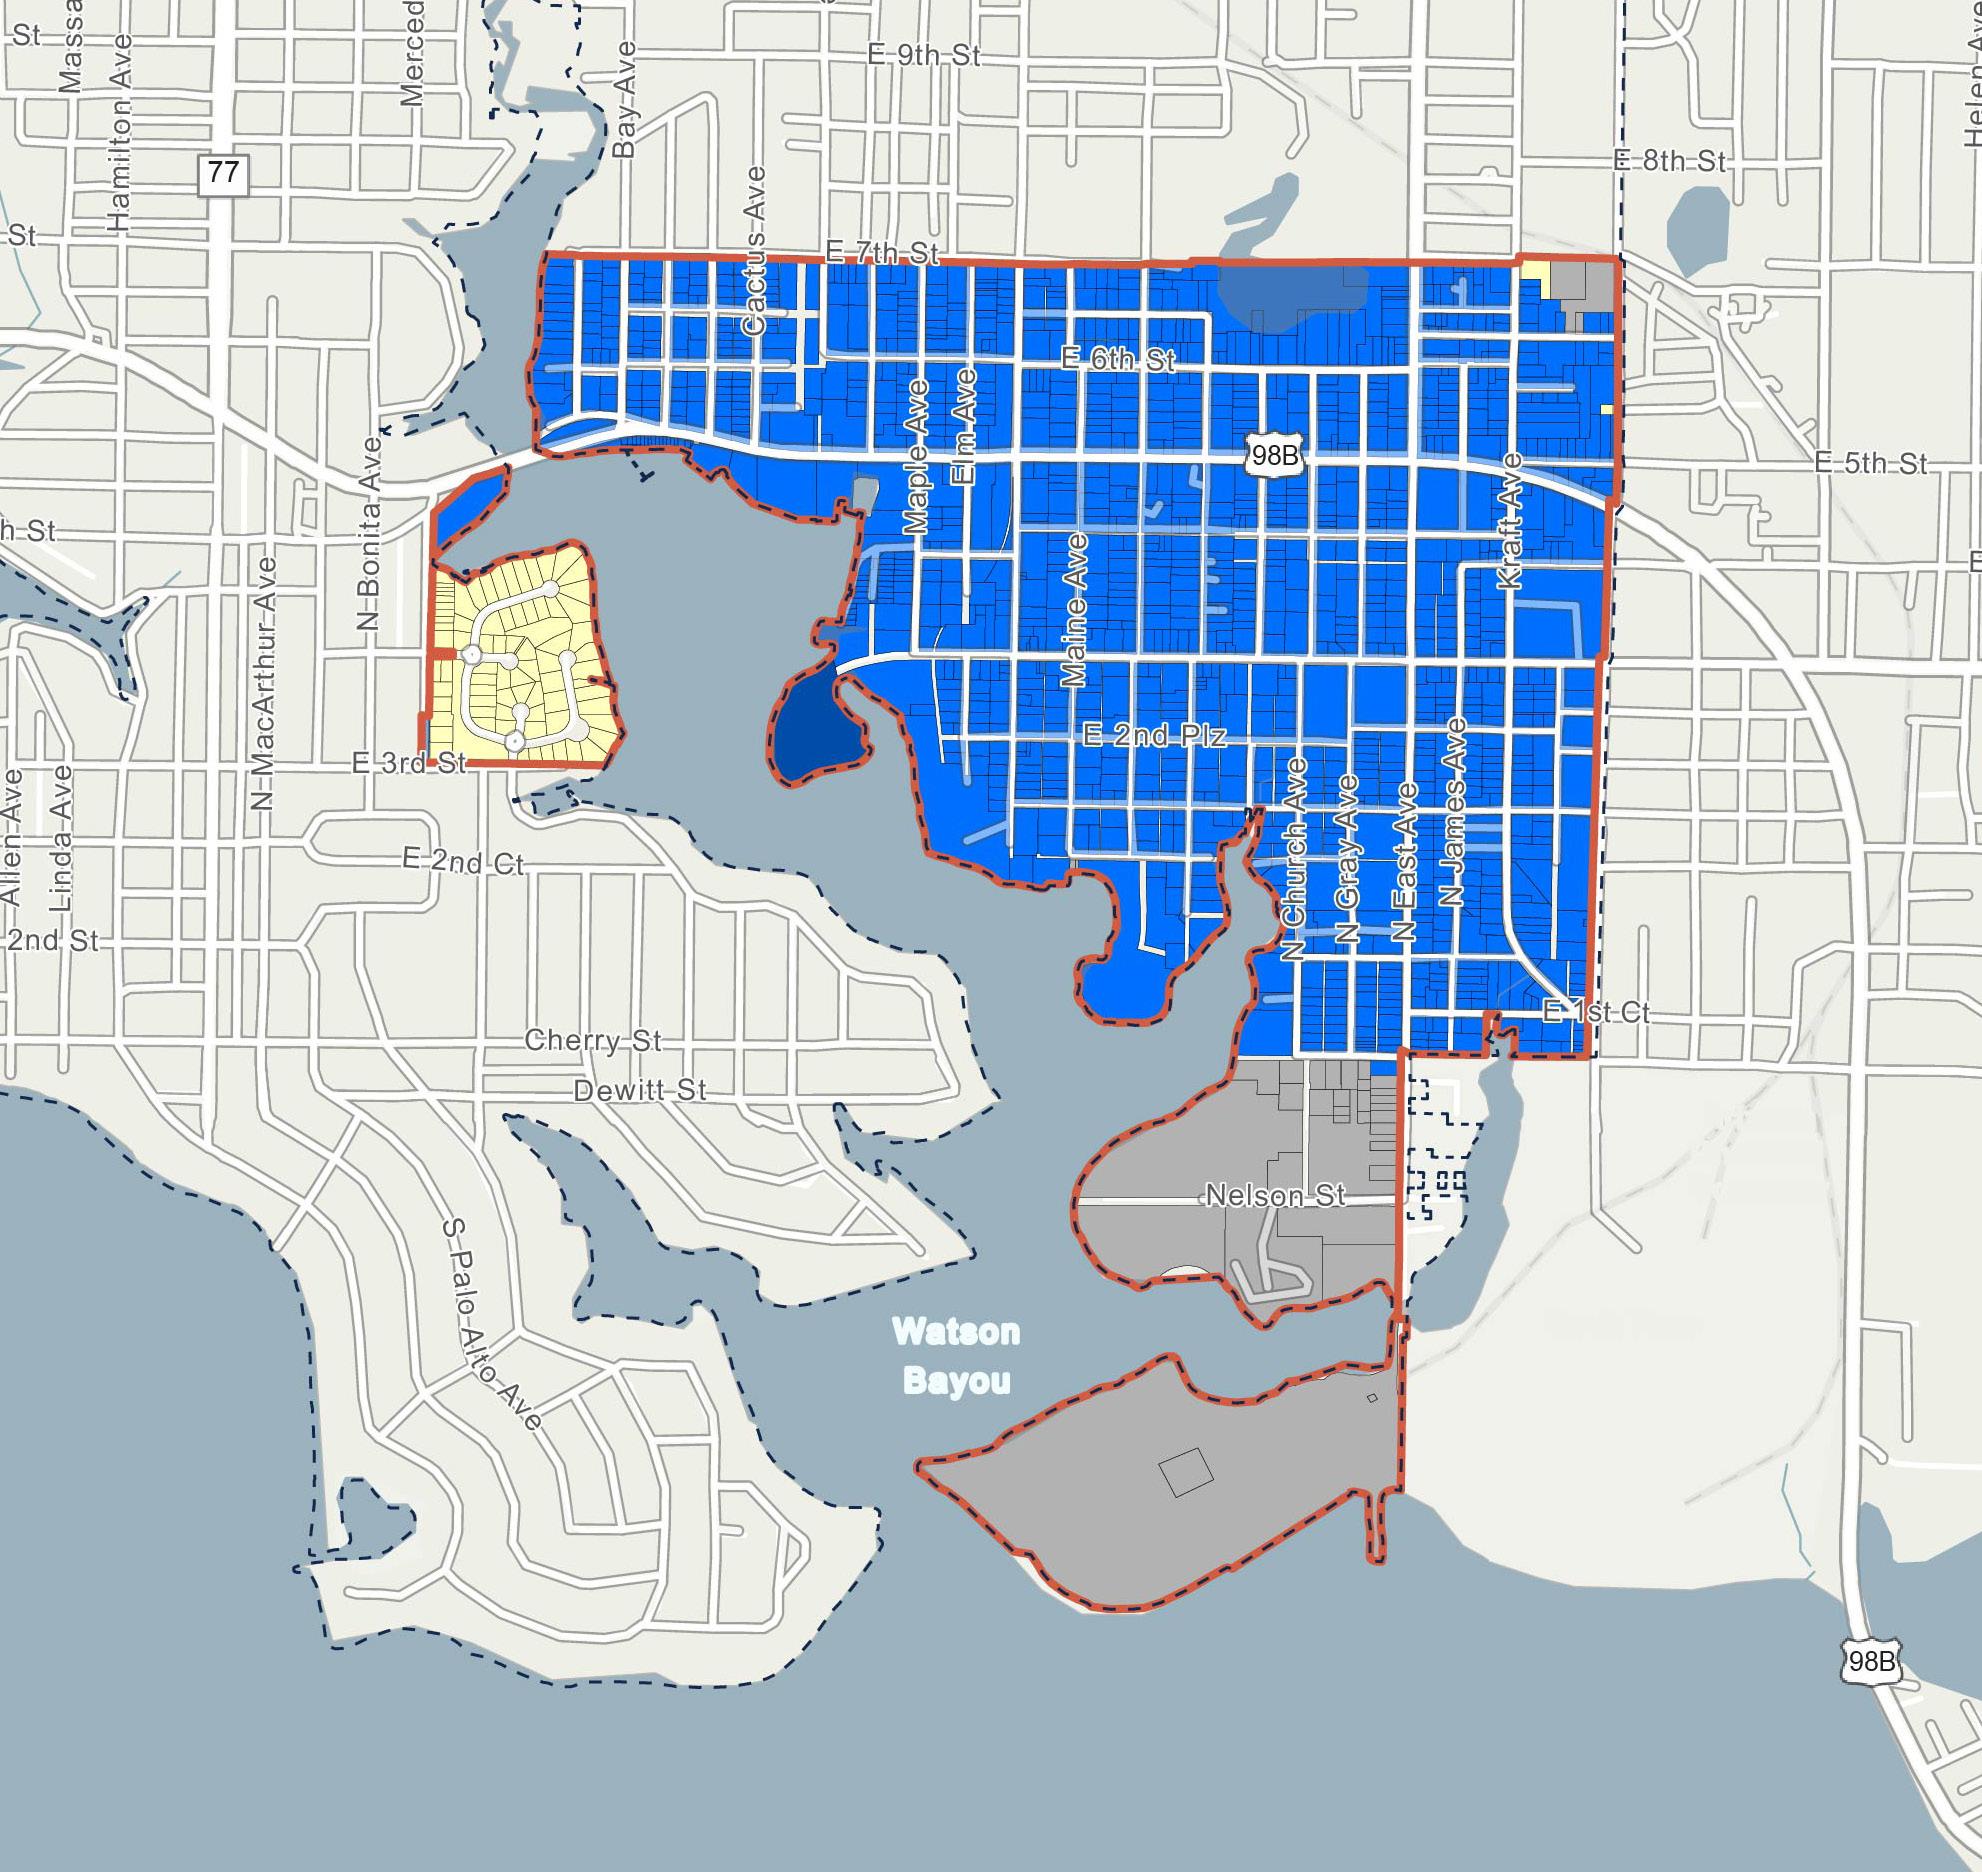
Figure 25. M illV ille C r A F u T ure l AND u S e MAP
Zoning Zoning classifications describe the permitted uses and development standards applicable to a specific property, in accordance with policies of both the City’s Comprehensive Plan and the requirements of the City’s Land Development Regulations.
The map below illustrates the different Zoning classifications of parcels within the Millville CRA, with the legend detailing the distribution of total land acres by Zoning classification (see Figure 26).
Within the Millville CRA’s approximately 681 total land
acres, the predominant Zoning classification is Neighborhood Residential, which comprises the largest share of total land area at 34.3%, followed by Neighborhood General and Heavy Industry with 30.6% and 20.3%, respectively, of this total share.
Legend
Panama City Municipal Boundaries
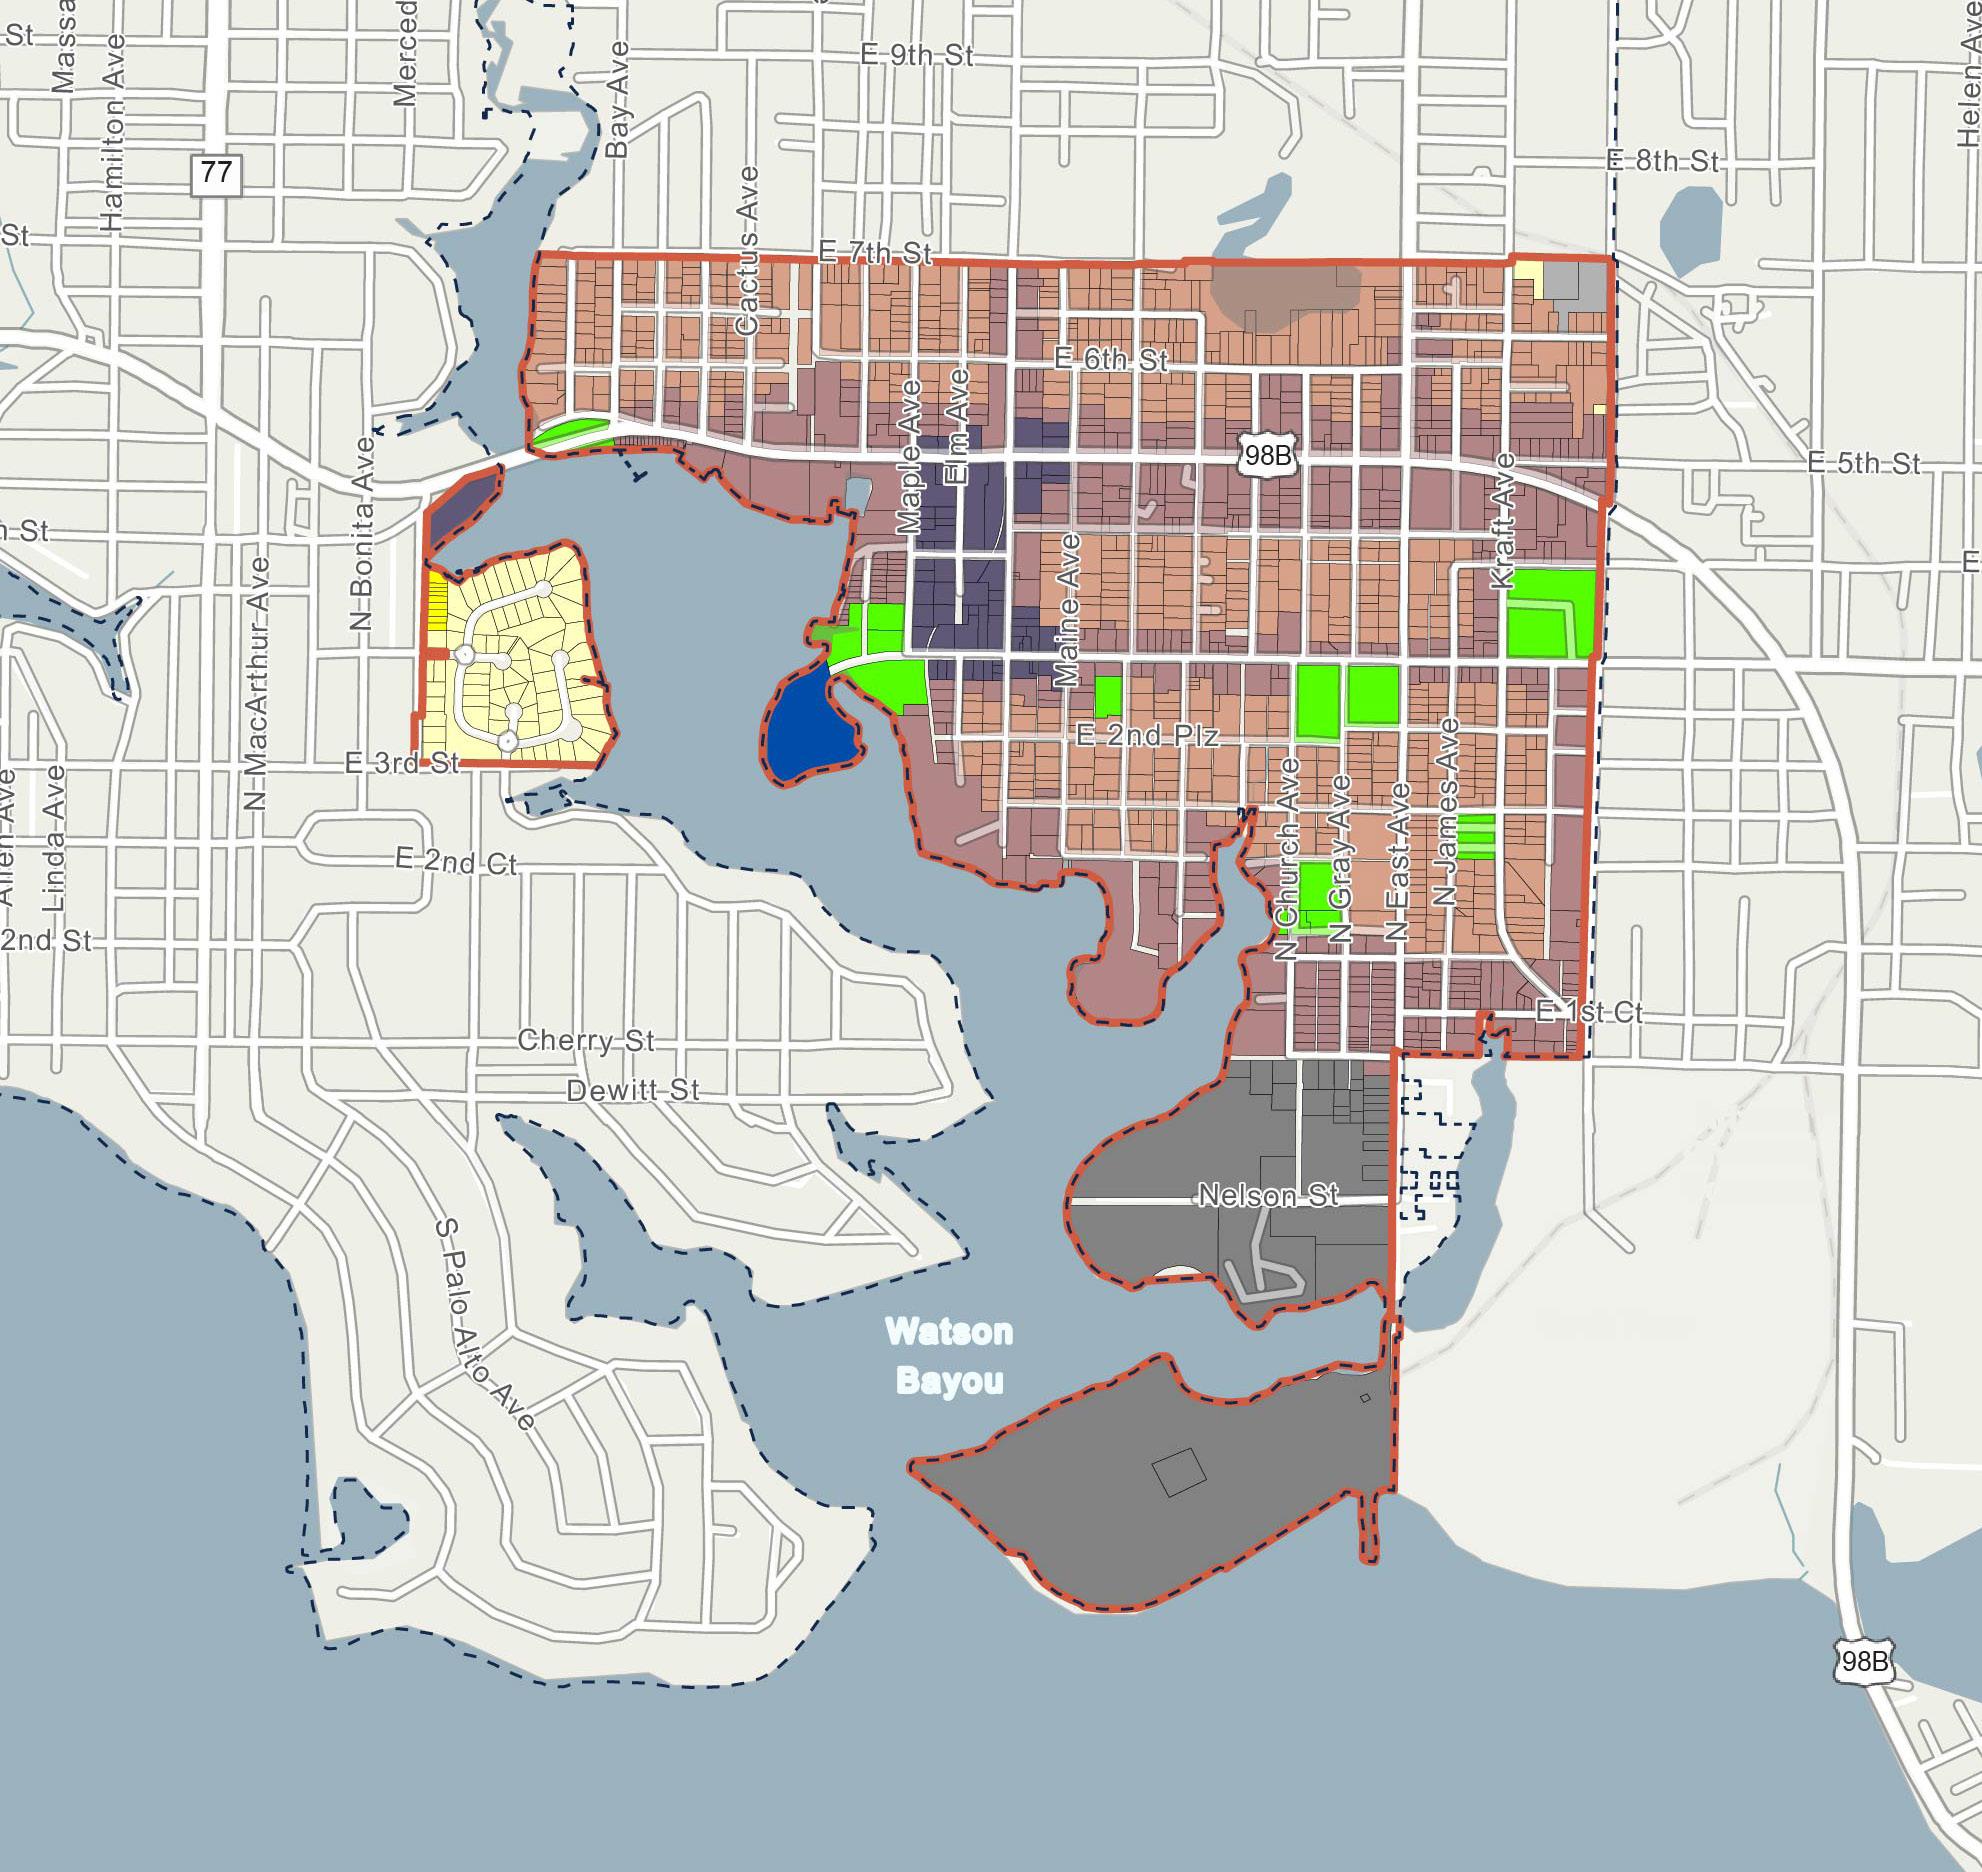
Figure 26. M illV ille C r A ZON i N g MAP
City-Owned Parcels
City-Owned parcels are those located within the Millville CRA that are owned by Panama City. These parcels may be utilized by the City and Agency to facilitate the implementation of redevelopment goals and strategies identified within this 2025 Plan.
The map below illustrates the City-Owned parcels within the Millville CRA, with the legend detailing the distribution of total land acres by DOR classification (see Figure 27).
There are approximately 53 City-Owned parcels within the Millville CRA, representing
3.6% of the total parcels in the area. Additionally, these 53 City-Owned parcels cover a total of 41.9 acres, which is approximately 6.2% of the total acreage within the Millville CRA.
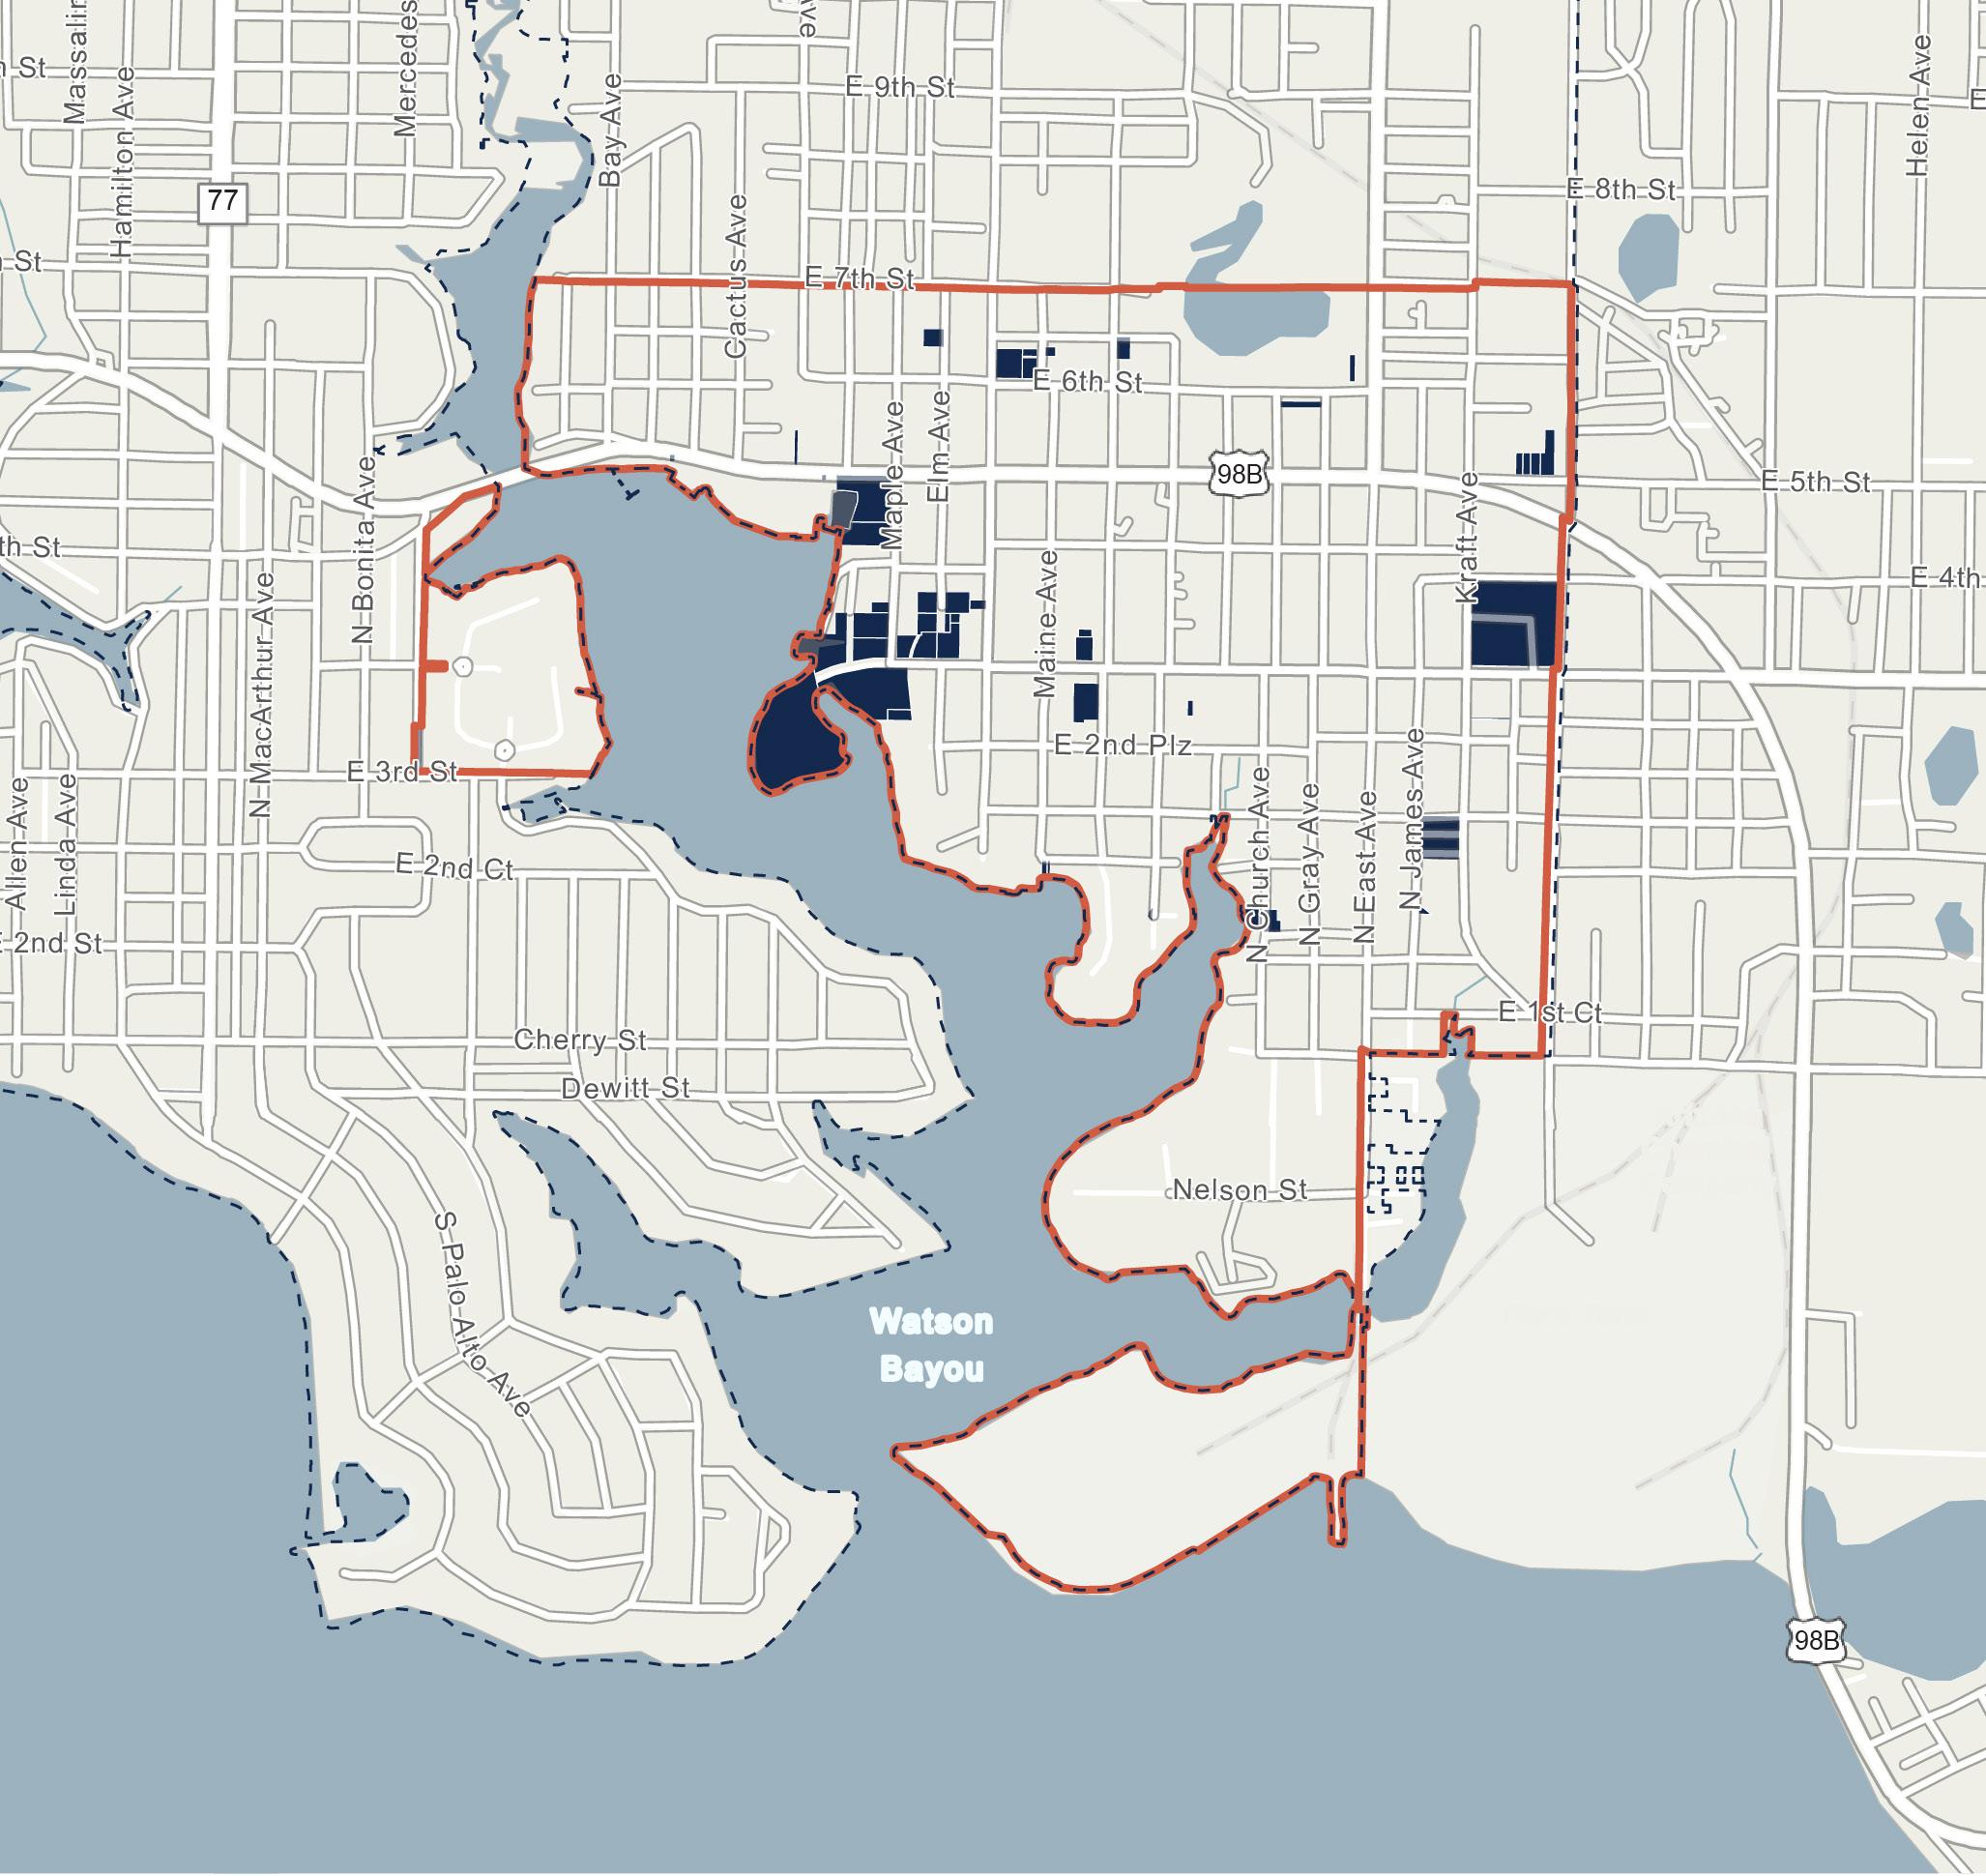
Figure 27. MILLVILLE CRA CITY-OWNED PROPERTIES MAP
Vacant Parcels
Vacant parcels are those within the Millville CRA that are undeveloped and/or do not have a built structure upon them. The four categories of vacant parcels within Panama City include: Vacant Residential, Vacant Commercial, Vacant Industrial, and Vacant Governmental,
representing redevelopment opportunities in their respective land use categories. To note, the Vacant Governmental parcels may be utilized by the City and Agency to facilitate the implementation of redevelopment goals and strategies identified in this 2025 Plan.
The map below illustrates the vacant parcels by DOR code within the Millville CRA, with the legend detailing the distribution of total land acres by vacant parcel classification (see Figure 28). The majority of vacant land within the Millville CRA is primarily Vacant Residential.
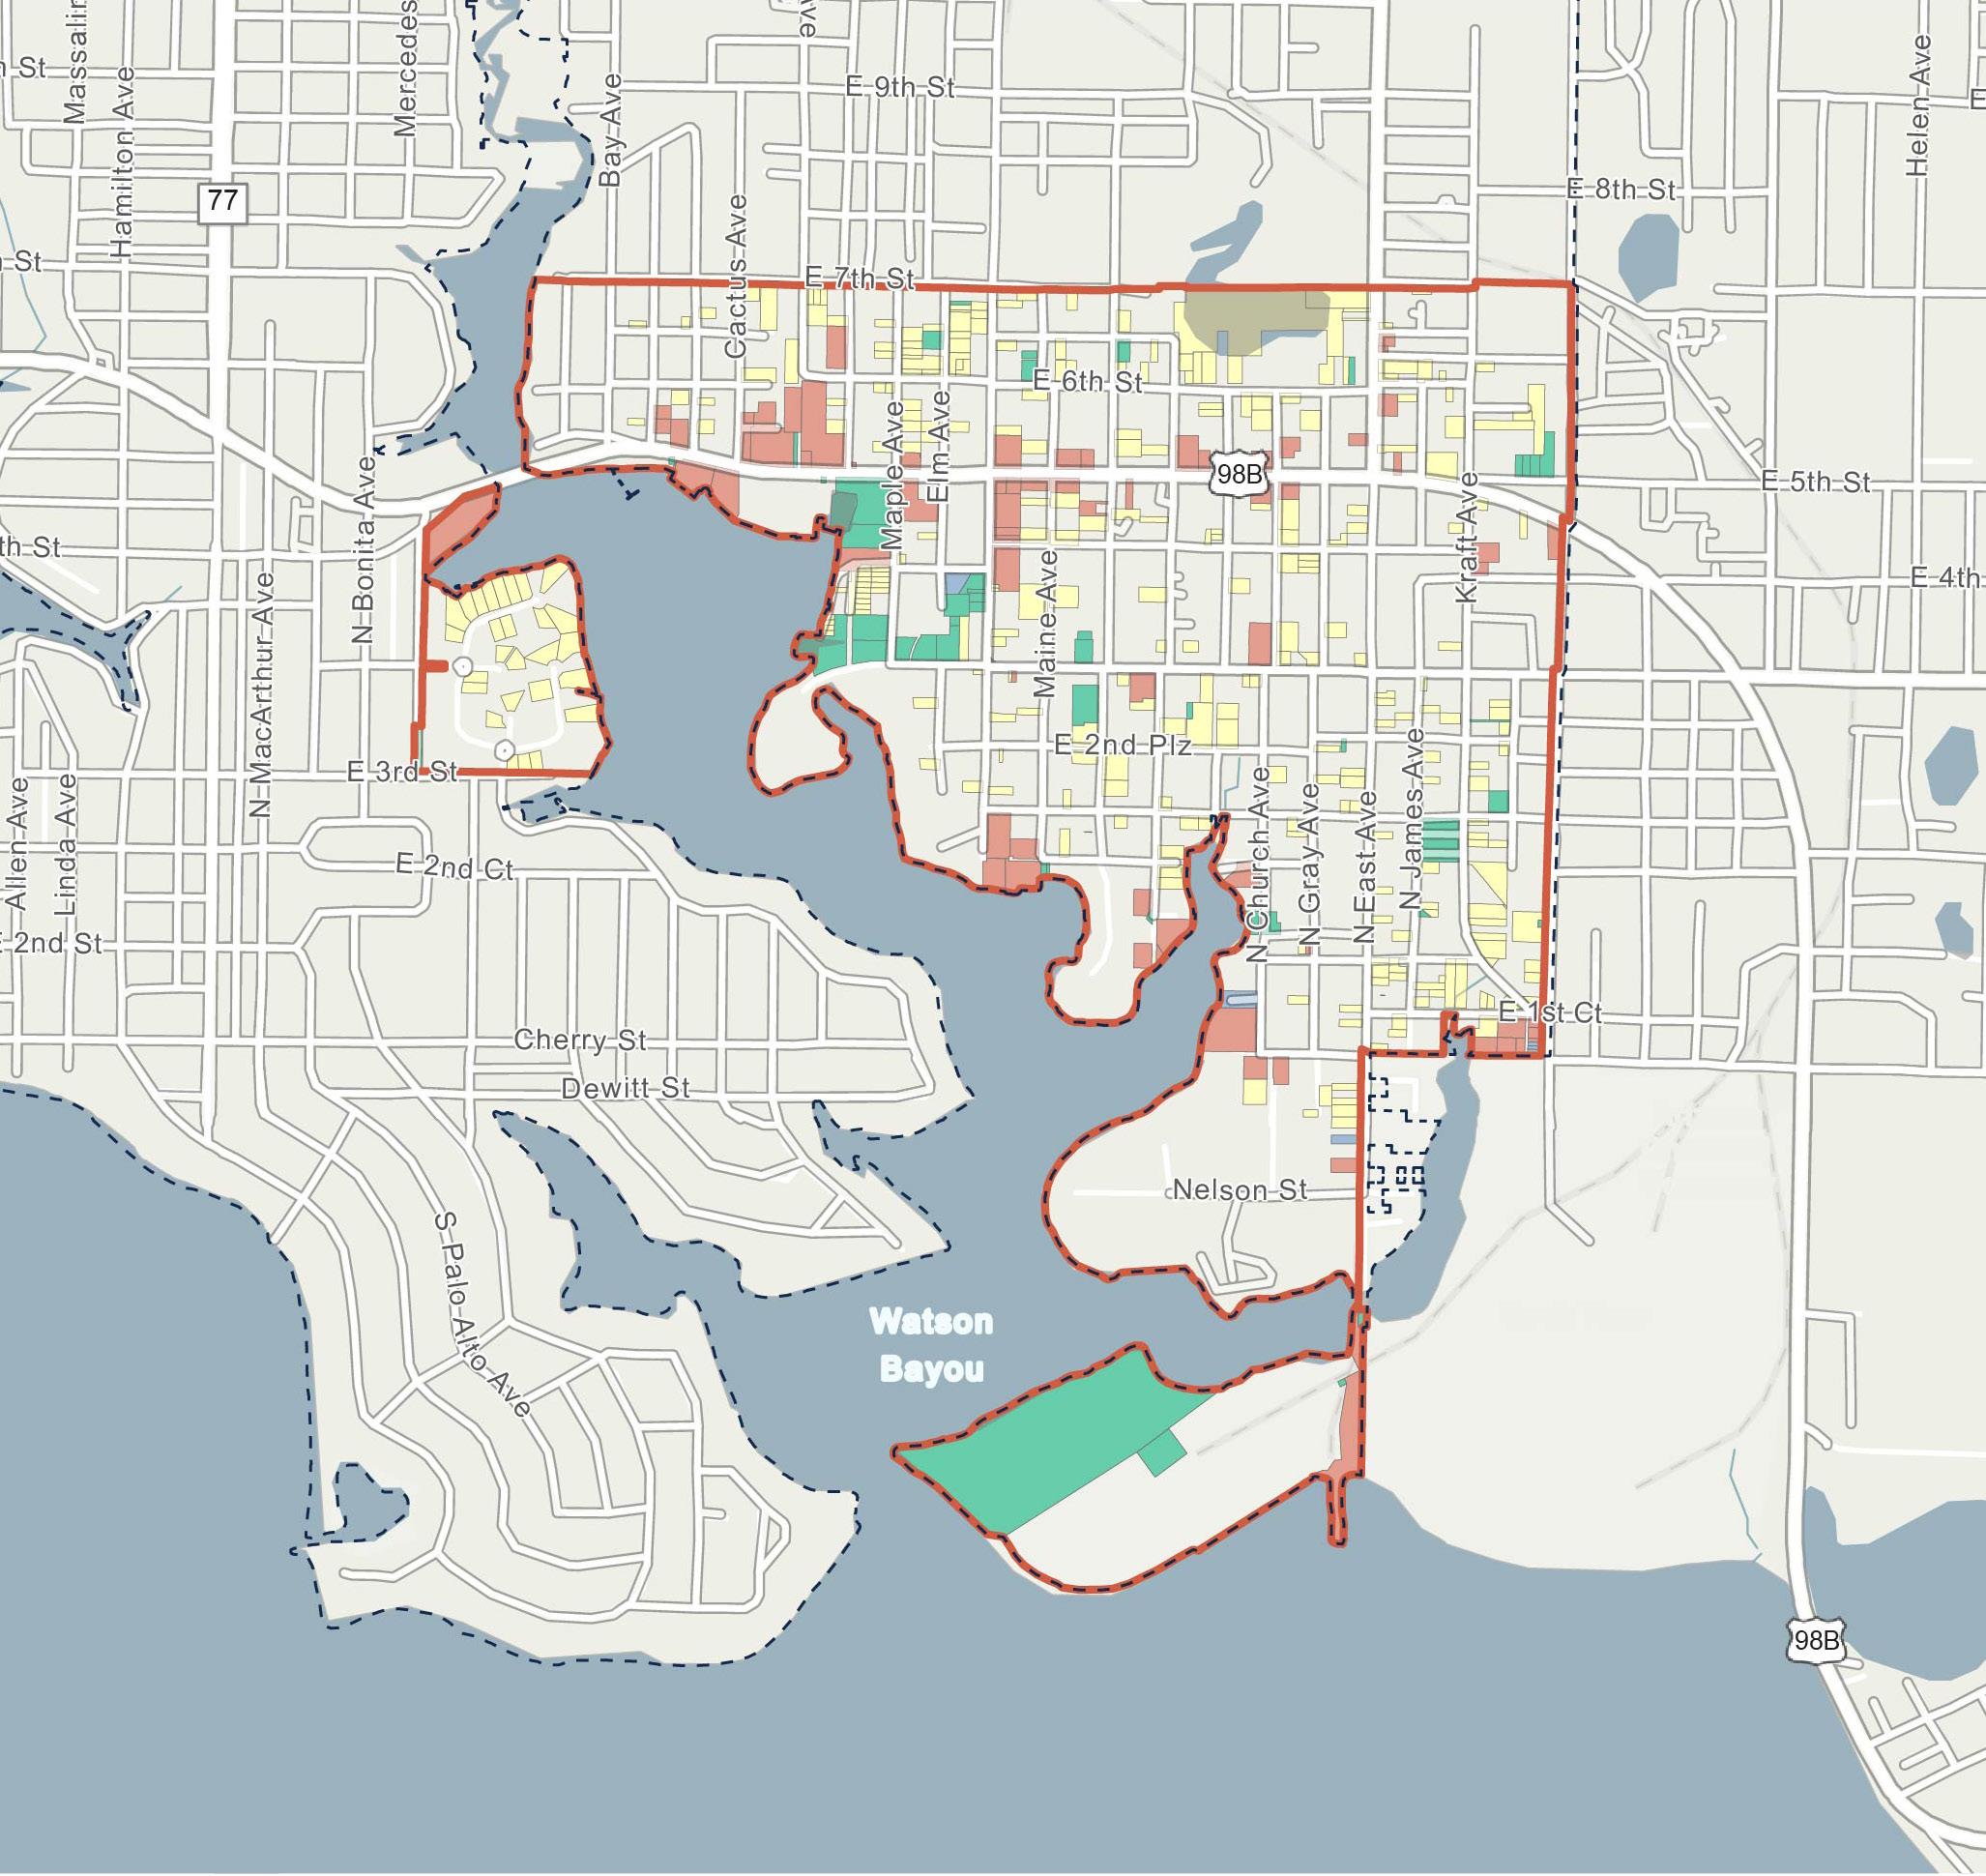
Figure 28. M illV ille C r A VACANT PA rC el S MAP
MARKET ASSESSMENT AND DEMOGRAPHIC PROFILE
Overview
There are many key market characteristics, along with demographic and socioeconomic indicators to consider when assessing the overall market supporting demand within the Millville CRA, these include:
▪ Market Performance
▪ Population
▪ Age Distribution
▪ Housing Characteristics
▪ Race and Ethnicity
▪ Academic Achievement
▪ Income Characteristics
▪ Employment and Business Activity
As of year-end 2024, the Millville CRA is home to a population of 2,280 persons—composing 6.7% of the total population within the City. The Millville CRA has a population density of 1,794 persons per square mile, with a median age of nearly 39 years old. Total population within the Millville CRA has experienced a negative CAGR of 0.6% since 2010: from a total population of 2,490 persons in 2010 to 2,280 persons in 2024.
There are approximately 1,080 total housing units within the Millville CRA—composing 6.5% of the total housing units within the City. Total housing units within the Millville CRA also experienced a negative CAGR since 2010 at 0.9%: from 1,230 housing units in 2010 to 1,080 housing units in 2024. Of the 1,080 housing units within the Millville CRA as of yearend 2024, approximately 54% are owner-occupied with the remaining 46% renter-occupied units. As of year-end 2024, the housing unit vacancy rate within the Millville CRA is 18%.
In addition, approximately 58% of the total population within the Millville CRA make up the working-class population, typically defined as persons between the ages of 20 and 64. Over 85% of the total population within the Millville CRA have obtained their high school diploma or greater, with nearly 13% obtaining a bachelors’ degree or a more professional/ graduate degree.
Population within the Millville CRA is predominately White at 48%, closely followed by Black/ African-American with 37%; approximately 9.1% of the population identify as Hispanic ethnicity, as of year-end 2024.
The Millville CRA is also home to approximately 670 total employees and 96 businesses as of year-end 2024. Total employment within the Millville CRA composes 1.9% of the total employment within the City. Total employment within the Millville CRA has experienced a positive CAGR of 4.8% since 2010: from 330 total employees in 2010 to 670 total employees in 2024.
As of year-end 2024, the major industry sectors, dominating the employment market within the Millville CRA include educational
services, construction, and other services—combined, these industries compose approximately 49% of the total Millville CRA employees. In addition, the unemployment rate within the Millville CRA at 6.6% is greater than that of the City at 5.1%, as of year-end 2024.
As of year-end 2024, the Millville CRA is made up of approximately 627,090 square feet (“SF”) of combined commercial uses (i.e., office, retail, and industrial/flex)— composing 3.9% of the City’s combined commercial space. In addition, the Millville CRA contains approximately 140 forrent multi-family residential units, composing 2.2% of the City’s for-rent residential market. The Millville CRA contains zero hotel rooms as of year-end 2024. The table below illustrates the yearend 2024 market characteristics for the Millville CRA’s commercial, for-rent residential, and hotel market(s); see Table 8
The graphs and figures on the following page illustrate the year-end 2024 demographic and socio-economic characteristics of the Millville CRA.
Source: CoStar Group, Year-End 2024. Note: The Millville CRA contains zero hotel rooms as of year-end 2024. (1) Average Rental Rate
Millville CRA Demographic and Socio-Economic Characteristics
2,280
POPULATION in the Millville CRA
Total population comprises 6.7% of the total population within Panama City.

1,080 HOUSING UNITS in the Millville CRA
The total housing units within the Millville CRA make up approximately 6.4% of the total housing units within Panama City.
EDUCATION

16% No High School Diploma
60% High School Diploma/GED 13% Associates Degree 13% Bachelor’s Degree+
670
EMPLOYEES in the Millville CRA
Represents an employee to population ratio of 0.3 persons per job, and comprises 1.9% of the total employees within Panama City.

UNEMPLOYMENT RATE INFLOW/ OUTFLOW(1)
1,254 Employed in the Area and Live Outside 929 Sources: U.S.
Live in the Area, Employed Outside
30 Employed and Living in the Area
INCOME CHARACTERISTICS
$262,214 Average Home Value
$22,174 Per Capita Income
$35,589 Median Disposable Income
$39,812 Median Household Income

Capture of Total Population
GOALS, OBJECTIVES, AND ACTION STRATEGIES
As a part of the 2025 Plan, major goals, objectives, and action strategies were identified specifically for the Millville CRA. The action strategies for achieving each objective are outlined beneath their respective objectives below.
The Agency’s major goals in this 2025 Plan include creating:
2. Expand Housing Opportunities
1. Support Economic Growth, Job Creation, and Small Business Development
3. Improve Infrastructure, Mobility and Connectivity
4. Enhance Public Safety
5. Activate and Improve the Waterfront
6. Enhance Open Spaces, Recreation and Community Facilities

7. Promote Cultural Identity and History
8. Advance Sustainability and Resilience
These major goals, objectives, and action strategies guide the Agency in evaluating projects and programs for potential implementation to address the opportunities and challenges facing the Millville CRA.
Support Economic Growth, Job Creation, and Small Business Development
To support economic growth, job creation and small business development, the objectives and strategies listed are intended to support the Millville CRA's current businesses, residents, and employees by investing and enhancing residential and commercial spaces.
Objective 1: Formulate economic development strategies that provide Millville CRA residents with access to employment opportunities.
▪ Partner with educational institutions and training providers to support workforce development.
▪ Acquire or receive strategic properties, including vacant buildings, to support redevelopment, entrepreneurship and job creation.
▪ Develop projects when necessary to catalyze investment, fill gaps, or address community needs.
▪ Support technical assistance, workforce development and mentorship programs.
▪ Promote, support and grow small business development.
Objective 2: Devise planning strategies and develop an effective regulatory framework to ensure well-managed growth throughout the neighborhood while accomplishing redevelopment program directives.
▪ Evaluate the City’s Comprehensive Plan to determine and correct inconsistencies in policies related to the Millville CRA, while embracing the following planning principles:
▪ Establish a land use pattern that reflects the City as a total community of diversified interests and activities, while promoting compatibility and harmonious land-use relationships.
▪ Encourage mixed-use development at an appropriate scale.
▪ Introduce multi-family development, strengthening the local market for retail and services.
▪ Create programs for land development and property rehabilitation, using financial or other economic incentives to facilitate new investment in the Millville CRA, thereby increasing the tax base.
▪ Formulate policies and procedures for developer solicitation and development agreements.
Objective 3: Focus efforts on a portion of the neighborhood to achieve the greatest overall aesthetic change and set standards that trigger reinvestment in the surrounding Millville CRA residential areas.
▪ Work with the community, City Staff, and City Commission to revise the Land Development Code and the City's regulatory policies to encourage zoning and land-use categories that will assist in diversifying its tax base and provide housing opportunities for all income levels, and include a high degree of design and development standards for new construction and rehabilitation.
▪ Contact property owners to determine their level of
interest on participating in the project.
▪ Prepare guidelines, procedures, and specifications framework to be undertaken for the project.
▪ Utilize City workforce to provide services.
▪ Consider implementation of Amnesty Program that can be used Agency in collaboration with the by the City to reimburse citizens for cleanup of commercial, industrial and residential private property.
Objective 4: Establish the Historic Neighborhood Commercial District as a place for local community businesses.
▪ Ensure that new development in the Historic Neighborhood Commercial District consists of appropriate land uses that will stabilize and enhance the area while representing area residents' and property owners' desires and interests.
▪ Stimulate local businesses by attracting an appropriate mix of uses in the Millville CRA and commercial district.
▪ Attract and encourage mixed-use, commercial, and economic development and redevelopment by attracting light industrial, marine, and eco-tourism uses.
▪ Revitalize Millville’s historic commercial corridors.
▪ Devise strategies including land assembly and other means of participating in land development to partner with the private sector in initiating development activity at appropriate locations in the Town Center area.
▪ Work closely with area Businesses, merchants’
associations, and the Bay County Chamber of Commerce to address the needs of existing Businesses through the redevelopment process.
▪ Collaborate with City to revise development codes to enable a desired mix of uses with appropriate design standards to establish a cohesive historic development pattern.
▪ Systematically conduct neighborhood-planning studies to determine issues and concerns of area residents.
Objective 5: Establish the administrative, financial, and programmatic mechanisms necessary to achieve the goals and objectives of current and future plans.
▪ Work with the City Manager and Finance Director to strategically devise annual operating and capital improvements budgets to maximize the use of anticipated TIF revenues.
▪ Ensure future annual budgets address the need to provide funding for ongoing staff support, requisite planning studies, operations, and maintenance for Agency activities.
▪ Increase the tax base to generate additional revenue for capital improvements through successful implementation of projects and programs.
▪ Work with the Bay County Property Appraiser to ensure updated property valuations are consistent with valuation assessments in neighboring communities.
▪ Provide targeted incentives
such as TIF, grants, and fee waivers to stimulate improvements or private investment.
▪ Continue to oversee the planning process and develop the appropriate strategies and policies.
▪ Institute creative measures, such as subdivision regulations to secure land for parks, trails, and open spaces.
▪ Seek short-term interim project financing with anticipation of long-term bond financing based on revenue projections.
▪ Provide public information concerning all aspects of the Millville CRA such as newsletters, as well as neighborhood and civic organization meetings to generate public support.
▪ Plan for neighborhood parks and strategically utilize TIF revenues and grant sources.
▪ Work with the City to prepare a Waterfront, Parks, Trails, Recreation and Open Space Master Plan to identify existing recreational assets and needs while devising an implementation program that includes:
– Operations and management analysis; – Maintenance requirements;
– Capital improvements programming; and – Budget recommendations.
▪ Identify potential revenues including TIF revenues, grants, impact fees and other assessments to provide adequate funding for proposed improvements and maintenance of public facilities.

Expand Housing Options
To expand housing opportunities, the objectives and strategies listed are intended to support mixed-use housing opportunities and encourage adaptive reuse of land to support the Millville CRA's residents.
Objective 1: Increase homeownership opportunities and education.
▪ Support infill single-family and duplex housing.
▪ Incentivize mixed-income development in priority areas.
▪ Provide relocation assistance to residents and businesses

displaced by redevelopment projects, ensuring equitable transitions and minimizing hardship during community transformation.
Objective 2: Redevelop vacant and boarded properties to encourage adaptive reuse, infill development, and to improve
Improve Infrastructure, Mobility, and Connectivity
the investment image of the community.
▪ Accept or purchase land to advance housing goals.
▪ Address vacant lots with targeted residential reuse.
To improve infrastructure, mobility, and connectivity, the objectives and strategies listed are intended to support the Millville CRA's neighborhoods by providing necessary infrastructure and transportation improvements.
Objective 1: Create a safe and efficient traffic circulation system that ensures all modes of transportation have adequate access to activity centers.
▪ Improve regional connectivity through upgraded public transit, complete streets, and expanded pedestrian and bicycle networks.
▪ Minimize the impacts of increased traffic and activity levels on residential areas.
▪ Create a safe, secure, and efficient pedestrian system linking all major activity centers, parking facilities, and other interchange points.
▪ Construct sidewalks, bikeways, and trails, designed to be separated from auto circulation to improve safety within the Millville CRA.
▪ Enhance the architectural character of the Millville CRA by softening the appearance of commercial areas and providing visual continuity
through tree planting and other landscaping elements along the visible transportation routes.
Objective 2: Focus on short-term improvements.
▪ Paint a narrower curb radius of 15 feet at appropriate intersections to slow traffic.
▪ Add crosswalks to connect the Millville CRA to the waterfront park.
Objective 3: Plan and continuously work to implement long-term improvements.
▪ Support upgrading and modernizing roads, stormwater systems, and utility infrastructure.
– Integrate smart infrastructure and emerging technologies— such as broadband/fiber networks, EV charging stations, and real-time transit systems—into projects funded by the
CRA to improve longterm functionality and competitiveness.
▪ Implement complete streets with lighting, sidewalks, and bike lanes.
▪ Rebuild sidewalks where needed and create a permanent smaller curb radius in appropriate locations.
▪ Raise intersection to be flush with the sidewalk to improve safety and walkability, reduce traffic speed, and enhance the street appearance of the Millville CRA
▪ Consider continuous streetscape improvements for: U.S. Hwy. 98; Sherman Ave; East Ave; 3rd Street; and Everitt Avenue.
Objective 4: Reflect 3rd Street as a main street with comfortable walking conditions, shaded trees, and an improved appearance.
▪ Connect waterfront, the Millville CRA, Daffin Park, and
residences with streetscape enhancements.
▪ Replace some on-street parking areas with planting, and widen sidewalks, separating them from vehicles with street trees once overhead power lines are relocated.
▪ Implement sharrows on roadways to allow bicyclists to share the road.
Objective 5: Design East Avenue to accommodate multiple modes of mobility as the primary north-south route connecting the Millville CRA with regional connections.
▪ Redesign to balance industrial access needs with homes and schools.
▪ Implement the following recommendations along East Avenue:

▪ A three-lane cross-section with drive lane widths adjusted to 11 feet for both north and south bound lanes.
▪ A traffic calming “safety strip for the center with optional on-street parking is depicted adjacent to Margaret K. Lewis School.
▪ Parking lanes alternate with new planting areas.
▪ Evaluate an alternative north and south bound route for a 2-way bikeway facility as part of the East Avenue study.
Objective 6: Revitalize Business
U.S. Highway 98 and 5th Street.
▪ Improve safety at crossings; connect to the Millville CRA; improve overall aesthetic of development and redevelopment along main corridors.
Enhance Public Safety
▪ Implement suggested street redesign concepts, including:
– Include a 70-foot rightof-way and 54-foot curb-to-curb width to accommodate bike lanes, on-street parking, door swing buffer, and tree plantings;
– Reduce drive lanes to two lanes and adjust to 10-feet wide;
– On-street parking, plantings, and turn lanes alternate in the same 8-foot lane on either side of the street; and
– Include sidewalks to improve pedestrian connection.
To enhance public safety, the objectives and strategies listed are intended to support the Millville CRA's community and partners to ensure safe streets and provide safety initiatives.
Objective 1: Expand public safety programmatic efforts in the Downtown North CRA to provide a safe and secure environment for the residents.
▪ Support Crime Prevention Through Environmental Design (CPTED) principles into improvements and projects funded by the CRA.
▪ Partner with local law enforcement and community organizations to support proactive public safety initiatives and community policing efforts.
▪ Support programs and
facilities that reduce loitering, illegal dumping, and vandalism through strategic activation of underutilized spaces.
Objective 2: Secure and repair infrastructure to support safety initiatives.
▪ Improve lighting, visibility, and pedestrian infrastructure to enhance safety in public spaces.
▪ Encourage the redevelopment of blighted or abandoned properties that contribute to unsafe conditions.
▪ Install or improve security infrastructure (e.g., cameras, emergency call stations) in key public areas when appropriate.
▪ Promote safe, walkable, and accessible environments through streetscape improvements and trafficcalming measures.
▪ Implement rights-of-way and vacant properties maintenance program(s) surpassing City minimum maintenance standards in accordance with maintenance agreement between City and Agency.

Activate and Improve the Waterfront
To activate and improve the waterfront in the Millville CRA, the objective and strategies listed are in intended to encourage updating plans that support local businesses and create a thriving public space around the Watson Bayou and Snug Harbor.
Objective 1: Develop a balance between industrial, recreational, and natural restoration areas along the shoreline of the Millville CRA’s Waterfront.
▪ Expand Millville Waterfront Park with community amenities.
▪ Provide access to Watson Bayou for recreation and tourism.
▪ Acquire parcels necessary for access and improvements.
▪ Create and enhance public access to the waterfront through shoreline parks, launch points, trails, and nature-based infrastructure improvements.
– Improve southern area with a focus on the waterfront trail, naturalized edge, restored shoreline, and water viewing areas.
– Create a multi-use path along waterfront to connect Waterfront Park

to Snug Harbor, East 5th Street, Sherman Avenue, and Daffin Park.
▪ Integrate nature-based solutions for erosion and flooding.
▪ Restore natural bayou wetlands to improve stormwater management.
▪ Incorporate peninsula into the Waterfront Park, restore the shoreline, and add a trail and water viewing areas, when wastewater treatment plant is relocated.
▪ Discourage further industrial uses from accruing between residential areas and the waters edge.
▪ Improve the recreational assets along the waterfront and allow for development of other desirable water related uses.
▪ Encourage desirable waterfront development in the vicinity of the historic
neighborhood commercial district to give users dual access to the waterfront and the historic commercial center.
▪ Encourage innovation in land planning and site development techniques.
▪ Work with the City to establish performance standards to be used within the Millville CRA that will provide incentives and/ or bonuses for developer proposals that provide for creative design and amenities.
▪ Allow for green-space along the waters edge to tie the existing natural environments of the neighborhood into an ecosystem associated with the bayou.
▪ Buffer views of industrial activity and the sewage treatment plant from the opposite shoreline.
▪ Consider restoration of the natural environment.
Enhance Open Spaces, Recreation, and Community Facilities
To enhance open spaces, recreation, and community facilities, the objectives and strategies listed are intended to support the continuation of streetscape projects, while focusing on developing a comprehensive signage program and functional community spaces.
Objective 1: Provide recreational opportunities for the citizens of the Millville CRA’s neighborhoods, which are readily accessible and improve the quality of life for residents.
▪ Improve, develop and maintain recreation buildings, facilities and spaces.
▪ Provide safe connections to the Millville CRA’s primary activity centers including the waterfront, local schools and neighborhoods through sidewalks and bikeways.
▪ Develop neighborhood parks in historic residential areas as amenities to stimulate private investment.
▪ Establish parks, recreation, and beautification efforts to improve the character of the Millville CRA that will reflect a pleasant appealing atmosphere for working, shopping, and living.
▪ Maintain the integrity of the natural environment when developing property, especially when significant tree canopies or natural habitats can be integrated into the site design.
▪ Enhance park and public spaces, including:
– Daffin Park: Improve facilities to meet service levels and incorporate Boys and Girls Club.
– Bob George: Add desired active recreation amenities, additional parking, and kayak storage.
– C.M. “Kidd” Harris Park: Update amenities nearing the end of their life cycle and improve connection to 3rd Street.
– Whittington Park: Work with FDOT to make the park more welcoming as a gateway into the Millville CRA.
▪ Create a small pocket park on Redwood Avenue near East 8th Street to include gathering space and play areas.
▪ Preserve historic structures and 3rd Street Cemetery.
▪ Develop neighborhood green spaces and trail connectivity.
▪ Acquire or repurpose land for public recreation.
▪ Maintain and enhance CRA improvements and vacant properties to support safe, attractive, and functional public spaces.
Objective 2: Develop better partnerships and connections with school facilities to increase youth recreational opportunities and ensure grounds have adequate infrastructure.
▪ Create a partnership with Margaret K. Lewis School to open outdoor recreation facilities to the public during non-school hours.
Objective 3: Develop the 6th Street Floodable Park.
▪ Combine vacant and naturalized parcels near Elm Avenue and East 6th Street to create a floodable nature park that restores the historic bayou drainage, filters runoff, and creates clearings for gathering, community gardens, play space, and walking trails.
Objective 4: Provide necessary public facilities and services at acceptable levels to accommodate existing needs, as well as new demands, as proposed development occurs within the Millville CRA and City.
▪ Secure grant funding, when possible, to leverage tax increment revenues for achieving goals related to adequate infrastructure provision.
▪ Collaborate with relevant government and private utilities to ensure adequate services, including electricity, telecommunications, cable television, water, storm water, sanitary sewer, gas, and solid waste.
▪ Assess existing infrastructure conditions to identify specific needs for upgrading older systems in conjunction with proposed improvements within the City.
▪ Support community policing efforts undertaken by the City's Police Department.
▪ Incorporate accredited safe neighborhood design techniques for all public places and proposed public/ private redevelopment projects.
▪ Enhance code enforcement efforts and evaluate policies to ensure effective enforcement practices to improve conditions and stabilize neighborhoods.
Objective 5: Enhance Aesthetics.
▪ Enhance aesthetics through use of decorative lighting in parks and along roadways, seasonally or year-round.
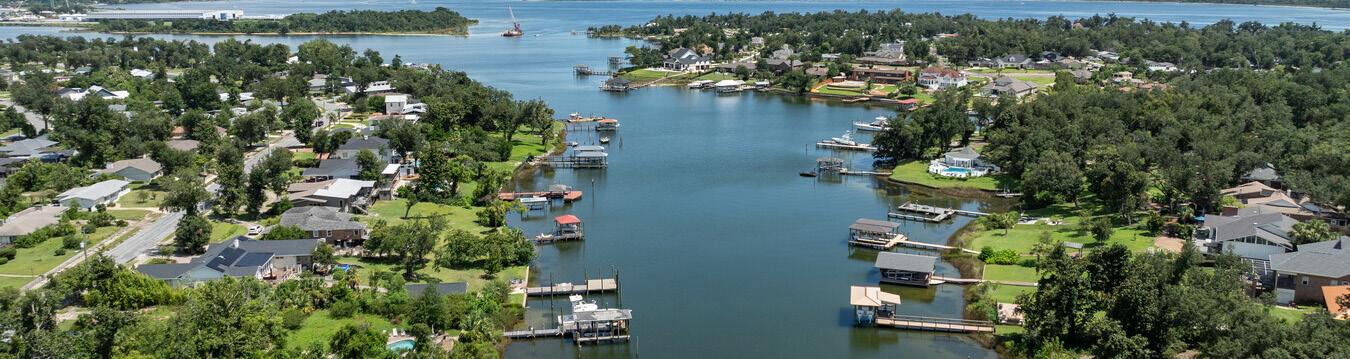

Promote Cultural Identity and History
To promote cultural identity and history, the objectives and strategies listed are intented to support historic preservation efforts through community education programs and implementing streetscape designs that will promote a community identity.
Objective 1: Preserve and maintain historic and architecturally significant structures and sites.
▪ Protect the Millville CRA’s heritage by preserving its landmarks and significant structures, especially the historic 3rd Street Cemetery.
▪ Identify and restore historic housing that may be in a state of deterioration but otherwise is structurally sound.
▪ Work with the Historic Preservation Advisory Board to further the organization’s goals as they pertain to historic structures in the neighborhood.
▪ Pursue designation of properties on the National Historic Register.
▪ Ensure that future development in the Millville

CRA is consistent with the existing architectural character of the neighborhood.
▪ Collaborate with City to create an overlayzoning district that will establish architectural design guidelines for new construction and building renovations.
▪ Establish a facade improvement program providing design assistance and financial incentives to encourage building renovation that will provide continuity of historical design and strengthen existing architectural features.
▪ Collaborate with City to prepare a historic preservation ordinance that promotes voluntary participation in preservation efforts and provides
Advance Sustainability and Resilience
economic incentives for the restoration of historic properties.
▪ Make property owners and investors aware of the tax inducements available as an incentive for restoring historic buildings for practical use.
▪ Interpret shipbuilding, mill, and maritime history.
▪ Install public art, wayfinding, and historic interpretation.
▪ Recognize and preserve the unique heritage of the district through plaques, murals, and interpretive displays.
▪ Develop cohesive design standards that reflect neighborhood identity and reinforce sense of place.
▪ Support community-based historic preservation efforts.
To advance sustainability and resilience, the objectives and strategies listed are intended to develop and implement plans that create energy efficient infrastructure throughout the Millville CRA with a focus on Snug Harbor.
Objective 1: Promote CRAwide resiliency infrastructure upgrades.
▪ Build stormwater capacity with green infrastructure.
▪ Promote tree planting, incorporate native landscaping and renewable energy upgrades.
▪ Support energy-efficient and resilient building practices.
▪ Support resilience planning for flood-prone areas.
▪ Install solar lighting in parks, trails, and public spaces to reduce energy use and enhance safety.
▪ Implement urban heat mitigation strategies such as expanded tree canopy, shaded streetscapes, and reflective surfaces to improve livability and address climate-related impacts.
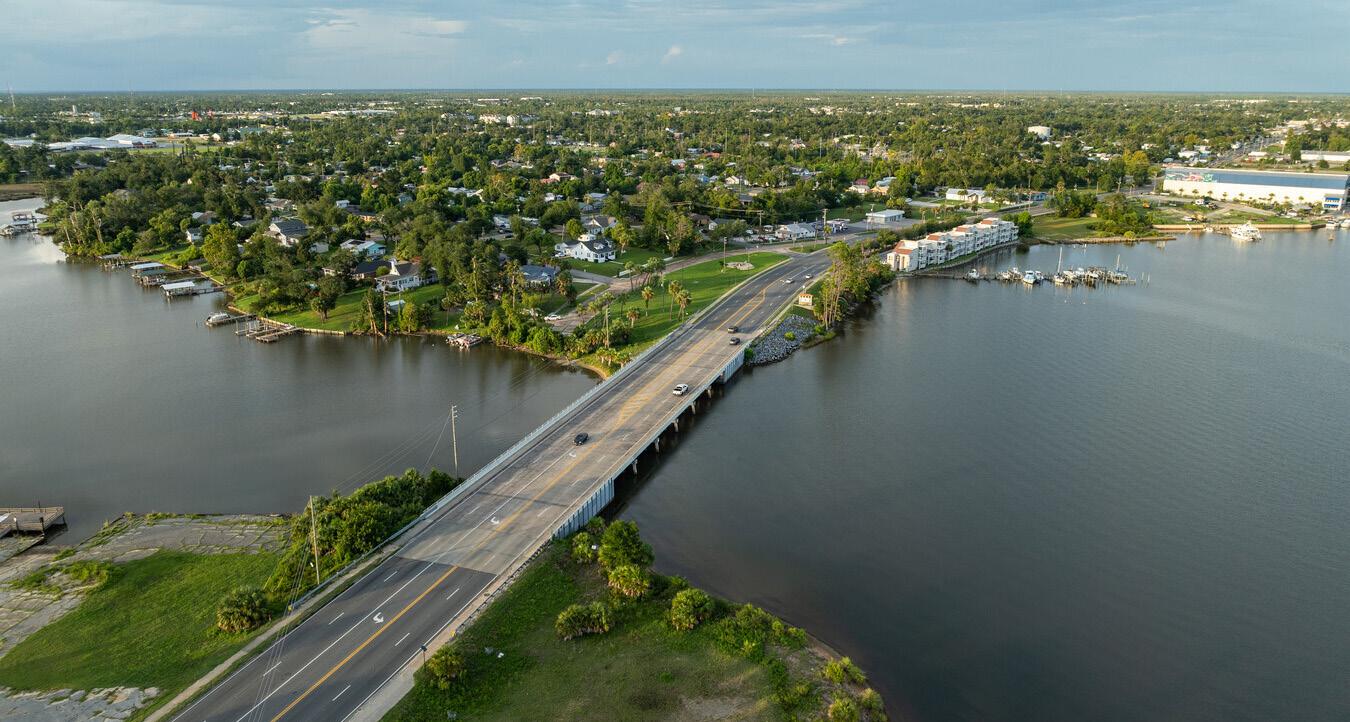
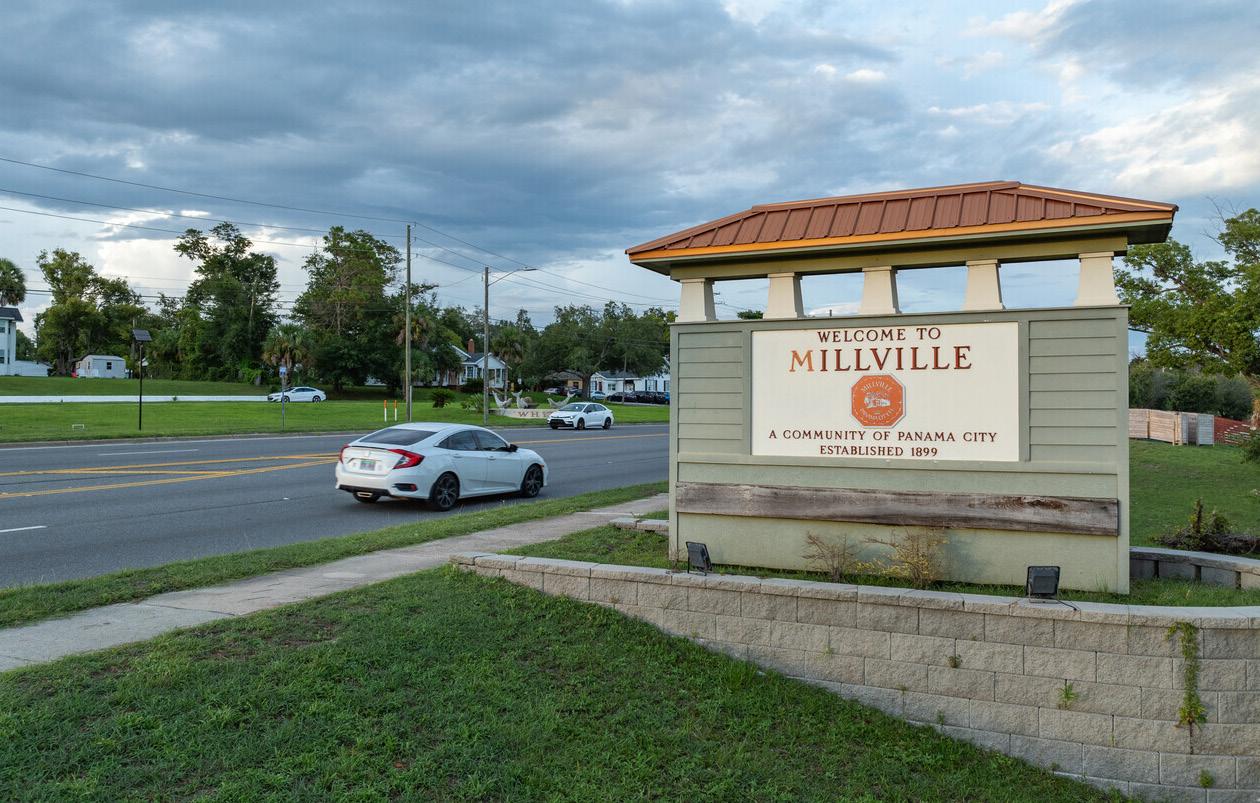
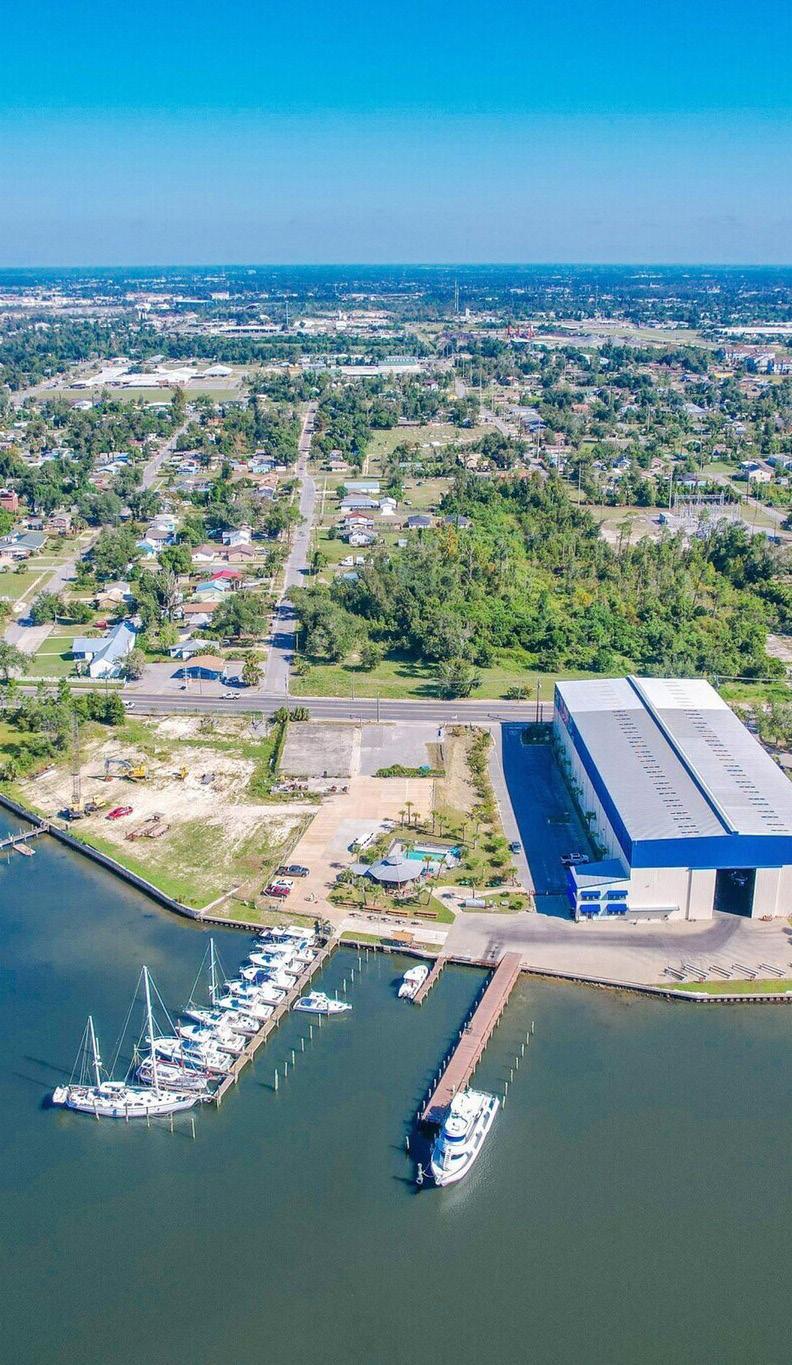
CONCEPTUAL MASTER PLAN
The Conceptual Master Plan for the Millville CRA illustrates the general locations of the previously installed capital improvements and proposed capital improvements and programming identified in the Capital Projects and Programming Worksheet, further detailed in Section 6, Financial Analysis of this document (see Figure 29).
Specific proposed capital improvements illustrated below include redevelopment focus areas, primary and secondary gateways, and safer streetscapes and intersections enhancements to improve pedestrian safety, as well as multi-use trails and protected bikeways to enhance walkability and bike paths.
Legend
Millville CRA
Primary Gateway
Secondary Gateway
Intersection Improvements
Redevelopment Focus Area
Traditional Neighborhood Commercial
Proposed Protected Bike/ Cycle Tracks
Proposed Multi-Use Path
Proposed Pedestrian/ Streetscape Improvement
Additional Pedestrian/Bike Connection
East Avenue Parallel Bike/ Mobility Options 1 2 3
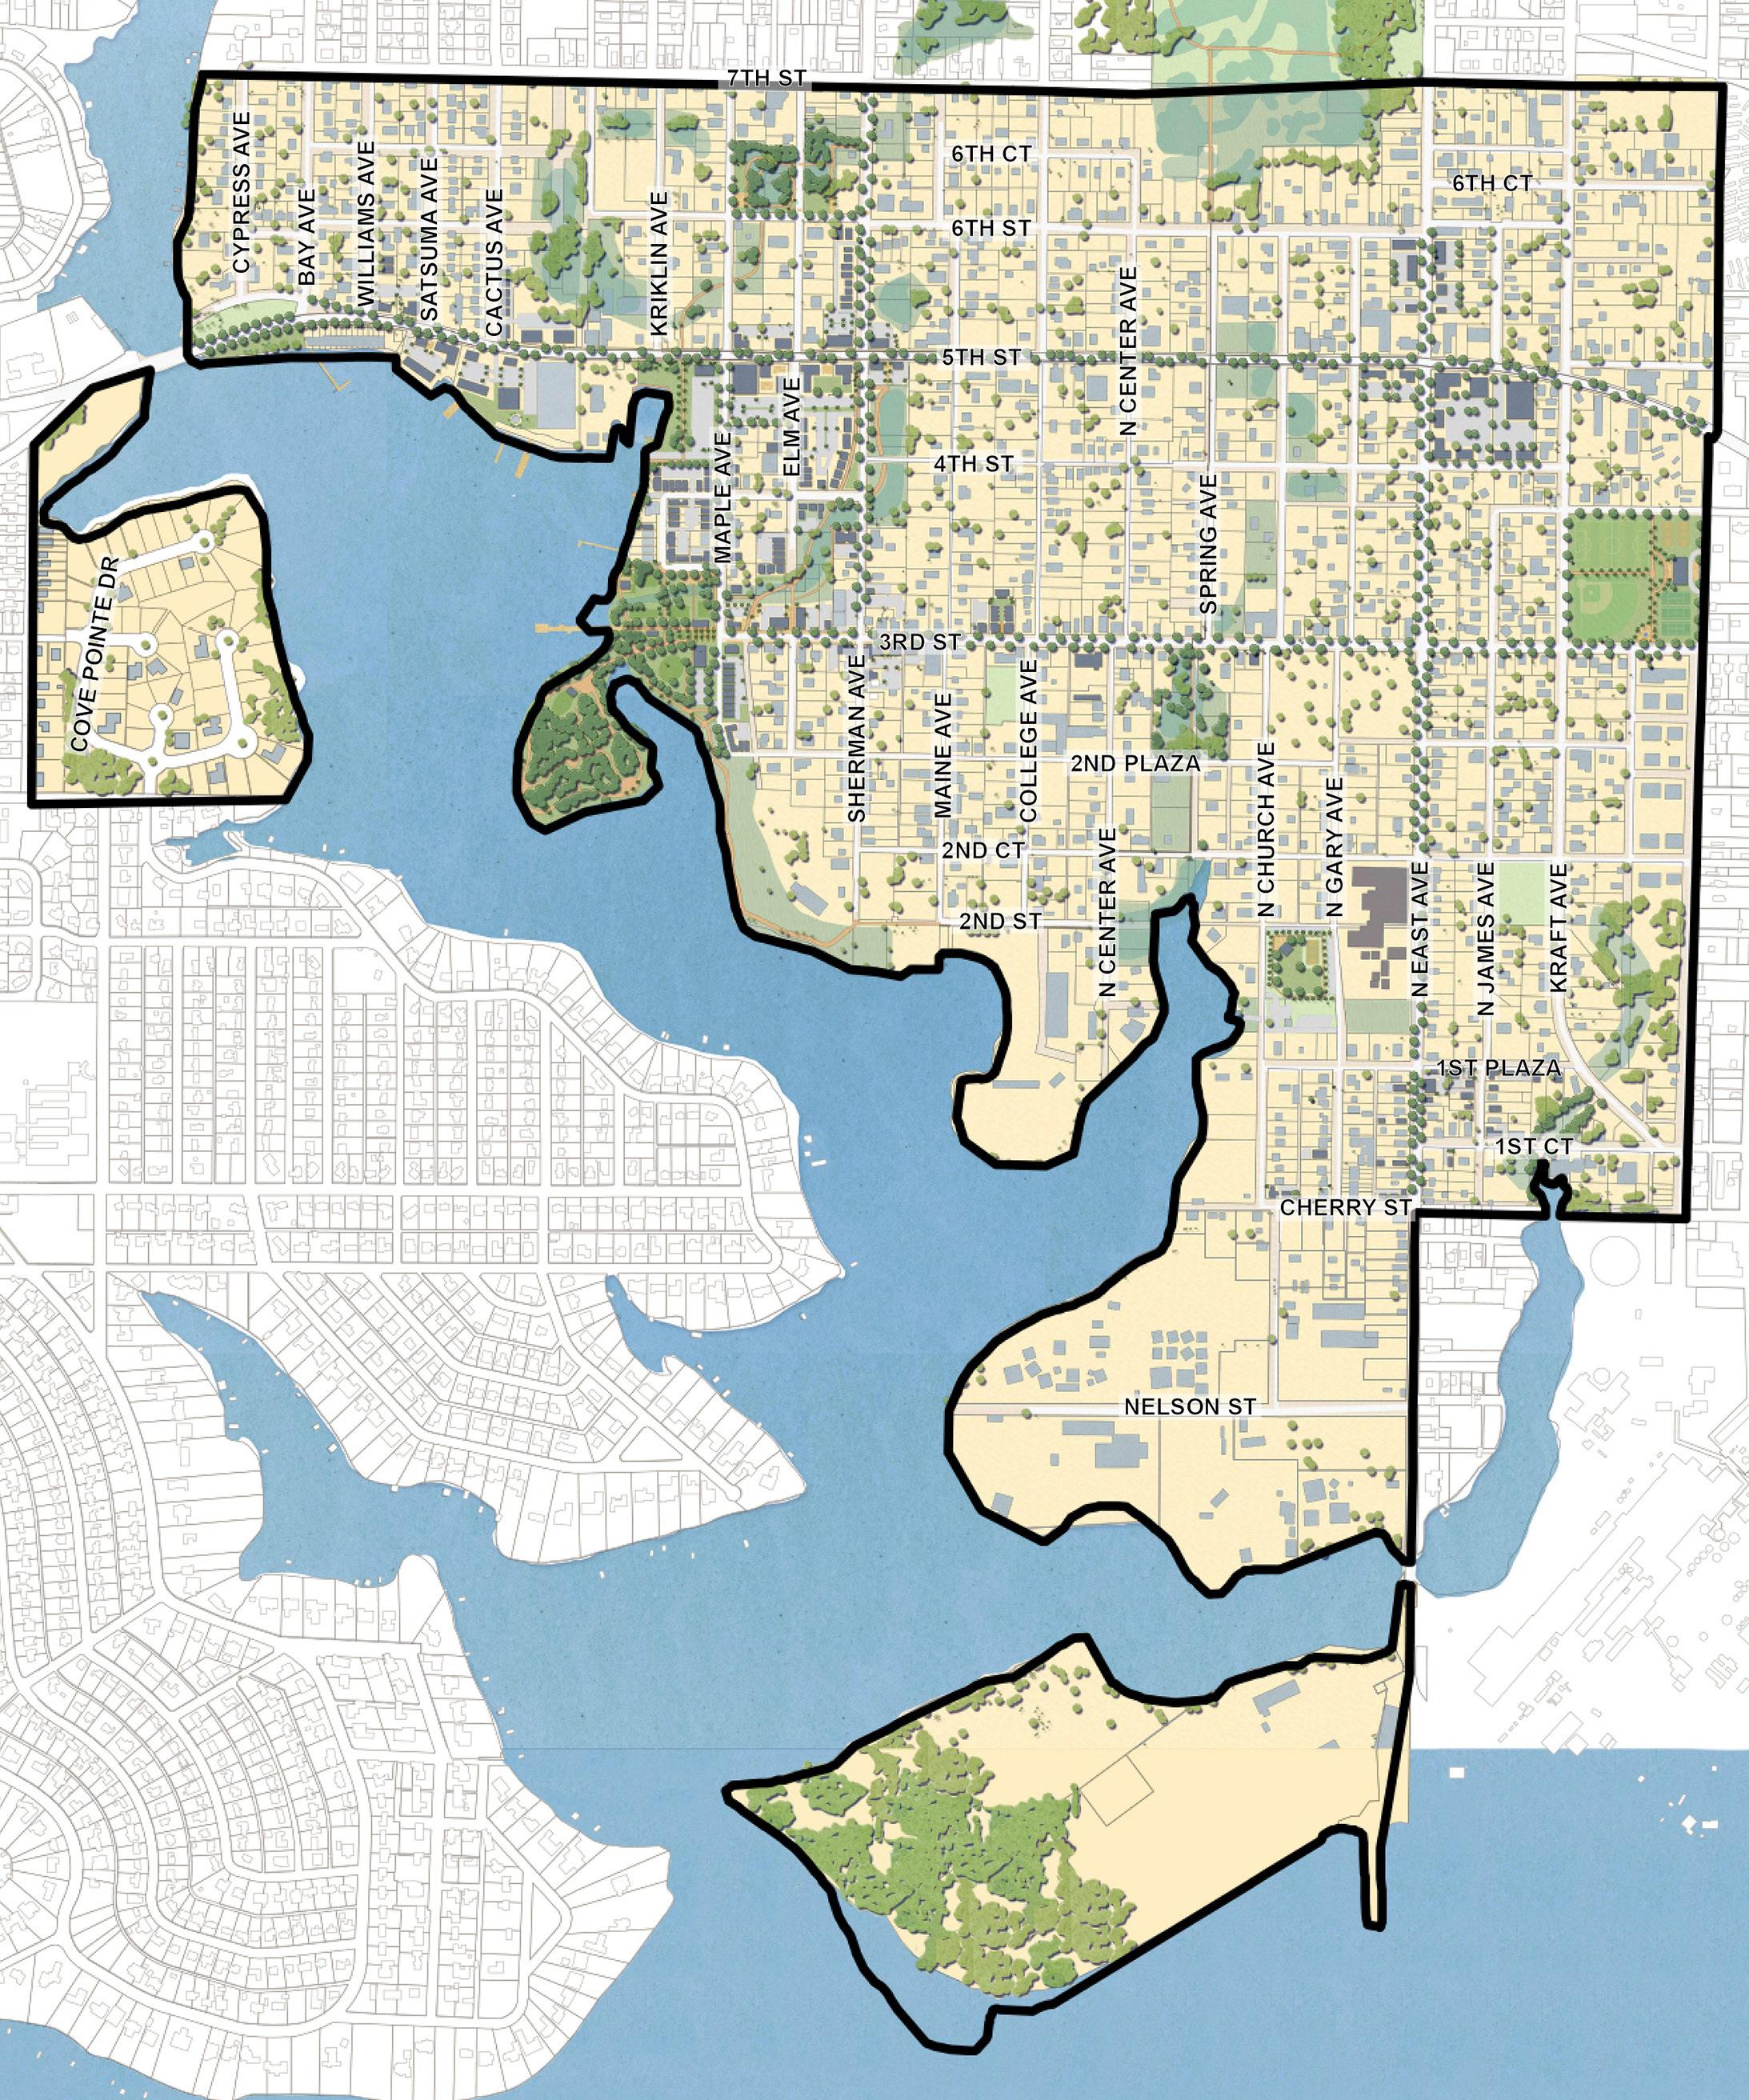
Figure
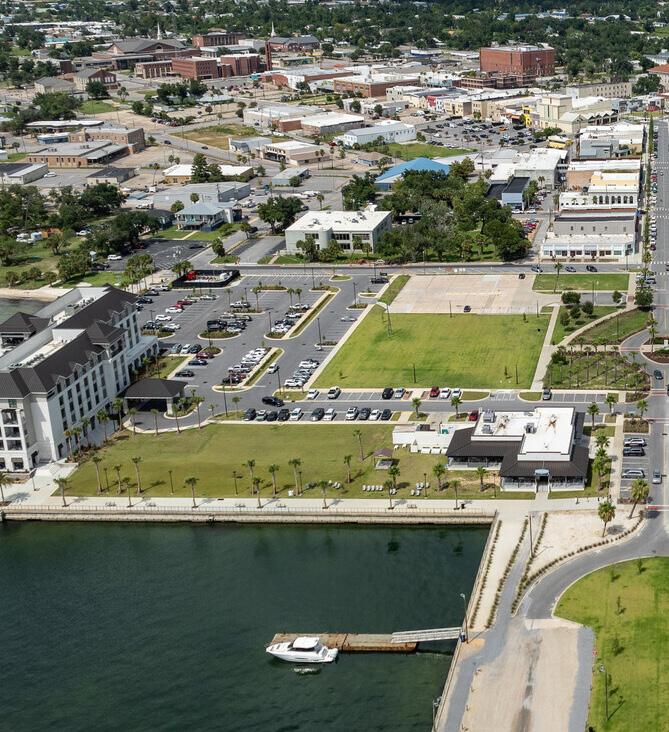
FINANCIAL ANALYSIS
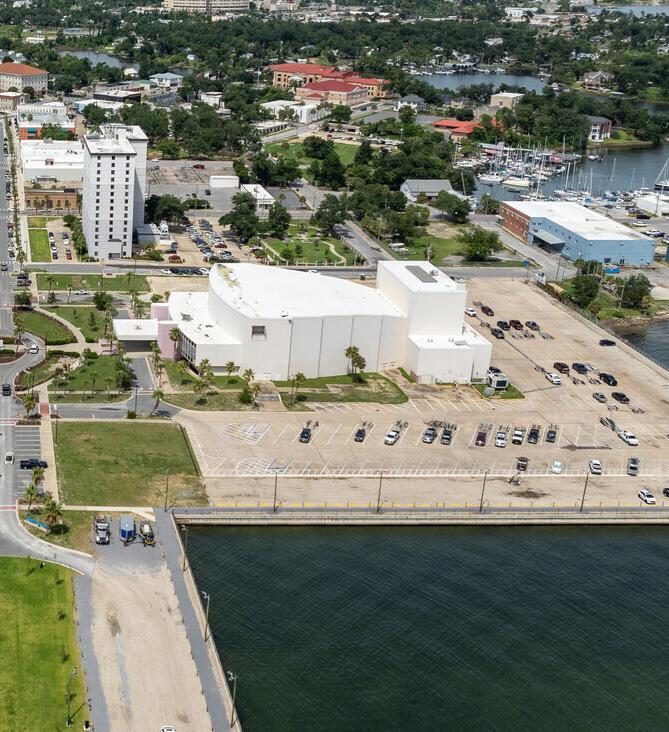
CHAPTER SIX:
FINANCIAL ANALYSIS
TAX INCREMENT FINANCING
Overview
The Community Redevelopment Act authorizes a county or municipality to create a Community Redevelopment Agency (“Agency”) as a means of redeveloping areas experiencing Slum and Blight conditions. Agencies administer programs and activities which implement goals as defined within an adopted Community Redevelopment Plan. These programs and activities are primarily funded by Tax Increment Financing (“TIF”) revenue, which is used to leverage public funds to promote redevelopment activities within Community Redevelopment Areas (“CRAs”).
TIF revenues are generated from increases in property values above their value at the time the Agency was created. TIF revenues accrue into a Redevelopment Trust Fund which is created for that express purpose. The ordinance creating the Redevelopment Trust Fund specifies the base valuation of all property located within the boundaries of the CRA. Thereafter, 95% of taxes assessed by qualified taxing authorities on increases in the value of all property contained in the CRA accrue into the Redevelopment Trust Fund.
The 30-year operational term of the Panama City Community Redevelopment Agency began in 1984 and was extended an additional 30-year term in 2014, therefore the Agency is due to “sunset” in 2044.
Major Assumptions
This analysis reflects a projected level of property values and the manner in which these property values are taxed, evaluated, and collected throughout the Agency’s existence. A reasonable and diligent effort has been made to confirm all assumptions.
In the course of estimating TIF revenues, data provided by the Florida Department of Revenue (“FDOR”), Bay County Property Appraiser, and City of Panama City was considered. The projections reflect levels of tax increment that could be achieved based on expected development and redevelopment which may occur within the Agency’s four CRA districts throughout the projection period, 2025 to 2044 (“projection period”).
The following major assumptions were utilized within the projections:
▪ The TIF revenue projections reflect a period through the Agency’s current 2044 sunset date, from 2025 through 2044.
▪ Average annual increase (appreciation) of existing and new taxable value includes value from residential and commercial development and redevelopment within the redevelopment area(s), as well as an annual inflation rate of 2% to remain conservative.
▪ Assumes full build-out of new development within 15
years and redevelopment construction within 20 years. New development includes converting tax-exempt properties to taxable and development on existing undeveloped properties.
▪ Ad valorem tax millage rates utilized were 5.4362 for Bay County and 4.7999 for the City of Panama City. The millage rates for the County and City are reflective of the final 2025 millage rates.
▪ The model assumes the City and County each contribute 95% of the incremental property taxes levy increase each year for the Downtown CRA and Millville CRA. However, the 95% contribution from the City and County applies only to the original boundaries of the St. Andrews CRA and Downtown North CRA.
– Per Interlocal Agreement (Resolution 20250408.1), Bay County agrees to pay a reduced percentage of seventy-four percent (74%) to the ad valorem increment levied by the County for the St. Andrews CRA Expansion Area.
– Per Interlocal Agreement (Resolution #20220208.5), Bay County agrees to pay a reduced percentage of 85% to the ad valorem increment levied by the County for both the 2021 Downtown
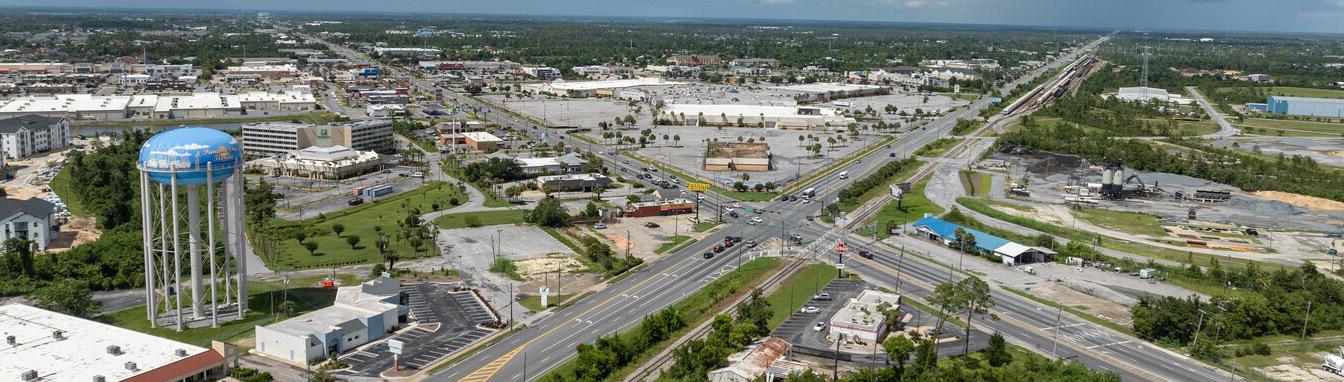
North CRA Expansion Area(s).
▪ The following base years were applied within the projection model(s):
– The Downtown CRA was established in 1984, with a base year value of $26,787,527.
– The St. Andrews CRA was established in 1989, with a base year value of $15,932,884. Per Resolution 20250408.1, the St. Andrews CRA was expanded in 2025 with a 2024 base year value of $167,378,638.
– The Downtown North CRA was established in 1993, with a base year value of $44,483,072. Per Resolution #032508.2, the Downtown North CRA was expanded in 2008 with a base year value of $26,152,791. Per Resolution #20180925.3, the Downtown North CRA was expanded in 2018 with a base year value of $12,534,490. Per Resolution 20220208.5, the Downtown North CRA was expanded in 2021 with a base year value of $47,525,578.
– The Millville CRA was established in 2004, with a base year value of $42,398,300.
▪ Based on prior rates of growth and change in market driven opportunities throughout the Agency’s four CRA districts, the projection model takes a conservative approach in estimating tax increment through 2044. The projections assume a continuation of historical inflationary growth plus development of vacant land and redevelopment of existing improved properties. Any general disruption of economic activity is considered short-lived and has a minimal impact on the region or the commercial and residential development sector in general.
Review of Millage Rates
The millage rates within both the County and City have remained consistent over the last couple of years, as illustrated in Table 9.
In an effort to remain conservative, the tax increment projections apply the 2025 final property millage rates for both the County and the City as a constant 5.4362 and 4.7999 per $1,000 of taxable real property value, respectively, throughout the projection period. Although it is likely the millage
rates may vary marginally during the projection period, the projections remain the most likely and reasonable estimate of TIF revenues anticipated to be generated by the Agency through the sunset date, 2044.
To note, the Panama City Agency Redevelopment Trust Fund was established in 1984, prior to the Florida Statutes provision stating that a taxing authority may not contribute an amount that exceeds that provided by the governing body that created the Redevelopment Trust Fund (Chapter 163.387, section b1, F.S.). Therefore, the County may contribute a greater amount to the Redevelopment Trust Fund than the City for any given year.
Components of Change
In addition, the projections take into consideration the likely components of change in total taxable value from the current taxable value given the composition of properties within the Agency’s four CRA districts.
Projected future taxable value is anticipated to be a function of (1) growth in market values of
existing improved properties over time (e.g., inflationary growth); (2) redevelopment of some portion of existing improved properties; (3) development of available vacant land area; and (4) additional growth in market value on newly developed or redeveloped properties over time. The components of change for each of the Agency’s four CRA districts are reflected in Table 10 below.
The potential development and redevelopment opportunities for both commercial and residential markets within the Agency’s four CRA districts are based on existing land use data, as well as an Investment and Redevelopment Opportunity Index (“IROI”) model, described below.
Investment and Redevelopment Opportunity Index
The Investment and Redevelopment Opportunity Index (“IROI”) included in this analysis has been developed using weighted values that can identify potential investment and redevelopment properties located within a specific area. For the purpose of this analysis, investment and redevelopment opportunities were examined for each of the Agency’s four CRA districts.
The IROI model defines investment opportunities as current forsale commercial properties or available vacant land, whereas redevelopment opportunities are defined as select properties— including commercial, residential, and industrial/flex—based on Department of Revenue (“DOR”)
property use codes, with an opportunity index score greater than 80. These redevelopment opportunities generally represent developed properties that may be in active use and are, in most cases, not currently on the market for sale. While many legal, physical, and economic factors ultimately play a role in the viability of redeveloping properties, the general factors used in the IROI model include the following:
▪ Property Utilization in terms of Floor Area Ratio (“FAR”).
▪ Age of the Improvements.
▪ Relationship between Land and Improvement Value.
▪ Total Market Value, including Land and Improvements per square foot of property.
▪ Size of the Parcels.
Each of these factors for these properties are weighted to provide a measure between 0 and 100. Values closer to 100 reflect factors in favor of redevelopment, and values closer to 0 reflect less favorable indicators for redevelopment. For this analysis, properties scoring 80 or above are considered significant redevelopment targets. The potential taxable value of these significant redevelopment targets is then estimated and applied to the TIF revenue projection model(s) utilizing the taxable value per square foot of existing properties recently built within the City delineated by property use. It is important to note, the IROI model does not consider any other legal, physical, or economic factors that may influence development opportunity.
TA ble 10. COMPON e NTS OF CHAN ge
Source(s): FDOR; Bay County Property Appraiser; City of Panama City; Panama Community Redevelopment Agency; GAI Consultants. Note: Totals may not add due to rounding.
Downtown CRA St. Andrews CRA Downtown North CRA Millville CRA
DOWNTOWN CRA TAX INCREMENT PROJECTIONS
The Downtown CRA was established in 1984 with a base year value of $26,787,527. By applying the millage rates for both the County and City, consistent with the final 2025 millage rates, and assuming a 95% participation rate from both entities, the total taxable value and TIF revenues for the Downtown CRA can be projected through the 20-year period from 2025 to 2044, the Agency’s current sunset date.
In 2025, the initial year of projections, the Downtown CRA is estimated to have a taxable value of $95,594,500 generating
$669,100 in TIF revenues. Over the next 10 years, 2025 to 2034, the Downtown CRA has the potential to generate, in total, as much as $9,019,600 in additional receipts.
Throughout the full projection period, 2025 to 2044, the projection model predicts that the taxable value for current improved land, existing vacant land, and new development within the Downtown CRA will experience a CAGR of 4.1%, consistent with historical growth rates observed by the Downtown CRA over the past 10-year period at a CAGR of 4.4%.
In addition, the Downtown CRA is estimated to generate approximately $24,118,000 in tax increment through the Agency’s sunset date, 2044—equating to approximately $1,205,900 in average annual increment over the 20-year projection period.
Table 11 details the projected total taxable value and TIF revenue, along with the contributions from the County and City to the TIF revenue, for the Downtown CRA over the projection period from 2025 to 2044.
Assumes a 95%
ST. ANDREWS CRA TAX INCREMENT PROJECTIONS
The St. Andrews CRA was established in 1989 with a base year value of $15,932,884. In 2024, an FON was adopted which expanded the St. Andrews CRA to include areas east and west of the original boundary. These expansion areas have a 2024 base year value of $167,378,638.
By applying the final 2025 millage rates for both the County and City, and assuming a 95% participation rate from both entities, the total taxable value and TIF revenues for the original St. Andrews CRA, along with a reduced 74% contribution from the County for the expansion areas, can be projected through
the 20-year period from 2025 to 2044, the Agency’s current sunset date. In 2025, the initial year of projections, the St. Andrews CRA is estimated to have a taxable value of $279,262,100, generating $924,300 in TIF revenues. Over the next 10 years, 2025 to 2034, the St. Andrews CRA has the potential to generate, in total, as much as $14,450,500 in additional receipts.
Throughout the full projection period, 2025 to 2044, the projection model predicts that the taxable value for current improved land, existing vacant land, and new development within the St. Andrews CRA will experience a
CAGR of 3.6%, consistent with historical growth rates observed by the St. Andrews CRA over the past 10-year period at a CAGR of 4.0%.
In addition, the St. Andrews CRA is estimated to generate approximately $42,597,800 in tax increment through 2044—equating to about $2,129,890 in average annual increment over the 20year projection period.
Table 12 details the projected total taxable value and TIF revenue, along with the contributions from the County and City to the TIF revenue, for the St. Andrews CRA over the projection period.
Source: Bay County Property Appraiser; Florida Department of Revenue (FDOR); GAI Consultants. Notes: Totals may not add due to rounding. (1) Reflects
for the expansion areas. (4) Reflects projected 20-year collections and CAGRs from 2025 to 2044, the Agency’s sunset date applying a
of $167,378,938 for the expansion areas.
DOWNTOWN NORTH CRA TAX INCREMENT PROJECTIONS
The Downtown North CRA was established in 1993 with a base year value of $44,483,072. Since establishment, the Downtown North CRA has been expanded four times: in 2008, 2018, and twice in 2021.
By applying the final 2025 millage rates for both the County and City, and assuming a 95% participation rate from both entities, the total taxable value and TIF revenues for the Downtown North CRA, along with a reduced 85% contribution from the County for both the 2021 Expansion Area(s), can be projected through the 20-year period from 2025 to 2044, the Agency’s current
sunset date. In 2025, the initial year of projections, the Downtown North CRA is estimated to have a taxable value of $274,906,900, generating $1,397,400 in TIF revenues. Over the next 10 years, 2025 to 2034, the Downtown North CRA has the potential to generate, in total, as much as $20,499,300 in additional receipts.
Throughout the full projection period, 2025 to 2044, the projection model predicts that the taxable value for current improved land, existing vacant land, and new development within the Downtown North CRA will experience a CAGR of 4.0%, slightly more aggressive
compared with historical growth rates observed by the Downtown North CRA over the past 10-year period at a CAGR of 1.6%.
In addition, the Downtown North CRA is estimated to generate approximately $58,047,000 in tax increment through 2044—equating to about $2,902,350 in average annual increment over the 20year projection period.
Table 13 details the projected total taxable value and TIF revenue, along with the contributions from the County and City to the TIF revenue, for the Downtown North CRA over the projection period.
Source: Bay County Property Appraiser; Florida Department of Revenue (FDOR); GAI Consultants. Notes: Totals may not add due to rounding. (1) Reflects the total taxable value within the increment area less the Downtown North CRA's base year value(s) of: $44,483,072 (1993 Original); $26,152,791 (2008 Expansion Area); $12,534,490 (2019 Expansion Area); $47,525,578 (2021 Expansion Area(s)). (2) Applies a millage rate of 4.7999 for Panama City and 5.4362 for Bay County. (3) Assumes a 95% participation rate from both Panama City and Bay County for the Downtown North CRA parcels, and assumes a reduced
contribution from the County for both the 2021 Expansion Area(s). (4) Reflects projected 20-year collections and CAGRs from 2025 to 2044, the Agency’s sunset date.
MILLVILLE CRA TAX INCREMENT PROJECTIONS
The Millville CRA was established in 2004 with a base year value of $42,398,300. By applying the millage rates for both the County and City, consistent with the final 2025 millage rates, and assuming a 95% participation rate from both entities, the total taxable value and TIF revenues for the Millville CRA can be projected through the 20year period from 2025 to 2044, the Agency’s current sunset date.
In 2025, the initial year of projections, the Millville CRA is estimated to have a taxable value of $137,997,100, generating $929,600 in TIF revenues.
Over the next 10 years, 2025 to 2034, the Millville CRA has the potential to generate, in total, as much as $12,882,300 in additional receipts.
Throughout the full projection period, 2025 to 2044, the projection model predicts that the taxable value for current improved land, existing vacant land, and new development within the Millville CRA will experience a CAGR of 4.3%, which may be considered conservative compared to historical growth rates observed by the Millville CRA over the past 10-year period at a CAGR of 5.6%.
In addition, the Millville CRA is estimated to generate approximately $35,126,800 in tax increment through the Agency’s sunset date, 2044—equating to approximately $1,756,340 in average annual increment over the 20-year projection period.
Table 14 details the projected total taxable value and TIF revenue, along with the contributions from the County and City to the TIF revenue, for the Millville CRA over the projection period from 2025 to 2044.
CAPITAL IMPROVEMENTS PROGRAM
The intent of the proposed Capital Improvement Program ("CIP") is to recognize the relative importance of the already identified or contemplated activities or programs. The CIP is a tool to focus decision making and actual implementation as resources become available. The activities and proposed funding allocation of the CIP recognizes potential general time frames for implementation, policies, and policy criteria or program content in accordance with F.S. Section 163.362.
While it is the purpose this 2025 Plan to direct resources to those listed, it is also the intention that funds be allocated with some flexibility, in part, because funds from other sources could be leveraged and directed to many of the same focus areas. As a part of that flexibility, it is expressly the intent of this 2025 Plan that the allocation of resources between and among activities should be fungible such that any adjustment in sums does not require amendment/ modification to this 2025 Plan.
By maintaining the overarching objectives and related principles of this 2025 Plan, consistency in project and program spending is assured. The funds for implementation could come from a variety of resources, just as they have in the past. The following table details the CIP for the Agency's four 4 CRA districts over the next 5-year period, fiscal year 2024 through fiscal year 2030 (see Table 15).
Source: Panama City Community Redevelopment Agency; GAI Consultants.
TA ble 15. CAPITAL IMPROVEMENTS PROGRAM, FISCAL YEAR 2024-2030
[ THIS PAGE INTENTIONALLY LEFT BLANK ]
ALTERNATIVE FUNDING OPTIONS AND INCENTIVE PROGRAMS
Potential Receipts and Capital Contributions
Identified below are several ways other communities have opted to improve or enhance both operational receipts and capital resources. These alternative funding options can be instrumental in the Agency obtaining additional resources to fund redevelopment projects and programs. Some of these options are addressed below.
General Fund
This is the most common source of budgetary commitments within a community and appears to be the primary means of funding or supporting various redevelopment activities in the City and the CRA. The issue, of course, is that every citizen claims to want more parks, and there is typically a level of service (“LOS”) standard for parks in each community’s comprehensive plan. Those standards become increasingly prohibitive to absorb through the General Fund.
Advantages
▪ Commonly used for both capital and operations.
▪ Subject to annual and continuing reviews.
▪ Any receipts or dollars generated combine well with other resources.
▪ Probably the most reliable financial mechanism.
▪ Dollars can be allocated to almost any purpose.
▪ Already a functioning system in place to address needs.
Disadvantages
▪ May be difficult to justify additional spending for
facilities in certain locations.
▪ Whatever the City budget might be, it is limited by law to a certain millage ceiling.
Special Assessments
Special assessments are fees levied to achieve a specific level of benefit or service. They take many forms under various provisions of Florida law. Depending upon their purpose or means of implementation, such assessments may be imposed simply by the City as the controlling legislative body, or could be authorized by referendum in some cases. Special assessments are a financial resource with flexible application to absorb or offset both capital and operational costs. They can be applied to the capital or operational costs of parks as well as roads, lighting, and other facilities or infrastructure broadly defined.
Assessments must be shown to provide a demonstrable benefit to property and the charge cannot exceed the benefit which reflects considerations more than simply an increase in property value. They can extend citywide or to certain accessible or identifiable areas. Because the idea of a benefit is quite broad, there are then multiple ways of allocating the assessment itself. The manner ultimately applied should satisfy certain tests of reasonableness and logic, but Florida law allows extensive latitude.
Advantages
▪ Commonly used for both capital and operations.
▪ Subject to annual and continuing reviews.
▪ Any receipts or dollars generated combine well with other resources.
▪ Probably the most reliable financial mechanism.
▪ Dollars can be allocated to almost any purpose.
▪ Already a functioning system in place to address needs.
Disadvantages
▪ An additional charge for services perceived as more properly absorbed by tax (General Fund) dollars.
▪ While there are ways to reduce assessments to specific properties, such as schools or churches, all benefited properties generally must contribute.
▪ May be difficult to justify added charges or fees in disadvantaged neighborhoods.
▪ If subjected to referendum, may not be adopted.
Simple User Fees
While such fees are typically associated with a controlled gate and for selected facilities, it is not uncommon for them to apply to trails and conservation areas at an obvious access point, often through an honor system. Where there is not an attendant, appropriate in many situations, rates would be posted and there would be a secure box for collections. These proceeds are generated for a specific park or area deemed to benefit from their imposition and their collection.
Advantages
▪ Tied to specific facilities.
▪ May combine existing workers if maintenance is an issue at a
targeted location.
▪ Ease of administration.
▪ Any receipts or dollars generated combine well with other resources.
▪ Dollars can be allocated to site, area, or facility specific activities.
Disadvantages
▪ Best for modest collections.
▪ Unlikely to offset major costs.
Other Complementary Programs, Dollars, or Funds
While assessments, benefit charges, and increment dollars could be extraordinarily effective, there are other funds and financing techniques which should be considered as well. These additional approaches leverage the value of other dollars and have application to specific activities.
Grant Programs
Grants are typically performance and/or criteria-based awards directed to a variety of initiatives and originating from many different local, state, and national resources. They are typically competitive although “need” may be a sufficient premise for an award. As well as coming from governmental sources, grants are sometimes provided by major area banks and institutions, foundations, and many smaller non-profits. Federal and state grant opportunities are highly limited. As such, their value and availability today are highly speculative. Because these dollars are highly speculative, they are not a sturdy foundation for an implementation plan, especially if there are near term objectives which must be satisfied. Grants are better viewed as
enhancements to financial options which are imminent and controlled by the parties or groups looking to realize immediate change through a plan.
Advantages
▪ They are often dollars extended without recurring obligations to the recipient.
▪ They can often be paired with, or inserted into, any financial scheme.
▪ They can be available for both capital and operational activities.
▪ May create a long-term partnership with granting entities or institutions.
▪ May be flexible in some cases as circumstances evolve.
Disadvantages
▪ Not likely to be an immediate financial resource.
▪ Usually highly competitive and can be costly.
▪ Major reporting and accountability requirements.
Improved Leveraging and Coordination of Existing Efforts
In many controlled situations there are likely to be projects, programs, or work which could be coordinated and leveraged to support or implement the development and/or redevelopment activities or management responsibilities associated with potential catalyst sites within the City and CRAs.
All the development and/ or redevelopment within the Panama City CRA controlled by the Agency, and nearby areas will require coordination, planning, and other efforts that might be funded or supported together such that the cooperative arrangements benefit the City and the Agency in some measurable or reasonable way. Over many projects or programs, careful planning, coordination, and scheduling can save dollars that often may be sufficient in scale to support the equivalent of still other projects.
Advantages
▪ Recognizes and leverages investments in staff and other program resources which have already been committed.
▪ The costs often leverage dollars without recurring additional obligations.
▪ Efforts are wholly marginal costs, so they are extremely efficient from an economic standpoint.
▪ Can literally be paired with, or inserted into, any financial or program scheme.
▪ Flexible in some cases as circumstances evolve.
Disadvantages
▪ Requires very forwardlooking thinking.
▪ Rarely aligns perfectly with existing budget priorities.
▪ May alter a preferred sequence of events.
Incentive Programs
Development incentives are a set of policies which encourage economic development. These incentives take many forms such as: Tax Refunds, Tax Increment Financing, Enterprise Zones,
Foreign Trade Zones, Historic Grants and Tax Credits, Interest write down, New Market Tax Credits, the use of Private/Public Partnerships, Pre-development Loans, Grants, insurance programs, Non Ad-Valorem Loan Guarantees, enhanced public amenities, Brownfield funding and other Municipal Finance Strategies.
The 18 incentives summarized within the following pages may be adopted by the City and provide the Agency the tools necessary to continue to attract quality development projects and investment into the community. It is critical to note that in any given year any local, state, and federal program may be underfunded or discontinued.
This 2025 Panama City CRA Plan Amendment and Comprehensive Updates (“2025 Plan”) has an operational timeframe for implementation of 2025 through 2044. It is the responsibility of the Governing Body, Agency, Staff, and downtown developers and residential and retail applicants to be mindful of the health of any such program for which funds are being sought.
World
Changers Home Improvement Program
For the ninth year, World Changers and the Panama City Community Redevelopment Agency ("Agency") are teaming up to improve homes in Millville and Downtown North. This summer, the 2025 Home Improvement Program will focus on enhancing residents’ quality of life through home rehabilitation. In July, hundreds of World Changers volunteers will return to Panama City to complete various home repair projects, including painting, porch repairs, and fence installations. World Changers will provide free labor, while the CRA will cover material costs, ensuring no expense for residents.
Economic Development Ad Valorem Property Tax Exemption
The Bay County Board of Commissioners, the City of Panama City and the City of Lynn Haven offer an abatement of the local property tax at the business location on tangible personal property and improvements to real property for a period up to 10 years. In order to qualify, a
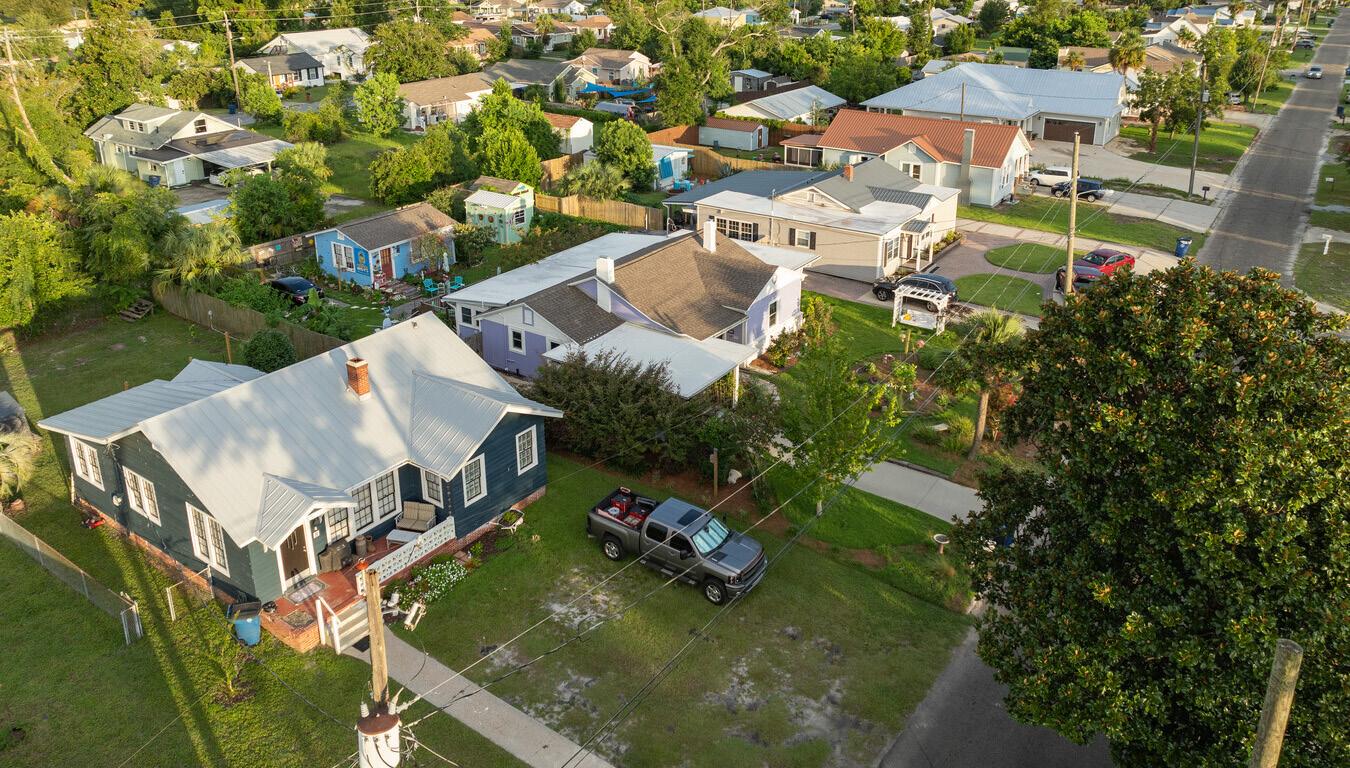
company must first meet the definitions of a new or expanding business as stated in s. 196.012 (15) and (16), F.S.
Panama City CRA’s Tax Increment Rebate Program
The purpose of the Panama City Community Redevelopment Agency Tax Increment Rebate Program is to encourage private sector redevelopment, in-fill development and public realm improvements that are consistent with the City’s recovery and redevelopment efforts. The proposed project must be located within one of the City’s Redevelopment Districts. The Agency will consider utilizing the Tax Increment Rebate Program for the following types of proposed development:
▪ Revitalization of historically significant or deteriorated buildings.
▪ Mixed-use developments that creatively integrate commercial and retail projects into a residential development.
▪ Projects that promote neighborhood stabilization or revitalization.
▪ Projects that are consistent with the associated district’s adopted Community Redevelopment Districts’ Community Redevelopment Plans and the Panama City Comprehensive Plan and associated sections of the Panama City Code of Ordinances-Unified Land Development Code; and the Strategic Vision for Panama City’s Historic Downtown and its Waterfront.
For project submittals that satisfy the basic eligibility guidelines, the base potential TIF rebate award considered would be 70%. The
potential TIF rebate could be increased up to a maximum 90% award for the inclusion of the following qualifying items in the proposed development program.
Historic Rehabilitation Tax Credit
The Federal government encourages the preservation of historic buildings through various means, including Federal tax incentives. The National Park Service administers the program with the Internal Revenue Service in partnership with the Florida Division of Historic Preservation. The tax incentives promote the rehabilitation of historic structures of every period, size, style, and type. The tax incentives for preservation attract private investment to the historic cores of cities and towns. They also generate jobs, enhance property values, and augment revenues for state and local governments through increased property, business, and income taxes.
The Preservation Tax Incentives also help create moderateand low-income housing in historic buildings. Through this program, abandoned and underused schools, warehouses, factories, churches, retail stores, apartments, hotels, houses, and offices throughout the country have been restored to life in a manner that maintains their historic character.
Housing Credit (HC) Program
The HC Program is governed by the U.S. Department of the Treasury and Florida’s allocation is administered by the Florida Housing Finance Corporation. Under the HC Program, successful applicants are provided with a dollar-for-dollar
reduction in federal tax liability in exchange for the development or rehabilitation of units to be occupied by very low- and lowincome households. Developers who cannot use the tax reduction may sell credits in exchange for equity to the development. On a project basis, the amount of credits available is approximately equal to 9% of the cost of building each very low-income unit, including a developer fee but excluding land cost. For certain federally assisted projects (Mortgage Revenue Bonds and Rural Housing) this translates into 4% of building costs. Syndication of the credits to investors can raise equity to pay for 40% or more of a project’s costs.
Pre-Development Loan Program (PLP)
The PLP Program provides below market interest rate financing and technical advisory services to nonprofit organizations and public entities for preliminary development activities necessary to obtain the requisite financing to construct homeownership or rental housing developments.
Rental Housing Mortgage Revenue Bonds (MRB)
The MRB utilizes funds generated from the sale of both taxable and tax-exempt bonds to make below-market interest rate loans to non-profit and for-profit developers of rental housing. Developments that receive tax exempt financing also receive automatic 4% Housing Credits directly from the federal government.
State Housing Initiative Partnership (SHIP)
The SHIP Program’s mission is threefold: (1) provide funding to
eligible local governments for the implementation of programs that create and preserve affordable housing; (2) foster public-private partnerships to create and preserve affordable housing; and, (3) encourage local governments to implement regulatory reforms and promote the development of affordable housing in their communities by using funds as an incentive for private development. Funds are allocated to every Florida County as well as municipalities which receive CDBG funds.
State Apartment Incentive Loan Program (SAIL)
The SAIL Program provides low-interest rate mortgage loans to developers who build or rehabilitate rental developments, made affordable to very low (50% or less of area median) income households. The SAIL loan bridges the gap between a development’s primary financing and total development costs.
Florida Brownfield Program
Brownfield redevelopment is of great importance in Florida where balancing strong economic and community growth with suburban sprawl is an ongoing challenge. The Florida Brownfield Program encourages voluntary cleanup of Brownfield sites by awarding tax credits to partially offset the cost of site rehabilitation or solid waste removal. The following may be available by entering into a Brownfield site rehabilitation agreement (BSRA):
▪ Annual 50% Tax Credit for eligible Site Rehabilitation costs.
▪ One-time 25% Bonus Tax Credit for complete cleanup.
▪ One-time 25% Bonus Tax Credit for development of
100% Affordable Housing or Healthcare Facility/Providers.
▪ One-time 50% Tax Credit for Solid Waste removal.
If the property is located in a designed Brownfield area, it may be eligible for:
▪ Up to $2,500 Job Bonus Tax Refund for each new job created by an eligible business on or abutting a site with a BSRA.
▪ Refunds on Sales Tax paid on the purchase of building materials used for affordable or mixed-use houing projects built on or abutting a BSRA site.
Local Government Distressed Area Matching Grant
Stimulate investment in Florida’s economy by assisting Local Governments in attracting and retaining targeted businesses. The amount awarded by the State of Florida will equal $50,000 or 50% of the local government’s assistance amount, whichever is less, and be provided following the commitment and payment of that assistance.
Economic Development Transportation Funds
A State of Florida program designed to alleviate transportation problems that adversely impact a specific company’s location or expansion decision. Eligible projects are those that facilitate economic development by eradicating location-specific transportation problems on behalf of a specific eligible company.
Capital Investment Tax Credit (CITC)
CITC is used to spur capital investment in Florida’s High
Impact Sectors. It is an annual credit, provided for up to 20 years, against the corporate income tax. The amount of the annual credit is based on the eligible capital costs associated with a qualifying project. Eligible capital costs include all expenses incurred in the acquisition, construction, installation, and equipping of a project form the beginning of construction to the commencement of operations.
High Impact Performance Incentive Grant (HIPI)
Negotiated grant used to attract and grow major high impact facilities in Florida. Grants are provided to pre-approved applicants in certain high-impact sectors designated by the Florida Department of Economic Opportunity (DEO).
Sales and Tax Use Exemptions on Machinery and Equipment
This exemption is for sales and use taxes paid on the purchase of new machinery and equipment used (directly related) to produce a product for sale. This program is administered through the Florida Department of Revenue. Program is for manufacturing and printing businesses or businesses which use a portion of a manufacturing process that are relocating to the area, opening a new facility or expanding.
Sales Tax Exemption on Electricity Used in Manufacturing Process
There is an exemption on the 7% sales tax for electricity used in the manufacturing process (if 75% or more of electricity is used in manufacturing). Exemption is managed through the Florida Department of Revenue.
Work Opportunity Tax Credit (WOTC)
The WOTC is a federal income tax credit that provides incentives to private for-profit employers to encourage the hiring of individuals from certain targeted groups of jobseekers who traditionally have difficulty finding employment. Employers can reduce their federal income tax liability up to $9,600 during the first year of employment of a member of targeted group, depending on the target group.
There is no limit to the number of qualified employers for which an employer receives this tax credit.
Incumbent Worker Training (IWT)
IWT provides training to currently employed workers to keep Florida’s workforce competitive in a global economy and to retain existing businesses. The program is available to all Florida businesses that have been in operation for at least one year prior to application and
require skills upgrade training for existing employees. Priority is given to businesses in targeted industries, Enterprise Zones, HUB Zones, Inner City Distressed areas, Rural Counties and areas, and Brownfield areas.
This list is not intented to be all inclusive put does provide an overview of available funding sources for various redevelopment and economic development programs.
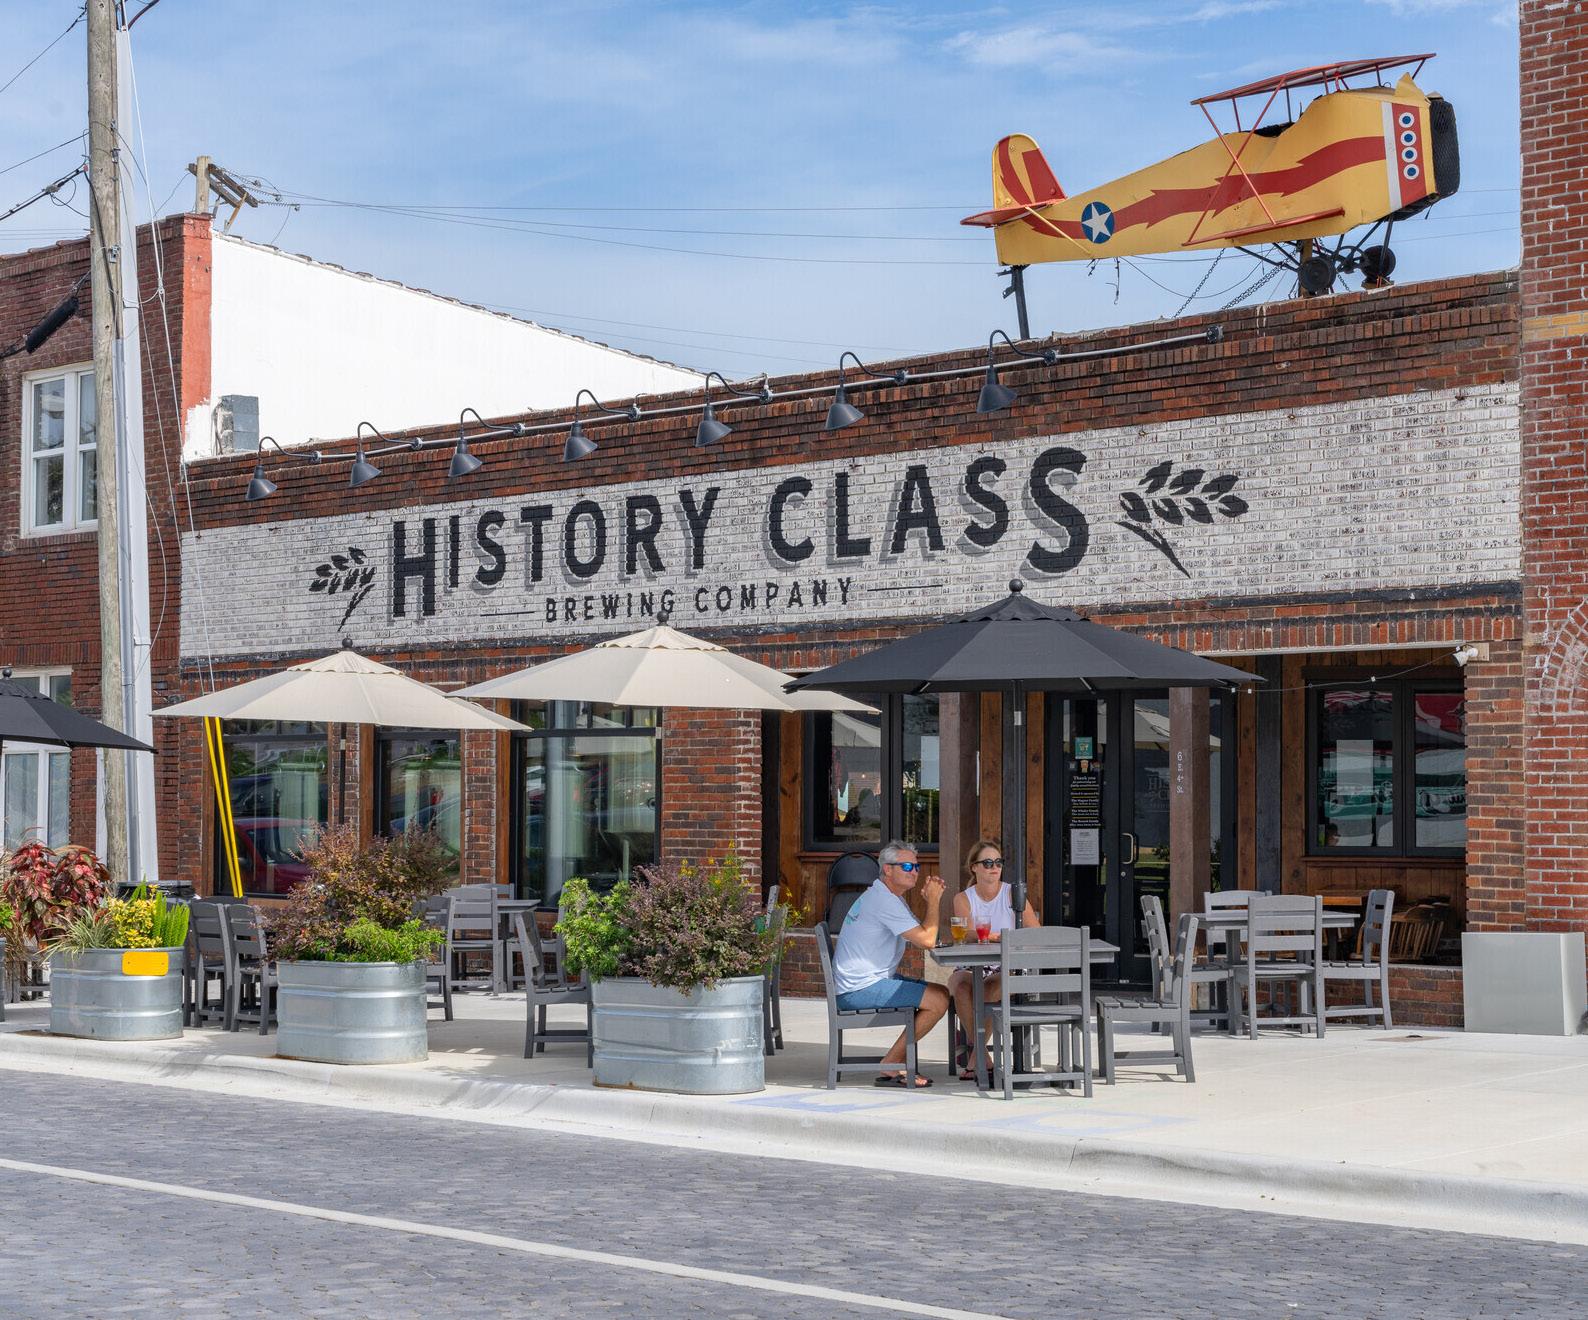
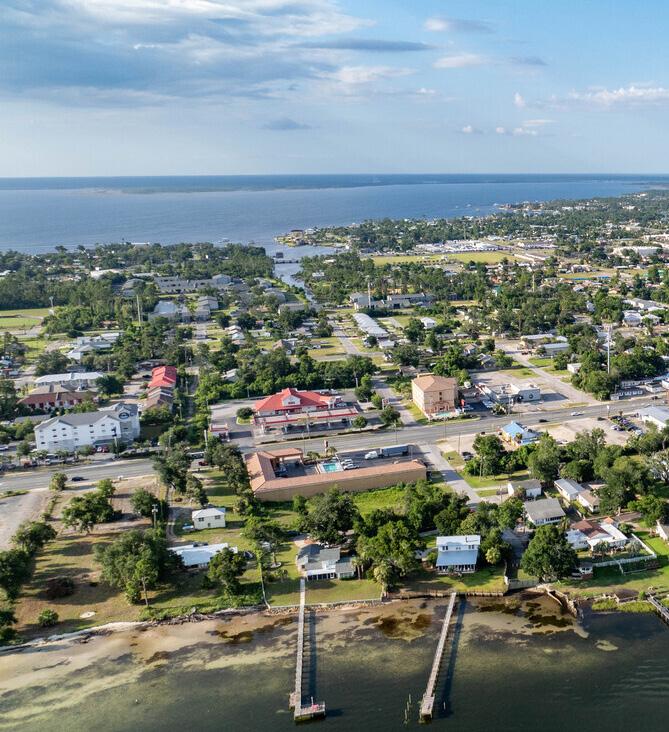
REDEVELOPMENT PLAN IMPLEMENTATION
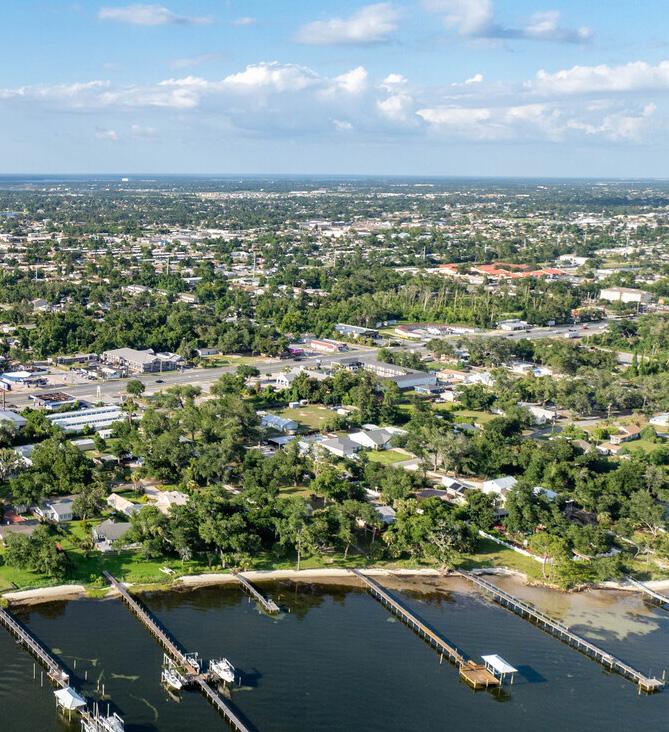
CHAPTER SEVEN:
REDEVELOPMENT PLAN IMPLEMENTATION
RECOMMENDED STRATEGIES FOR IMPLEMENTATION
Overview
The purpose of these 2025 Community Redevelopment Area Plan Amendments and Comprehensive Updates (“2025 Plan”) is to provide an update of the most recent Downtown CRA and Millville CRA Redevelopment Plan(s), as well as to provide a modification and update to include adopted expansions of the Downtown North and St. Andrews CRAs.
This 2025 Plan recaps basic contents, projects, and milestones to strengthen the foundation for renewed objectives, programs, and proposed funding allocations going forward. This 2025 Plan continues to address many of
the past priorities and guiding principles as well as focusing on the four overarching major goals which were identified through the most recent public engagement efforts, these major goals include:
▪ Create Complete Neighborhoods
▪ Create Great Streets
▪ Create Resilient Open Spaces and Infrastructure
▪ Create Sustainable Coordination and Implementation
The identification of these major goals was highly influential in developing the recommended strategies for implementation described in the following pages.
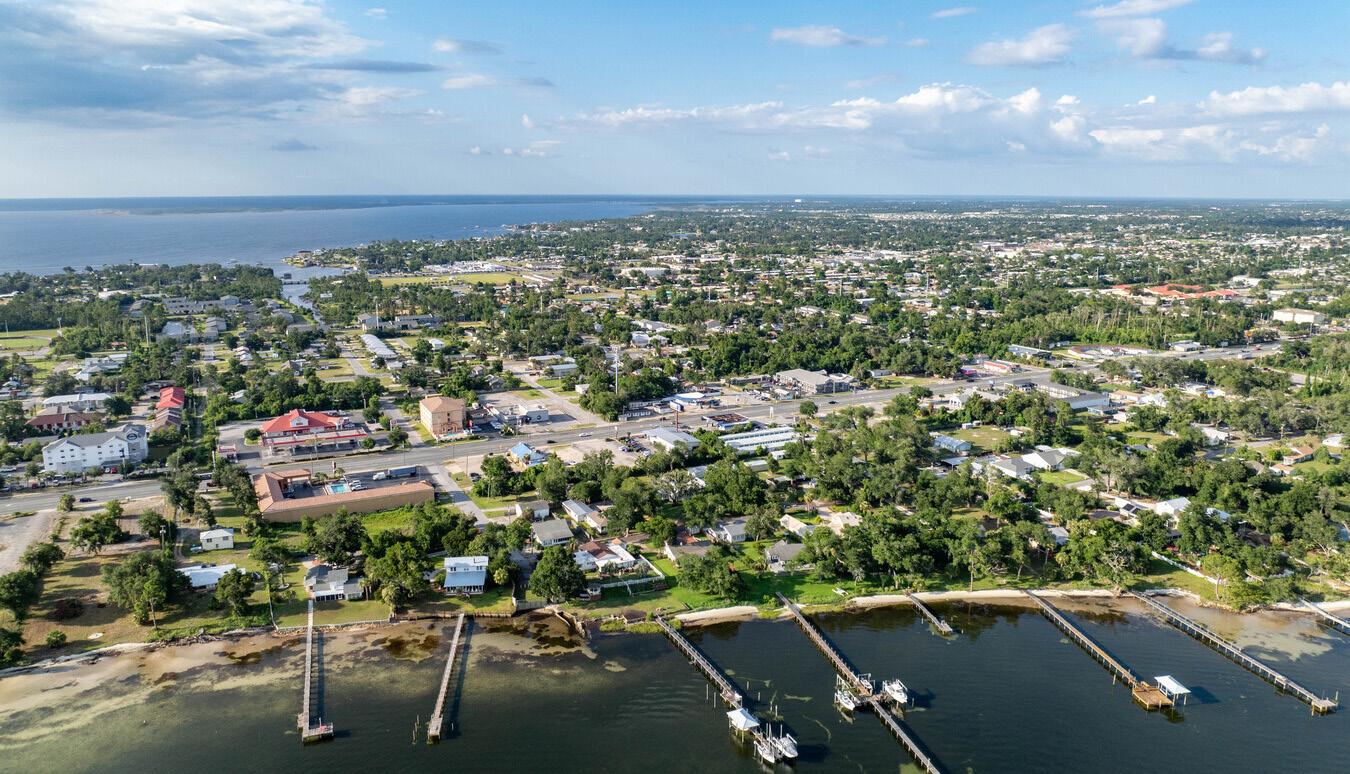
Chapter 163 emphasizes the importance of maintaining the existing tax base through purposeful redevelopment actions.
This 2025 Plan details a series of recommended investments or activities and a proposed funding allocation for each of the four CRA districts, aligned with projected revenues.
Administrative
The Agency will maintain the requisite administrative and financial mechanisms to ensure the continued cost-effective operations of the Community Redevelopment Agency.
▪ The Agency shall continue to utilize funding derived from tax increment fund revenues and other sources where appropriate, to fund capital improvements, programs and activities identified in the Redevelopment Plan.
▪ The Agency shall coordinate with the Panama City Manager’s Office, Planning Department, and Finance Department to develop cost effective, annual budgets and work programs that will provide administrative and operational support for Community Redevelopment Agency activities.
▪ Evaluate and update the Agency's Redevelopment Plan(s) every 10-years.
▪ Monitor amendments to Chapter 163 of Florida Statutes to ensure that all programs, projects, activities, and expenditures of funds from the redevelopment trust fund undertaken by the Agency are in compliance with the Redevelopment Act.
▪ Update Capital Improvement Program as well as all other project and program funding allocations on an annual basis.
▪ The 30-year operational term of the Agency began in 1984 and was extended an additional 30-year term in 2014, therefore the Agency will “sunset” in 2044. An assessment of the Agency’s projects, programs, and related activities should be conducted within the first 5 years following adoption of this 2025 Plan.
The Agency shall adhere to Annual Reporting, Audits and other Special District reporting requirements as prescribed by the Florida Statutes.
▪ The Agency and its operations shall be reviewed annually as part of Panama City’s Annual Comprehensive Financial Report ("ACFR").
▪ Information from the ACFR shall be incorporated into the Agency’s Annual Report documents.
▪ Provide for a financial audit of the redevelopment trust fund to be conducted each fiscal year by an independent certified public accountant or
firm as required by Chapter 163.387(8)(a) of Florida Statutes.
The Agency shall enhance community presence and increase community awareness.
▪ The Agency shall use social media to disseminate information regarding new initiatives.
▪ The Agency shall maintain and keep current its social media presence as part of its annual operational and administrative activities.
The Agency shall identify community stakeholders and partners to assist in the implementation of the Redevelopment Plan Goals, Objectives and Projects.
▪ The Agency shall contract with professional firms or organizations to implement specific Goals, Objectives and Policies in accordance with Florida Statute requirements and relevant determinations from the Florida Attorney General’s Office.
The Agency shall enable and support the professional redevelopment training and education of Agency Staff to stay current and aware of the latest redevelopment programming, state reporting requirements, redevelopment opportunities and changes to applicable state statutes.
▪ The Agency Staff shall notify Agency Board members of community redevelopment training programs provided by the Florida Redevelopment Association and support CRA Board members’ attendance.
▪ The Agency shall encourage and support the attendance of Agency Board and staff at the Annual Conference of the Florida Redevelopment Association for professional redevelopment training and to become aware of best practices.
Regulatory Environment
The Agency shall coordinate with the Panama City Planning and Economic Development Department to evaluate development applications for their adherence and compliance CRA specific guidelines and standards.
▪ The Agency shall work with Panama City Development Services to identify current or pending applications for development within the Agency’s four CRA districts.
▪ The Agency Staff shall attend Panama City Planning and Economic Development Department pre-application and Development Review Committee meetings for development applications whose projects are located within the Agency’s four CRA districts.
COMMUNITY IMPACT STATEMENT
This section of the Redevelopment Plan addresses the requirements of Chapter 163 Part III of the Florida Statutes, Sections 163.360 and 163.362.
The implementation of the Redevelopment Plan will foster many positive impacts to the quality of life in the Community Redevelopment Areas and surrounding communities. Neighborhoods will benefit from the redevelopment programming, through the development of new and the improvement of existing housing
Relocation
To minimize relocation impacts, the Agency will provide supportive services and equitable financial treatment to any individuals, families, and businesses subject to relocation. When feasible, the relocation impact will be mitigated by assisting relocation within the immediate neighborhood and by seeking opportunities to relocate within new/redeveloped buildings that will contain residential and commercial space.
Residential Development
There are residential uses of various types and character, including, single-family, multifamily, rental units, owner occupied units, and detached units in existence within the Community Redevelopment Areas. The efforts undertaken by the Agency, as described in this Redevelopment Plan, are intended to retain and enhance a high quality of residential use, particularly with regard to developing and maintaining sustainable neighborhoods.
stock, improvements to public infrastructure, pedestrian safety and intersection improvements, and other improvements to the public realm. These activities are to address conditions of Slum and Blight that were found present in the Community Redevelopment Areas.
Successfully addressing the conditions of blight will improve the quality of life for residents, businesses and visitors. The redevelopment activities and public realm improvements will also improve the economic
Redevelopment program activities will strive to cultivate the positive neighborhood characteristics cited by the community and reduce or eliminate negative characteristics.
The establishment of a revitalized and expanded residential base within the Community Redevelopment Areas is essential to achieve a successful economic redevelopment program. Residents living within the Community Redevelopment Areas will comprise components of the work force and the market, which will generate economic activity.
The efforts undertaken by the Agency, as described in this Redevelopment Plan, are intended to encourage the continued residential uses within the CRAs and encourage homeownership, fix up, and repair.
Affordable Housing
This Redevelopment Plan supports the identification of potential sites for the development of affordable renter-occupied and owner-
environment for business owners, employers and workers within the City of Panama City, neighboring cities, and Bay County more broadly.
While all impacts cannot be determined without sitespecific proposals from which to evaluate potential impacts, the following section presents the range of potential impacts that may be anticipated to occur in the categories required by Chapter 163 Part III of the Florida Statutes, Sections 163.360 and 163.362.
occupied housing in concert with community housing development agencies. Programming that enhances the buying power of the low and moderate-income home buyers are also strategies contemplated within this Redevelopment Plan.
Employment
The long-term implementation of this Redevelopment Plan is anticipated to increase employment activities within the Community Redevelopment Areas and increase employment opportunities for residents. Small business development is a key factor to providing a stronger, more diverse employment base that is more resistant to fluctuating economic cycles and decisions regarding capital mobility. This Redevelopment Plan supports the establishment and revitalization of neighborhood commercial, retail, hospitality and office uses in appropriate locations throughout the Community Redevelopment Areas.
Transportation
This Redevelopment Plan proposes streetscape improvements, pedestrian improvements and improved bicyclist amenities throughout the Community Redevelopment Areas. These projects will maintain or improve traffic circulation and parking as well as the flow of through traffic while enhancing the pedestrian character of the Community Redevelopment Areas.
Future streetscape projects will emphasize the provision of enhanced pedestrian facilities and bicycle facilities. While through traffic capacity is maintained, the pedestrian environment will be enhanced, and bicycle facilities expanded. Neighborhood revitalization incorporating new local employment is expected to provide some relief to traffic congestion by fostering the development of traditional neighborhood characteristics.
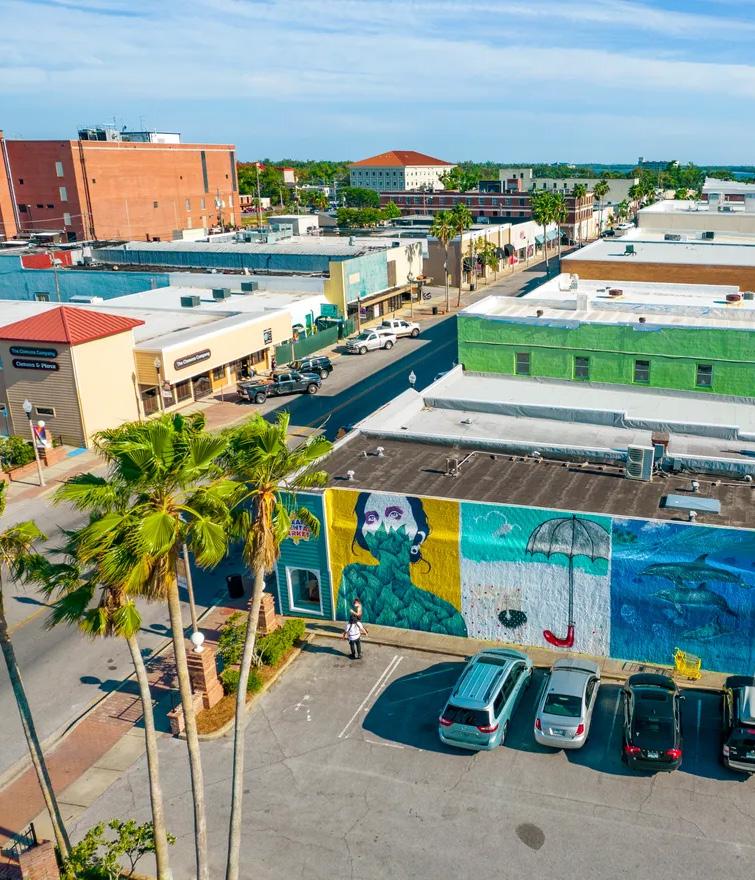
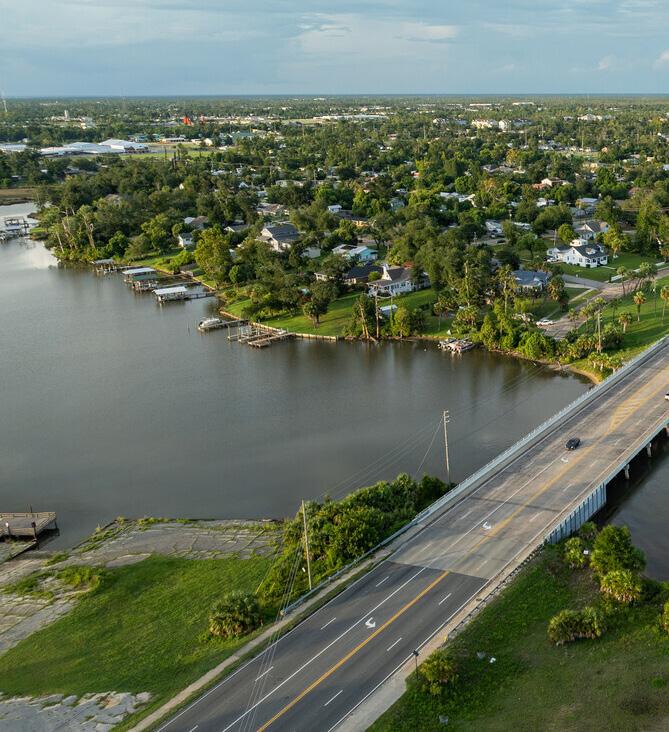
APPENDIX
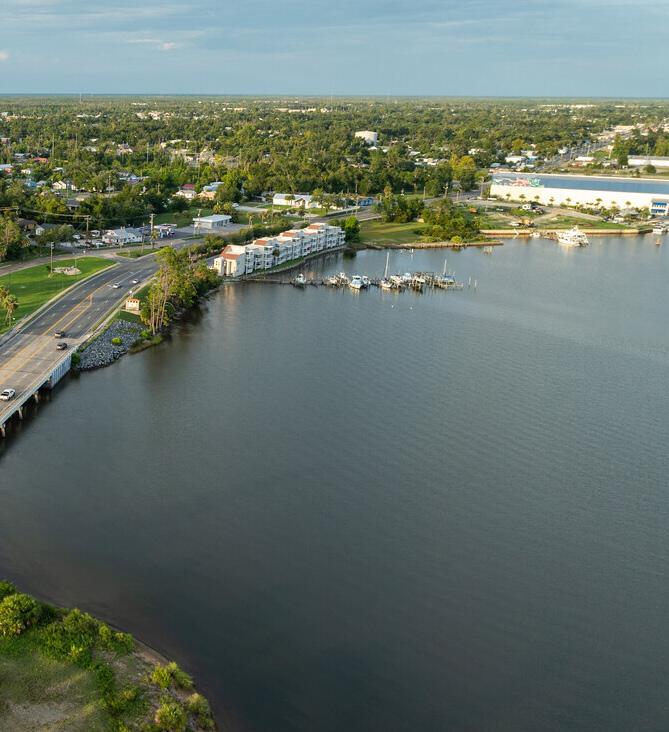
LEGAL DESCRIPTIONS
Downtown CRA (1984)
Located in Panama City, Bay County, Florida, and more generally described as follows:
BEGINNING at the point of intersection of the northerly right-of-way of 7th Street and easterly right-of-way line of the alley 100 feet east of Allen Avenue; thence southerly along the extension of the easterly right-of-way line of said alley to its intersection with the waterfront of Massalina Bayou; thence generally westerly and southerly along the waterfront of the Bayou, Bayfront, Marina, and Bayfront west of the Marina to the intersection with the westerly right-of-way of Mercer Avenue; thence northeasterly along the westerly right-of-way line of Mercer Avenue to the northerly right-of-way line of 5th Street; thence easterly along the northerly right- of-way line of 5th Street to the westerly right-of-way line of Jenks Avenue; thence northerly along the westerly rightof-way line of Jenks Avenue to the northerly right-of-way of 8th Street; thence easterly along the northerly right-of-way line of 8th Street to the easterly right-of-way line of Magnolia Avenue; thence southerly along the easterly right-of-way line of Magnolia Avenue to the northerly right-of-way line of 7th Street; thence easterly along the northerly right-of-way line of 7th Street to the point of BEGINNING.
SOURCE: PANAMA CITY COMMUNITY REDEVELOPMENT AGENCY | DOWNTOWN CRA PLAN UPDATE - FINAL DECEMBER 2012
St. Andrews CRA (1989)
St. Andrews Redevelopment Study Area consists of approximately 50 square blocks anchored on the south by the St. Andrews Marina, and anchored on the north by U.S. Highway 98.
The boundary of the St. Andrews Redevelopment Study Area may be described as follows:
BEGINNING at the point of intersection of the westerly right-of-way line of Drake Avenue with the waterfront of St. Andrews Bay; thence northerly along the westerly right-of-way line of Drake Avenue to a point 260 feet south of the southerly right-of- way line of 15th Street; thence easterly to the easterly right-of-way line of Hickory Avenue; thence southerly to a point 190 feet north of the northerly right-of-way line of 14th Street; thence easterly to the westerly right-of-way line of Foster Avenue; thence northerly to a point 260 feet north of the northerly right-of-way line of 15th Street; thence westerly to a point 140 feet west of the westerly right-ofway line of Wilmont Avenue; thence northerly to the southerly right-of-way line of 16th Street; thence westerly to the westerly right-of-way line of Chestnut Avenue; thence northerly to a point 280 feet south of the southerly right- of-way line of 17th Street; thence westerly to a point 140 west of the westerly right-of-way line of Chestnut Avenue; thence northerly to the southerly right-of-way line of 17th Street; thence westerly to westerly right-of-way line of Beck Avenue; thence northerly to a point 270 feet south of the southerly right-of-way line of 18th Street; thence westerly to the westerly right-of-way line of Bayview Avenue; thence northerly to the southerly right-of-way line of 18th Street; thence westerly to the easterly right- of-way line of Lake Avenue; thence northerly to a point 455 fect south of the southerly right-of-way line of 19th Street; thence westerly to the westerly right-of-way line of Deer Avenue; thence northerly to a point 420 feet south of the southerly rightof- way line of 19th Street; thence westerly to the easterly right-of-way line of Molitor Avenue; thence southerly to a point 290 feet north of the northerly right-of-way line of 17th Street; thence easterly to the easterly rightof-way line of Deer Avenue; thence southerly to a point 250 feet north of the northerly right-of-way line of 17th Street; thence easterly to a point 150 feet cast of the easterly right-of-way line of Lake Avenue; thence southerly to the northerly right-of-way line of 17th Street; thence easterly to the easterly right-of-way line of Cincinnati Avenue; thence southerly to the northerly right-of-way line of 15th Street; thence easterly to the easterly right-of-way line of Bayview Avenue; thence southerly to the southerly right-of-way line of 13th Street; thence westerly to the point of intersection with the waterfront of St. Andrews Bay; thence southerly and easterly along the waterfront to the point of BEGINNING.
SOURCE: PANAMA CITY COMMUNITY REDEVELOPMENT AGENCY | ST. ANDREWS CRA PLAN UPDATE - FINAL JUNE 2018
St. Andrews CRA (2024 - Westerly Expansion Area)
The boundary of the St. Andrews Westerly Expansion Redevelopment Study Area is described as follows:
Begin at the at the centerline of right of way intersection of Drake Ave and Twelfth Street thence easterly along the centerline of right of way of Twelfth Street to the centerline of right of way intersection of Foster Avenue and Twelfth Street; thence northerly along the centerline of right of way of Foster Avenue to a point 260 feet more or less north of the northerly right of way line of Fifteenth Street; thence westerly to a point 140 feet west of the westerly right of way line of Wilmont Avenue; thence northerly to the southerly right of way line of Sixteenth Street; thence westerly to the westerly right of way line of Chestnut Avenue; thence northerly to a point 280 feet south of the southerly right of way line of Seventeenth Street; thence westerly to a point 140 feet west; of the westerly right of way line of Chestnut Avenue; thence northerly to the southerly right of way line of Seventeenth Street; thence westerly to the westerly right of way line of Beck Avenue; thence northerly to a point 270 feet south of the southerly right of way line of Eighteenth Street; thence westerly to the westerly right of way line of Bayview Avenue; thence northerly to the southerly right of way line of Eighteenth Street; thence westerly to the easterly right of way line of Lake Avenue; thence northerly to a point 455 feet south of the southerly right of way line of Nineteenth Street; thence westerly to the westerly right of way line of Moliter Avenue; thence southerly to a point 290 feet north of the northerly right of way line of Seventeenth Street; thence easterly to a point 160 feet, more or less east of Lake Avenue; thence southerly to the centerline of right of way of Seventeenth Street; thence westerly along the centerline of right of way of Seventeenth Street to the centerline of right of way intersection of Mound Avenue and Seventeenth Street; thence northerly to the centerline of right of way intersection of Mound Avenue and Seventeenth Street; thence westerly to the centerline right of way intersection of Danford Avenue and Seventeenth Street; thence southerly to the waterfront of St. Andrews Bay; thence southwesterly along said waterfront of St. Andrews Bay to a point 35 feet more or less west of Hannah Avenue; thence northerly 1160 feet more or less; thence northwesterly 560 feet,more or less, to the southeasterly right of way line of twenty third street; thence northeasterly along said right of way line of Twenty Third Street to the centerline of right way line of Bay Line Railroad; thence easterly and northeasterly along said centerline of right of way of Bay Line Railroad to a point on the northwesterly extension of the centerline right of way of Drake Avenue; thence southeasterly and southerly along the centerline of right of way of Drake Avenue and northwesterly extension thereof to the centerline of right of way intersection of Drake Avenue and Sixteenth Street; thence easterly along the centerline of right of way of Sixteenth Street to the centerline of right of way intersection of Foster Avenue and Sixteenth Street; thence southerly along the centerline of right of way of Foster Ave to a point 320 feet, more or less, south of the centerline of right of way of Fifteenth Street; thence westerly to the centerline of right of way of Drake Avenue; thence southerly to the point of BEGINNING.
SOURCE: PANAMA CITY COMMUNITY REDEVELOPMENT AGENCY
St. Andrews CRA (2024 - Easterly Expansion Area)
The boundary of the St. Andrews Easterly Expansion Redevelopment Study Area is described as follows:
Begin at the centerline of right of way intersection of Foster Avenue and Fourteenth Street; thence northerly along the centerline of right of way of Foster Avenue to the centerline of right of way intersection off Foster Avenue and Sixteenth Street; thence westerly along the centerline of right of way of Sixteenth Street to the centerline of right of way intersection of Drake Avenue and Sixteenth Street; thence northerly along the centerline of right of way of Drake Avenue to the centerline of right of way intersection of Drake Avenue and Seventeenth Street; thence easterly along the centerline of right of way of Seventeenth Street to the centerline of right of way intersection of Gulf Avenue and Seventeenth Street; thence southerly along centerline of right of way of Gulf Avenue to the centerline of right of way intersection of Gulf Avenue and Fourteenth Street; thence westerly along the centerline of right of way of Fourteenth Street to the point of BEGINNING.
SOURCE: PANAMA CITY COMMUNITY REDEVELOPMENT AGENCY
Downtown North CRA (1993)
The following is legal description of the boundaries of the Downtown North Community Redevelopment Area, as contained in Appendix A of the Downtown North Redevelopment Plan (1993):
Commence at the Southeast Corner of the Southeast Quarter (SE1/4) of Section 5, Township 4 South, Range 14 West. Thence West 30 feet, thence North 30 feet to the intersection of the center line of 8th Street; Thence West along the center line of 8th Street 1170 feet more or less to the center line of Jenks Avenue; Thence South along the center line of Jenks Avenue 2080 feet more or less to center line of Mercer Avenue; Thence southwesterly along the extended center line of Mercer Avenue a distance of 960 feet more or less to the intersection with the waterfront of St. Andrew Bay; Thence meandering Easterly and Northerly along the East edge of Johnson Bayou; Thence meandering Easterly and Northerly along the East edge of Johnson Bayou to the intersection of the extension of State Avenue; Thence North 2370 feet more or less to the center line of the extension of 12th Street; Thence East along the center line of 12th Street 7180 feet more or less to the center line of North end of Watson Bayou Tributary; Thence meandering Southerly along said center line and along the center line of Watson Bayou Channel to the intersection with the centerline of Business Highway 98 (State Road 30); Thence West along the center line of Business Highway 98 (State Road 30) 450 feet more or less to the intersection of center line of 4th Street; Thence southwesterly and west 3660 feet more or less along the center line of 4th Street to the intersection of the center of the channel of Massalina Bayou; Thence meandering North along the center of the channel of Massalina Bayou to the intersection of the extension of the center line of Allen Avenue; Thence North along the center line of Allen Avenue 890 feet more or less to the center line of 7th Street; Thence West along the center line of 7th Street 1180 feet more or less to the intersection of the center line of Magnolia Avenue to the point of BEGINNING.
SOURCE: PANAMA CITY COMMUNITY REDEVELOPMENT AGENCY | DOWNTOWN NORTH CRA PLAN UPDATE - FINAL APRIL 2009
Downtown North CRA (2007)
The boundary of the Downtown North Redevelopment 2007 Expansion Area may be described as follows:
Commence at the intersection of 12th Street and McKenzie Avenue for the Point of Beginning. Thence North 2,815 feet more or less along the center line and extended center line of McKenzie Avenue to the southerly right-of-way line of U.S. Hwy. 231, Thence Northeasterly 4,765 feet more or less along Southerly right-of-way of U.S. Hwy. 231 to the northerly extended center line of Mercedes Avenue, Thence South 5,915 feet more or less along the northerly extended center line and center line of Mercedes Avenue to the center line of 12th Street, Thence West along the center line of 12th Street 3,700 feet more or less to the center line of McKenzie Avenue and the point of BEGINNING.
SOURCE: PANAMA CITY COMMUNITY REDEVELOPMENT AGENCY | PANAMA CITY RESOLUTION NO. 111307.1
Downtown North CRA (2018)
The boundary of the Downtown North Redevelopment 2018 Expansion Area may be described as follows:
Beginning in the centerline of right of way intersection of Mckenzie Avenue and Twelfth Street; thence west along said centerline of right of way of Twelfth Street to a point 20 feet, more or less, west of the centerline of right of way of Bell Avenue; thence north to a point, parallel to and 20 feet west, more or less, of the centerline of right of way of Bell Avenue and 110 feet north, more or less of the centerline of right of way of Thirteenth Street; thence northwesterly and parallel to and 60 feet, more or less, southeasterly of the curving centerline of right of way of Bay Line Railroad to a point 760 feet, more or less west of the centerline of right of way of Jenks Avenue; thence northeasterly to a point 500 feet, more or less east of the centerline of right of way of Harrison Avenue and 60 feet, more or less, perpendicular southeasterly of the centerline of right of way of highway 231; thence south to a point 340 feet, more or less, north of the centerline of right of way of Fifteenth Street and 500 feet, more or less, east of the centerline of right of way of Harrison Avenue ; thence east to a point 735 feet, more or less, east of the centerline of right of way of Harrison Avenue and 340 feet north of the centerline of right of way of Fifteenth Street; thence south to a point 50 feet, more or less, north of the centerline of right of way of Fifteenth Street and 735 feet east of the centerline intersection of Harrison Avenue and Fifteenth Street; thence southeasterly to the centerline intersection of Mckenzie Avenue and Fifteenth Street; thence south along the centerline of right of way of Mckenzie Avenue to the point of BEGINNING.
SOURCE: PANAMA CITY COMMUNITY REDEVELOPMENT AGENCY
Downtown North CRA (2021 - Expansion Area A)
The boundary of the Downtown North Redevelopment 2021 Expansion Area A (Panama City Mall) may be described as follows:
Beginning at the intersection of the south right of way line of 23rd Street, and the east right of way line of Martin Luther King JR. Blvd., Thence east along said right of way line of 23rd Street to a point to the southerly extension of the centerline of right of way of Palo Alto Avenue, thence south to the northwesterly right of way line of Hwy 231, thence southwesterly along said right of way line of Hwy 231 to a point 130 feet east, more or less, of the centerline of right of way of Martin Luther King JR. Blvd., Thence northwesterly to the east right of way line of Martin Luther King JR. Blvd. to a point 190 feet north, more or less, of the centerline of highway 231; thence north along said east right of way line of Martin Luther King JR. Blvd., To the point of BEGINNING.
SOURCE: PANAMA CITY COMMUNITY REDEVELOPMENT AGENCY
Downtown North CRA (2021 - Expansion Area B)
The boundary of the Downtown North Redevelopment 2021 Expansion Area B (Eastern Expansion Area) may be described as follows:
Beginning in the centerline of right of way of Redwood Avenue, 670 feet, more or less, north of the centerline of right of way intersection of Eleventh Street and Redwood Avenue; thence north along the centerline of right of way of Redwood Avenue to a point 630 feet, more or less, south of the centerline of right of way intersection of Redwood Avenue and Fourteenth Street; thence west to a point on the southerly extension of the centerline of right of way of Mercedes Avenue 360 feet, more or less, south of the centerline intersection of Mercedes Avenue and Thirteenth Court; thence north along said southerly extension of the centerline of right of way of Mercedes Avenue and the centerline of right of way of Mercedes Avenue and the northerly extension of the centerline of right of way of Mercedes Avenue to the southeasterly right of way line of Highway 231 and the northwesterly right of way line of Bay Line Railroad; thence northeasterly 340 feet, more or less, to a point 180 feet, more or less, perpendicular southeasterly from the centerline of right of way of Highway 231 and 700 feet west of the centerline intersection of Industrial Drive; thence east to a point 20 feet, more or less, east of the center line of railroad tracks of Bay Line Railroad tracks and 250 feet south of the centerline intersection of Industrial Drive; thence south to a point on the northerly extension of the centerline of right of way of Bay Ave 1650 feet, more or less north of the centerline of intersection of Bay Avenue and Fifteenth Street; thence southeasterly to a point 40 feet, more or less, perpendicular southwesterly of the centerline of railroad tracks of Bay Line Railroad and 1220 feet north, more or less, of the centerline of right of way of Fifteenth Street and 1360 west of the centerline of right of way of Maple Avenue; thence south to a point 610 feet east of the centerline of intersection of right of way of Bay Avenue and Fifteenth Street; thence east along the centerline of right of way of Fifteenth Street to the centerline intersection of Maple Ave and Fifteenth Street; thence southeasterly to a point 310 feet, more or less, west of the centerline of right of way intersection of Sherman Avenue and Thirteenth Street; thence west to a point 320 feet, more or less, east of the centerline right of way of Redwood Avenue; thence south to a point 320 feet east, more or less, of the point of beginning; thence west to the point of BEGINNING.
SOURCE: PANAMA CITY COMMUNITY REDEVELOPMENT AGENCY.
Millville CRA (2004)
The boundary of the Millville Redevelopment Study Area may be described as follows:
Commence at the intersection of the centerlines of 3rd Street and Mercedes Avenue for the Point of Beginning; thence North along the said centerline of Mercedes Avenue to the centerline of 4th Street; thence Northeast along the said centerline of 4th Street to the centerline of U.S. Highway 98; thence East along the said centerline of U.S. Highway 98 to the Easterly waters edge of Watson Bayou; thence Northerly along the Easterly waters edge of Watson Bayou to a point of intersection with the Westerly extension of the centerline of 7th Street; thence East along the said Westerly centerline extension of 7th Street to the existing centerline of 7th Street; thence continue East along the said centerline and centerline extension of 7th Street to the East right of way line of Everitt Avenue; thence South along said East right of way line of Everitt Avenue to the centerline of Cherry Street; thence West along said centerline of Cherry Street to the centerline of East Avenue; thence South along the said centerline of East Avenue and the extension of East Avenue centerline to the waters edge of St. Andrews Bay; thence Westerly and Northerly along said waters edge of St. Andrews Bay and Watson Bayou to a point of intersection with the Easterly extension of the centerline of 3rd Street; thence West along the said extension of 3rd Street centerline to the existing centerline of 3rd Street; thence continue West along the centerline of said existing 3rd Street to the centerline of Mercedes Avenue, also being the Point of Beginning. Located and being in Bay County, Florida.
SOURCE:
[ THIS PAGE INTENTIONALLY LEFT BLANK ]
EXISTING CONDITIONS REGULATORY REVIEW
Land Development Code (LDC) and Regulations
Chapter 104 Zoning Districts
Sec. 104-33 - Downtown District (DTD) Zoning District
▪ The purpose of this zoning district is to provide for the vitality of downtown Panama City as a safe walkable community of business, residential, commercial, cultural, and other land uses while protecting the environment and enhancing the quality of life. To encourage and promote economic growth and redevelopment downtown, higher residential density and non-residential intensities may be achievable within the Downtown District through development bonuses.
▪ (4) Height – height enhancement criteria may be leveraged to allow higher building heights for redevelopment projects that may require it.
– Parking setbacks for front and side street could be minimized where it may support streetscape projects.
– No minimum building setback requirements.
Sec. 104-34 - St. Andrew’s District (StAD) Zoning District
▪ The purpose of this zoning district is to preserve the working waterfront and eclectic nature of the StAD. Redevelopment of the area is encouraged- with uses including business, residential, commercial, cultural, and entertainment, including public green spaces.
– Bulk requirements do not call for minimum setbacks.
▪ Additional requirements for buildings to: Maintain and promote the historic architectural character through the scale and massing of buildings. New construction shall utilize historic design elements that are complimentary to the neighborhood character. Renovations to existing buildings shall retain historic elements and/or add historic elements in keeping with the historic look and character of the area.
Sec. 104-35 - Millville Downtown District (MDTD) Zoning District
▪ The purpose of this zoning district is to preserve the eclectic nature of Millville’s 3rd Street Commercial Area. Redevelopment of the area is encouraged-with uses encompassing business, residential, commercial, cultural, and entertainment.
▪ District does not have any minimum setback requirements.
Sec. 104-41 - Planned Unit Development (PUD)
▪ The purpose and intent of a planned unit development (PUD) zoning district is to promote innovative and sustainable development. In order to achieve such purpose and intent, the PUD zoning district provides a regulatory vehicle for relief from the strict adherence to the requirements of the city’s
Unified Land Development Code in exchange for development that provides substantial public benefits which justify such relief.
▪ Minimum objectives that each PUD zoning district will achieve that could support future CRA development or redevelopment include:
– Encourage developers to exercise greater ingenuity and imagination in the planning and development or redevelopment of land under unified control than generally is possible under the more traditional zoning regulations.
– To promote the enhancement of housing, employment, shopping, traffic circulation, recreational opportunities for the people of the city.
– Allow a diversification of uses, structures and open space in a manner compatible with both the existing and approved development of land surrounding the PUD site.
– Provide a means for land to be used more efficiently, and for utilization of smaller networks of utilities and streets.
Sec. 104-64 - St. Andrew’s Historic Treatment Zone
▪ The purpose of this zone is to encourage a compatible revitalization and redevelopment of properties in the St. Andrews historic district through development of vacant parcels and the redevelopment of existing properties. To accomplish this
purpose, the city may reduce the minimum lot size and front and rear setback requirements to ensure conformity with the scale and character of the existing structures within the district.
– Flexibility in minimum lot size and rear setback requirements may support specific development plans for the St. Andrew’s CRA area.
Chapter 108 Parking and Loading
Sec. 108-1 - Off-street parking and loading: requirements for businesses in regard to off-street parking, loading and unloading, and for handicapped parking.
▪ Off-street parking is required for the Millville District, the St. Andrew’s District, but not for the Downtown District.
▪ Deferred parking may be granted by City Commission as outlined in Sec. 108-3. Criteria for differed parking is listed; may require a deferred parking plan.
▪ Bicycle parking standards. Off-street parking reduction for bicycle parking is allowed and described here.
▪ Compact car parking may be provided only to nonresidential land uses.
▪ Parking structures are allowed in DTD, StAD, but not the MDTD.
All CRA zoning districts have a lot coverage maximum of 100%, and a maximum floor area ratio of 5.0. StAD and MDTD have a density of 35 dwelling units per acre, while DTD has a density of
60 dwelling units per acre. Each district has a different maximum building height requirement, it is 150’ for DTD, 125’ for StAD, and 60’ for MDTD.
Chapter 105 Design Standards
Sec. 105-14 - Outdoor Dining
▪ The City encourages outdoor dining as a support for a pedestrian-oriented environment that helps to create a visually attractive atmosphere and streetscape, and promotes overall commerce.
▪ Declarations outline regulations for the issuance of outdoor dining permits, application and fees for receiving a permit, and application review. Application review enforces design standards that include requirements for setbacks, materials, dividers, and signage.
Sec. 105-15 - Neighborhood District Building Design Standards
▪ Ordinance No. 3015 adds to Chapter 104 Article I: The Neighborhood Districts (ND, NG, and NR) may be requested for use in the Neighborhood Plans study areas for Glenwood, Millville, and St Andrews. These zoning districts enable the development of Missing Middle Housing.
▪ Bulk regulations for the ND, NG, and NR zoning districts can be located in Sec. 104-36.1 – 10436.3 of the land development code.
▪ Neighborhood District building design standards which apply to Neighborhood Downtown (ND) and Neighborhood General (NG) include requirements for building facades, centerlines, structure, liner buildings, entrances, wall materials, and garden walls and fences.
Chapter
107 Landscaping and Buffering
Sec. 107-3 - Landscaped Buffers
▪ This section outlines buffer requirements between allowable uses. According to Table 107-1, Commercial land uses must maintain a 10 ft. wide landscape buffer between industrial uses and residential uses.
Sec. 107-4 - Landscape Requirements for Off-Street Parking and Vehicle Use Area
▪ This section states that in all districts, except single-family dwelling uses, ten percent of the impervious areas used for vehicle use areas or offstreet parking, except for ingress and egress drives, will be landscaped. Landscape requirements include standards for setback areas, placement of trees, interior landscaped areas, and design standards.
Chapter 112 - Sign Regulations
▪ Sec. 112-4.- Prohibited signs: ensure developments or redevelopment does not incorporate any of the type of signs listed under this section.
Comprehensive Plan
Future Land Use Element (FLUE)
Downtown District (DTD)
a. This category is intended to promote the vitality of downtown Panama City as a safe community of business, residential, cultural, government and entertainment uses, including public green spaces and recreational access to the waterfront, while protecting the environment and enhancing the quality of life.
b. Maximum density shall be no more than 30 dwelling units per acre with incentives to allow up to 60 dwelling units per acre. Procedures and criteria for implementation of density incentives shall be contained in the Land Development Regulations. Density bonuses may be provided to any of the following initiatives:
i. Waterfront projects that provide dedicated public access to the bay.
ii. Waterfront projects that dedicate a public easement parallel to the bay.
iii. Projects that include the rehabilitation and reuse of historic structures.
iv. Projects that contribute to a network of parks and green space.
v. Projects that utilize “green” or sustainable tech¬nology or development practices as part of the construction process or site design.
vi. Projects that offer more than 25% of the total project as residential dwelling units.
c. Development Principles - A broad mix of uses should be encouraged to promote a downtown where business, residential, and cultural uses are in close proximity to each other. The City should encourage designs which are:
i. Pedestrian friendly;
ii. Maintain and enhance visual and physical access on public owned property;
iii. Provide incentives to private property owners to minimize reduction of visual access and to allow public access to the waterfront;
iv. Compliments the unique character of down¬town;
v. Encourage rehabilitation and reuse of historic structures;
vi. Develops a network of parks and green space.
Policy 1.4.2: The inclusion of neighborhood commercial uses in residential areas shall be encouraged.
Policy 1.5.1: The City shall coordinate with developers of areas considered to be blighted or unsightly. Such coordination may include, but not be limited to: provision of public facilities; relaxation of regulatory standards; tax incentives; development agreements or other actions taken through the Community Development Department as part of the Community Development Plan.
Policy 1.6.1: The City will restrict proposed development which is inconsistent with the character of the community and maintain provisions for the evaluation of non-conforming land uses into its land development regulations.
Policy 1.12.2: The City shall promote redevelopment / revitalization efforts through administration of its Land Development Regulations and capital improvements planning, and efforts of the Community Redevelopment Agency.
Policy 1.12.3: The City’s planning efforts shall support the implementation of each CRA Master Plan.
Policy 1.17.1: The Millville CRA or Waterfronts Program shall continue to utilize the waterfront park on the City-owned property located on Watson Bayou at East 3rd Street and Maple Avenue in order to accommodate passive and limited active recreational uses.
Policy 1.17.4: In coordination with the Millville CRA and the Waterfronts Program, the City shall pursue federal, state, local, and other funding to purchase waterfront property, or property close to the water that provides access to water views or the shoreline, for use as public space.
Policy 1.18.1: The Millville CRA and/or Waterfronts Program shall design and construct a gateway at the 5th Street and Sherman Avenue location.
Transportation Element
Policy 2.1.3: Promote urban infill, redevelopment, and new growth through the provision of a range of transportation alternatives to satisfy mobility needs and achieve a healthy, vibrant city. These alternatives may include biking, walking, and the use of transit.
Policy 2.2.1: The City shall promote compact, multi-use, interconnected developments that provide pedestrian and bicycle modes of transportation.
Policy 2.4.2: The City will coordinate with the TPO and Bay County for the provision of bicycle paths as specified in the Transportation Planning Organization, Comprehensive Bicycle Plan.
Policy 2.6.1: Developers shall provide paved streets as part of any new subdivision development.
Policy 2.6.2: All street roads constructed by developers shall conform to design standards as specified in the Land Development Regulations.
Policy 2.8.3: The City shall use selected roadway improvements to promote other objectives such as redevelopment and revitalization efforts.
Housing Element
Policy 3.3.1: The City shall target redevelopment efforts within each of the City’s CRAs. Redevelopment shall include such efforts as revitalization and assistance programs, including installation of needed public infrastructure.
Policy 3.7.1: The City shall conserve stable neighborhoods by:
c. Preventing or eliminating Slum and Blight influences.
d. Providing and improving public facilities such as, but not limited to, streets, sidewalks, curbs and gutters, utilities, parks and recreation, and neighborhood services facilities.
Policy 3.7.2: The City shall support the revitalization of deteriorating neighborhoods and aid in the elimination of conditions detrimental to the public health, safety, and welfare. Strategies to
accomplish this Policy include, but are not limited to:
a. Rehabilitation of substandard structures.
b. Clearance of dilapidated and dangerous structures.
c. Stimulation of commercial investment to enhance economic vitality in deteriorating neighborhoods.
Economic Development Element
Policy 11.1.7: The City shall investigate the use of incentives to promote infill development and redevelopment, as well as business growth within the City.
Policy 11.1.4: The City shall support efforts to expand tourism activities, particularly within each of the established Community Redevelopment Areas.
Policy 11.1.5: The City shall continue to apply for Community Development Block Grants to assist with economic development projects in the Community Redevelopment Area.
Policy 11.1.6: The City, in conjunction with the Regional Planning Council, shall assist interested parties in using and understanding brownfield redevelopment programs and grants available to en¬courage redevelopment of areas with real and / or perceived environmental contamination.
Policy 11.1.8: The City shall assist in the development of industrial and commercial locations and business parks.
Policy 11.1.10: The City shall pursue and maintain effective public/private sector partnerships to enhance economic development opportunities within the City.
CRA Policy Support within Panama City Policy Framework
Panama City’s Land Development Code (LDC) includes some land development requirements that provide support for and encourage redevelopment in the City’s four Community Redevelopment Areas. In Chapter 104 – Zoning Districts, each CRA area is defined and assigned a purpose, which is primarily to encourage revitalization through redevelopment that enables economic growth, walkability, architectural preservation, and the improvement of quality of life factors. The Downtown District (DTD) includes bulk requirements that support higher density development with relaxed parking requirements, no setback requirements, and the provision of density bonuses in certain cases.
However, each CRA is different and has as purpose to support the City’s intentions for its revitalization and growth, like the St. Andrew’s District (StAD), which is more focused on growing businesses and commercial uses through maintaining architectural design, neighborhood character, and historic sites. Similarly, the Millville Downtown District (MDTD) zoning district’s primary purpose is to preserve the “eclectic” nature of Millville’s 3rd street commercial corridor.
While the DTD has fewer parking requirements and offers density bonuses, both the MDTD and StAD zoning districts are required to provide off street parking (Chapter 108 provides parking requirements) and have lower maximum height allowances compared to the DTD, but they also have no assigned setback requirements. Further, the DTD
zoning district does not permit the development of parking structures, but they are allowed in the StAD and the MDTD. Overall, it would be correct to say that these zoning districts are supportive of the implementation of economic redevelopment projects in the City’s CRA areas and related infrastructural improvements, such as:
▪ Streetscaping improvements on streets to enhance public transportation, traffic signals, lighting, parking, bike paths, sidewalks, and ADA ramps and pathways.
▪ Architectural preservation through landscaping and the rehabilitation of structures (commercial and residential) to blend with existing architecture.
▪ Incorporation of enhanced signage and wayfinding.
▪ Placemaking efforts that support local art scenes and cultural land uses.
▪ Maintaining of utilities and stormwater management systems.
▪ Parks and open, green spaces including those that improve access to the downtown waterfront.
Another zoning district to consider is the Cultural Heritage zoning district, provided in Sec. 104-36. Its main purpose is to preserve the cultural heritage and traditional design pattern found in the MLK Jr. Blvd. area while supporting redevelopment of business, residential, commercial, and cultural uses. In recent years several CRA accomplishments were completed on MLK Jr. Blvd. Chapter 105 of the LDC is focused on design standards, and includes building design standards for the different Neighborhood Districts, which include Neighborhood Downtown
(ND), Neighborhood General (NG), and Neighborhood Residential (NR). These zoning districts may be applied to Neighborhood Plan study areas (Glenwood, Millville, and St. Andrews). These zoning districts enable the development of Missing Middle Housing.
In addition, Chapter 105 also includes policy support and guidance for outdoor dining in Section 105-14. Here, outdoor dining is described as a support for “pedestrian-oriented environment that helps to create a visually attractive atmosphere and streetscape, and promotes overall commerce”. Regulations for the issuance of outdoor dining permits are provided. Lastly, in Chapter 112 where signage regulations are housed, rules for murals are provided to enforce their use as a design strategy to preserve the aesthetic appeal of the City. Murals are only allowed in the General Commercial districts, all CRA districts, and all Downtown Districts.
CRA Policy Support within Panama City Comprehensive Plan
Similar to the LDC, the Future Land Use Element (FLUE) in the City’s Comprehensive Plan enables the DTD to allow New Urbanist type development that is contingent on allowing higher residential densities. Density bonuses are allowed in the DTD, and can be provided to waterfront projects and projects that include the rehabilitation of reuse of historic structures. Development principles listed for the DTD under Policy 1.1.1 show that this and use category should support a “broad mix of uses to promote where business, residential, and cultural uses are in close proximity to each other” and be designed to support
walkability, accessibility, recreation, and the character of downtown. Other FLUE policies that provide support for this development type include Policy 1.4.2, which allows for the inclusion of neighborhood commercial uses in residential areas.
Many of the zoning overlays detailed in the FLUE (Goose Bayou, Panama City North Planning area, Huckleberry Creek, Black Creek, etc.) were established to promote economic development in a targeted way within the City. They also promote the development of effective circulation systems that promote multi-modal mobility and connectivity between residential spaces and commercial and office uses. Further, these zoning overlays encourage effective landscaping and stormwater management, wetland preservation, mixed-use housing, and deterring residential development away from flood prone areas.
CRA activities can find other policy support in the FLUE. Policy 1.5.1 encourages the City to support local developers and incentivize the development of blighted areas, while Policy 1.12.2 and 1.12.3 enables the City to employ various strategies to support redevelopment efforts by the Community Redevelopment Agency. Additionally, policy support for redevelopment in the Millville CRA that fosters waterfront access through the provision of parks and public space can be found in Policies 1.17.1 and 1.17.4. Support for gateway planning efforts in the Millville CRA area can be found in Policy 1.18.1. Other elements that provide policy support for CRA redevelopment activities include the transportation, housing, and economic development elements.
Transportation
Development activities in any CRA district that incorporate road or street improvements may promote compact, multi-use, and interconnected development that support walking and biking (Policy 2.2.1), as well as promote general redevelopment and revitalization efforts in the City (Policy 2.8.3). These activities should also enable infill as well as new growth through a range of transportation alternatives to provide residents with more opportunities to walk, bike, or use public transit to reach their destinations (Policy 2.1.3). To support development planning, the City may coordinate with the TPO and Bay County to provide bike lanes to help improve access to bicycle paths (Policy 2.4.2).
Housing
Intended to stimulate the development of affordable housing, the City is encouraged to target redevelopment in the CRA through existing programming and the provision of needed public infrastructure (Policy 3.3.1). The City should also support neighborhood revitalization and stabilization through the elimination of blighting influences (Policy 3.7.1), the rehabilitation or clearance of substandard structures, and the incentivizing of commercial investment (Policy 3.7.2).
Economic Development
Several strategies are outlined to support economic development in the City’s CRA districts through the issuing of redevelopment incentives (Policy 11.1.7), the expansion of tourism activities (Policy 11.1.4), and the use of Community Development Block grants. It also encourages the City to employ local partnerships, such as the one it has with the Emerald
Coast Regional Planning Council, to encourage the redevelopment of potential brownfield properties (Policy 11.1.6). More generally, the Economic Development element provides policy support that enables the City to assist the development of commercial uses and business parks (Policy 11.1.8), and leverage public/ private partnerships to maximize opportunities for economic growth in the City (Policy 11.1.10).
Considerations and Recommendations
Some policies within the Comprehensive Plan that should be considered while planning for future redevelopment in a CRA district include Policies 2.6.1 and 2.6.2. These policies call for paved streets to be provided by developers of new subdivisions and for those streets to be developed using design standards referenced in the LDC. Whereas, in the LDC, attention should be paid to the bulk requirements for development and/ or redevelopment plans in the CRA zoning districts.
It is recommended that the portion of the LDC that outlines development requirements for the CRA zoning districts better convey the need for community connectivity in their purpose statement for each district.
Walkability is mentioned, but the policy can be expanded and better aligned with future redevelopment goals by emphasizing the need for more connected neighborhoods through enhanced street networking and commercial corridors. Similarly, the need for improved streetscapes should be incorporated into the purpose and the objectives for the CRA zoning districts. Redevelopment initiatives that have a focus on
connectivity and strengthening streetscapes further the CRA’s mission to mitigate blight and spur redevelopment. Policies that could be incorporated into both the LDC and the Comprehensive Plan to better support redevelopment within the City’s CRA districts are listed below. Please note that these policy recommendations are informed by a review of CRA accomplishments in Panama City over the years.
▪ Support for the development of Complete Street elements, such as shade, benches, pocket parks, bike lanes, widened walking paths, public transit stops, trail integration, crosswalks, and ADA ramps and walkways.
▪ Encourage the active involvement of CRA agencies in the improvement of waterfront infrastructure, such as the Panama City Marina Redevelopment Master Plan.
▪ Enable effective code enforcement in CRA areas.
▪ Provide support for CRA initiatives and events, programs, and partnerships, such as partnership with the Downtown CRA and City Police.
▪ Add more examples of the type of redevelopment that should be promoted in CRA areas—aligning with recent CRA accomplishments and supporting economic growth in the Economic Development element of the Comprehensive Plan: public art, parks and recreation, urban agriculture, cultural land uses, and community events.
▪ Promote CRA initiatives that redevelop vacant properties in support of the local economy.
© GAI Consultants, Inc. 2024
This document has been prepared by GAI Consultants, Inc. on behalf of the City of Panama City Community Redevelopment Agency.