FISHER’S
NANTUCKET REAL ESTATE
SEPT ‘25 REVIEW
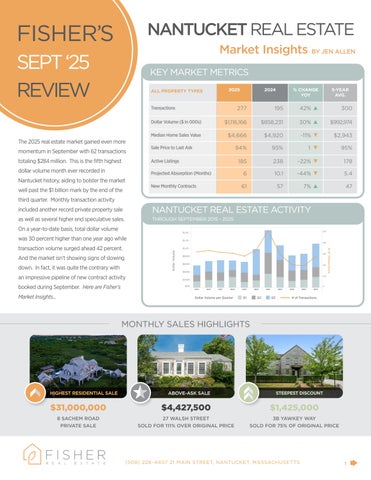
KEY MARKET METRICS
Market Insights BY JEN ALLEN
ALL PROPERTY TYPES
2025
2024
% CHANGE YOY
5-YEAR AVG.
277
195
42% d
300
Dollar Volume ($ in 000s)
$1,116,166
$858,231
30% d
$992,974
Median Home Sales Value
$4,666
$4,920
-11% f
$2,943
Sale Price to Last Ask
94%
95%
1 f
95%
totaling $284 million. This is the fifth highest
Active Listings
185
238
-22% f
178
dollar volume month ever recorded in
Projected Absorption (Months)
6
10.1
-44% f
5.4
New Monthly Contracts
61
57
7% d
47
Transactions
The 2025 real estate market gained even more momentum in September with 62 transactions
Nantucket history, aiding to bolster the market well past the $1 billion mark by the end of the third quarter. Monthly transaction activity included another record private property sale
NANTUCKET REAL ESTATE ACTIVITY
as well as several higher end speculative sales.
THROUGH SEPTEMBER 2015 - 2025
On a year-to-date basis, total dollar volume was 30 percent higher than one year ago while Dollar Volume
# of Transactions
transaction volume surged ahead 42 percent. And the market isn’t showing signs of slowing down. In fact, it was quite the contrary with an impressive pipeline of new contract activity booked during September. Here are Fisher’s Market Insights...
Dollar Volume per Quarter
Q1
Q2
Q3
# of Transactions
MONTHLY SALES HIGHLIGHTS
HIGHEST RESIDENTIAL SALE
ABOVE-ASK SALE
STEEPEST DISCOUNT
$31,000,000
$4,427,500
$1,425,000
8 SACHEM ROAD PRIVATE SALE
27 WALSH STREET SOLD FOR 111% OVER ORIGINAL PRICE
3B YAWKEY WAY SOLD FOR 75% OF ORIGINAL PRICE
(508) 228–4407 21 MAIN STREET, NANTUCKET, MASSACHUSETTS
1