FISHER’S
NANTUCKET REAL ESTATE
MAY ‘26 REVIEW
KEY MARKET METRICS
Market Insights BY JEN ALLEN
ALL PROPERTY TYPES
2026
% CHANGE YOY
5-YEAR AVG.
88
120
-27% f
109
Dollar Volume ($ in 000s)
$359,279
$420,832
-15% f
$402,386
Median Home Sale Value
$3,053
$2,700
13% d
$2,625
Sale Price to Last Ask
92%
93%
-1 f
95%
Active Listings
158
208
-24% f
165
Projected Absorption
5.0
7.0
-31% f
5.0
New Monthly Contracts
34
20
70% d
25
Transactions
NANTUCKET REAL ESTATE ACTIVITY THROUGH MAY 2016 - 2026
Dollar Volume
# of Transactions
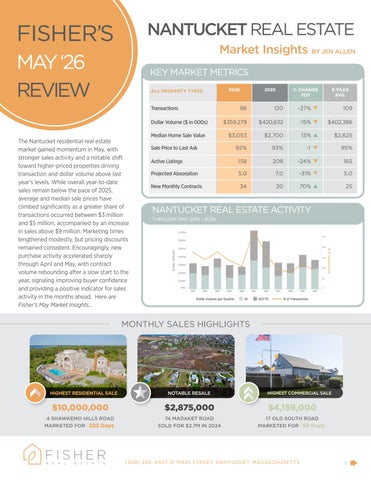
The Nantucket residential real estate market gained momentum in May, with stronger sales activity and a notable shift toward higher-priced properties driving transaction and dollar volume above last year’s levels. While overall year-to-date sales remain below the pace of 2025, average and median sale prices have climbed significantly as a greater share of transactions occurred between $3 million and $5 million, accompanied by an increase in sales above $9 million. Marketing times lengthened modestly, but pricing discounts remained consistent. Encouragingly, new purchase activity accelerated sharply through April and May, with contract volume rebounding after a slow start to the year, signaling improving buyer confidence and providing a positive indicator for sales activity in the months ahead. Here are Fisher’s May Market Insights...
2025
Dollar Volume per Quarter
Q1
Q2YTD
# of Transactions
MONTHLY SALES HIGHLIGHTS
HIGHEST RESIDENTIAL SALE
NOTABLE RESALE
$10,000,000
$2,875,000
$4,159,000
4 SHAWKEMO HILLS ROAD MARKETED FOR [222 Days]
74 MADAKET ROAD SOLD FOR $2.7M IN 2024
17 OLD SOUTH ROAD MARKETED FOR [59 Days]
HIGHEST COMMERCIAL SALE
(508) 228–4407 21 MAIN STREET, NANTUCKET, MASSACHUSETTS
1