FISHER’S
NANTUCKET REAL ESTATE
MAR ‘26 REVIEW
KEY MARKET METRICS
Market Insights BY JEN ALLEN 2026
ALL PROPERTY TYPES
% CHANGE YOY
5-YEAR AVG.
54
71
-24% f
78
Dollar Volume ($ in 000s)
$252,363
$271,359
-7% f
$224,852
Median Home Sale Value
$3,775
$2,500
51% d
$2,315
Sale Price to Last Ask
92%
93%
-1 f
95%
Active Listings
104
135
-23% f
109
Projected Absorption
3.0
4.8
-37% f
4
New Monthly Contracts
7
24
-71% f
17
Transactions
NANTUCKET REAL ESTATE ACTIVITY THROUGH MARCH 2016 - 2026
Dollar Volume
# of Transactions
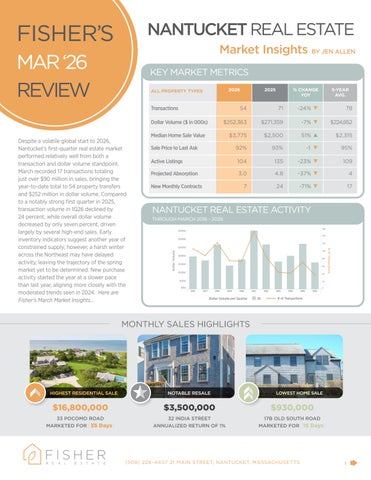
Despite a volatile global start to 2026, Nantucket’s first-quarter real estate market performed relatively well from both a transaction and dollar volume standpoint. March recorded 17 transactions totaling just over $90 million in sales, bringing the year-to-date total to 54 property transfers and $252 million in dollar volume. Compared to a notably strong first quarter in 2025, transaction volume in 1Q26 declined by 24 percent, while overall dollar volume decreased by only seven percent, driven largely by several high-end sales. Early inventory indicators suggest another year of constrained supply; however, a harsh winter across the Northeast may have delayed activity, leaving the trajectory of the spring market yet to be determined. New purchase activity started the year at a slower pace than last year, aligning more closely with the moderated trends seen in 2024. Here are Fisher’s March Market Insights...
2025
Dollar Volume per Quarter
Q1
# of Transactions
MONTHLY SALES HIGHLIGHTS
HIGHEST RESIDENTIAL SALE
NOTABLE RESALE
LOWEST HOME SALE
$16,800,000
$3,500,000
$930,000
33 POCOMO ROAD MARKETED FOR [35 Days]
32 INDIA STREET ANNUALIZED RETURN OF 1%
17B OLD SOUTH ROAD MARKETED FOR [15 Days]
(508) 228–4407 21 MAIN STREET, NANTUCKET, MASSACHUSETTS
1