FISHER’S
NANTUCKET REAL ESTATE
JUNE ‘25 REVIEW
KEY MARKET METRICS
Market Insights BY JEN ALLEN
ALL PROPERTY TYPES
2025
% CHANGE YOY
5-YEAR AVG.
151
104
45% d
172
Dollar Volume ($ in 000s)
$519,067
$451,241
15% d
$514,895
Median Home Sales Value
$2,933
$3,550
-17% f
$2,641
Sale Price to Last Ask
94%
95%
2 d
95%
Active Listings
241
221
9% d
482
Projected Absorption
8
9.5
-20% f
6
New Monthly Contracts
31
33
-6% f
37
Transactions
NANTUCKET REAL ESTATE ACTIVITY THROUGH JUNE 2015 - 2025
Dollar Volume
# of Transactions
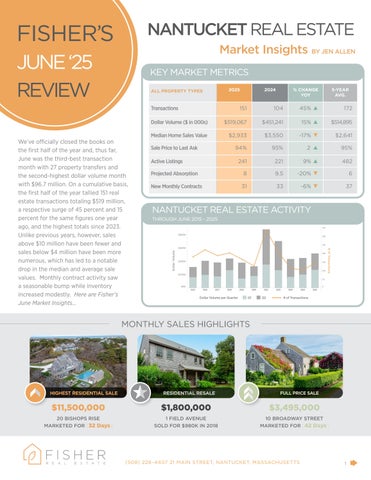
We’ve officially closed the books on the first half of the year and, thus far, June was the third-best transaction month with 27 property transfers and the second-highest dollar volume month with $96.7 million. On a cumulative basis, the first half of the year tallied 151 real estate transactions totaling $519 million, a respective surge of 45 percent and 15 percent for the same figures one year ago, and the highest totals since 2023. Unlike previous years, however, sales above $10 million have been fewer and sales below $4 million have been more numerous, which has led to a notable drop in the median and average sale values. Monthly contract activity saw a seasonable bump while inventory increased modestly. Here are Fisher’s June Market Insights...
2024
Dollar Volume per Quarter
Q1
Q2
# of Transactions
MONTHLY SALES HIGHLIGHTS
HIGHEST RESIDENTIAL SALE
RESIDENTIAL RESALE
$11,500,000
$1,800,000
$3,495,000
20 BISHOPS RISE MARKETED FOR [32 Days]
1 FIELD AVENUE SOLD FOR $980K IN 2018
10 BROADWAY STREET MARKETED FOR [42 Days]
FULL PRICE SALE
(508) 228–4407 21 MAIN STREET, NANTUCKET, MASSACHUSETTS
1