FISHER’S
NANTUCKET REAL ESTATE
JULY ‘26 REVIEW
KEY MARKET METRICS
Market Insights BY JEN ALLEN 2026
ALL PROPERTY TYPES
% CHANGE YOY
5-YEAR AVG.
136
184
-26% f
164
Dollar Volume ($ in 000s)
$555,497
$644,958
-14% f
$615,485
Median Home Sale Value
$3,045
$2,500
22% d
$2,682
Sale Price to Last Ask
94%
93%
1 d
95%
Active Listings
184
233
-21% f
194
Projected Absorption
6.0
8.0
-20% f
6.0
New Monthly Contracts
43
48
-10% f
38
Transactions
NANTUCKET REAL ESTATE ACTIVITY THROUGH JULY 2016 - 2026
Dollar Volume
# of Transactions
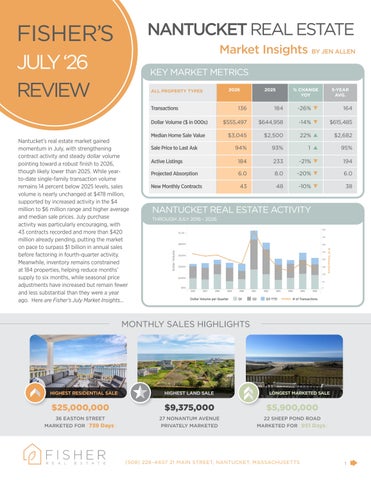
Nantucket’s real estate market gained momentum in July, with strengthening contract activity and steady dollar volume pointing toward a robust finish to 2026, though likely lower than 2025. While yearto-date single-family transaction volume remains 14 percent below 2025 levels, sales volume is nearly unchanged at $478 million, supported by increased activity in the $4 million to $6 million range and higher average and median sale prices. July purchase activity was particularly encouraging, with 43 contracts recorded and more than $420 million already pending, putting the market on pace to surpass $1 billion in annual sales before factoring in fourth-quarter activity. Meanwhile, inventory remains constrained at 184 properties, helping reduce months’ supply to six months, while seasonal price adjustments have increased but remain fewer and less substantial than they were a year ago. Here are Fisher’s July Market Insights...
2025
Dollar Volume per Quarter
Q1
Q2
Q3 YTD
# of Transactions
MONTHLY SALES HIGHLIGHTS
HIGHEST RESIDENTIAL SALE
HIGHEST LAND SALE
LONGEST MARKETED SALE
$25,000,000
$9,375,000
$5,900,000
36 EASTON STREET MARKETED FOR [739 Days]
27 NONANTUM AVENUE PRIVATELY MARKETED
22 SHEEP POND ROAD MARKETED FOR [951 Days]
(508) 228–4407 21 MAIN STREET, NANTUCKET, MASSACHUSETTS
1