FISHER’S
NANTUCKET REAL ESTATE
JUNE ‘26 REVIEW
KEY MARKET METRICS
Market Insights BY JEN ALLEN
ALL PROPERTY TYPES
2026
% CHANGE YOY
5-YEAR AVG.
111
147
-24% f
137
Dollar Volume ($ in 000s)
$438,419
$517,490
-15% f
$508,801
Median Home Sale Value
$2,945
$2,498
18% d
$2,664
Sale Price to Last Ask
93%
94%
-1 f
95%
Active Listings
175
241
-27% f
182
Projected Absorption
6.0
8.0
-27% f
6.0
New Monthly Contracts
30
31
-3% f
32
Transactions
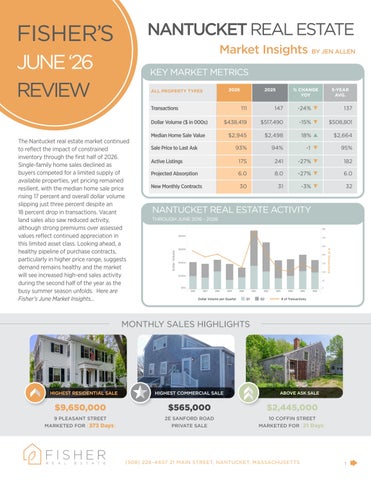
NANTUCKET REAL ESTATE ACTIVITY THROUGH JUNE 2016 - 2026
Dollar Volume
# of Transactions
The Nantucket real estate market continued to reflect the impact of constrained inventory through the first half of 2026. Single-family home sales declined as buyers competed for a limited supply of available properties, yet pricing remained resilient, with the median home sale price rising 17 percent and overall dollar volume slipping just three percent despite an 18 percent drop in transactions. Vacant land sales also saw reduced activity, although strong premiums over assessed values reflect continued appreciation in this limited asset class. Looking ahead, a healthy pipeline of purchase contracts, particularly in higher price range, suggests demand remains healthy and the market will see increased high-end sales activity during the second half of the year as the busy summer season unfolds. Here are Fisher’s June Market Insights...
2025
Dollar Volume per Quarter
Q1
Q2
# of Transactions
MONTHLY SALES HIGHLIGHTS
HIGHEST RESIDENTIAL SALE
HIGHEST COMMERCIAL SALE
ABOVE ASK SALE
$9,650,000
$565,000
$2,445,000
9 PLEASANT STREET MARKETED FOR [373 Days]
2E SANFORD ROAD PRIVATE SALE
10 COFFIN STREET MARKETED FOR [21 Days]
(508) 228–4407 21 MAIN STREET, NANTUCKET, MASSACHUSETTS
1