July Market Insights - Nantucket Real Estate

Page 1

FISHER’S

NANTUCKET REAL ESTATE

JULY ‘25 REVIEW

KEY MARKET METRICS

Market Insights BY JEN ALLEN

ALL PROPERTY TYPES

2025

% CHANGE YOY

5-YEAR AVG.

184

124

48% d

206

Dollar Volume ($ in 000s)

$644,958

$515,293

25% d

$639,925

Median Home Sales Value

$3,524

$4,156

-15% f

$3,235

Sale Price to Last Ask

93%

95%

2 d

95%

Active Listings

187

196

-5% f

155

6

8.5

-29% f

5

48

34

41% d

43

Transactions

Projected Absorption (Months) New Monthly Contracts

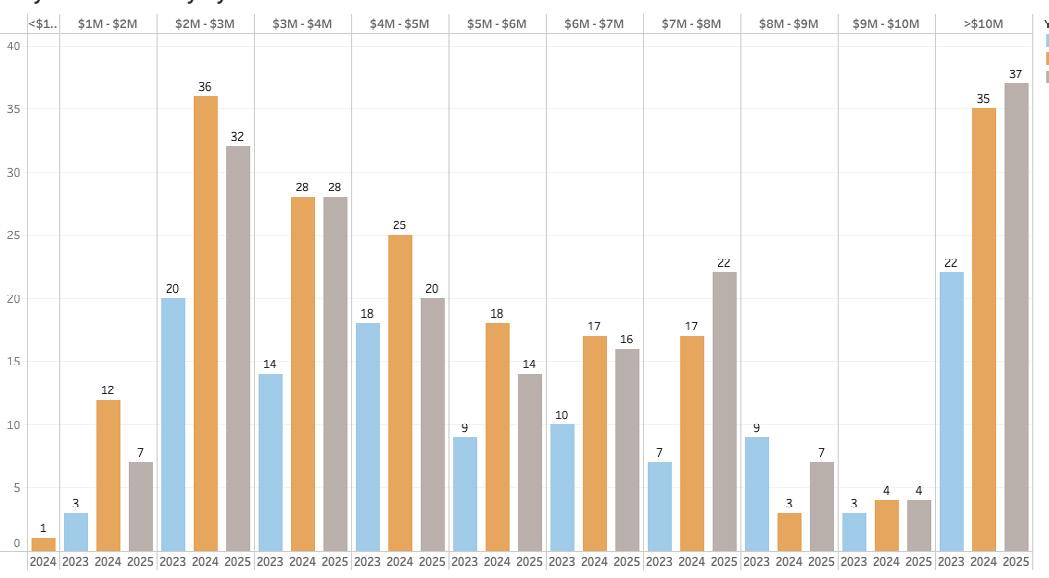
NANTUCKET REAL ESTATE ACTIVITY THROUGH JULY 2015 - 2025

Dollar Volume

# of Transactions

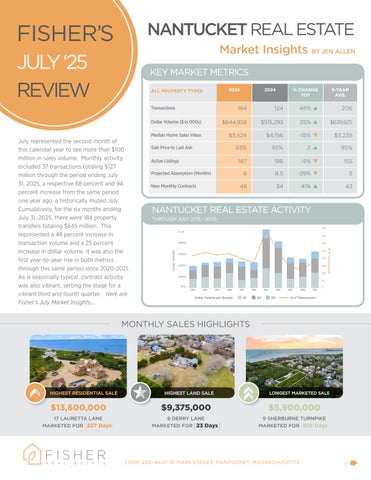
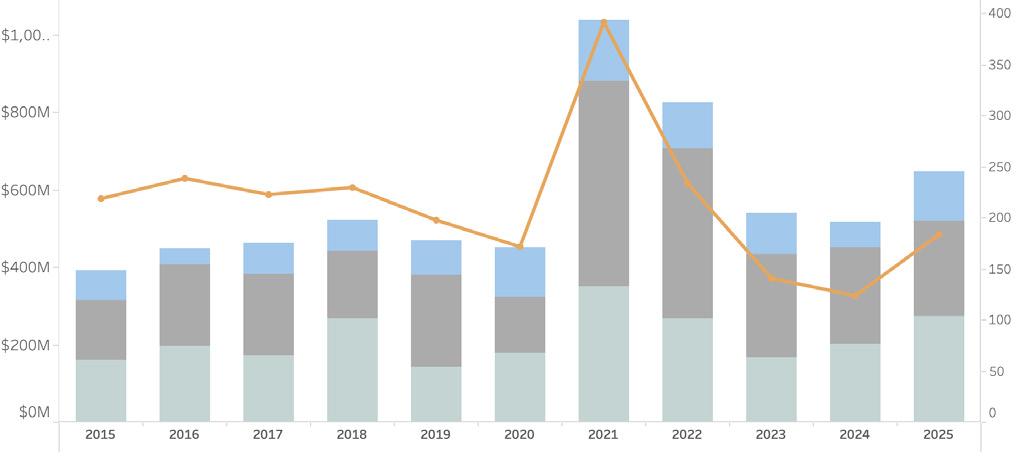
July represented the second month of this calendar year to see more than $100 million in sales volume. Monthly activity included 37 transactions totaling $127 million through the period ending July 31, 2025, a respective 68 percent and 94 percent increase from the same period one year ago, a historically muted July. Cumulatively, for the six months ending July 31, 2025, there were 184 property transfers totaling $645 million. This represented a 48 percent increase in transaction volume and a 25 percent increase in dollar volume. It was also the first year-to-year rise in both metrics through this same period since 2020-2021. As is seasonally typical, contract activity was also vibrant, setting the stage for a vibrant third and fourth quarter. Here are Fisher’s July Market Insights...
2024

Dollar Volume per Quarter

Q1

Q2

Q3

# of Transactions

MONTHLY SALES HIGHLIGHTS

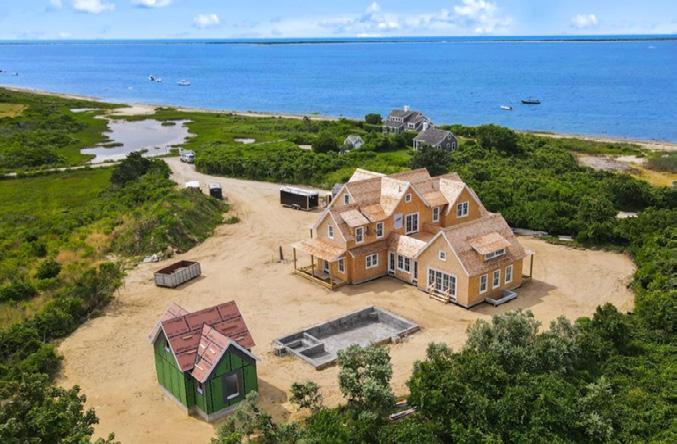
HIGHEST RESIDENTIAL SALE

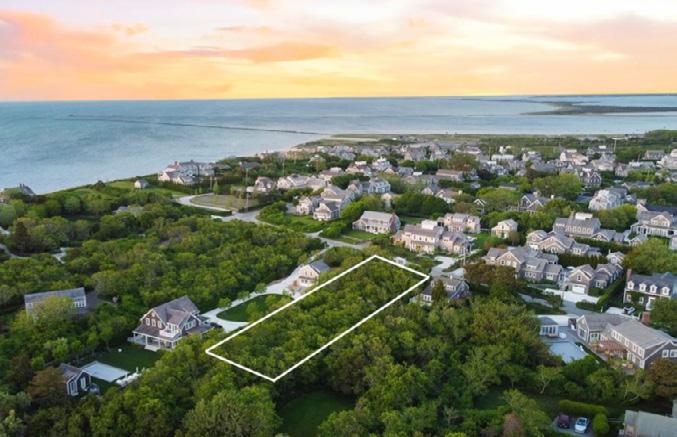
HIGHEST LAND SALE

$13,600,000

$9,375,000

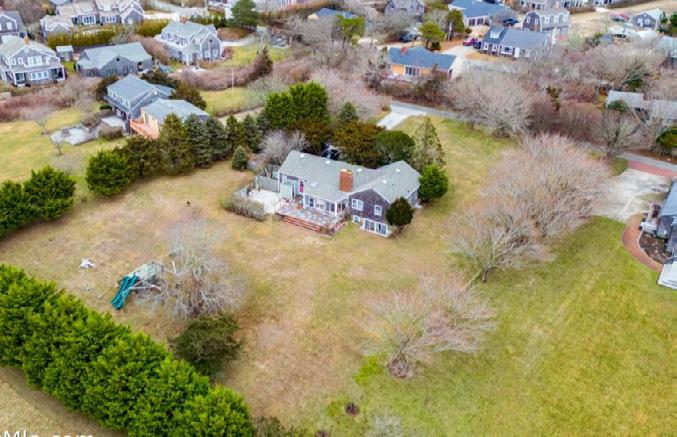
$5,900,000

17 LAURETTA LANE MARKETED FOR [227 Days]

8 DERRY LANE MARKETED FOR [23 Days]

9 SHERBURNE TURNPIKE MARKETED FOR [610 Days]

LONGEST MARKETED SALE

(508) 228–4407 21 MAIN STREET, NANTUCKET, MASSACHUSETTS

1


Turn static files into dynamic content formats.

Create a flipbook
July Market Insights - Nantucket Real Estate by fishernantucket - Issuu