FISHER’S JAN ‘25
KEY MARKET METRICS
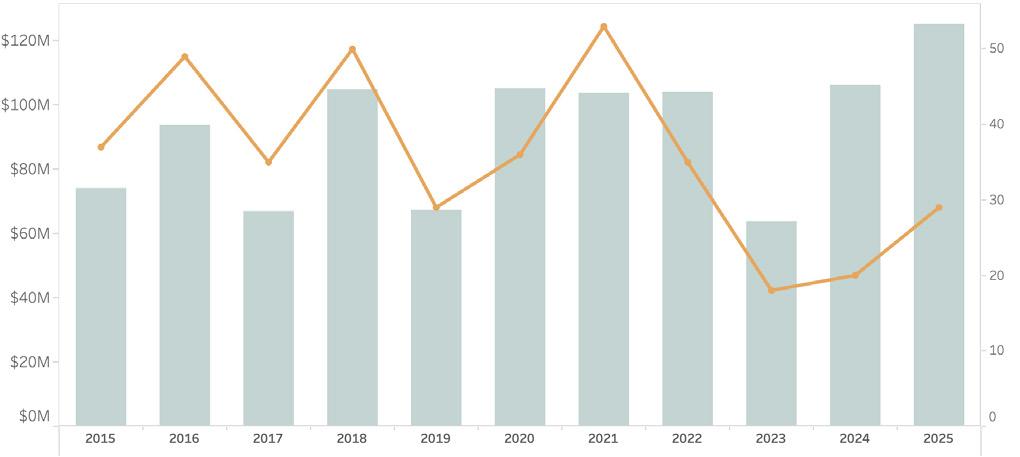
The Nantucket real estate market made a notable start in the new year with $125 million in sales activity, the highest dollar volume on record for the first month of the year. Transactions tallied 29 properties including two property transfers above $15 million. As we reported in our 2024 Year in Review, we anticipate that we will continue to see a vibrant high-end market in 2025, and January activity certainly set the stage. Transaction volume was higher than one year ago but well below the average we saw prior to 2023 when transactions figures were regularly in the 30-50 range. New contracts perked up from year’s end and listing inventory also increased modestly from the seasonal low we usually see in December. Here are Fisher’s January Market Insights…
NANTUCKET REAL ESTATE ACTIVITY THROUGH JANUARY 2015 - 2025
MONTHLY SALES HIGHLIGHTS
Market Insights BY
JEN ALLEN
RESIDENTIAL SALES ACTIVITY
INCREASE IN TRANSACTIONS, RECORD DOLLAR VOLUME
• Single-family home sales (excluding condos, co-ops, multi-family & covenant properties) perked up in January, reflecting the highest number of transactions since 2022 and in line with figures we saw prior to 2020.
• Monthly dollar volume set a new historic record with $125 million, thanks to several high-end sales including two ultra-high-end sales in Brant Point and the Cliff. This dollar volume reflects an increase of 18 percent from one year ago, the previous record for January sales.
• Despite the high-end activity, there were sufficient sales at the lower end of that market that the average and median home sale declined from one year ago. With just one month of data, we will be able to extract better trend information from these metrics in coming months. One data point we will be watching closely is the average marketing time, which jumped to 4.7 months in January 2025 and is two months longer than just one year ago.
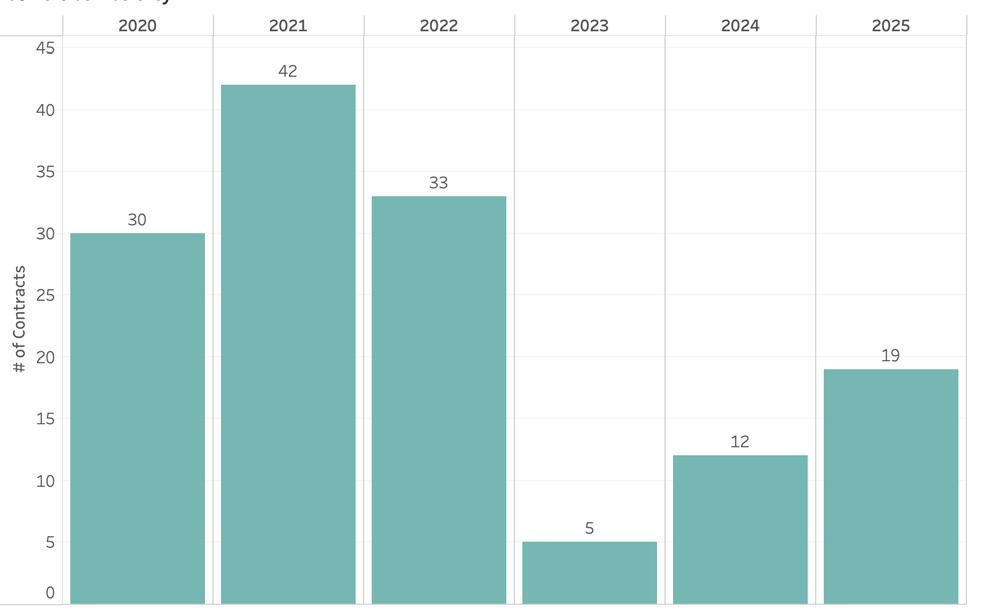
• In what could foreshadow an uptick in 2025 sales activity, new monthly contract activity in January was well ahead of last year’s volume and closer to pre-pandemic norms. Recorded contracts (Offers to Purchase and Purchase & Sale Contracts excluding duplicates) totaled 19 properties, markedly above the five contracts we saw during this period two years ago.
• More than half of the new contracts were for properties last listed between $1 million and $3 million, while 27 percent were for properties last listed below $3 million and $5 million. One contract was marked for a property last listed above $10 million.
NANTUCKET PROPERTY INVENTORY
• January is typically a very low inventory time of year, which is why active property listings were 27 percent lower than in December. Nonetheless, there were 20 new property listings during the month and seven “return-to-market” to bring property listings slightly higher than one year ago. As of January 31, 2025, there were 121 properties listed for sale including residential, commercial, and vacant land listings.
• The total months’ supply, or how long it would take to sell all listings based on trailing 12-month sales, measured three months for residential properties, five months for vacant land, and four months for commercial properties.
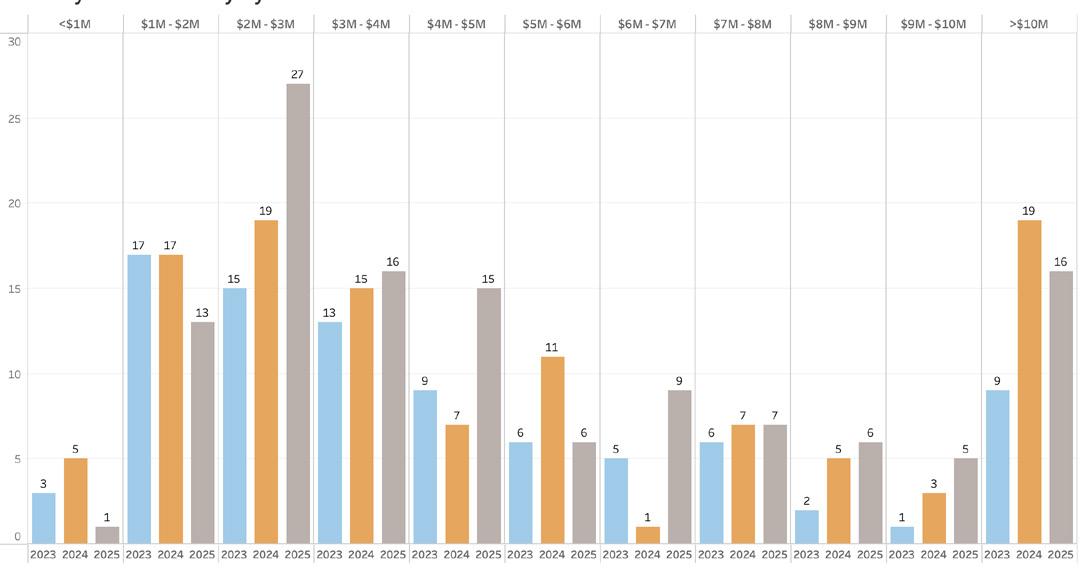
• As compared to this time last year, the price points that saw the most growth in new listings were the $2 million to $3 million, $4 million to $5 million and $6 million to $7 million. We expect this distribution to shift significantly as new property inventory comes to market in the coming months.