FISHER’S
NANTUCKET REAL ESTATE
AUG ‘25 REVIEW
KEY MARKET METRICS
Market Insights BY JEN ALLEN 2025
ALL PROPERTY TYPES
% CHANGE YOY
5-YEAR AVG.
215
124
73% d
206
Dollar Volume ($ in 000s)
$831,766
$515,293
61% d
$639,925
Median Home Sales Value
$3,887
$4,156
-6% f
$3,235
Sale Price to Last Ask
94%
95%
1 d
95%
Active Listings
215
245
-12% f
189
Projected Absorption (Months)
7
10.7
-35% f
5
New Monthly Contracts
57
62
-8% f
60
Transactions
NANTUCKET REAL ESTATE ACTIVITY THROUGH AUGUST 2015 - 2025
Dollar Volume
# of Transactions
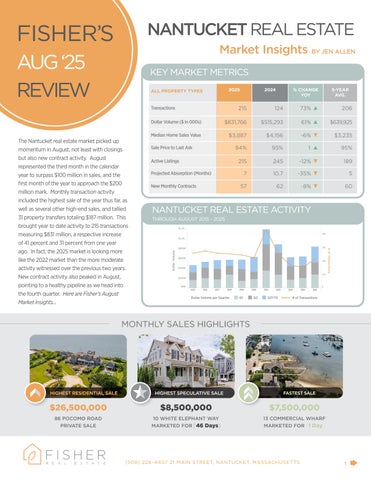
The Nantucket real estate market picked up momentum in August, not least with closings but also new contract activity. August represented the third month in the calendar year to surpass $100 million in sales, and the first month of the year to approach the $200 million mark. Monthly transaction activity included the highest sale of the year thus far, as well as several other high-end sales, and tallied 31 property transfers totaling $187 million. This brought year to date activity to 215 transactions measuring $831 million, a respective increase of 41 percent and 31 percent from one year ago. In fact, the 2025 market is looking more like the 2022 market than the more moderate activity witnessed over the previous two years. New contract activity also peaked in August, pointing to a healthy pipeline as we head into the fourth quarter. Here are Fisher’s August Market Insights...
2024
Dollar Volume per Quarter
Q1
Q2
Q3YTD
# of Transactions
MONTHLY SALES HIGHLIGHTS
HIGHEST RESIDENTIAL SALE
HIGHEST SPECULATIVE SALE
FASTEST SALE
$26,500,000
$8,500,000
$7,500,000
86 POCOMO ROAD PRIVATE SALE
10 WHITE ELEPHANT WAY MARKETED FOR [46 Days]
13 COMMERCIAL WHARF MARKETED FOR [1 Day]
(508) 228–4407 21 MAIN STREET, NANTUCKET, MASSACHUSETTS
1