FISHER’S
NANTUCKET REAL ESTATE
APR ‘26 REVIEW
KEY MARKET METRICS
Market Insights BY JEN ALLEN 2026
ALL PROPERTY TYPES
% CHANGE YOY
5-YEAR AVG.
67
101
-34% f
67
Dollar Volume ($ in 000s)
$282,794
$366,985
-23% f
$282,794
Median Home Sale Value
$4,400
$3,200
38% d
$2,751
Sale Price to Last Ask
92%
93%
-1 f
92%
Active Listings
143
184
-22% f
140
Projected Absorption
4.5
6.3
-29% f
5
New Monthly Contracts
20
23
-13% f
21
Transactions
NANTUCKET REAL ESTATE ACTIVITY THROUGH APRIL 2016 - 2026
Dollar Volume
# of Transactions
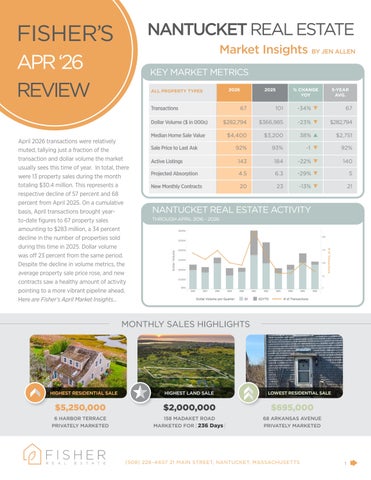
April 2026 transactions were relatively muted, tallying just a fraction of the transaction and dollar volume the market usually sees this time of year. In total, there were 13 property sales during the month totaling $30.4 million. This represents a respective decline of 57 percent and 68 percent from April 2025. On a cumulative basis, April transactions brought yearto-date figures to 67 property sales amounting to $283 million, a 34 percent decline in the number of properties sold during this time in 2025. Dollar volume was off 23 percent from the same period. Despite the decline in volume metrics, the average property sale price rose, and new contracts saw a healthy amount of activity pointing to a more vibrant pipeline ahead. Here are Fisher’s April Market Insights...
2025
Dollar Volume per Quarter
Q1
Q2YTD
# of Transactions
MONTHLY SALES HIGHLIGHTS
HIGHEST RESIDENTIAL SALE
HIGHEST LAND SALE
LOWEST RESIDENTIAL SALE
$5,250,000
$2,000,000
$695,000
6 HARBOR TERRACE PRIVATELY MARKETED
158 MADAKET ROAD MARKETED FOR [236 Days]
68 ARKANSAS AVENUE PRIVATELY MARKETED
(508) 228–4407 21 MAIN STREET, NANTUCKET, MASSACHUSETTS
1