ACKNOWLEDGEMENTS
Applied Survey Research (ASR) acknowledges the following individuals for their support and assistance in the planning and implementation of the 2025 Kindergarten Readiness Assessment in Santa Clara County: Jennifer Kelleher-Cloyd, Trena Hudson, Nathan Thomas, Ali Kagawa, and Shannon Aivazian of FIRST 5 Santa Clara County; Joy Murrieta of Kids in Common; Matthew Tinsley of Santa Clara County Office of Education. ASR would also like to express appreciation to FIRST 5 Santa Clara County, Kids in Common, the Early Childhood Initiatives Strategy of Silicon Valley Community Foundation, and the Morgan Family Foundation for sponsoring this study.
This assessment would not have been possible without the support of the participating kindergarten teachers who generously gave their time and energy to help deepen understanding of students’ skills and experiences as they entered school. ASR gratefully acknowledges the many individuals listed in the following table for their contributions:
PARTICIPATING SCHOOLS AND TEACHERS
School Teacher
Alexander Rose Elementary
Aptitud Community Academy at Goss
Argonaut Elementary
Booksin Elementary
Bracher Elementary
Cadwallader Elementary
Capri Elementary
Captain Jason M. Dahl Elementary
Carolyn A. Clark Elementary
Castlemont Elementary
Franklin Elementary
Hubbard Media Arts Academy
Joseph Weller Elementary
Learning in an Urban Community with High Achievement (L.U.C.H.A.)
Montague Elementary
Nordstrom Elementary
Oak Ridge Elementary
Paradise Valley Engineering Academy
Santa Rita Elementary
Santee Elementary
Silver Oak Elementary
Washington Elementary
Westwood Elementary
Lucille Lai
Xanthiol Tran
Jill McKie
Ailish Johnson
Erin Hannon
Rocio Kappenman
Alison Inouye
Anna Metichecchia
Tala Navarro
Mika Yanai
Kylie Ziolkowski
Lisa Hubrig
Edgar Quiroz Medrano
Karen Acosta
Susan Noda
Alicia Stapes
Victoria Urzi
Carlos Marquez
Jane De Jesus
Lisa Dries
Kristi Mastrome
Melanie McLaughlin
Kimi Hiroshima
Karyn Howl
Lisa Stuart
Jennifer Clifford
Holly Carlson
Stacy Dolan
Heather Belanger
Tarang Gupta
Kimberly Leonhardt
Rodger Mao
Tara Ferguson
Rosalia Canela
Elena Dritsas
Carlos Marquez
INTRODUCTION
Methodology
Sample
READINESS OF CHILDREN
Kindergarten Readiness
Interpreting Readiness Trends Over Time
Malleable Assets Associated with Overall Readiness
Cumulative Effect of Malleable Assets
Geographic Differences in Readiness
Demographic Differences in Readiness
Caregiver Perceptions of Kindergarten Readiness
Section Summary
READINESS OF FAMILIES & COMMUNITIES
Early Learning Access
Community Resources and Supports
Family Engagement in Home Learning Activities
Family Routines
Family Stressors and Well-Being
Access to Health Care and Resources
Access to Recommended Services
Section Summary
READINESS OF SCHOOLS
Supporting the Kindergarten Transition
Section Summary
SUMMARY & DISCUSSION
How Ready Were Children, Families, Schools, & Communities in 2025? Building on This Foundation
Conclusion
Appendix A: Study Sample and Kindergarten Population, by School District
Appendix B: Santa Clara County Resource List

INTRODUCTION
Children’s readiness for kindergarten lays the foundation for future academic success, including thirdgrade proficiency and high school graduation.i,ii,iii These early readiness skills develop within the context of children’s everyday environments, and a smooth transition into kindergarten depends not only on individual preparedness but also on how well schools support their social, emotional, and developmental needs. Children are more likely to thrive when they grow up in stable households, have access to enriching early experiences, and enter schools that are prepared to support their development.
The 2025 Santa Clara County Kindergarten Readiness Assessment (KRA) offers a comprehensive look at how children, families, schools, and communities are working together to support school readiness. As in previous years, the study includes both teacher-administered assessments alongside caregiver perspectives gathered through the Parent Information Form (PIF)
This year’s Santa Clara County KRA report includes:
A comparison of 2025 findings with results from 2023, and Selected comparisons to 2018 to highlight long-term trends.
Together, these data illuminate how children and their communities are growing, adapting, and preparing for success in school and beyond.1
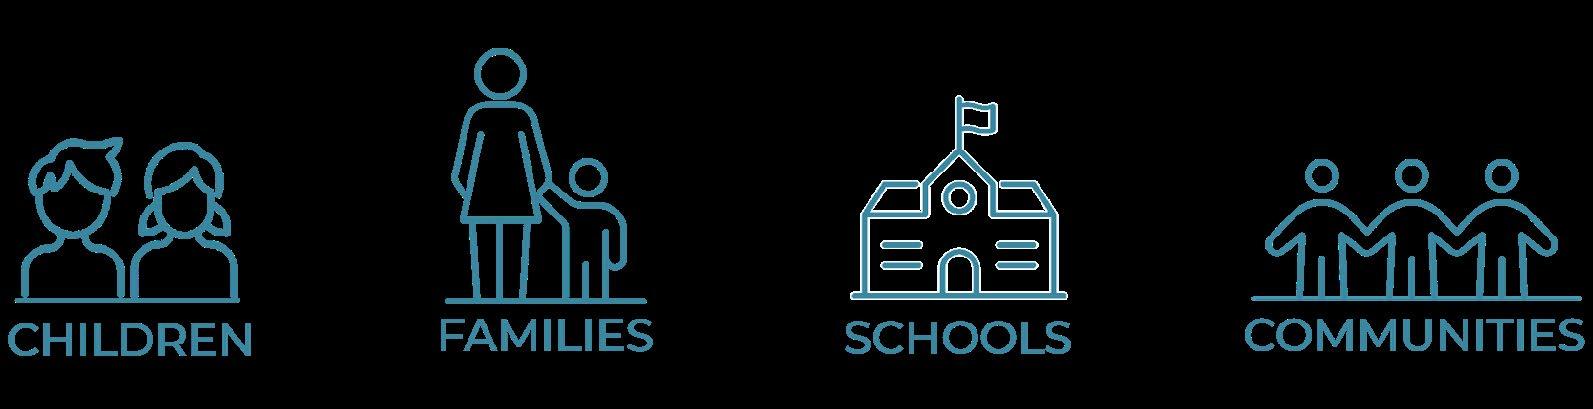
FOUR COMPONENTS OF SCHOOL READINESS
1 Due to COVID-19 disruptions, only a parent survey was conducted in 2020, and a limited number of classrooms participated in 2021. These years are not included in the analyses.
METHODOLOGY
Kindergarten Observation Form (KOF)
Kindergarten readiness was assessed by classroom teachers during the first few weeks of the school year using the Kindergarten Observation Form (KOF), a validated assessment tool shown to predict academic outcomes such as third grade achievement.iv Teachers rate each child’s readiness skills on a four-point scale, from 1 = Not Yet demonstrating the skill to 4 = Proficient or consistently shows the skill.
The KOF focuses on three core Building Blocks of Readiness – Self-Regulation, Social Expression, and Kindergarten Academics. A fourth area includes two additional items related to fine and gross motor skills, which provide foundational support for the other domains.
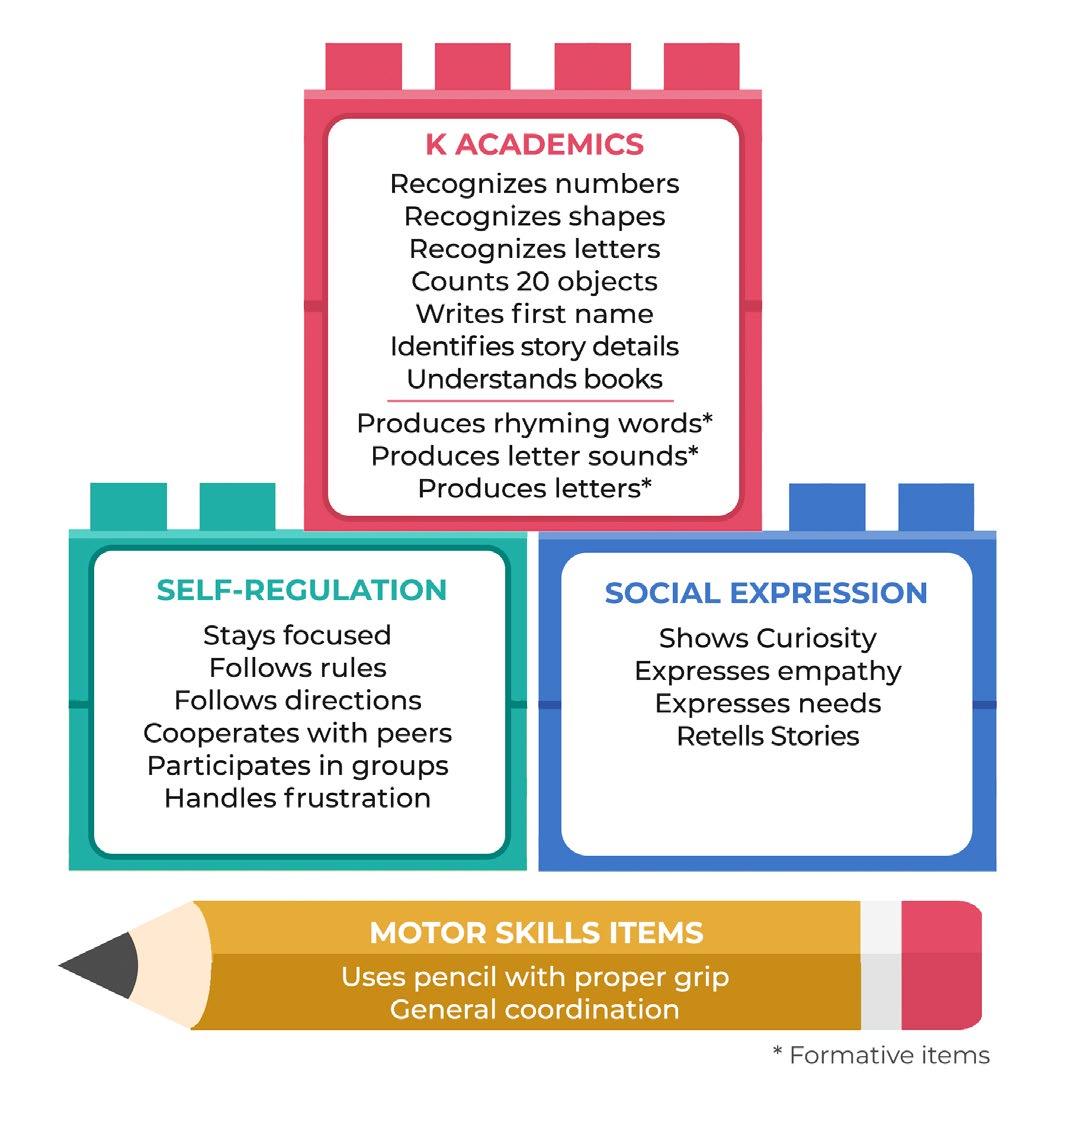
Before administering the assessment, all participating teachers attended a 90-minute training session led by ASR staff. The training provided step-by-step guidance on how to implement each observational and interactive item on the assessment. Teachers reviewed the scoring guide, examined detailed definitions for each skill at every proficiency level, and practiced assigning ratings using sample scenarios and images. Both the training and the scoring materials were designed to ensure consistency across classrooms and to minimize potential bias in how readiness skills were rated.
Parent Information Form (PIF)
To better understand the experiences that shape children’s readiness for kindergarten, caregivers were invited to complete the Parent Information Form (PIF). This survey gathered information about each child’s background, early learning experiences, kindergarten-related skills, and overall well-being. Caregivers also shared how they support their child’s learning at home, their use of community resources, access to healthcare and screenings, and connections to systems of support.
Surveys were offered in English and Spanish at a sixth grade reading level. As part of the study, all families enrolled in a participating classroom received a children’s book, regardless of survey completion.

The 2025 KRA included 705 kindergarten students across 36 classrooms, representing 23 schools in 11 districts throughout Santa Clara County. The table below shows the number of classrooms and study participants represented by each school. The sample represents 5% of the 2024 countywide kindergarten enrollment of 14,182 students.v While the sample is sufficiently large to support statistically valid and reliable analysis at the county level (confidence level of ±3.7%), readers should refer to “A Note about How to Interpret the Data in This Report” for important context regarding generalizability.
To ensure a statistically valid county-level sample, a higher number of schools were selected from certain districts, while fewer schools were included from others. This approach supports reliable countywide analysis; however, results are not representative at the individual district level. A full breakdown of the sample and population percentages by district is provided in Appendix A
Exhibit 1. An Overview of Participation in the 2025 KRA, by School Source: Kindergarten Observation Form 2025.
The map below shows the distribution of children assessed in the 2025 Santa Clara County KRA by the ZIP Code of their school. Participation was highest in larger-population areas of the county, particularly East San Jose (95122), Campbell (95008), and Milpitas (95035). Several smaller areas also contributed to the sample, helping ensure broad geographic representation across Santa Clara County.
Exhibit 2.
An Overview of Participation in the 2025 KRA, by ZIP Code of Assessed Children’s School
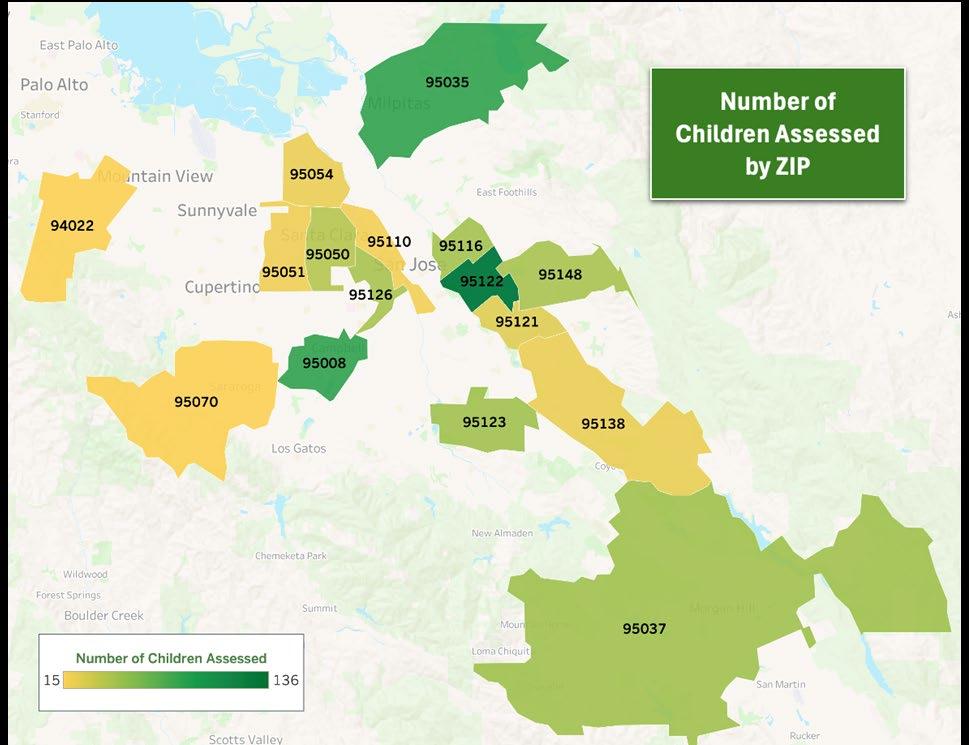
Source: Kindergarten Observation Form 2025, N = 705. The map uses a color gradient ranging from dark green to light green to yellow, representing areas with higher to lower numbers of children assessed, respectively.
In the 2025 Santa Clara County KRA, 99% of surveys were completed by biological parents, and 1% by guardians. At the time of the assessment, children were 5.5 years old on average. Just over half of participating children were identified by their caregivers as boys (52%), and 48% as girls.
Families identified their child’s race or ethnicity, with 10% selecting more than one race. The most commonly reported groups were Hispanic or Latino (36%), Asian, Native Hawaiian, Pacific Islander, or Filipino (35%), and White (14%). Additional responses included Multiracial (10%), Black or African American (1%), and another race or ethnicity not listed (3%). The overall racial and ethnic distribution of the sample closely aligns with Santa Clara County’s kindergarten population. There was a slightly higher proportion of multiracial children in the sample and a slightly lower representation of children identified as Black or White compared to countywide estimates.
Exhibit 3. Racial and Ethnic Composition, KRA 2025 and Santa Clara Kindergarten County Population
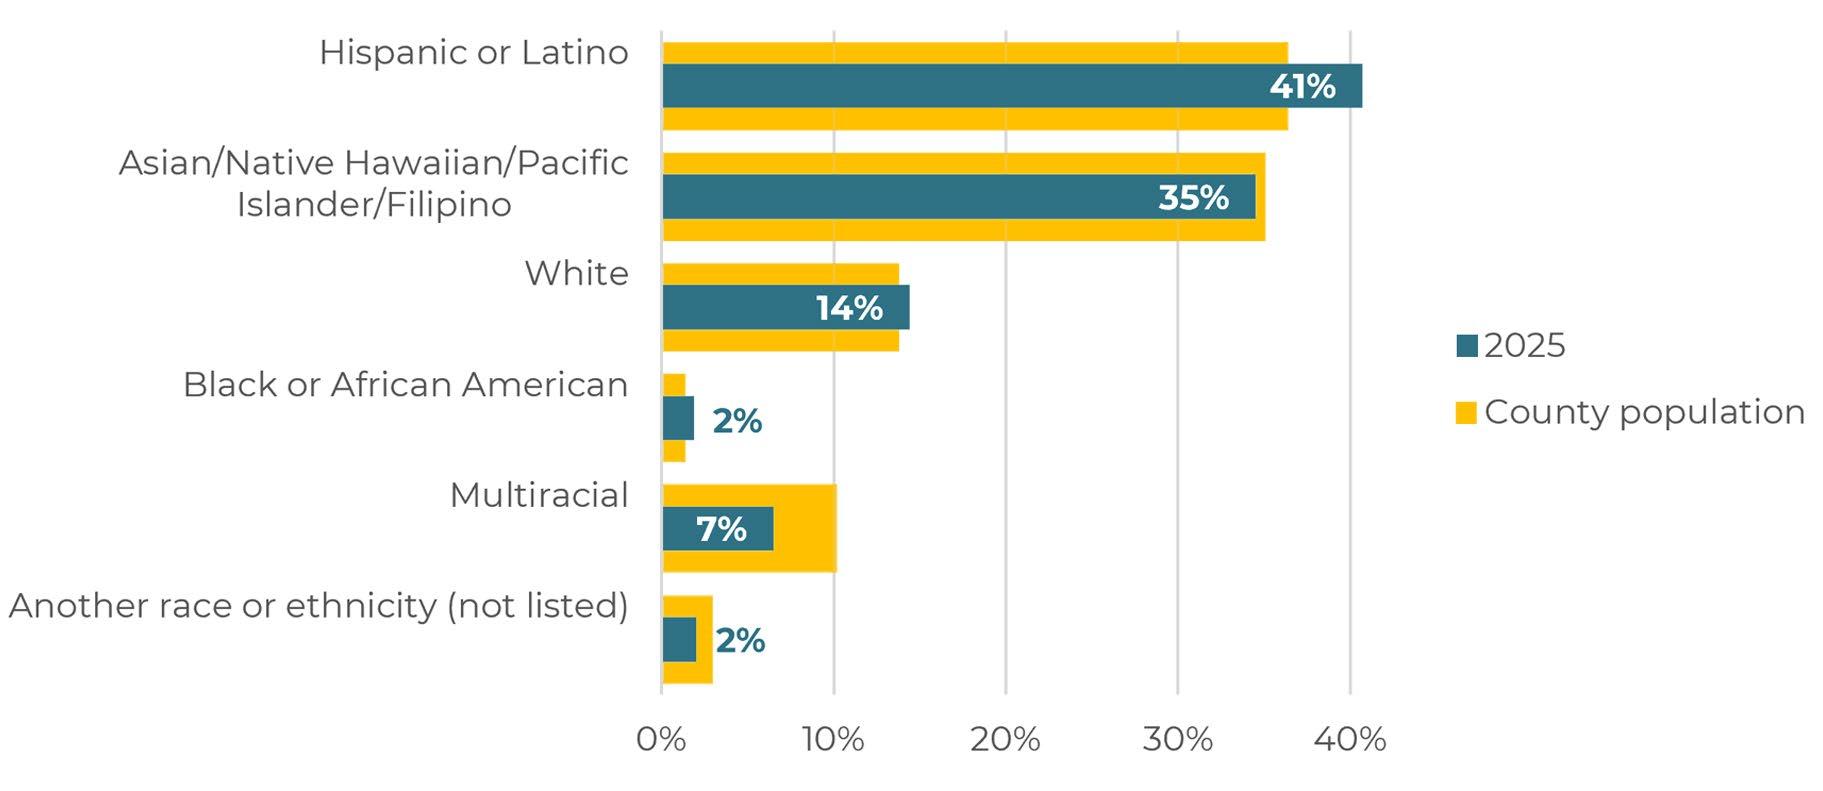
Source: Kindergarten Observation Form 2025, N = 705. California Department of Education (2024-25), N = 14,182. Another race or ethnicity includes American Indian or Alaska Native, Middle Eastern, North African, and Indian. Proportions of 5% or less are not labeled.
Caregivers were asked to report the language they most often use with their child at home. The most common home language was English (64%), followed by Spanish (22%), and Chinese, Cantonese or Mandarin at 5%. Other languages included Vietnamese (4%), Punjabi or Hindi (3%), Farsi or Dari (1%), and Tagalog or another Filipino language (1%). Forty-two percent of children were identified as emergent bilingual learners.
Exhibit 4. Primary Language Used by Families at Home, KRA 2025
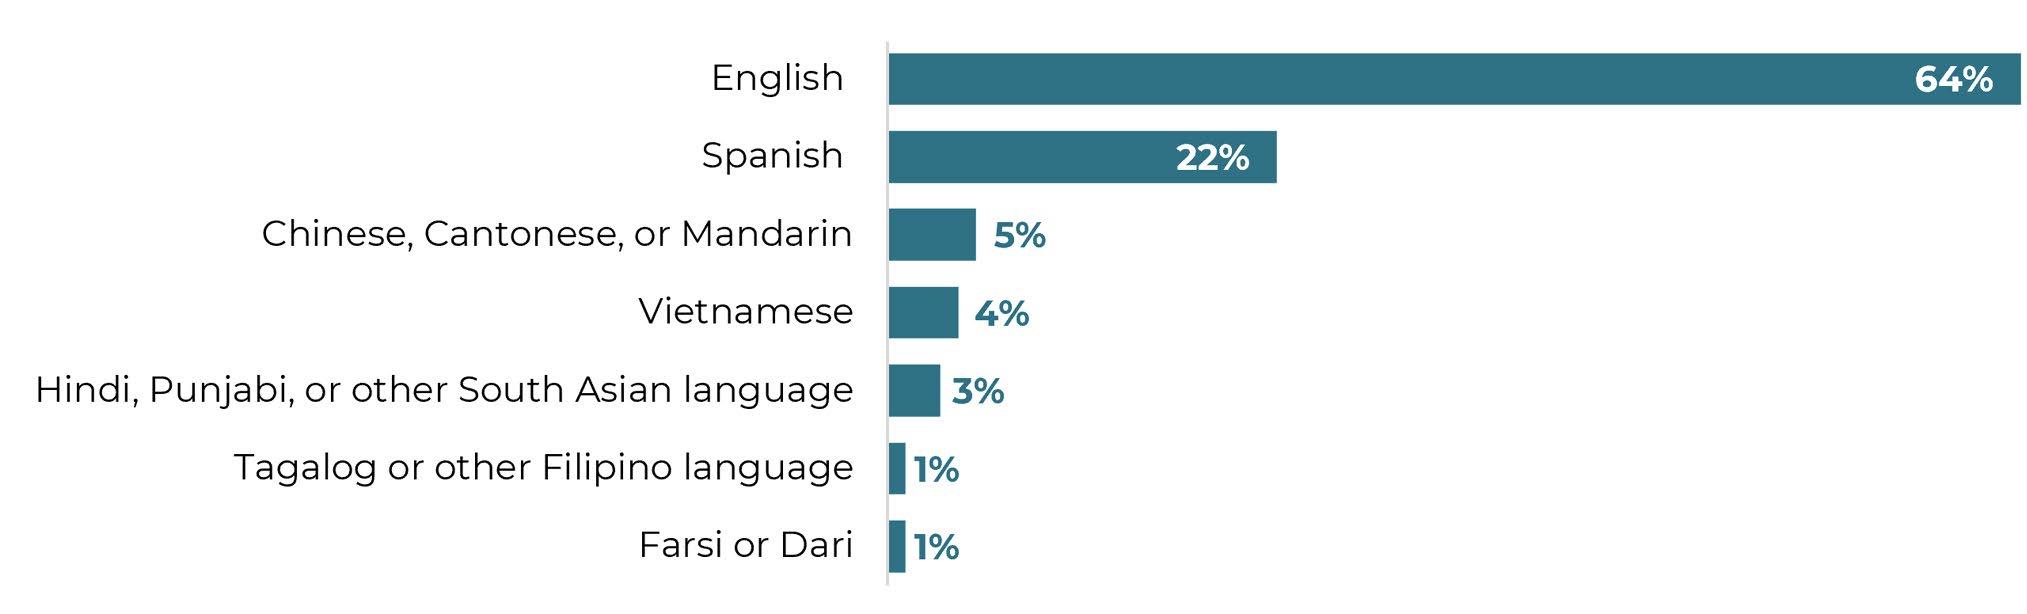
Source: Parent Information Form 2025. Kindergarten Observation Form 2025, N = 691. Note: When a PIF was not available, teachers provided the child’s primary language based on classroom knowledge, ensuring more complete representation in the data.

Families reported a broad range of annual household incomes. While 30% of participating households reported annual incomes of $200,000 or more, many families are raising young children on more modest incomes, with 20% reporting incomes under $25,000. By comparison, U.S. Census American Community Surveyvi data show that 40% of all Santa Clara County households earn $200,000 or more annually, and 8% earn less than $25,000. It is important to note that county-level Census data reflects all households, not just those with children entering kindergarten. Given that families with young children often have fewer earners or are earlier in their careers, some variation in income distribution is expected.

Household sizes ranged from 2–10 people, with an average of four.
Annual Household Income, KRA 2025 and Santa Clara County Households
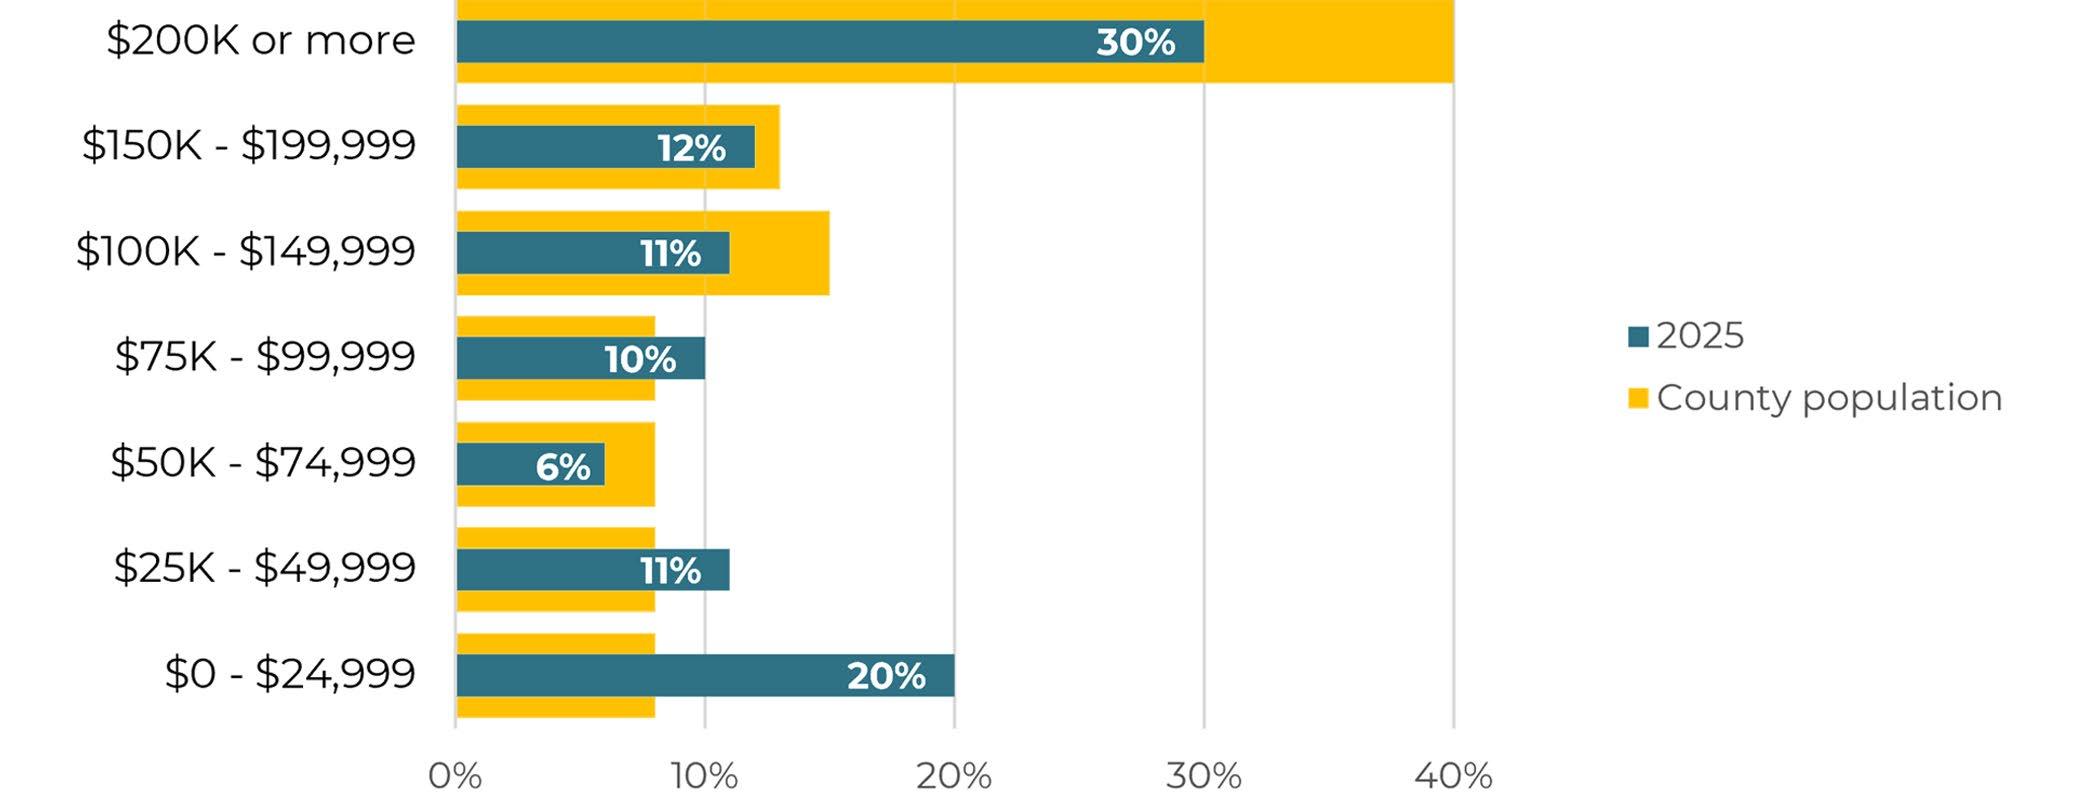
Source: Parent Information Form 2025, N = 272. U.S. Census Bureau, 2023 American Community Survey 5-Year Estimates, Table DP03, Santa Clara County N = 654,467.
Caregiver education levels varied across the 2025 KRA sample. Nearly three in five (58%) caregivers held a Bachelor’s degree or higher, while others reported completing an Associate degree, some college, a high school diploma or GED, or less than high school education.
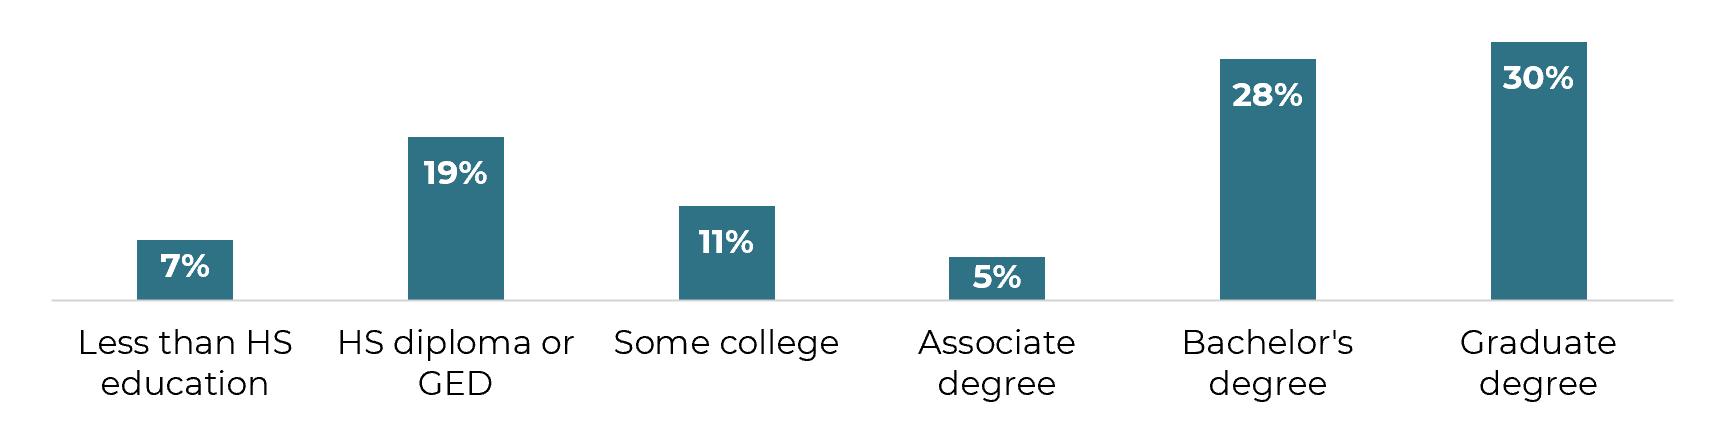
Source: Parent Information Form 2025. Kindergarten Observation Form 2025, N = 265.
Exhibit 5.
Exhibit 6. Highest Level of Education Among Caregivers, KRA 2025
The 2025 KRA sample was sufficiently large and statistically representative of the County in terms of racial and ethnic composition. A chi-square goodness-of-fit test confirmed that no significant differences existed between the sample and the countywide kindergarten population on this dimension, and data weighting was applied to ensure precise alignment. However, the sample may differ from the broader county population on other demographic, geographic, and socioeconomic characteristics. Additionally, participation in the study was voluntary for both teachers and caregivers. This means that those who participated may differ in important ways from families and students who did not participate. It is also important to interpret findings within the context of the data collection methods used. Teacher ratings on the KOF, while guided by standardized training, may still be influenced by implicit bias or variation in interpretation. Parent and caregiver responses on the parent survey may be affected by social desirability bias (responding in a way that feels socially acceptable) or reference bias (shaped by personal context and expectations). Given these limitations, the findings presented in this report provide valuable insights into trends at the county level, but generalizations to the full population should be made with appropriate caution.
KINDERGARTEN READINESS
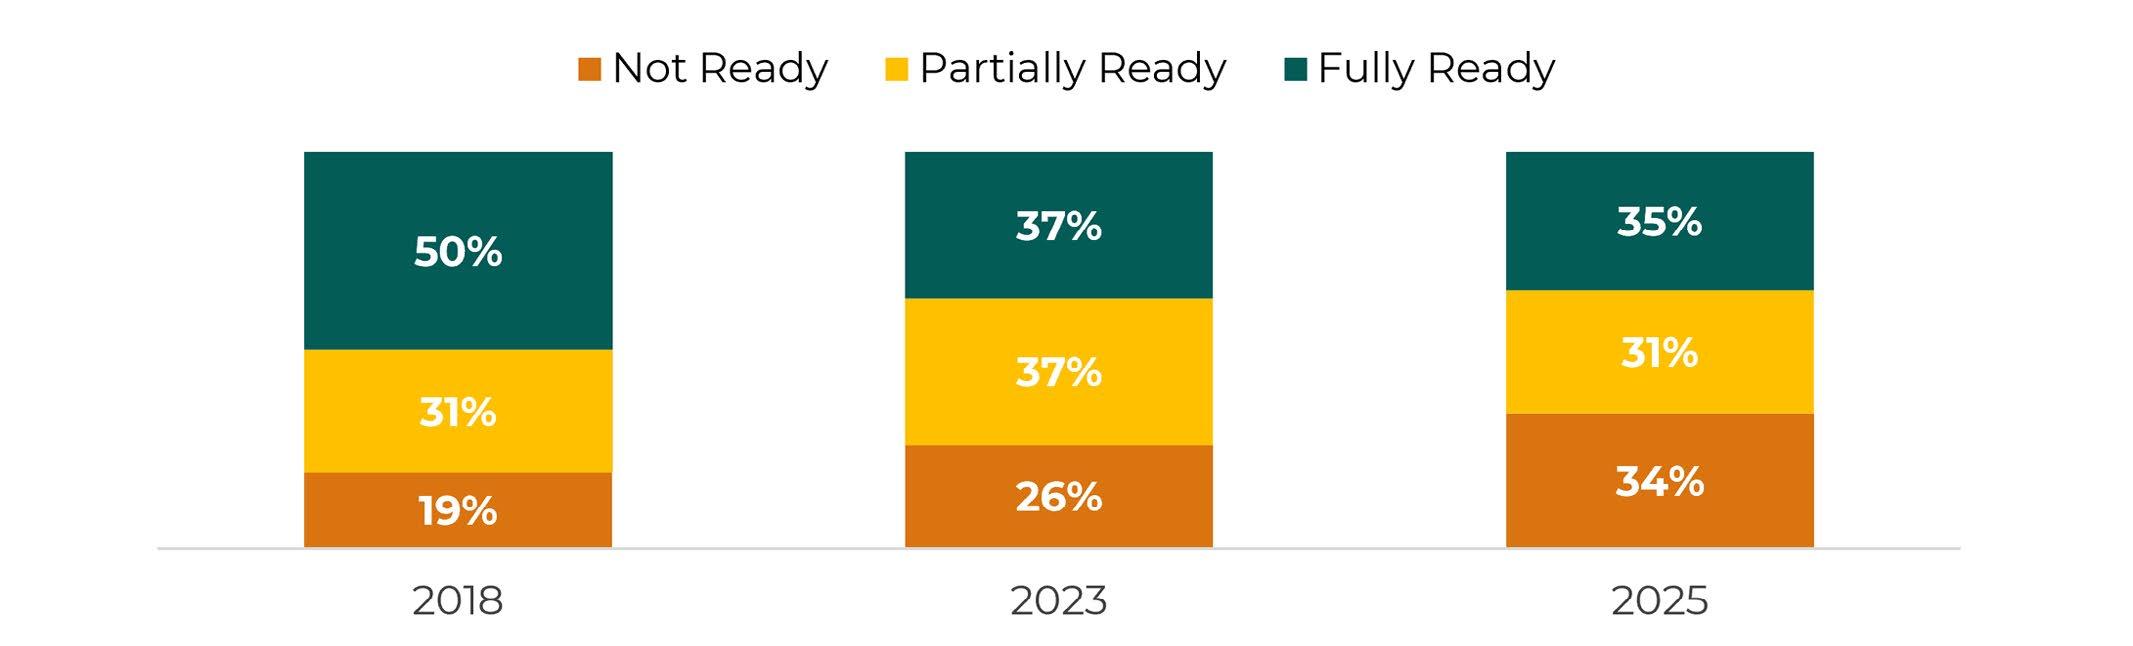
The KOF measured children’s readiness skills across three core domains: Self-Regulation, Social Expression, and Kindergarten Academics Scores ranged from 1 = Not Yet to 4 = Proficient. Children who scored 3.25 or higher in all three domains were considered Fully Ready for kindergarten, reflecting a validated readiness benchmark linked to later academic achievement.2 Those who scored below 3.25 in all domains were classified as Not Ready, while those who met the benchmark in one or two domains were considered Partially Ready. In 2025, 35% of children were Fully Ready, showing proficiency across all key domains, while 31% were Partially Ready and 34% were Not Ready
Fully
Ready for kindergarten
Between 2018 and 2025, the percentage of children classified as Fully Ready decreased from 50% to 35%, while the proportion of children classified as Not Ready increased from 19% to 34%. The percentage of children who were Partially Ready remained relatively stable, ranging from 31% to 37% over the three assessment years.
Exhibit 7. Trends in Kindergarten Readiness, KRA 2018–2025
INTERPRETING READINESS TRENDS OVER TIME
When interpreting changes in kindergarten readiness over time, it is important to consider both cohort differences and the scope of the assessment. The share of children identified as Fully Ready declined from 2018 to 2023 and remained relatively stable in 2025 compared to 2023. Children entering kindergarten in 2023 and 2025 were born closer to or during the COVID-19 pandemic and experienced early childhood during a period of widespread disruption to early learning, healthcare access, developmental supports, and social interaction. As a result, lower readiness levels in 2023 and 2025 likely reflect the lasting effects of pandemic-era disruptions rather than a decline in family engagement or system effort.
Source: Kindergarten Observation Form. 2025 N = 705. 2023 N = 918. 2018 N = 1,184. Weighting was applied to align the sample’s racial and ethnic distribution with the Santa Clara County kindergarten population.
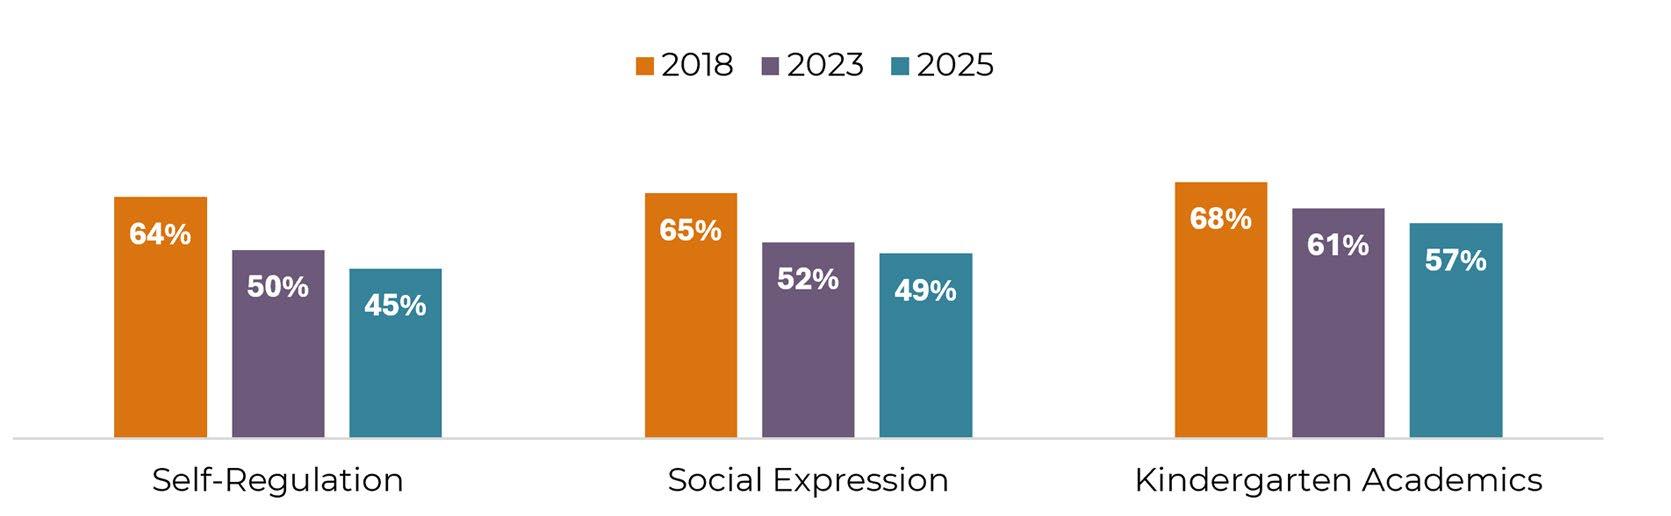
The percentage of children ready in each domain ranged from 45% to 57%, and readiness was highest in the Kindergarten Academics domain. Across all three domains, readiness levels declined slightly compared to previous years.
Exhibit 8. Percentage of Children Fully Ready for Kindergarten by Domain, KRA 2018–2025
Source: Kindergarten Observation Form. 2025 N = 704-705. 2023 N = 917 - 951. 2018 N = 1,186-1,249. Weighting was applied to align the sample’s racial and ethnic distribution with the Santa Clara County kindergarten population.
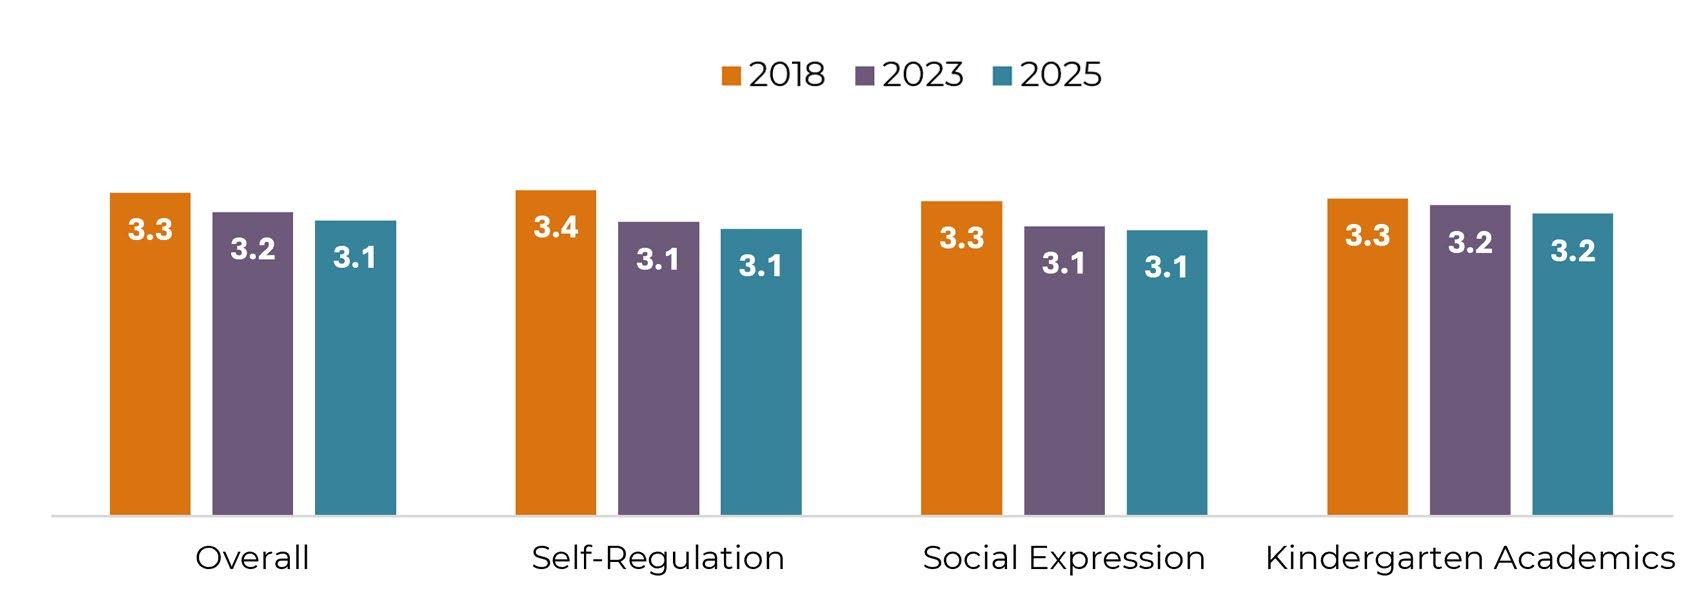
In 2025, children’s average scores on the KOF ranged from 3.06 to 3.18 across the three readiness domains, with the highest average score in the Kindergarten Academics domain (3.2). The overall readiness score was 3.1. Since 2018, average scores have shown a gradual decline across all domains and overall. The largest change over time was observed in Self-Regulation, which decreased from 3.35 in 2018 to 3.07 in 2025.
Exhibit 9. Average Kindergarten Readiness Scores by Domain, KRA 2018–2025
Source: Kindergarten Observation Form. 2025 N = 704-705. 2023 N = 917 - 951. 2018 N = 1,186-1,249. Weighting was applied to align the sample’s racial and ethnic distribution with the Santa Clara County kindergarten population.

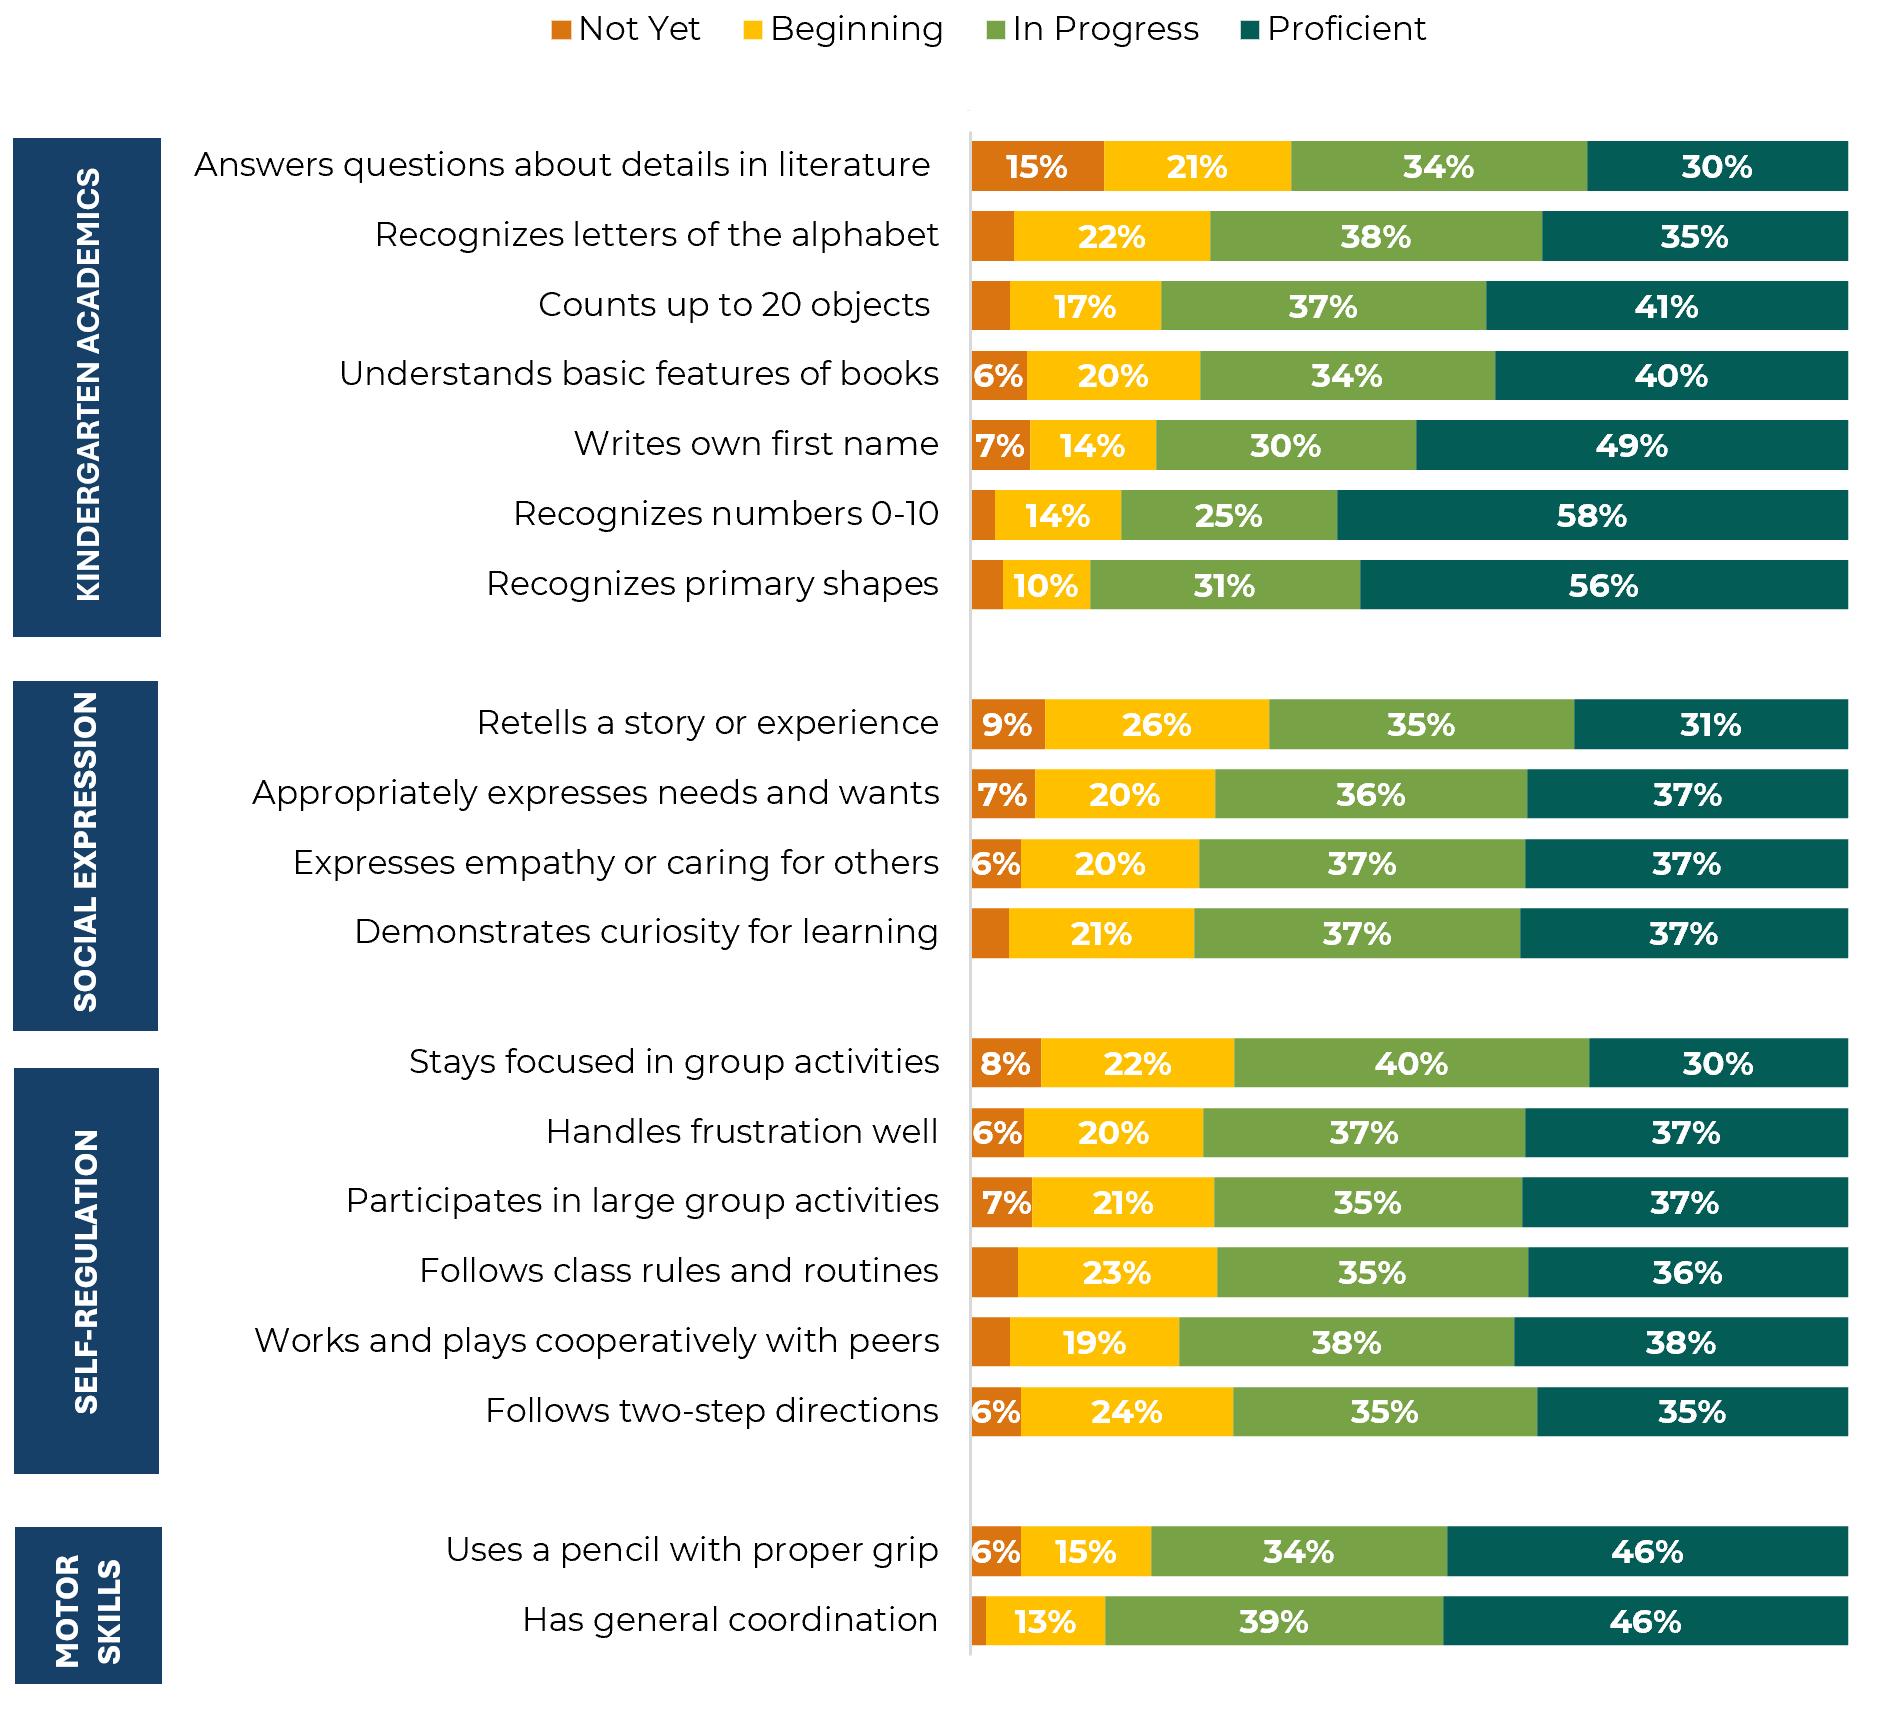
The exhibit below shows the distribution of scores across the 19 items on the KOF. Children in the sample entered kindergarten most proficient in skills such as recognizing numbers and shapes, writing their first name, using a pencil with proper grip, and showing general coordination. Foundational literacy, comprehension, and self-regulation skills—such as answering questions about a story, retelling a story or experience, and staying focused in group activities—were more often still developing.
Exhibit 10. Distribution of Proficiency Levels Across School Readiness Skills, KRA 2025
Source: Kindergarten Observation Form 2025, N = 649 - 705. Proportions of 5% or less are not labeled.
MALLEABLE ASSETS ASSOCIATED WITH OVERALL READINESS
To better understand which factors are most closely associated with children’s overall readiness for kindergarten, a multilevel regression analysis was used to examine patterns in the data while accounting for classroom-level differences and demographic factors. The goal was to identify malleable assets—factors that families, schools, and communities can support—that were most strongly linked with higher readiness scores in the 2025 KRA sample.3
Many of the experiences and conditions associated with higher readiness were areas that could be supported through early learning systems, community engagement, and family resources. These included having basic needs met, attending formal early learning program, caregiver education, low weekday screentime, and engaging in kindergarten transition activities.
Exhibit 11. Key Predictors of Overall School Readiness (in Order of Strength), KRA 2025
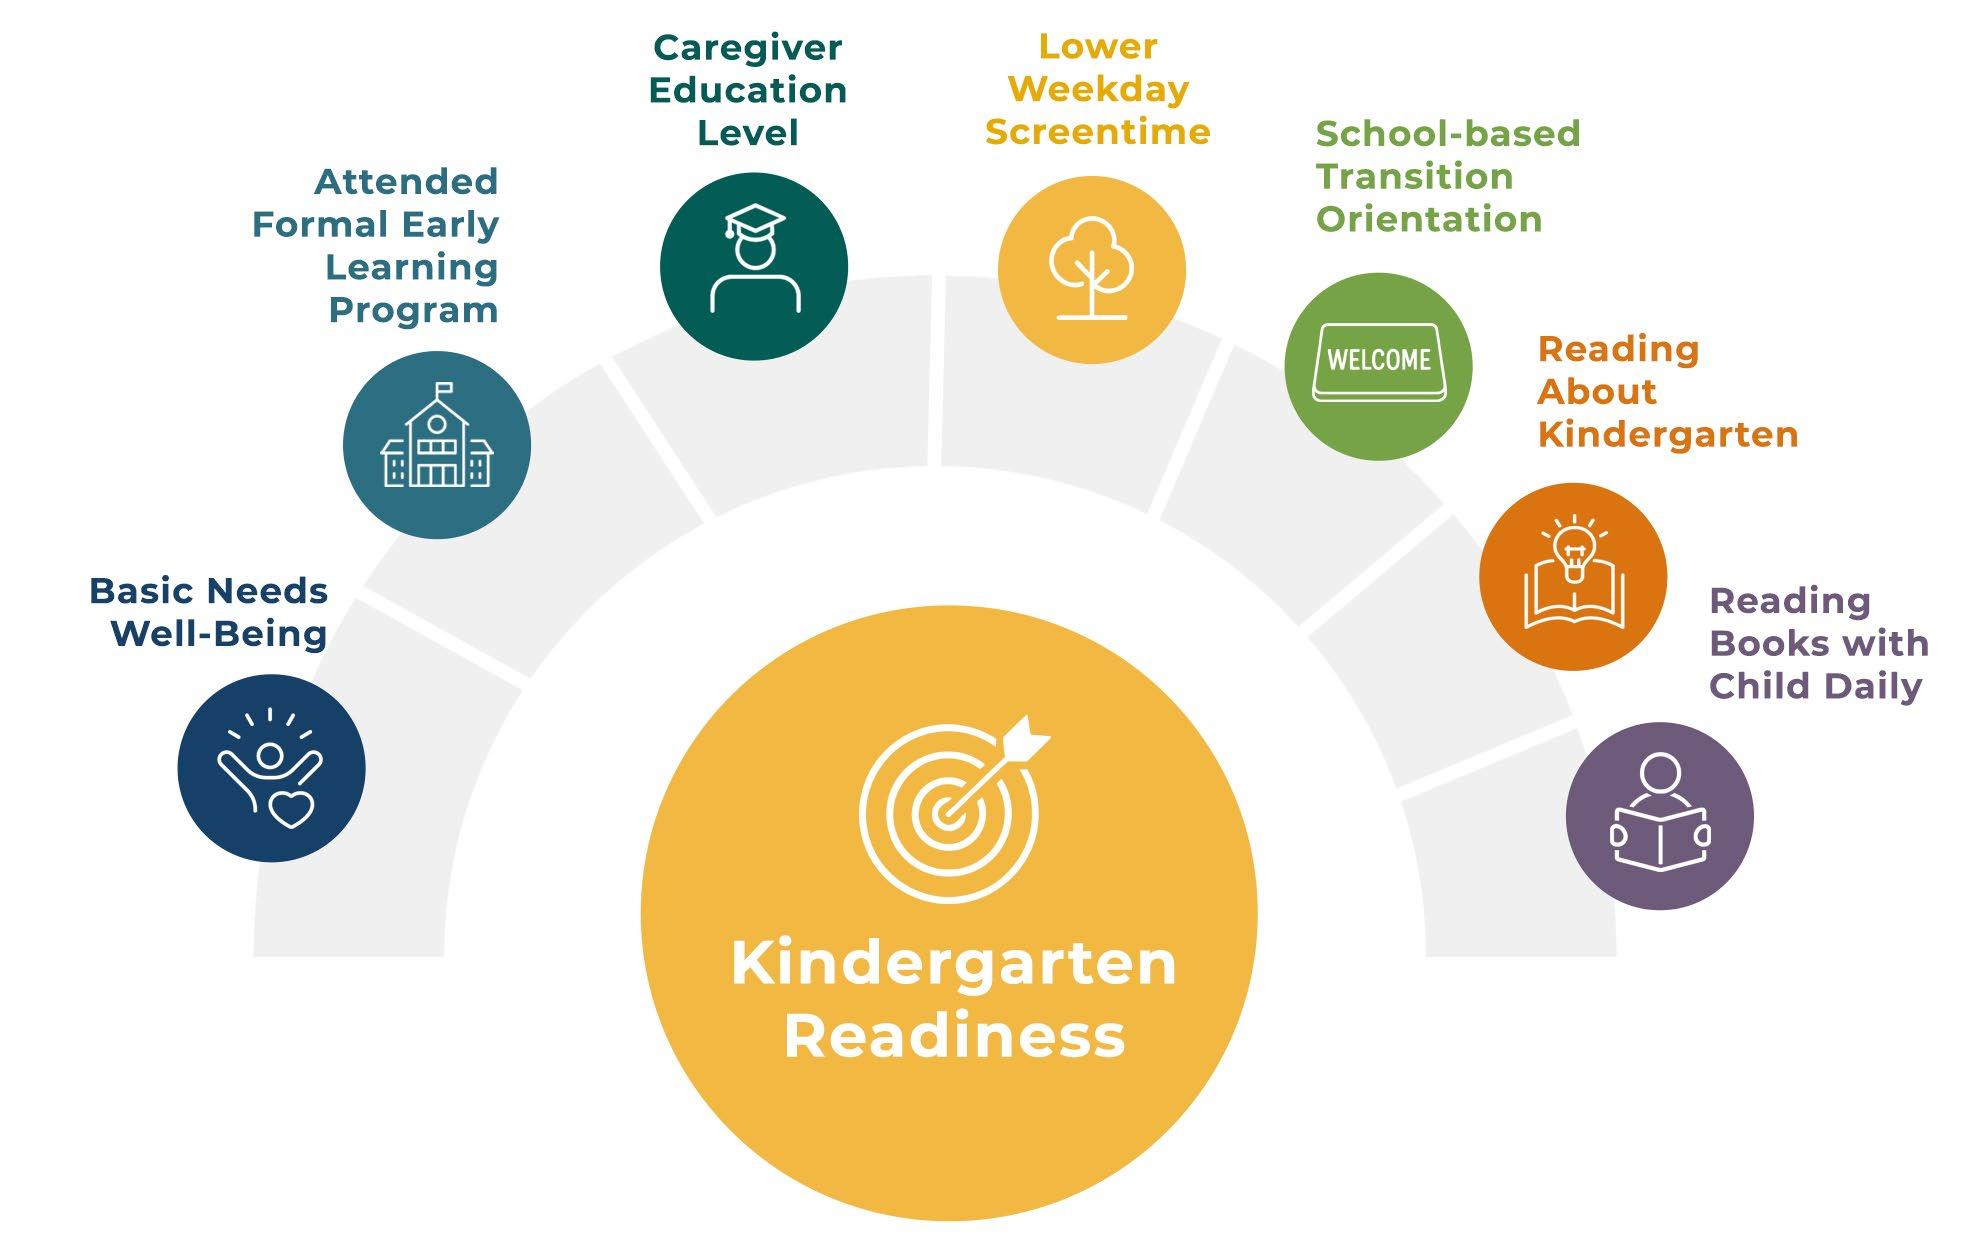
Source: Kindergarten Observation Form 2025, Parent Information Form 2025. N = 321. Weighting was applied to align the sample’s racial and ethnic distribution with the Santa Clara County Kindergarten population. The model controlled for age and special need designation. The overall model accounted for 39% of the variance in school readiness scores (R2 = 0.39), and the predictors were associated with readiness at the p < .05 level.
3 It is important to note that these analyses are correlational, not causal. The findings reflect associations observed within the 2025 sample and cannot determine cause and effect. In addition, there are likely other factors that influence readiness that were not included in this assessment.
The factors most strongly associated with readiness outcomes were (in order of strength):
BASIC NEEDS WELL-BEING4
FORMAL EARLY LEARNING PROGRAM
CAREGIVER EDUCATION LEVEL
LOWER WEEKDAY SCREENTIME
SCHOOL-BASED TRANSITION ORIENTATION
READING ABOUT KINDERGARTEN
READING BOOKS WITH CHILD DAILY
Children who appeared well-rested and well-fed in class demonstrated the highest readiness scores, underscoring the importance of consistent sleep, nutrition, and routines.
Children who attended a formal early learning program (e.g., preschool or center, family child care home, Transitional Kindergarten, Head Start) demonstrated higher readiness scores, highlighting the potential value of structured early learning experiences.
Readiness scores were higher among children whose caregiver had earned a Bachelor’s degree or higher, pointing to the broader influence of caregiver education on early development.
Children with less weekday screen time were more likely to demonstrate higher readiness, suggesting that reduced screen use may support more active and enriching daily routines.
Participation in a school-based orientation about kindergarten transitions was positively associated with readiness, pointing to the potential value of early engagement with kindergarten expectations.
Caregivers’ engagement in reading about kindergarten (e.g., books or articles) was associated with higher readiness scores, reflecting the possible benefits of learning what to expect and how to prepare.
Children who read books with a caregiver daily (6-7 days per week) also tended to score higher, reinforcing the value of frequent shared reading as a home-based learning activity.
CUMULATIVE EFFECT OF MALLEABLE ASSETS
Children in the 2025 sample who had access to more readiness-related supports, or malleable assets, tended to demonstrate higher overall readiness. Among those with only one to two malleable assets, fewer than 10% were Fully Ready. Among children with five or six malleable assets, the proportion who were Fully Ready increased significantly.
Exhibit 12. Percentage Fully Ready by Number of Malleable Assets, KRA 2025
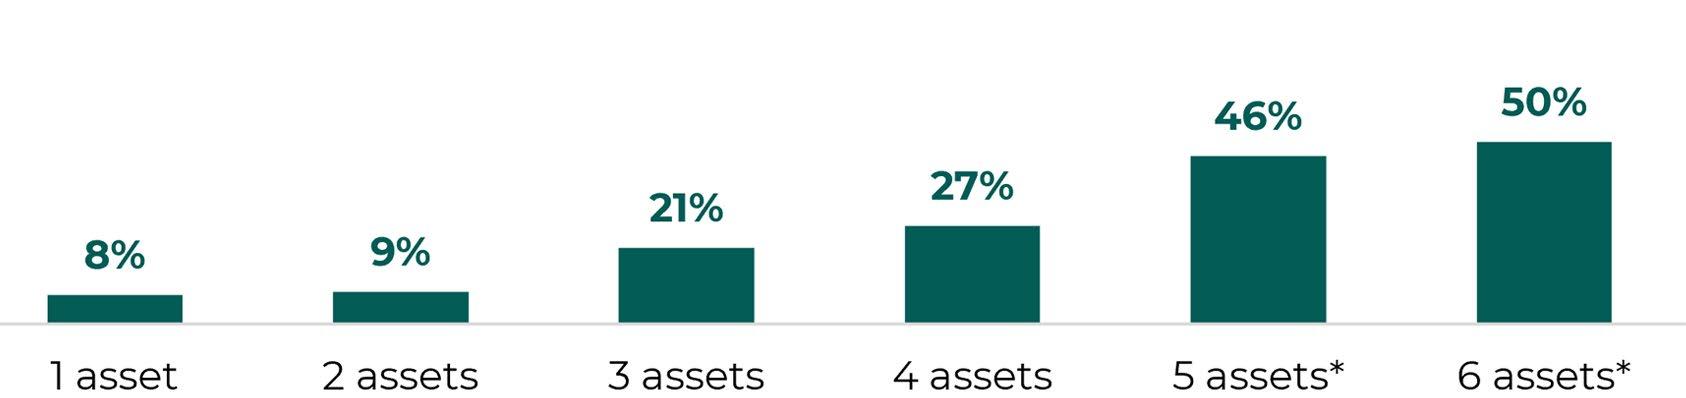
Source: Kindergarten Observation Form 2025, Parent Information Form 2025. N = 321. Weighting was applied to align the sample’s racial and ethnic distribution with the Santa Clara County kindergarten population. Differences in percent Fully Ready are statistically significant at *p < .05.
4 According to child’s teacher. All other factors reported by child’s caregiver.
GEOGRAPHIC DIFFERENCES IN READINESS
The maps below show variation in average kindergarten readiness across different school ZIP Codes in Santa Clara County, alongside the average number of malleable assets reported by families in each area. In areas where families reported more of these assets, children tended to have higher average readiness scores. While these patterns do not explain all differences, they highlight how community context and access to resources may play a role in shaping early learning experiences.
Exhibit 13. Average Kindergarten Readiness Scores and Number of Assets, by School ZIP Code, KRA 2025
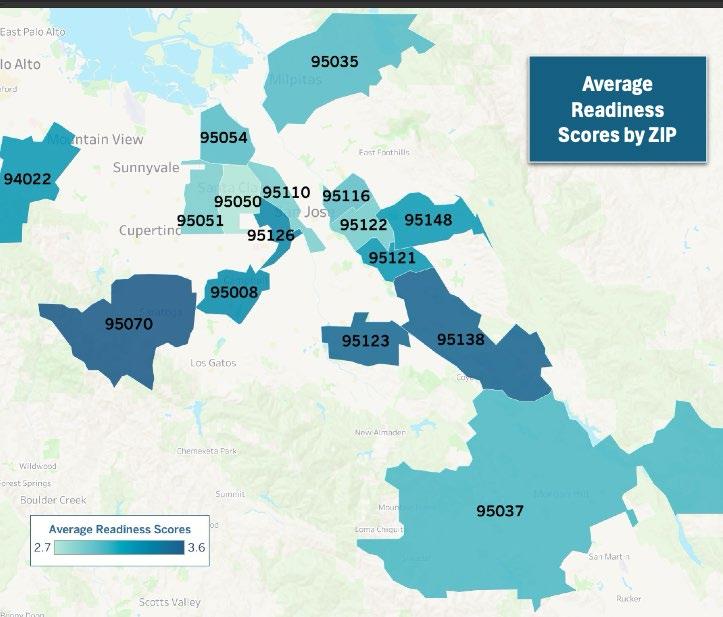
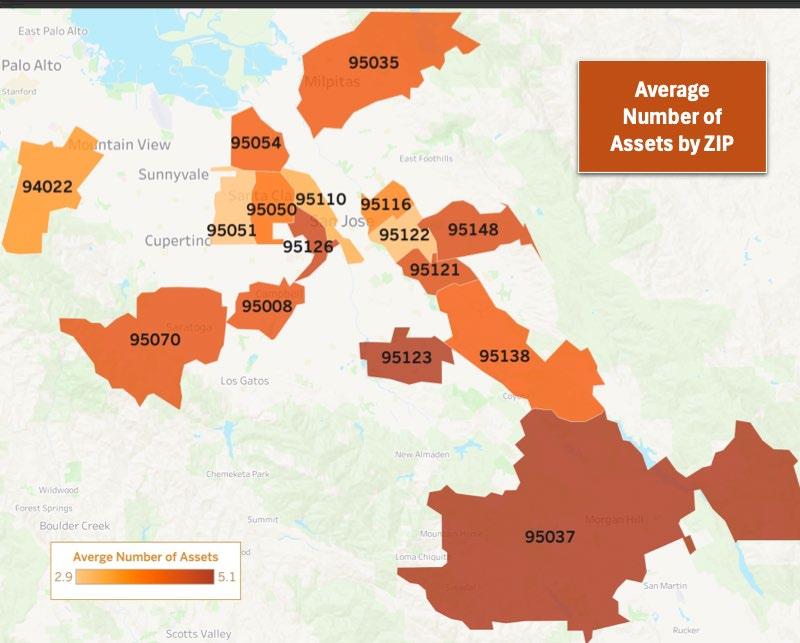
Source: Kindergarten Observation Form. 2025 N = 321.
DEMOGRAPHIC DIFFERENCES IN READINESS
This section examines patterns in kindergarten readiness across key demographic groups, including race and ethnicity, English proficiency, and disability status. The findings describe how readiness varies across groups within the 2025 sample.
Race and Ethnic Differences
Average readiness scores varied somewhat across racial and ethnic groups, though the overall size of these differences was relatively small. Children identified as Asian, Native Hawaiian, Pacific Islander, or Filipino had the highest average readiness score, followed by White and Multiracial children. Hispanic or Latino children had lower average scores, and Black or African American children had the lowest average. The number of Black or African American children in the sample was relatively small, and these results should be interpreted with caution.

Source: Kindergarten Observation Form. 2025 N = 682.
Exhibit 14. Average Kindergarten Readiness Scores by Racial and Ethnic Composition, KRA 2025
Children with Emerging English Proficiency
Children with emerging English proficiency—defined based on home language and observed communication in the classroom—had slightly lower average readiness scores than children who were proficient in English.
Exhibit 15. Average Kindergarten Readiness Scores by English Proficiency, KRA 2025

Source: Parent Information Form 2025. Kindergarten Observation Form 2025, N = 691. Weighting was applied to align the sample’s racial and ethnic distribution with the Santa
READINESS OF CHILDREN
Children with Disabilities
In 2025, approximately 10% of children in the sample were identified as having a disability. On average, children with identified disabilities had lower readiness scores than children without identified disabilities.
Exhibit 16. Average Kindergarten Readiness Scores by Disability Status, KRA 2025

Source: Parent Information Form 2025. Kindergarten Observation Form 2025, N = 705. Weighting was applied to align the sample’s racial and ethnic distribution with the Santa Clara County kindergarten population. .
INTERPRETING DEMOGRAPHIC DIFFERENCES IN READINESS
Differences in readiness across demographic groups should be interpreted with care. This analysis describes patterns within the sample and does not examine the underlying factors that may contribute to these differences. Results should not be interpreted as reflecting inherent differences between groups. Findings elsewhere in this report highlight the importance of factors such as access to early learning experiences, family supports, and stable environments in shaping children’s readiness for kindergarten.
Clara County kindergarten population.
CAREGIVER PERCEPTIONS OF KINDERGARTEN READINESS
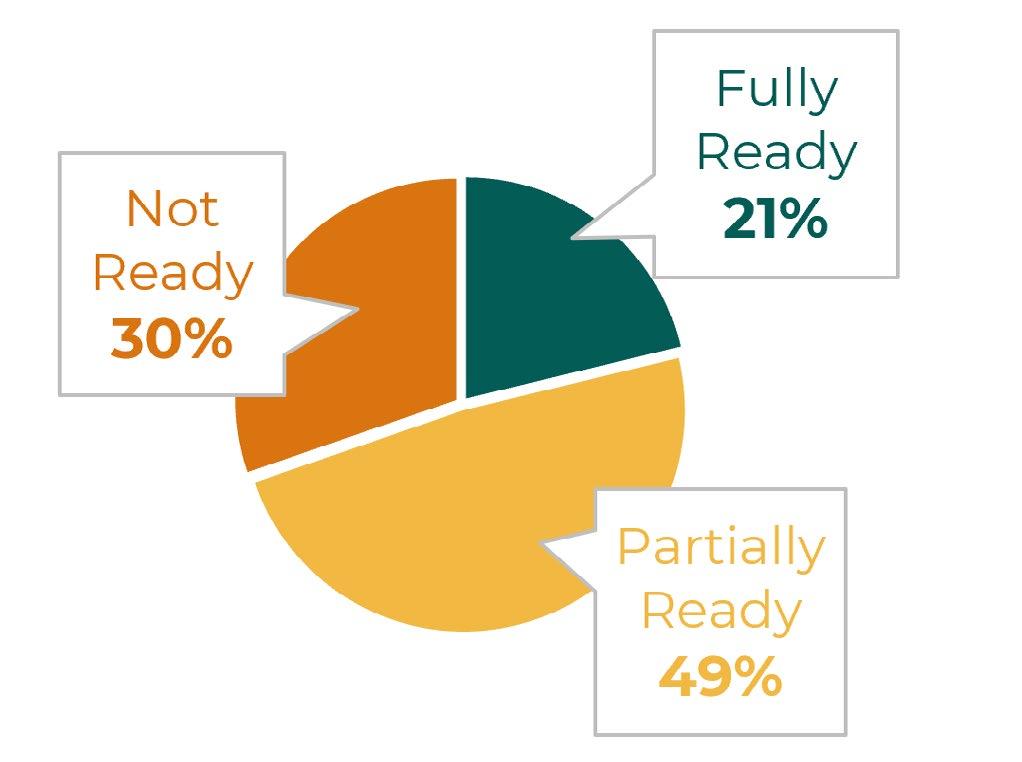
Across the three core domains (Self-Regulation, Social Expression, and Kindergarten Academics), 21% of children were rated by their caregiver as Fully Ready for kindergarten, meaning they “consistently show” skills in all areas of development.
Caregiver perceptions reflected patterns similar to teacher assessments. Teachers identified 35% of children as Fully Ready and 34% as Not Ready, while caregivers reported 21% and 30%, respectively. Although caregivers were somewhat more likely to describe children as Partially Ready, the overall patterns were consistent, suggesting that families have a strong understanding of their child’s readiness as they enter kindergarten.
Source: Parent Information Form 2025. N = 321.
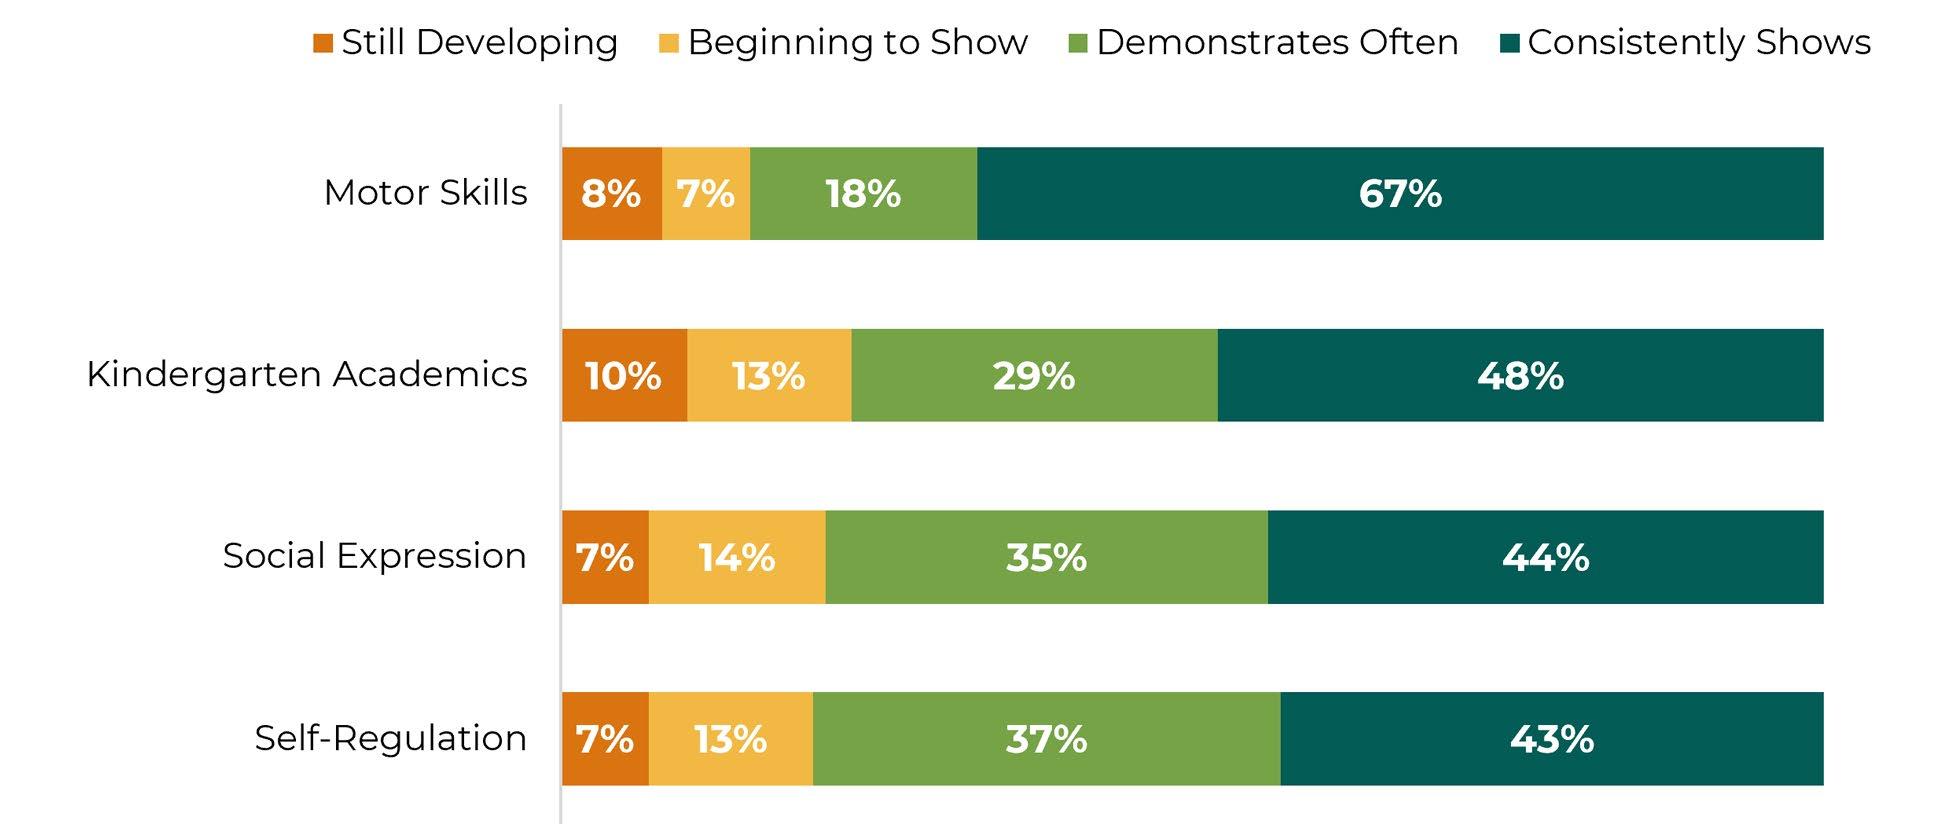
Caregivers in Santa Clara County reported that children are entering school with a strong foundation across key areas of development. Motor Skills was the most commonly endorsed strength, with 67% of caregivers saying their child “consistently shows” these skills, indicating strong perceived physical readiness. Across all four developmental areas, at least three in four caregivers reported their children were either “demonstrating often” or “consistently” showing the readiness skills—reflecting a broad and encouraging perception of readiness as children begin school.
Source: Parent Information Form 2025. N = 321.
Exhibit 17. Caregiver Perceptions of Kindergarten Readiness, KRA 2025
Exhibit 18. Caregiver Perceptions of Kindergarten Readiness by Domain, KRA 2025

SECTION SUMMARY: READINESS OF CHILDREN
Most children entered kindergarten with meaningful strengths. In 2025, two-thirds of children were Fully or Partially Ready, demonstrating foundational skills in one or more key readiness domains.
Early academic skills were the strongest area of readiness, with many children proficient in recognizing numbers and shapes, using a pencil with proper grip, and writing their first name.
Self-regulation emerged as a key priority growth area. Many children were still developing skills related to focus, sustained attention, and engagement in group activities. This domain represents a high-impact opportunity for early learning, family, and school-based supports.
Several family, school, and community experiences were closely linked to higher readiness, including having basic needs met, attending a formal early learning program, and higher caregiver education levels. Daily shared reading, limited weekday screen time, and participation in kindergarten transition activities were also positively associated with readiness.
Community context was associated with readiness. Geographic patterns showed that access to resources and supports aligns with higher readiness, pointing to opportunities for targeted, placebased strategies.
Caregivers generally shared positive perceptions of their children’s readiness by domain, with more than three in four indicating that their child often or consistently demonstrated skills in each area of development.
EARLY LEARNING ACCESS
Access to quality early care and education (ECE) remains one of the strongest and most consistent predictors of kindergarten readiness. In 2025, 86% of children in the sample had attended a formal early learning program—higher than in previous years.
More than half of participating families indicated their child attended transitional kindergarten (TK) in the year before kindergarten. At the same time, fewer families reported enrolling their child in a licensed preschool or center-based care, with a noticeable shift toward summer programs and care by family, friends, or neighbors. These patterns suggest families are navigating multiple pathways into kindergarten, depending on what is available and accessible to them.
Between 2023 and 2025, there was a statistically significant 19% increase in TK participation and a 16% decrease in licensed preschool attendance. These shifts occurred alongside the continued expansion of transitional kindergarten (TK) across Santa Clara County and the state, which has broadened access to early learning opportunities for more families.
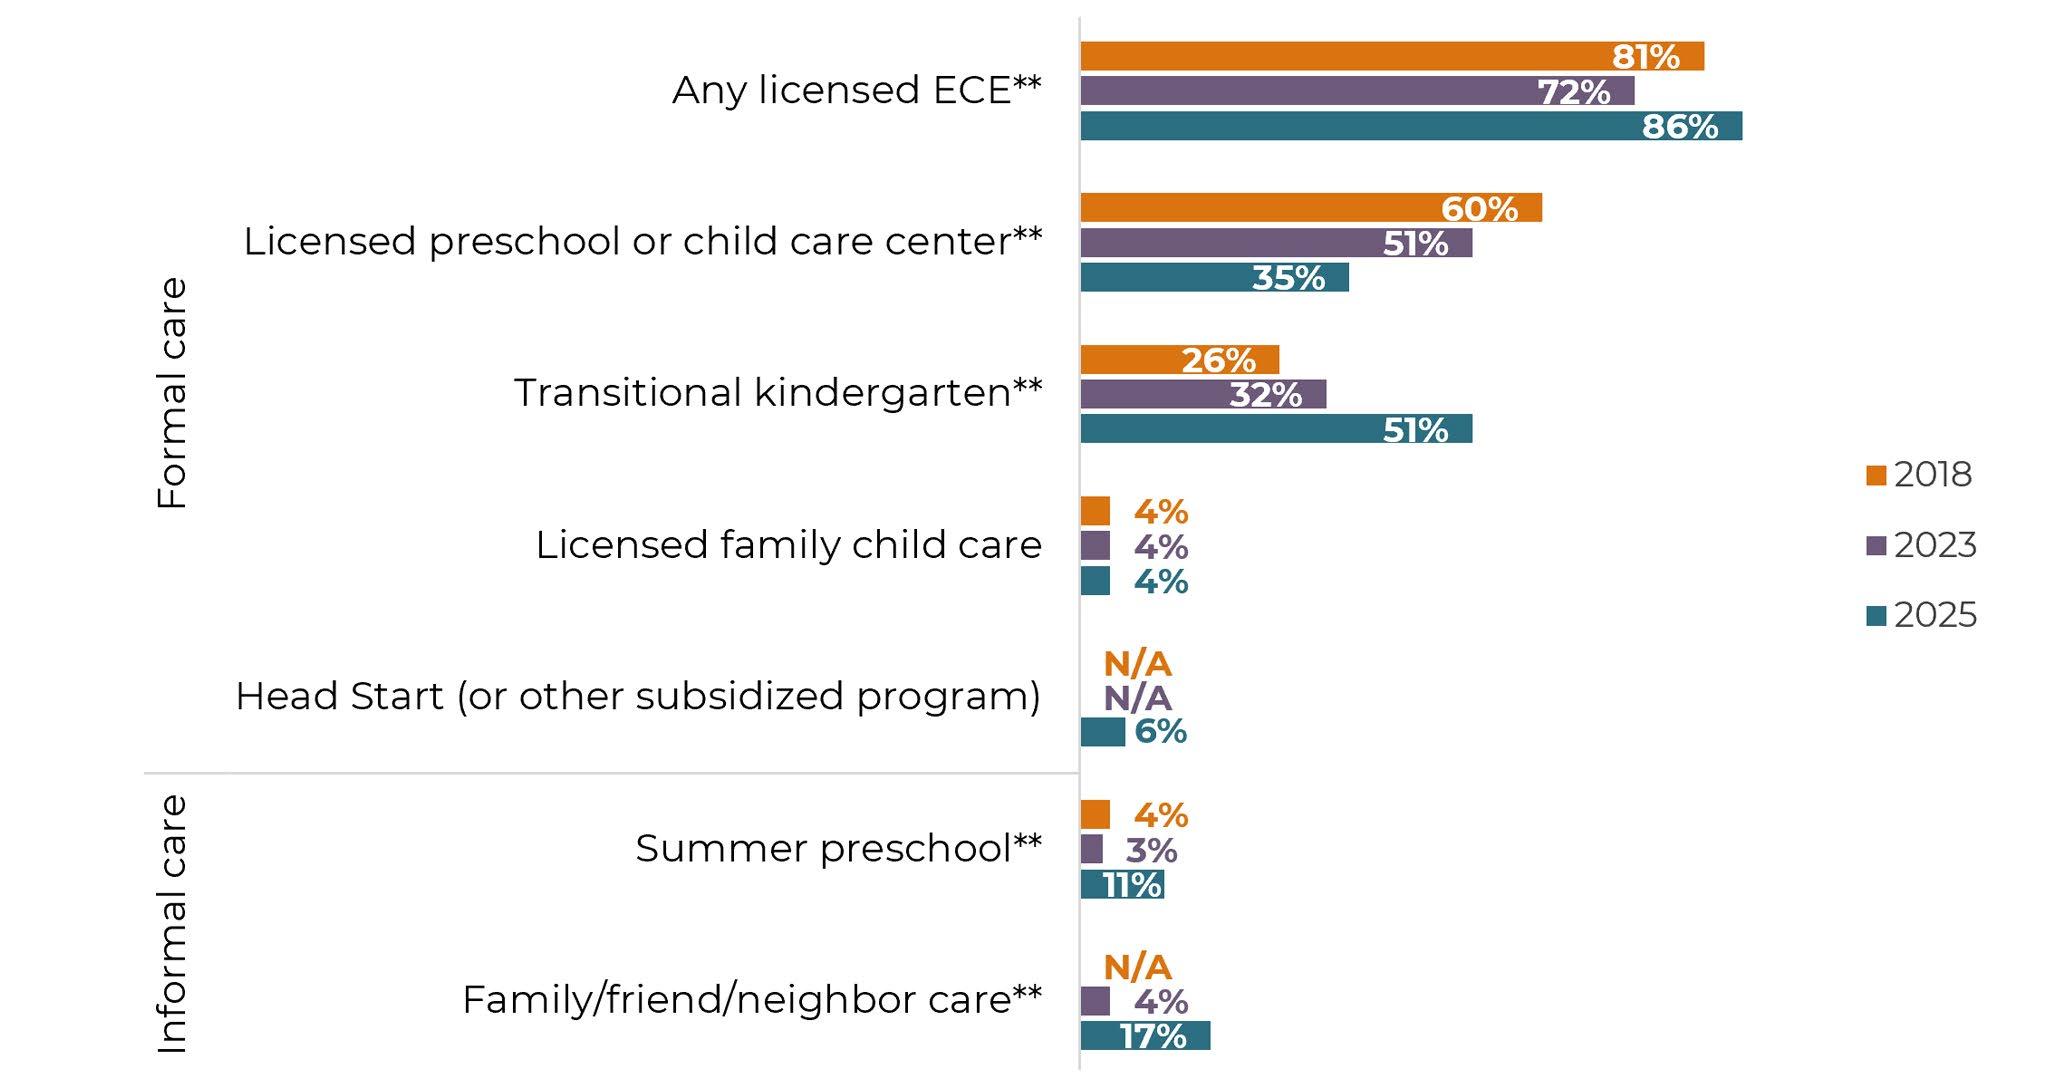
Source: Parent Information Form. 2025 N = 321. 2023 N = 674. 2018 N = 941-1,183. N/A indicates that the item was not included in the survey for that year. Differences between 2023 and 2025 were significant at **p < .01. of children attended a formal early learning program
Exhibit 19. Participation in Early Learning Experiences Prior to Kindergarten, KRA 2018-2025
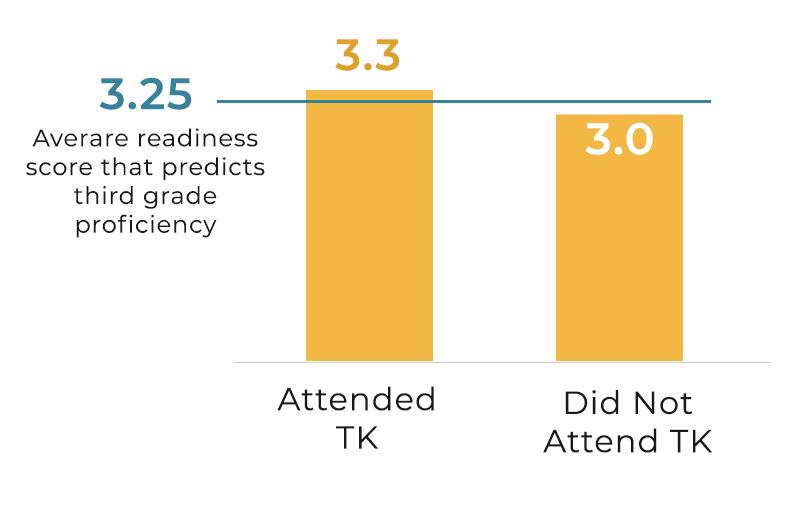
Children who attended Transitional Kindergarten entered kindergarten with significantly higher readiness scores, reinforcing the value of expanded access to formal early learning opportunities.
Family-Reported Challenges Accessing Early Learning
In 2025, families were asked for the first time about challenges they may have faced in accessing child care or preschool. While many families reported having no difficulty (45%) or not needing care (25%), others described barriers that made access harder. Cost was the most common challenge, followed by limited availability during needed hours and transportation issues. Some families also shared that there were no programs available in their area or that the programs they found weren’t a good fit for their child. A small number expressed concerns about quality.
20. Barriers to Accessing Child Care or Preschool, KRA 2025
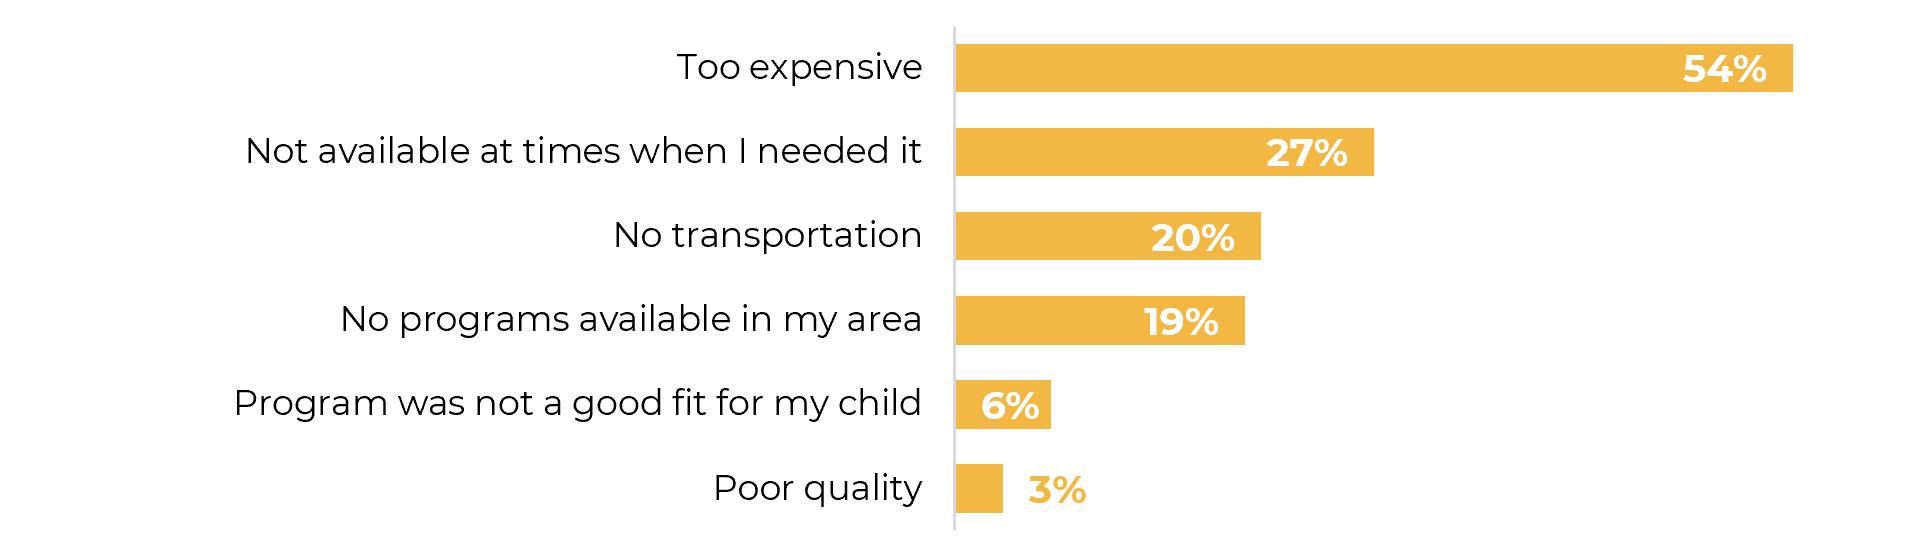
Source: Parent Information Form. 2025 N = 97. Percentages include only the sample of caregivers reporting at least one challenge.

Exhibit
COMMUNITY RESOURCES AND SUPPORTS
Use of Parenting Programs, Services, and Supports
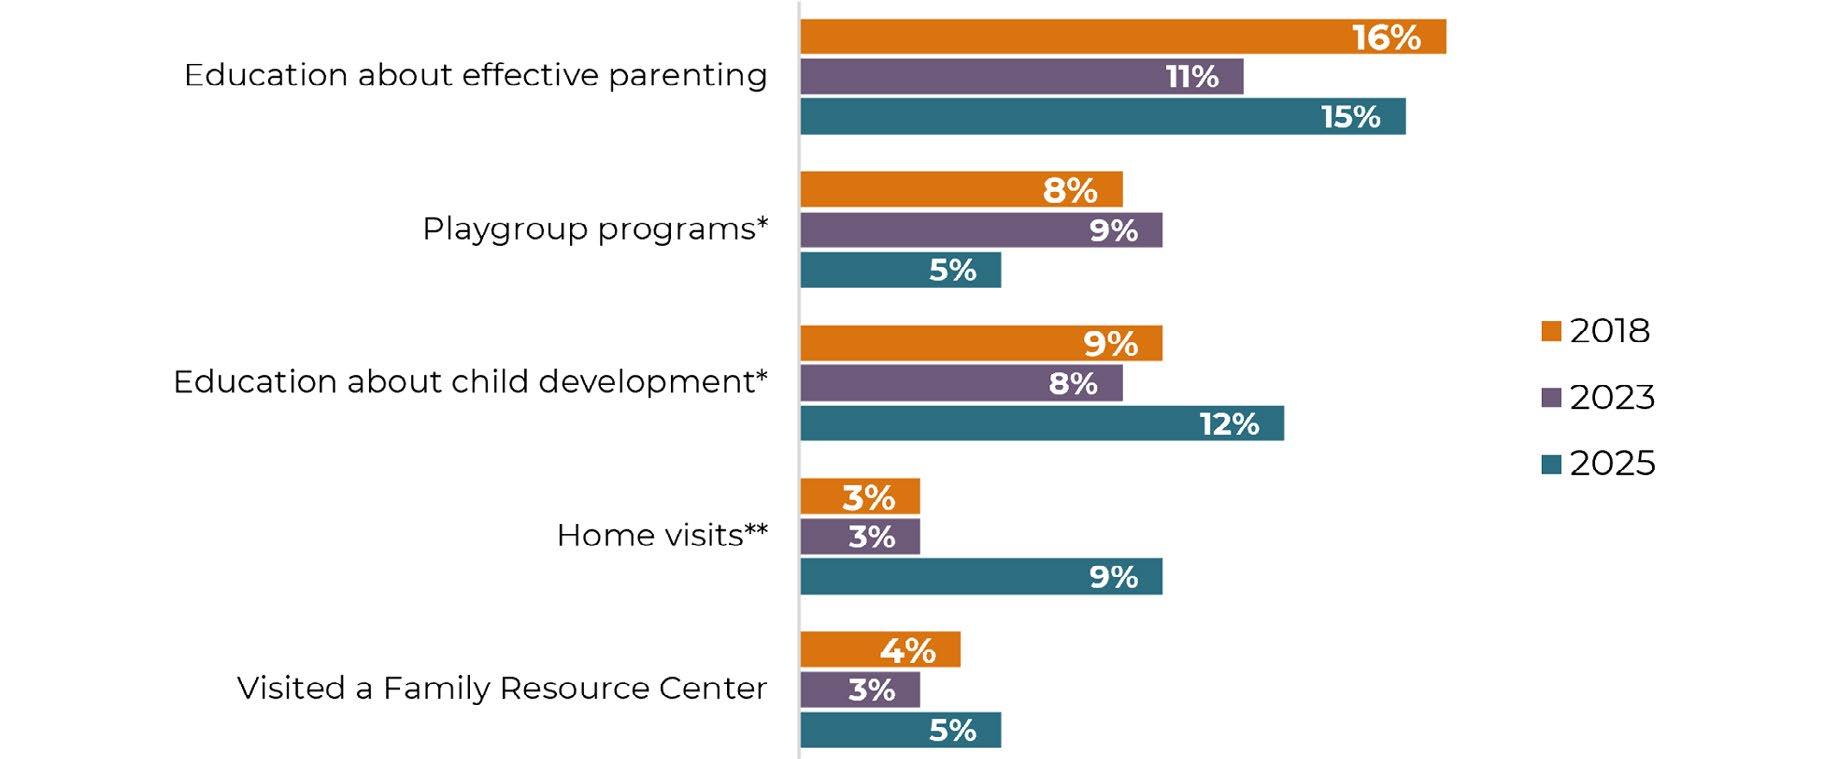
In 2025, one in four families reported using at least one parenting-related program, service, or support. The most commonly used resources included education about effective parenting and child development. More families also reported receiving home visits than in past years, while fewer participated in playgroups. These shifts show greater engagement with individualized and informational supports, alongside reduced participation in group-based activities.
Exhibit 21. Families’ Use of Parenting Programs, Services, and Supports, KRA 2018-2025
Source: Parent Information Form. 2025 N = 280. 2023 N = 664. 2018 N = 890. Differences between 2023 and 2025 were significant at **p < .01 and * p < .05.
Families’ Use of Local Community Resources
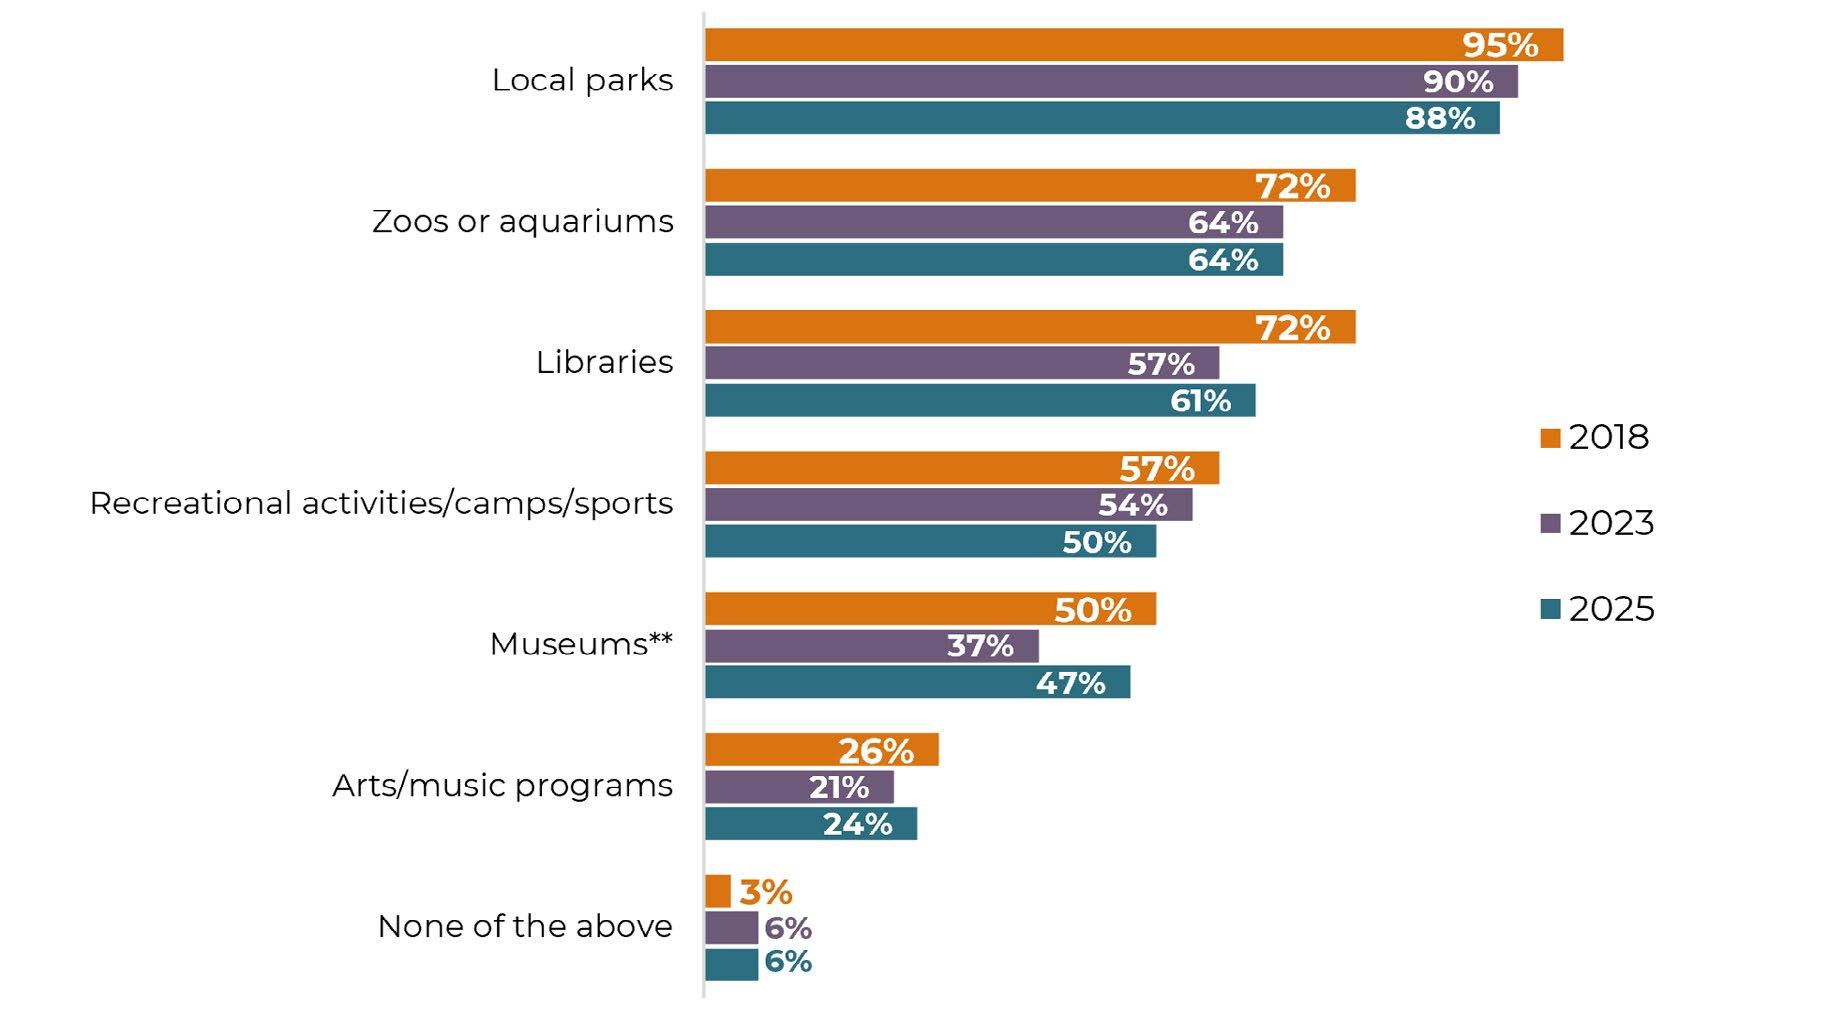
In 2025, more than four in five families reported using at least one local resource. The most commonly accessed places included local parks, libraries, and cultural institutions like zoos, aquariums, and museums. While engagement with many of these resources remained strong, overall participation was lower than in 2018. Fewer families reported visiting local parks and recreational programs, camps, or participating in sports. Access to museums, which had declined in 2023, showed a small rebound in 2025.
Exhibit 22. Families’ Use of Local Resources, KRA 2018-2025
Source: Parent Information Form. 2025 N = 280. 2023 N = 691. 2018 N = 947. Differences between 2023 and 2025 were significant at **p < .01.
FAMILY ENGAGEMENT IN HOME LEARNING ACTIVITIES
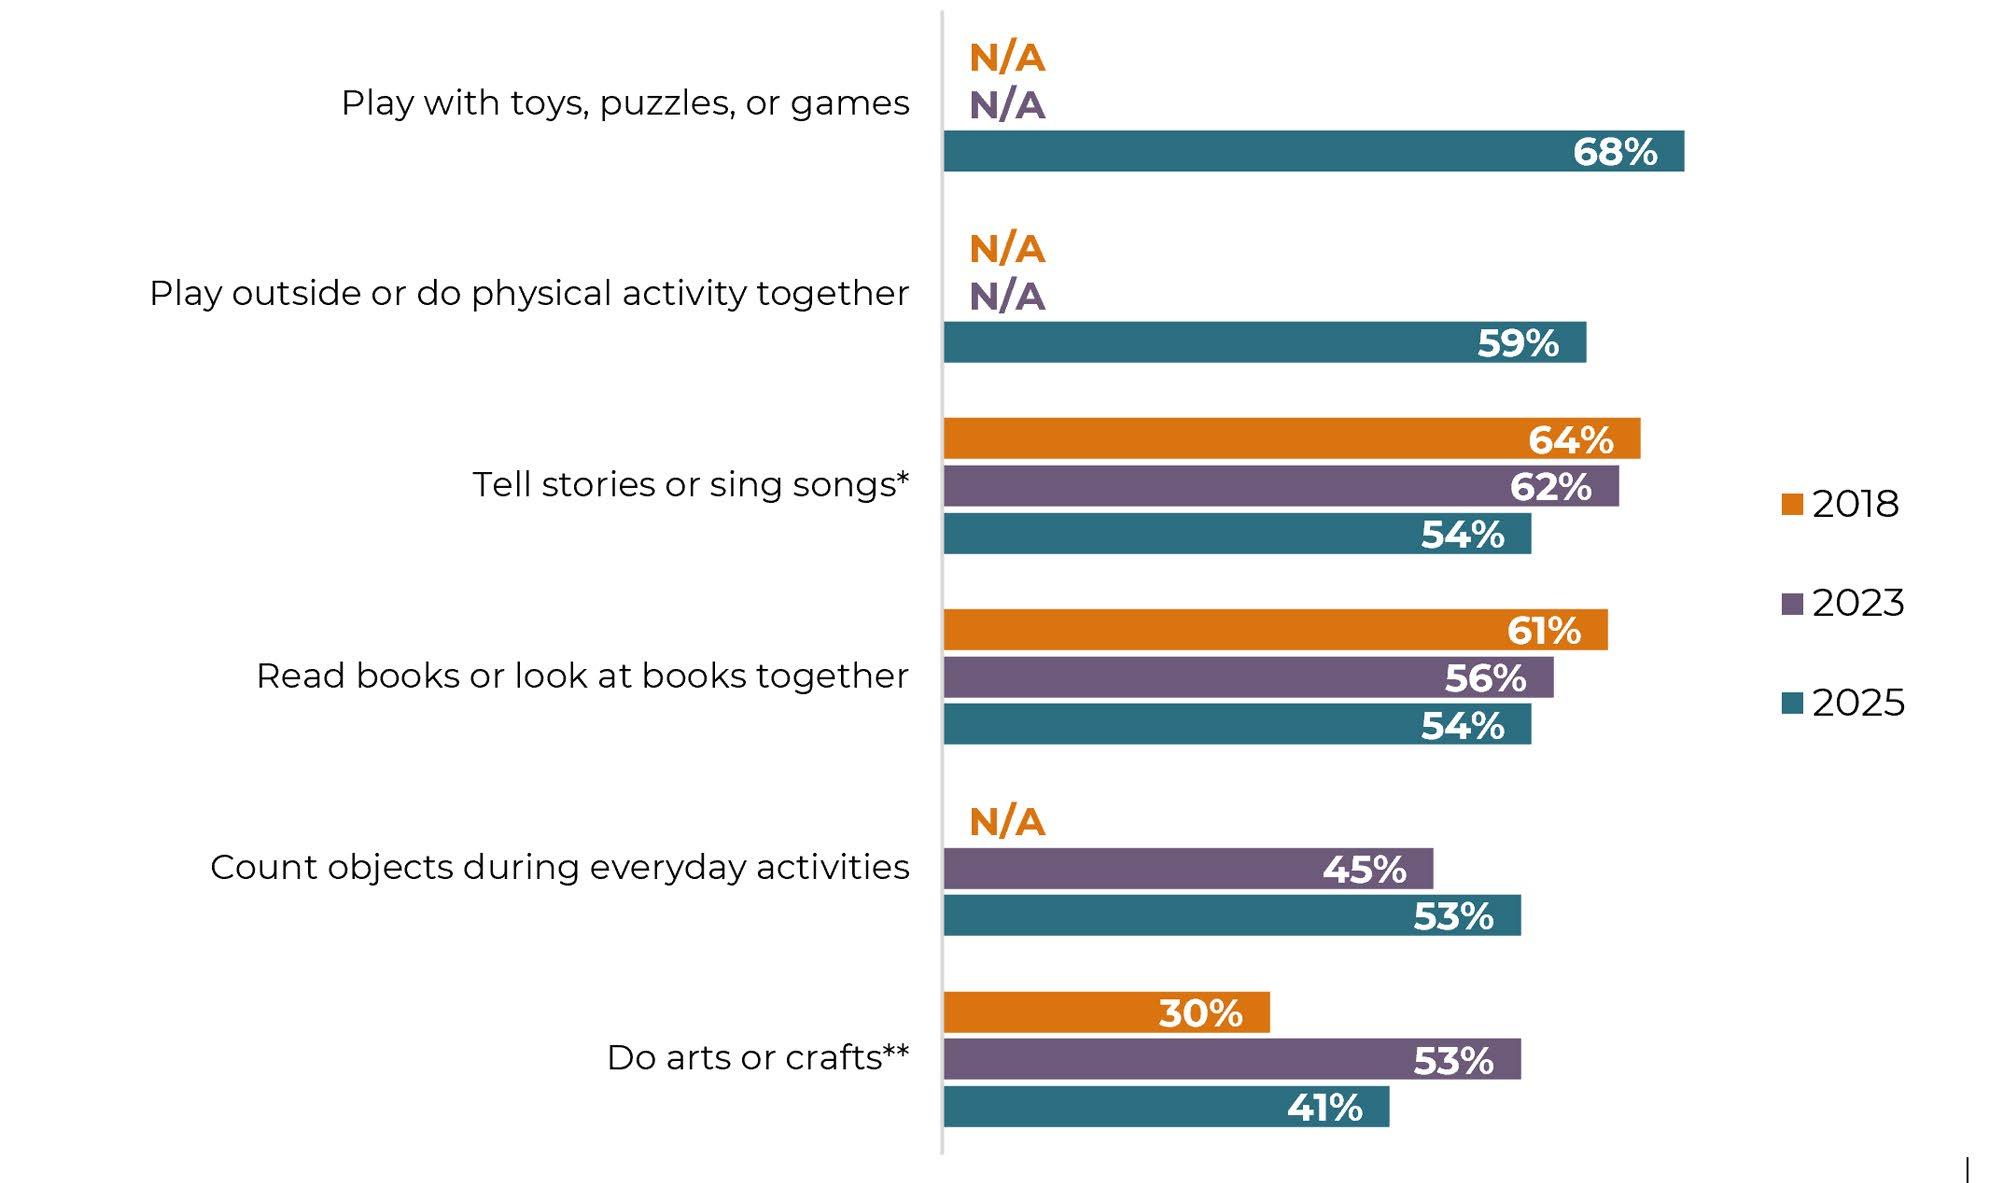
Families play a vital role in supporting early learning at home. In 2025, most caregivers reported spending time each week engaging their children in enriching learning activities such as reading, singing, playing, and exploring math and movement through everyday routines. Fewer families reported doing crafts or storytelling compared to the 2023 sample of caregivers. Book reading remained steady across years, continuing to be a consistent part of many families’ weekly routines.
Exhibit 23. Frequency of Home Learning Activities At Least Four Days per Week, KRA 2018-2025
Source: Parent Information Form. 2025 N = 321. 2023 N = 679-688. 2018 N = 871-915. N/A indicates that the item was not included in the survey for that year. Differences between 2023 and 2025 were significant at **p < .01 and *p < .05.
FAMILY ROUTINES
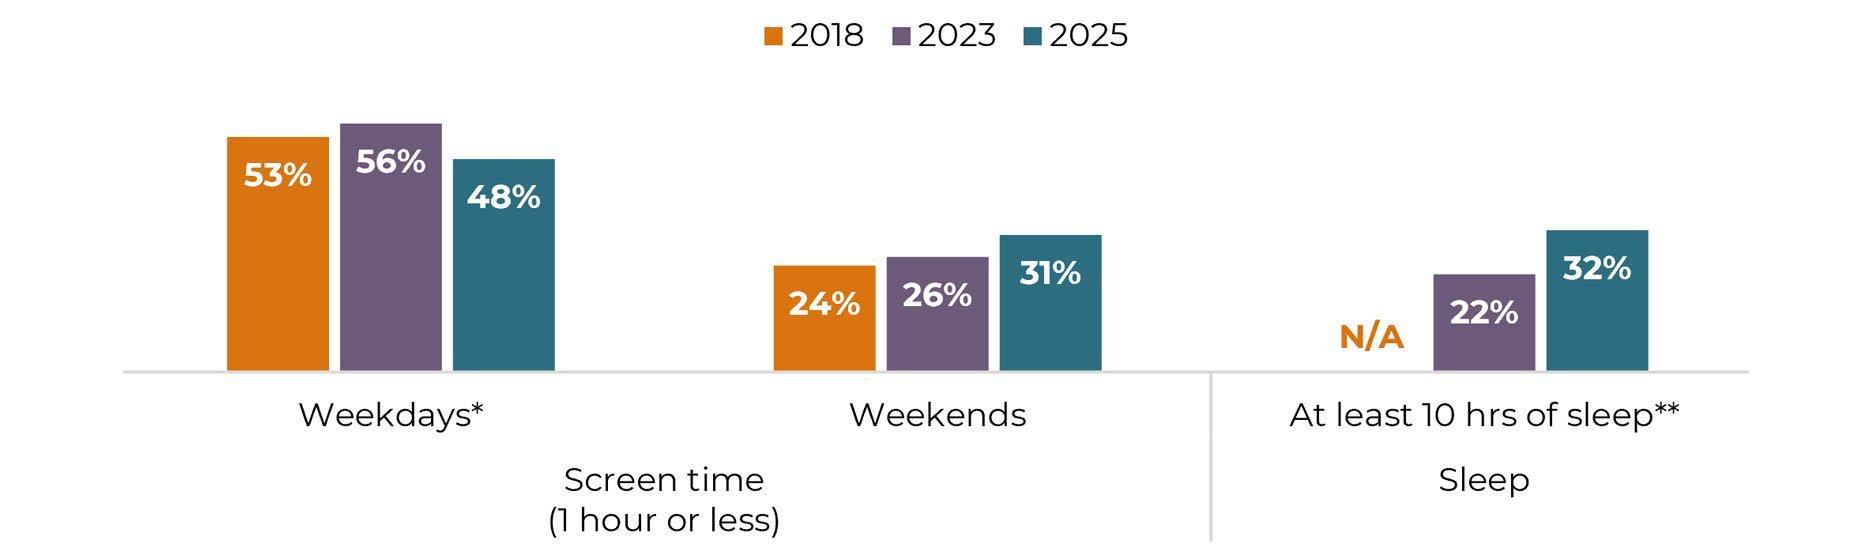
Regular routines like sleep and screen time are foundational to a child’s well-being and school readiness. The American Academy of Pediatrics recommends that children ages two to five get at least 10 hours of sleep each night and no more than one hour of screen time per day, including television, videos, and digital games.vii, viii
In 2025, more families reported that their children were getting the recommended amount of sleep each night, showing a meaningful improvement from the previous study cycle. Screen time, however, continues to be an area of attention. Fewer families reported limiting weekday screen time to an hour or less compared to prior years, and weekend screen use has continued to rise gradually over time. As families navigate busy schedules and increasing access to digital devices, these patterns reinforce the importance of community supports that help promote healthy habits at home.
Exhibit 24. Trends in Screen Time and Sleep Habits, KRA 2018-2025
Source: Parent Information Form. 2025 N = 321. 2023 N = 670-703. 2018 N = 931. N/A indicates that the item was not included in the survey for that year. Differences between 2023 and 2025 were significant at **p < .01 and *p < .05. Note: The American Academy of Sleep Medicine recommends children 3-5 sleep 10-13 hours per night.
FAMILY STRESSORS AND WELL-BEING
Caregiver Concerns and Daily Challenges
Families were asked how concerned they had been in the past month about a range of common stressors, including housing, food, employment, and caregiving. In 2025, many caregivers reported navigating ongoing economic and caregiving-related pressures.
Compared to 2023, more families reported concerns about access to food and finding affordable child care. Concerns about housing stability also increased. At the same time, fewer families reported being concerned about work-related stress than in earlier years, continuing a downward trend from 2018.
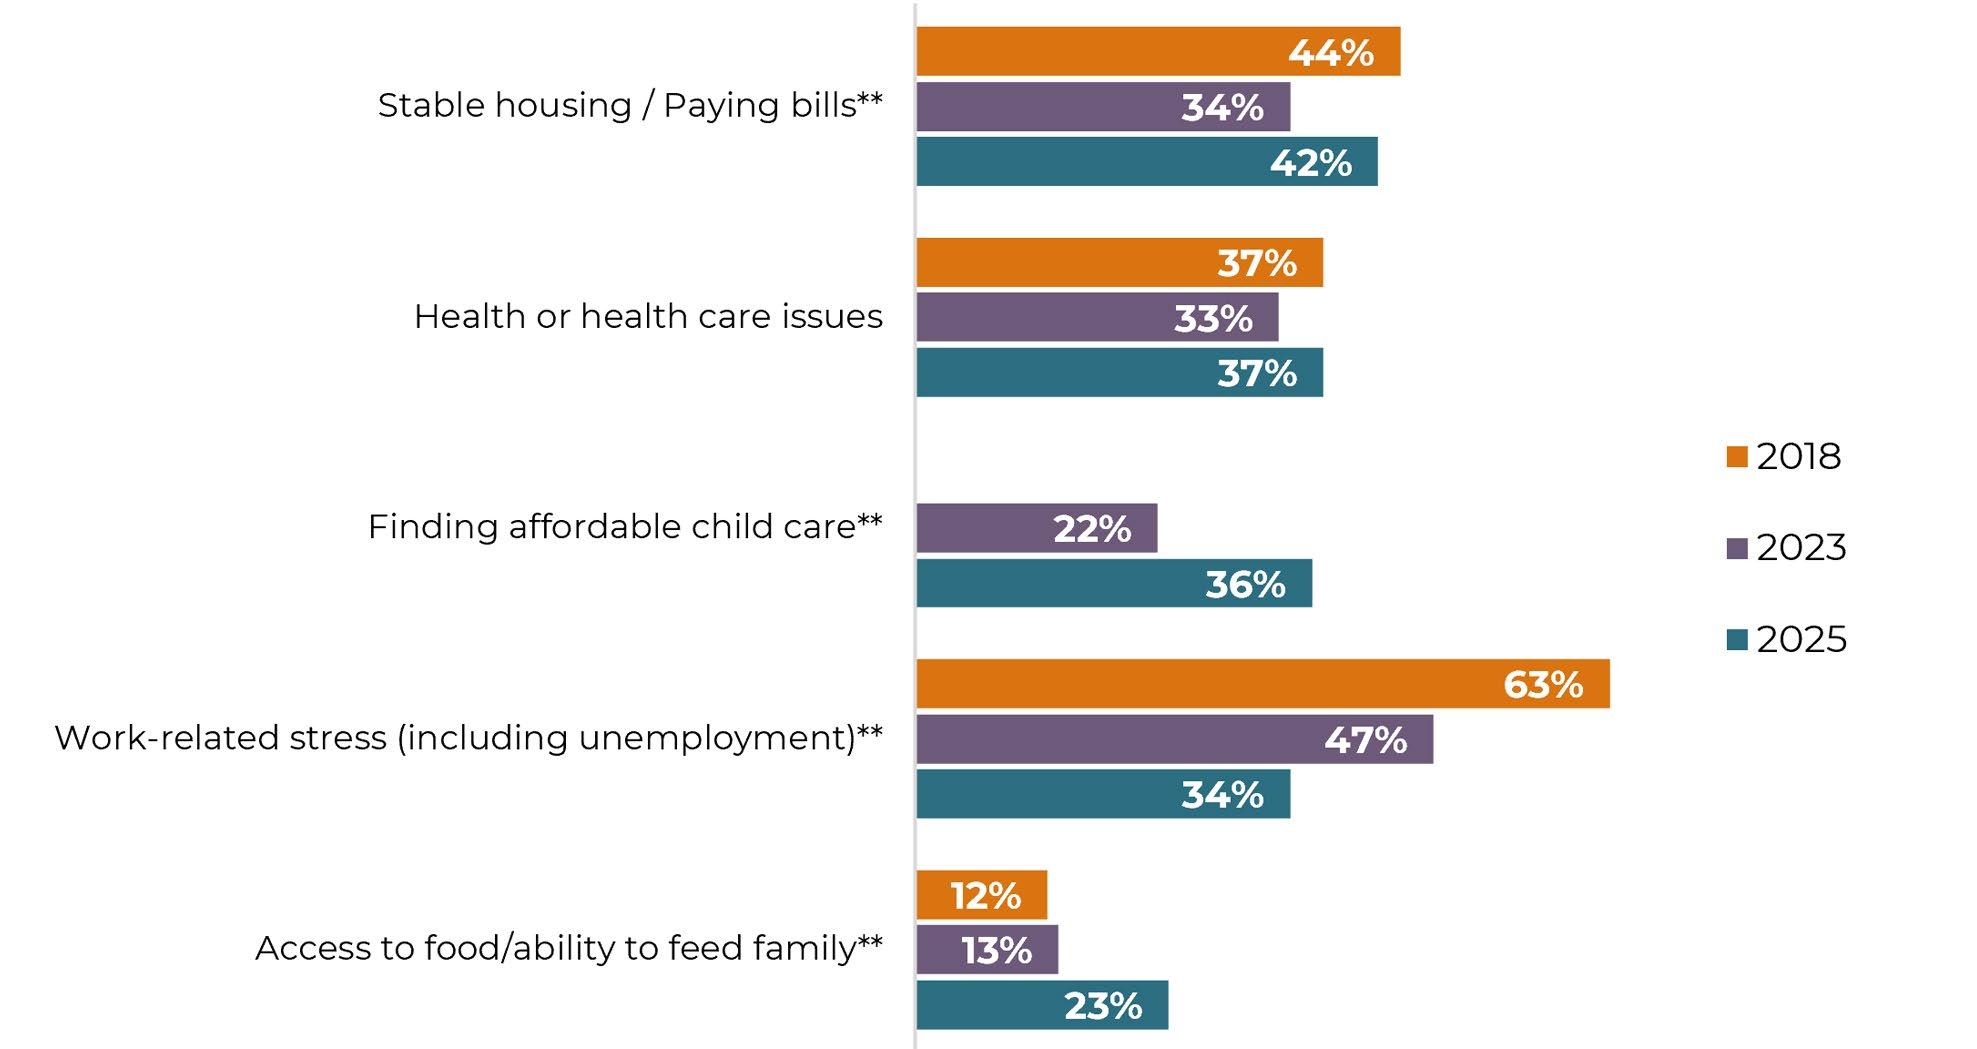
Source: Parent Information Form. 2025 N = 321. 2023 N = 683-690. 2018 N = 916-927. Numbers reflect the percentage of respondents who marked “a little,” “moderately,” or “very” concerned. N/A indicates that the item was not included in the survey for that year. Differences between 2023 and 2025 were significant at **p < .01.
Exhibit 25. Common Family Concerns Reported by Caregivers, KRA 2018-2025
Emotional Well-Being And Child Behavior
In 2025, new questions were added to better understand how families are navigating emotional and behavioral health in early childhood. Caregivers were asked whether they had concerns related to their own mental health and well-being, their child’s mental health and well-being, or managing their child’s behavior.
Many families expressed some level of concern in these areas. Over one-third reported being concerned about their child’s mental health, while nearly one in four had concerns about managing their child’s behavior. Caregivers also noted their own mental health as an area of concern. These findings highlight how emotional well-being is an important part of the overall landscape of early childhood and family life.
Exhibit 26. Caregiver Concerns About Mental Health and Behavior, KRA 2025
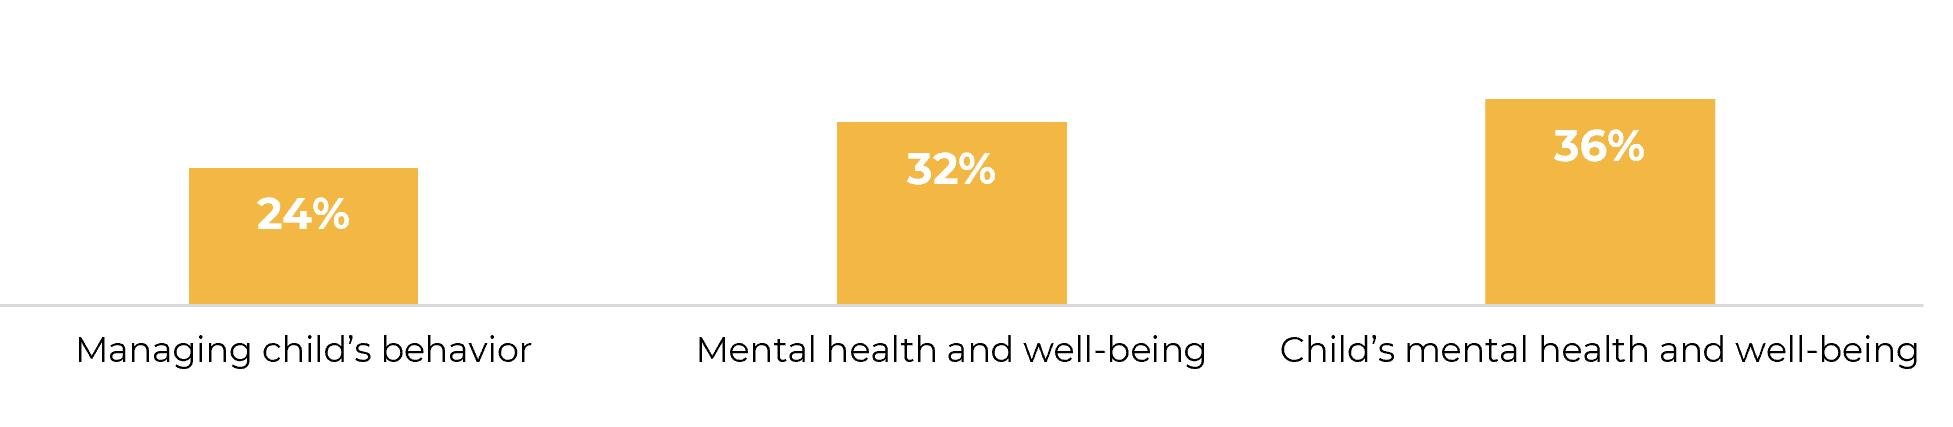
Source: Parent Information Form 2025. N = 321. Numbers reflect the percentage of respondents who marked “a little,” “moderately,” or “very” concerned.
Housing Stability
Stable housing is a cornerstone of early development, supporting children’s health, behavior, and readiness for school.ix In 2025, just over half of families reported that they had not moved since their child was born—an encouraging sign of stability for many households.
However, housing challenges remain a concern for others. A growing number of families reported experiencing homelessness at some point in their child’s life, highlighting ongoing disparities in access to secure housing.
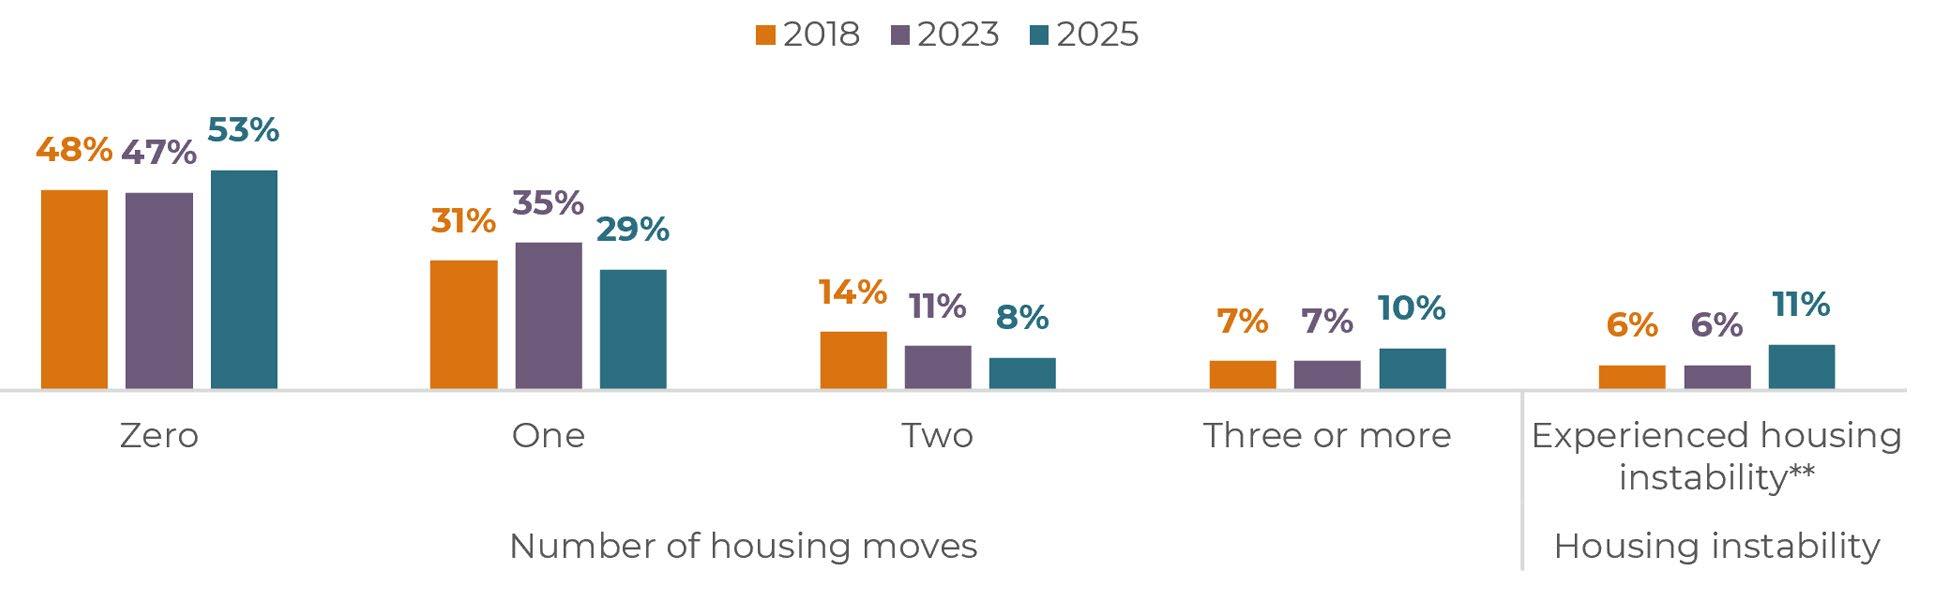
Source: Parent Information Form. 2025 N = 321. 2023 N = 679- 689. 2018 N = 945. Housing instability included staying in a public place, shelter, hotel, or with friends or family due to economic hardship. Differences between 2023 and 2025 were significant at **p < .01.’
Exhibit 27. Housing Stability in Child’s Lifetime, KRA 2018-2025
ACCESS TO HEALTH CARE AND RESOURCES
Health Insurance
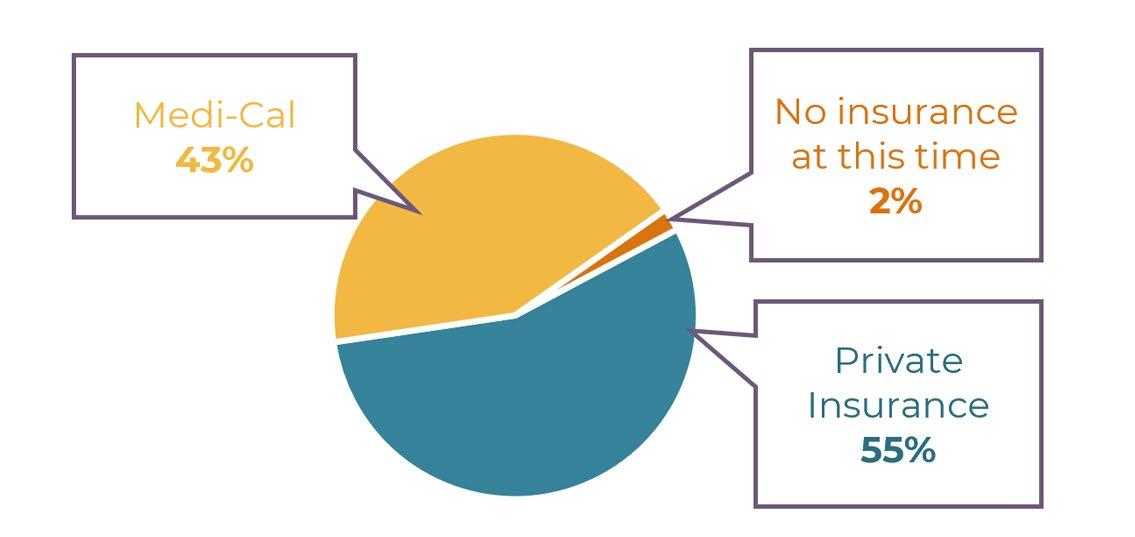
Nearly all families in the 2025 KRA sample reported that their child had health insurance. Just over half were covered by private insurance, and 43% were enrolled in Medi-Cal, Covered California, or Kaiser.
Child Health Screenings and Preventive Care
Exhibit 28. Type of Health Insurance Reported by Families, KRA 2025
Families were asked whether their child received common preventive health services in the past year, including checkups, dental visits, and hearing or vision screenings. Most children in the 2025 sample received a routine well-child checkup, continuing a strong trend from prior years. Compared to 2023, more children received dental exams, and there were clear increases in both vision and hearing screenings.
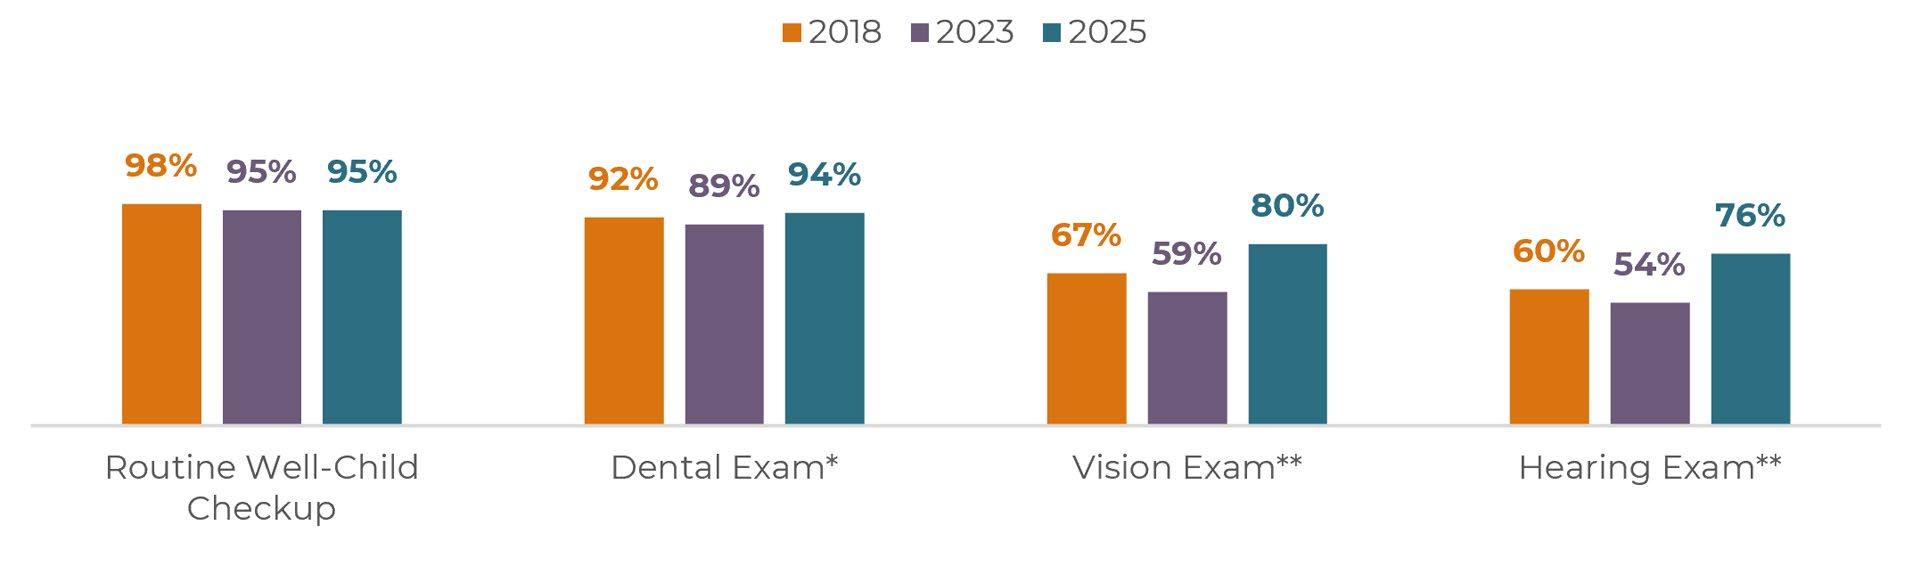
Parent Information Form. 2025 N = 321. 2023 N = 686. 2018 N = 894-983. Differences between 2023 and 2025 were significant at **p
.01 and *p < .05.
Source: Parent Information Form. 2025 N = 301.
Exhibit 29. Accessed Preventive Health Services in the Past Year, KRA 2018-2025
Source:
In 2025, new questions were added to better understand what happens after a child receives a health screening. Specifically, caregivers were asked whether any follow-up care was recommended, and if so, whether they were able to access the recommended services or supports.
Follow-up care was most commonly recommended after dental and vision exams. Among those referred for additional care, most families reported being able to access the services their child needed. Access was especially strong for dental and well-child referrals.
Exhibit 30. Follow-up Recommendations and Access to Care, KRA 2025
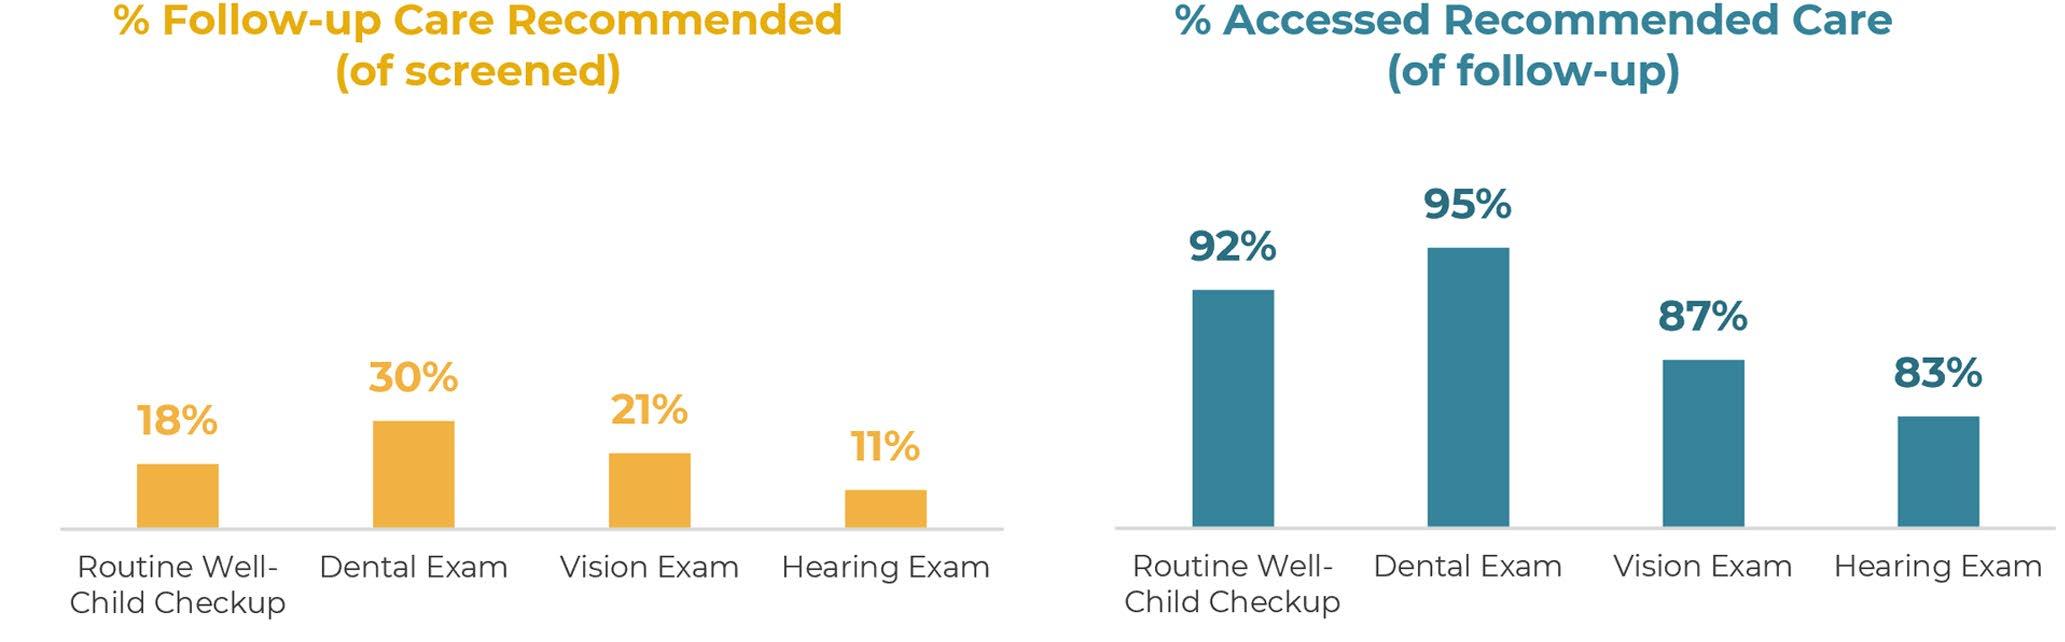
Source: Parent Information Form. 2025 N = 279. Percentages are conditional and reflect only those who received the screening (see Exhibit 29) and received a follow-up recommendation.
SECTION SUMMARY: READINESS OF FAMILIES & COMMUNITIES
More than eight in ten children accessed formal early learning programs, reflecting broad engagement with early care and education and continued expansion of TK.
Cost and availability of child care or preschool remained key access challenges for some families. While many families reported no difficulty accessing early learning, others identified cost, limited hours, transportation, and program fit as barriers.
Families were actively engaged in supporting learning at home. Most caregivers reported regularly reading, playing, and engaging their children in learning activities during the week.
Use of parenting programs and supports showed changing patterns. More families reported receiving individualized services, like home visits and parenting education, while group-based playgroup participation declined.
Family routines showed areas of strength and opportunity. More children were getting recommended amounts of sleep compared to prior years, while screen time continued to be an area for additional support and guidance.
Families faced growing stressors related to basic needs and caregiving. Concerns about food access, housing stability, and affordable child care increased since 2023. Emotional well-being also emerged as a common challenge for both children and caregivers.
Access to health care and preventive services was strong. Nearly all children had health insurance and received routine well-child checkups, with increases in dental, vision, and hearing screenings since 2023. Among families referred for follow-up care, most reported successfully accessing recommended services.
Access to Kindergarten Preparation Information
More than nine in ten families in the 2025 assessment shared that they received helpful information to support their child’s transition into kindergarten. Caregivers were most likely to receive guidance on how and when to register, along with information about the skills children need for kindergarten and how to help build those skills at home. Many also reported receiving feedback about how ready their child was for school. These types of support have remained consistent across recent years.
31. Caregiver Access to Kindergarten Transition Information, KRA 2018-2025
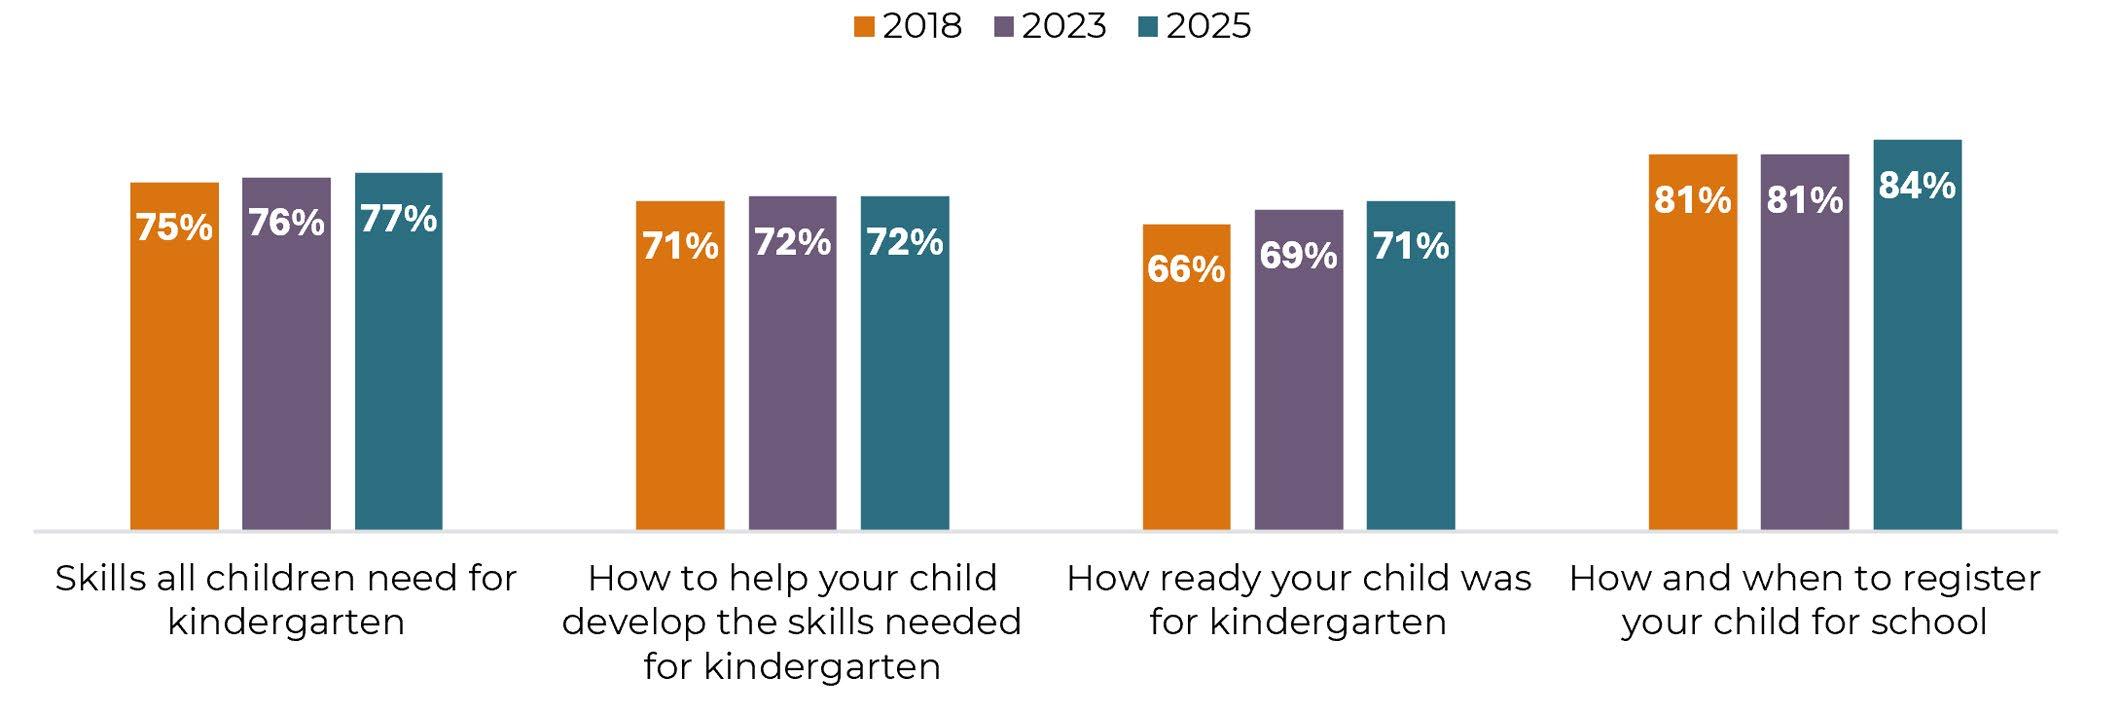
Source: Parent Information Form. 2025 N = 321. 2023 N = 587-685. 2018 N = 960-967.
Family Participation in Kindergarten Transition Activities
Caregivers were also asked about the kindergarten transition activities they engaged in prior to the start of school. Across the three study years, the most common activities were visiting the elementary school and working with their child on school skills. While participation in most activities dropped in 2023, likely due to pandemic impacts, 2025 showed a clear rebound, with many families returning to or even exceeding pre-pandemic levels of engagement.
Specifically, educator-connected transition activities—such as visiting the school, meeting the kindergarten teacher, and asking preschool providers about kindergarten—showed meaningful increases between 2023 and 2025. These patterns suggest families are reconnecting with schools and getting more involved in their children’s transition to kindergarten

Exhibit
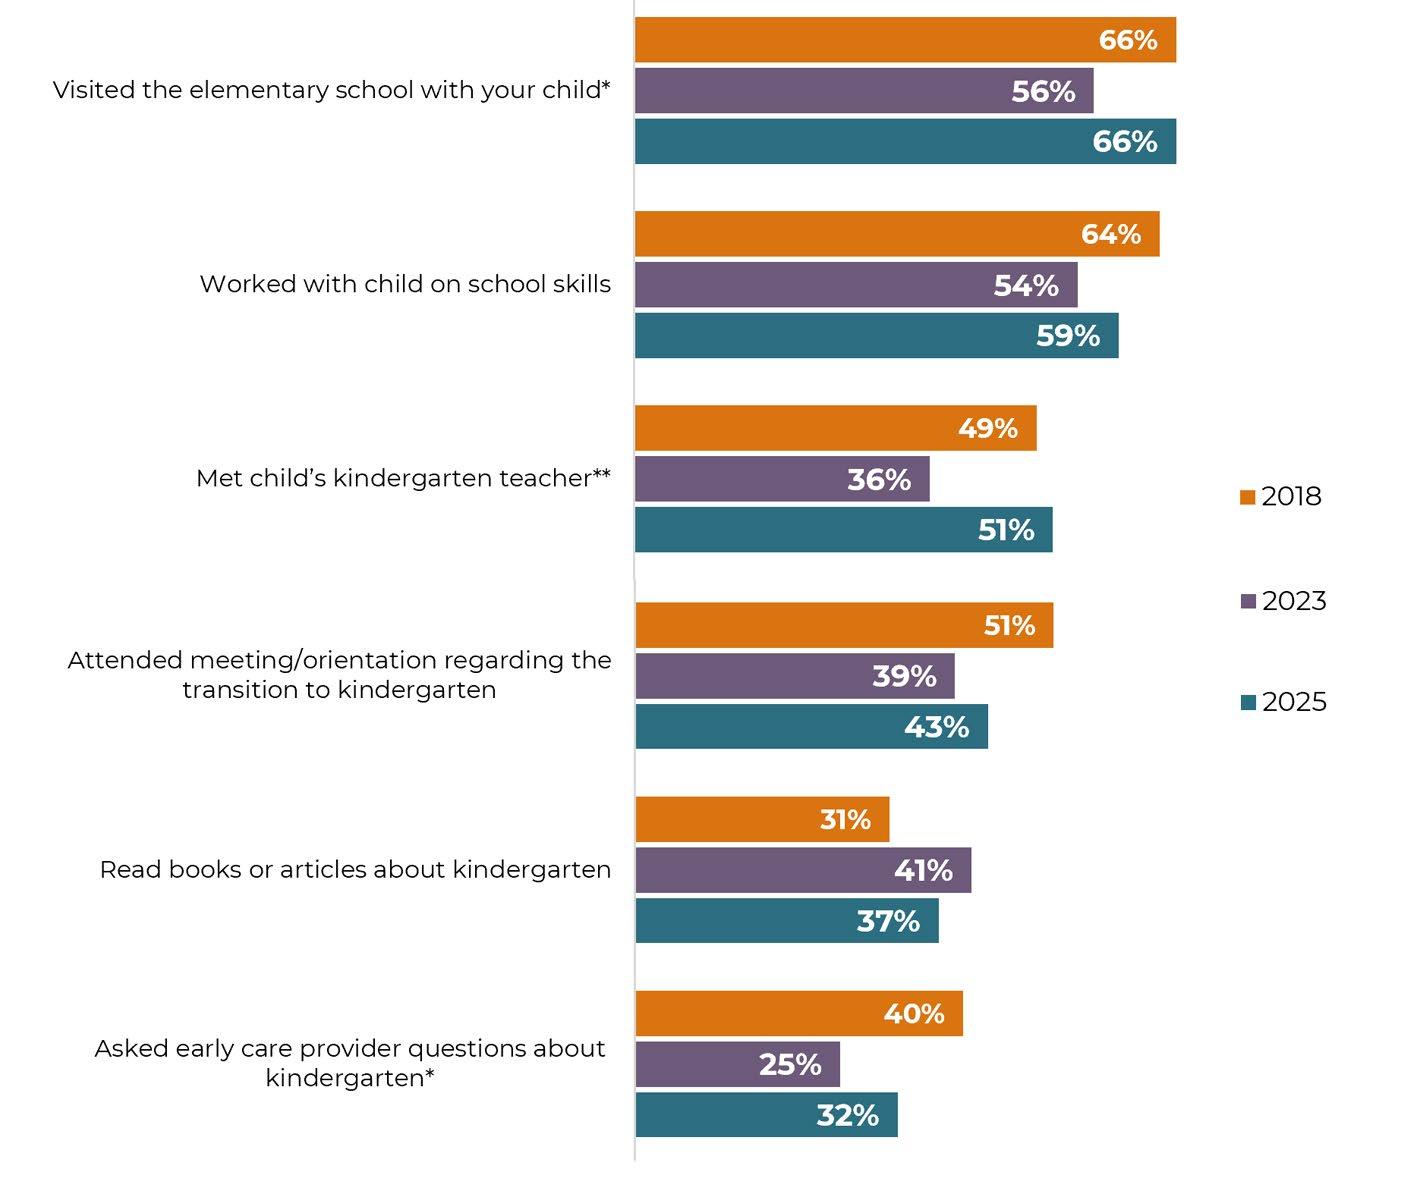
Parent
Schools were effectively supporting families during the kindergarten transition. More than nine in ten families reported receiving helpful information to support their child’s transition into kindergarten, reflecting strong and consistent school–family communication.
Families were well-informed about kindergarten expectations. Caregivers most often received guidance on registration, kindergarten readiness skills, and ways to support learning at home.
Connections between families and educators strengthened, with more families visiting schools, meeting teachers, and asking preschool providers about kindergarten.
Working on school skills at home remained a common activity, reflecting families’ continued investment in preparing their children for school.
Source:
SECTION SUMMARY: READINESS OF SCHOOLS
SUMMARY AND DISCUSSION
HOW READY WERE CHILDREN, FAMILIES, SCHOOLS, & COMMUNITIES IN 2025?
The 2025 Santa Clara County Kindergarten Readiness Assessment (KRA) provides an encouraging and multifaceted picture of how children, families, schools, and community systems are working together to support a strong start to school. The findings reflect not only children’s developing skills, but also the collective impact of early learning opportunities, family engagement, health supports, and coordinated countywide investments designed to promote readiness from birth through age five.
Across domains, the results indicate that Santa Clara County’s early childhood system, including early care and education providers, family-serving organizations, health systems, and schools, is working toward shared readiness goals. Although fewer children were identified as Fully Ready in 2025 compared to earlier years, the findings point to consistent strengths in early learning participation, family engagement, access to health care, and kindergarten transition supports that research shows are critical for promoting readiness over time.
When interpreting changes in kindergarten readiness over time, it is important to consider both differences between cohorts and the broader developmental context. The proportion of children identified as Fully Ready declined between 2018 and 2023 and remained relatively stable in 2025. Children entering kindergarten in the most recent cohorts were born shortly before or during the COVID-19 pandemic and spent their earliest years amid significant disruptions to early learning, health care, developmental services, and opportunities for social interaction. These conditions likely had lasting effects on early development. As such, the readiness patterns observed in 2023 and 2025 are best understood in the context of pandemic-era experiences rather than diminished family engagement or reduced commitment across early childhood systems.
With this broader context in mind, the findings that follow highlight both the strengths children bring to kindergarten and the systems, families, and communities that continue to support early learning and successful transitions to school.
Highlights
Children are showing early academic strengths and entering school with foundational skills. One in three children were Fully Ready for kindergarten, and many demonstrated proficiency in academic areas such as recognizing numbers, writing their name, and using a pencil. These skills reflect the impact of early learning experiences and supportive home environments.
Families are laying strong foundations at home. Most caregivers reported engaging their children in reading, play, and learning routines each week. Shared reading and educational play were among the most common activities, and caregivers shared generally positive perceptions of their children’s readiness across developmental domains.
Kindergarten transition supports are reaching more families. More than nine in ten caregivers received helpful information about how to prepare for kindergarten, and many participated in school-related transition activities like visiting classrooms and meeting teachers. These patterns show how schools and families are connecting early and often to support a smooth transition.
Access to early learning continues to grow and evolve. More than eight in ten children in the sample attended a formal early care or education program prior to kindergarten, and participation in Transitional Kindergarten increased significantly. Families reported navigating multiple pathways into kindergarten, finding the options that best fit their needs.
Families are resourceful and connected. Most families accessed local community resources such as libraries, parks, museums, and other cultural institutions. More than one in four engaged in parenting programs or services, including education and home visiting supports.
Health access is strong in many households, while stability varies across families. Nearly all children had health insurance and received routine preventive care, with many accessing recommended follow-up services after screenings. At the same time, while many families reported stable housing since their child’s birth, housing instability remained a concern for a subset of households.
BUILDING ON THIS FOUNDATION
Findings from the 2025 KRA, together with input from families and educators, point to several areas where continued investment and alignment can strengthen school readiness across Santa Clara County. While many families reported strong engagement, access to early learning, and stable health care, readiness outcomes remained uneven, underscoring the need to build on existing resources while addressing persistent gaps. The recommendations below highlight opportunities to strengthen early learning quality, child development and well-being, family engagement, and school readiness systems. A list of available community-based supports and county initiatives is outlined in Appendix B.
Recommendations
To support more children in entering school ready to succeed, Santa Clara County can consider the following actions:
Expand access to high-quality early learning
Research consistently shows that participation in high-quality, early care and education is associated with stronger cognitive, social-emotional, and self-regulation skills at kindergarten entry, particularly for children from historically underserved communities.x Continue to invest in preschool, Transitional Kindergarten, and child care options that are affordable, culturally responsive, inclusive of children with disabilities, and aligned with school readiness goals, building on existing quality improvement and universal pre-kindergarten efforts.
Support stable home routines that promote health and learning
Children’s readiness for kindergarten is closely linked to stable home routines and access to basic needs such as food security, housing stability, adequate sleep, and preventive healthcare. Strengthen programs that address basic needs such as food security, housing stability, and access to preventive healthcare to reduce family stress and support children’s daily readiness for learning.
Invest in family engagement and education
Expand home visiting, parenting supports, and kindergarten transition activities that empower caregivers as children’s first teachers and foster strong, trusting family–school relationships.
Increase school readiness outreach in trusted community spaces
Leverage libraries, family resource centers, clinics, and community-based organizations to ensure all families— especially those facing barriers—have timely access to enrollment assistance, developmental screenings, and early intervention services.
Target investments in communities with fewer malleable assets
Use local data to identify ZIP Codes where children and families may benefit from additional supports, and apply targeted, community-informed strategies to reduce disparities and promote equitable readiness outcomes countywide.
CONCLUSION
Continued investment in high-quality early learning, family engagement and education, health and basic needs supports, and targeted, community-based strategies will be essential to ensuring that more children across Santa Clara County enter kindergarten ready to learn, grow, and thrive.
APPENDIX A
STUDY SAMPLE AND KINDERGARTEN POPULATION, BY SCHOOL DISTRICT
Source: Kindergarten Observation Form 2025. California Department of Education (2024-25).
APPENDIX B
SANTA CLARA COUNTY RESOURCE LIST
EARLY CARE AND EDUCATION
FIRST 5 Santa Clara County’s Early Learning and Care Program strives to increase families’ access to quality early learning and childcare. Our early educator workforce development initiatives aim to strengthen both center-based and home-based learning and care settings through innovative strategies that serve to recruit and retain a qualified, compassionate, and skilled workforce that promotes healthy child development and prepares children to succeed in school and in life.
QUALITY MATTERS...a STRONG START for Kids increases the quality of early learning programs in the county with professional development and resources for providers. It is an initiative of FIRST 5 Santa Clara County and the Santa Clara County Office of Education (SCCOE).
San José Public Library’s Family, Friend, and Neighbor (FFN) Caregiver Support Network connects FFN caregivers to resources as well as professional development and peer support opportunities. Caregivers can call 408-808-2617 or email EarlyEducation@sjlibrary.org for more information.
Santa Clara County Office of Education provides a range of services to children, families, ECE sites, and school districts throughout the county, including health and wellness services, trainings to improve the climate of schools, and direct services for young children through Special Education, Head Start, State Preschool, and Migrant Education.
SCCOE Resource and Referral Program connects families to child care that meets their needs via an online Childcare Portal. They can also be reached at 669-212-5437 or childcarescc@sccoe.org.
SCCOE Universal Prekindergarten Initiative builds the capacity of school districts and community agencies to expand access to equitable, high-quality learning opportunities and supports for young children.
SCCOE Steps to Success provides resources for families and school leaders to facilitate enrollment in early learning programs.
FAMILY AND PARENTING SUPPORT
2-1-1 connects families to various health, education, and wellness services and supports throughout the county. Families can call 2-1-1 to get support.
Community-based prevention services operate through the Prevention Bureau within the Department of Family and Children’s Services to support strong and healthy communities and to avoid, when possible, entry into the child welfare and foster care systems. The Prevention Bureau works with community partners to provide programs and services that educate and coach parents and caregivers while supporting children, youths, and families. Available programs include parenting classes, services targeting at-risk and gang-impacted youth, their families and communities, and case management services for families experiencing crisis.
FindHelp maintains an online database of service providers to connect families to a variety of services and supports.
FIRST 5 Santa Clara County Family Strengthening and Support Program helps families by promoting access to basic needs, safety, and child development knowledge, increasing referrals to critical health and social services, and collaborating with families and community partners to create culturally responsive, traumainformed systems of care in which children and families can thrive.
HEALTHCARE AND PERINATAL SERVICES
Black Infant Health Program honors the unique history of Black women and supports Black women to have healthy babies with educational group sessions, individualized case management, home visits and referrals. Women can enroll by calling 408-937-2270.
Children’s Health Initiative connects families to free and low-cost health insurance for their children. Parents/ caregivers can call 888-244-5222 for more information.
FIRST 5 Santa Clara County’s Child Health and Wellness Program promotes equitable access to critical health needs, behavioral supports, and prevention and intervention efforts that ensure young children, prenatal through five years, receive the medical, dental, behavioral, and developmental supports they need to grow and thrive. In addition, FIRST 5 supports home visitation services through its collaborative of communitybased organizations and providers who promote healthy parenting strategies and provide in-home support for vulnerable children, including children with disabilities, in our county.
FIRST 5 Santa Clara County Home Visiting Collaborative connects home visiting providers to increase access to resources and improve cross-system service coordination.
FIRST 5 Santa Clara County FIRST 5 Home Visiting Program provides helpful home visiting resources for families with young children and/or pregnant individuals—all designed to support you and your child’s healthy start.
Healthier Kids Foundation provides health screenings to low-income children, connects children to health coverage, and provides nutrition and health education to parents/caregivers. They can be contacted at 408564-5114 or info@hkidsf.org.
Maternal, Child and Adolescent Health Program (MCAH) oversees the Comprehensive Perinatal Services Program to provide pregnant people care coordination, referrals, screenings, assessments, education, and other services that promote their health and well-being. They can be reached by calling 800-310-2332.
Public Health Nursing Home Visitation Programs provide monthly home visits to families with infants up to age 6 months, developmental screenings, postpartum health assessments, and pregnancy and health education. From ages 6 months to 6 years, the program supports families with bimonthly visits. Families can call 408-937-2231 to enroll.
Public Health Oral Health Program links children and families to oral health screenings, education, health coverage, and a dental home. Their phone number is 408-793-2700.
Public Health Perinatal Equity Initiative aims to eliminate disparities in Black infant mortality with evidencebased or evidence-informed interventions throughout the county. For more information, call 669-263-2828 or email PerinatalEquity@phd.sccgov.org.
HOUSING AND FOOD
Santa Clara County Homelessness Prevention System assists low-income families at risk of losing their housing with case management, legal support, and temporary financial assistance. Families can call 408-9268885 or email info@preventhomelessness.org for more information.
Second Harvest of Silicon Valley operates a network of food distribution programs, provides cooking demonstrations and food safety presentations, and partners with schools to ensure students and families have year-round access to healthy food. Families can call 800-984-3663 for assistance.
SNAP/CalFresh provides benefits to purchase food for families earning up to 185% of the Federal Poverty Line (FPL). Families can call 408-758-3800 to enroll.
Women, Infants and Children (WIC) provides benefits to purchase healthy food as well as nutrition education and breastfeeding support to women who are pregnant, postpartum, or breastfeeding, and children 0-5. Women can call 408-792-5101 or text 888-413-2698 to see if they qualify.
INCLUSION AND EQUITY
The Innovations Collaborative of SCCOE believes every individual, with their unique strengths and experiences, has the right to high quality learning and community environments. The WarmLine offers support, information, and referrals to families and providers of children with disabilities. They can be contacted at 408-453-6651 and Inclusionwarmline@sccoe.org.
Parents Helping Parents supports families raising children with disabilities with an electronic learning library, webinars, and support groups. Families can call 408-727-5775 for one-on-one support.
ENDNOTES
Duncan, G. J., Dowsett, C. J., Claessens, A., Magnuson, K., Huston, A. C., Klebanov, P., Pagani, L.S., Feinstein, L., Engel, M., Brooks-Gunn, J., Sexton, H., Duckworth, K., & Japel, C. (2007). School readiness and later achievement. Developmental Psychology, 43(6), 1428–1446.
Bettencourt, A. F., Gross, D., Ho, G., & Perrin, N. (2018). The costly consequences of not being socially and behaviorally ready to learn by kindergarten in Baltimore City. Journal of Urban Health, 95(1), 36–50.
Fitzpatrick, C., Boers, E., & Pagani, L. S. (2020). Kindergarten readiness, later health, and social costs. Pediatrics, 146(6).
Applied Survey Research. (n.d.) Psychometric properties of the Kindergarten Observation Form. San Jose, CA: Author.
California Department of Education. (2024). DataQuest. https://data1.cde.ca.gov/dataquest/
U.S. Census Bureau. (2023). Selected economic characteristics: 2023 American Community Survey 5-Year Estimates (Table DP03). U.S. Department of Commerce.
American Academy of Pediatrics (AAP). (2023). Study: Sleeping 10 hours per night linked to better kindergarten readiness. AAP News https://publications.aap.org/aapnews/news/20727/
American Academy of Pediatrics. (2016). Media and young minds. Pediatrics, 138(5), e20162591.
Ghandour, R. M., Hirai, A. H., Moore, K. A., Paschall, K., LaForett, D. R., Reddington, E., & Kogan, M. D. (2024). School readiness among United States children: results from the 2022 National Survey of Children’s Health. Academic Pediatrics, 24(7), 1049-1061.
So, M., Woodward, K. P., Shlafer, R. J., Testa, A., Davis, L., & Jackson, D. B. (2023). Positive early childhood experiences and school readiness among US preschoolers. The Journal of Pediatrics, 262, 113637.
ABOUT THE RESEARCHER
Applied Survey Research (ASR) is a non-profit social research firm dedicated to helping people build better communities by creating meaningful evaluative and assessment data, facilitating information‐based planning, and developing custom strategies. The firm has more than 40 years of experience working with public and private agencies, health and human service organizations, city and county offices, school districts, institutions of higher learning, and charitable foundations. Through community assessments, program evaluations, and related studies, ASR provides the information communities need for effective strategic planning and community interventions.
For questions about this report, please contact:
Applied Survey Research
Claire Miller, Ph.D., Project Manager
Lisa Colvig-Niclai, M.A., Senior Vice President of Planning and Evaluation
Email SRA@appliedsurveyresearch.org
www.AppliedSurveyResearch.org