FIELDNOTES
letter from the editors
A nother winter quarter has come and gone, where our editors cozied up under fluorescent lights to handpick a unique spread of undergraduate environmental research.
This year, we are excited to feature a project that engaged novice birdwatchers with technology in pursuit of environmental stewardship. This issue also features undergraduate research that spans from wetland health on Bainbridge Island to the Yakima Valley to investigate the environmental impact of beer production. Our own writers chose to feature an array of pressing research, including the implications of national park closures, emerging performative corporate activism, enacting legal personhood on our own Southern Resident Killer Whales, and so much more.
As we spring into another quarter, we look forward to beginning a new chapter next year. We remain optimistic for our environment in the face of adversity.
We would like to thank the College of the Environment for their generosity and support of the journal. A special thank you goes to our incredible teaching staff, Giordano “Gio” Jacuzzi and Julian Olden, for their passion, dedication, and leadership. The journal wouldn’t be possible without them! We were honored to have Gio join us for the first time this year – he fit right in with the team and has brought a new energy to the journal.
Please enjoy reading the hard work from our undergraduate researchers, the editorial board, and our teaching staff!
Best,
The FieldNotes Editorial Board
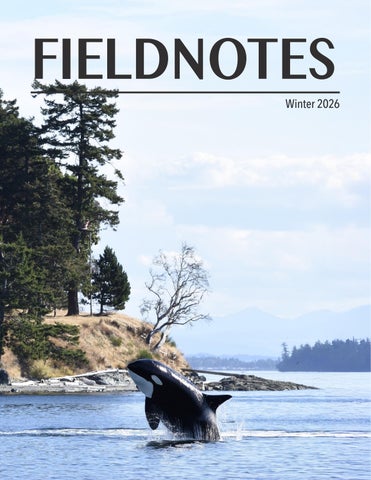
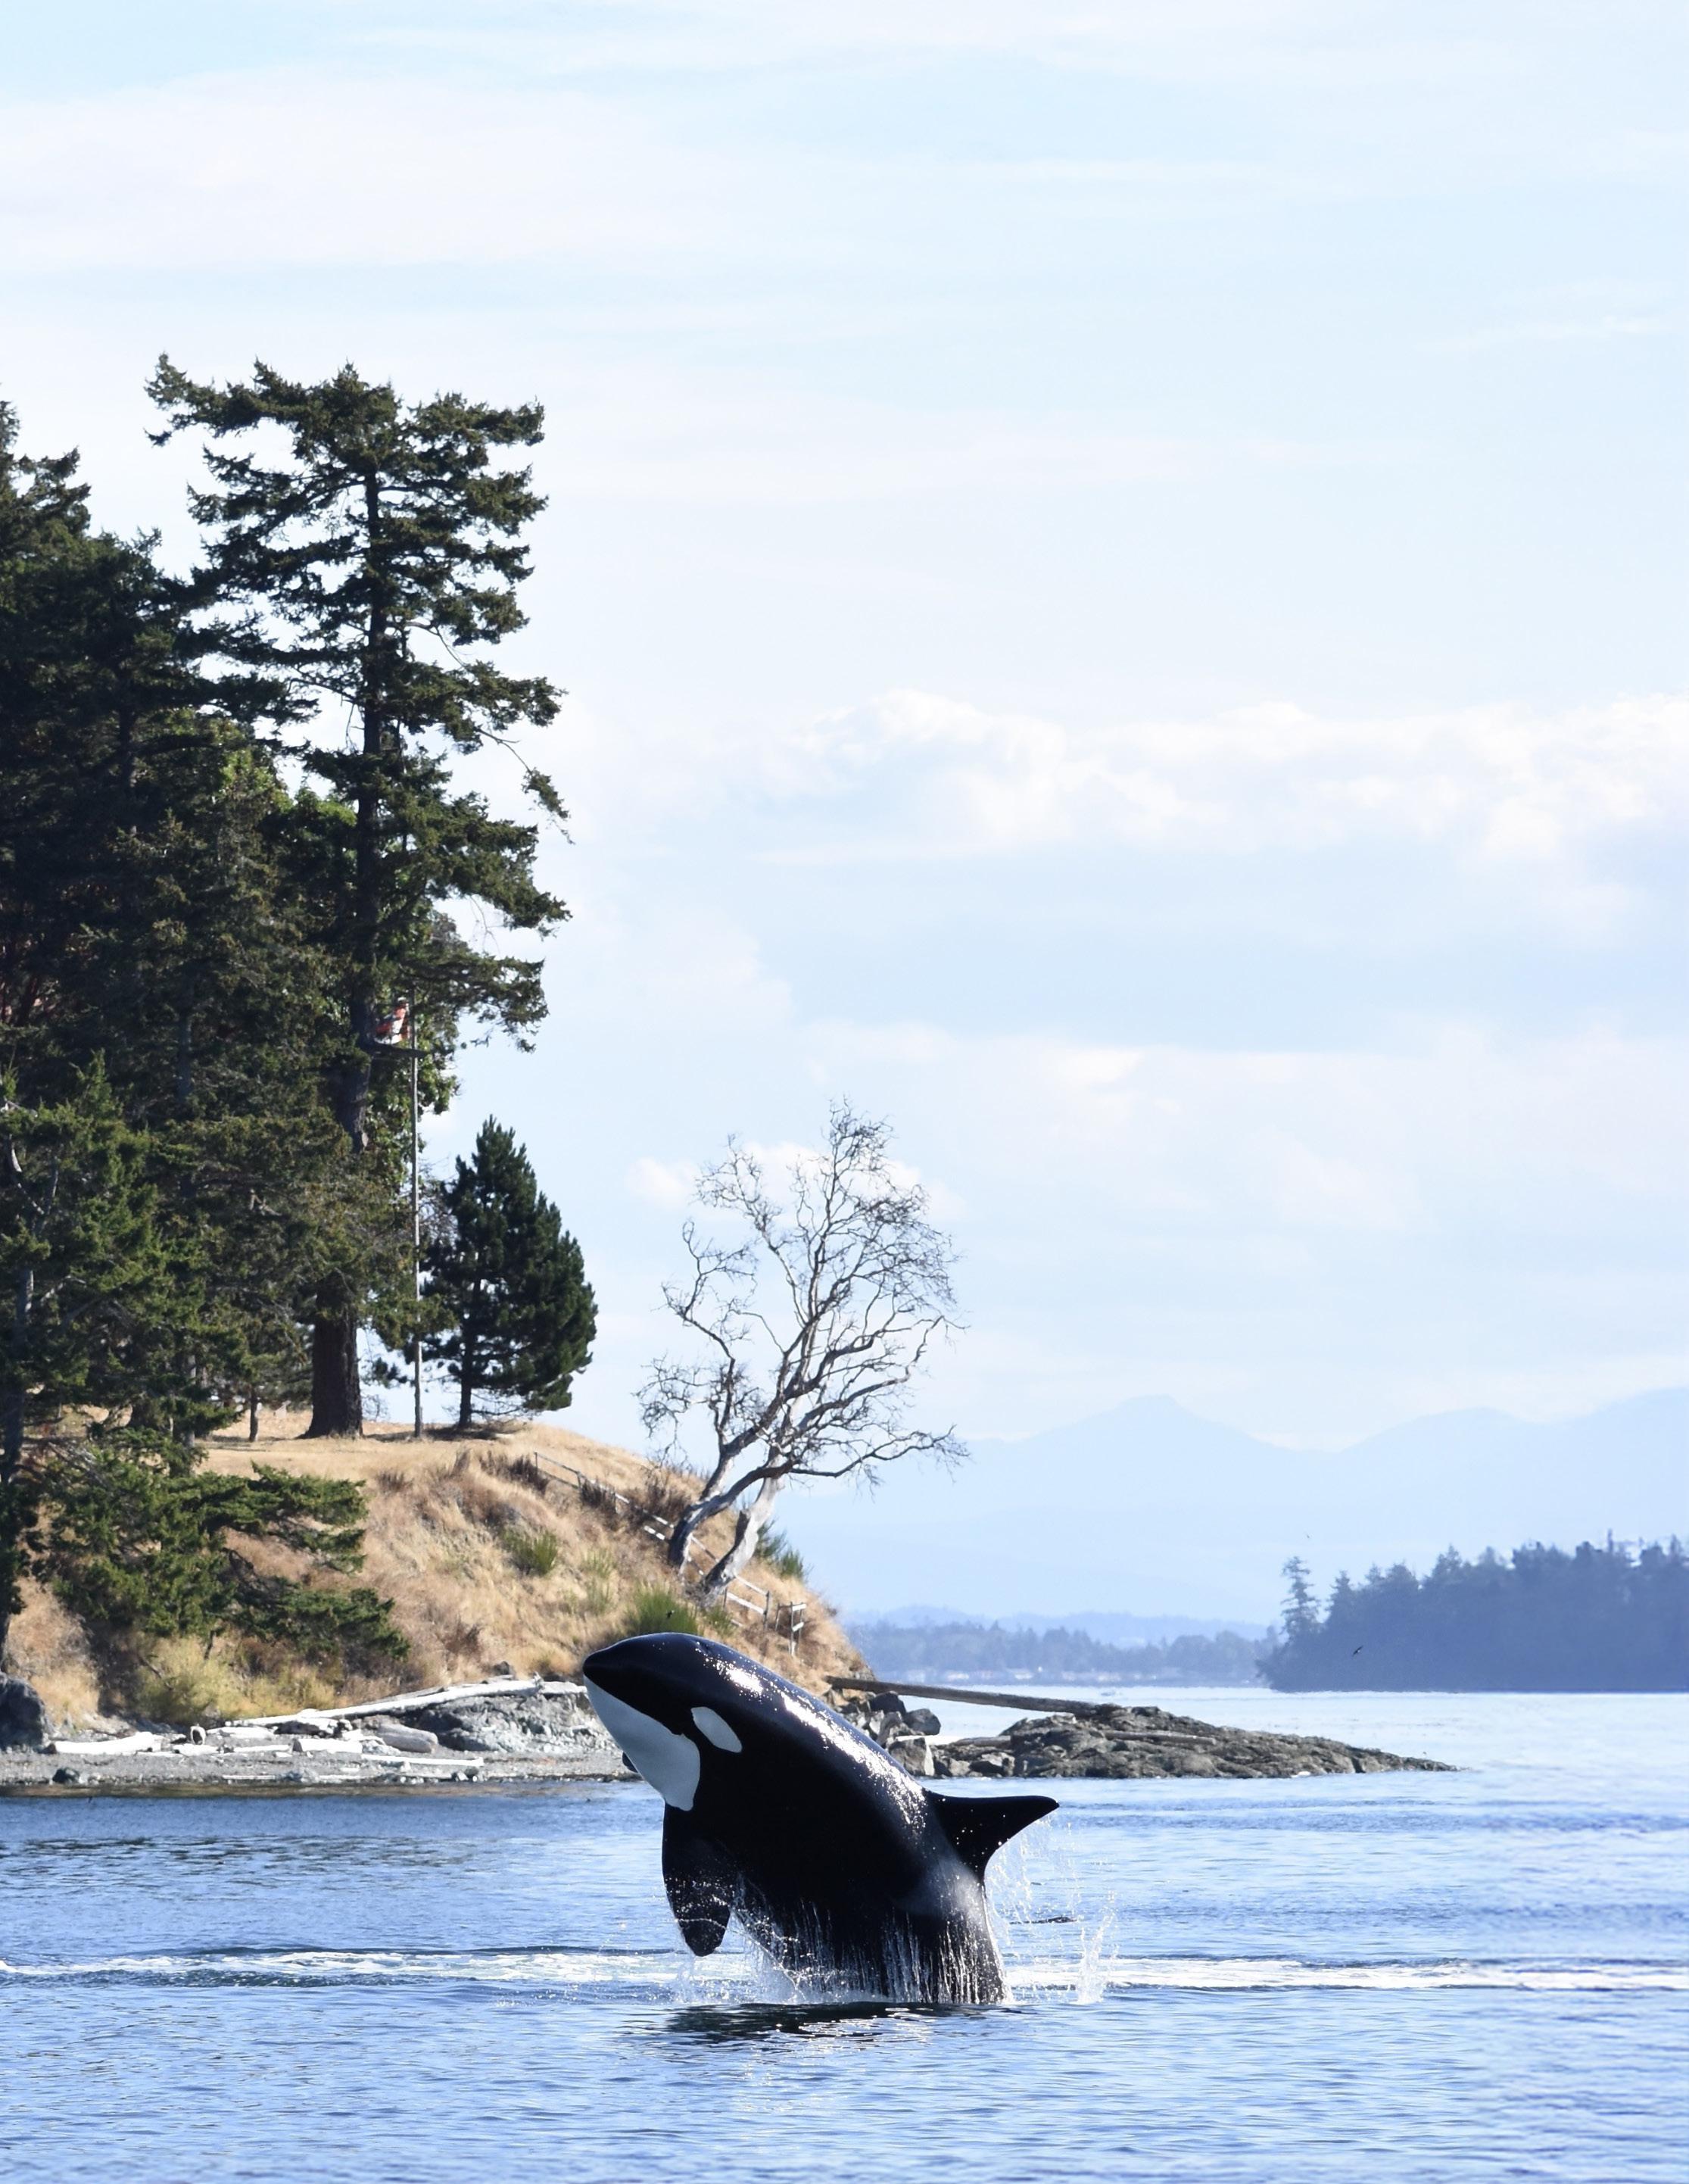
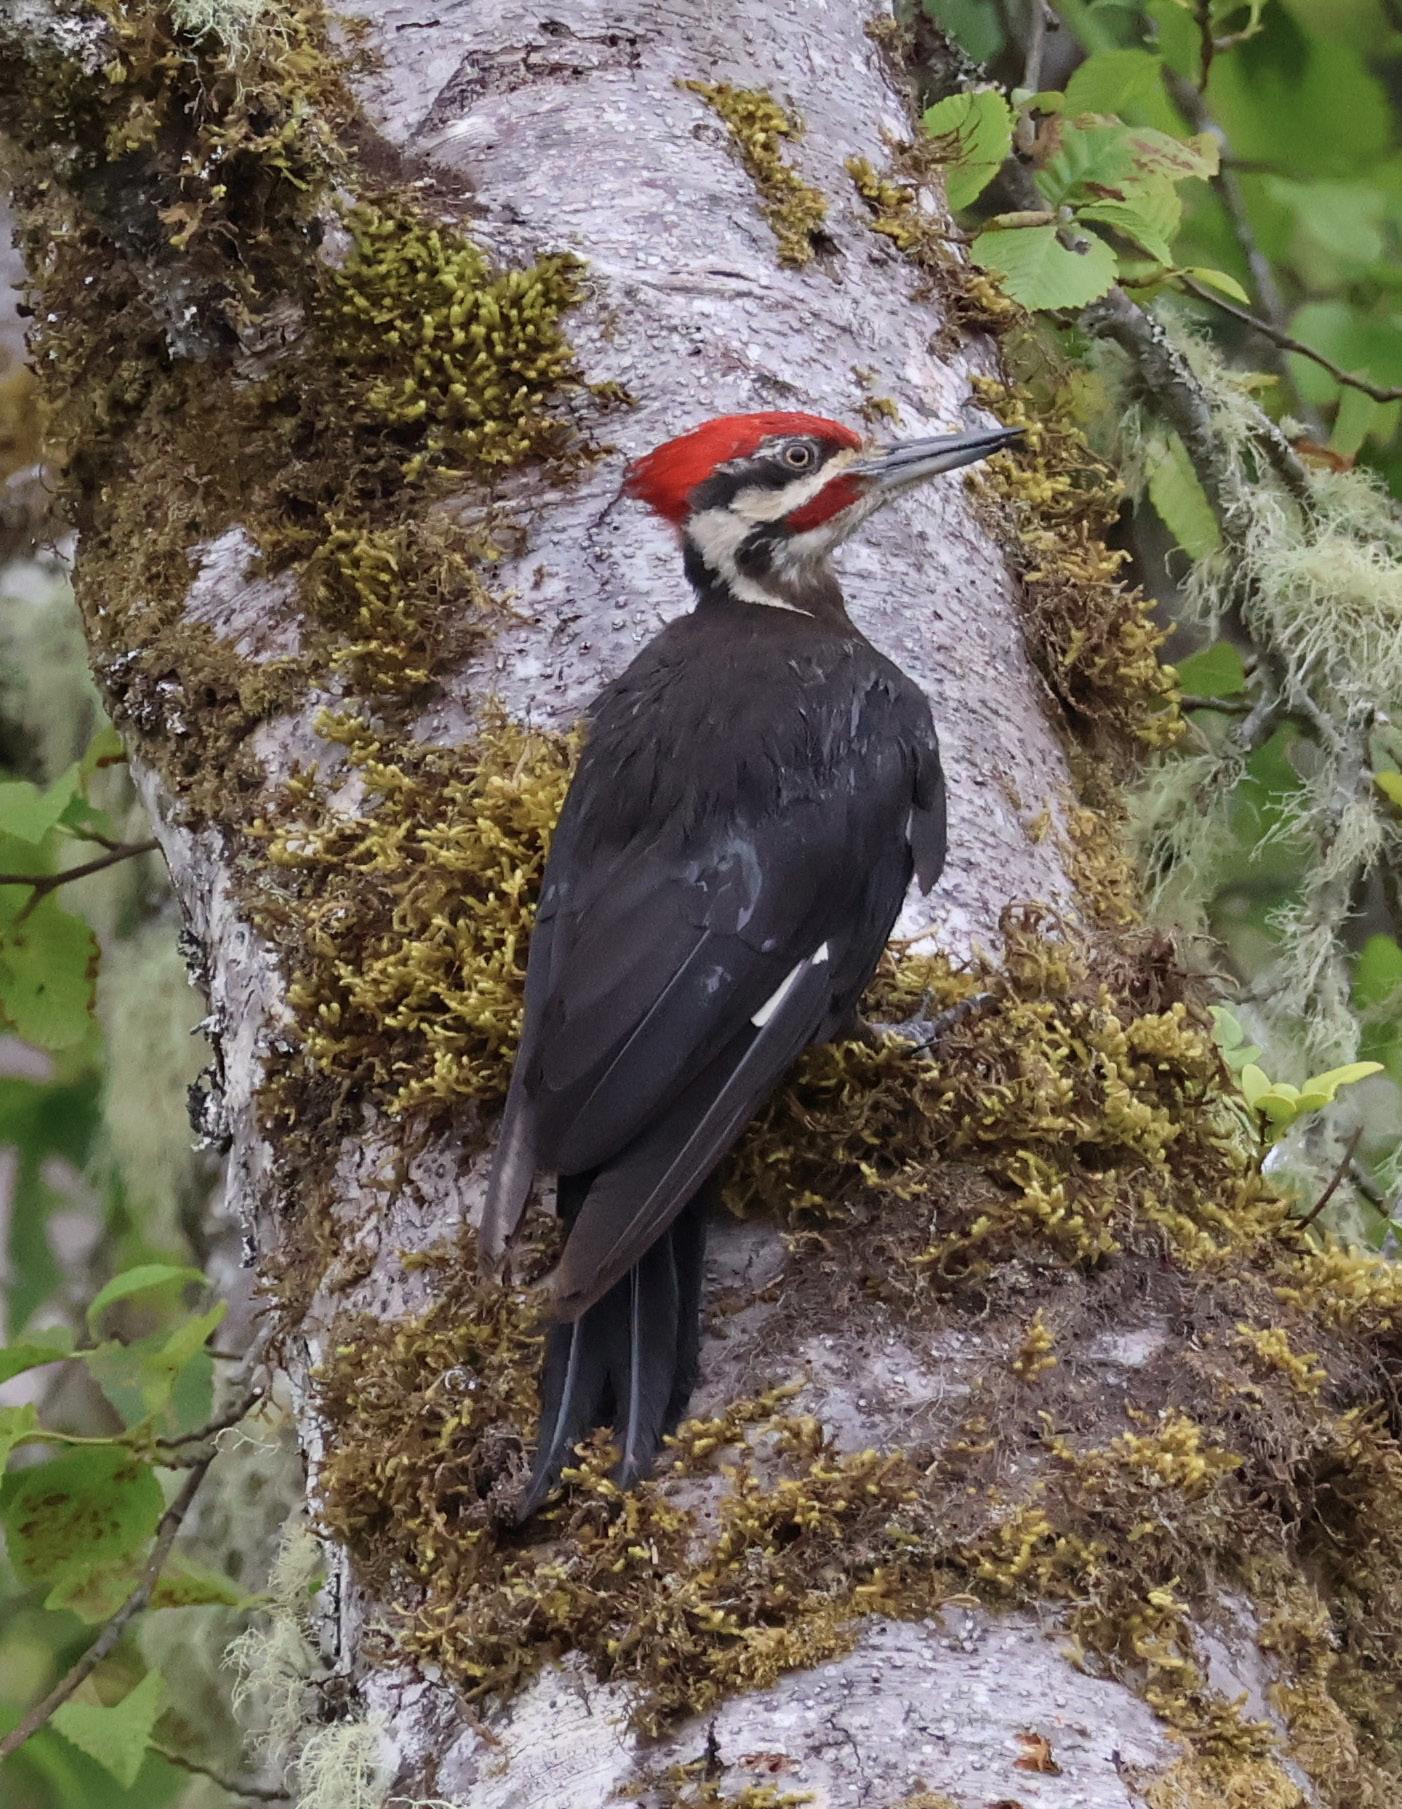
COVER PHOTO FAITH JAYARAM
meet the team


SAGE MAILHIOT EDITOR
CALLIE MURAKAMI EDITOR
CATE MIGGINS EDITOR
SYNNOVE PRICE-HUISH EDITOR
XANDER SMITH EDITOR
GIORDANO JACUZZI GRADUATE ADVISOR
ANNE MARIE ZINK EDITOR
JULIAN OLDEN FACULTY ADVISOR
ASHLEY INGALSBE EDITOR
ALEXA LAVINDER EDITOR
BEN KUHL EDITOR
RYAN LUVERA EDITOR
PHOEBE BERGHOUT EDITOR
ALBERTO CASTAGNOLI EDITOR
JACK CARTER EDITOR
SOPHIE GARROTE EDITOR
KATE ALLHUSEN EDITOR-IN-CHIEF
HIGH ADAPTABILITY,
Chris Steinbronn, Environmental Science and Terrestrial Resource Management ‘27
Alice Vimal, Marine Biology ‘26
Mathilda Myerhoff,
MONITORING
Nelson Pham, Environmental Science & Terrestrial Resource Management ‘27
BREWERS WITHOUT BORDERS: HOW HOPS SHAPE WASHINGTON’S ENVIRONMENT AND BELGIUM’S ECONOMY
Orion De Smet, Environmental Studies ‘26, Adlai Knutson, Envrionmental Studies ‘26, and Emily Sanders, Economics ‘26
REMOTE SENSING: ETHICAL IMPLICATIONS FOR SCIENTISTS AND GLOBAL POWER DYNAMICS
Sage Mailhiot, Env Science & Terrestrial Resource Mgmt, ‘26 and Ryan Luvera, Aquatic and Fishery Sciences, Marine Biology, ‘26
BEYOND BANS: RETHINKING CHEMICAL REGULATION IN THE AGE OF PFAS
Kate Allhusen, Marine Biology ‘26 and Sophie Garrote, Env Science and Terrestrial Resource Mgmt ‘26
FRICTIONS BETWEEN GREEN ENERGY AND TRIBAL SOVEREIGNTY
Phoebe Berghout, Aquatic and Fishery Sciences, Env Science & Terrestrial Resource Mgmt ‘26, and Ashley Ingalsbe, Env Studies ‘26
PERSONAL IMPACT VS CORPORATE RESPONSIBILITY: PUSHING ENVIRONMENTAL IMPACT ONTO THE CONSUMER
Jack Carter, Biology ‘26, and Ben Kuhl, Marine Biology ‘26
THE LAST FRONTIER FOR SALE: ENERGY, POWER, AND THE FUTURE OF ALASKA
Cate Miggins, Env Studies ‘26, and Anne Marie Zink, Marine Biology ‘28
ENVIRONMENTAL COST OF A GREENER FUTURE
Callie Murakami, Aquatic & Fishery Sciences ‘26, and Alberto Castagnoli, Env Engineering ‘26
FLOODING RESILIENCE: MITIGATION VERSUS RECOVERY IN WESTERN WASHINGTON
Synnove Price-Huish, Law Societies & Justice, Community Env & Planning ‘26, and Xander Smith, Env Science & Resource Mgmt ‘26
First Flight Engaging Novice Birdwatchers with Merlin Bird ID
By Summer Delehanty,
Human-centered Design & Engineering ‘25
ABSTRACT
Birdwatchers play a critical role in citizen science and conservation, making the engagement of young and beginner birdwatchers especially important in sustaining these efforts. This study investigates how a bird identification app, Merlin Bird ID, can better recruit and retain new, inexperienced users. Using a mixed-methods approach—including observations, surveys, and interviews—this study explores the identities, motivations, behaviors, and struggles of young, novice birdwatchers. Findings show that novices often don’t identify as a birdwatcher due to lack of experience, have diverse goals, and rely on others to build foundational skills, such as locating and learning about birds. From these insights, design recommendations focus on building community, learning through multiple methods, encouraging ways of birdwatching besides list-keeping, and giving guidance to help beginners develop confidence and expertise.
INTRODUCTION
Birdwatching is a popular hobby, with more than 80 million participants in the United States, characterized by the observation or identification of wild birds (White et al. 2014). From the casual to the hardcore, birdwatchers are also often leading contributors to citizen science projects that leverage publicly collected data to inform bird conservation and ecological science. Public databases, like eBird, have provided data for over 1,250 published studies, especially helpful for research lacking funding or means to acquire data at scale (Tang 2025). Volunteers also run and participate in bird surveying events, notably the Christmas Bird Count, which has collected over 100 years of bird population data in the Western hemisphere and has been used in studies on population decline
and shifting ranges in response to climate change (Rosenberg et al. 2019, Wu et al. 2022). Because birds cannot exist without the environment that supports them, birders can be dedicated conservationists, whether by participating in invasive plant removal at a local scale, or advocating for greater environmental protection
Birdwatching isn’t just an activity – it’s a way of thinking that influences how people connect with their environment and encourages environmentallyconscious living.
policies at a national level. Oftentimes, birdwatching isn’t just an activity–it’s a way of thinking that influences how people connect with their environment and encourages environmentallyconscious living. While the average age of United States birdwatchers is still 49 years old, the activity is gaining traction in younger communities (U.S. Fish and Wildlife 2024). With the creation of digital field guides, apps to identify and track birds, and instant messaging allowing for the rapid spread of information, birdwatching accessibility has increased. One popular technology is the Cornell Lab of Ornithology’s Merlin Bird ID, a bird identification app with more than 3 million active users. People can upload photos they’ve taken of a bird, record birdsong, or follow a “step by step” ID process to receive identification recommendations generated by a machine learning algorithm. However,
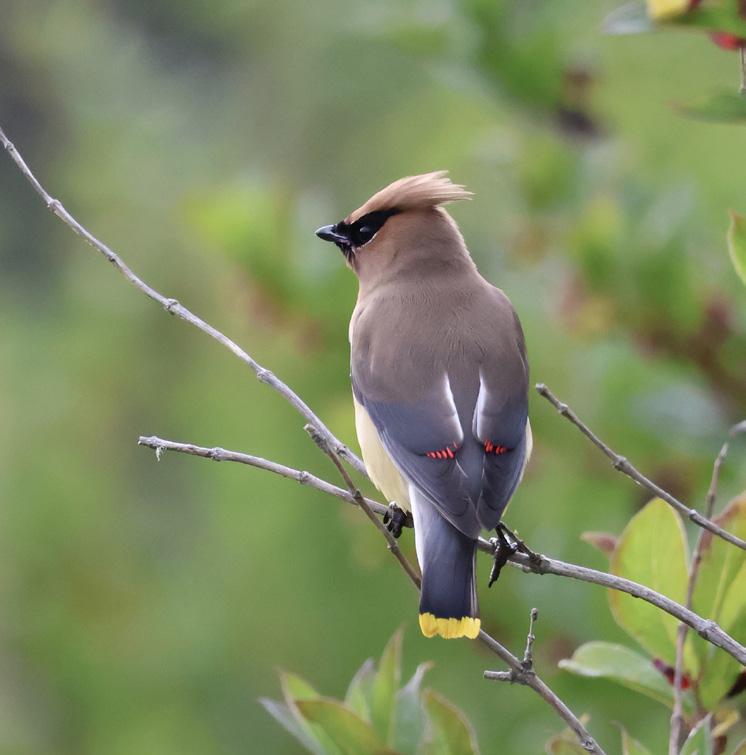
PHOTO Cedar Waxwing.
Photo by Summer Delehanty.
it’s not perfect, and birdwatchers must use their own discretion to verify the suggestions. Once confirmed, bird sightings can be saved and are then added to the eBird database. Technologies like this give new birders the ability to find and identify birds in real time, without poring over field guides or memorizing bird calls before they step outside. At the same time, it may prevent new birders from learning these skills themselves, because the app can do it for them (Gyllenhaal et al. 2026). In order to encourage young birdwatchers, the app needs to be sufficiently engaging, but also encourage them to build knowledge on their own. But how? In this project we sought to design Merlin Bird ID as a companion app to young, novice birdwatchers (18-40) that encourages regular engagement and long-term behavioral changes towards more environmentally-conscious lifestyles. Our research aims to identify: what is a novice birdwatcher, and how might this app support them?
METHODS
We split the project into two phases: research on novice birdwatchers and exploration of design strategies. Because the birdwatching community is so vast and birdwatching experiences are not universal, we used multiple different data sources–observation
notes, survey results, and interviews–to explore what it means to be a young, novice birdwatcher, from the tools they use to their goals and motivations (Figure 1). With a better understanding of our target audience, we used lowfidelity designs, or simple sketches of app interfaces, to propose changes to Merlin that address specific needs or pain points of novice birdwatchers, with the goal of recruiting and retaining new users.
We used a “grounded theory” approach in our research, a qualitative method of analysis that involves gathering information and identifying emerging concepts from the collected evidence. While analyzing data from our research participants, we made note of findings applicable to app design. We paid particular attention to novice birdwatchers’ (1) identity and understanding of hobby, (2) motivations and goals, (3) behavior, and (4) pain points and struggles. In grounded theory, all types of data are equally important and analyzed concurrently, so our theories are structured via the categories above, rather than sorted by method of data collection. To make sure our data encompassed a wide range of information and experiences, we used four methods to gather evidence: field observations, online observations, survey responses, and
interviews. Field observations and online observations, both passive methods of data collection, gave us insight on the natural thoughts and behaviors of birdwatchers. Although there’s no reliable way to assess a participant’s age or skill level using these methods, evidence gathered from observation provides helpful context about birdwatchers and can be used to supplement data obtained from the more direct interaction in survey responses and interviews.
Field observations were conducted at Union Bay Natural Area in Seattle, selected for its relatively small size, proximity to student housing, and reputation as a popular place for birdwatchers. Over the course of three, two-hour sessions, we observers took timestamped notes on the behavior of birdwatchers at the park to see what birds they looked at and what tools they used. Online observations, conducted in public birdwatching forums across Discord, Reddit, Facebook, and Instagram, focused on the content of posts or messages rather than interpretation. Consistent with grounded theory principles, each piece of data for analysis consisted of a subject and an action at a moment in time. To collect this data ethically, we followed guidelines listed in the Internet Research: Ethical Guidelines 3.0 (IRE) when reviewing online
theories about the identiy, motivations and goals, behavior, and pain points of novice birdwatchers.
FIGURE 1 Data analysis process. Data from all four information sources was combined and coded line by line. Coded data was then sorted into themes, which informed
content, removing all personal identifying information.
Surveys and interviews allowed us to directly interact with our target audience and further explore their identity as birdwatchers, motivations and goals, behavior, and pain points. In order to recruit interview participants, we collected four survey metrics regarding their experience as a birdwatcher: interest/ enthusiasm, knowledge, duration of time, and frequency. Using a scale of 1 to 5, we had potential interviewees rate themselves along these metrics, with 1 trending towards noviceness and 5 towards expertise. We divided the sum of their responses by the amount of points possible to assign each participant a “noviceness score.” We then randomly selected six participants that ranked in the lower 50% of all survey responses. The rest of the survey consisted of open-ended questions about birdwatcher experience to generate more pieces of data for analysis.
Our interview structure was guided by emerging themes from previously collected data and methodology from published qualitative research on birdwatchers (Sali et al. 2007, Aas et al. 2023). Each of the six 90-120 minute interviews was conducted in the same place as the field observations, where the interviewee first answered questions about their experience and identity as a birdwatcher. Then, the interviewer shadowed them as they birdwatched around the interview site and took notes by hand. Finally, the participant answered closing questions about how that birdwatching experience went for them and the role that Merlin BirdID played. Half the participants had previously used the app while the other half hadn’t. Those that had not used the app got the chance to birdwatch as they normally would first, before later being introduced to the app. All audio from the interview was recorded and transcribed using Zoom. Quotes from the interviewees and written observations from the field section of the interview were added to the
existing data, along with any openended responses from eligible survey participants that were not selected for an interview.
Starting with our field and online observation data then moving into surveys and interviews, we reviewed each piece of evidence line by line in a process called “open coding,” coding the data’s relation to the guiding research question and then grouping similar codes by theme (Charmaz 2006). For example, a field observation of a woman examining a tree through binoculars was coded as “using binoculars for closer inspection,” then grouped in the theme of “equipment/ tool use.” After grouping all the data, we organized our thoughts and initial impressions in memos, or free-form documents, where we noted what stood out to us from the research. Gathering all of our supporting evidence within each theme, we used an affinity analysis, or additional method of grouping, to start identifying more specific emerging concepts or theories. For example, creating a subgrouping of all instances of binocular use in the “equipment/tool use theme” allows us to form a theory on how novice
birdwatchers use binoculars as a tool and how that shapes their experiences. These theories, built from our four methods, were presented to the Cornell Lab of Ornithology and department sponsors. Together, we identified four potential design directions as examples of how this research could be used to improve engagement with Merlin Bird ID. We used low- and mid-fidelity mockups to explore these ideas and evaluate the desirability of these possible enhancements through four sessions of user testing with some of our interview participants.
RESULTS
To translate our results into design implications, we organized our findings by target user identity, motivations, behavior, and struggles (Figure 2). Identity – Currently, Merlin Bird ID is closely associated with birdwatching communities, which we found novices may not be a part of. Many novices balked at being referred to as a birdwatcher, citing reasons such as “I don’t always identify the birds,” “I don’t track my sightings,” or “I don’t go out intentionally looking for birds.” One theory we developed from our data
FIGURE 2 Emerging theories and their implications from our research, grouped by: identity, motivations, behavior, and pain points.
was that the birdwatcher stereotype can intimidate and dissuade beginners, whether that’s from identifying with the term themselves, or participating in events and community discussions. They’re less interested in resources advertised towards birdwatchers, preferring terms like “bird-lovers” or “nature enjoyers,” and are more likely to read but not participate in online birdwatcher discussions. Those that do participate in community events often express fear of being wrong or ignorant, or clarify that they’re either a beginner or not a “real” birdwatcher when sharing. Online especially, there were frequent arguments and regular “downvoting” or “disliking” of posts or comments asserting an incorrect identification. Knowing this, resources designed for novices must use extra effort to find and include their target audience.
We also found that novices prefer to learn from others rather than dig through resources themselves, regardless of how they feel about their own identity. Several study participants would stop to talk to a stranger with binoculars, pull out their phone to text or post, or ask the interviewer questions. They were also likely to ask for verification from others. Thus, learning is best encouraged through community building and conversation.
Motivations – Through our research, we theorized that not all novice birdwatchers care strictly or exclusively about identification,
“
While there is a lot of variety in the motivations and behaviors of birdwatchers, we hypothesized from our study results that all birdwatchers possess one shared trait: curiosity. ”
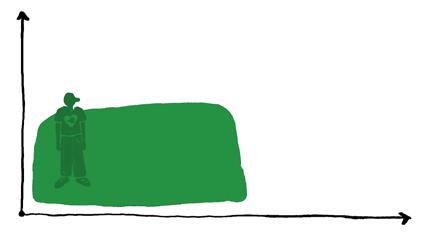
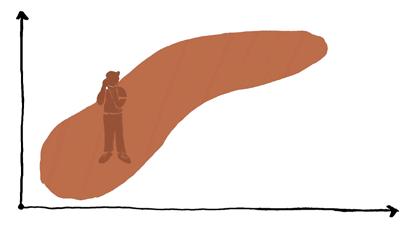
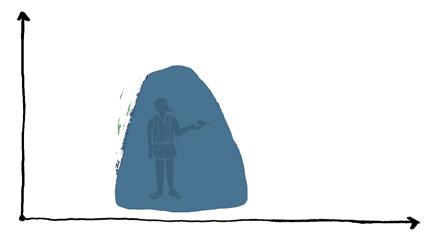

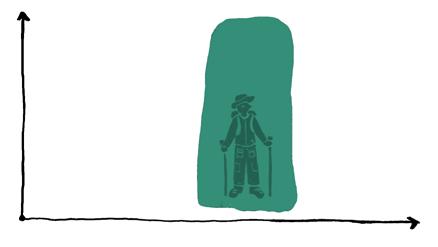

FIGURE 3 Proposed archetypes of birdwatchers. A subjective graph compares typical depth of bird-related knowledge on the y-axis and how closely they appear to a stereotypical birdwatcher on the x-axis, using the stereotype criteria provided by our participants (keeping lists, wearing specific clothing and gear, going early in the morning, etc). The more criteria the archetype may meet, the higher they score on the x-axis.
instead falling into different “types” of birdwatchers with a variety of goals, skill levels, and needs. We found that study participants with shared goals tended to act in similar ways, so to better understand alternate motivations for birdwatching and how that might differ from the perceived birdwatcher stereotype, we proposed alternate archetypes for comparison (Figure 3).
The six archetypes we found are: bird enjoyers, bird caretakers, nature lovers, photographers, curious learners, and companion birders. Each one is classified by their main interest in birds: casual entertainment, feeding or interacting with them, appreciating them as a part of nature, photographing them, learning about them or tracking statistics, and enjoying them as a part of community-building, respectively.
While there is a lot of variety in the motivations and behaviors of birdwatchers, we hypothesized from
our study results that all birdwatchers possess one shared trait: curiosity. No matter their goals, they need some kind of predisposition to observation and learning. Thus, their enjoyment of birds will benefit from their ability to access a wide range of information, and they may enjoy workflows in Merlin Bird ID that emphasize learning rather than just identification.
Behavior and Merlin ID use – We discovered that although novices are open to phone use while birdwatching, their lack of knowledge means they need to have it open more often and for longer to find what they’re looking for, which can distract them from the birds. One interviewee even missed a Bald Eagle soaring overhead while still reading information about a robin. While Merlin Bird ID was designed for field use, with step-by-step identification processes, we found that novices got stuck when reading
through all their options, highlighting a need for additional information prioritization.
Additionally, many are already distracted or doing other activities while they birdwatch: we found a large number of young, novice birdwatchers are opportunistic, or watch birds while doing other hobbies or activities. Many were observed or shared experiences of birdwatching while hiking, dog walking, commuting via foot, or simply enjoying time outside. They also may not pay attention to or look up information on every bird they see. Several study participants described the concept of “cool” or “interesting” birds that they notice. While every participant had a slightly different definition, generally, birds that are loud, conspicuous, big, moving, and/or brightly-colored were extra appealing to novices.
Pain points and struggles –When it comes to struggles with birdwatching, novices often had extra trouble with both finding the birds and seeing them clearly, impacting their ability to notice certain field markings and then identify the bird. Birdwatchers with years of experience
have more practice training their binoculars on a point and locating birds based on subtle sounds or movements. They also know what information is important, from what the bird is doing to what kind of environment it’s in. On the other side of the spectrum, study participants frequently struggled to locate a singing bird at all, let alone find it in their binoculars and gather identifying information. Even novices with high quality tools may not get the same views as an expert with the same
“ Turning the next generation of birdwatchers into environmentallyconscious individuals and contributors to citizen science starts with engaging them in the hobby regularly. ”
equipment, or have the same mental notes on the bird they just saw. For novices trying to describe or identify what they saw, they may be relying on worse views or less information about the bird.
Novices may not have binoculars at all, with participants describing their struggles with binocular access. Some wanted binoculars but struggled with the number of available options and/or price, others had binoculars but struggled with their weight or using them effectively, and others weren’t interested in binoculars at all, preferring either a camera or nothing. Merlin Bird ID displays high quality images of birds at a close range, which is often only how they appear when viewed through special optics. For example, these three images of the same species show how field marks and fine details can get lost without high quality equipment, which can make observation and identification more difficult (Figure 4).
Design implications – In order to adapt Merlin Bird ID to be a companion for beginners, all of the above findings must be considered. With four team members, we
FIGURE 4 Song Sparrow (Melospiza melodia) with different optics, showing how different field markings are only visible with certain tools. Photos by Summer Delahanty.
developed four different design directions that each addressed several of the theories proposed above to encourage regular use (Figure 5).
Because identity and community are so important to novice birdwatchers, the first design focused on welcoming beginners to the community: such as displaying a list of worldwide bird-related events, as many novices looked to others as a source of knowledge. Given the stereotype surrounding the word “birdwatcher,” it’s important that events use neutral language, or specify that they include people of all skill levels.
The second design further supports community by introducing badges and achievements. Turning birdwatching into a shared game can appeal to new birdwatchers’ sense of competition and encourage them to stick with the hobby, while also offering rewards for those that don’t necessarily care about their species lists – like recognizing how regularly they visit the same spot or how often they pay attention to birds.
Because novices have a lot more unfamiliar information to sift through and digest, the third design
incorporates flashcards and condensed versions of information to help novices find and remember what they’re looking for. Rather than having to read. through an entire paragraph, bullet points and short phrases will help novices see the information quickly and get back to birdwatching.
The final design introduces learning modules on other aspects of birding that study participants found difficult but can’t learn from a field guide: like where and how to find better tools, how to use them, and how to find birds in their surroundings. This, along with the flashcards, provides another use case for the app than solely out in the field, hopefully encouraging more regular use. It also addresses problems around finding and viewing birds that may make identification more difficult for novices.
As anticipated, during four rounds of user testing, our interviewees preferred the design directions that aligned the most closely with their individual birdwatching goals.
CONCLUSION
Just like birds, birdwatchers are everywhere, and they reflect an equally
wide range of diversity in their habits, goals, knowledge, and struggles. Given the positive impact birdwatchers have on environmental conservation and research, it pays to not be exclusionary. Turning the next generation of birdwatchers into environmentallyconscious individuals and contributors to citizen science starts with engaging them in the hobby regularly, which first requires taking the time to understand them and accommodate accordingly. Researching novice birdwatchers and identifying what they need is the first step towards encouraging a more sustainable way of life.
ACKNOWLEDGEMENTS
I’d like to thank my three capstone team members–Reis Pestano, Renee Chien, and Olivia Feng–for completing this capstone with me. I would also like to express my gratitude to Dr. Shana Hirsch, for sponsoring this capstone, and the design team at the Cornell Lab of Ornithology, for working with us. Finally, I’d like to acknowledge everyone who participated in our project definition and research, without whom this capstone would not be possible.

FIGURE 5 Example screens demonstrating each of the four design directions.

PHOTO APRIL MORROW

research communications
High adaptability, limited occupancy
Mapping habitat for non-native red fox in Washington
By Chris Steinbronn, Environmental Science and Terrestrial Resource Management, ‘27
The importance of addressing anthropogenic disturbances, such as urbanization and climate change, is growing (Abass et al., 2022; Scanes, 2018). Human-driven activities are subjecting ecosystems to dramatic changes, including environmental degradation, species distribution alteration, and ecological interaction shifts (Sekercioglu et al., 2007). The alteration of species distribution is especially threatening, as it can influence the range of non-native species, and potentially amplify existing disturbance from anthropogenic activities (Bradley et al., 2024).
In order to monitor the health of ecosystems amid these changes, we must consider shifts in the ranges of both native and non-native species. While a variety of studies have used Species Distribution Models (SDMs) to predict the range
for native species (Quinn et al., 2018), we are still lacking information on non-native species. Modeling the ranges of native and non-native species is important to understanding biotic responses to anthropogenic disturbance.
Two types of red foxes inhabit Washington State. The first is the critically-endangered native subspecies Vulpes vulpes cascadensis, found in the Cascade Mountains surrounding Mt. Rainier National Park. The second is the non-native Vulpes vulpes, which was first introduced to the area for fur trapping and predation of the European rabbit (Aubry, 1984). The non-native red foxes have a stable population in the San Juan Islands, but are low and fragmented throughout parts of western and eastern Washington. The red fox has the largest home range of any mammal in the world, spanning numerous different ecoregions, including urban cities (Zimen, 1980). They have even become invasive in Australia, areas in North America, and other parts of the world (Hradsky et al., 2019). Red foxes are opportunistic omnivores observed eating berries, small mammals, birds, carrion, and even earthworms, so their success is typically not limited by food (Zimen, 1980). This begs the question of why a highly adaptable, opportunistic feeder with a large range has a fragmented distribution in Washington.
“ Environmental conditions throughout Washington state may not promote occupancy for the red fox. ”
This study aims to address why red foxes are not more widespread across Washington state. The evolution of the Cascade red fox led to hyperspecialization and geographical restriction to high elevation areas (Akins et al. 2018), thus red foxes historically may not have spread naturally throughout the state. There are two potential hypotheses as to why the now introduced red foxes are not spreading. Firstly, red fox population numbers have remained too low and fragmented, therefore not reaching a threshold to grow and expand. They could be suffering from numerous features negatively impacting low population numbers, such as a lack of genetic diversity or Allee effects (Hohenlohe et al., 2020; Sanderson et al., 2013). The other hypothesis is that the environmental conditions throughout Washington state may not promote occupancy for the red fox. This paper uses a SDM to investigate this second
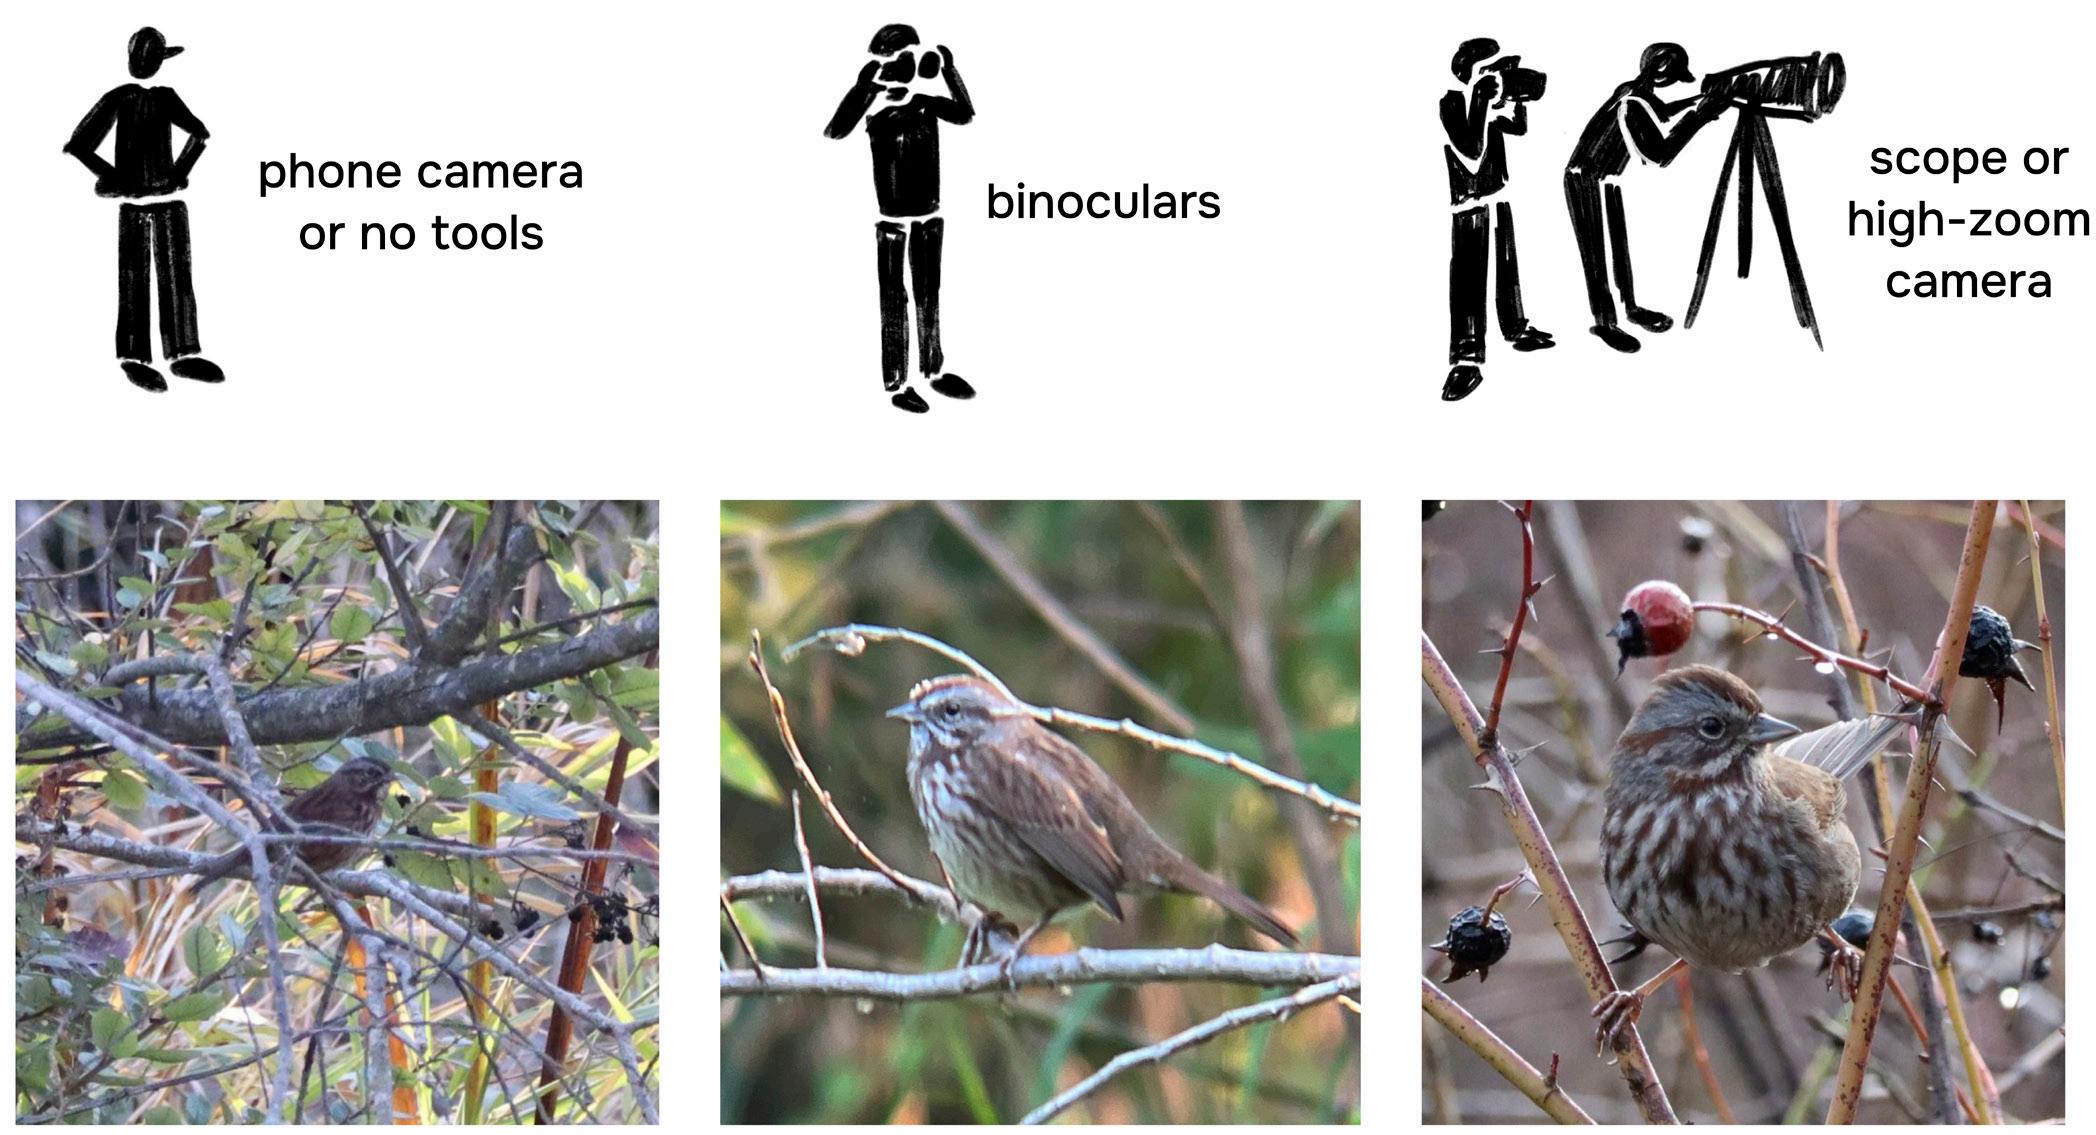
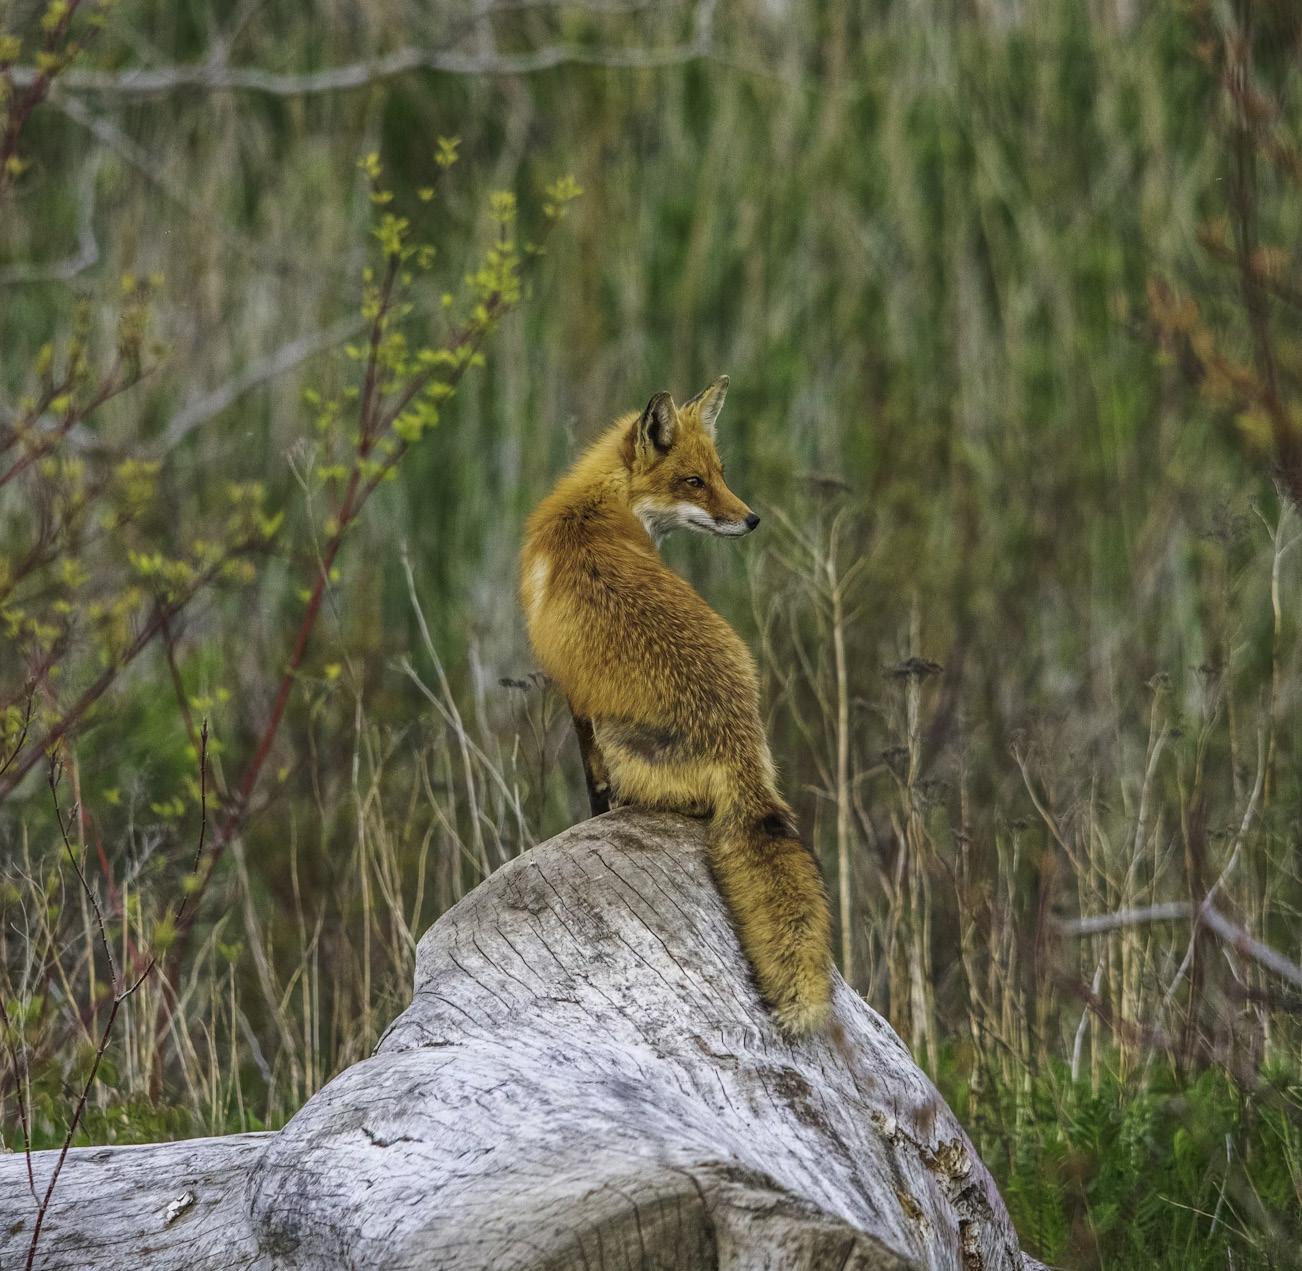
PHOTO Vulpes vulpes. Photo taken from Unsplash, posted by Jeremy Hynes.
hypothesis and assess if environmental conditions are limiting red fox distribution in Washington..
To determine habitat suitability, I used the machine learning algorithm MaxEnt to generate a SDM for red foxes across Washington state. MaxEnt uses presence-only observations for species and then records the environmental and spatial covariates of those sites, producing a map of predicted habitat suitability for the species of interest (Elith et al., 2010).
Both abiotic and biotic variables were factored into the red fox SDM. Red foxes and coyote (Canis latrans) populations are shown to be inversely related to each other due to intraguild predation and competition, so a kernel density map of the coyote point observations was created and added to the spatial predictor stack (Sargeant & Allen, 1989; Zimen, 1980). Observational point data was taken from the Global Biodiversity Information Facility (GBIF) for red fox (Linnauus, 1758) and coyotes. Any red fox observations that explicitly listed cascadensis as the subspecies were removed. Additionally, WorldClim bioclimatic and NLCD landcover data were included in the spatial layers to allow the model to incorporate temperature, precipitation, and land cover conditions. Temperature, precipitation, and landcover are common covariates because they play a large role in driving environmental gradients and interactions (Brodie et al., 2019) These variables can typically act as proxies for other unmeasured variables, such as elevation or latitude (Brodie et al., 2019). A Generalized Linear Model with this many data layers would overfit the model, leading to autocorrelation of variables that can over or underestimate their significance; using MaxEnt avoids the
problem of overfitting (Elith et al., 2010). The model ran through 20 iterations, which were then averaged to produce the distribution map. MaxEnt is inherently stochastic, so running multiple models is necessary when analyzing the importance of environmental variables as information may be lost due to this variability (Elith et al., 2010). I found that 20 runs led to stability and reduced the uncertainty in variable importance.
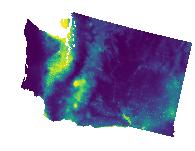
While I tried to remove observations of the subspecies Cascade red fox, there might be observations that misidentified the red fox as a Cascade red fox that would skew the suitability of that area. Even with the potential for this error in the Mt. Rainier area, the predicted suitability across the state is more expansive than the current extent of red fox observations (Figure 1). There are large geographic regions of predicted suitability that are either uncolonized, or have low fox density. More specifically, red foxes have been observed east of the Cascade Mountains, but most of the suitability was predicted west (Figure 1).
In this SDM, the most important drivers in red fox habitat suitability were mean temperature of the warmest quarter, annual mean temperature, max temperature of the warmest month, mean diurnal range, landcover, and mean temperature of the driest quarter (Figure 2A). All of these variables had very high response curve strength, indicating that habitat suitability strongly changes when they are varied (Figure 2B). Landcover, despite its high importance score,
1 Average predicted habitat suitability for red foxes (Vulpes vulpes) across Washington state. Regions with a higher predicted suitability have a value of 1, and are represented by the color yellow. The orange circle identifies Mount Rainier.
FIGURE
Precipitation
Precipitation of Wettest Quarter
Precipitation of Warmest Quarter
Precipitation of Driest Month
Precipitation of Coldest Quarter
Temperature Seasonality
Precipitation of Driest Quarter
Precipitation Seasonality
was excluded from this analysis because a response curve cannot be generated for this variable. Suitability tended to decrease with increased temperature, providing evidence for a negative relationship between hotter temperatures and habitat suitability (Figure 2B). Coyote density, while having the lowest predictive importance (Figure 2A), also conferred extremely low predicted suitability for red foxes with increasing density (Figure 2B).
This study finds that the suitable habitat for red foxes in Washington is more expansive than the range that they are currently observed to occupy. This provides evidence to reject the hypothesis that non-native red foxes are not spreading due to environmental conditions that create a lack of suitable habitat. Thus, the hypothesis regarding population growth that red foxes are not spreading due to the negative impacts of small, fragmented populations is more plausible. Since the predicted suitability of the non-native red fox expands into the native red fox habitat in the Mt. Rainier region, this study highlights the potential threat that this distribution could pose to the already endangered native population, and reiterates the importance of modeling both native and non-native species.
Even though coyote density corresponded with low predicted suitability, it was the least influential variable in predicting habitat suitability. Coyotes are known to be urban adaptors (Leighton et al., 2023), so a scenario where the foxes are able to expand their range could potentially lead
“ Suitable habitat for red foxes in Washington is more expansive than the range they are currently observed to occupy. ”
FIGURE 2 (A) Variable importance in predicting suitability according to MaxEnt. A higher importance score indicates that a variable had more impact in explaining the spatial variation. A negative importance score contributes less to the explanation. (B) Response curves for the most important predictor variables (excluding landcover), and coyote density.
the two species competing in these urban spaces. Further field work investigation of red fox and coyote density and interactions is needed to confirm this relationship.
Land cover was a moderately significant variable in predicting habitat suitability. In an intersection of landcover and red fox observation layers, red foxes were observed most in pastures, low developed regions, and evergreen forests. Given the high proportion of red foxes observed in landscapes involving human-management, further investigation is needed to conclude if the foxes are selecting for these regions, or if this distribution can be attributed to another factor.
Finally, temperature was the most significant variable when predicting habitat suitability. Since almost all of the environmental variables that predicted suitability were temperature dependent, rerunning this model under various climate change scenarios could give insight into how these interactions will change with increasing global temperatures. Lawler et. al describe Washington state as an important migration pathway to regions of higher latitude and elevation, and therefore, lower temperatures. Such conditions could provide a refuge for red fox populations in search of relief from temperature burdens, ultimately resulting in a shift in their range. SDMs are a critical tool that allow us to predict these shifts and infer their implications.
Alone in the Shallows
Foraging dynamics of Great Blue Herons in False Bay by
Alice Vimal, Marine Biology ‘26
Great blue herons (Ardea herodias) are large wading birds found throughout North America and are especially common along the shorelines, wetlands, and estuaries of the Puget Sound. The Puget Sound supports one of the highest concentrations of great blue herons on the West Coast, making it an important region for studying their ecology and behavior (Eissinger 2007). As long-lived predators at the top of their food chain, great blue herons are ecological indicators of wetland conditions and function as keystone species regulating populations of diverse prey species. Through these trophic interactions, herons may also indirectly influence the health of foundational habitatforming species such as eelgrass, a critical component of estuarine ecosystems that provides nursery habitat for juvenile fishes and supports coastal biodiversity (Eissinger 2007). By preying on organisms that graze on or disturb eelgrass beds, herons may contribute to the stability of these habitats, which have experienced periods of decline in False Bay. Because their ecological role is closely tied to their foraging behavior, understanding how great blue herons
hunt and compete for prey is important for understanding their influence on these ecosystems. However, despite their abundance and visibility, relatively little is known about how herons interact with one another while foraging, and how these interactions influence hunting success.
Tidal cycles strongly influence heron foraging opportunities in marine environments. Herons primarily hunt using visual detection, either by standing motionless or slowly stalking prey like fish and invertebrates before striking rapidly with the bill (Krebs 1974, Eissinger 2007). Because great blue herons cannot swim, they rely on shallow water exposed during low tide, which limits both the time and space available for feeding (Peterson and Marzluff 2025). As a result, competition for access to suitable foraging habitat may shape how herons space themselves while feeding.
During the breeding season, great blue herons gather in reproductive colonies known as rookeries as early as February, where they stay until their fledglings hatch and
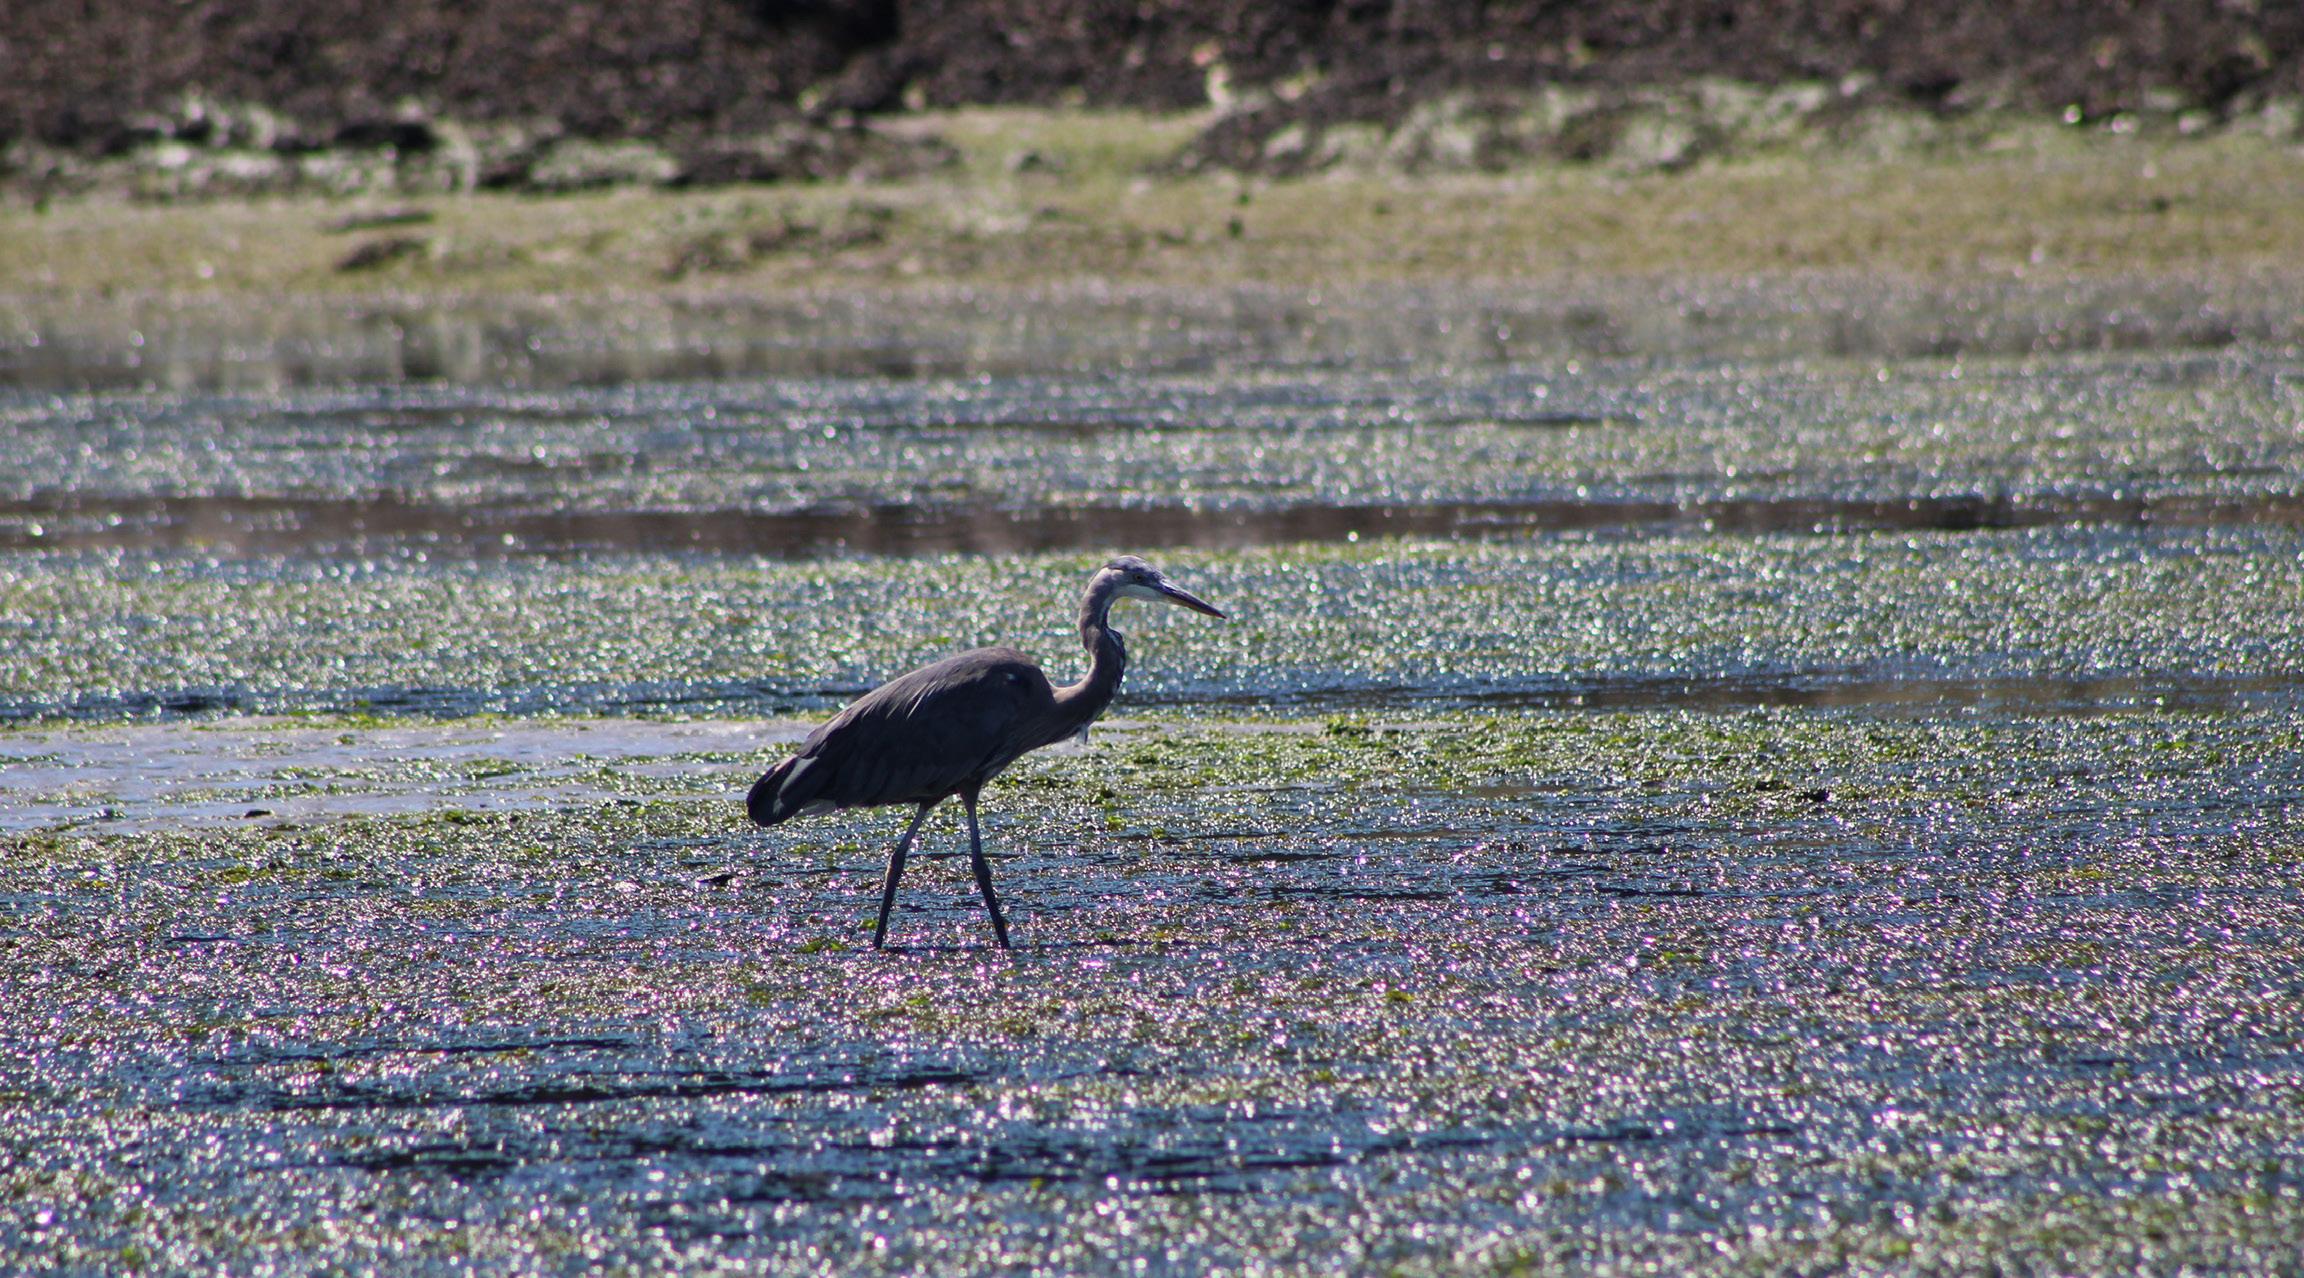
PHOTO Solitary Heron wading in False Bay. Photo by Alice Vimal.
disperse around July (Eissinger 2007). These colonies may function as information centers that allow birds to locate productive feeding areas, and large aggregations may also reduce predation risk through safety in numbers (Krebs 1974). Although San Juan Island does not currently host an active rookery, herons in the area are frequently observed roosting together at night, suggesting some degree of social association outside of the breeding season. While group dynamics are beneficial within rookeries and therefore could be advantageous for heron roosting groups, cooperative foraging behavior outside of breeding season is not well documented.
In this study, we observed great blue heron feeding behavior in False Bay, Washington, over three days. The objective of this study was to examine whether great blue herons that share roosting areas feed alone or in groups, and whether group foraging influences feeding success. With limited feeding area, herons may feed solitarily and compete
As long-lived predators at the top of their food chain, great blue herons are ecological indicators of wetland conditions and function as keystone species.
for resources. Alternatively, herons that roost together may benefit from cooperative feeding strategies. We predicted that herons feeding near one another might show higher strike success than individuals feeding alone.
Herons were observed from August 11–13 at False Bay Biological Preserve on San Juan Island, Washington, a shallow estuary composed of mudflats and sand that are widely exposed during low tide. We surveyed the southeastern portion of the bay, which contained silty mud and dense growth of Ulva (sea lettuce), providing habitat for small fish and invertebrate prey. Using binoculars and a spotting scope, we observed herons beginning approximately one hour before low tide. Every two minutes, we recorded whether herons were feeding alone or near other individuals. Herons within approximately two body lengths (about two meters) of another heron were classified as feeding in a group, while those farther apart were considered solitary. All strike attempts were continuously recorded, and a strike was considered successful if prey was visible or if the heron displayed head-shaking behavior associated with swallowing prey.
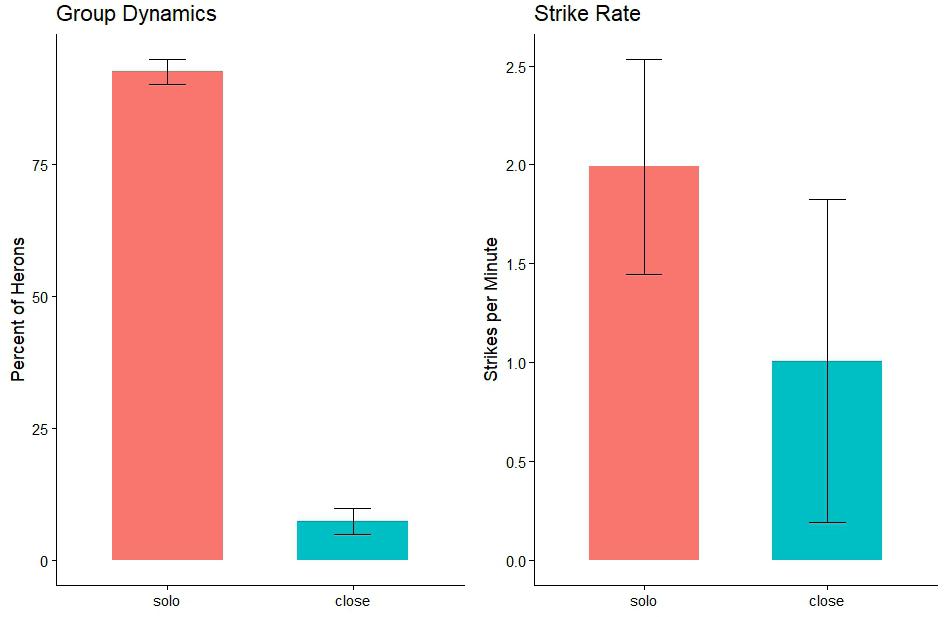
Over the three day observation period, great blue herons fed alone far more frequently than in groups (Figure 1). Across all 83 observations, more than 92% of herons foraged solitarily, while fewer than 8% fed near other individuals. This strong preference for solitary feeding suggests that herons actively maintain distance from one another while foraging in False Bay.
FIGURE 1 Strike rate and group foraging dynamics with 95% confidence intervals. Results shown
Solitary herons struck at prey more frequently than grouped individuals, averaging approximately two strikes per minute solitarily compared to roughly one strike per minute for grouped herons. Despite this difference in strike frequency, strike success was nearly identical between the two feeding strategies, with both solitary and grouped herons capturing prey in about 39% of strikes. However, because solitary herons struck more often while maintaining similar success rates, they captured approximately twice as many prey items per hour as herons feeding near others.
These results contrast with our original prediction that herons feeding near one another might benefit from cooperative foraging or shared information about prey. Instead, our observations suggest that competition for limited feeding space may discourage group feeding. Occasional aggressive displays between nearby individuals further support the idea that interference competition influences spacing behavior. Social hierarchies within roosting groups may also influence feeding behavior, allowing dominant individuals to control preferred feeding areas while subordinate birds avoid conflict by feeding independently. As tidal conditions restrict both the time and area available for foraging, maintaining distance from competitors may increase overall foraging efficiency.
Although solitary herons struck more frequently, similar strike success across feeding strategies suggests that prey availability and prey size may influence strike behavior. Solitary herons may target smaller or lower-energy prey, requiring more frequent strikes, while grouped individuals
may capture larger prey that require longer handling times. Similar success rates reported in previous studies from False Bay support the idea that prey distribution and size structure play a key role in shaping heron foraging behavior.
Great blue herons play an important ecological role in estuarine environments. Resident great blue herons are essential to False Bay’s trophic dynamics, influencing prey
Our observations suggest that competition for limited feeding space may discourage group feeding.
populations and supporting eelgrass recovery through topdown ecological control. In shallow estuarine systems where eelgrass habitat is increasingly vulnerable to disturbance, these predator-prey interactions may play an important role in maintaining habitat stability. The indirect trophic interactions highlight the broader ecological significance of great blue heron foraging activity in False Bay and its role in maintaining local ecosystem balance and recovery. Understanding how herons use limited feeding space is therefore important for conservation planning. Because herons primarily rely on solitary feeding, habitat protection efforts should prioritize maintaining sufficient foraging area and prey availability rather than supporting social feeding behavior. Protecting shallow shoreline habitats that support both prey populations and eelgrass beds is therefore important for sustaining the ecological functions of great blue herons.
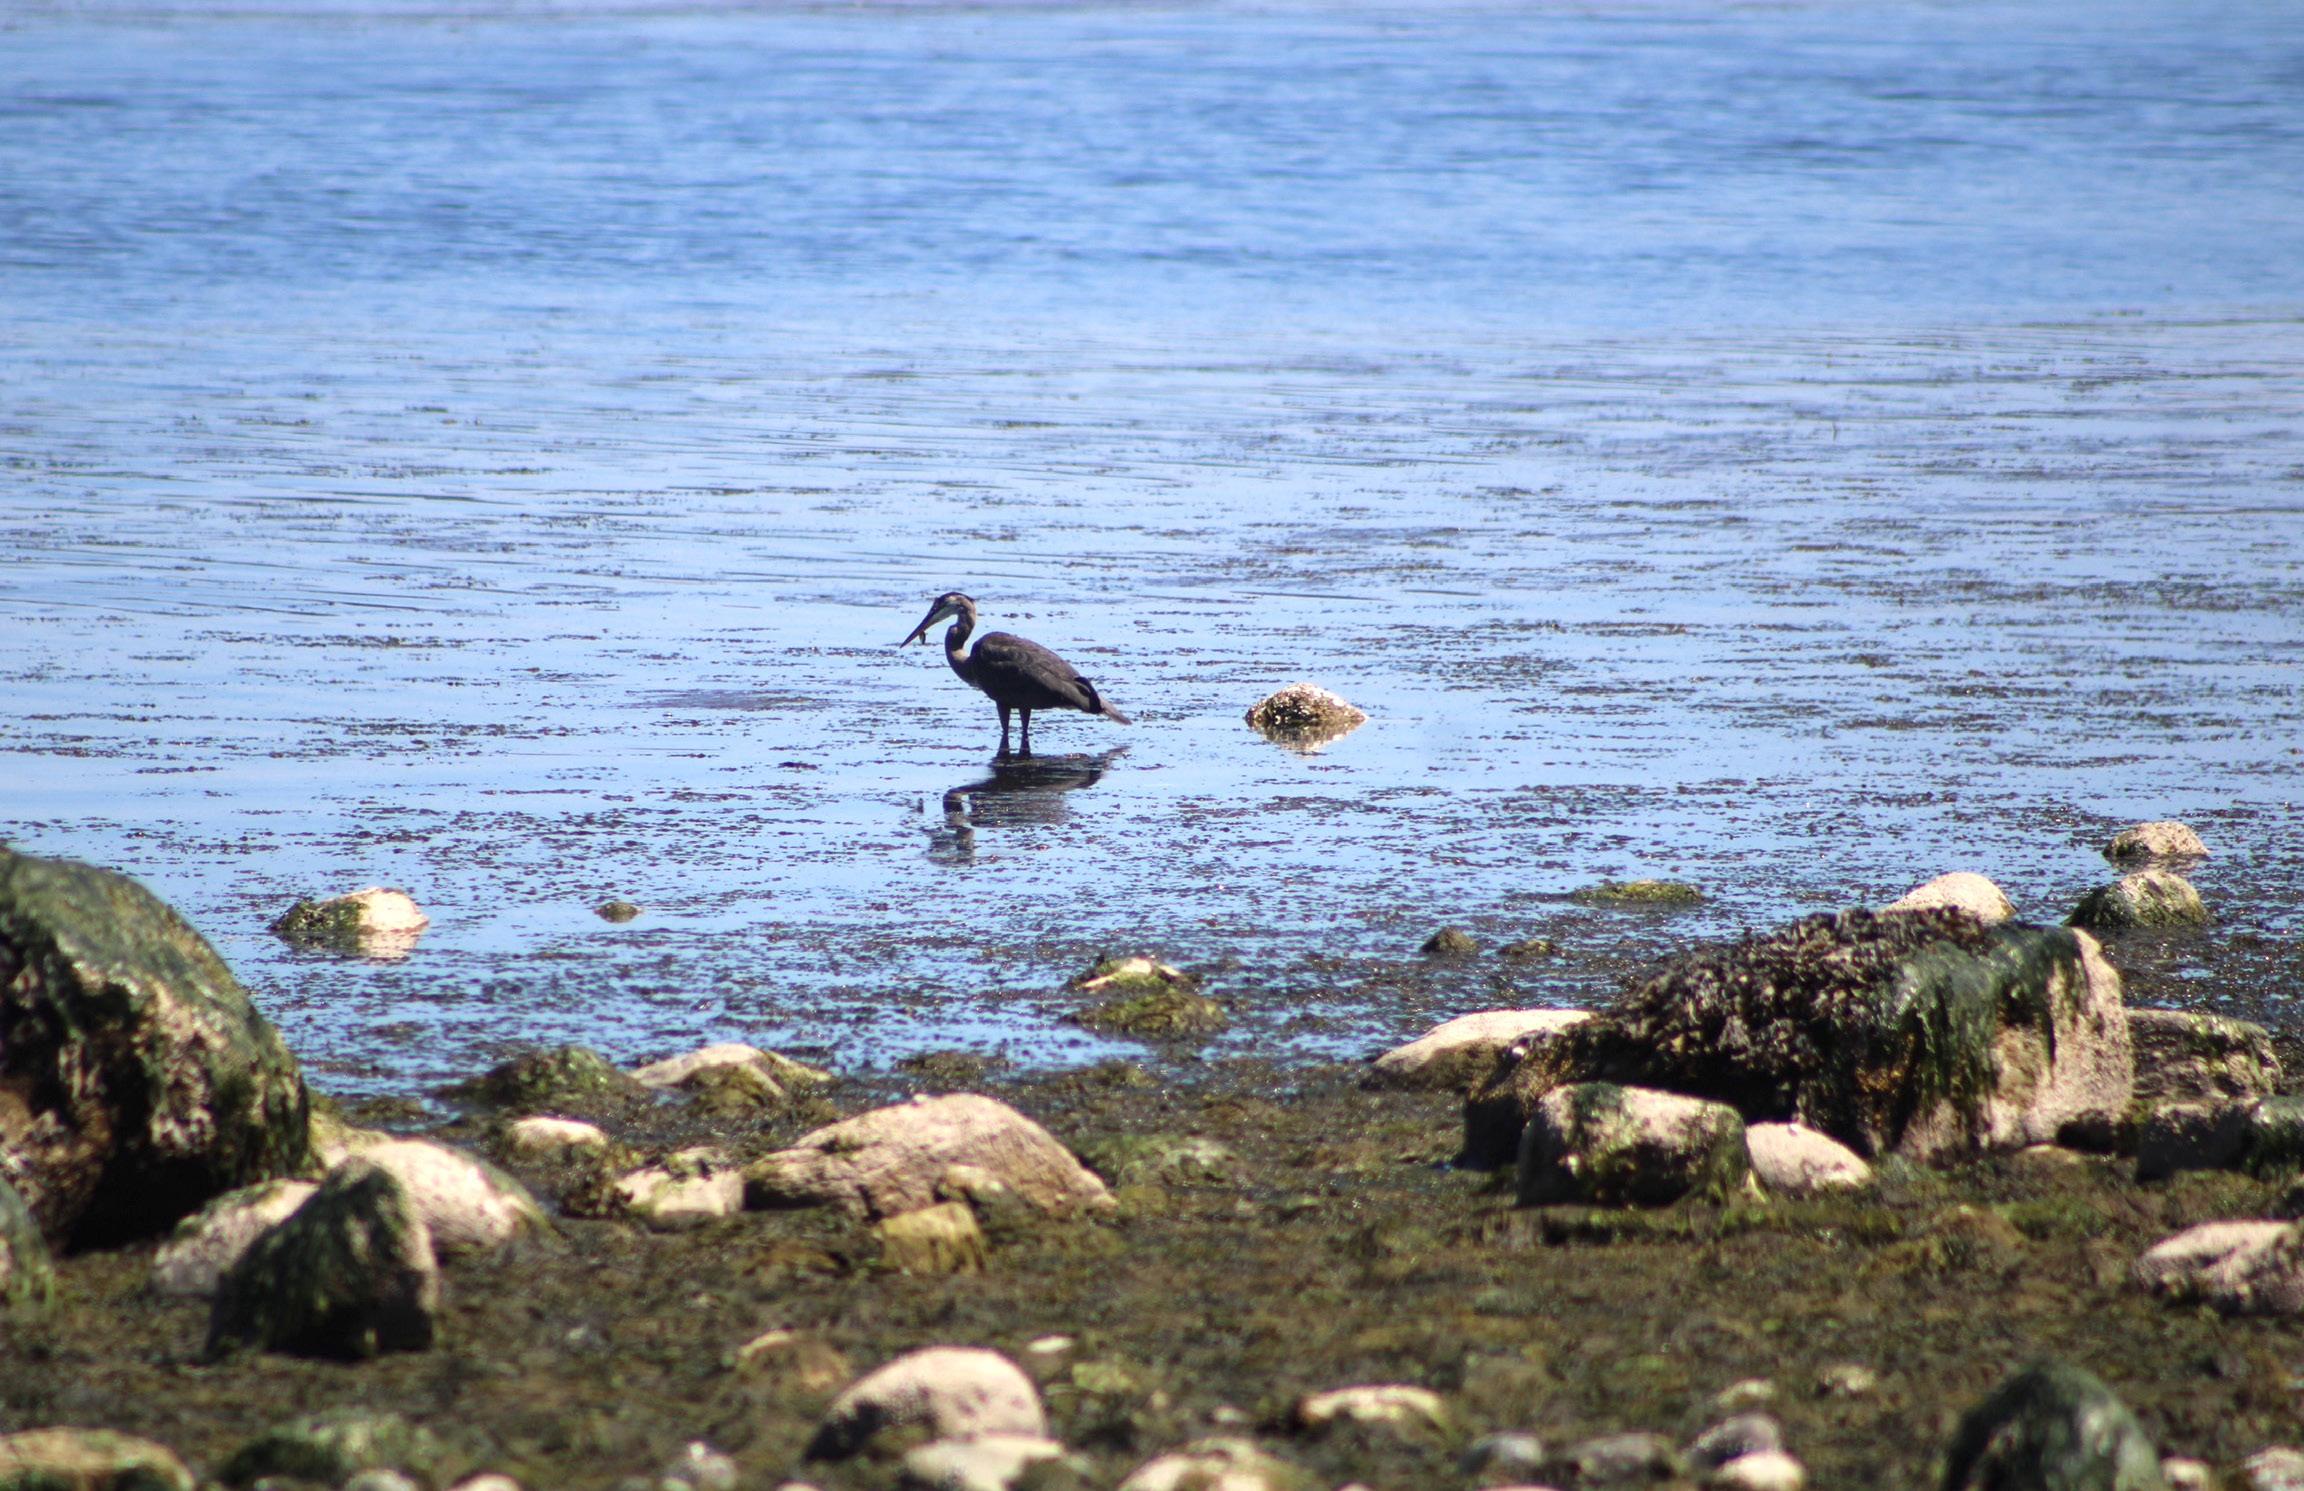
PHOTO Heron foraging in False Bay mud flats. Photo by Alice Vimal.
Seaweed to Soil
An exploration of sugar kelp as a composting supplement
By Mathilda Myerhoff, Environmental Studies & Anthropology ‘26
Coastal and intertidal ecosystems are increasingly impacted by excess nutrients flowing from land to sea. As agricultural zones exude chemical and nutrient runoff, these compounds reach the sea and fuel the rapid growth of macroalgae such as ulva and kelp species (Raven 2003). These algal blooms can quickly deplete aquatic ecosystems of oxygen through a process called eutrophication, resulting in hypoxic, low-light, sulfide-rich areas that fail to support typical ecosystem functions (Smith 2003). While some nutrient runoff is natural, the anthropogenically produced excess of these compounds in runoff is greatly accelerating eutrophication (Kahn 2014).
Throughout history, many societies have utilized seaweeds as agricultural fertilizers. Literature documents the use of seaweed as fertilizer across the European Atlantic area, ranging from Scandinavia to the Mediterranean Sea, dating as far back as AD 79 (Battacharyya et al. 2015). In North America as well, seaweed has been used in agriculture by coastal Indigenous populations (Troge, 2023).
Historically, localized techniques were developed to mitigate salinity and chemical imbalance, including the “lazy bed” farming systems of the Scottish Highlands. In this method, seaweed was layered with peat and left to weather under heavy rainfall, a process that likely leached excess sodium before it was applied to compost or used in further agricultural applications (Pereira et al., 2020).
When incorporated into compost or soil amendments, seaweeds can bring marine-derived nutrients to terrestrial systems, where they are released more slowly and support plant growth, soil structure, and microbial activity (Pereira et al. 2020). This approach reframes nuisance macroalgae from a negative byproduct of agricultural runoff to an approachable asset for sustainable agriculture.
In 2023, the USDA awarded nearly $5 million to the University of Washington’s Department of Environmental & Occupational Health Sciences (DEOHS) to further explore this phenomenon. This funding initiated the ‘Blue Carbon Green Fields’ (BCGF) project, which investigates the feasibility and benefits of modernized use of marine algae as a soil amendment. Despite reaching significant milestones, such as engineering scalable methods of algae harvesting and promising methods for field application in agriculture, BCGF was required to cease all current projects immediately following the grant termination in April 2025. As a result, this project and many others were halted prematurely. Nevertheless, this study’s results have the potential to inform the direction of future seaweed-to-soil research.
BCGF has run several experiments that assess the function of marine algae as a fertilizer, comparing various incorporation, application, and production methods. This study in particular explores a potential methodology for using sugar kelp (Saccharina latissima) as a soil amendment in compost. This incorporation method tests the feasibility of sugar kelp as a low-cost, convenient, natural fertilizer for coastal farmers. While other BCGF projects have primarily tested sea lettuce (Ulva lactuca), this study investigates the viability of sugar kelp as a compost amendment.
To analyze the performance of sugar kelp in this context, a field experiment was conducted that quantified the impact of sugar kelp as a compost amendment on two different plant stages: germination and early stage growth.
To do this, six identical compost bins (3 × 3 × 3 ft) were built on a certified organic farm on South Whidbey Island, Washington. Each bin was covered in a high tunnel to retain ideal decomposition temperatures. Aiding with compost rotation, the bins were maintained via a static-aeration system built with perforated PVC pipe running through the base of each bin. The pipe was connected to an industrial fan, which delivered airflow for approximately 20 minutes daily over a six-week composting period. All bins followed the same layered compost recipe consisting of mulch, grass, manure, and cedar grove soil, sourced on
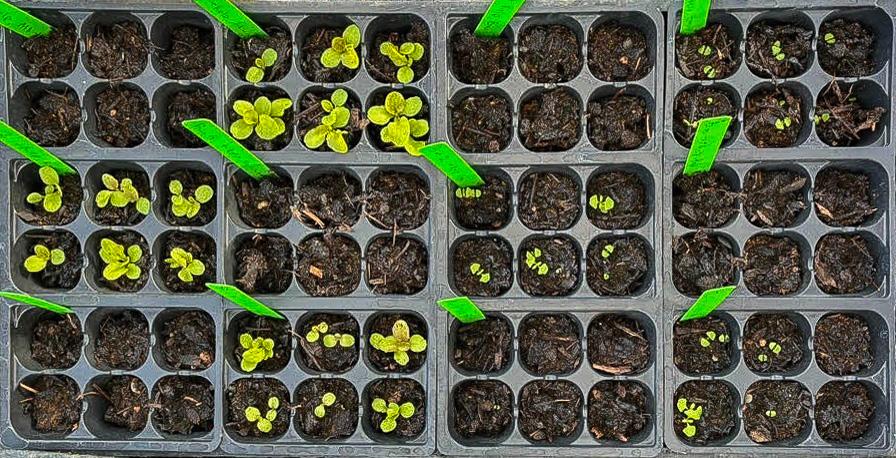
FIGURE 1 72 individual germination trials. Each color-coded section in the table above represents a collection of 6 cells, each with two seeds of the respective species. The corresponding soil treatment is represented in the table.
Whidbey Island or in the broader Puget Sound area. Sugar kelp was incorporated as a distinct layer in the compost sequence for three bins, while the other three bins served as non-kelp controls.
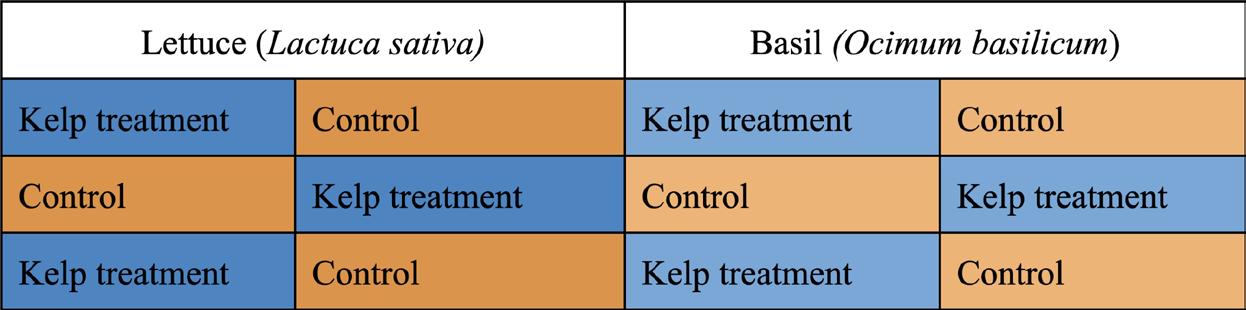
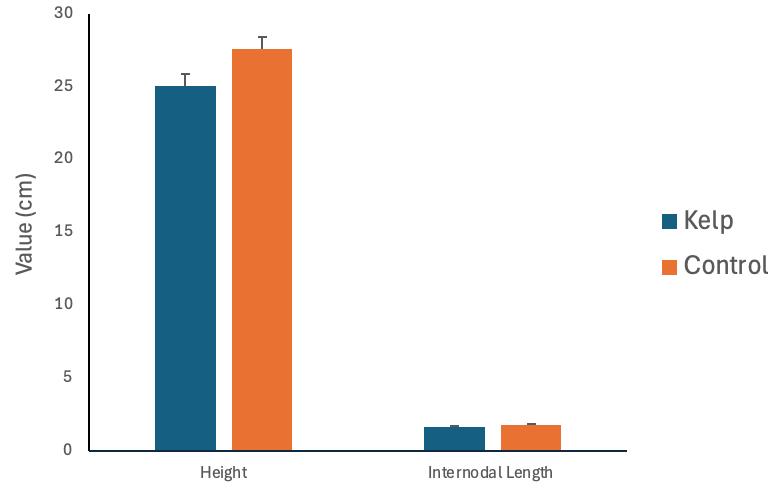
Following decomposition, compost from each treatment was used in two sequential plant experiments. First, germination trials were conducted using Alkindus lettuce (Lactuca sativa) and basil (Ocimum basilicum) seeds. Second, established Sungold tomato seedlings (Solanum lycopersicum), roughly 6 inches tall, were transplanted into compost from each treatment to assess post-germination growth. After eight weeks, each transplanted seedling was cut, and measured by three different metrics: biomass, plant height, and internodal length.
In our germination trials, there was a stark contrast in success across treatments: control treatments averaged a germination success of 86.67% , while the kelp-amended compost treatments exhibited a 0% germination rate (Figure 1). In the transplant trials, Sungold tomato plants successfully established across kelp and control treatments. Though substantial growth was noted among plants from both treatments over the two-month growing period, kelptreated trials displayed slightly reduced growth, considering height, internodal length, and biomass (Figures 2, 3). The reduced success in the kelp-amended germination and transplant trials suggests that this method of sugar kelp incorporation hinders plant growth.
The transplant trials compared to germination trials yielded less stark, but notable results in growth reduction. A longer timeline could have been beneficial in identifying the
“ Seaweed to Soil contributes to the wider effort of protecting coastal waters and intertidal zones from anthropogenic impact, while promoting support for smallscale farmers and shellfish operations, coastal restoration, and reciprocity. ”
full-scale of potential benefits or detriments of kelp-compost incorporation on early plant growth. Additionally, the study could benefit from Nitrogen, Phosphorus, and Sodium tests to identify differences in each trial’s compost treatment.
As the conversation of ‘Seaweed to Soil’ continues, this study provides insight into the feasibility of unprocessed incorporation of marine biomass for coastal farmers, and prompts further questioning on the topic. While historical “Seaweed to Soil” methods are rooted in success, the raw incorporation of high-salt species like sugar kelp may require a longer “curing” period or a pre-wash phase to protect sensitive seeds from osmotic stress.
While the application of seaweed in compost is well-documented, there is a lack of literature regarding composting kelp species (Pereira et al. 2020). However, kelp meal is well-regarded as a fertilizer for small-scale farmers. Kelp meal is a processed form of kelp that has been heavily rinsed, sun-dried, and ground up prior to sale and application.
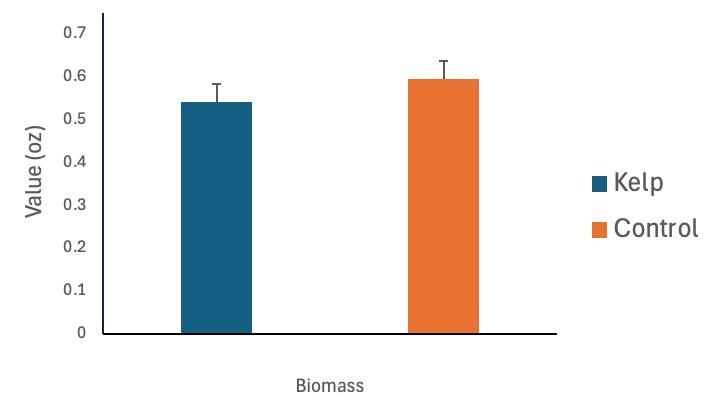
FIGURE 3 Average biomass in ounces compared across kelp-amended compost and control treatments.
The method of kelp incorporation in this experiment was selected to model an accessible method for small-scale coastal farmers to procure their own fertilizer. By taking kelp directly from the ocean and layering it into compost, we test the practicality of this natural fertilizing option. The low-effort application of kelp used in this experiment does not reflect traditional processes of seaweed fertilizer application, nor the process utilized to create kelp meal, both of which involve rigorous desalination routines before agricultural application. Excess marine salt in the kelp trials could have contributed to the unsuccessful growth outcomes from the kelp-amended compost.
The results of this study will contribute to the effort toward identifying ideal methodologies for incorporating agricultural marine algae. Anthropogenic disruption of ecological cycles is an ongoing and increasingly irreversible phenomenon that requires intentional input through initiatives like Blue Carbon Green Fields. Furthering research in the field of ‘Seaweed to Soil’ contributes to the wider effort of protecting coastal waters and intertidal zones from anthropogenic impact, while promoting support for small-scale farmers and shellfish operations, coastal restoration, and reciprocity between biological and anthropogenic systems.
FIGURE 2 Average internodal length and height in centimeters compared across kelpamended compost and control treatments.
Monitoring Forest Health in Point Defiance State Park, WA
By Nelson Pham
Environmental
Science
& Terrestrial Resource Management ‘27
T
he Pacific Northwest experienced one of the hottest summers on record in 2015 (USDA Climate Hubs, 2021). It also is the same year many foresters and scientists in the region noted large amounts of western redcedar dieback (Western Wildland Environmental Threat Assessment Center, 2024). Since then, starting in 2017, the Washington State Department of Natural Resources has tracked western redcedar dieback through annual aerial forest health surveys (Brennan et al. 2024). In 2022 they saw the largest amount of dieback recorded with over 100,000 acres of dieback measured by the state (Brooks et al. 2022). “Western redcedar dieback” occurs when parts of a western redcedar start to die whether through flagging (small twigs or branches wilting), branch dieback (entire branch has died), a dead crown (dead tree top), or in a lot of cases a dead tree. Andrus et al. (2024) found by looking at the yearly growth output in dead western redcedar tree rings and matching the rings with previous years climate data, after drought exposure, if the following years were just as warm and dry there was an increased likelihood of mortality by 80%. With a climate expected to continually warm, the study’s authors note that western redcedar may be the “Canary in the Goldmine” for our forests
here in the Pacific Northwest, and a potential key indicator for what is to come for similar native tree species.
Joey Hulbert, a Research Assistant Professor at WSU Puyallup Extension, oversees the western redcedar Dieback Map on iNaturalist, an open source platform for people to post pictures of wildlife to be identified. With a global community of over 4 million registered users, 4000+ observations have been added to the project from 463 different users. This growing database helps scientists build models to predict western redcedar health. Community science projects help to efficiently collect data across large areas and provide an educational element for users who engage in the data collection. Tree location, size, condition,
“ Western redcedar may be the ‘Canary in the Goldmine’ for our forests here in the Pacific Northwest, and a potential key indicator for what is to come for similar native tree species. ”
percent canopy dieback, and a list of health symptoms are all collected. With how far dieback is occurring across the region, the iNaturalist project allows for community scientists to crossverify tree identifications while actively participating in monitoring tree health within their own communities.
The Western Redcedar Parks Study, a coinciding iNaturalist project, was created to monitor a population of healthy western redcedars in Point Defiance Park in Tacoma, Washington. Starting in 2024 and ending in 2025, a group of community scientists spent every Wednesday afternoon traveling
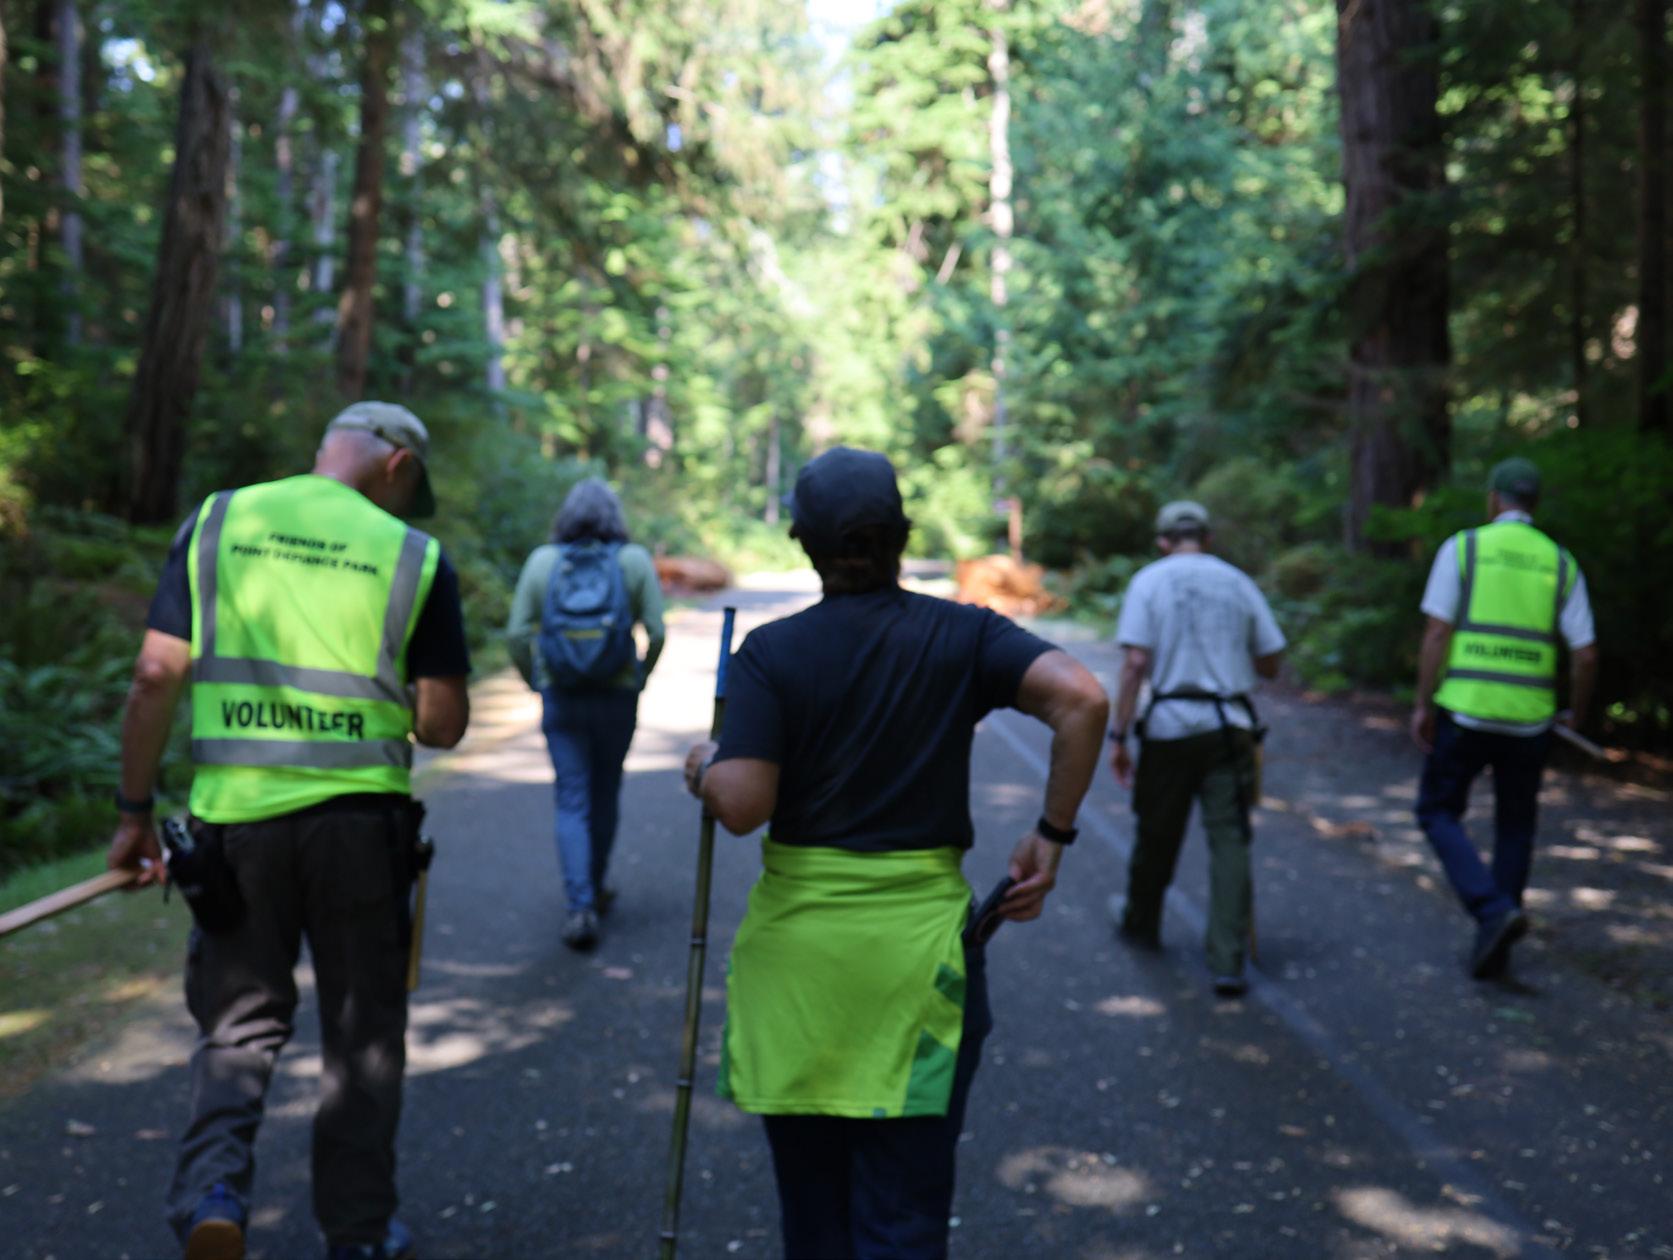
PHOTO Volunteers walking on the Point Defiance 5 Mile Drive. Photo by Isiah Montejano.
“
around Point Defiance with blue aluminum tree tags, nails, yard sticks, diameter at breast height (DBH) tapes, and their phones. They would log the location of any western redcedar within 20 feet of the trail, as agreed to by Parks Tacoma, and nail numbered aluminum tree tags into each tree for future monitoring. Then they would take pictures, meticulously scanning the tree canopy looking for signs of dieback. Finally, they catalog plant species found in the understory and make visual assessments on the trees’ health condition on a scale of ‘Good, Fair, Poor, and Dead.’
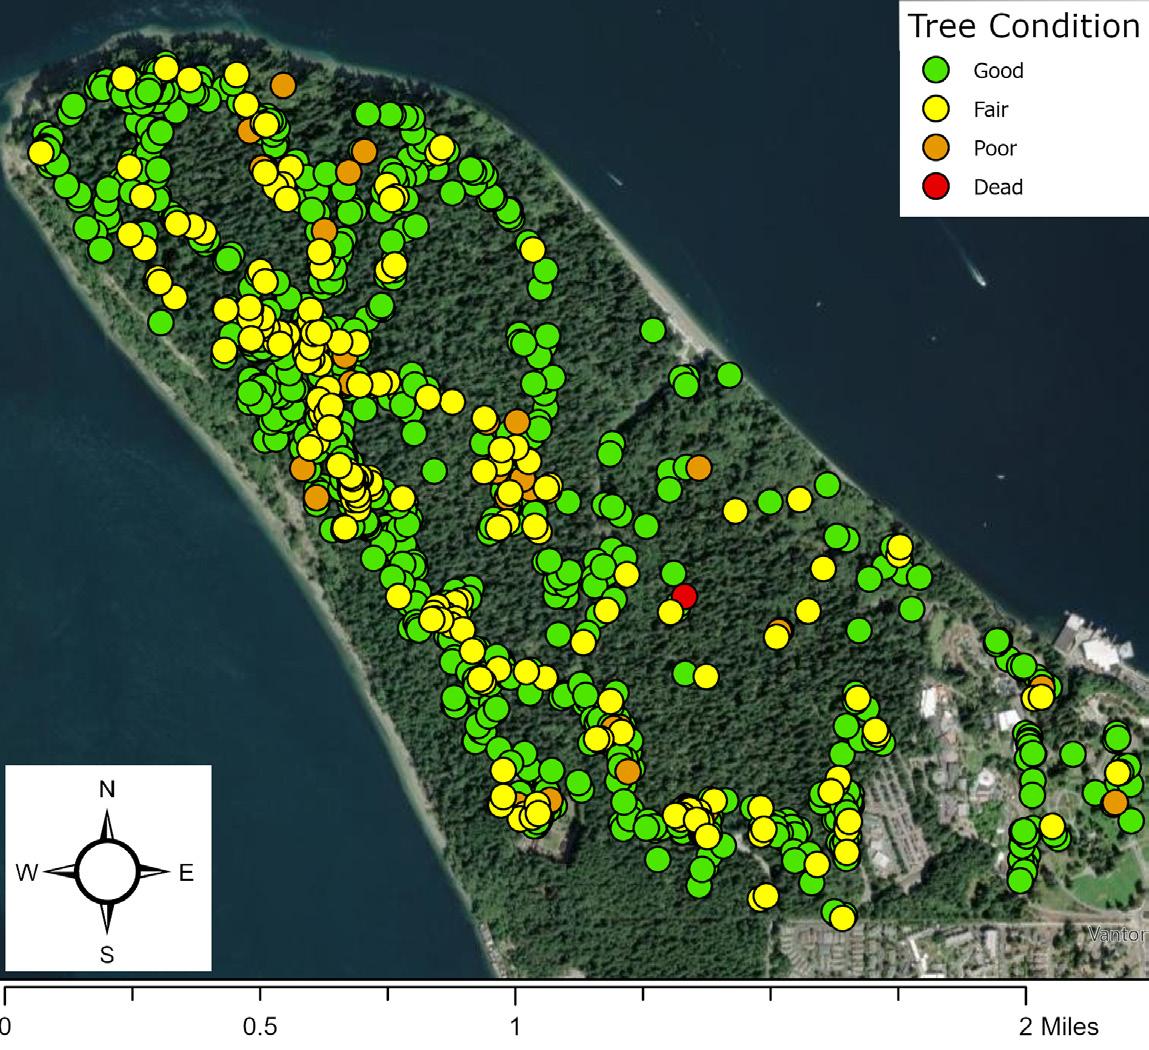
The collected data has revealed a promising picture for western redcedar health in Point Defiance. Only one dead western redcedar was found out of the 1136 tagged trees with 77% of trees being found in good condition while only 17% being in fair condition and 4% being in poor condition (Figure 1). This data sets a baseline for future monitoring projects to track trends in western redcedar forest health.
When looking at the tree size data, we see that most of the western redcedars in Point Defiance
Before moving out here I had very little connection to the forest. So you start doing this project, you start walking [around Point Defiance], and you start like… wow where am I? This is amazing.
”
– Ray Lepore, volunteer
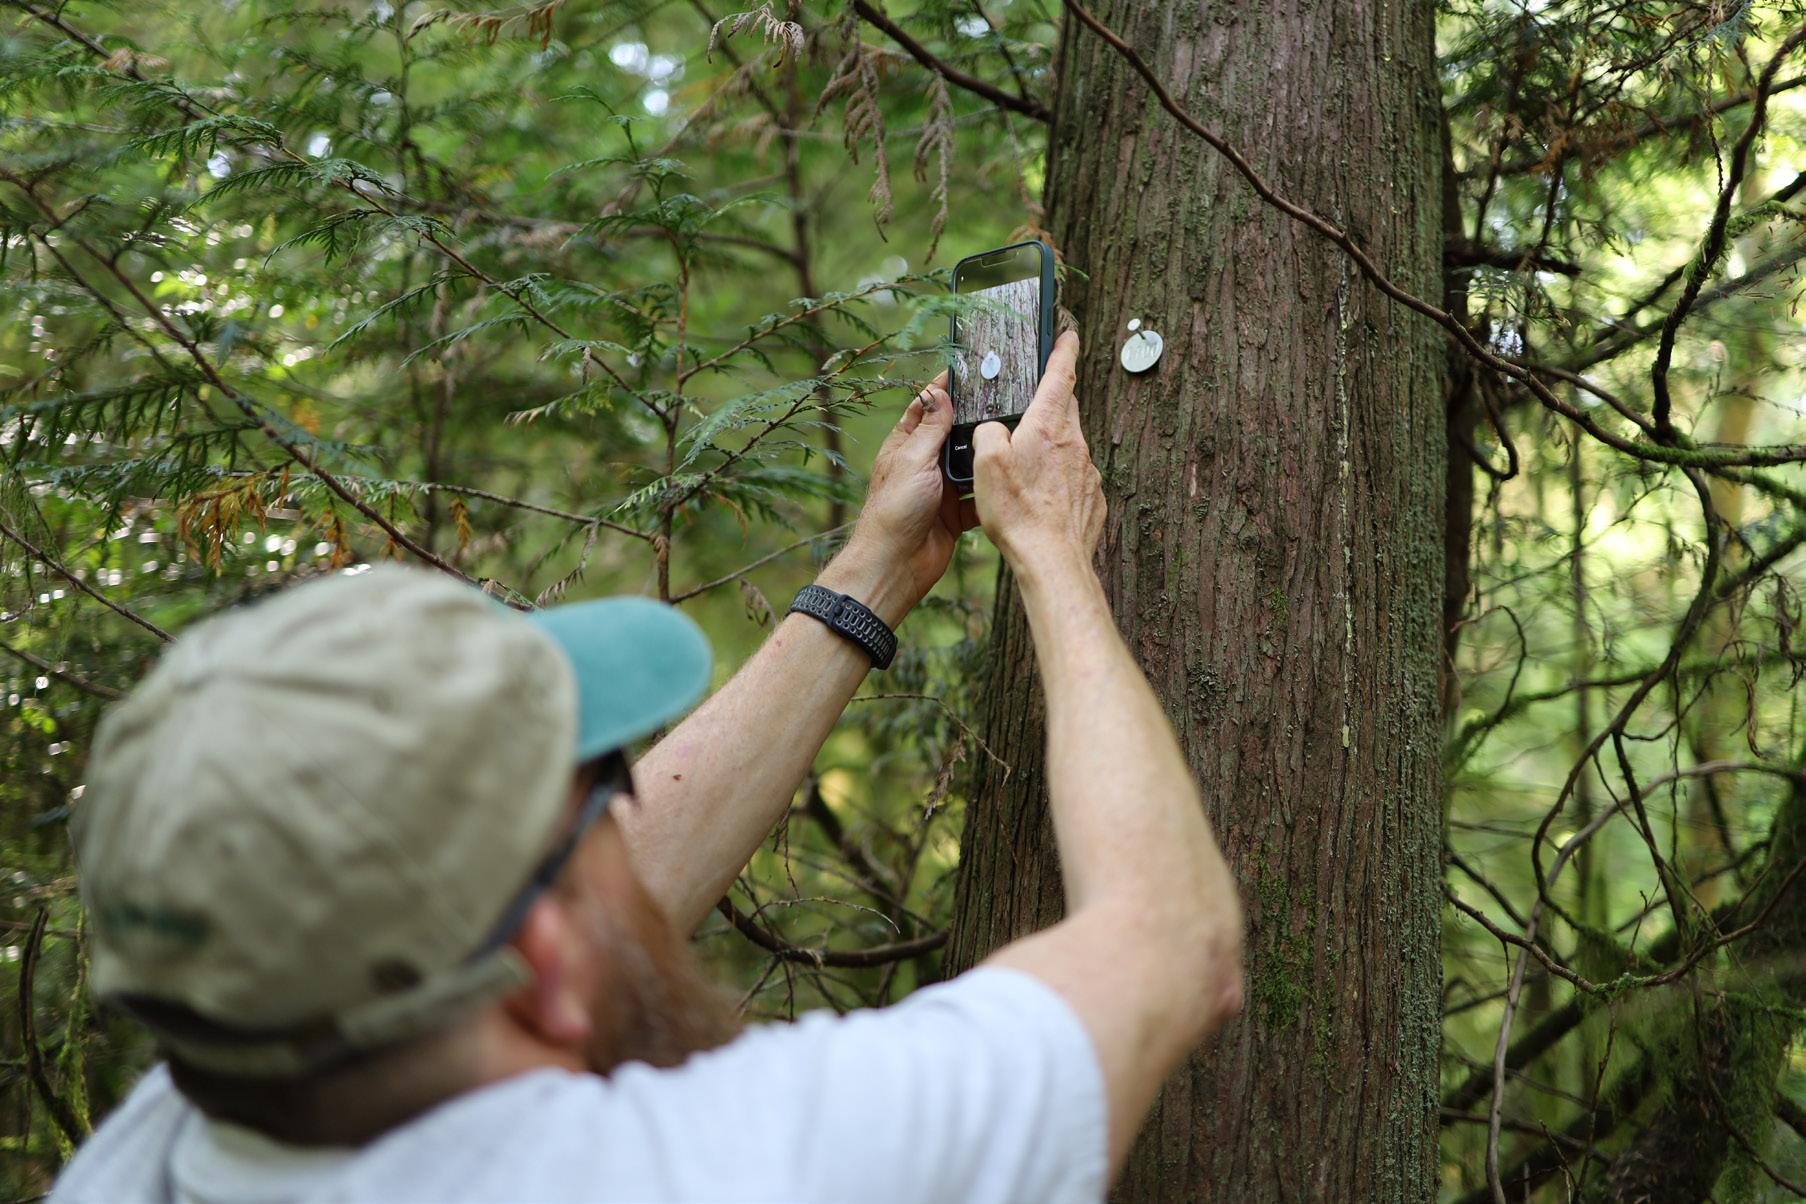
PHOTO Western Redcedar Parks Study volunteer, taking a photo of a tree tag on a western redcedar, ultimately to be uploaded to iNaturalist. Photo by Isiah Montejano.
FIGURE 1 Locations of tagged western redcedar in Point Defiance State Park, WA. Points colored according to categories of tree condition.
are well established having been there for at least 150+ years (Figure 2). Because western redcedar is a shade tolerant species, we also see a lot of new growth with younger trees being heavily prevalent within the 5-25 inch DBH range. This is a great sign as it shows there is new growth occurring that will eventually replace the much larger and older western redcedars over time.
The project has also been really important for the volunteers. “Doing this community science project, we’ve built a community, and that’s pretty special,” said Ray Lepore, one of the volunteers who helps organize and lead the project. When you walk with this group of volunteers, there’s a sort of familiarity between everybody there. In many cases, the volunteers have formed friendships that extend outside of the project. As the project was nearing completion, there was one afternoon where the volunteers decided to go on a 10 mile hike in Point Defiance together instead of wrapping up the day — community science isn’t just an avenue to bridge the gap between research needs and community engagement. These projects offer an opportunity to build social connections in a world where such connections can be hard to find. Whenever the group finds a tree that is far off the trail, they all go together instead of just sending one member out. There’s a sort of care for one another that extends beyond professionalism. Most members of the group are around retirement age, a population often vulnerable to the impacts of social isolation. This project allows them to form a community while contributing to meaningful scientific work.
With the Western Redcedar Parks Study finished, it now serves as a template for another similar project in Seward Park in Seattle. Seward Park is also home to a population of
western redcedars, and the volunteer group in Point Defiance has shown what is possible with a few people who have the time, energy, and resources, to go out and collect data on tree health. Even though the project has been completed, the group, or “The Western Redcedar Band” as they sometimes are referred to, is already gearing up for a new project to work on. Pacific madrones are also experiencing significant dieback, and Point Defiance has a population of them.
Joey Hulbert and Marianne Elliot, one of the Program Advisors for
the Urban Forest Health Lab, are looking into setting up a similar pilot study on Pacific madrones.
As funding for forestry research becomes scarce, and climate change continues to warm our world, scientists must think about the communities they serve. Finding and creating meaningful engagement opportunities may be a way forward in rebuilding trust in the sciences and a cost-effective alternative for data collection. Community scientists on the ground collecting data on tree health may be the starting point for highlighting the importance of forest health. It remains unclear how western redcedar health will fair in the future within Point Defiance Park as longer and drier summers become the norm. What can we do to help our forests remain resilient in the face of climate change? Questions like this require long term data collection, and if it weren’t for the community scientists on the ground volunteering their time and energy to community research, projects like this wouldn’t exist.
“What
can we do to help our forests remain resilient in the face of climate change? Questions like this require long term data collection, and if it weren’t for the community scientists on the ground volunteering their time and energy to community research, projects like this wouldn’t exist.
FIGURE 2 Count of western redcedar according to diameter at breast height sizes in Point Defiance State Park, WA.
Brewers Without Borders
How Hops Shape Washington’s Environment and Belgium’s Economy
By Orion De Smet, Environmental Studies ‘26, Adlai Knutson, Envrionmental Studies ‘26, and Emily Sanders, Economics ‘26
Washington state is famous for its diverse climate and wide ranging landscape spanning temperate rainforests in the west and semi-arid deserts in the east. Most notably for brewers, Washington heavily supports the growth of hops - the flowers of Humulus lupulus and one of the four key ingredients in beer. Water, another key ingredient, is needed in large amounts to grow and process the hops, leading to long-standing concerns regarding the environmental consequences of hop growing. Perhaps no other country loves hops more than Belgium, whose beer culture was placed on UNESCOs list of items preserving the ‘Intangible Cultural Heritage of Humanity’. Belgium imported close to 15 percent of all processed hops from Washington, totaling a value of USD 63 million and far exceeding other major importers such as Germany (USD 20 million) and the United Kingdom (USD 19.8 million) (USCB 2025). This unique relationship greatly contributes to the Washington economy, but the excessive water and fertilizer puts considerable strain on the
state’s freshwater resources.
The United States is the world’s leading producer, with Washington state producing roughly 74 percent of the national supply. Washington’s dominance in the hop industry is attributed to the environmental conditions of the Pacific Northwest and a strong market demand in domestic and international markets. Of the 41,000 acres dedicated to hop production in Washington state, a large majority of it is clustered in the central Yakima Valley, a semi-arid desert region that receives irrigated water from the Yakima River Watershed.
The Yakima Valley’s climate allows for high hop yield, which is a metric of production that measures growth efficiency rather than raw production data. This allows Washington state farmers to maintain high yields even when overall production elsewhere is low. When yield does dip, it could be explained by inadequate growing conditions, or farmers favoring space intensive hops. The Yakima Valley receives nearly 16 hours of sunlight a day during the summer months, thus offering near perfect conditions for hop production. Not only does Washington have superior growing conditions, their proximity to the ports on the Pacific Ocean and access to research institutions like Washington State University increase their reach and ability to advance disease and pest-resistent hop varieties.
Adding to Washington’s hop demand abroad are patented hop varieties like Citra®, Krush™, and Mosaic®, which are bred for their unique and intense flavor profiles. These hops are owned and licensed by the Hop Breeding Company of Yakima Chief Ranches, which creates an entirely exclusive supply (Yakima Chief Ranches 2026). In 2023, nine of the top ten hops grown in Washington state were locally bred and cultivated. The primary destinations for U.S. hop exports include Germany (USD 44.3 million), the United Kingdom (USD 44.2 million), and Belgium (USD 41.3 million), all of which have a significant history of beer brewing and have been frontrunners in the craft beer revolution (The

PHOTO Beer and hops. Photo by Missy Fant, Unsplash.
Observatory of Economic Complexity 2025). With growing demand for hop forward beer styles, these hops are desired by brewers who aim to produce distinctive beers such as the bitter and hop heavy IPAs that are synonymous with Washington state breweries.
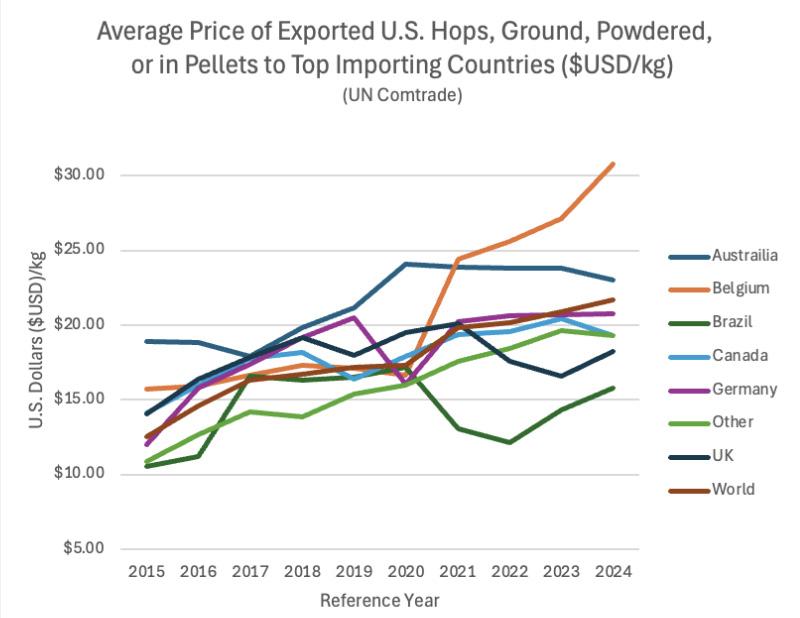
The United States’ reported free-on-board (FOB) values and quantities exported to top hop importing countries have remained relatively similar to one another throughout the past decade (UN 2025). Belgium initially followed this trend, however from 2020 to 2022, the United States reported a sharp increase in exports to Belgium (Fig. 1). The global pandemic and recession increased Belgian beer consumption by 12 percent with a whopping 650 million liters of beer polished off. (Van Gelder 2022). The significant increase in beer consumption and production within Belgium could explain the sharp increases seen in the United States reported FOB values. Following the COVID-19 pandemic, the United States slightly decreased hop exports to other large consumers. In the years ahead however, we would expect imports to continue to rise, specifically in top consumers of United States hops in Europe such as Belgium and Germany, due to the previous decade of import data showing a steady increase.
Belgium pays a premium for hops imported from the United States at nearly $30/kg, whereas other top importers of United States produced hops pay between $20/kg and $25/ kg (UN 2025). Belgium likely pays more because Belgium primarily focuses on specialty beers that require bitters properties and specific aromatics, which are found in Washington state hops. Germany, another major importer of the United States produced hops, primarily produced lagers and pilsners, with less intense hop profiles. Speciality hops from Washington state may not be necessary, allowing brewers to
source non-patented hop varieties.
Hop farmers in the United States heavily rely on exporting processed hops. In 2024, the United States produced USD 446 million worth of processed hops (NASS 2024). The same year, the United States exported USD 245 million, or 55 percent, of the total amount of processed hops produced. In Washington state, only 8 percent of their annual crop is exported to Belgium (NASS 2024), however Belgium was incredibly reliant on American imports of processed hops, with American processed hops representing 82 percent of the total market value.
Continued concerns regarding large-scale hop farming include those that are common to most other agricultural practices. Consumptive water use, fertilizer application, and soil management practices can lead to contaminated runoff and long-term soil degradation. Nitrogen based synthetic fertilizers cost approxi-
mately $0.30/lb and are often applied liberally to hop farms, generally between 80 and 200 pounds per acre. The National Association of County Agricultural Agents found a significant increase in average hop biomass from 0 to 100 pounds per acre of fertilizer but an insignificant increase after the 100 pound mark across all seven varieties studied. Researchers from Oregon State University report that hop farmers could, on average, decrease their fertilizer use by almost 50 percent and achieve the same yield of hops (Christensen 2009).
Despite these studies, many farmers continue to overapply fertilizers. A 2013 EPA report found that 1.6 million pounds (8.6%) of the total fertilizer use in the Yakima Valley was for hop production. Frequent tilling, heavy rainfall, and constant irrigation can disrupt the soil and lead to high nutrient levels in the runoff. This may promote eutrophic conditions in rivers, leading to the risk of hypoxia and dead zones. The United States Geological Survey found above expected algal growth in the summers of 2001 and 2003, as well as lower dissolved oxygen levels than the Washington
“
The United States is the world’s leading producer, with Washington state producing roughly 74 percent of the national supply. Washington’s dominance in the hop industry is attributed to the environmental conditions of the Pacific Northwest.
FIGURE 1 Average price over time of exported United States hops to top importers.
state standard in 2003 (Zuroske 2009). Furthermore, the Environmental Protection Agency found that 20 percent of total water wells in the Yakima Valley had nitrate levels above the federal standard for safe drinking water, including 100 percent of wells located in close proximity to hop farms (EPA 2013).
Water plays a significant role in the production of any crop, including hops. However, hops require significantly more water than other common crops. To put this in context, research from Virginia Tech University indicated that apples in Washington state require only one-fourth of the water compared to hops. Yakima Chief Hops, a major supplier, reportedly used 10 million gallons of water for hop production in 2023. The amount of water needed when growing hops varies based on variants. Aroma hops need 423 gallons of water to produce one kilogram, whereas alpha hops need 251 gallons of water to produce one kilogram (Hoang 2022). Typically, this water is drawn from local watersheds to provide the needed volume for fields, however continuous irrigation can lead to loss of local freshwater habitats and ecosystems. To combat high water use and environmental degradation, farms can implement drip irrigation methods which can decrease total water use by up to 70 percent. A widespread switch from traditional irrigation methods to drip irrigation would allow for an increase in hop production, as far more hops could be grown with the same amount of water, potentially leading to an increase in local agricultural economies and an increase in export profits.
“
Consumptive water use, fertilizer application, and soil management practices can lead to contaminated runoff and long-term soil degradation.
As the global craft beer market continues to expand, so will the hop industry. The environmental impact of hop farming, especially water and fertilizer usage, poses many of the same challenges as other industrial agriculture systems. Continuing research partnerships with various agricultural foundations, crop scientists and industry will undoubtedly help fuel breakthroughs in hop processing and agricultural methods, while concurrently protecting freshwater ecosystems. Washington state’s beer economy relies on the sustainable production of hops, and by protecting the watersheds and ecosystems surrounding the Yakima Valley, farmers can ensure Washington’s hops can be enjoyed domestically and abroad for generations to come.
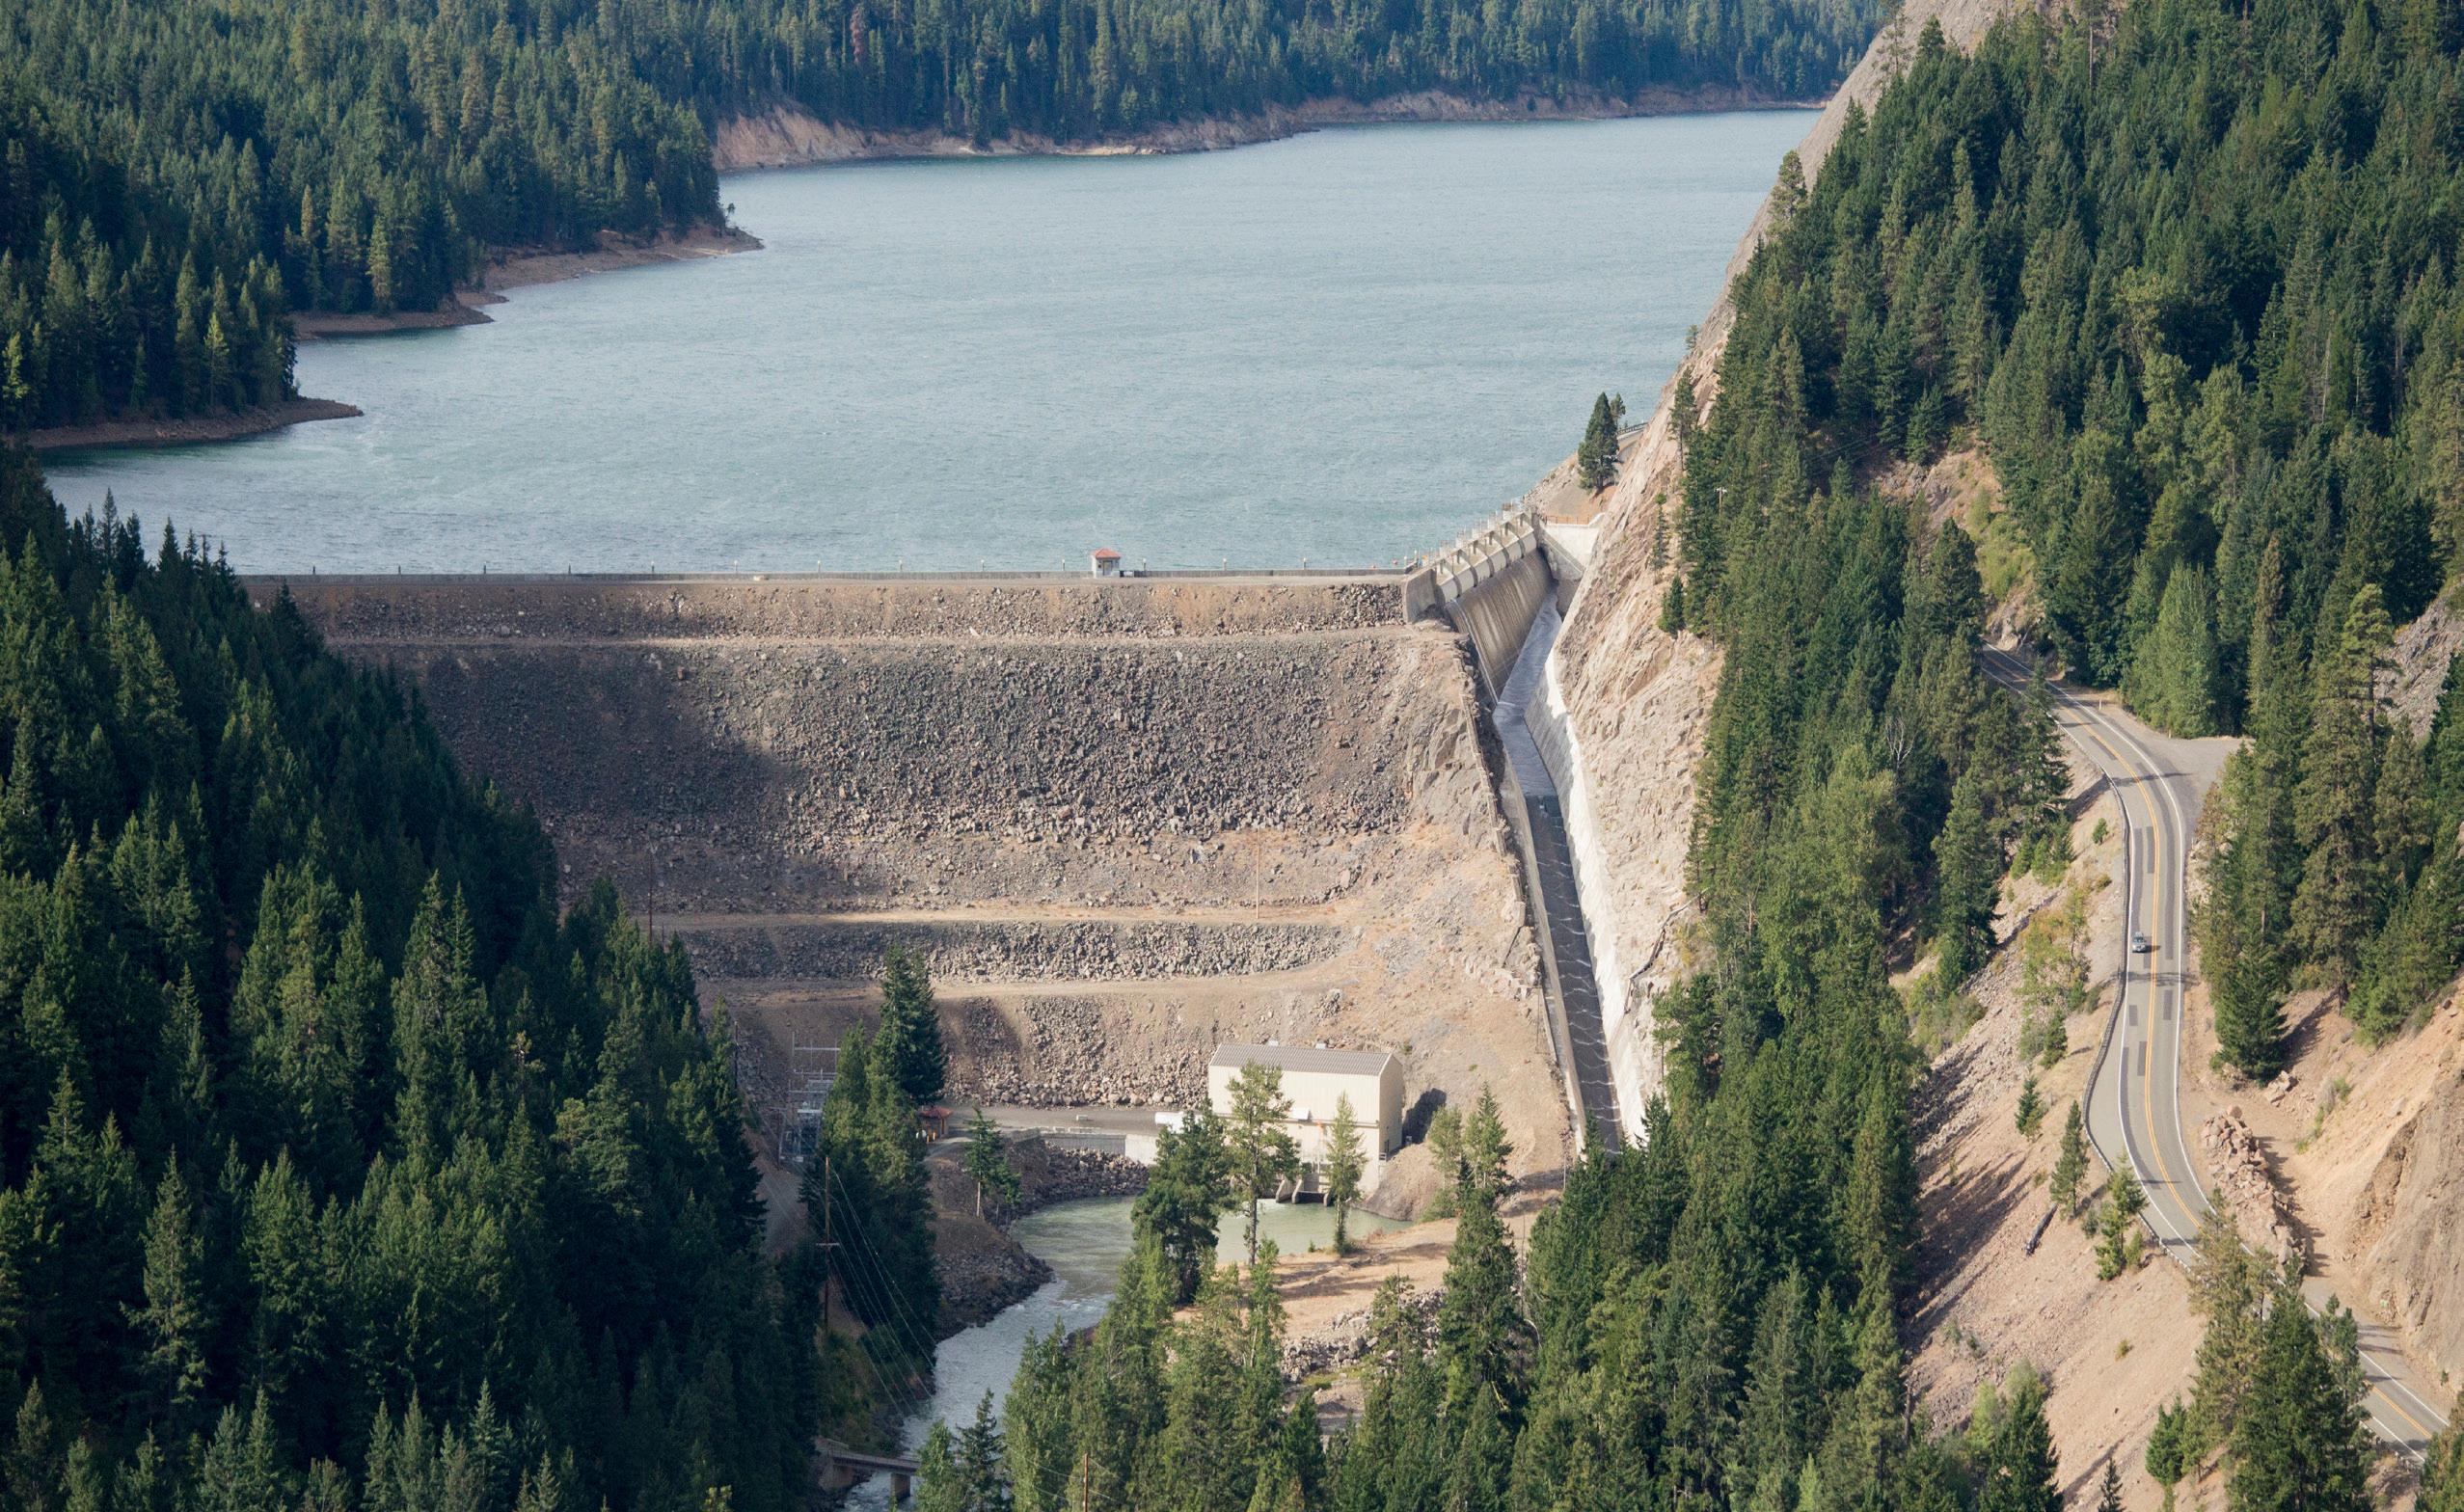
PHOTO Tieton Dam. Wikimedia Commons.
Frogs and fronds Evaluating the health of wetlands on Bainbridge Island
By Jake Levin, Marine Biology ‘26
Wetlands are critical ecosystems that provide innumerable benefits to humans and the natural world alike. They offer several direct services to humans including flood prevention and natural biofiltration (Bolpagni and Piotti 2016). Their unique habitats, feeding opportunities, and chemical composition support diverse and productive biological communities that contribute significantly to global carbon sequestration. (Mitsch et al. 2012). These habitats also create essential refugia for many species including some migratory bird species that are entirely wetland dependent (Haig et al. 2008). Unfortunately, wetlands have not always been widely appreciated for their immense value, but rather as wastelands in need of fixing. Many of them have been drained or filled in favor of agriculture or other human developments, resulting in a staggering 61% of all wetlands worldwide being destroyed (Bentley et al. 2022).
In opposition to widespread wetland loss, local conservation organizations, such as The Bainbridge Island Land Trust, have played a critical role in protecting remaining ecosystems. Through community fundraising and partnerships with governmental organizations, the Land Trust acquires properties on the island with significant ecological value, including forests, shorelines, streams, wildlife networks, and wetlands. The Cougar Creek Preserve and Wildlife Corridor Preserve are two such properties (Figure 1).
Cougar Creek Preserve (CCP) is a 15 acre parcel of land that has been host to significant human activity in the past, including a historic log mill. Despite this disturbance, CCP boasts some of the largest western red cedars on Bainbridge Island, and from anecdotal evidence, an impressive abundance of amphibians.
Wildlife Corridor Preserve (WCP) is roughly twice the size of Cougar Creek at 34.5 acres and connects two other Land Trust properties, making it an important contribution to the network of intact habitat. A wetland delineation conducted in 2015 determined WCP to be a Category 1 wetland, meaning it is relatively undisturbed, provides uniquely important ecological functions, and deserves the highest level of protection (Hruby T. 2014).
The Land Trust describes several management goals for their properties including maintaining or improving the quality of the forest and wetland ecosystems. This cannot
be achieved by simply setting the land aside. Continuous monitoring is necessary to assess the changing condition of the ecosystems and inform the proper allocation of resources and management practices for each preserve. As a Conserva-
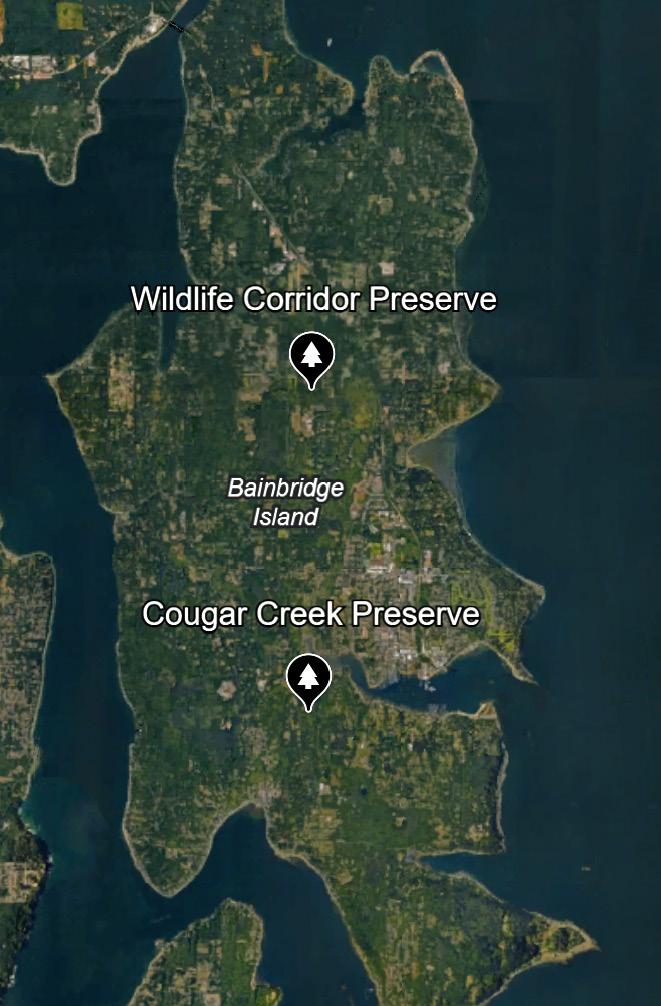
FIGURE 1 Wildlife Corridor Preserve (WCP) and Cougar Creek Preserve (CCP) on Bainbridge Island, Washington.
“ In opposition to widespread wetland loss, local conservation organizations... have played a critical role in protecting remaining ecosystems. ”
tion and Stewardship intern with the Bainbridge Island Land Trust, my goal with this project was to determine the current condition of CCP and WCP.
Monitoring amphibian and plant communities at these preserves could potentially reveal the magnitude of human disturbance to the ecological functions of these wetlands. Firstly, amphibians have thin permeable skin, making them incredibly responsive to poor water quality (Brooks et al. 2007). Aquatic plants provide food and shelter to many organisms, including amphibians, and also have massive abiotic influences as they produce oxygen and support nutrient cycling and carbon storage. In this study, I will determine how many species of amphibians are present at WCP and CCP and whether the presence or absence of any species reveals anything about the condition of the preserve. Additionally, I ask whether plant communities with higher species richness and a smaller presence of noxious weeds will yield a higher richness of amphibians.
To collect vegetation data, three representative transects were set up at each preserve. The transects were all 30 feet long, beginning at the edge of the area fully inundated with water, and extending up through the riparian zone. A flag was placed every two feet along the transect beginning at “point zero,” leaving 16 flags for each transect. The starting point of the transects was important to consider because the water level at both preserves decrease significantly during the summer months. I collected data in July when the water level was relatively low, so the first five flags for each transect were likely submerged in wetter months, as evidenced by the still-saturated soils. At each flag, all plant species
within a foot of the transect on either side were identified and documented. The locations of each transect were also marked using proprietary ArcGIS Fieldmaps belonging to the Bainbridge Island Land Trust. Percent cover of vegetation was also estimated for each transect at 0ft, 15ft, and 30ft away from the beginning of the transect.
Additionally, raw data on the amphibian communities of Bainbridge Island were collected from February to June of 2025. As a collaborative citizen science project involving the Bainbridge Island Land Trust and the Woodland Park Zoo, 6 volunteers waded into the waters of WCP and CCP to identify the various amphibians during their egg life-stages and document the number of egg masses. The data was then synthesized to find the species richness for each preserve.
I averaged the data across all three transects, with the y-axis representing the number of flags at which a species was observed (Figure 2). The most prevalent species at CCP was reed canary grass (Phalaris arundinacea) which is acknowledged as a noxious weed in Washington State because of its tendency to outcompete many native wetland species (Lavergne and Molofsy 2010). Another common and harmful invasive species, Himalayan blackberry (Rubus armeniacus) was also documented at much lower frequency. Aside from these two noxious weeds, the data reflects a plant community that would be expected from a wetland in western Washington, including soft-leaved sedge (Carpex disperma) and black cottonwood (Populus trichocarpa). The data at WCP reflects a very similar plant community, but with important differences. Most notably, salal (Gaultheria shallon) had the highest frequency, which was unexpected given that salal is more characteristic of drier lowland forest. This may be due to the relatively steep bank, which would facilitate a rapid transition away from moisture-loving plants. Overall, WCP exhibited a higher species richness, fewer noxious weeds, and a greater vegetation percent cover than CCP. All of these results point towards WCP having a healthier plant community, which based on preliminary research, should result in more suitable habitat for amphibians and could potentially increase amphibian species richness.
To test this, I then compared the results of the transect portion of the study to the data synthesized from the amphib -
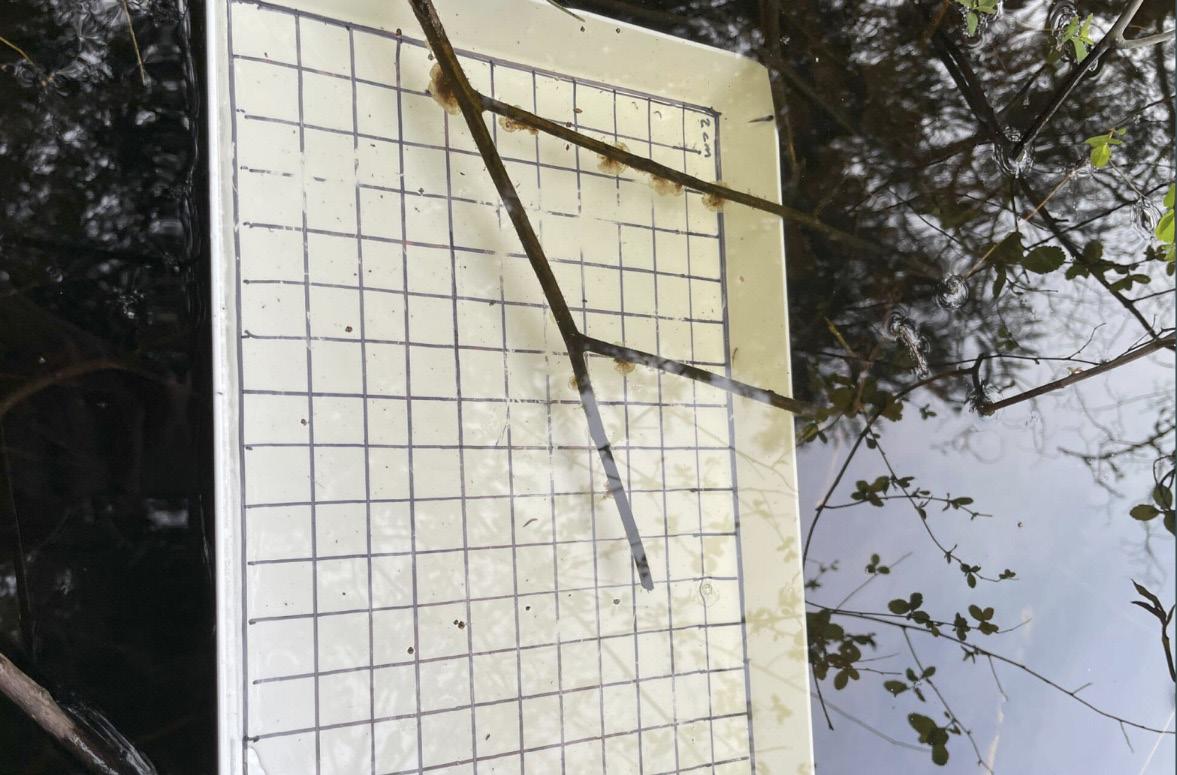
ian monitoring. Four amphibian species, the northern red-legged frog (Rana aurora), the long-toed salamander (Ambystoma macrodactylum), rough-skinned newt (Taricha granulosa), and Pacific tree frog (Pseudacris regilla), were identified at both WCP and CCP. The northern red-legged frog is somewhat selective of its habitat, as it requires moist and forest habitats with access to suitable breeding sites (Washington State Herp Atlas 2009). Their presence suggests that both CCP and WCP have a suitable forest ecosystem and connect to a slow-moving body of water. However, this species is also known to occur in areas of low density development, so may not be the most reliable indicator of minimal habitat distur-
PHOTO Volunteers identify amphibian egg masses at Wildlife Corridor Preserve.
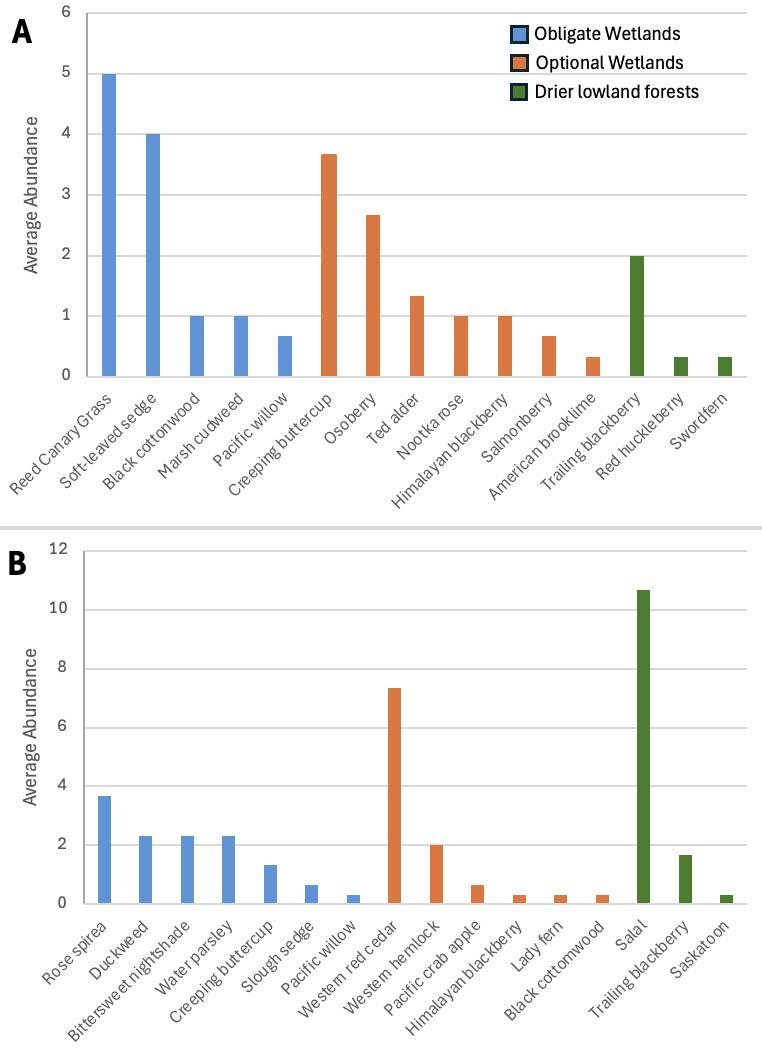
2 of plant species recorded across three transects at CCP (A) and WCP (B). The bar colors represent the ecology of each plant species, including obligate wetland species (blue), optional species found in wetlands and other ecosystems (orange), and drier lowland forests (green).
bance. The rest of the species are very common in western Washington and are able to survive in urban and heavily disturbed watersheds. Found only at CCP, the northwestern salamander (Ambystoma gracile) is unique because they take two years to transition to their adult form, during which they are strictly aquatic and vulnerable to dwindling water levels. This is a concern at CCP, as the water levels reach a new minimum nearly every summer, raising the risk of completely drying out.
“ This case study does not support the hypothesis that a plant community with higher species richness yields an amphibian community with higher richness. ”
The number of egg masses is considered a reliable indicator of breeding effort, and CCP reported a much higher egg mass count than WCP (Figure 3). Based on the transect data, WCP had a healthier plant community, which should mean more substrate for egg-laying, higher oxygen levels, and more suitable habitat for amphibians. However, CCP had more species of amphibians and a larger egg mass count, with the northern red-legged frog being the most notable contributor. This likely means that the plant community at Cougar, though more sparse and dominated by invasive grasses, must be able to support a productive amphibian breeding population. Collectively, the findings of my
research offer important insights into plant–amphibian relationships within Bainbridge Island wetlands. This case study does not support the hypothesis that a plant community with a higher species richness yields an amphibian community with a higher species richness. There are many steps that should be taken from here to appropriately manage these wetlands such as expanding the amphibian monitoring program. The Land Trust should monitor the water level at both preserves to see how increasingly dry summers may impact the ecosystems. Finally, the invasive reed canary grass at Cougar Creek should be removed using a strategy that minimizes the impact on the amphibian community.
The implementation of these management practices will support the ongoing conservation of these wetland ecosystems on Bainbridge Island and will benefit current and future generations of humans and wildlife. These monitoring methods and management techniques can also be applied to other wetlands at a larger scale in the Pacific Northwest and elsewhere to enhance the biodiversity and services of these incredible ecosystems worldwide.
FIGURE 3 Cumulative number of amphibian egg masses observed at WCP and CCP.
FIGURE
PHOTO YIDING LUO
Rights for residents
Protecting Southern Resident
Orcas in the Pacific Northwest
Alexa Lavinder, Earth and Space Sciences ‘26
Named for their regularity within the waters of the Pacific Northwest, the Southern “Resident” orcas have had an enduring presence in the region for generations. Revered not only for their intelligence but also for their intricate social structures and cultural behaviors, these whales are an emblem of the Salish Sea’s ecological richness. Despite their long-standing role in the local environment, the Southern Residents face an uncertain future. With populations dipping to roughly 70 individuals, the survival of these local whales is no longer guaranteed (Orca Conservancy). The Resident family, made up of J, K, and L pods, are victims of mounting anthropogenic disturbances, and as a result, are among the most critically endangered marine mammal populations in
2005, the Southern Residents continue to contend with three persistent and interrelated threats: prey scarcity, toxic contamination, and vessel disturbance (The Whale Museum). Once serving as a reliable food source, Chinook salmon populations have declined amid overfishing, habitat destruction, and climate change, with some runs as low as 10% of their historic numbers (EPA, 2021). The loss of this essential prey places the whales at risk of malnutrition, diminished reproductive success, and increased calf mortality. At the same time, the inland waters they inhabit are burdened by toxic pollutants concentrated in areas of dense human settlement and industrial activity (Fisheries, 2025). Substances such as lead, mercury, and PCBs bioaccumulate in the whales’ blubber, compromising their immune and reproductive systems over time. Compounding these pressures, vessel traffic generates chronic noise and physical disturbance that interfere with the Residents’ echolocation and communication, disrupting their ability to coordinate hunts and navigate effectively. Suppressing these critical behaviors makes hunting the already scarce prey all the more difficult. Together, these stressors interact and intensify one another, leaving the Southern Residents both nutritionally depleted and physiologically vulnerable.
With the threat of extinction on the horizon, several jurisdictions across Washington stepped up to take action by developing legal frameworks that recognize the Southern Resident pods as beings with inherent rights. In 2022, the cities of Gig Harbor and Port Townsend adopted proclamations affirming that “the rights of the Southern
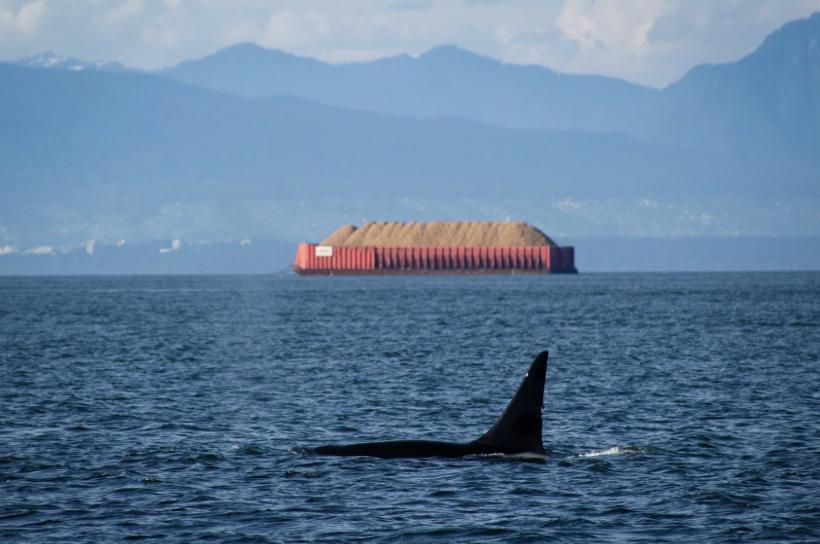
PHOTO Orca near a shipping vessel. Photo licensed under Creative Commons 2.0.
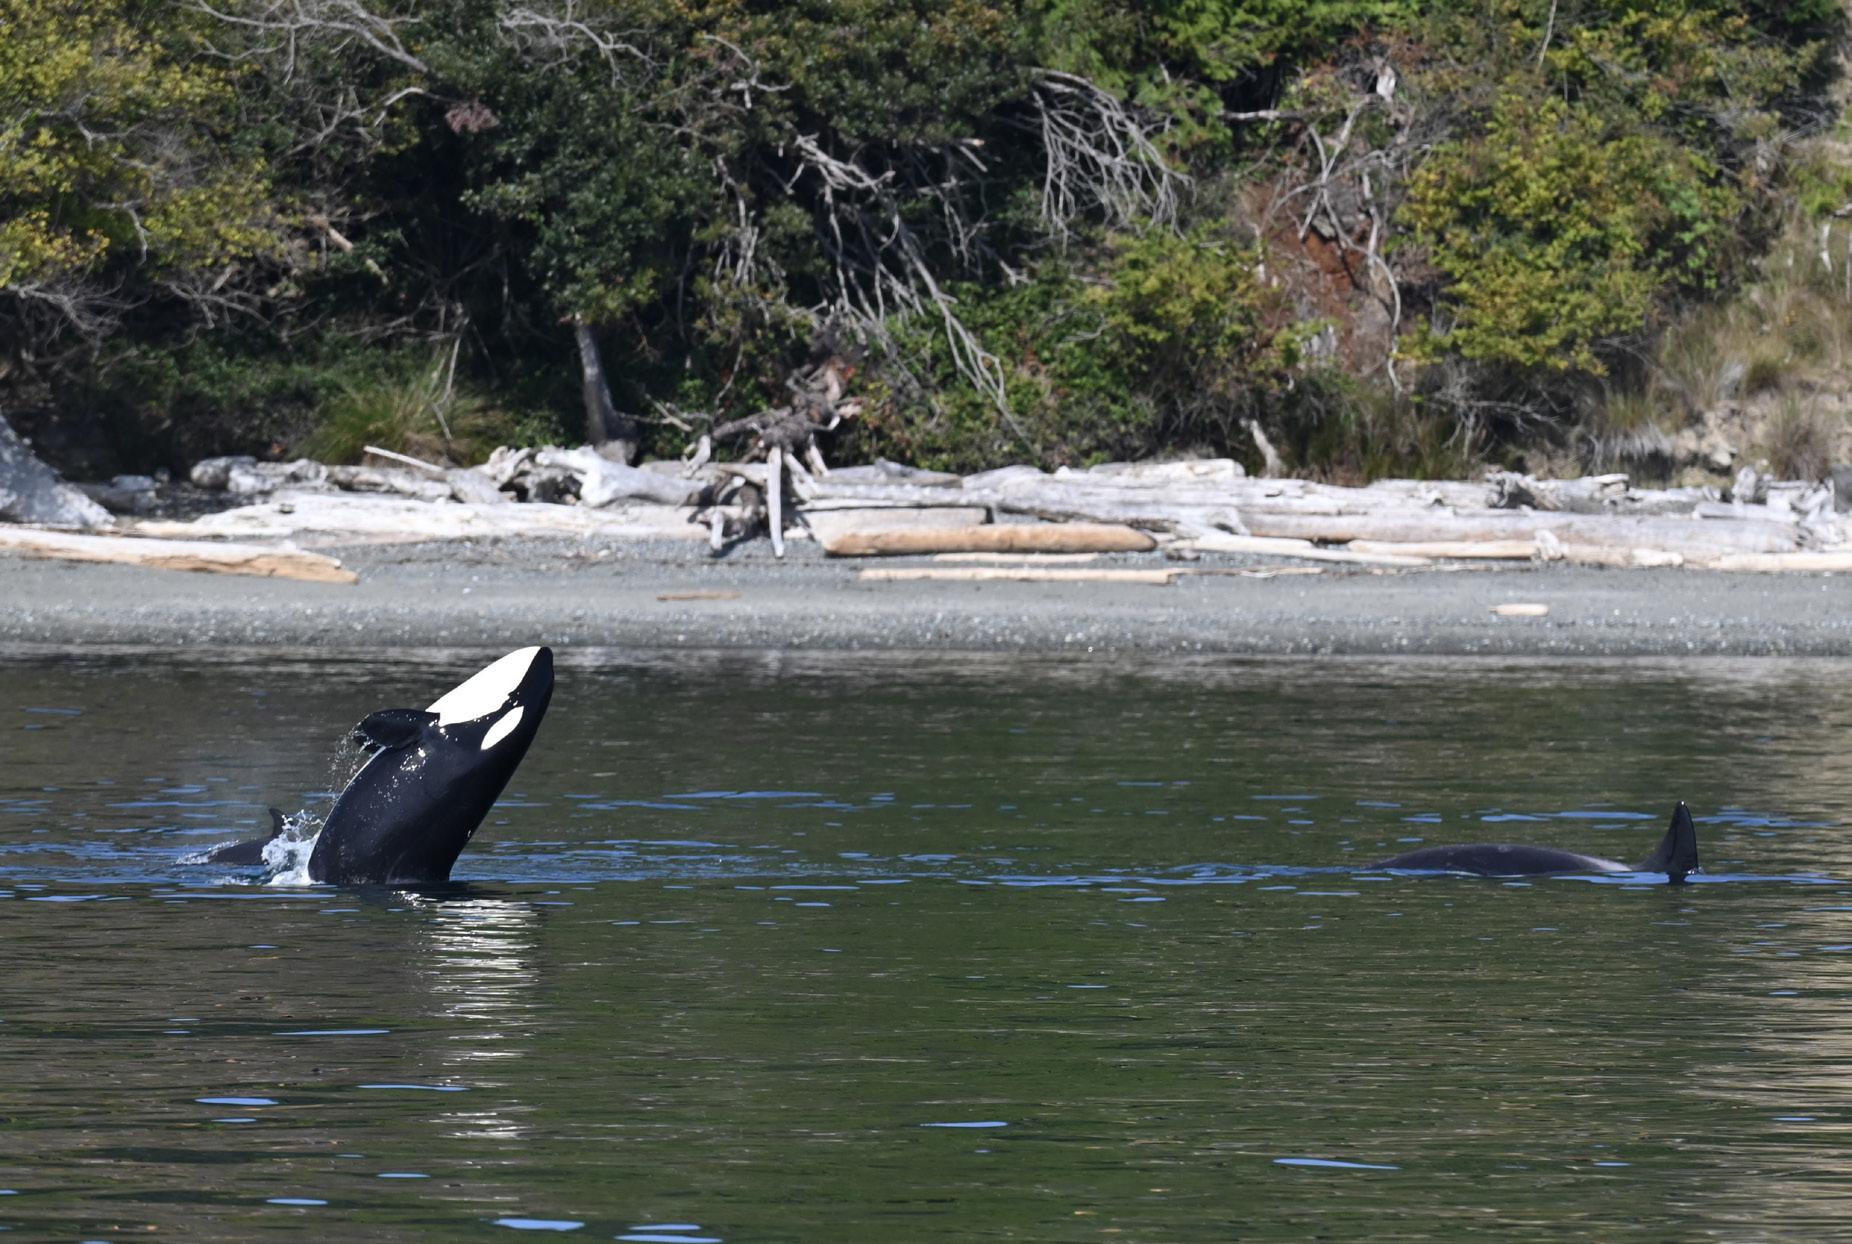
dorian government explicitly recognizes nature, or “Pachamama,” as a subject of legal rights. This means that ecosystems can be represented in court, and citizens can initiate legal proceedings on behalf of rivers, forests, and species. Since then, Ecuador has seen a growing number of successful legal cases in which courts have ruled in favor of ecosystems’ rights, establishing a precedent that environmental degradation constitutes a rights violation rather than simply a regulatory infraction.
Similarly, in 2017, New Zealand granted legal per-
ination.” Reflecting the principles of the Rights of Nature movement, these proclamations assert that nonhuman beings and ecosystems possess intrinsic value and legal standing independent of human interests. Rather than asking how much harm is permissible, the Rights of Nature framework instead asks whether human actions violate the whales’ fundamental rights to life, culture, and habitat integrity. This approach reframes environmental stewardship as a matter of justice and moral responsibility, emphasizing that humans have an obligation not just to manage or protect wildlife, but to respect and uphold the inherent rights of other beings.
These proclamations assert that nonhuman beings and ecosystems possess intrinsic value and legal standing independent of human interests.
This movement in Washington mirrors a broader global trend in recognizing the rights of nature and animals. There are currently more than 400 ongoing Rights of Nature initiatives worldwide, ranging from local ordinances to national legislation (Putzer et al., 2022). Examples from Ecuador and New Zealand establish definitive legal protections of wildlife and ecosystems, effectively paving the path of possibility for the Southern Residents (Figure 1). As the first nation to embed Rights of Nature in its constitution in 2008, the Ecua-
sonhood to the Whanganui River, a culturally and spiritually significant waterway for the Whanganui iwi tribe. Under this arrangement, the river has its own legal identity, with two appointed guardians, one from the iwi and one from the government, empowered to represent the river’s interests in legal matters (Bosselmann, 2025). This approach acknowledges both the ecological and cultural dimensions of the river, combining Indigenous knowledge and Western legal structures to provide enforceable protections. By granting the river legal standing, New Zealand created a mechanism to defend the river’s health, integrity, and vitality against harmful human activities, setting a global precedent for recognizing nature as a rights-bearing entity.
For the Southern Resident orcas, these examples offer a model for rethinking protection and conservation. The Rights of Nature framework empowers communities and governments to address environmental harm as a violation of the orcas’ fundamental rights, potentially creating stronger incentives for action than traditional conservation approaches alone. This evolving recognition of animal rights may be one of the most promising pathways to the survival of the Residents in the Pacific Northwest.
Unlike Ecuador’s constitutional protections or New Zealand’s legal recognition of the river, however, Washing-
“
Ecosystems can be represented in court, and citizens can initiate legal proceedings on behalf of rivers, forests, and species.
PHOTO Two orcas breaching near shore. Photo by Faith Jayaram.
ton’s proclamations are nonbinding, acting only in a symbolic capacity. Their primary function is to raise awareness, shift public perception, and build political momentum. To translate recognition into real-world protection, symbolic measures must be coupled with enforceable regulations and policies that directly mitigate threats to the whales.
In an effort to pair proclamations with policies, Washington has implemented concrete laws that provide measurable protections for the Southern Residents. As of January 1st, 2025, all vessels, both motorized and non-motorized, are required to “stay 1,000 yards away from Southern Resident killer whales,” “attempt to navigate out of [their] path while adhering to a 7-knot speed limit,” and “disengage the transmission and wait for the animal to move away” if a whale approaches within 400 yards (Washington Department of Fish & Wildlife, 2025). These regulations address one of the key threats to the whales, vessel disturbance, but do not solve the broader crises of prey scarcity or pollution. Strengthening these protections and expanding regulations to cover other threats is essential for the long-term survival of the population.
Ultimately, the future of the Southern Resident orcas depends on our willingness to employ awareness with decisive, enforceable action. Symbolic proclamations, though useful, will not alone secure the survival of this threatened popula-
tion. We must implement stronger protections, restore salmon populations, reduce pollution, and regulate vessel traffic to safeguard their habitats. Drawing inspiration from examples in Ecuador and New Zealand, it is evident that legal framework can give nature a voice and hold humans accountable. Without urgent intervention, we risk the loss of an integral species, and with it, their irreplaceable legacy that has shaped these waters for centuries. This extinction won’t be nature’s failure, it will be ours.
“
This evolving recognition of animal rights may be one of the most promising pathways to the survival of the Residents in the Pacific Northwest.
”
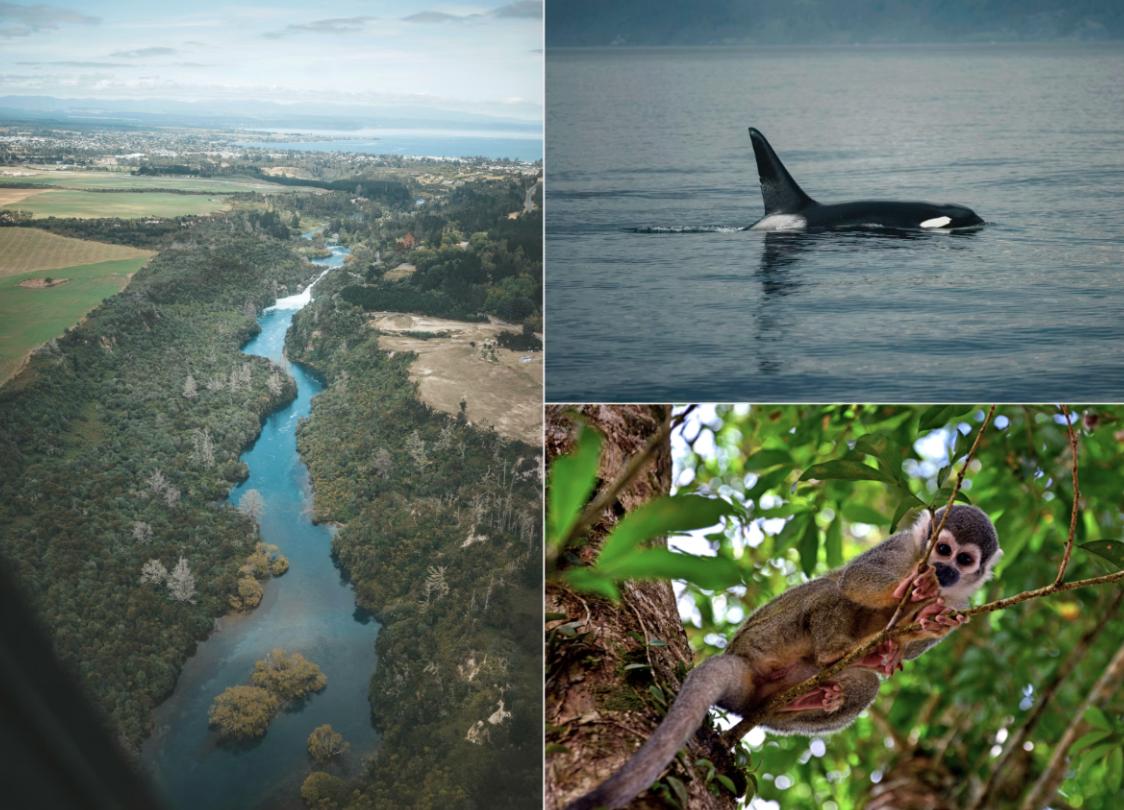
FIGURE 1 Rights of Nature movements: Whanganui River (left), Ecuadorian natural life (bottom right), Southern Resident orcas (top right). Photos licensed under Creative Commons 2.0.
Remote sensing Ethical implications for scientists and global power dynamics
By Sage Mailhiot, Envir Science & Terrestrial Resource Mgt, ‘26 and Ryan Luvera, Aquatic and Fishery Sciences, Marine Biology, ‘26
I
n order to determine the height of a tree, a scientist can stand on the ground and point a clinometer at the top of the canopy. Through many iterations of measurements like
this, a scientist could estimate the canopy height, and draw conclusions about habitat suitability, or carbon sequestration potential. In contrast, the emergence of remote sensing products has allowed scientists to harness information on the variations in canopy height over thousands of acres in a matter of minutes (Figure 1).
Remote sensing acquires spectral and spatial information about the Earth’s surface from afar – via satellites, airplanes, or drones. Daily imagery can be utilized to assess change–everything from herd migrations to bark beetle impacts. These images take field measurements that can be converted into publically accessible global datasets, quantifying soil pH or wildfire risk. Remote sensing mitigates the time-consuming and expensive nature of field work, resulting in more efficient and expansive studies. However, some academics are calling attention to the ethics of studies that lack place-based knowledge, as is often the case in the field of remote sensing. Mia Bennett, an associate professor at the University of Washington, has been a leader in this charge. In her paper establishing the field of critical remote sensing, she argues that remote sensing scientists cannot justly excuse themselves from responsibility to people and places
“ “
Academics are calling attention to the ethics of studies that lack place-based knowledge, as is often the case in the field of remote sensing.
they are observing. She outlines a framework for remote sensing work that prioritizes collaboration and reciprocity (Bennett et al. 2022).
George Darkwah, a civil engineering doctoral student at the University of Washington, leads a remote sensing project that he says would be “useless” if not for local land manager partnerships and feedback. Darkwah’s work utilizes NASA satellite imagery to estimate temperature in remote, unmonitored streams. Darkwah and his team have translated this data into a website that allows for easy access to river temperatures across the Pacific Northwest (Figure 2).
Darkwah’s project wouldn’t have been possible without close collaboration with the Columbia River Intertribal Fish Commission (CRITFC). As Darkwah recounts, he eagerly brought an early version of the temperature tool to the
FIGURE 1 Aerial rendering of canopy height of a ~3 acre patch of forest within UW Pack Experimental Forest. Gradient from blue to red corresponds to 0-50 meters.
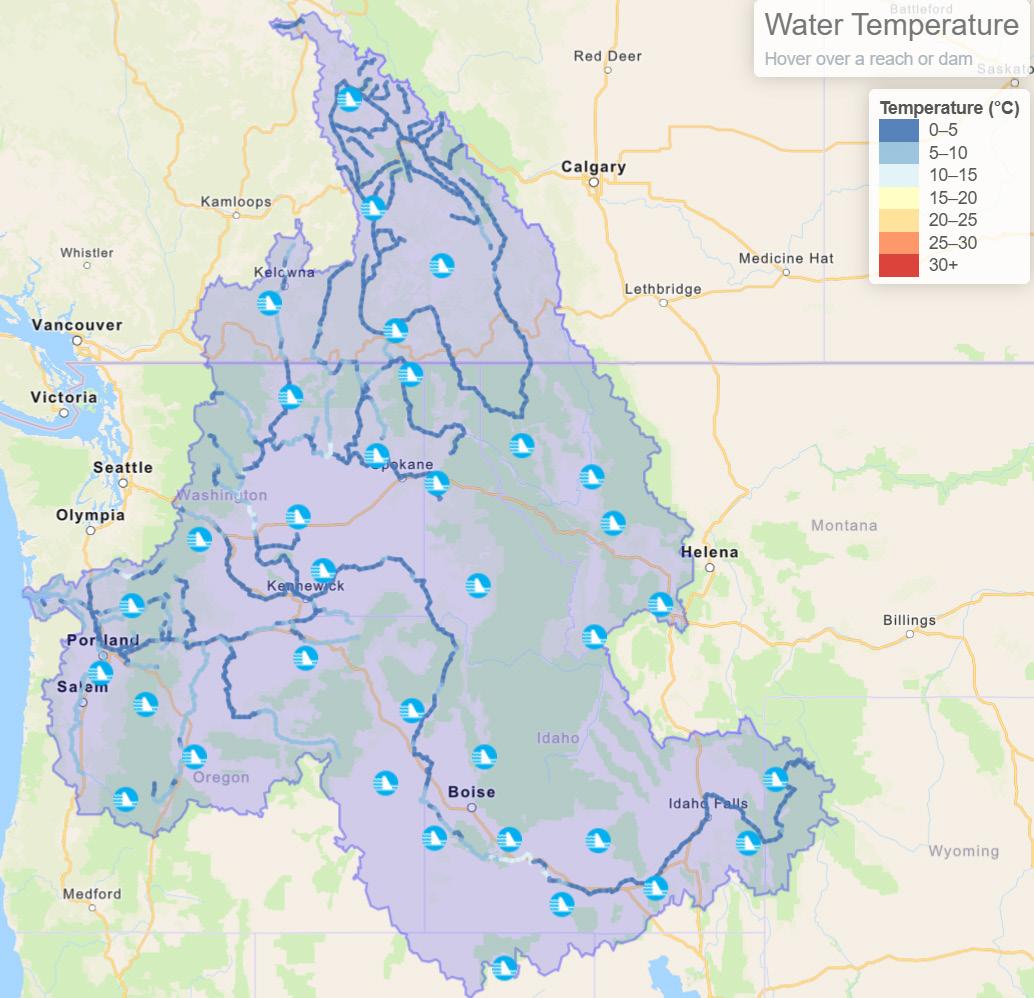
2 George Darkwah’s THORR (Thermal History of Regulated Rivers) model which predicts river temperatures with satellite imagery coupled with machine learning methods. From THORR Website (Darkwah et al. 2024).
commission, but after review, tribal fishermen identified a discrepancy between the mapped temperature and what they knew of the river. “I had never been to those locations before”, says Darkwah, “I thought those were reasonable temperatures”. Beyond catching errors, this partnership has been critical to the website development process, ensuring that the final product is relevant and useful for CRITFC and user-friendly for regional land managers.
Turtle May, another graduate student at the University of Washington, carries out research in collaboration with the
“ “
Even if perfect accuracy can be achieved from the computer lab, studies that are executed in isolation from the lands that they study often lack context, local application, and reciprocity with communities.
Confederated Tribes of the Colville Reservation, with the help of remote sensing tools. She puts it well, saying “the data that comes from the land does not exist in a vacuum… the communities that live there see patterns that can’t be captured by just looking at a dataset.”
This type of work bears a stark contrast to the countless recent remote sensing studies that operate in a silo, often lacking field data, let alone local partners. Historically, remote sensing data has been notoriously riddled with errors and distortions, as a result of low resolution and atmospheric pollution, making field data mandatory (Lunetta et al. 1991 June 1; Ozdogan and Woodcock 2006; Martin 2008). As the future promises higher resolution satellite imagery and ad-
Two satellites docking in space. Photo by Kevin Stadnyk, Unsplash.

FIGURE
PHOTO
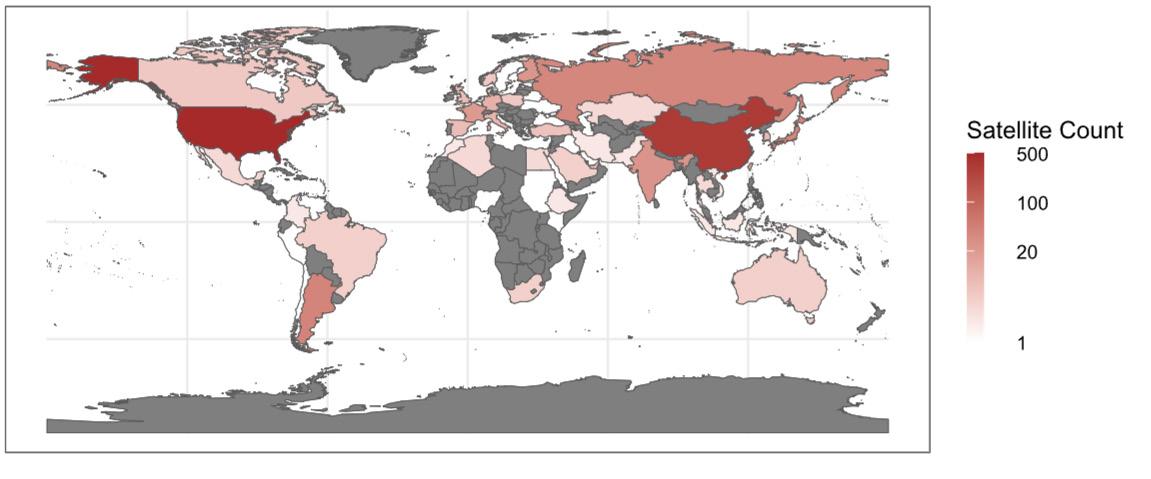
vanced machine learning systems, it may be more and more feasible to carry out analyses without field data.
But even if perfect accuracy can be achieved from the computer lab, studies that are executed in isolation from the lands that they study often lack context, local application, and reciprocity with communities (Sanger et. al., 2021; Bennett et. al., 2024). For example, a 2022 study found the suggestions of a highly-revered global priority restoration map to be unrealistic (Schultz et al. 2022). The map in question proposed forest restoration projects on small, subsistence farmlands in the tropics that local communities depend on. Global mapping projects are the projection of algorithms, often developed with minimal context in comparison to the immense study region. Maps like these – that may contain bias as a result of the origin of the study – can influence policy, borders, and distribution of funds. To put it plainly, in the words of Bennett, “Who gets to draw the borders determines how and where power is exercised.”
There are reasons that most global mapping studies come from the global North. Consider the distribution of satellites – the US and China soar above the rest of the world, with 502 and 334 imagery satellites in space, respectively (Fig. 3). The highest resolution imagery satellite data is often restricted by paywalls. 79% of all imagery satellites have been launched in the past 10 years, and 63% of those satellites are owned by private companies (Satellite Database | Union of Concerned Scientists). To request new high-resolution satellite images, it costs about $12 per square Kilometer, which translates to 2 million dollars for imaging all of Washington state a single time (Flexible Pricing for Satellite Imagery & Data | Planet labs). High-temporal resolution studies on the scale of days to months can quickly rack up an impressive tab. Wealthy nations can afford this, but it can be a prohibitive cost for scientists with a smaller pool of national funding. Beyond the steep prices, manipulating remote sensing data requires high-powered computers, sophisticated
storage systems, and a stable internet connection.
This accessibility gap can be bridged as a part of remote sensing studies. As outlined in Bennett’s framework, empowering local stakeholders by providing training or accessible technology is a meaningful method of engaging in reciprocity with lands and communities. Approaches that researchers have employed include GIS training and the implementation of community drones (Vargas-Ramírez and Paneque-Gálvez, 2019), which equip communities with remote sensing tools to use for their own management purposes.
Remote sensing will continue to revolutionize science to an unprecedented degree. The increase in temporal and spatial resolution could make effort-intensive fieldwork sampling largely irrelevant. However these new tools come with many ethical stipulations. Taking remote sensing data at face value overlooks important localized context. The ethical use of remote sensing is characterized by the partnerships formed with the land and the people.
“ “
Remote sensing will continue to revolutionize science to an unprecedented degree... The ethical use of remote sensing is characterized by the partnerships formed with the land and the people.
FIGURE 3 Global distribution of imagery satellites. The USA and China have significantly more imagery satellites than the rest of the world (502 and 334 respectively). The next country with the most imagery satellites is Argentina with 39. Data from Satellite Database, Union of Concerned Scientists.
Beyond Bans Rethinking chemical regulation in the age of PFAS
By Kate Allhusen, Marine Biology ‘26 and Sophie Garrote, Environmental Science and Terrestrial Resource Management ‘26
At the 2026 Winter Olympic Games, three skiing and snowboarding athletes were disqualified for chemical usage. It wasn’t in their bloodstream, but rather on their boards and skis; traces of PFAS, or per- and polyfluoroalkyl substances, were found in the wax used on their equipment (Tabuchi, 2026). PFAS are a group of synthetic, fluorine-based chemicals that have been in commercial use since the 1950s (Samora, 2023). They are used in a wide variety of industries and products: non-stick pans, firefighting foam, waterproof apparel, electronics, construction, and more. Considering how ubiquitous PFAS are in everyday items, the release of this class of chemicals into soil, water, and air is unavoidable.
The molecular makeup of these chemicals makes it so they do not readily degrade, earning it the nickname as a “forever chemical.” PFAS build up in organisms that are repeatedly exposed to the substance through consumption of food or water contaminated with PFAS or by breathing in air containing PFAS (National Institute of Environmental Health Sciences, 2023). Current studies indicate that exposure to and subsequent accumulation of certain types of PFAS may cause reproductive effects, developmental

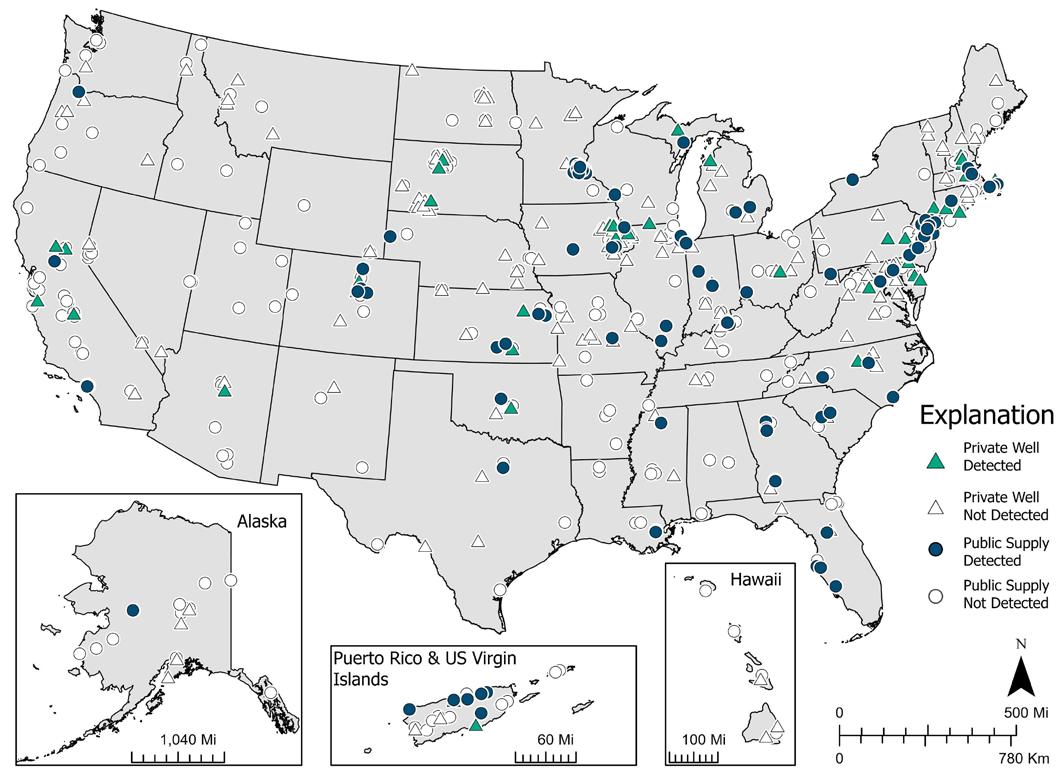
(2023), Wikipedia Commons.
effects or delays in children, increased risk of some cancers, reduced capability of the immune system, hormonal interference, and increased cholesterol levels and/or risk of obesity (United States Environmental Protection Agency, 2024).
Since the use of these chemicals were mostly unregulated until the beginning of the 21st century, PFAS contamination is widespread. One study published in 2024 estimated that between 71 and 95 million people in the United States rely on groundwater with detectable levels of PFAS, while toxic forever chemicals are present in about 70% of urban tap water sources (Tokranov et al., 2024; Igini, 2024). The Centers for Disease Control and Prevention published a report stating that PFAs is present in the bloodstream of 97% of Americans (National Institute of Environmental Health Sciences, 2023). There are additional studies linking the disproportionate presence of PFAS polluters, such as major manufacturing plants, airports, military bases, and landfills to watersheds that serve communities with higher proportions of Black and Hispanic/Latino residents (Igini, 2024; Harvard School of Public Health, 2023).
However, there are global efforts to eliminate the use of PFAS and rectify the existing contamination. Since 2025, California and New York have prohibited the sale of apparel with intentionally-added PFAS, although the chemicals are so pervasive they cannot guarantee that they aren’t in the final product unintentionally (Okamoto, 2025). This year marks the first time in the history of the Olympics that PFAS have been formally banned, reflecting the push to prevent the substance from making its way into increasingly remote environments, such as mountains used for winter sports (Tabuchi, 2026). With global attention brought to the topic, it is worth considering whether an outright ban of PFAS is possible on a national level. In order to do so, we consider the similarities and differences between PFAS and the regulation of another persistent organic pollutant, DDT.
DDT, or dichloro-diphenyl-trichloroethane, was the primary insecticide that United States farmers used in the 1950s. Both being persistent organic pollutants, DDT also accumulates in the fatty tissues of the organisms that ingest
PHOTO Common items manufactured with PFAS. Photo from SESI Consulting Engineers.
FIGURE 1 PFAS detections in tap water collected from public-supply (blue circles) and private-wells (green triangles). Photo by Smalling et al.
the substance, magnifying in concentration up the food chain (United States Environmental Protection Agency, 2025). In animals and humans, toxic levels of DDT have been identified as a cause of reproductive failure and a probable carcinogen (United States Environmental Protection Agency, 2025; Ehrlich et al., 2019).
Although DDT has long been lauded as a success story in environmental action and contaminant management, it was not that simple to get rid of. In fact, there was a whole 10 years in between the release of Rachel Carson’s Silent Spring, the influential book exposing the extent to which DDT was impacting the environment, and the formal ban of DDT in 1972 (United States Environmental Protection Agency, 1972). So what, exactly, was the hold up?
DDT remained in use due to its effectiveness as a pesticide and the lack of concrete evidence for its environmental
“The solution is not an all-encompassing ban, but a coordinated effort across science, governance, industry, and the public to eliminate the production of PFAS while repairing the damage already done.
effects. Carson’s arguments in Silent Spring hinged on visible changes in ecological communities, rather than a quantification of the contaminant in the environment. DDT was especially effective in protecting human food and health. Cases of malaria in the United States plummeted from 400,000 from the onset of DDT usage in 1946 to practically 0 in 1950 (Whitney, 2012). It was only in the face of mounting evidence that insects were developing resistance to the pesticide that it was banned (United States Environmental Protection Agency, 1972). Additionally, prior to 1970 and the creation of the EPA, there was not an independent agency with blanket authority to address pesticides, so environmental regulations required coordination across agencies (Whitney, 2012). The willingness and ability to be rid of DDT, in the end, came down to governance and its waning utility.
PFAS, on the other hand, does not have governance or obsolescence on its side. While DDT is a single chemical with a single use, PFAS are a family of chemicals with diverse uses, making phasing them out or banning them outright more difficult. Some have argued that the banning of DDT has set a precedent of banning individual chemicals only for other harmful replacements to pop up instead, rather than investing in proactive management and risk assessment of chemicals (Cardon et al., 2025). This is exactly what has happened with PFAS. As soon as the toxic nature of longchain PFAS were discovered and the chemicals were largely phased out, the production began on short-chain PFAS, which were eventually found to be even more difficult to remove from the environment (Mueller & Schlosser, 2020). Thus, a theoretical ban would be dealing with chemicals that span different industries and function differently in the
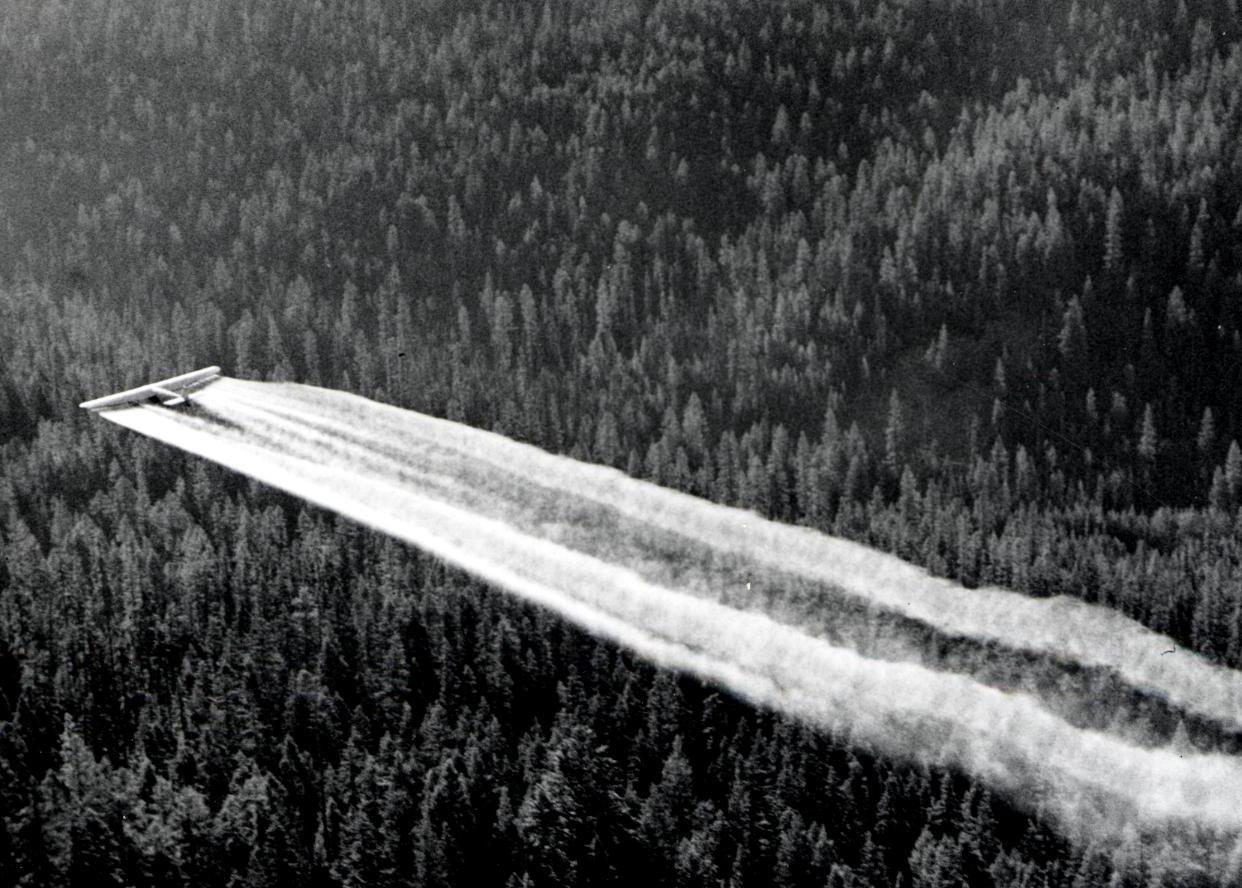
environment, requiring complex regulation. Furthermore, at the time of DDT, the modern environmental movement was on the rise and subsequent government actions, like the creation of the EPA, reflected that. This same trajectory is not necessarily present at the height of PFAS. Originally, goals were made in 2023 to remove six forms of PFAS from municipal water in the United States by 2029, but that deadline has been extended to 2031 for two types of PFAS and entirely revoked for the four others under the Trump administration (Okamoto, 2025). Not only would a PFAS ban have to be more complex due to the sheer number of PFAS and industries they are used in, but current policy is not favorable to a ban of the chemicals. The same strategies we have used for contaminants in the past cannot stand if we are to tackle PFAS.
What can be done about PFAS? After decades-long usage, cutting edge research is necessary to address the damage done by persistent organic pollutants. Kaylyn Stewart, a 2nd year PhD student in Dr. Jessica Ray’s Aquatic Innovations in Materials Science (AIMS) Lab, does exactly that. She is working on formulating a modified granulated activated carbon, a substance used in many commercially available water filters, to be more effective at adsorbing short-chain PFAS. Beyond filtering, there are some companies dedicated to finding ways to destroy PFAS. Aquagga, for instance, has developed a peer-reviewed waste treatment methodology that focuses on destroying all types of PFAs using high temperatures, high pressure, and high pH (Solutions, 2026).
High-level solutions are not the only thing to be done, either; PFAS exposure can be minimized on a personal level. In our interview, Stewart emphasized little actions people can take: switching cookware from non-stick to ceramic or steel and educating yourself on where your water comes from, as public utilities are legally required to report on quality.
For a seemingly all-encompassing problem like PFAS, perhaps the solution is not an all-encompassing ban, but a coordinated effort across science, governance, industry, and the public to eliminate the production of PFAS while repairing the damage already done.
PHOTO DDT being sprayed over a forest as part of a spruce budworm control project circa 1955. Photo from USDA Forest Service, R.B. Pope.
Frictions Between Green Energy and Tribal Sovereignty
By Phoebe Berghout, Aquatic and Fishery Sciences, Envir Science & Terrestrial Resource
Mgt ‘26, and Ashley Ingalsbe, Environmental Studies ‘26
With statewide energy demand projected to double by 2050, Washington has fasttracked several initiatives to reach an entirely renewable energy grid by 2045 under the Clean Energy Transformation Act (CETA). In 2024, Washington ranked lowest in the nation for renewable energy growth, reporting a -3% change in average annual energy production compared to the prior decade. This growth reduction is largely attributed to project backlogs, barriers to approval, and citing hurdles that have contributed to delays in development. In response, discussions surrounding the implementation of new green energy projects have intensified, many of which are now growing in priority throughout the state.
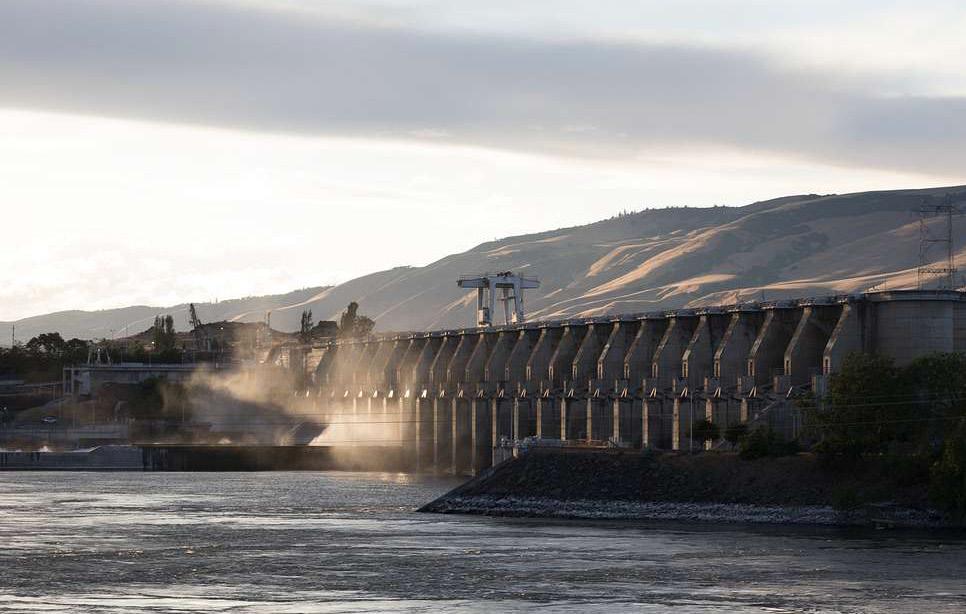
Despite low growth, Washington remains a national leader in total renewable energy generation, with ~60% of its electricity being generated by hydropower (U.S. Energy Information Administration). Moreover, the Columbia River, home to one of the largest hydroelectric power plants in the world, accounts for nearly 90% of total renewable energy in the Pacific Northwest. The river basin is also the homelands for the Yakama, Nez Perce, Wanapum, Cowlitz, Chinnok, Confederated Tribes of Grand Ronde, Confederated Tribes of the Umatilla Indian Reservation, and Confederated Tribes of Warm Springs, all of whom have inhabited the land for millennia (Figure 1). The rapid expansion of renewable energy projects threatens the rights of these eight sovereign tribes, while also bringing forth many legislative challenges, where renewable goals and tribal sovereignty clash.
The Goldendale hydropower project, with plans to break ground next year, illustrates the ongoing friction between tribal treaty rights and state-led energy development. The project, located on Yakama lands ceded in the treaty of 1855,
proposes the installation of pumped storage hydropower, with a generator capable of producing enough electricity to power 500,000 Seattle homes for 12 hours (Washington State Standard). The construction of the hydropower generator would drill directly through Pushpum, a sacred site for the Yakama people, traditionally used for ceremonies, fishing, and root gathering. While many developers contend that the space offers optimal energy storage as a brownfield site and former aluminum smelter, the cultural significance of the land to the Yakama tribe is profound. Translating to “Mother of all roots,” the site served as a village location for tribal members of the Yakama Nation for generations. The implementation of the Goldendale project would result in destruction of digging spots, burial grounds, and sacred ceremonial sites. Many of the roots found on Pushpum are first foods of the Yakama people, representing reciprocal relationships with land and spirit. Elaine Harvey, a member of the Rock Creek Band of the Yakama tribe and the
PHOTO The Dalles Dam spans the Columbia River. Photo by Carol Highsmith.
The Goldendale hydropower project, with plans to break ground next year, illustrates the ongoing friction between tribal treaty rights and stateled energy development... While many developers contend that the space offers optimal energy storage as a brownfield site and former aluminum smelter, the cultural significance of the land to the Yakama tribe is profound.
Watershed Department Manager of the Columbia River Intertribal Fish Commission, noted that on projects like Goldendale, “once you clear the ground, it doesn’t come back” (Harvey 2026).
In an interview with Northwest News Network, Harvey further reminds, “Green energy is not so green if it’s creating so much environmental injustice”. This is not the first time a “green” energy project has threatened the availability and access of first foods for the Yakama tribe, as well as tribes across Washington state. Of the 41 dams in Washington within the Columbia River watershed, many have drowned Northwest native land while also drastically impacting the historic salmon runs of the Columbia (Washington Department of Fish and Wildlife). Salmon are also a first food for many Columbia River tribes, who refer to themselves as Wykanushpum or “Salmon people”. The absence of wild salmon runs throughout the Columbia from hydroelectric projects places a direct threat to tribal way of life, with strong ties of food between people, land, and spirit.
Increasing pressure from tribes have resulted in removal of hydroelectric projects along salmon runs, notably the Elwha and Klamath rivers. Indigenous advocacy has catalyzed these projects, often coupled with economic incentives from degrading dam infrastructure. In 2012, the removal of Elwha dams resulted in the restoration of 70 miles of habitat for salmon along with other cultural and ecological benefits (Washington Conservation Action). The affirmation of tribal sovereignty is core to these large-scale hydropower removal efforts and must be considered in the

PHOTO Columbia River Gorge. Photo by Elena Kuchko, Unsplash.
construction of new projects.
Despite ongoing pushback from the Yakama Nation, the Goldendale hydropower project received the green light from federal energy regulators in early February year. At the time of approval, more than a dozen tribal governments had objected to the project, stating that it would cause irreversible and long-lasting damages to the land. The lack of consultation is not unfamiliar for the Yakama tribe, and Indigenous communities throughout American history. Currently, dispossession of tribal land for the “green” cause of energy expansion is just one of these disenfranchisements.
As it stands, the current consultation process for many of these projects have poorly defined terms, with blurred lines regarding tribal consent and sovereignty. In 2021, Jay Inslee vetoed a significant provision in the Climate Commitment Act (CCA) that had required tribal consultation for environmental projects that would harm their sacred sites (The Seattle Times). This choice resulted in widespread controversy, setting back tribal involvement in environmental decision-making and the integration of traditional ecological knowledge (TEK) into policy.
In that same year, the Federal Energy Regulatory Commission offered the Yakama Nation consultation on the project, however doing so would require disclosing sacred knowledge that could be shared with developers (High Country News). Often, the inability to disclose sanctified tribal knowledge is used as a point of contention in decision
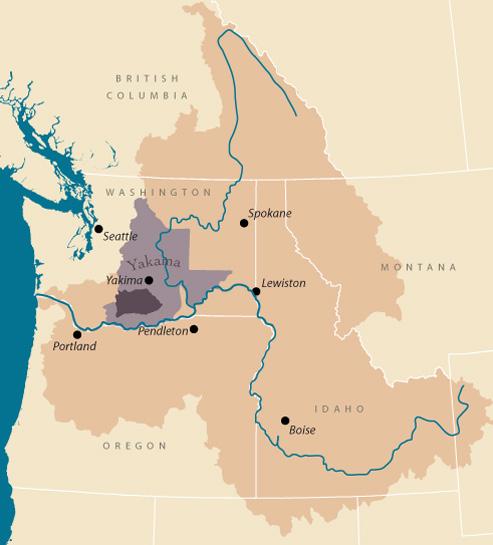
making. These situations highlight a permitting process lacking collaboration with tribes. Additionally, energy projects exist at both the state and federal levels, with different permitting processes and standards for Indigenous consultation.
Climate change projections show renewable energy sources are critical in reducing warming global temperatures (International Renewable Energy Agency). Consequently, navigating energy projects with tribal collaboration and consent must be made a priority, as Washington aims to keep pace with renewable energy growth. Governor Ferguson issued executive order 25-11 at the end of December 2025, largely pushing for the acceleration and support of clean energy projects. The order, which expressed haste for renewables, also outlined that “the development of clean energy must not be to the detriment of our natural environment, cultural resources, or rights of Tribal Nations and public to transparency and due process”. While these are valuable parameters and assurances to make, the core priority of the executive order is to expedite projects. While the clock ticks to address the climate crisis, the speed of green development has left tribes out of conservation before.
When opposing projects such as the Goldendale hydropower plan, tribal communities emphasize it is not renewable energy projects they dissent, but rather the unethical methods that exploit their resources and sacred spaces in the name of development. Climate change is a pressing concern for many tribal communities and leaders. When asked about a path forward that addresses renewable energy demands without compromising tribal sovereignty, Harvey emphasised this lies in “funding tribes to do their own projects”. Yakama Nation began leading a project that converts inefficient open-water irrigation canals to solar and micro-hydropower irrigation systems, along with plans to include advanced rail-based gravity energy storage. Projects like these, led by tribal land management, do not pose threats to cultural resources and sacred places.
Ultimately, as more energy projects emerge to address the climate crisis, we must ask ourselves; Who are these projects “green” for?
When opposing projects such as the Goldendale
tribal
hydropower plan,
communities
emphasize it is not renewable energy
projects
they dissent, but rather the unethical methods that exploit their resources and sacred spaces in the name of development.
FIGURE 1 Yakama Tribal Lands. The Yakama reservation is purple and the land they ceded to the United States is light purple. The Columbia Basin is in dark tan. Figure by The Columbia River Inter-Tribal Fish Commission.
Personal Impact vs Corporate Responsibility
Pushing
Environmental Impact onto the Consumer
By Jack Carter, Biology ‘26, and Ben Kuhl, Marine Biology ‘26
As shipping and air travel around the globe have grown in the past half century, the environmental impacts of such activities have come under scrutiny. Along with increasing environmental consciousness came the idea of personal responsibility for the environment.
In response to the heightened attention to the matter, corporations have begun implementing strategies to shift the environmental responsibility onto consumers. Some of these strategies we commonly see are adding the option to pay for Sustainable Aviation Fuel credits to flights or adding carbon dioxide calculators for delivery and air travel.
Over time, the increased understanding of environmental impact has led to legislation changes and in response, corporations have to show how they are complying. Corporate efforts for environmental sustainability are commendable at the least, allowing for better peace of mind when making purchases.
Letting the consumer choose to pay more towards green energy credits is a common trend in the commercial aviation industry. In the past, carbon credits were typically aimed at protecting forests or planting trees. Today, we see many airlines present the option to pay extra specifically for Sustainable Aviation Fuel (SAF) credits. The idea is enticing for customers; for a small added fee you can reduce the carbon footprint of the flight you are taking.
While the technology behind sustainable aviation fuels (often made from cooking oils or agricultural waste) is scien-
“
In response to the heightened attention to [sustainability], corporations have begun implementing strategies to shift the environmental responsibility onto consumers.
tifically sound, scaling up SAF credits is incredibly complex. As of 2024-2025, sustainable aviation fuel accounts for approximately 0.53% of the global jet fuel demand (McKinsey 2026). This isn’t to say that the aviation industry is ignoring the problem, SAF production projects are seeing heavy development throughout the industry and manufacturers like Boeing and Airbus have taken large initiatives towards increasing fuel efficiency. At the current levels of sustainable fuel regulation in the aviation industry, corporations are not being forced to overhaul any of their current systems and can use additional costs to consumers to bridge the gap between their actual emissions and their public sustainability pledges. We see similar corporate strategies when online shopping where delivery corporations like Amazon have integrated carbon calculators into the user interface of checkout. These carbon calculators present information about the levels of CO2 that will be used and how opting for a later delivery will save on emissions. While the data is informative, the interface is designed around the consumer’s choice for delivery instead of the massive global shipping network that moves a product from the factory to your doorstep. CO2 calculators in the checkout screen give the impression that those last few miles of delivery are the main source of emissions when in reality, the final delivery drive is a small fraction of the megatons of carbon produced by global freight shipping,

PHOTO United Airlines 737-900 taking off. Photo by Nick Morales, Unsplash.
manufacturing, and the data centers hosting the website you ordered on.
Along with CO2 calculators, Amazon offers “Green Shipping” and “Amazon Day” options, where you can bundle packages to arrive on the same day. Similarly to not paying for expedited shipping on a package that is not a pressing need, using fewer boxes and requiring less delivery trips gives consumers a real option to lower the emissions being caused by their delivery. However, what is being
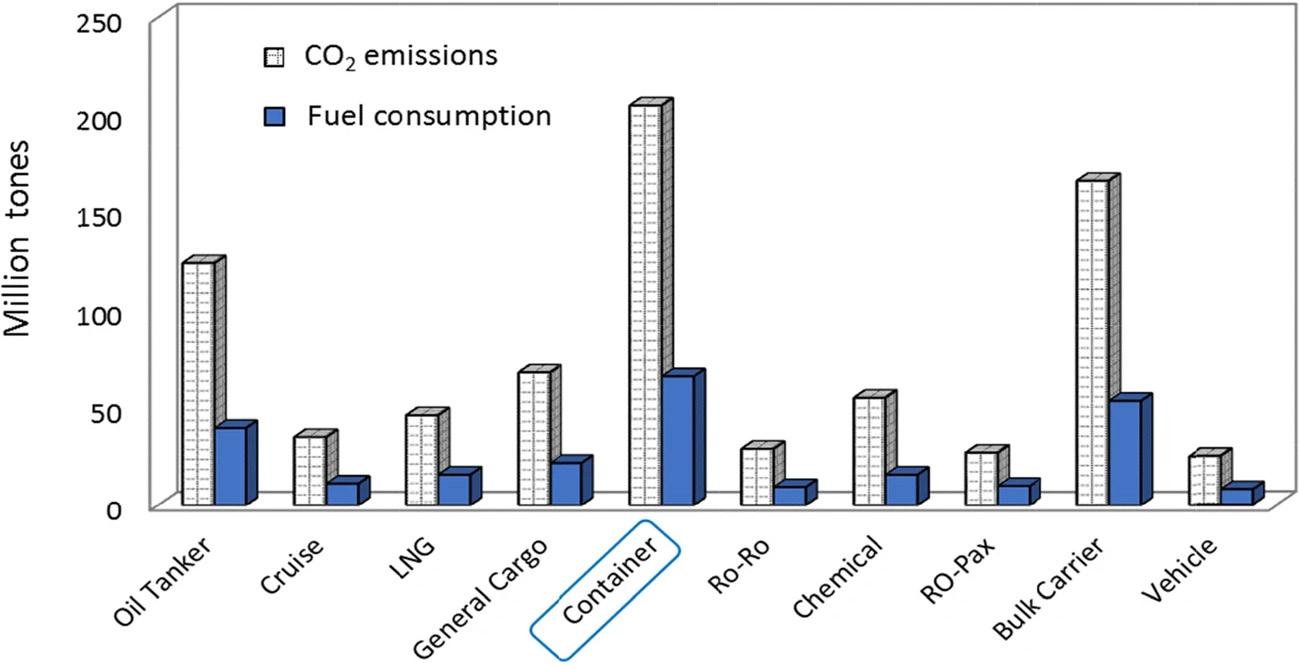
left out of this consumer-facing message is how much money it saves the corporation on delivery costs, packaging costs, and driver wages. Framing it only as a moral choice for sustainability can blur the line between a sustainable initiative and a highly profitable logistical optimization.
While using consumer-facing tools to highlight individual environmental impacts is becoming more common every day, it is not a new concept. The concept of “personal carbon footprint” was coined by British Petroleum (BP) in 2004 when they hired public relations professionals to promote the idea that climate change is the fault of individuals, not one of the largest oil companies in the world (Rebecca Solnit, 2021). While tracking personal emissions can be useful, campaigns to shift public attention towards individual habits can mask the much larger emissions that consumers don’t see.
Corporate sustainability messages place too much emphasis on the effects of one individual’s choice while leaving all of the most impactful decisions in corporate hands. Across many different industries, brands offer consumers the ability to make choices that are “more sustainable” like buying offsets, paying more for a more sustainable alternative product, or choosing a greener option of delivery.
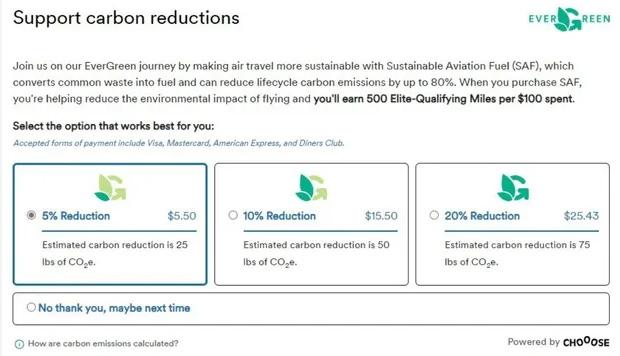
These companies choose how products are made, what is in stock, where and how the supply chains operate, and how much pollution they will tolerate in total. Consumer tools like carbon calculators, voluntary offsets, premium green options and sustainable labels function as an individualized distraction away from the accountability not being taken by large corporations.
The fight for environmental sustainability is constant and ongoing. While corporations are responsible for most of the impact, as consumers, we can be mindful of how our decisions can impact the environment. So the next time you want next-day delivery or are booking a flight, be on the lookout and be mindful of what corporations are making efforts for sustainability.
“
These companies choose how products are made, what is in stock, where and how the supply chains operate, and how much pollution they will tolerate in total. Consumer tools like carbon calculators, voluntary offsets, premium green options and sustainable labels function as an individualized distraction away from the accountability not being taken by large corporations.
FIGURE 1 Data from Ammar and Seddiek (2020) showing the inefficiencies of container ships among other delivery vehicles towards global emissions.
PHOTO An example of an Alaska Airlines checkout screen allowing the purchase of SAF credits during flight booking. Photo from Alaska Airlines.
The Last Frontier for Sale Energy, Power, and the Future of Alaska
By Cate Miggins, Environmental Studies ‘26, and Anne Marie Zink, Marine Biology ‘28.
Alaska has long been known as the “Last Frontier”, a landscape of towering glaciers, sprawling tundra, and ecosystems shaped by some of the harshest conditions on Earth. Polar bears roam its coasts, and migratory caribou travel hundreds of miles across transboundary terrain. Survival here demands resilience, from wildlife and the communities who call this region home (Stinchcomb et al., 2019). The scale of the land and the endurance of its ecosystems create an impression of permanence, as though Alaska exists beyond the reach of ordinary political decisions.
At the center of a current political debate is the National Petroleum Reserve (NPR-A), a 23 million acre region on the North Slope and the single largest tract of public lands in the United States. Created in 1923 as an emergency oil supply for the U.S. Navy, the reserve was always tied to energy strategy. Over time, however, large portions of land were recognized for its ecological importance (Alaska Wilderness League 2026).
One of those portions is the Teshekpuk Lake Special Area. It supports one of Alaska and Canada’s largest caribou herds and millions of migratory birds. Alaskan Indigenous
PHOTO A sliver of the Trans-Alaska Pipeline System, an 800-mile oil transportation system born in the 1970s. This system creates an oil barrel blockade running from North Alaska to Anchorage. Licensed under Creative Commons 2.0.
communities rely on these wildlife populations for survival and cultural continuity. In April 2024, the Biden administration finalized protections across roughly 11 million acres in the Western Arctic, limiting new oil and gas leasing in sensitive areas, including Teshekpuk Lake (Federal Register 2024). 9 months later, those protections were reversed, in Trump’s Executive Order 14153. This redirects federal agencies to rescind environmental regulations enacted between 2021 and 2025 and to accelerate energy development across Alaska. Congress reinforced the effort using the Congressional Review Act to overturn land management plans that had redistricted drilling across millions of acres (House Committee on Natural Resources 2025). The Bureau of Land Management has since been instructed to resume lease sales in the region.
The primary justification for reopening these public lands is energy security. Federal estimates suggest the over 1.5 million acre Arctic National Wildlife Refuge Coastal Plain may contain between 4.25 and 11.8 billion barrels of recoverable oil (Bureau of Land Management 2026). The executive order argues that unlocking Alaska’s resources will reduce dependence on foreign energy, create jobs, and maintain American global energy dominance.
Energy demand is rising. Electricity consumption is increasing rapidly as artificial intelligence systems, data centers, and digital infrastructure expand nationwide. From a strategic perspective, Alaska looks like insurance.

But, do we need insurance? The United States is already the world’s leading oil producer. Expanding Arctic leasing is not an emergency response to shortage. It is a desperate attempt to harvest a dwindling supply of oil. That distinction becomes more significant when viewed alongside broader energy decisions. The same administration accelerating fossil fuel leasing in Alaska has also moved to roll back or freeze several renewable energy initiatives and funding mechanisms created in previous years. When protections for oil development expand while renewable investment dwindles, the direction of
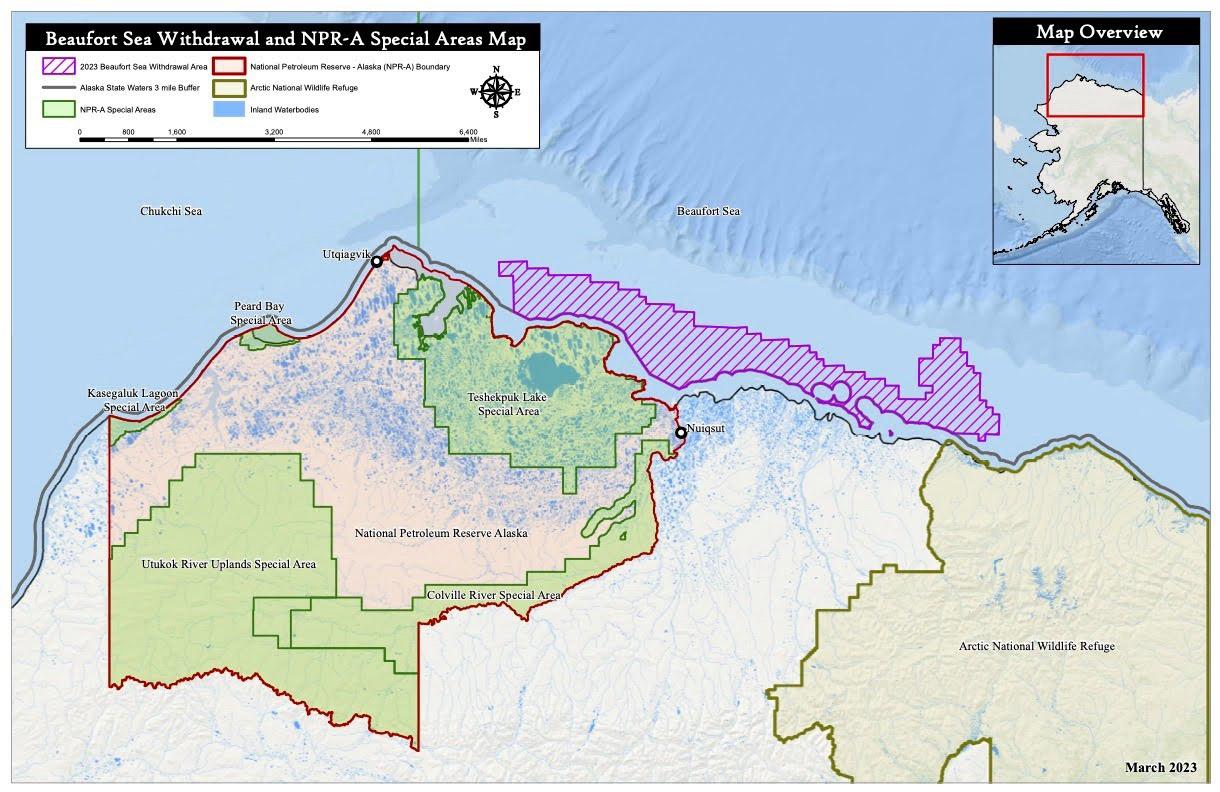
national energy policy looks to be moving backwards.
Oil development in the Arctic is not easily reversible. It requires roads, drilling pads, pipelines, and processing infrastructure built across tundra and permafrost. Those installations fragment habitat and alter migration patterns. The Tesekpuk Lake region is globally significant for bird populations and critical for caribou movement. Once industrial corridors are established, the ecological fragmentation remains for decades.
Supporters emphasize revenue and employment. On the other side of the aisle, lawyers suing the Trump Administration argue reopening most of the Western Arctic exposes fragile ecosystems for private gain while placing long-term environmental costs on the public (Eartjustice 2025). They also point to fisheries, subsistence resources, and tourism as economic sectors that depend on ecological stability.
Public land policy does not exist in a vacuum. Oil and gas leasing requires federal approval, regulatory design, and political will. The oil and gas industry remains one of the most influential sectors in federal lobbying and campaign financing. Big Oil invested almost $450 million dollars on Trump’s 2024 election campaign. That influence buys the power to metamorphose policy and land protections into billions of dollars. When millions of acres are reopened after recently enacted protections, it raises reasonable questions about whose interests are prioritized.
Is developing Alaska necessary to keep the lights on? Or does it reflect alignment between political leadership and industries positioned to benefit? On Tuesday, February 17, 2026, both new and recycled lawsuits were filed, challenging federal policy on Alaska energy development. In Grandmothers Growing Goodness v. Burgum, plaintiffs sued the U.S. Department of the Interior alleging the administration’s actions to expand oil and gas leasing in the NPR-A violated
federal environmental and procedural laws. The goal is to overturn or pause policies enabling industrial development without sufficient environmental review. The revived sixyear-old complaint, National Audubon Society v. United States Department of the Interior, also disagrees with the government’s decision to open Arctic habitats to expand leasing and drilling.
These lawsuits are attempting to prevent the sale of 5.5 million acres in the North Slope. This sale encompasses the Teshekpuk Lake Special Area and would be the first oil and gas drilling sale in the NPR-A since 2019 (Alaska Beacon 2026). The Indigenous tribes, conservation groups, and nonprofit law firms at the front lines of these legal battles spotlight the ongoing tensions between fossil fuel development and statutory mandates to safeguard sensitive, irreplaceable ecosystems.
Americans are not drawn to Alaska because of the amount of oil underneath one of the few remaining, untouched ecosystems in our country. Americans are drawn to Alaska’s wild beauty. This frontier has over 3 million lakes, northern lights, volcanoes, unique wildlife, glaciers, and the tallest mountain in North America. Reserves like the NPR-A are the last of The Last Frontier. Since policy consistently favors one industry’s expansion while narrowing alternatives, real patriots, like the Indigenous communities that have lived off the land since time in memorium, continue to step up to protect the invaluable natural capital in this Alaskan Reserve.
Lawsuits are a promising attempt to legally push back against the rapid rollback of protections in Alaska’s Arctic regions. It can be hard to think of ways to truly help American communities and ecosystems being Loraxed. Consider donating to non-profit law firms or signing petitions to be a voice for the voiceless. Alaska may be vast, but the window to defend its future is not.
“ “
Indigenous tribes, conservation groups, and nonprofit law firms at the front lines of these legal battles spotlight the ongoing tensions between fossil fuel development and statutory mandates to safeguard sensitive, irreplaceable ecosystems.
PHOTO National petroleum reserve (red) and reserved special areas (green). Teshekpik Lake Special Area recently lost “special area” status. Wikimedia commons.
Environmental Cost of a Greener Future
By Callie Murakami, Aquatic & Fishery Sciences ‘26, and Alberto Castagnoli, Environmental Engineering ‘26
Driving into Seattle, it can feel like construction season never ends. Traffic cones sprout overnight. Lanes disappear. Everyday routines turn into a maze of detours that not even Google Maps can solve. Frustration mounts as the rhythmic thuds of pile driving echo across Lake Washington.
What is all the hubbub about? On brand with the nickname “Emerald City”, Seattle prides itself on increasingly green and sustainable infrastructure. In 2011, the city committed to achieving net-zero carbon emissions by 2050 (Farrell & Krishna, 2024). Ongoing projects reflect this goal, with streamlined upgrades to highways and transit that will make it faster and more efficient to get where you need to go. An emissions report in 2022 attributed 58% of Seattle’s total emissions to the transportation sector (Farrell & Krishna, 2024). Washington has poured billions of dollars into major transportation projects that promise increased ridership, improved public transit options, safer access for pedestrians and cyclists, and lower greenhouse gas emissions.
Yet years of construction and traffic cloud the air with
dust and exhaust, making these endeavors feel anything but “green”. So what is the payoff? When will the dust settle? How much benefit will this “green infrastructure” actually have, and at what cost?
To clear the air, we look at two recent major transportation projects: the SR 520 Bridge Replacement and HOV Program, and Sound Transit light rail expansion. The SR 520 Bridge Replacement and HOV Program began in 2011 with the objective of rebuilding and constructing resilient bridge structures. Beyond safety upgrades, the project is estimated to lower greenhouse gas emissions by an estimated 10% through dedicated bus/HOV lanes and multimodal transit options capable of accommodating 17% more people and 5-10% more vehicles, according to the Washington State Department of Transportation (WSDOT) project webpage. Landscaped freeway lids, noise-reducing barriers, and a new stormwater management system aim to improve neighborhood connectivity and green space (“SR 520 Bridge Replacement and HOV Program”). This seems
“ How much benefit will this ‘green infrastructure’ actually have, and at what cost? ”
like a long term win for the larger Seattle area, but in the meantime, what impact is all of this construction and change having on the environment?
A quick search online is enough to find publicly available construction practices, records, and environmental manuals on how WSDOT handles the habitat their work runs through. Gretchen Coker, the Policy Branch Manager with WSDOT Environmental Services Office, explains that projects must develop protection plans for measures like sediment and erosion control, spill prevention and countermeasures, and temporary stream diversions among other safeguards before construction can begin. Contractors implement and monitor
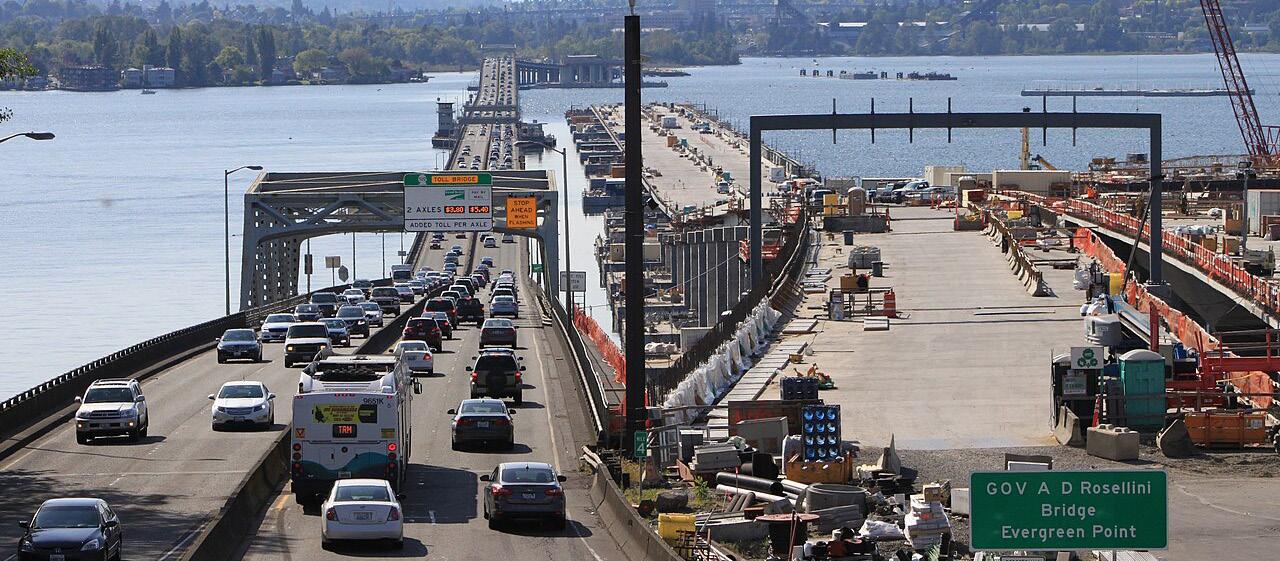
PHOTO Construction on SR520 bridge replacement taken from a freeway lid in 2015. Wikimedia Commons.
these plans, and may halt work if standards are not met. Mitigation measures are also a common method for projects to offset their environmental impacts. The $5.69 billion reported funding for the 520 program includes a multitude of restoration and enhancement of public spaces, including finished improvements to the Washington Park Arboretum and the Union Bay Natural Area (“SR 520 Bridge Replacement and HOV Program”).
As we rely on our state governments to take strides in green infrastructure and set us up for success, we as the public must also do our part to ensure that emissions goals can be realized. Coker notes that the biggest payoff for WSDOT in large projects like these is the long term trust with regulators, tribes, and the public through commitment to environmental protection and stewardship. Commuters can do their part by carpooling, limiting vehicle idling, and taking
“ The dust and detours of today may become the foundation of a cleaner tomorrow.
advantage of public transit, biking, and pedestrian options as they become available.
With construction projected to continue through 2031, traffic and disruptions will likely persist for years. Green infrastructure is rarely a simple or immediate fix - the true environmental cost of the SR 520 project is measured not only in years of construction, but the following decades of use.
The Seattle Light Rail was approved by voters in 1996 and launched in 2009 as the Central Link between the Tukwila International Boulevard and Westlake Stations (Sound Transit “Our History”). Since then, the 1 Line has made important expansions through the SeaTac Airport and the University of Washington, and the 2 Line has opened across the lake in Bellevue. The most recent plan approved in 2016 will add 62 new miles of light rail, more than doubling the current rail length to 116 miles and connecting sixteen cities across the Seattle metropolitan area. The Sound Transit 3 (ST3) expansion is the most ambitious transit expansion in the country, but does this ambition come with a disregard for the environmental impact?
Similar to WSDOT, Sound Transit designs their projects in compliance with the State Environmental Policy Act (SEPA), meaning all projects are reviewed and edited to best account for environmental consequences. For example, 5,300 trees had to be removed during the construction of the Lynnwood Light Rail expansion (Gallagher 2019). After the project was completed, Sound Transit replanted more than 20,000 trees near the elevated guideway with plans to monitor and maintain the new trees for thirteen years rather than the customary three years (Gallagher 2019).
Above all, the reduction of emissions by the Seattle Light Rail depends on whether people use the transit. Dr.

Don MacKenzie, a professor of Civil & Environmental Engineering at the University of Washington, makes the comparison that “Running full trains on electric power instead of gasoline pickup trucks will reduce emissions a lot, [while] Running empty trains instead of people driving electric vehicles will reduce emissions little to none… Ridership is key.” Sound Transit claims that passengers collectively avoided over 255,000 tonnes of greenhouse emissions in 2024 while operating on around 55,000 tonnes for annual operations (Sound Transit 2025). We can’t be absolutely sure that the ST3 expansion will achieve the necessary ridership to offset the emissions, but the most recent data show great progress.
Public opinion isn’t exclusively positive for these projects. Both the SR 520 and Light Rail have accumulated costs that weren’t initially part of the plan. Before 2017, the SR 520 was reported to cost $4.56 billion rather than the current $5.69 billion, and Sound Transit announced in 2025 an increased $34.5 billion needed for their ST3 project, which will cost a hefty $62.4 billion for the light rail additions alone (Federal Highway Administration 2016, Sound Transit 2025). With the precedent set, more cost spikes are a very real possibility for the years leading up to the project completions.
Despite the bumps in the road to a green future, Seattle has done remarkable work recently in decreasing car reliance. Just thirty years ago, there was no commuter rail, no light rail, and a less developed bus system. Now, Seattle is among the cities with the highest increases in bus and rail ridership in the country (FTA 2025). Since the COVID 19 pandemic in 2020, ridership for all Sound Transit systems, especially the Link Light Rail, has been increasing steadily every year since. The average monthly Link boardings was 2.5 million in 2024 compared to 3.1 million in 2025 (Sound Transit 2025).
With the air somewhat cleared, there is a notable optimism mixed in with the insecurity of the future. The city will be dealing with construction and road closure and rail restructuring, but if these projects can lead us to the green Seattle we dream of, then maybe we can wait for it to come true. The dust and detours of today may become the foundation of a cleaner tomorrow.
PHOTO Shoreline North/185th light rail station on its opening day in 2024. Wikimedia Commons.
Flooding Resilience Mitigation versus recovery in Western Washington
by Synnove Price-Huish, Law Societies & Justice, Community Environment & Planning
‘26, and Xander Smith, Environmental Science & Resource Management ‘26
In December 2025, atmospheric rivers brought days of intense precipitation throughout northwest Washington, causing roughly 100,000 evacuation notices and over 1,000 individuals to be rescued (Atkins et al., 2025). Rivers overflowed, and the limits of local infrastructure were tested as western Washington experienced its second major flooding event in five years. Skagit and Whatcom counties saw a particularly severe impact, representing over half of the nearly 4,000 homes that were affected across Washington State (Goldstein-Street, 2025). With forced evacuations, triggered landslides, and damage to roadways and personal property, the flooding was relentless. Nooksack School Districts closed as floodwaters seeped into buildings, residents of RV parks were displaced in Hamilton, and a sinkhole swallowed part of a road in Bellingham. Farms are expected to lose nearly $30 million in crop value due to the damage from flooding this year, and infrastructure damages are expected to cost in $10s of millions as well. From years of infrastructure planning to a newly established nonprofit, communities in Skagit and Whatcom counties have demonstrated different ways to respond to flooding events.
Unlike normal rainstorms, atmospheric rivers often result in large quantities of rain, which can cause significant damage and flooding. The definition of atmospheric rivers
was highly debated, but in the 1990s, the Glossary of Meteorology defined them as a narrow corridor consisting of a vast quantity of water vapor that leads to heavy precipitation. Regardless of their size, these events are known to disrupt travel, trigger mudslides, and cause other forms of catastrophic damage to life and property due to the immense quantity of rain they deposit.
Not all atmospheric rivers wreak havoc over the land they cross, however. The West Coast sources about 50% of its water from the precipitation these storms generate (Shea, 2020), highlighting the importance of these storms in replenishing the region’s watershed.
Washington faced an abnormally warm December in 2025, which ensured that this storm predominantly deposited rain (Norris, 2026). This weather event consisted of an atmospheric river that spanned roughly 7,000 miles (Hansen, 2025). The National Weather Service reported that certain areas of western Washington received over 10 inches of rain in 72 hours, which caused the Snohomish River and the Skagit River to flood at record-breaking levels. Skagit and Whatcom counties were both hit particularly hard by this overwhelming amount of rainfall and illustrate different approaches to disaster planning.
One story of success comes from Mount Vernon, and it took decades of planning, securing funding, and construction to see it come to fruition. In 2008, city leaders of Mount Vernon recognized the need to protect its downtown, so they created plans for a floodwall (Whitman, 2026). After years of navigating federal funding, securing permits, and undergoing construction, the project was finally completed in 2018. The floodwall is a remarkable yet simple piece of infrastructure that sits on top of an existing levee. When the river is at its normal volume, the floodwall blends in with the rest of downtown Mount Vernon, as its brick
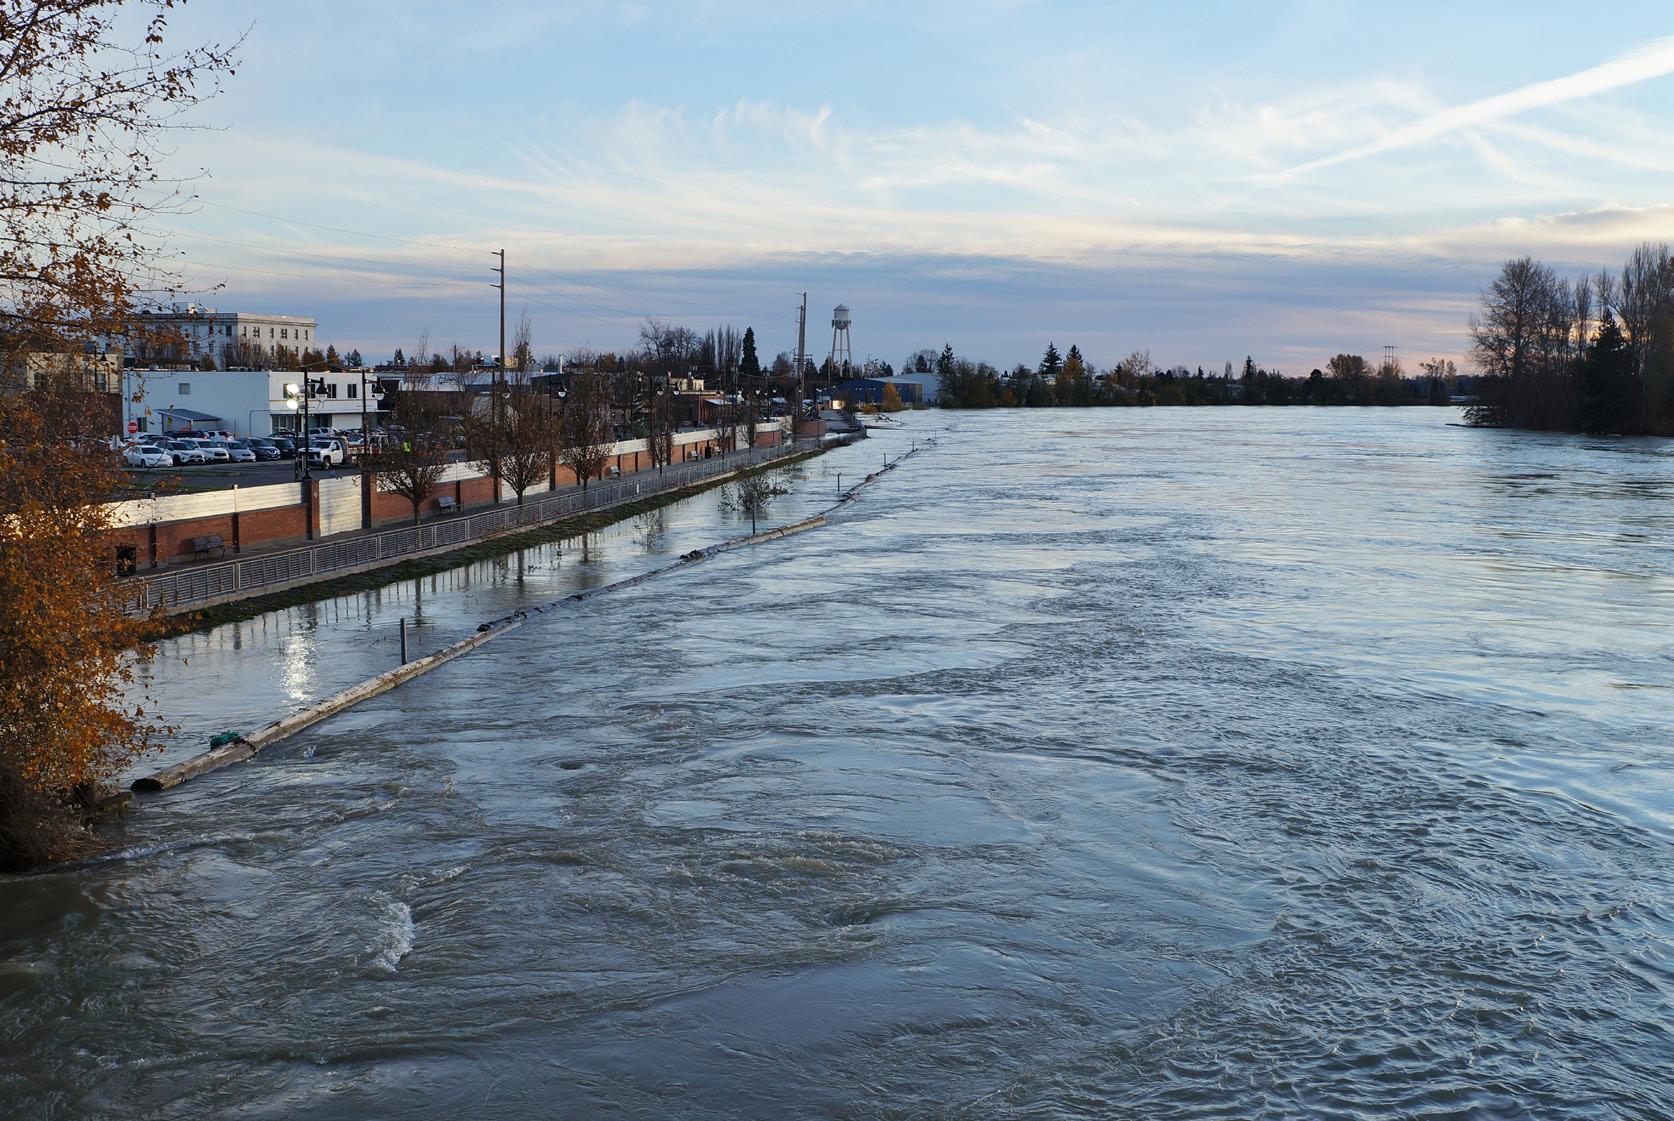
PHOTO The Skagit River encroaching on the Mount Vernon floodwall following a flooding event in November 2021. Photo from Wikimedia Commons.
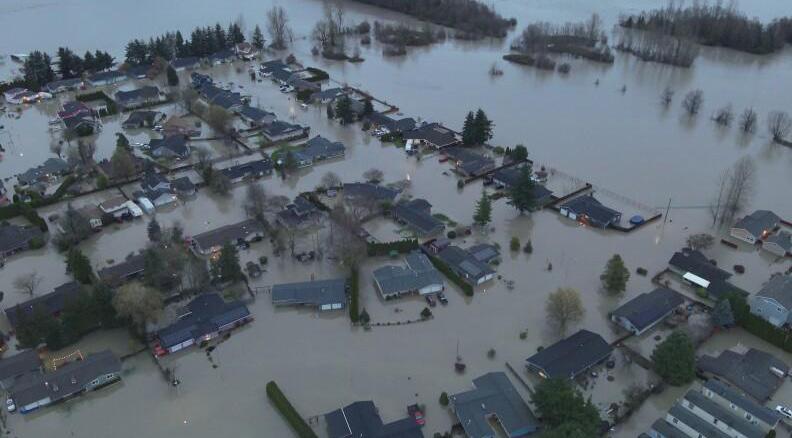
pattern seamlessly runs along a waterfront walking trail. But when the heavy rains came and the Skagit River crested at nearly 40 ft., breaking previously known records, the floodwall played a critical role in defending the city. Using removable metal slots and posts, the floodwall is fortified whenever the Skagit River is predicted to flood.
Instead of relying on hordes of volunteers to haul sandbags to protect local storefronts, which was the reality not too long ago, over 200 buildings and businesses were able to remain open and unharmed. The strength of the Mount Vernon floodwall has been appraised by many. It highlights the importance of resilient infrastructure planning that takes into account not just historic flood levels, but estimated increases in severity in these events as well. Although it may have taken 10 years and two mayors, investment in these projects is both necessary and worthwhile.
While Mount Vernon stayed dry and the floodwall held strong, multiple levees broke along the Nooksack River, and multiple culverts were blocked or damaged, resulting in worsening impacts throughout towns in Whatcom County (Alden, 2025). In Everson alone, there’s an estimated to be over $2 million in damages to city properties, and in Sumas, over 90% of residents were forced to evacuate before the floodwaters got too high. These communities, located along the Nooksack River near the Canadian border, have experienced recurring flooding for decades. Each major
From years of infrastructure planning to a newly established non-profit, communities in Skagit and Whatcom counties have demonstrated different ways to respond to flooding events.
event not only damages homes and workplaces but causes a disruption to daily life and forces residents to navigate how to rebuild, secure insurance, or even move away (Todd, 2025). It’s not that these cities ignore flooding, as there are many investments in flood-mitigation infrastructure, such as the series of levees in place along the Nooksack River. But when extreme weather hits, many levees are at risk of being breached, causing the flooding that was seen in 2025.
However, resilience doesn’t only show itself in prevention. Whatcom County has recently taken steps to immensely aid in individuals’ recovery in the aftermath of flooding events. Following a major flooding event in the Fall of 2021, Whatcom Long Term Recovery Group, also
Storm resilience requires a well-rounded approach that values small and large-scale efforts... from communityled action to robust infrastructure investments. “ ”
known as Whatcom Strong, was founded (Sanford, 2026). Their mission is to provide resources and coordination to communities hit hard after disasters, and as their name implies, continue their support long-term. The non-profit works to help households with ongoing financial, logistical, and emotional barriers to recovery. Their creation reflects that disaster recovery extends far beyond the immediacy of the emergency. Although not a physical infrastructure like Mount Vernon’s floodwall, this organization was vital in the response to the 2025 floods, providing community-based support for nearly 800 households (Alden, 2025).
As climate change persists, severe weather events such as this one will happen with more frequency. Atmospheric rivers are expected to happen more often and with greater intensity (USDA, n.d.). Some research indicates that atmospheric rivers could be 25% longer and wider, which would inevitably lead to heightened risk for damage. Given this trajectory of future flooding events, it is more important than ever that flood-prone counties across Washington take intentional steps to invest in both mitigation and recovery strategies. As demonstrated by the Skagit and Whatcom communities, storm resilience requires a well-rounded approach that values small and large-scale efforts. From community-led action to robust infrastructure investments, Washington can look to these counties moving forward.
PHOTO Nooksack River flooding in Everson, Washington, December 2025. Photo from the Whatcom County Sheriff’s Office.
references
FIRST FLIGHT: ENGAGING NOVICE BIRDWATCHERS WITH MERLIN BIRD ID
Summer Delehanty, Human-centered Design & Engineering ‘25
Aas Ø, Jørgensen FMO, Stensland S, Reiertsen T, Dybsand HNH. 2023. Your place or mine? Exploring birdwatching tourists’ behaviour disturbing birds in a nature reserve. European Journal of Wildlife Research. 69:44. doi:10.1007/s10344-02301678-y.
Charmaz, K. 2006. Constructing grounded theory: a practical guide through qualitative analysis. London; Thousand Oaks, Calif: Sage Publications. ISBN: 0761973524 9780761973522 0761973532 9780761973539
Gyllenhaal, A. & Gyllenhaal, B. 2026. Are Merlin and eBird helping or hurting our birding skills? A debate is brewing over how best to use these powerful tools. Flying Lessons. https://flyinglessons.us/2026/01/16/are-merlin-and-ebirdhelping-or-hurting-our-birding-skills-a-debate-is-brewing-over-how-best-touse-these-powerful-tools
Rosenberg, K, V., et al. 2019. Decline of the North American avifauna. Science 366 (6461): 120–124. https://doi.org/10.1126/science.aaw1313
Sali, M. J. G. & Kuehn, D. M. 2007. Gender-based motivations of non-residential birdwatchers in New York state: A qualitative study. In: Burns, R.; Robinson, K., comps. Proceedings of the 2006 Northeastern Recreation Research Symposium; 2006 April 9-11; Bolton Landing, NY. Gen. Tech. Rep. NRS-P-14. Newtown Square, PA: U.S. Department of Agriculture, Forest Service, Northern Research Station: 318-325.
Tang, A. 2025. Lab of Ornithology hits 2 billion bird sightings, 3 million recordings. Cornell Chronicle. https://news.cornell.edu/stories/2025/08/lab-ornithologyhits-2-billion-bird-sightings-3-million-recordings
U.S. Fish and Wildlife Service. 2024. Birding in the United States: A Demographic and Economic Analysis. U.S. Department of the Interior, Fish and Wildlife Service
White E. M, Bowker J. M., Askew A. E., Langner L.L., Arnold J.R., & English D. B. K. 2014. Federal outdoor recreation trends: effects on economic opportunities national center for natural resources economic research. NCNRER working paper number 1
Wu, J. X., et al. 2022. U.S. National Wildlife Refuge System likely to see regional and seasonal species turnover in bird assemblages under a 2°C warming scenario. The Condor: Ornithological Applications 124 (3): duac016. https://doi. org/10.1093/ornithapp/duac016
HIGH ADAPTABILITY, LIMITED OCCUPANCY: MAPPING HABITAT FOR NON-NATIVE RED FOX IN WASHINGTON
Chris Steinbronn, Environmental Science and Terrestrial Resource Management ‘27
Abbass, K., Qasim, M.Z., Song, H. et al. 2022. A review of the global climate change impacts, adaptation, and sustainable mitigation measures. Environ Sci Pollut Res 29, 42539–42559. https://doi.org/10.1007/s11356-022-19718-6
Akins, J. R., Aubry, K. B., & Sacks, B. N. 2018. Genetic integrity, diversity, and population structure of the Cascade red fox. Conservation Genetics, 19(4), 969–980. https://doi.org/10.1007/s10592-018-1070-y
Aubry, K. B. 1984. The recent history and present distribution of the red fox in Washington. Research Exchange (Washington State University). http://hdl. handle.net/2376/1865
Brodie, S. J., Thorson, J. T., Carroll, G., Hazen, E. L., Bograd, S., Haltuch, M. A., Holsman, K. K., Kotwicki, S., Samhouri, J. F., Willis-Norton, E., & Selden, R.
L. 2019. Trade-offs in covariate selection for species distribution models: a methodological comparison. Ecography, 43(1), 11–24. https://doi.org/10.1111/ ecog.04707
Elith, J., Phillips, S. J., Hastie, T., Dudík, M., Chee, Y. E., & Yates, C. J. 2010. A statistical explanation of MaxEnt for ecologists. Diversity and Distributions, 17(1), 43–57. https://doi.org/10.1111/j.1472-4642.2010.00725.x
GBIF.org.12 November 2025. GBIF Occurrence Download https://doi.org/10.15468/ dl.wmxbdn
GBIF.org. 17 November 2025. GBIF Occurrence Download https://doi.org/10.15468/dl.4agqf7
Hohenlohe, P., Funk, W. C., & Rajora, O. 2020. Population genomics for wildlife conservation and management [Dataset]. Authorea. https://doi.org/10.22541/ au.158480040.06912807
Hradsky, B. A., Kelly, L. T., Robley, A., & Wintle, B. A. 2019. FoxNet: An individual-based model framework to support management of an invasive predator, the red fox. Journal of Applied Ecology, 56(6), 1460–1470. https://doi.org/10.1111/13652664.13374
Lawler, J. J., Ruesch, A. S., Olden, J. D., & McRae, B. H. 2013. Projected climatedriven faunal movement routes. Ecology Letters, 16(8), 1014–1022. https://doi. org/10.1111/ele.12132
Leighton, G. R. M., Froneman, W., Serieys, L. E. K., & Bishop, J. M. 2023. Trophic downgrading of an adaptable carnivore in an urbanising landscape. Scientific Reports, 13(1), 21582. https://doi.org/10.1038/s41598-023-48868-x
Quinn, C. B., Akins, J. R., Hiller, T. L., & Sacks, B. N. 2018. Predicting the potential distribution of the Sierra Nevada red fox in the Oregon cascades. Journal of Fish and Wildlife Management, 9(2), 351–366. https://doi.org/10.3996/082017jfwm-067
Sanderson, C. E., Jobbins, S. E., & Alexander, K. A. 2013. With Allee effects, life for the social carnivore is complicated. Population Ecology, 56(2), 417–425. https://doi. org/10.1007/s10144-013-0410-5
Sargeant, A. B., & Allen, S. H. 1989. Observed Interactions between Coyotes and red foxes. Journal of Mammalogy, 70(3), 631–633. https://doi. org/10.2307/1381437
Scanes, G., Colin. Chapter 19 - Human Activity and Habitat Loss: Destruction, Fragmentation, and Degradation. Animals and Human Society, Academic Press, 2018, 451-482, https://doi.org/10.1016/B978-0-12-805247-1.00026-5
Sekercioglu, C. H., Schneider, S. H., Fay, J. P., & Loarie, S. R. 2007. Climate change, elevational range shifts, and bird extinctions. Conservation Biology, 22(1), 140–150. https://doi.org/10.1111/j.1523-1739.2007.00852.x
Steven J. Phillips, Miroslav Dudík, Robert E. Schapire. [Internet] Maxent software for modeling species niches and distributions (Version 3.4.1). Available from url: http://biodiversityinformatics.amnh.org/open_source/maxent/. Accessed on 2026-2-24
Zimen, E. 1980. The red fox : Symposium on behaviour and ecology. http://ci.nii.ac.jp/ ncid/BA07820447
ALONE IN THE SHALLOWS: FORAGING DYNAMICS OF GREAT BLUE HERONS IN FALSE BAY
Alice Vimal, Marine Biology ‘26
Eissinger, A.M. 2007. Great Blue Herons in Puget Sound. Puget Sound Nearshore Partnership Report No. 2007-06. Published by Seattle District, U.S. Army Corps of Engineers, Seattle, Washington
Krebs, J. R. 1974. Colonial Nesting and Social Feeding as Strategies for Exploiting Food Resources in the Great Blue Heron (Ardea herodias). Behaviour 51:99–134
Peterson, N. J., and J. M. Marzluff. 2025. Response of Great Blue Heron (Ardea herodias) Habitat Use to Changing Seasons and Tidal Levels Across a Grassland and Estuarine Ecosystem. Waterbirds 47:1–10
SEAWEED TO SOIL: AN EXPLORATION OF SUGAR KELP AS A COMPOSTING SUPPLEMENT
Mathilda Myerhoff, Environmental Studies & Anthropology ‘26
Battacharyya, D., M.Z. Babgohari, P. Rathor and B. Prithiviraj. 2015. Seaweed extracts as biostimulants in horticulture. Sci. Hortic. 196: 39–48
Khan, M., Mohammad, F. 2014. Eutrophication: Challenges and Solutions. In: Ansari, A., Gill, S. Eutrophication: Causes, Consequences and Control. Springer, Dordrecht. https://doi.org/10.1007/978-94-007-7814-6_1
Pereira, L., & Bahcevandziev, K. 2020. Seaweeds as plant fertilizer, agricultural biostimulants and animal fodder. CRC Press. https://doi. org/10.1201/9780429487156
Raven, J.A., Taylor, R. 2003. Macroalgal growth in nutrient-enriched estuaries: A biogeochemical and evolutionary perspective. Water, Air, & Soil Pollution: Focus 3, 7–26. https://doi.org/10.1023/A:1022167722654
Smith, V.H. Eutrophication of freshwater and coastal marine ecosystems a global problem. Environ Sci & Pollut Res 10, 126–139 (2003). https://doi.org/10.1065/ espr2002.12.142
Troge, T. 2023, February 17. Washington Sea Grant, Washington Seaweed Knowledge Symposium [Video]. YouTube. https://www.youtube.com/ watch?v=5DEOWhoIYwA
MONITORING FOREST HEALTH IN POINT DEFIANCE STATE PARK, WA
Nelson Pham, Environmental Science & Terrestrial Resource Management ‘27
Andrus, R. A., Peach, L. R., Cinquini, A. R., Mills, B., Yusi, J. T., Buhl, C., Fischer, M., Goodrich, B. A., Hulbert, J. M., Holz, A., Meddens, A. J. H., Moffett, K. B., Ramirez, A., & Adams, H. D. 2024. Canary in the forest?—Tree mortality and canopy dieback of western redcedar linked to drier and warmer summers. Journal of Biogeography. 51(1): 103-119
Brennan, D., Brooks, R., Davis, I., Dehr, M., Kohler, G., McIvor, M., Omdal, D., Prado, L., Rubin, W., Spaeth, A., Watkins, J., Williams, K., Chi, P., DePinte, D., Hof, J., Mulvey, R., Navarro, S., & Ripley, K. 2024. Forest Health Highlights in Washington / 2024. Washington State Department of Natural Resources
Brooks, R., Davis, I., Dehr, M., Gosztyla, D., Grell, J., Kohler, G., Lane, A., Omdal, D., Prado, L., Rubin, W., Tonkel, M., Watkins, J., Chi, P., DePinte, D., Fischer, M., Goodrich, B., Hof, J., & Ripley, K. 2022. Forest Health Highlights in Washington / 2022. Washington State Department of Natural Resources Lepore, R. Personal Interview. 18 December 2025 USDA Climate Hubs. 2021. Climate Change Impacts in the Northwest. USDA Climate Hubs. https://www.climatehubs.usda.gov/hubs/northwest/topic/climatechange-impacts-northwest Western Wildland Environmental Threat Assessment Center. 2024. Western Redcedar Dieback. USDA Forest Service
BREWERS WITHOUT BORDERS: HOW HOPS SHAPE WASHINGTON’S ENVIRONMENT AND BELGIUM’S ECONOMY
Orion De Smet, Environmental Studies ‘26, Adlai Knutson, Envrionmental Studies ‘26, and Emily Sanders, Economics ‘26
Brewers of Europe. 2025. Number of active beer breweries in Belgium from 2009 to 2024. https://www.statista.com/statistics/447354/belgium-number-beerbreweries/ Chappell, B. 2016. UNESCO Deems Belgium’s Beer Culture A Treasure Of Humanity.
NPR. https://tinyurl.com/4dhr6tm9
Christensen , N. 2009. Hop growers improving efficiency, helping environment. Oregon State University. Oregon State University
Environmental Protection Agency (EPA). 2013. Relation Between Nitrate in Water Wells and Potential Sources in the Lower Yakima Valley, Washington
Hoang, M. 2022, April 22. How Your Favorite IPA Is Contributing to Climate Change. Cascade PBS. www.cascadepbs.org/environment/2022/04/how-your-favoriteIPA-contributing-climate change
Koen, V.G. 2024. Annual volume of beer consumed in Belgium from 2008 to 2024. Brasseurs Belges. https://www.statista.com/statistics/446729/volume-beerconsumption-belgium
N.d. Hops (HS: 1210). The Observatory of Economic Complexity. https://oec.world/en/profile/hs/hops
United Nations (UN). 2025. Comtrade Database https://comtradeplus.un.org
United States Census Bureau (USCB). 2025. USA Trade Online. https://usatrade. census.gov
United States Department of Agriculture (USDA). 2024. National Hop Report. National Agricultural Statistics Service (NASS), Agricultural Statistics Board. hops1224. pdf
Yakima Chief Hops. 2024 Sustainability Impact Report. https://www.yakimachief.com/ media/wysiwyg/documents/Impact_Report_2024.pdf
Yakima Chief Ranches. 2026. Hop Brands. https://yakimachiefranches.com/create/ brands
Zuroske, M.L. 2009. Assessment of Eutrophication in the Lower Yakima River Basin, Washington, 2004–07. Scientific Investigations Report 2009–5078
FROGS AND FRONDS: EVALUATING THE HEALTH OF WETLANDS ON BAINBRIDGE ISLAND
Jake Levin, Marine Biology ‘26
Bentley, Shannon., Tomscha, Stephanie., and Deslippe, Julie. 2022. Indicators of wetland health improve following small-scale ecological restoration on private land. Science of the Total Environment. 837: 155760
Bolpagni, R. and Piotti, A. 2016. The importance of being natural in a human-altered riverscape: role of wetland type in supporting habitat heterogeneity and the functional diversity of vegetation. Aquatic Conservation: Marine and Freshwater Ecosystems. 26: 1168-1183
Brooks, R. 2007. Next Generation of Ecological Indicators of Wetland Condition. Ecohealth. 4(2): 176-178
Haig, S., Mehlman, David., and Oring, Lewis. 2008. Avian Movements and Wetland Connectivity in Landscape Conservation. Conservation Biology. 12(4): 749-758
Hruby, T. 2014. Washington State Wetland Rating System for Western Washington, 2014. Washington Department of Ecology. No. 14-06-029
Lavergne, S. and Molofsy. J. 2010. Reed Canary Grass as a Biological Model in the Study of Plant Invasions. Critical Reviews in Plant Sciences. 23(5): 415-429
Mitsch, W.J., Bernal, B., Nahlik, A.M. et al. Wetlands, carbon, and climate change. Landscape Ecology. 28: 583–597
Washington Herp Atlas. 2009. A cooperative effort of Washington Natural Heritage Program, Washington Department of Fish and Wildlife, U.S.D.I. Bureau of Land Management, and U.S. Forest Service. Map products updated March 2017
RIGHTS FOR RESIDENTS: PROTECTING SOUTHERN RESIDENT ORCAS IN THE PACIFIC NORTHWEST
Alexa Lavinder, Earth and Space Sciences ‘26
Bosselmann, K. 2025, January 29. The river as a legal person: The case of the Whanganui River in New Zealand. Heinrich Böll Stiftung. https://www.boell.de/
en/2025/01/29/river-legal-person-case-whanganui-river-new-zealand Environmental Protection Agency. Chinook Salmon. EPA. https://www.epa.gov/salishsea/chinook-salmon
Fisheries, N. 2025, January 27. Southern Resident Killer Whale Recovery Planning and Implementation. https://www.fisheries.noaa.gov/west-coast/endangeredspecies-conservation/southern-resident-killer-whale-recovery-planningand#environmental-contaminants
Gig Harbor (USA) Proclamation: Rights of the southern resident orca. Eco Jurisprudence Monitor. https://ecojurisprudence.org/initiatives/gig-harbor-u-sproclamation-of-the-rights-of-the-southern-resident-orcas
Issues Affecting the Orcas. The Whale Museum. https://whalemuseum.org/pages/ issues-affecting-the-orcas
Killer Whale Resources and Regulations for Boaters. Washington Department of Fish & Wildlife. https://wdfw.wa.gov/species-habitats/at-risk/species-recovery/orca/ regulations
Meet the Southern residents. Orca Conservancy. https://www.orcaconservancy.org/ meet-the-southern-residents
The Orca/Killer Whale Indigenous Symbol: Spirits of the West Coast. Spirits of the West Coast Art Gallery. https://spiritsofthewestcoast.com/collections/the-orcasymbol-or-killer-whale
Putzer, A., Lambooy, T., Jeurissen, R., & Kim, E. 2022. Putting the rights of nature on the map. A quantitative analysis of rights of nature initiatives across the world. Journal of Maps, 18(1), 89–96. https://doi.org/10.1080/17445647.2022.2079 432
Surma, K. 2022, December 7. Port Townsend recognizes rights of endangered Southern Resident Orcas. The Seattle Times. https://www.seattletimes.com/ seattle-news/environment/port-townsend-recognizes-rights-of-endangeredsouthern-resident-orcas
Surma, K. 2026, January 16. Two towns in Washington take steps toward recognizing the rights of southern resident orcas. Inside Climate News. https:// insideclimatenews.org/news/06122022/rights-of-nature-southern-residentorcas
REMOTE SENSING: ETHICAL IMPLICATIONS FOR SCIENTISTS AND GLOBAL POWER DYNAMICS
Sage Mailhiot, Environmental Science & Terrestrial Resource Management, ‘26 and Ryan Luvera, Aquatic and Fishery Sciences, Marine Biology, ‘26
Bennett, M. M., Chen, J. K., Alvarez Leon, L. F., & Gleason, C. J. 2022. The politics of pixels: A review and agenda for critical remote sensing. Progress in Human Geography, 46(3), 729-752. https://journals.sagepub.com/doi/ full/10.1177/03091325221074691
Bennett MM et al. 2024. Bringing satellites down to Earth: Six steps to more ethical remote sensing. Global Environmental Change Advances. 2:100003. https://doi. org/10.1016/j.gecadv.2023.100003
Darkwah GK et al. 2024. Reconstruction of the Hydro-Thermal Behavior of Regulated River Networks of the Columbia River Basin Using Satellite Remote Sensing and Data-Driven Techniques. Earth’s Future. 12(10):e2024EF004815. https://doi. org/10.1029/2024EF004815
Flexible Pricing for Satellite Imagery & Data | Planet. [accessed 2026 Mar 3]. https:// www.planet.com/pricing
Lunetta R et al. 1991. Remote Sensing and Geographic Information System Data Integration: Error Sources and Research Issues. Photogrammetric Engineering and Remote Sensing. [published online ahead of print] https://scholars.unh.edu/ faculty_pubs/1255
Martin RV. 2008. Satellite remote sensing of surface air quality. Atmospheric
Environment. 42(34):7823–7843. https://doi.org/10.1016/j. atmosenv.2008.07.018
Ozdogan M, Woodcock CE. 2006. Resolution dependent errors in remote sensing of cultivated areas. Remote Sensing of Environment. 103(2):203–217. https://doi. org/10.1016/j.rse.2006.04.004
Satellite Database | Union of Concerned Scientists. [accessed 2026 Mar 3]. https:// www.ucs.org/resources/satellite-database
Schultz B et al. 2022. Recognizing the equity implications of restoration priority maps. Environ Res Lett. 17(11):114019. https://doi.org/10.1088/1748-9326/ac9918
Vargas-Ramírez N, Paneque-Gálvez J. 2019. The Global Emergence of Community Drones (2012–2017). Drones. 3(4) https://www.mdpi.com/2504-446X/3/4/76. https://doi.org/10.3390/drones3040076
BEYOND BANS: RETHINKING CHEMICAL REGULATION IN THE AGE OF PFAS
Kate Allhusen, Marine Biology ‘26 and Sophie Garrote, Environmental Science and Terrestrial Resource Management ‘26
Cardon, V., Levain, A., Pellissier, F., Dedieu, F., Joly, P.-B., & Barbier, M. 2025. Continuous discontinuation: the DDT ban as a framework for the perpetuation of pesticides use. Environmental Sociology, 12(1), 1–12. https://doi.org/10.1080/23 251042.2025.2484478
Ehrlich, P., Dobkin, D., & Wheye, D. 2019. DDT and Birds. Stanford University. https:// web.stanford.edu/group/stanfordbirds/text/essays/DDT_and_Birds.html
Harvard School of Public Health. 2023, May 15. Communities of color disproportionately exposed to PFAS pollution in drinking water. Harvard T.H. Chan School of Public Health. https://hsph.harvard.edu/news/communities-ofcolor-disproportionately-exposed-to-pfas-pollution-in-drinking-water
Igini, M. 2024, November 15. PFAS Potentially Contaminate Water For 95 Million Americans. Earth.org
Mueller, R., & Schlosser, K. E. 2020. History and Use of Per- and Polyfluoroalkyl Substances (PFAS) found in the Environment. Interstate Technology Regulatory Council
National Institute of Environmental Health Sciences. 2023, December 4. Perfluoroalkyl and Polyfluoroalkyl Substances (PFAS). National Institute of Environmental Health Sciences. https://www.niehs.nih.gov/health/topics/ agents/pfc
Okamoto, K. 2025, January 13. PFAS Bans Are Coming for Clothing. Here’s What You Need to Know. The New York Times
Peter, H., Aurich, D., Schymanski, E. L., Sims, K., & Hale, S. E. 2023. Avoiding the Next Silent Spring: Our Chemical Past, Present, and Future. Environmental Science & Technology, 57(16), 6355–6359. https://doi.org/10.1021/acs.est.3c01735
Samora, S. 2023, December 6. The history of PFAS: From World War II to your Teflon pan. Manufacturing Dive. https://www.manufacturingdive.com/news/thehistory-behind-forever-chemicals-pfas-3m-dupont-pfte-pfoa-pfos/698254
Solutions. 2026. Aquagga. https://www.aquagga.com/ourtech
Tabuchi, H. 2026, February 15. Three Olympic Athletes Were Just Disqualified for a Novel Reason: PFAS. The New York Times. https://www.nytimes. com/2026/02/15/climate/olympics-ski-snowboard-wax-pfas-forever-chemicals. html
Tokranov, A. K., Ransom, K. M., Bexfield, L. M., Lindsey, B. D., Watson, E., Dupuy, D. I., Stackelberg, P. E., Fram, M. S., Voss, S. A., Kingsbury, J. A., Jurgens, B. C., Smalling, K. L., & Bradley, P. M. 2024. Predictions of groundwater PFAS occurrence at drinking water supply depths in the United States. Science. https:// doi.org/10.1126/science.ado6638
United States Environmental Protection Agency. 2024, November 26. Our Current Understanding of the Human Health and Environmental Risks of PFAS. EPA.
https://www.epa.gov/pfas/our-current-understanding-human-health-andenvironmental-risks-pfas
United States Environmental Protection Agency. 2025, May 1. DDT - A brief history and status. EPA. https://www.epa.gov/ingredients-used-pesticide-products/ddtbrief-history-and-status
United States Environmental Protection Agency. 1972, December 31. DDT Ban Takes Effect [Press release]. EPA. https://www.epa.gov/archive/epa/aboutepa/ddt-bantakes-effect.html
Whitney, C. 2012. The Silent Decade: Why It Took Ten Years to Ban DDT in the United States. The Virginia Tech Undergraduate Historical Review, 1. https://doi. org/10.21061/vtuhr.v1i0.5
FRICTIONS BETWEEN GREEN ENERGY AND TRIBAL SOVEREIGNTY
Phoebe Berghout, Aquatic and Fishery Sciences, Environmental Science & Terrestrial Resource Management ‘26, and Ashley Ingalsbe, Environmental Studies ‘26
Brannan, H. 2026, February 2. Feds greenlight $2B renewable energy project on Yakama Nation sacred site; Washington State Standard. Washington State Standard. https://washingtonstatestandard.com/2026/02/02/feds-greenlight2b-renewable-energy-project-on-yakama-nation-sacred-site
Celebrating 10 years of dam removal, salmon recovery, and community resilience on the Lower Elwha. 2021, September 24. Washington Conservation Action. https://waconservationaction.org/celebrating-10-years-of-dam-removal-andcommunity-resiliency-on-the-lower-elwha
Columbia River hydropower system | Washington Department of Fish & Wildlife. Wdfw.wa.gov. https://wdfw.wa.gov/species-habitats/habitat-recovery/columbiariver-hydropower
Controversial energy project in southern Washington state moves closer to breaking ground. Opb. https://www.opb.org/article/2024/02/10/controversial-energyproject-moves-closer-to-breaking-ground
O’Sullivan, J. 2021, May 17. Inslee signs climate bills, but vetoes parts that tie them to passage of a transportation package. The Seattle Times. https://www. seattletimes.com/seattle-news/inslee-signs-climate-bills-but-vetoes-partstying-them-to-transportation-package shoshana.gordon@propublica.org. 2026, January 26. Our Reporting Showed Washington Ranks Last in Green Energy Growth. Now the State Is Working to Speed It Up. ProPublica. https://www.propublica.org/article/washingtonrenewable-energy-projects-grid-upgrades United States - U.S. Energy Information Administration (EIA). 2026. Eia.gov. https:// www.eia.gov/states/WA/overview
PERSONAL IMPACT VS CORPORATE RESPONSIBILITY: PUSHING ENVIRONMENTAL IMPACT ONTO THE CONSUMER
Jack Carter, Biology ‘26, and Ben Kuhl, Marine Biology ‘26
Alaska Airlines Travelers Can Purchase SAF Credits to Offset Their Carbon Impact for Flights | Travelpulse, www.travelpulse.com/news/airlines-airports/alaskaairlines-travelers-can-purchase-saf-credits-to-offset-their-carbon-impact-forflights
Ammar, Nader R., and Ibrahim S. Seddiek. 27 Apr. 2020 “An environmental and economic analysis of emission reduction strategies for container ships with emphasis on the improved energy efficiency indexes.” Environmental Science and Pollution Research, vol. 27, no. 18, pp. 23342–23355, https://doi.
org/10.1007/s11356-020-08861-7
“Big Oil Coined ‘carbon Footprints’ to Blame Us for Their Greed. Keep Them on the Hook | Rebecca Solnit.” 23 Aug. 2021. The Guardian, Guardian News and Media, www.theguardian.com/commentisfree/2021/aug/23/big-oil-coined-carbonfootprints-to-blame-us-for-their-greed-keep-them-on-the-hook
How the Aviation Industry Could Help Scale Sustainable Fuel Production, www. mckinsey.com/industries/aerospace-and-defense/our-insights/how-theaviation-industry-could-help-scale-sustainable-fuel-production
THE LAST FRONTIER FOR SALE: ENERGY, POWER, AND THE FUTURE OF ALASKA
Cate Miggins, Environmental Studies ‘26, and Anne Marie Zink, Marine Biology ‘28
Alaska Wild Admin. 2026, January 7. “Western Arctic (National Petroleum Reserve).” Alaska Wilderness League. alaskawild.org/places-we-defend/western-arcticnational-petroleum-reserve
Arkestejin, Jan. 2023, April 28. OilPipeAlaska. https://commons.wikimedia.org/w/ index.php?title=File:OilPipeAlaska.JPG&oldid=1159001249
Brooks, James. 2026, February 17. “Two Lawsuits Challenge Trump Administration’s Plans for Oil Drilling in Alaska Petroleum Reserve” Alaska Beacon. alaskabeacon. com/briefs/two-lawsuits-challenge-trump-administrations-plans-for-oil-drillingin-alaska-petroleum-reserve
Bureau of Land Management. Alaska Oil and Gas Lease Sales. https://www.blm.gov/ programs/energy-and-minerals/oil-and-gas/leasing/regional-lease-sales/alaska Bureau of Land Management. Forms for Oil and Gas Leasing. https://www.blm.gov/ services/electronic-forms
Executive Order. No. 01966, 2025, pp. 8363–8365. https://www.whitehouse.gov/ presidential-actions/2025/01/temporary-withdrawal-of-all-areas-on-the-outercontinental-shelf-from-offshore-wind-leasing-and-review-of-the-federalgovernments-leasing-and-permitting-practices-for-wind-projects
Earthjustice. 2025, June 18. “Earthjustice Statement on Trump Administration Plan to Open Most of the Western Arctic to Oil and Gas Drilling.” earthjustice.org/ press/2025/earthjustice-statement-on-trump-administration-plan-to-openmost-of-the-western-arctic-to-oil-and-gas-drilling
Federal Register. 2024, May 7. Management and Protection of the National Petroleum Reserve in Alaska. 89(89). https://www.federalregister.gov/ documents/2024/05/07/2024-08585/management-and-protection-of-thenational-petroleum-reserve-in-alaska
Federal Register 2025, January 29. Unleashing Alaska’s Extraordinary Resource Potential. 90(18). https://www.govinfo.gov/content/pkg/FR-2025-01-29/ pdf/2025-01955.pdf
Global Energy Review 2025. Analysis. IEA. www.iea.org/reports/global-energyreview-2025
Grandmothers Growing Goodness v. Burgum, 1:26-cv-00513, (D.D.C. Feb 17, 2026) ECF No. 1 https://www.courtlistener.com/docket/72288699/1/grandmothersgrowing-goodness-v-burgum
Jan, Jake Johnson. 2025, January 24. “Big Oil’s $445 Million Investment in Trump and GOP ‘Already Paying Off.’” Common Dreams. www.commondreams.org/news/ big-oil-donations-trump
National Audubon Society v. United States Department of the Interior, 3:20-cv00206, (D. Alaska Feb 17, 2026) ECF No. 134. https://www.courtlistener.com/ docket/17474998/134/national-audubon-society-v-united-states-departmentof-the-interior
“President Trump Signs Legislation to Unleash American Resources and Unlock Public Lands.” House Committee on Natural Resources, 11 Dec. 2025, naturalresources.house.gov/news/documentsingle.aspx?DocumentID=418511
Rosen, Yereth. 2026, February 5. “Feds Schedule First Lease Sale in Alaska’s National Petroleum Reserve since 2019.” Alaska Beacon. alaskabeacon.com/2026/02/05/ feds-schedule-first-lease-sale-in-alaskas-national-petroleum-reserve-since-2019
Stinchcomb, T.R., Brinkman, T.J., Fritz, S.A. 2019. A Review of Aircraft-Subsistence Harvester Conflict in Arctic Alaska. ARCTIC. 72(2):131-144. https://doi. org/10.14430/arctic68228
“Trans-Alaska Pipeline.” State of Alaska Geoportal. gis.data.alaska.gov/datasets/ SOA-DNR::trans-alaska-pipeline/explore?location=62.698268%2C149.414062%2C4
United States Department of the Interior. 2024, April 19. “Biden-Harris Administration Takes Critical Action to Protect Alaska Native Subsistence, Lands and Wildlife.” www.doi.gov/pressreleases/biden-harris-administration-takes-critical-actionprotect-alaska-native-subsistence
United States Congress, Bureau of Land Management. National Petroleum Reserve — Alaska. https://www.blm.gov/programs/energy-and-minerals/oil-and-gas/ about/alaska/NPR-A
World Population Review. 2026, February 25. “Oil Producing Countries 2026.” worldpopulationreview.com/country-rankings/oil-producing-countries
Wright, Michael C. 2023, March 13. Beaufort Sea Withdrawal NPR-A Special Areas. https://commons.wikimedia.org/wiki/File:Beaufort_Sea_Withdrawal_NPR-A_ Special_Areas.jpg
ENVIRONMENTAL COST OF A GREENER FUTURE
Callie Murakami, Aquatic & Fishery Sciences ‘26, and Alberto Castagnoli, Environmental Engineering ‘26
Coker, G. Personal interview. 13 February 2026
Farrell, J., Krishnan, A. 2024. 2022 Community Greenhouse Gas Emissions Inventory. Seattle Office of Sustainability & Environment.
Gallagher, J. 6 May 2019. “Moving forward: Lynnwood Link moves into construction”. The Platform. https://www.soundtransit.org/blog/platform/moving-forwardlynnwood-link-moves-construction
MacKenzie, D. Personal interview. 9 February 2026
Sound Transit. “System Expansion | Sound Transit.” Soundtransit.org. www. soundtransit.org/system-expansion
Sound Transit. “Our History.” Soundtransit.org. https://www.soundtransit.org/get-toknow-us/our-history
Sound Transit. 2025. 2024 Sustainability Progress Report. soundtransit.org
United States Department of Transportation, Federal Highway Administration. 2016. “FHWA - Center for Innovative Finance Support - Project Profiles.” https://www. fhwa.dot.gov/ipd/project_profiles/wa_sr520.aspx.
United States Department of Transportation, Federal Transit Administration. “The National Transit Database (NTD) | FTA.” Www.transit.dot.gov, www.transit.dot. gov/ntd
Washington State Department of Transportation. “SR 520 Bridge Replacement and HOV Program.” https://wsdot.wa.gov/construction-planning/major-projects/sr520-bridge-replacement-and-hov-program
FLOODING RESILIENCE: MITIGATION VERSUS RECOVERY IN WESTERN WASHINGTON
Synnove Price-Huish, Law Societies & Justice, Community Environment & Planning ‘26, and Xander Smith, Environmental Science & Resource Management ‘26
Alden, C. 2025, December 16. What we know so far about flooding damage in
Whatcom, Skagit. Cascadia Daily News. https://www.cascadiadaily.com/2025/ dec/16/what-we-know-about-flooding-damage-in-whatcom-skagit-so-far Atkins, D., Graff, A., Griffin, A. 2025, December 12. Record flooding forces rescues across western Washington. The New York Times. https://www.nytimes. com/2025/12/12/us/washington-flooding-rain-atmospheric-river.html
Goldstein-Street, J. 2026, February 17. Washington flood damage totals at least $182M, governor says. Washington State Standard. https:// washingtonstatestandard.com/2026/02/17/washington-flood-damage-totals-atleast-182m-governor-says
Hansen, K. 2025, December 12. Pacific moisture drenches the U.S. Northwest. NASA Earth Observatory. https://science.nasa.gov/earth/earth-observatory/pacificmoisture-drenches-the-u-s-northwest
Sanford, N. 2026, February 27. Volunteers face long road to flood recovery in Whatcom County. KNKX Public Radio. https://www.knkx.org/government/2026-02-27/ volunteers-face-long-road-to-flood-recovery-in-whatcom-county
Shea, S. B. 2020, March 10. Flooding the sky: Navigating the science of atmospheric rivers. U.S. Department of Energy. https://www.energy.gov/science/articles/ flooding-sky-navigating-science-atmospheric-rivers
Todd, A. 2025, December 13. A tale of two cities: Mount Vernon, Sumas face very different recovery efforts after historic flooding. Cascadia Daily News. https:// www.cascadiadaily.com/2025/dec/13/a-tale-of-two-cities-mount-vernon-sumasface-very-different-recovery-efforts-after-historic-flooding
USDA Climate Hubs. Atmospheric rivers in the Northwest. U.S. Department of Agriculture. https://www.climatehubs.usda.gov/hubs/northwest/topic/ atmospheric-rivers-northwest
Norris, J. 2026, January 6. Did record rainfall end Washington’s drought? Washington State Department of Ecology. https://ecology.wa.gov/blog/january-2026/didrecord-rainfall-end-washington-drought
Whitman, M. 2026, January 24. Mount Vernon’s floodwall a model for future flood protection. Cascadia Daily News. https://www.goskagit.com/news/local_news/ mount-vernons-floodwall-a-model-for-future-flood-protection/article_afffa4b810ad-494a-884f-30a3623b8871.html