INTRODUCTION
A ppen dix 1
STRATEGIC PILLARS
RESPONSIBLE INVESTMENT IN ACTION
LOOKING AHEAD
APPENDICES
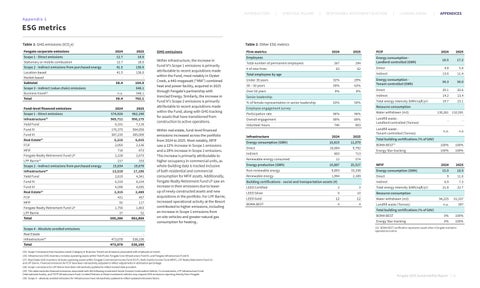
ESG metrics Table 1: GHG emissions (tCO2e)
Table 2: Other ESG metrics
Fengate corporate emissions
2024
2025
Scope 1 - Direct emissions Stationary or mobile combustion Scope 2 - Indirect emissions from purchased energy Location-based Market-based Subtotal Scope 3 - Indirect (value chain) emissions Business travel25 Total
12.7 12.7 41.5 41.5 58.4
18.0 18.0 136.0 136.0 154.0 548.1 548.1 702.1
Fund-level financed emissions Scope 1 - Direct emissions Infrastructure26 Yield Fund Fund IV Fund III Real Estate27 FCIF MFIF Fengate Realty Retirement Fund LP LPF Barrie28 Scope 2 - Indirect emissions from purchased energy Infrastructure29 Yield Fund Fund IV Fund III Real Estate29 FCIF MFIF Fengate Realty Retirement Fund LP LPF Barrie Total Scope 4 - Absolute avoided emissions Real Estate Infrastructure30 Total
n.a. 58.4 2024
2025
574,926 569,711 6,101 176,375 387,235 5,215 2,055 716 2,228 217 15,834 13,519 2,619 6,310 4,590 2,315 431 92 1,756 37 595,386
962,190 956,175 7,116 564,050 385,009 6,015 2,136 873 2,673 333 19,679 17,190 4,341 8,154 4,695 2,489 457 117 1,863 52 981,869
473,078 473,078
GHG emissions Within infrastructure, the increase in Fund IV’s Scope 1 emissions is primarily attributable to recent acquisitions made within the Fund, most notably in Oyster Creek, a 440-megawatt (“MW”) combined heat and power facility, acquired in 2025 through Fengate’s partnership with Ironclad Energy. Similarly, the increase in Fund IV’s Scope 2 emissions is primarily attributable to recent acquisitions made within the Fund, along with GHG tracking for assets that have transitioned from construction to active operations. Within real estate, fund-level financed emissions increased across the portfolio from 2024 to 2025. Most notably, MFIF saw a 22% increase in Scope 1 emissions and a 28% increase in Scope 2 emissions. This increase is primarily attributable to higher occupancy in commercial units, as whole-building data is tracked inclusive of both residential and commercial consumption for MFIF assets. Additionally, Fengate Realty Retirement Fund LP saw an increase in their emissions due to leaseup of newly constructed assets and new acquisitions in the portfolio. For LPF Barrie, increased operational activity at the Resort contributed to higher emissions, including an increase in Scope 1 emissions from on-site vehicles and greater natural gas consumption for heating..
538,190 538,190
(25) Scope 3 emissions from business travel (Category 6: Business Travel) are emissions associated with employee air travel. (26) Infrastructure GHG inventory includes operating assets within Yield Fund, Fengate Core Infrastructure Fund III, and Fengate Infrastructure Fund IV. (27) Real Estate GHG Inventory includes operating assets within Fengate Commercial Income Fund (FCIF), Multi-Family Income Fund (MFIF), LPF Realty Retirement Fund LP, and LPF Barrie. Financed emissions for FCIF have been retroactively adjusted to reflect adjustments in attribution percentage. (28) Scope 1 emissions for LPF Barrie have been retroactively updated to reflect revised data provided. (29) This table excludes financed emissions associated with the following investment funds: Everest Continuation Vehicle, Co-investments, LPF Infrastructure Fund (International Assets), and TCPP Infrastructure Fund. Limited Partners in these investment vehicles may request GHG emissions reporting directly from Fengate. (30) Scope 4 – absolute avoided emissions for infrastructure have retroactively updated to reflect updated emissions factor.
Firm metrics
2024
2025
FCIF
2024
2025
Total number of permanent employees
267
294
Energy consumption Landlord controlled (GWh)
18.5
17.2
# of new hires
63
62
Direct
4.8
5.8
Indirect
13.6
11.4
Energy consumption Tenant controlled (GWh)
34.3
34.0
Employees
Total employees by age Under 30 years
32%
29%
30 – 50 years
59%
63%
Over 50 years
9%
8%
Direct
20.1
20.6
Indirect
14.2
13.4
63%
50%
Total energy intensity (kWh/sqft/yr)
19.7
23.1
Participation rate
96%
96%
Water withdrawn (m3)
Overall engagement
90%
89%
-
-
Volunteer hours
740
803
Landfill waste Landlord controlled (Tonnes)
n.a.
n.a
Infrastructure
2024
2025
Landfill waste Tenant controlled (Tonnes)
Energy consumption (GWh)
10,819
11,079
Direct
10,004
9,792
BOMA BEST31
100%
100%
Indirect
803
713
Energy Star tracking
100%
100%
Senior leadership % of female representation in senior leadership Employee engagement survey
Renewable energy consumed
Resource consumption 130,261 132,591
Total building certifications (% of GAV)
12
574
Energy production (GWh)
10,887
35,527
MFIF
2024
2025
Non-renewable energy
8,893
33,338
Energy consumption (GWh)
15.9
18.9
Renewable energy
1,994
2,189
Direct
9
11.6
Indirect
6.9
7.3
21.8
22.7
Building certifications - social and transportation assets (#) LEED Certified
2
3
Total energy intensity (kWh/sqft/yr)
LEED Silver
9
10
Resource consumption
LEED Gold
12
12
Water withdrawn (m3)
94,225
91,337
BOMA BEST
4
4
Landfill waste (Tonnes)
n.a.
397
BOMA BEST
0%
100%
Energy Star tracking
0%
100%
Total building certifications (% of GAV)
(31) BOMA BEST certification represents assets wher e Fengate maintains operational control.
Fengate 2025 Sustainability Report
42