
10/27/25
Prepared for: Sample Company

10/27/25
Prepared for: Sample Company


Current Period: Jan 24 - Dec 24 (Paid)
Previous Period: Jan 23 - Dec 23

Current Period: Jan 24 - Dec 24 (Paid)
Previous Period: Jan 23 - Dec 23

Current Period: Jan 24 - Dec 24 (Paid)
Previous Period: Jan 23 - Dec 23

Current Period: Jan 24 - Dec 24 (Paid)
Previous Period: Jan 23 - Dec 23
Current Period: Jan 24 - Dec 24 (Paid)
Previous Period: Jan 23 - Dec 23

Current Period: Jan 24 - Dec 24 (Paid)
Previous Period: Jan 23 - Dec 23

Current Period: Jan 24 - Dec 24 (Paid)
Previous Period: Jan 23 - Dec 23
Current Period: Jan 24 - Dec 24 (Incurred)
Previous Period: Jan 23 - Dec 23

Current Period: Jan 24 - Dec 24 (Incurred)
Previous Period: Jan 23 - Dec 23
Current Period: Jan 24 - Dec 24 (N/A)
Previous Period: N/A
Error: Claims data not available for this cohort.
The widgets within the Executive Overview can be run on an incurred, paid or incurred and paid date basis and may behave differently based on the user’s selection.
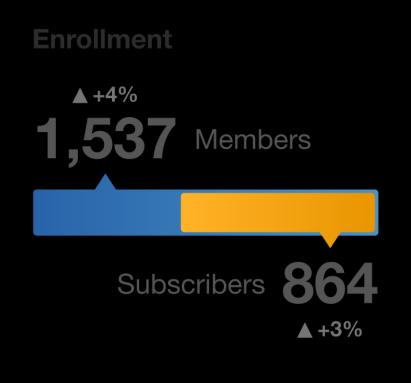
Enrollment: The average number of subscribers (employees) and members (all plan participants including employee, spouses and dependents) in the current period. This analysis can be run on either an incurred or a paid period. If the incurred and paid date basis is selected, only the months of overlap between the two date ranges will be shown.
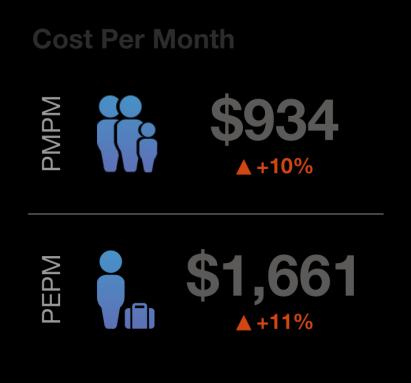
Cost Per Month: The amount of total claims paid by the employer on a per member per month (PMPM) and per employee per month (PEPM) basis. This analysis can be run on either an incurred or a paid period. If the date basis selected is incurred & paid, enrollment is calculated for the overlapping incurred and paid months. The dollars will reflect both the incurred and paid date filters.
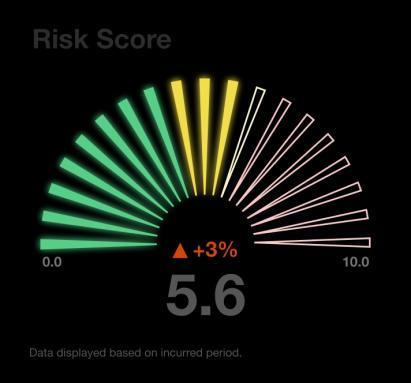
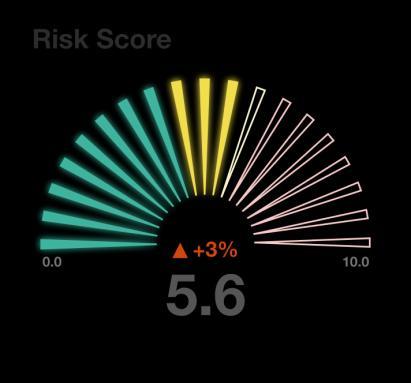
Risk Score: The average concurrent global risk score in the current period. This score is generated against the overall Innovu benchmark distribution which has an average of 5.0 (with lower scores indicating healthier populations and higher scores indicating the opposite.) This analysis can be run on an incurred period only. If the incurred and paid date basis is selected, the incurred date range will be used. If the paid date basis is selected, those dates will be handled as an incurred date range.
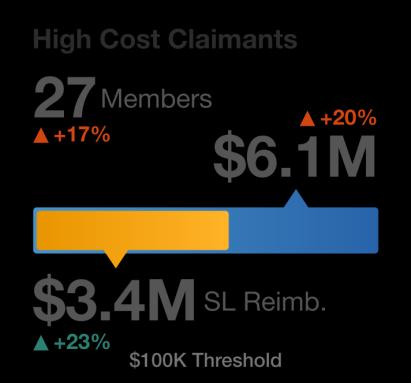
High Cost Claimants: The number of members whose total claim costs exceeded the specific stop loss deductible in the current period (which may not coincide with the stop loss plan year). The total amount spent on those members over the specific deductible, and the amount that should have been reimbursed by the stop loss provider based on that deductible. Note that the stop loss deductible is identified from the most recent policy within the selected period. For those clients with no available stop loss information or for cohorts comprised of multiple organizations, a stop loss deductible of $100K is used.
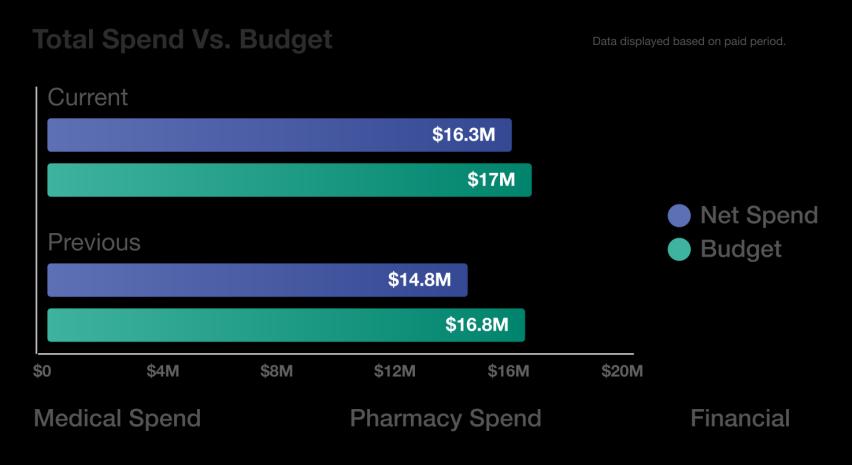
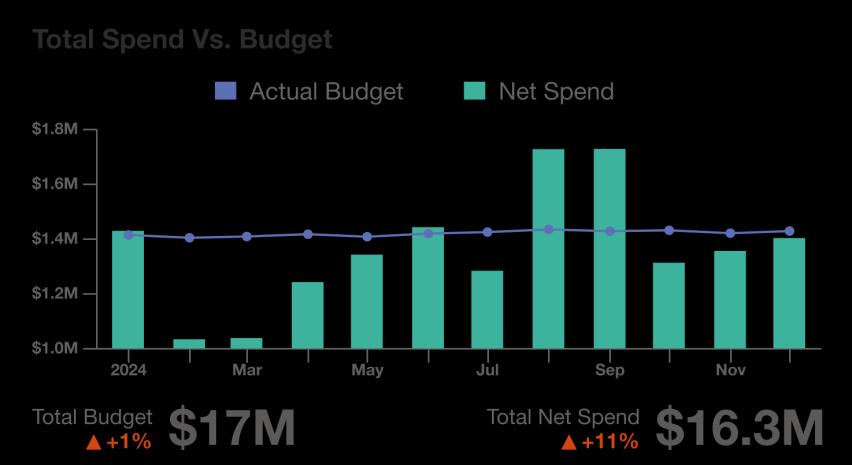
Total Spend vs Budget: Net spend is the total claim costs less any specific stop loss reimbursements, plus the retention fees (including ASO, account, disease management, telehealth, wellness, PEPM related Rx rebates, etc.) and the stop loss premium. Note: Stop loss reimbursements are determined using the available stop loss information, and may be a result of coverage from the current plan year and/or the previous plan year's run-out period. Rx rebates returned directly to the client are not included in the net spend calculation as these do not go through Innovu for tracking purposes. Budget is the sum of the coverage tier rates multiplied by the number of contracts for each coverage tier. Total Spend vs Budget can be run on a paid period only. If the incurred and paid date basis is selected, only the paid date range will be used, and if the incurred date basis is selected, those dates will be handled as a paid date range.
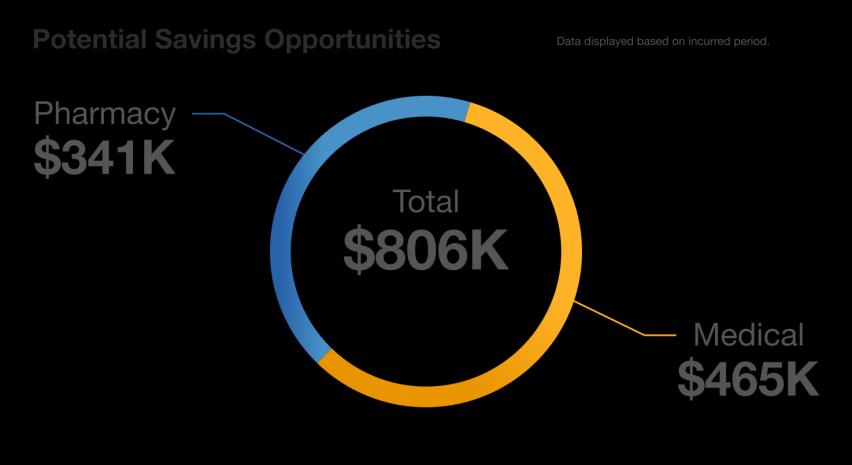
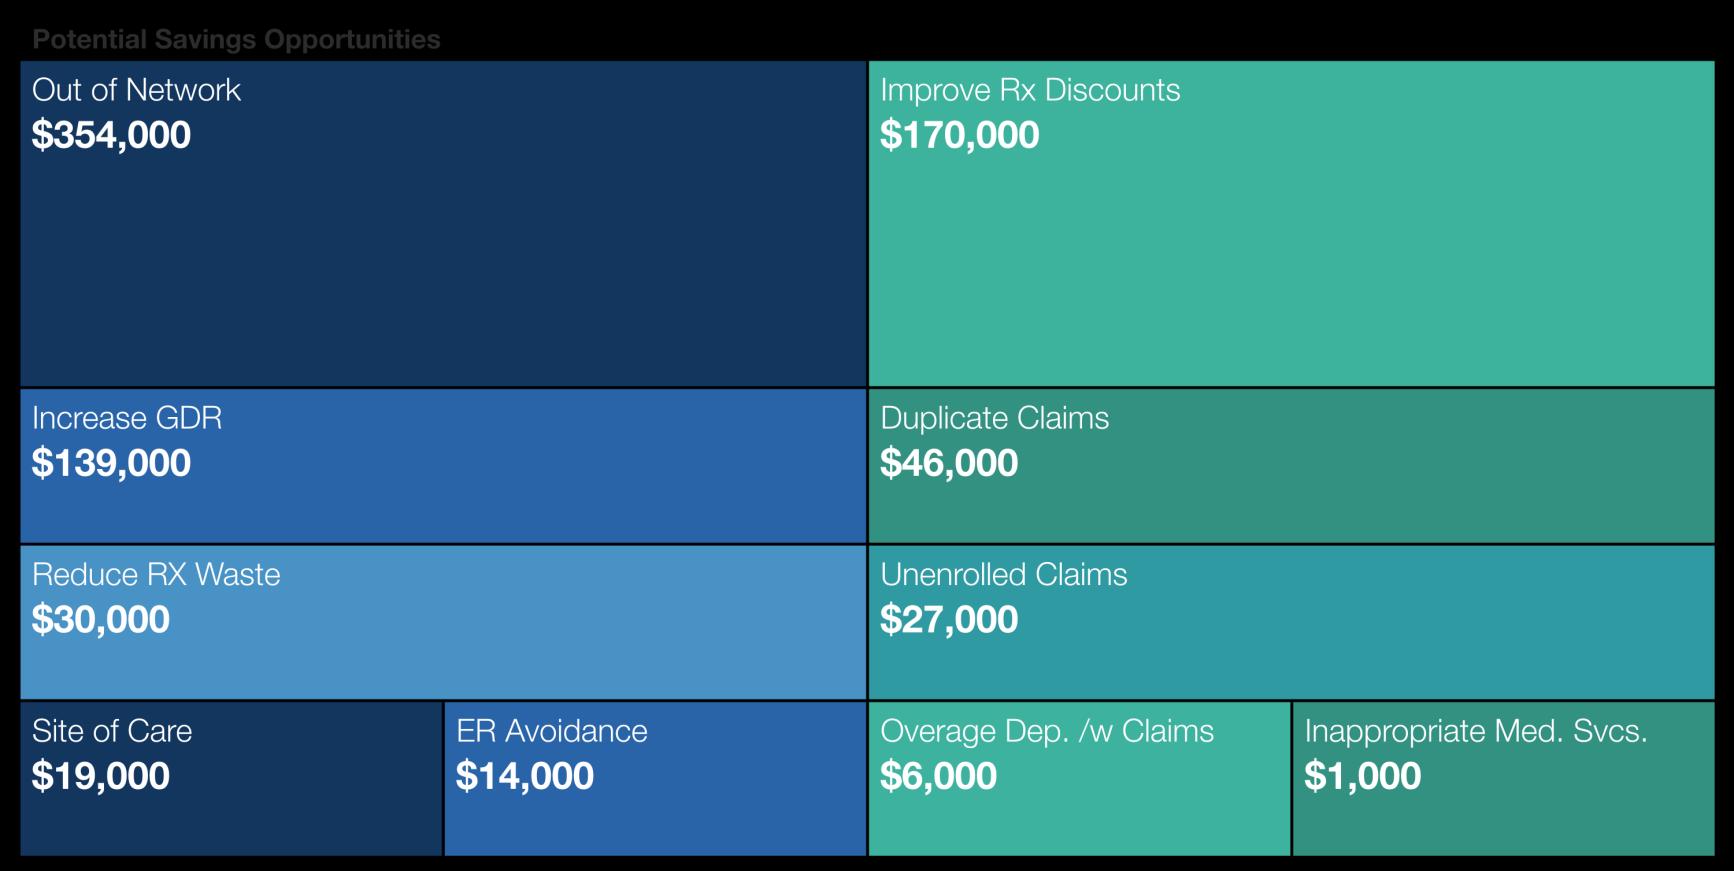
Potential Savings Opportunities: Potential savings opportunities come from the following list of topics: Generic Dispensing Rate (GDR) Increase, Unenrolled Claims, Reducing Rx Waste, Overage Dependents with Claims, Site of Care Migration, ER Avoidance, Out of Network, Overage Dependents with Claims, End Stage Renal Disease (ESRD), Inappropriate Medical Services, and Duplicated Claims. The estimates are based on the provider's allowed amount. This analysis can be run on an incurred period only. If the incurred and paid date basis is selected, only the incurred date range will be used, and if the paid date basis is selected, those dates will be handled as an incurred date range.
The Cost Per Month Overview can be run on an incurred, paid or an incurred & paid date basis. If the date basis selected is incurred & paid, enrollment is calculated for the overlapping incurred and paid months. The dollars will reflect both the incurred and paid date filters.
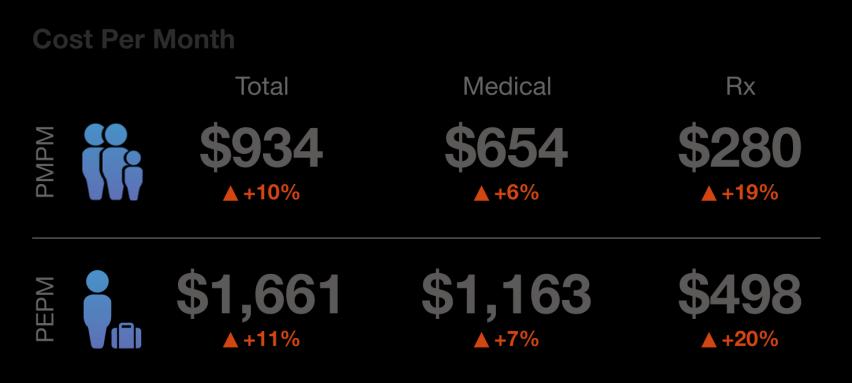
Cost Per Month: The amount of total claims paid by the employer on a per member per month (PMPM) and per employee per month (PEPM) basis.
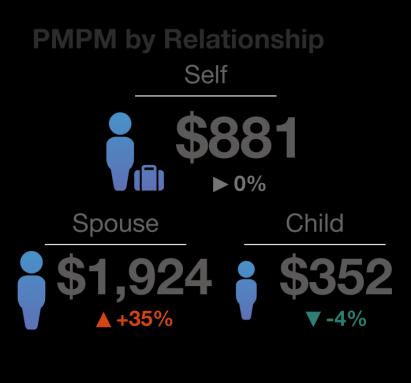
PMPM by Relationship: The amount of total claims paid by the employer on a per member per month (PMPM) basis broken out by relationship to the employee (Self, Spouse or Child). Members whose relationship is unknown are excluded.
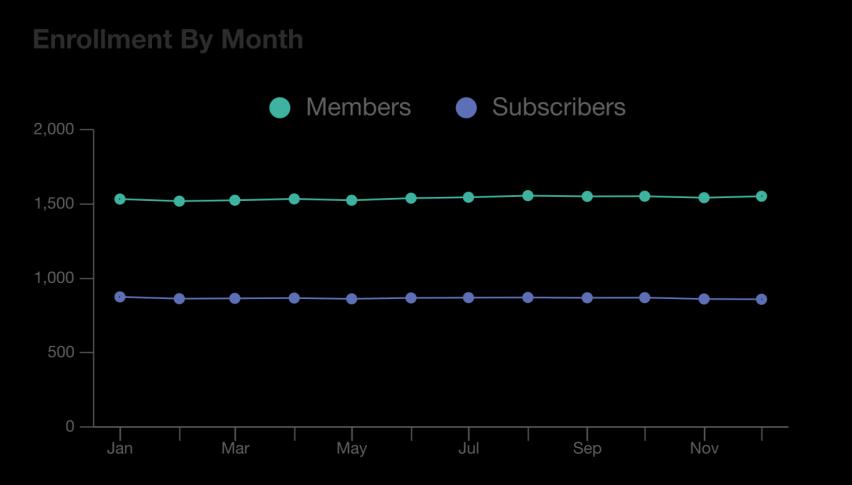
Enrollment: The average number of subscribers (employees) and members (all plan participants including employee, spouses and dependents) enrolled in the current period.
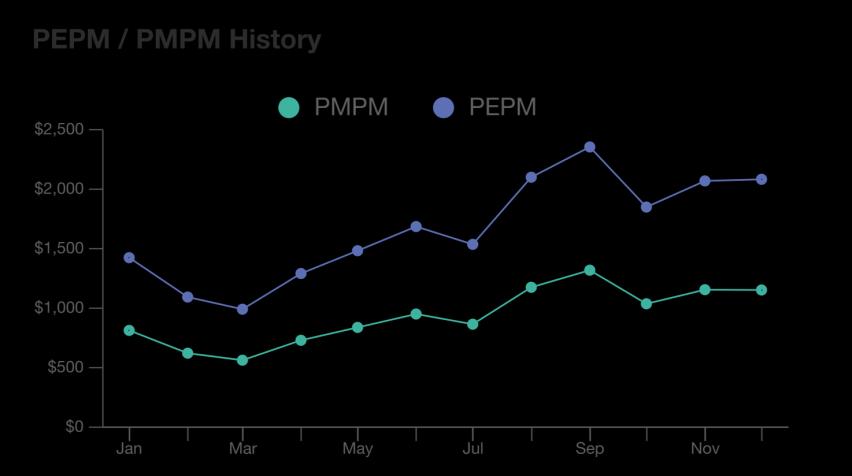
PEPM / PMPM History: The amount of total claims paid by the employer on a per member per month (PMPM) and per employee per month (PEPM) basis over the selected current period.
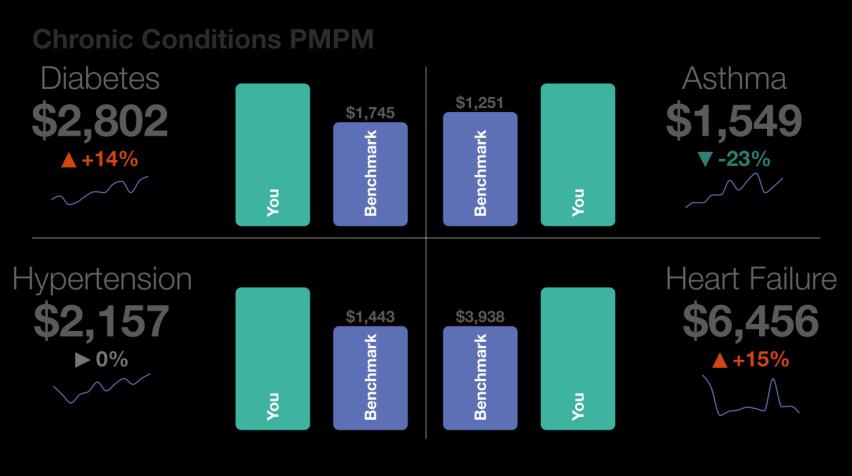
Chronic Conditions PMPM: The amount of total claims paid by the employer on a per member per month (PMPM) basis for members identified as having Diabetes, Asthma, Hypertension or Heart Failure compared against Innovu's aggregated dataset. Chronic conditions are assigned to each member monthly based on a diagnosis or a prescription in the recent medical history. (The PMPM includes all claims for the member with the identified condition, not just the claims for the condition.)
The Enrollment Overview can be run on an incurred, paid or an incurred and paid date basis. If the date basis selected is incurred and paid only the overlapping incurred and paid months will be displayed.
Enrollment: The average number of subscribers (employees) and members (all plan participants including employee, spouses and dependents) enrolled in the current period.
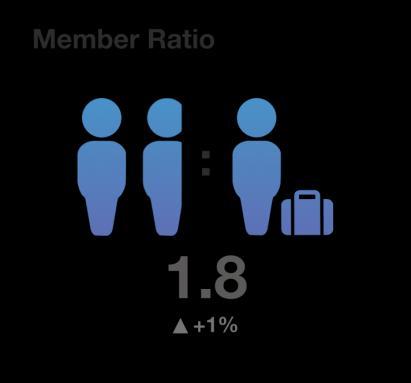
Member Ratio: The ratio of the average number of members to the average number of subscribers in the current period.
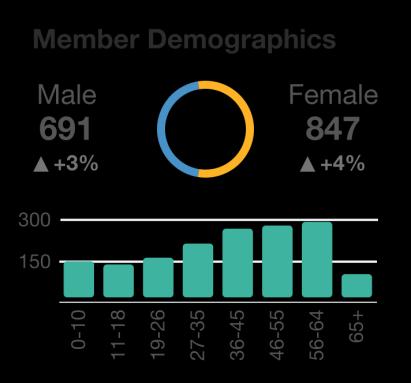
Member Demographics: Age Distribution is the average number of members per age group in the current period. Members whose age is unknown are excluded. Gender Distribution is the average number of members by gender in the current period. Members whose gender is unknown are excluded.
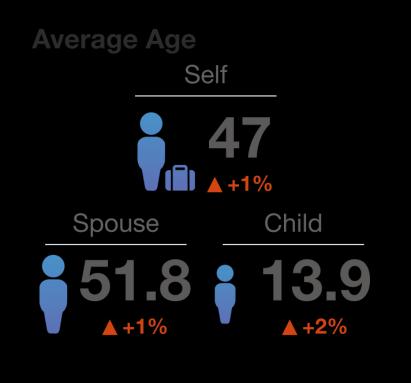
Average Age: The average age of the subscribers, spouses, and dependents in the current period. Members whose relationship to the subscriber is unknown are excluded.
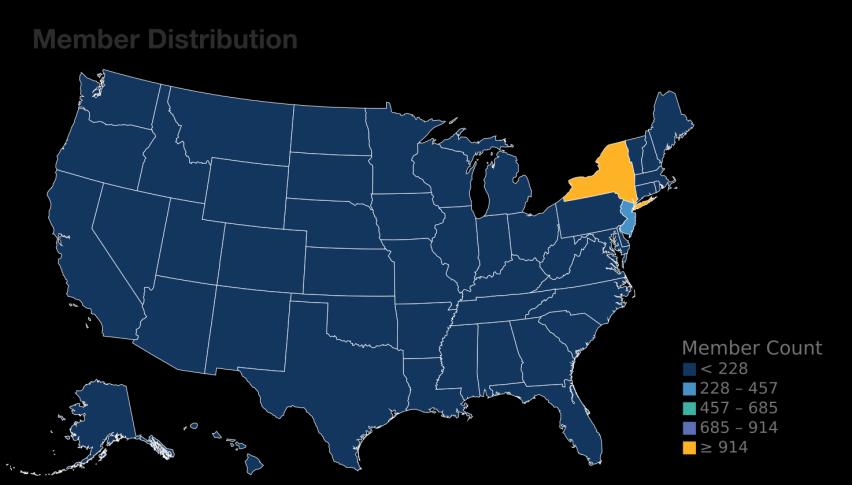
Member Distribution: The average number of members per state in the current period. Members whose home state is unknown are excluded.
Enrollment by Month: The average number of subscribers and members per month in the current period.
The Financial Overview can be run on a paid basis only.
Total Spend vs Budget: Net spend is the total claim costs less any specific stop loss reimbursements, plus the retention fees (including ASO, account, disease management, telehealth, wellness, PEPM related Rx rebates, etc.) and the stop loss premium. Note: Stop loss reimbursements are determined using the available stop loss information, and may be a result of coverage from the current plan year and/or the previous plan year's run-out period. Rx rebates returned directly to the client are not included in the net spend calculation as these do not go through Innovu for tracking purposes. Budget is the sum of the coverage tier rates multiplied by the number of contracts for each coverage tier.
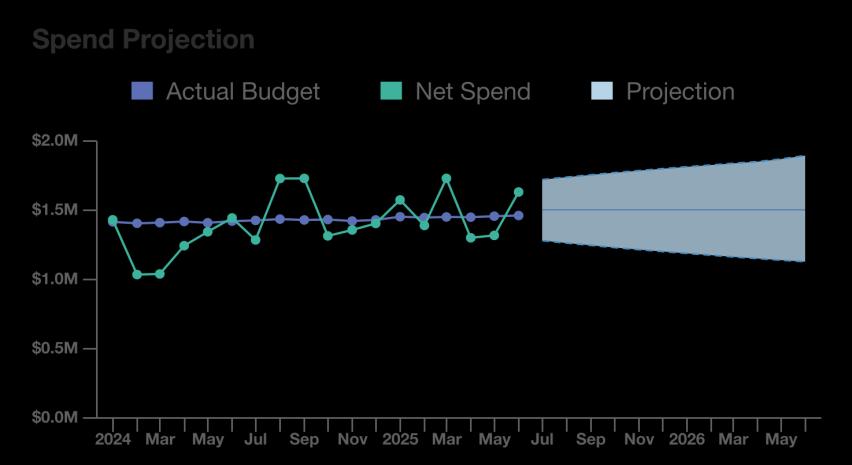
Spend Projection: Projected 12-months of net spend (total claims and retention less stop loss reimbursements). Forecast is generated using organization’s entire data history and an ensemble of 8 predictive models. The forecast line represents the median of the models and the shaded area is the median 80th and 20th percentiles.
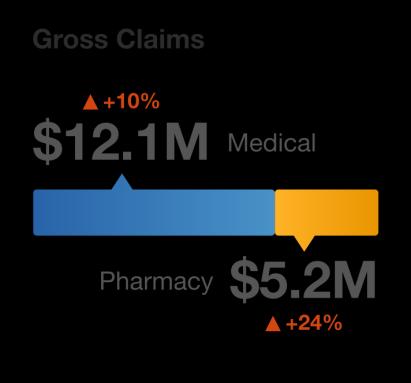
Gross Claims: The amount of total claims paid by the employer prior to stop loss reimbursements.
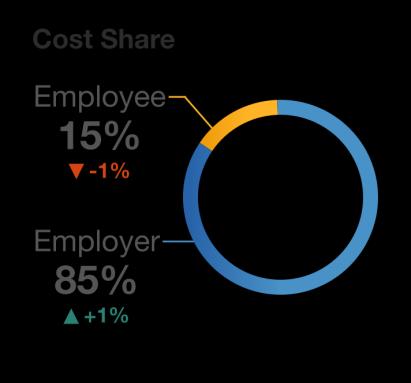
Cost Share: Allowed claims represent the amount that the vendor has determined as appropriate through their claim adjudication process which takes into account items like plan design, provider discounts, erroneous charges, Reasonable & Customary (R&C) charge considerations, etc. (Note, amounts to be determined as excess of Allowed claims are not reported to or captured by Innovu.) The Allowed claims can be broken down as: Employer Portion = The amount of total claims paid by the employer less any stop loss reimbursements, Employee Portion (Member Liability) = The out-of-pocket claims paid by the employee. If a vendor does not provide allowed amounts and the allowed amount cannot be estimated from the employer-paid amount and member liability, this box will not populate.
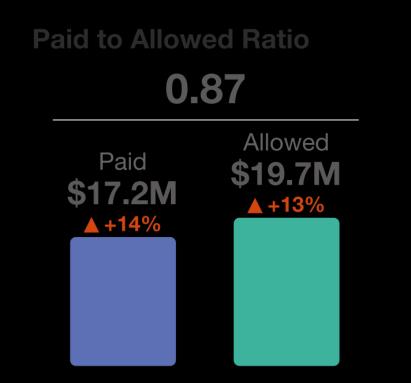
Paid to Allowed Ratio: The amount of total claims paid by the employer prior to stop loss reimbursements compared to the allowed claims.
High Cost Claimants: Summary of high cost claimants reflects: the number of members whose total claim costs exceeded the specific stop loss deductible in the current period (which may not coincide with the stop loss plan year), the total amount spent on those members over the specific deductible, the amount that should have been reimbursed by the stop loss provider based on that deductible. Note that the stop loss deductible is identified from the most recent policy within the selected period. For those clients with no available stop loss information or for cohorts comprised of multiple organizations, a stop loss deductible of $100K is used.
The High Cost Claimants Overview can be run on an incurred, paid or incurred and paid date basis. Note that the stop loss deductible is identified from the most recent policy within the selected period. For those clients with no available stop loss information or for cohorts comprised of multiple organizations, a limit of $100K is used.
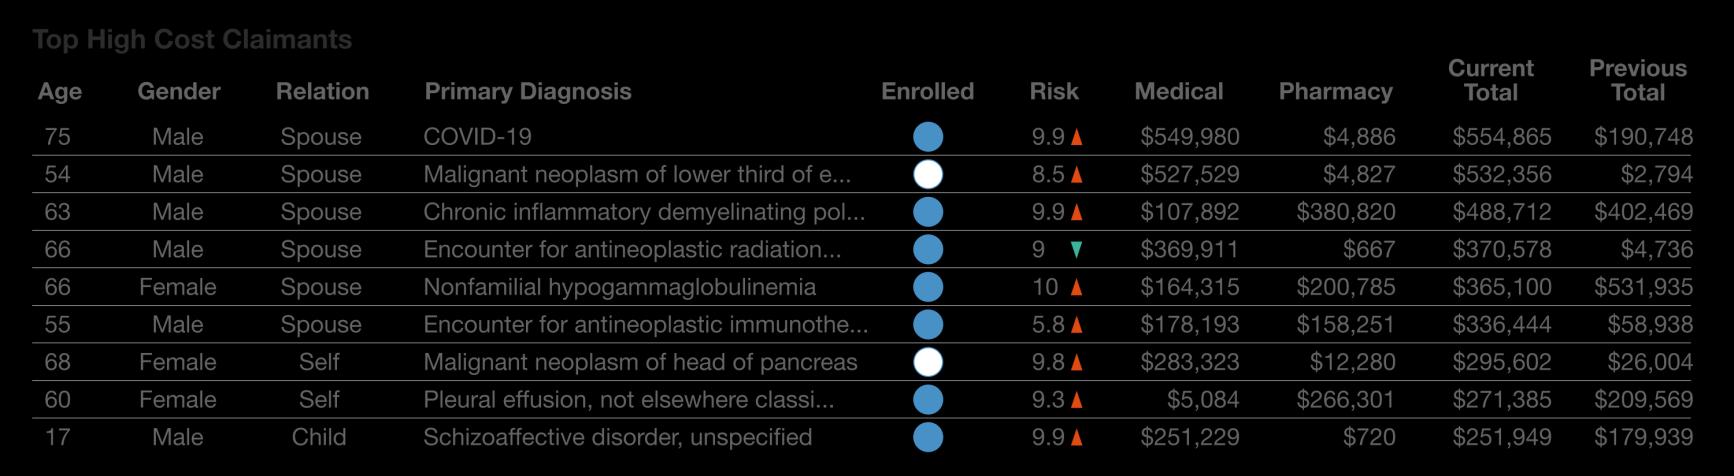
Top High Cost Claimants: Summary of the 9 members with the highest claim costs in the current period, including the primary diagnosis associated with the majority of costs, the enrollment status as of the last month of the current period, and the average concurrent global risk score.
High Cost Claimants: Summary of high cost claimants reflects: the number of members whose total claim costs exceeded the specific stop loss deductible in the current period (which may not coincide with the stop loss plan year), the total amount spent on those members over the specific deductible and, the amount that should have been reimbursed by the stop loss provider based on that deductible. Note that the stop loss deductible is identified from the most recent policy within the selected period.
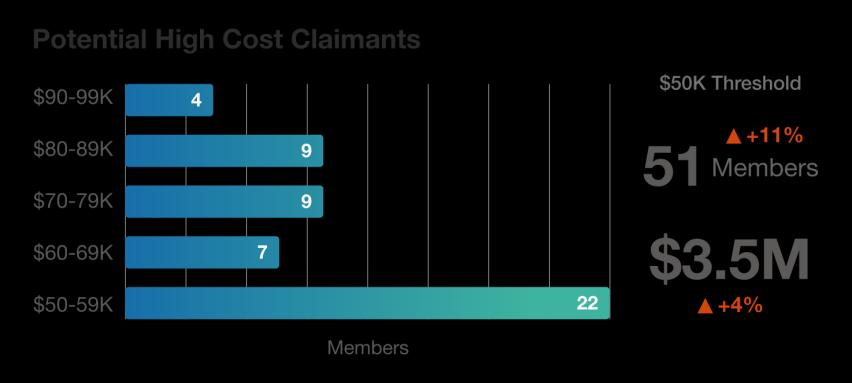
Potential High Cost Claimants: Summary of potential high cost claimants reflects: number of members costing between 50% and 100% of the specific stop loss deductible, total amount spent on those members during the period, distribution of those members across spending "ranges". Please note that the stop loss deductible is identified from the most recent policy within the selected period.
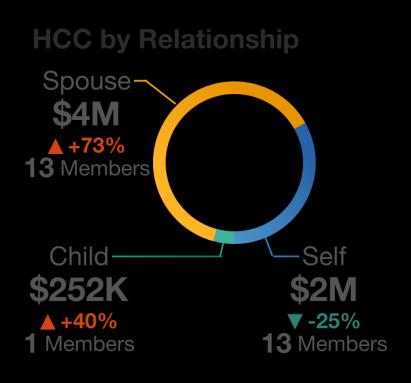
HCC by Relationship: The number of the subscribers, spouses, and dependents whose total claim costs exceeded the specific stop loss deductible in the current period and the total amount spent on those members.
The Medical Overview can be run on an incurred, paid or incurred and paid date basis.
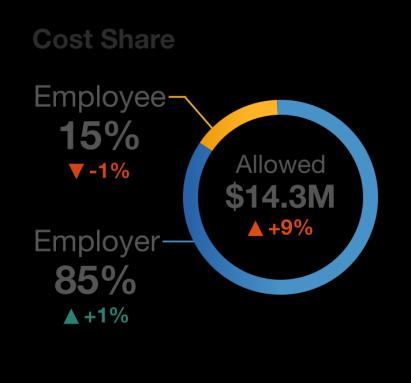
Cost Share: Allowed claims represent the amount that the vendor has determined as appropriate through their claim adjudication process which takes into account items like plan design, provider discounts, erroneous charges, Reasonable and Customary (RandC) charge considerations, etc. (Note, amounts to be determined as excess of Allowed claims are not reported to or captured by Innovu.) The Allowed claims can be broken down as: Employer Portion = The amount of total claims paid by the employer, Employee Portion (Member Liability) = The out-of-pocket claims paid by the employee. If a vendor does not provide allowed amounts and the allowed amount cannot be estimated from the employer-paid amount and member liability, this box will not populate.
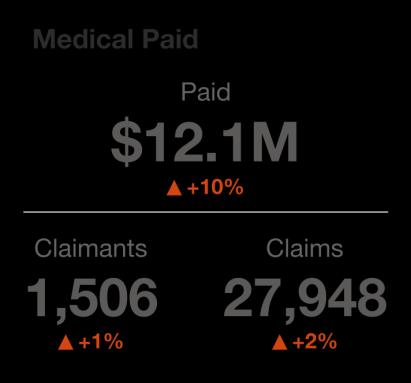
Medical Paid: The amount of medical claims paid by the employer, as well as the total number of claimants and claims. Note that all claims are counted, which can include adjustments and voids depending on the vendor.
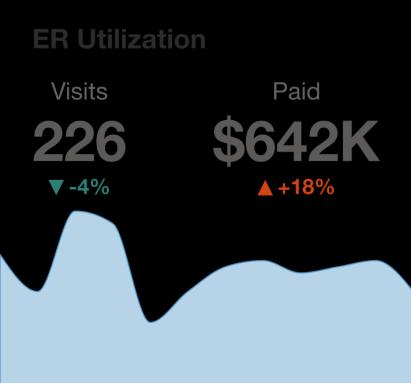
ER Utilization: ER Visits is the total number of unique member and service date combinations flagged as "Emergency Room" in the current period based on Revenue, Current Procedures Terminology (CPT) and Place of Service Codes. Emergency room visits that result in a hospital admission are excluded. ER Amount Paid is the total amount paid by the employer for services flagged as "Emergency Room". This will account for both the professional and technical portions of the ER visit, but may not include all of the ancillary procedures associated with the visit due to coding inconsistencies. Note that visits are associated with the most recent paid date.
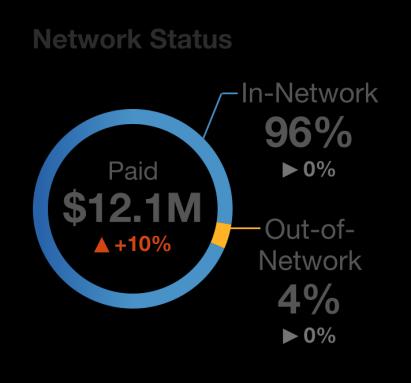
Network Status: The amount of claims paid by the employer and the percentage of this amount paid in-network and out-of-network as defined by the vendor. If the client does not have a network or if the vendor does not provide Innovu with a network indicator, the percentage of out-of-network claims will be 100%.
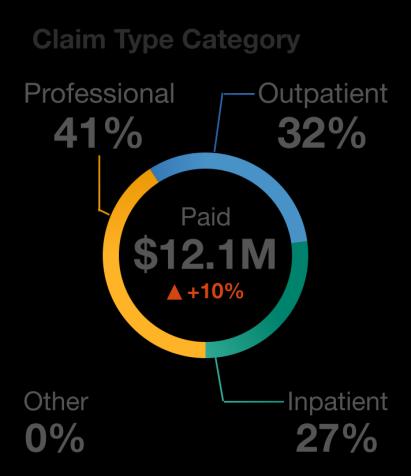
Claim Type Category: The amount paid by the employer for claims identified as Inpatient, Outpatient, Professional, or Other based on the vendor reported Claim Type Codes, as well as Place of Service, CPT, and Bill Type Codes.
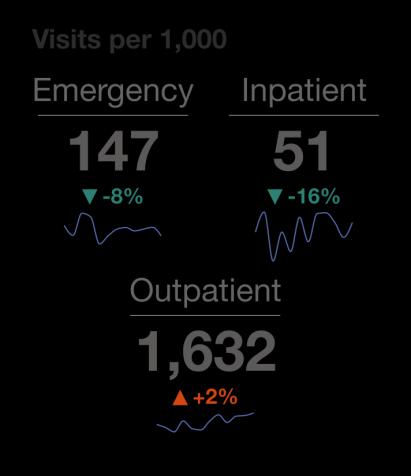
Visits per 1,000: The total number of unique member and service date combinations flagged as Emergency, Inpatient or Outpatient converted to the standard "per 1,000" measure for comparison. (Defined as the total visits divided by the total months of enrollment, multiplied by 12 months, multiplied by 1,000 members).
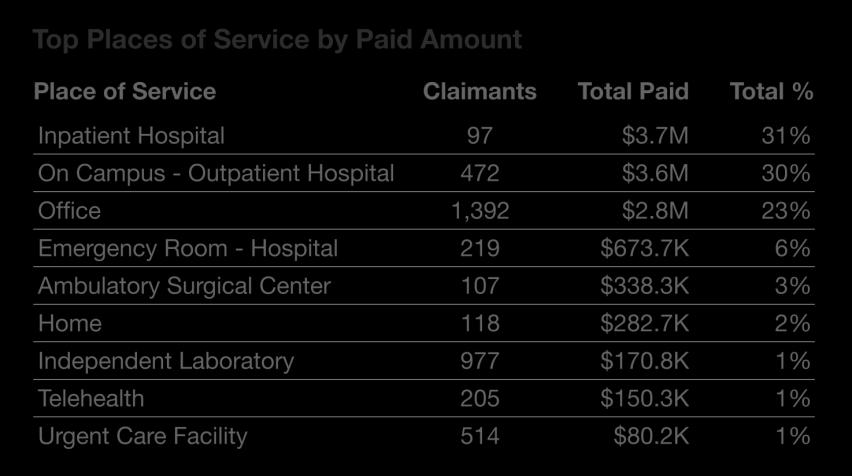
Top Places of Services by Paid Amount: Summary of the top 9 Place of Services based on the amount of total claims paid by the employer in the current period.
The Pharmacy Overview can be run on an incurred, paid or incurred and paid date basis. The analysis for (1) Brand vs. Generic and (2) Benchmark Paid per Quantity are limited to pharmacy claims billed under the prescription benefit with a date of service incurred on or after 1/1/2018.
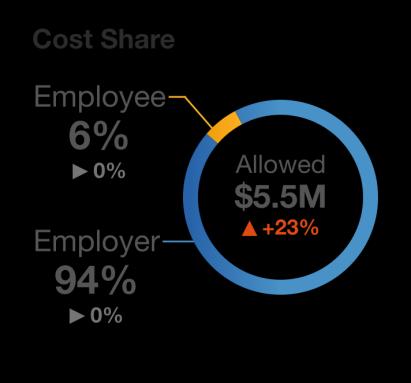
Cost Share: Allowed claims represent the amount that the vendor has determined as appropriate through their claim adjudication process which takes into account items like plan design, provider discounts, erroneous chargers, Reasonable and Customary (RandC) charge considerations, etc. (Note, amounts to be determined in excess of Allowed claims are not reported to or captured by Innovu.) The Allowed claims can be broken down as: Employer Portion = The amount of total claims paid by the employer, Employee Portion = The out-of-pocket claims paid by the employee. If a vendor does not provide allowed amounts and the allowed amount cannot be estimated from the employer-paid amount and member liability, this box will not populate.
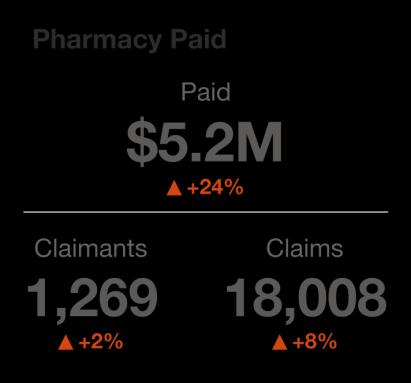
Pharmacy Paid: The amount of Rx claims paid by the employer, as well as the total number of claimants and claims. Note that all claims are counted, which may include adjustments and voids depending on the vendor.
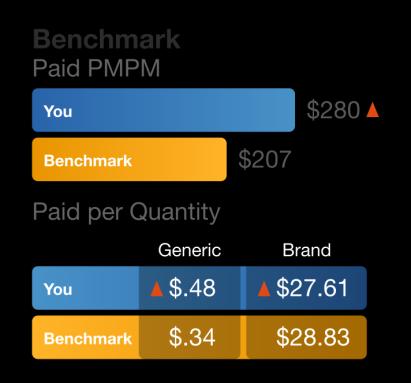
Benchmark: Cost per member per month is the amount of Rx claims paid by the employer on a per member per month (PMPM) basis compared against Innovu's aggregated dataset. Paid per quantity is the amount of Rx claims paid by the employer for brand and generic drugs per quantity dispensed compared against the Innovu benchmark.
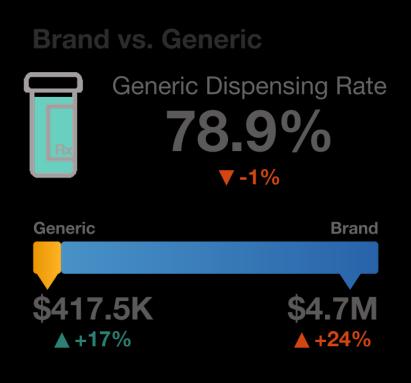
Brand vs. Generic: The Generic Dispensing Rate (GDR), calculated as the number of claims for a generic drugs divided by the total number of claims. Also shown is the breakdown of the amount paid by the employer split between generic and brand. Note, drugs that could not be identified as brand or generic such as Durable Medical Equipment (DME) supplies are excluded from these statistics.
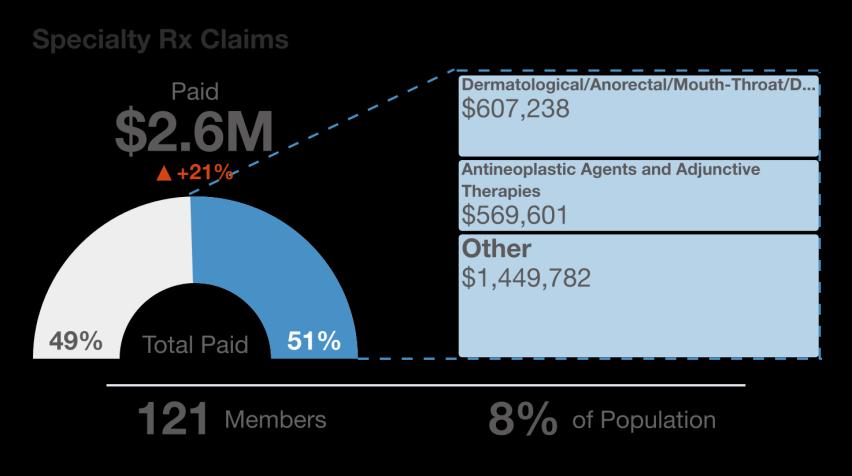
Specialty Rx Claims: Summary of specialty Rx claims broken down into: Total amount of claims paid by the employer for drugs on the Innovu-specialty drug list, Percentage of employer-paid claims for non-specialty versus specialty drugs, Total number of members taking specialty drugs (and the percentage against enrolled members). The percentage paid for specialty drugs is broken down into the actual employer-paid amount for the two most costly therapeutic class categories and all other categories.
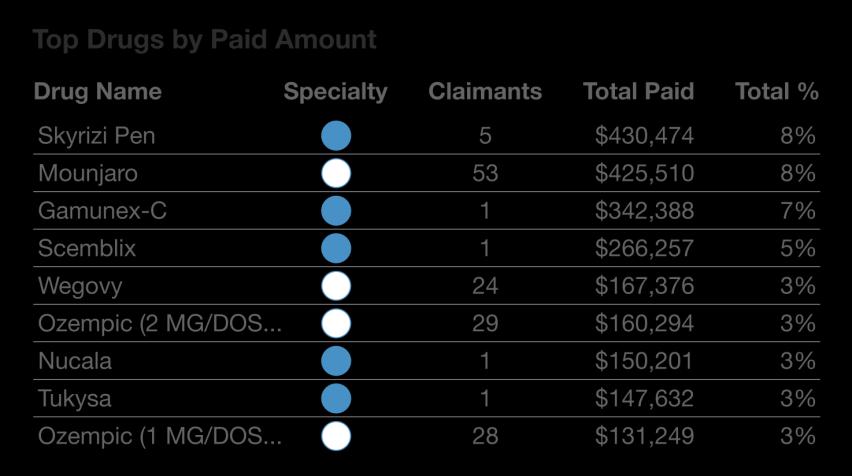
Top Drugs by Paid Amount: Summary of the top 9 drugs based on the amount of total claims paid by the employer in the current period.
The Potential Savings Opportunities Overview can be run on an incurred basis only. All potential savings opportunities are reported on an allowed cost basis. Pharmacy savings are limited to claims billed under the prescription benefit with a date of service incurred on or after 1/1/2018.
Duplicated Claims: Duplicate claims are identified, based on CMS guidelines, as claims with the same values for the following fields: Patient, Incurred date, Performing provider or Billing Provider, Procedure codes and modifiers, Place of service (Professional only), Type of service (Professional only), Bill Type Code (Facility only), Paid amount, submitted amount, or allowed amount
ER Avoidance: Estimate of medical savings from migrating Emergency Room (ER) visits to an Urgent Care setting based on the following migration assumptions based on severity level: 50% of Low Severity, 25% of Low to Moderate Severity, and 10% of Moderate Severity. A severity level is assigned to each ER visit according to the service code billed. If two different severity codes are identified for a member on the same visit, the CPT code that was paid more recently is reported, otherwise the one with the highest severity is reported. ER visits that result in an Inpatient admission are not considered.
ESRD: Total medical payments on dialysis claims for enrolled individuals diagnosed with End Stage Renal Disease (ESRD) in the last 12 months who have also received treatment in 30 of the last 35 months.
Improve Rx Discounts: Estimate of pharmacy savings from setting brand and generic discounts off the Average Wholesale Price (AWP) to the following levels based on Rx costs before rebates: Brand = AWP - 22%, Brand Specialty = AWP - 20%, Generic = AWP - 83%, and Generic Specialty = AWP - 83%. Individual prescription claim’s Brand or Generic status is derived from a combination of the Dispense as Written (DAW) codes provided on the claim and Medi-Span's multi-source descriptions attributed to the National Drug Code (NDC) at the time of dispensing, while specialty status is assigned based on a drugs membership on Innovu's list of Specialty Drugs.
Inappropriate Medical Services: Total medical payments for claims that include a service identified as inappropriate based on an enrolled individual's age or gender.
Increase GDR (Generic Dispensing Ratio): Estimate of pharmacy savings from a 1% increase in the Generic Dispensing Rate (GDR) based on applying a 2.5% decrease to total prescription drug costs. When GDR exceeds 90% the likelihood to further increase generic utilization is low and therefore the cost savings are assumed to be zero.
Out of Network: 30% of total medical claim payments to out-of-network providers. If a vendor does not provide an in-network indicator on claims, this box will not populate.
Overage Dependents with Claims: Total medical and pharmacy claim payments on enrolled dependents over the age of 26.
Reduce Rx Waste: Estimate of pharmacy savings from switching from higher to lower cost drug alternatives from a select list of drugs identified by Innovu that are targeted by intervention programs.
Site of Care: Estimate of medical savings from shifting 15% of radiology services and non-self-administered injectable drugs from an outpatient hospital setting to an office, independent laboratory, or in the case of injectables, home setting.
Unenrolled Claims: Total medical and pharmacy claim payments for individuals not included in the eligibility file for the month of service.
The Risk Overview can be run on an incurred basis only.
Risk Score: The average concurrent global risk score in the current period. This score is generated against the overall Innovu benchmark distribution which has an average of 5.0 (with lower scores indicating healthier populations and higher scores indicating the opposite).
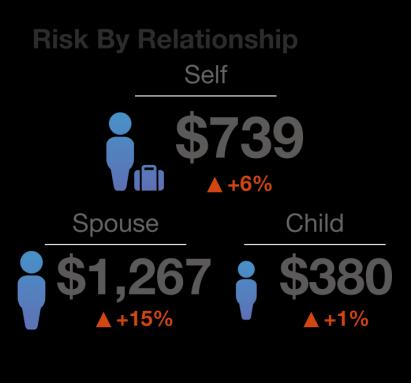
Risk by Relationship: Average current predicted risk expense broken down to subscriber, spouse, and dependent for the current period. Members whose relationship to the subscriber is unknown are excluded.
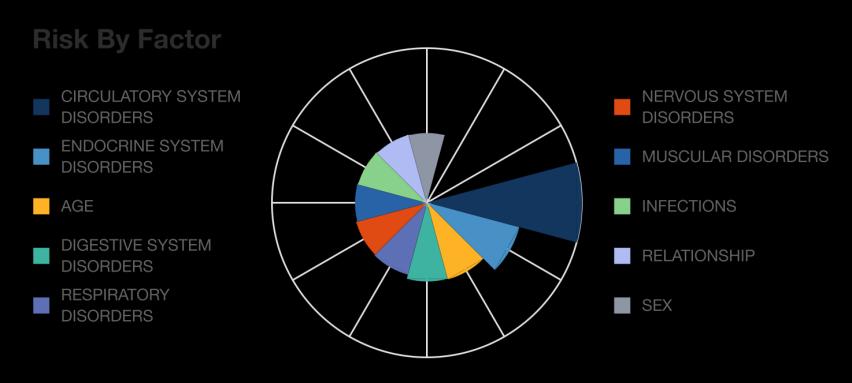
Risk by Factor: Summary of the top risk factors in the current period that are included in the determination of the risk score prediction for high risk members (members in the 95-100 percentile).
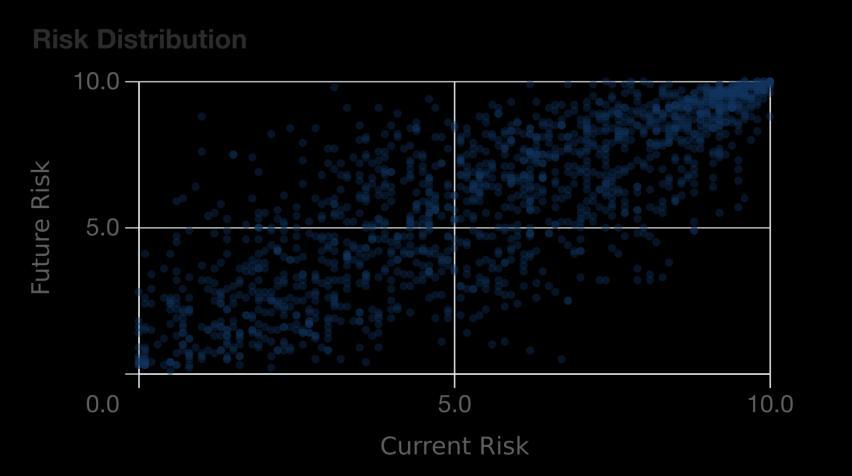
Risk Distribution: Average prospective global risk scores (Future) compared to the average concurrent global risk scores (Current) by individual member.
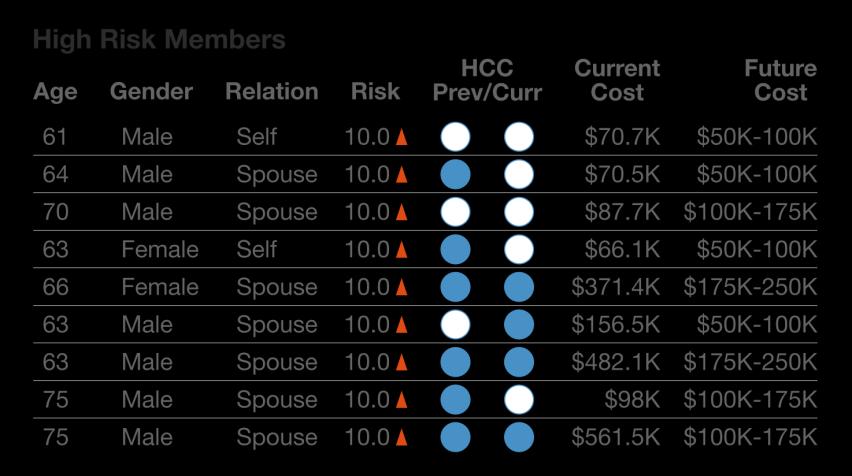
High Risk Members: Summary of the top 9 high risk members enrolled in the last month of the selected date range based on the average concurrent global risk score in the current period. For each member: demographic information, total amount allowed by the employer for those members for the 11 months prior to the last selected month (i.e., the current cost), members whose total claim costs exceed the specific stop loss deductible in the period (which may not coincide with the stop loss plan year) are flagged as a high cost claimant, and the expected allowed amount over the 12 months subsequent to the current period (i.e., the future cost). Note that the stop loss deductible is identified from the most recent policy within the selected period. For those clients with no available stop loss information or for cohorts comprised of multiple organizations, a stop loss deductible of $100K is used.
The Workers Compensation Overview can be run on an incurred basis only.
Total Incurred Claims: The amount paid by the employer for indemnity, medical treatment and expenses for injuries occurring during the current period or for claims that remain open. In the case of open or reopened claims, the reserve is also included in the total. The number of open/closed claims for members with an opioid prescription within the 90 days prior to the date of injury. If a vendor does not provide claimant status, this box will not populate.
Open Claims: The number of open or reopened workers' compensation claims in the current period. The amount paid by the employer on opened or reopened claims for indemnity, medical treatment and expenses compared to the amount set aside to cover the anticipated cost of these claims (reserve). If a vendor does not provide claimant status, this box will not populate.
Health Risk Score: The average concurrent global risk score for worker's compensation claimants who were either injured during the current period or have an open claim compared to employees who did not incur a worker's compensation claim (Non WC Claimants). The risk score is generated against the overall Innovu benchmark distribution which has an average of 5.0 (with lower scores indicating healthier populations and higher scores indicating the opposite). The average risk score is only reported if there are at least 3 worker's compensation claimants enrolled in the medical plan, and therefore having a risk score.
Medical & Rx PMPM: The amount of medical and pharmacy claims paid by the employer on a per member per month (PMPM) basis for workers' compensation claimants who were injured during the current period or have an open claim compared to employees who did not incur a worker's compensation claim (Non WC Claimants).
Last WC Claimants: Summary of workers' compensation claimants for the 8 most recent workplace injuries. For each member: Demographic information including member age at injury and gender, Tenure calculated as the period between the date of injury and the date of hire. Injuries within the first 90 days of employment may point to a need for the review of training procedures, and are highlighted in red, Days to Report (Rpt) calculated as the period between the date of injury and the date the employer was given notice of the injury. Injuries reported after 21 days in PA may not receive retroactive benefits, and are highlighted in red, State, Injury Description, High Cost Claimant (HCC) identified as a member whose total medical and Rx claim costs exceed the specific stop loss deductible in the period (which may not coincide with the stop loss plan year) are flagged. Note that the stop loss deductible is identified from the most recent policy within the selected period. For those clients with no available stop loss information or for cohorts comprised of multiple organizations, a stop loss deductible of $100K is used, Comorbidity defined as the concurrence of one or more of the following 12 chronic diseases: Diabetes, COPD, Hypertension, Heart Failure, Asthma, Rheumatoid Arthritis, Inflammatory Bowel Disease, Kidney Disease (not including ESRD), HIV/AIDS, Parkinson’s Disease, End Stage Renal Disease (ESRD), Sleep Apnea, ER Visit 30 days prior to the injury or 14 days after the injury, Enrollment status as of the last month of the current period, The average concurrent global risk score in the current period, Closed WC claim Indicator, Total Incurred represents the amount paid by the employer for indemnity, medical treatment, and expenses. In the case of an open or reopened claim, the reserve is also included.