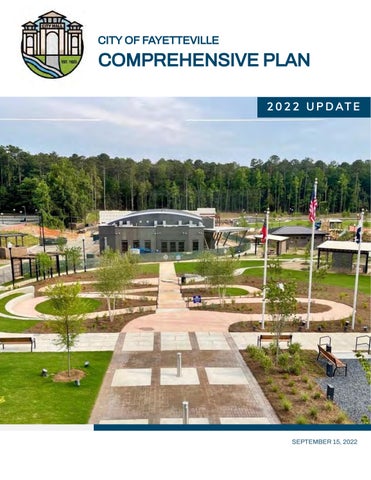
CITY OF FAYETTEVILLE
COMPREHENSIVE PLAN 2 0 2 2 U P D AT E
SEPTEMBER 15, 2022
Comprehensive Plan Advisory Committee (CPC) Mayor & City Council
Steering Committee
Edward Johnson, Mayor
Sarah Murphy, Local Resident/Planning Commission Chair /Downtown Development Authority (DDA)
Joe Clark, Mayor Pro-Tem Kenneth Collins, Local Resident/Planning Commission Vice-Chairman Rich Hoffman, Council Member Darryl Langford, Council Member
Debi Renfroe , Local Resident/Planning Commission
Scott Stacy, Council Member
Toby Spencer , Local Resident/Teacher/Planning Commission
Niyah Glover, Council Member
City Staff
David Hilderbrandt, Local Resident/Planning Commission Jamie Wyatt, Downtown Development Authority (DDA) Dan Vano, Downtown Development Authority (DDA) /Business Community
Ray Gibson, City Manager David Rast, Director of Community Development Brian Wismer, Director of Economic Development Denise Brookins, Director, Planning and Zoning Julie Brown, Senior Planner
Sam Burch, Downtown Development Authority (DDA) Historian/Local Resident/Business Owner Nancy Musselwhite, Downtown Development Authority (DDA) Business Community Brandon Sherman, Downtown Development Authority (DDA)/Business Community
Nicole Gilbert, Planning Specialist Katherine Prickett, Planning Specialist Tony Whitley, GIS Analyst
City of Fayetteville Thank you to the residents of Fayetteville that provided input the throughout the planning process.
2
Table of Contents CHAPTER 1: INTRODUCTION PURPOSE OF THE PLAN
9
PLANNING HISTORY
10
CHAPTER 2: FAYETTEVILLE TODAY COMMUNITY PROFILE
13
DENSITY AND GROWTH
14
GROWTH AND DIVERSITY
15
REGIONAL COMPARISON
16
EDUCATION
17
TENURE AND HOUSING
18
TRANSPORTATION
19
FISCAL OUTLOOK
32
HOUSEHOLDS AND ECONOMIC MOBILITY
33
HOME VALUES
34
MAJOR INDUSTRIES AND OPTIMAL BUSINESS TARGETS
38
BROADBAND ELEMENT
39
CHAPTER 3: FAYETTEVILLE TOMORROW PUBLIC INPUT
47
VISION
54
GOALS AND POLICIES
56
COMMUNITY WORK PLAN AND ACCOMPLISHMENTS
65
CHAPTER 3: INTEGRATED LAND USE FRAMEWORK
75
LAND USE RECOMMENDATIONS
78
APPENDIX LEGAL NOTICE AND COMMUNITY SIGN IN SHEET
118
2022 HOUSING STUDY
128
2022 DOWNTOWN VISIONING STUDY
228
2021 LCI STUDY
249
FAYETTEVILLE’S CAPITAL IMPROVEMENTS ELEMENT
408
Transmittal Resolution
4
5
6
1 INTRODUCTION
7
About Fayetteville Today, more than 19,000 people call the City of Fayetteville “home”, and many thousands more shop, dine and work here. We are known for our overall high quality of life with high educational standards, low crime rate, and a great sense of community. As Fayetteville grows, and as more people desire to live, work, shop and play here, we are presented with the challenge of maintaining the high quality of life generations of families have come to expect. In response to this challenge, we will encourage smart, collaborative, and managed growth.
Work effectively
8
Purpose of the Plan The Comprehensive Plan is a community-based vision for future growth and development within the City of Fayetteville. The plan addresses land use, housing, economic development, transportation, parks and recreation, and natural resources, with a strong focus on how land is used, developed, and/or conserved. The City’s current Comprehensive Plan was adopted in 2017 and since that time, Fayetteville has experienced significant population growth and economic development. The 2022 Update builds on the previous plan and provides a five-year update as required by Georgia’s local planning rules centered around reevaluating key elements.
9
Planning History Implementation Plan The 2022 Update includes a review of the Community Work Program, which identifies projects and initiatives to assist in implementing the Community Goals. While the Comprehensive Plan as a whole incorporates policies and strategies for a 20-year planning period, the Community Work Program outlines specific implementation strategies in a 5-year timeframe. The Capital Improvements Element identifies capital investments the city intends to make in the next five years to facilitate achieving the city’s goals. Previous Plans
2017 Comprehensive Plan The 2017 Comprehensive Plan provided a road map for the city as it continues to grow and evolve. The comprehensive plan used different forms of public engagement and reflects the ideas, values, and desires of the community, aligning these with a range of plans, policies, and initiatives in place or underway in both Fayetteville and the wider region. Strategic Plan The Strategic Plan serves as a tool to help guide the community toward its desired outcomes. The plan is intended to be a living document, meaning it will be updated and amended as needed to reflect progress made, changing conditions in Fayetteville and the region, and the evolving needs of the community. The updated plan serves as a reinvigorated foundation for the city, establishing a comprehensive vision for the future, refreshed land use recommendations, and implementation recommendations to guide the city moving forward. 2021 LCI Study The 2021 LCI Study established a community-wide vision and plan for the downtown core. A part of the study evaluated previous planning documents and their recommendations for downtown development. The 2021 LCI study has served the city well and provided comprehensive analysis and recommendations for the downtown area's land use, zoning, and development regulations. 2022 Housing Study The 2022 housing study provided a demographic review, market demand data, and identify potential residential development opportunities in the city.
10
11
2 FAYETTEVILLE TODAY
12
Community Profile OVERVIEW
The City of Fayetteville is located in the center and serves as the county seat of Fayette County. Historically, Fayetteville was predominantly an agricultural area with sprawling homes on large lots. In recent years the city has worked to restore the historic streetscape and downtown charm while still welcoming new residents and businesses. Fayetteville captures estimated 17% of Fayette County's population, with a 2021 census population of 19,284 residing in 6,741 households. The population is fairly diverse across age, race, and income cohorts. While being historically more rural than suburban, recent development activity and housing market trends have fueled growth in Fayetteville.
19,284 Population
6,741 Number of Households Population By Age
12.88 Square Miles
40%
19%
1,365.1 People Per Square Mile 19%
2.60 Average Household Size
22%
Under 18 Years 22
18 to 34 Years 19
35 to 64 Years 40
65 and Over
19
13
Population Density DENSITY AND GROWTH PATTERNS Between 2010 and 2022 the population in downtown Fayetteville increased from 3,426 to 3,786 people per square mile, demonstrating a 10% increase in population density. Census statistics show the younger population has increased within the downtown core and the southern portion of the city, while the northern arc has experienced a decrease in the younger population. The shift in age is predominantly due to high-performing schools being located to the west and south of the City, close to Peachtree City and south of the City, as well as job opportunities for younger adults located to the west (Trilith Studios, the Town at Trilith and Piedmont Fayette Hospital) and manufacturing and light industrial-related jobs to the east and north. Since 2010, the census tracts encompassing Downtown Fayetteville have also identified a 10% increase in the 55+ age group, which is consistent with similar growth patterns in neighboring communities. For instance, Peachtree City to our west has experienced a significant increase in residents aged 55 and over, which bodes well as Fayetteville continues to provide opportunities for downsizing and senior living facilities.
POPULATION DENSITY MAPS (PER SQ. MILE) 2010
2022
14
Growth
& Diversity The median age in Fayetteville is 42, and population growth has been steady since 2010. Based on census-based estimates, the strongest growth will have occurred from 2010 – 2022, with an 18.2% population increase, or just over 1.5% per year.
40,000
30,000 Fayetteville Peachtree City
20,000
Tyrone
10,000 2010
2015
POPULATION GROWTH
Population growth over the last ten years has grown steadily in the 18-34 and 55-85+ age groups, with a steady increase in the Black/African American and Asian populations. These numbers point to a growing number of young singles and professionals as well as empty nesters and retirees, all of which will require a greater variety of housing products. Decreases in the 5-17 and 35-54 age groups indicates a decreasing number of younger families moving to the city.
2020
White
8,000
Black or African American American Indian and Alaska Native
6,000
Asian
4,000
Native Hawaiian and Other Pacific Islander
2,000
RACE DISTRIBUTION
10,000
Some other race Two or more races
2010
2015
2020
15
Regional Comparison Fayetteville is located in the Atlanta-Sandy Springs-Roswell Metropolitan Statistical Area (MSA). The Atlanta MSA encompasses 29 counties, with ten central counties belonging to the Atlanta Regional Commission (ARC) and forming the core of the MSA. Roughly 78% of the population of the MSA lives within this ten county core including Cherokee, Clayton, Cobb, DeKalb, Douglas, Fayette, Forsyth, Fulton, Gwinnett, Henry and Rockdale. Between 2000-2010 only 67% of all population growth within the MSA occurred within this ten county core. Since 2010 roughly 85% of all population growth within the MSA occurred in this ten county core as younger and older generations increasingly sought walkable neighborhoods both in urban and suburban areas. Fayette County had considerable growth from 2000 to 2010 with an annual growth rate of 1.6%. However, the story for the City of Fayetteville is more positive. From 2000-2010 population growth within Fayetteville outpaced many of the fastest growing counties in the MSA with a 3.6% annual growth. Since 2010 the city's growth rate is still strong and has outpaced all counties in the MSA except for Cherokee County with an annual growth rate of 1.7%
SQ MILES
% MSA
2020
% OF MSA
200010
201020
200010
201020
200010
2010-20
LAND / CAPTUR E RATIO
Cherokee County
422
4.80%
266620
4.50%
7244
5227
4.20%
2.20%
7.10%
5.20%
1.08
Clayton County
142
1.60%
297595
5.00%
2291
3817
0.90%
1.40%
2.20%
3.80%
2.36
Cobb County
339
3.90%
766149
12.80%
8033
7807
1.20%
1.10%
7.80%
7.80%
2.01
DeKalb County
268
3.10%
764382
12.80%
2603
7249
0.40%
1.00%
2.50%
7.30%
2.37
Douglas County
200
2.30%
144237
2.40%
4023
1183
3.70%
0.90%
3.90%
1.20%
0.52
Fayette Co. (exl. Fayetteville
44
0.50%
100237
1.70%
1051
962
1.20%
1.00%
1.00%
1.00%
1.9
City of Fayetteville
150
1.70%
18957
0.30%
480
301
3.60%
1.70%
0.50%
0.30%
0.18
Fulton Co. (excl. Atlanta)
394
4.50%
580420
9.70%
10079
8010
2.30%
1.50%
9.80%
8.00%
1.78
City of Atlanta
133
1.50%
486290
8.10%
378
6603
0.10%
1.50%
0.40%
6.60%
4.34
Gwinnett County
430
4.90%
957062
16.00%
21687
15174
3.20%
1.70%
21.20%
15.20%
3.08
Henry County
322
3.70%
240712
4.00%
8458
3679
5.50%
1.70%
8.30%
3.70%
1
Rockdale County
130
1.50%
93570
1.60%
1510
836
2.00%
0.90%
1.50%
0.80%
0.56
10-County ARC Core
2974
34.10%
4716231
78.80%
67837
86926
1.80%
2.00%
66.30%
87.30%
2.56
Exurban Counties
5739
65.90%
1267876
21.20%
34492
12700
3.50%
1.00%
33.70%
12.70%
0.19
MSA Total
8713
100.00 %
5984107
100.00%
102329
99626
2.20%
1.80%
100.00 %
100.00%
1
16
Education Concentrations of highly-educated residents and households are attractive to both office and retail employers. Prospective office tenants desire proximity to a highly-educated workforce. Retailers often use educational attainment levels as a key metric when determining site locations. Additionally, households with high educational attainment levels have shown to include higher income potential and are strong indicators of neighborhood stability. The northern and eastern portions of the city of Atlanta and the north metro suburbs have the highest concentrations of high educational attainment households in metro Atlanta. On the southside of Atlanta, Fayette County stands out, but a lack of high concentrations of educated households and workforce continues to limit major office growth and/or relocation. Nearly 40% of Fayetteville residents 25 years and over have obtained a Bachelor's degree or higher. Historically, college-educated individuals in Fayette County have been concentrated in the west and southwest near Peachtree City and Tyrone, but over the past few decades college-educated individuals have been pushing west, increasing the educational attainment in Fayetteville, and within Fayette County, as a whole.
EDUCATION ATTAINMENT IN FAYETTEVILLE Less Than High School
High School Grad or Higher
6.7%
95%
Education Attainment for Population 25 and Over
Bachelor's Degree or Higher
41% School Dropout Rate
7% 7% 24% 24% 98%
30% 30%
2%
24% 24% 15%
15%
Dropped Out
Less Than High School
High School
Some College
Bachelor's Degree
2
In School
98
* Civilian Population 16 to 19 Years
Post-grad
17
Tenure & Housing As of 2022, Fayetteville has 6,949 total housing units, the majority of which were constructed after 1991 and include single-family detached, townhomes, condominiums and apartments. Approximately 36% of all dwelling units were constructed in the 1990's. While more than 71% of all housing units within the city are owner-occupied, the recently completed Housing Study indicated a lack of product diversity, with an estimated 72% being conventional single-family detached structures. Statistics show a healthy rental vacancy rate typically hovers around 7-8%, while a healthy homeowner vacancy rate is much lower, at 2% or below. Of the city's 6,949 housing units, an estimated 97% are occupied, and 3% are vacant. Vacancy rates within the city are currently 2.7% for rental units and 0.2% for residential structures. When vacancy rates dip below 5%, studies show the demand for housing is outstripping the supply. Rental market vacancy rates in the 5-7% range show the market is providing adequate housing choices. Low rental vacancy rates can be harmful to communities because it can lead to unjustified rent increases, provide a disincentive for property owners to maintain facilities, and reduce the choice and opportunity for renters. Additionally, when rental vacancy rates fall below 5%, there is the possibility that rents will increase making some rental properties less affordable.
Total Housing Units
9%
Occupied Housing Units
33%
2% 5% 5% 5% 1% 0%
67%
72%
Owner Occupied 67%
1-unit, detached
72%
1-unit, attached
9%
2 units
2%
3 or 4 units
5%
5 to 9 units
5%
10 or more units
5%
Mobile home
1%
Boat, RV, van, etc.
0%
Renter Occupied 33%
18
Transportation Functional Classification The assessment of existing traffic patterns, access points, and conditions of the street network is an integral part of the Comprehensive Plan because land use and the street system are interdependent. Historically commercial establishments generate high traffic volumes and pursue locations along major thoroughfares with high traffic capacity and visibility. Industrial and warehousing operations generate heavy truck traffic and are typically located adjacent to similar uses. Office and industrial employment centers generate high peak hour volumes and require convenient routes to expressways. For example SR 85, SR 92, SR 314 and SR 54 have higher traffic volumes than other roads in the city and, therefore, provide more opportunity to capture a segment of the pass-by traffic. Conversely, the arrangement of land uses can influence traffic flow. Residents often desire convenient access to work and shopping but generally want safe, low-volume streets in their neighborhoods. A well-designed street system can safely accommodate a mix of traffic generated by each land use.
Street Functional Classifications Major Arterial Collector Local
19
Transportation Functional Classification
Street Functional Classifications Major Arterial
Neighborhoods
Collector Local
20
Transportation Access and Connection The city has an estimated 150 miles of streets, with limited connections where motorists can travel to other parts of the city without depending on major corridors. While limited connectivity discourages traffic on local streets, it also constraints residents from entering and departing their neighborhood. The city's road network is not comprised of the traditional grid pattern. Between the early 1950's to the 1990's, the street network began to shift from grid to traditional suburban street patterns when regulations focused on reducing and even eliminating through movements on many residential streets and having them take place on main arterials. The opportunities for pedestrian mobility or even bicycles are even more constrained. As the population increases, this could cause further conflict, congestion, and potential safety concerns among all road users.
1900's City of Fayetteville - 2022
1940's
1990's
21
Transportation Access and Connection Original Downtown Layout from the early 1820's
22
Transportation Traffic Volume Currently, the vast majority (81%) of city residents who are employed drive alone to work while 8% carpool, 0.5% use transit (bus or rail), and 8% work from home. Most households (98%) have at least one automobile. The average city resident takes 33 minutes on average to travel to work. The table below shows there are currently sixty-four (64) signalized intersections in the county with the majority located within Fayetteville along state routes. Even with the growth in population, traffic volumes on arterials has declined slightly. Further review should be conducted to confirm the decline is not related to the pandemic or other issues. Fayetteville moves forward by considering how streets are not only efficient, but safe for all users. Signalized Intersections
Jurisdiction
2020 Population Estimates
Land area in square miles, 2010
Number of Signalized Intersections
Fayetteville
18,957
10.89
25
Peachtree City
38,244
24.54
21
Tyrone
7,658
12.47
4
Fayette County
119,194
194.34
14
Average Annual Daily Traffic
30,000
30,800 30,100
31,600 30,400
29,200 28,000
25,000 23,400 22,600
24,000 22,800
22,100
20,000 2018
SR GA - 92
2019
SR GA- 54, East Lanier
SR GA- 54, West
2020
SR North GA - 85
23
Transportation Sidewalk Map The map below shows a rough estimate of the city sidewalk network in 2019. Overall, the city boasts good sidewalk coverage, but the pedestrian experience when traveling varies greatly and is dependent on factors such as: ▪ Traffic volume ▪ Sidewalk width and physical condition ▪ Quality of the sidewalk surface ▪ Obstructions
▪ The presence of landscaping and street furniture ▪ Public art ▪ Building frontages ▪ Neighboring use
24
Transportation Pedestrian and Walking Propensity In 2019 a walking propensity analysis was conducted as a part of the city's Master Path Plan. This quantitative analysis reviewed four factors to predict the most likely locations where people would walk if there were sidewalks. The four factors included: ▪ Existing Land Use ▪ School and Park Zones ▪ Intersection Density ▪ Pedestrian Crashes The analysis showed a strong walking demand in downtown Fayetteville which was due to commercial land uses, a grid street network with small blocks, and proximity to schools. Other high demand nodes include the intersection of SR 54 and Grady Avenue due to commercial and office land uses, proximity to Fayette County Alternative School and Spring Hill Elementary School, and the Meridian apartment development. The analysis did not include Trilith Studios or the Town at Trilith due to the fact this area was still under construction at the time the study was conducted.
25
Transportation Bicycle Comfort Index The Master Path Plan also evaluated existing streets throughout the city to determine how comfortable they were for biking. Among other factors, the Bicycle Comfort Index analyzed the speed and volume of automobile traffic. The index assumes that as travel speed the volume of traffic increase the road becomes less comfortable for cyclists. This map shows level of comfort by color. Roads in green are the most comfortable to ride on. Those yellow and orange are progressively more uncomfortable to ride on. Those in red are the most uncomfortable to ride on. The results show that almost all of longer routes are uncomfortable to ride a bicycle on. This illustrates a need for either on-rode or separated bicycle facilities to help facilitate bicycle mobility.
26
Transportation Previous Studies 2002 LCI Supplemental Study: The City of Fayetteville undertook an LCI Study in 2002 which identified a series of transportation improvements intended to improve connectivity and circulation within the downtown core. The LCI recommendations mainly focused on congestion relief strategies, safety improvements, and non-motorized travel alternatives. Specifically, the study recommended implementing intersection and traffic signal improvements along SR 85/Glynn Street between LaFayette Avenue and SR 54/Stonewall Avenue. The study also recommended safety improvements for SR 85/Glynn Street, namely the installation of medians. 2010 LCI Supplemental Study: The 2010 LCI Supplemental Study was an update to the 2002 LCI Study. Like the 2002 study, the 2010 LCI Supplemental addressed connectivity and circulation within Downtown Fayetteville. The LCI Supplemental placed an increased focused on walk-ability and access management. It also presented concept plans for: ▪ Extending Hillsdale Drive to SR 85/Glynn Street ▪ Extending Church Street to Kathy Avenue ▪ Intersection improvements at SR 92/Forrest Avenue at SR 85/Glynn Street ▪ Church Street at Kathy Avenue ▪ Hood Avenue at SR 92/Forrest Avenue Roundabout 2018 Master Path Plan Analysis In March of 2018, a community stakeholder meeting was conducted that focused on the Master Path Plan and the development of a county-wide network of sidewalks, side paths (bi-directionally multi-use path along side of roadways), greenway trails, and bicycle routes. This meeting brought a variety of community members from various backgrounds together in an effort to identify common community interests. Community desires for various locations for bicycle routes, pedestrian walkways, and golf cart facilities including sidepaths, greenway trails, shoulder bikeways, signed shared roadway, and sidewalks were discussed and cataloged. The meeting generated a significant amount of feedback for desired pathway connections. Common desired connection locations included a sidepath connections between Peachtree City and Fayetteville along Redwine Road, a sidepath on SR 54, and bicycle facilities on Bernhard Road and Brooks Woolsey Road. Common desired connection destinations include a regional trail connection in southern Peachtree City as well as connections to the Starr’s Mill school cluster as a starting point for the development of the Master Path Plan. The Master Path Plan includes design guidelines that cover the specifics of the path designs and how they should be constructed in relation to the existing environment. The Master Path Plan discusses a City Hall project that will update land-use, pedestrian transportation networks and traffic patterns within the downtown area, while at the same time being integrated with expansion efforts of paths and sidewalks throughout the city, including enhancing the network of streets connecting SR 54, SR 85, Beauregard Blvd, and Grady Avenue.
27
Transportation Previous Studies
“The Master Path Plan will connect population centers, schools, parks, commercial land use, and other recreational opportunities. The Master Path Plan will accommodate pedestrians, bicyclists, and golf cart users.”
28
Transportation Previous Studies 2021 LCI Study: This LCI study of the downtown area focused on implementation and hence featured a multi-disciplinary team that integrated urban planning & design, existing conditions, community engagement, market analysis, transportation, and zoning, in a collective vision for the Downtown Fayetteville study area. The transportation section reviewed operational characteristics, potential changes and improvements to the mobility network. The following frameworks recommendation were proposed: • Recognizes the physical constraints, context, and character of the surrounding built and natural environment. It recommends policies and projects that strengthen the pedestrian, bicycle, and vehicle transportation network • Defines ideal standards for Complete Streets in local areas. “Complete Streets” refer to the concept that roadways should be designed with all users in mind, not just motorists. These standards apply contextsensitive design approaches to roadway redesign that enable safe, convenient, and comfortable travel or access for users of all ages and abilities regardless of their mode of transportation. This effort will support walking and bicycling within Fayetteville. • Establish a Street Typology, the traditional functional classifications of streets provide a hierarchy that correlates traffic flow to land access. Traffic volume, speed, and level of service provide the basis for roadway design criteria. However, this classification system falls short in considering non-vehicular users of the public right-of-way (pedestrians, bicyclists, and transit) and is void of context for how the street impacts adjacent land uses and vice versa. • Advocates for (re)developing Fayetteville’s core transportation network to work for the city’s residents, businesses, and visitors. This requires flexibility in its design application and implementation so that mobility priorities and guidance for transportation investments are identified to improve resident’s quality of life and access to goods or services.
29
Transportation Previous Studies
30
Transportation Previous Studies 2019 Fayette Transportation Plan The 2019 Fayette Transportation Plan is Fayette County’s Comprehensive Transportation Plan (CTP) and identifies a set of short-term, intermediate, and long-range transportation system development opportunities. As it relates to the City of Fayetteville, the Fayette Transportation Plan primarily identifies the following policy changes recommendation: ▪ Veterans Parkway Overlay district that will encourage best practices in access management ▪ County-Wide Truck Route Ordinance restrictions through truck movements ▪ Refine Path Design Guidelines ▪ Sandy Creek Road Needs Assessment Additionally, the Fayette Transportation Plan lends support for the City of Fayetteville’s use of Special Purpose Local Option Sales Tax (SPLOST) program funding, and the development of the Fayetteville City Center. In 2017, in a county-wide referendum, Fayette County citizens voted to approve the 1% (or 1¢) SPLOST. The following is the status of the 2017 SPLOST transportation projects. Project
Number
Category
Fiscal Year
SPLOST Funds
Status
Quadrant 1 Area
3
Transportation
2018
$1,223,376
Completed
Quadrant 2 Area
3
Transportation
2019
$1,192,987
Completed
Quadrant 3 Area
3
Transportation
2020
$960,167
Completed
Quadrant 4 Area
3
Transportation
2020
$1,174,342
Completed
Transportation Master Plan- Multi- Use Paths
7
Transportation
2019
$75,000
Completed
S.R. 54 Multi-Use Bridge-Crossing
5
Transportation
2018
$600,000
In Design
Highway 85 Landscaped - Median
8
Transportation
2019
$75,000
In design
Downtown Master Plan- Road Engineering
6
Transportation
2018
$500,000
Underway
Redwine Rd/ Ramah Rd Roundabout
4
Transportation
2021
$1,200,000
From the comprehensive plan, previous studies, public input, and staff review, the following list of high priority projects were compiled. Some of the projects did not have identified funding sources. • Citywide – add sidewalks • SR 85 South –widen to four lanes • Work with GDOT and other stakeholders to make SR 54 and SR 85 in the downtown area safe and pedestrian friendly • Improve and add sidewalks citywide • Improve and update the multi-use path • Fayette Bypass -- complete • Citywide –create grid street network/connect neighborhoods • Hood Avenue – connect to Sandy Creek • Advocate for citywide – synchronize traffic signals • SR 85, SR 314, and Jeff Davis – improve flow, add safety improvements • City Center Engineering and Constructions • S.R. 54 Multi-Use Bridge-Crossing
31
Fiscal Outlook Fayetteville is well-positioned geographically to the City of Atlanta, Hartsfield-Jackson Atlanta International Airport and to I-85 and I-75 which makes it convenient for residents, business owners and industrial tenants to travel for business and/or pleasure. The city has a wealth of natural, cultural, historical, and commercial resources that provide an amenity for residents, a destination for tourists, and an attractive location for commercial business and industry. The unemployment rate within the city in 2022 is 3.7% which is a slight increase over 2020 (3.4%). Revenue continues to be steady in most sectors, while sectors affected by the pandemic (hotel/motel tax, excise tax and court-related revenue) have started to normalize. The financial position of the city continues to improve from the recent recession, with three years of positive growth in the tax digest. Most revenue sources are stabilizing and some are showing slight increases. The city continues to maintain adequate fund balances consistent with the reserve fund policy, while also monitoring of revenue and expenditures.
32
Households & Economic Mobility A household includes all the persons who occupy a housing unit as their usual place of residence. The 2021 census data indicates that Fayetteville has 6,741 households, with approximately 69% identified as owner-occupied. Of the owner-occupied households, 25% of the occupants earn less than $50,000 annually, 33% earn between $50-$100,000 annually, and 41% earn more than $100,000 annually. Most homeowners are married couples between the ages of 45-64 with a combined income exceeding $100,000. A growing number of single residents and those between the ages of 25-34 also purchasing homes in the city. In the rental-occupied households, 34% are occupied by residents earning less than $35,000 annually; 24% are occupied by residents earning between $50-$75,000 annually; and 29% are occupied by residents earning more than $75,000 annually. Statistics show that households earning less than $35,000 annually are likely renting due to income restrictions and a lack of affordable housing options. Statistics also show there is a growing number of renters who could afford to own but choose to rent. Within the city, rental-occupied households are split evenly amongst household type (singles, married couples, and other family) and age distribution (25-34, 35-44, and 45-54). In 2019 the average median income of residents in the downtown district was between $52,700-$83,500. Through the years there has been a steady increase in the average median income with concentrations of high-earning households within the western and southern portions of the city. This trend is consistent with the median income in unincorporated Fayette County which also shows a concentration of higher median income households to the west and south of the city. Typically these areas are occupied predominantly by families and/or empty nester homeowners who want to live close to one of the county school complexes.
33
Home Values Between 2018 and 2019 the median home value in Fayetteville increased 4.1% from $215,200 to $224,100, which was 0.93% less than the national average of $240,500. Within downtown Fayetteville home values have decreased 4% since 2010. On average the median home value within the city is 30% less than median home values within unincorporated Fayette County ($281,400). Home values not only vary within the city limits but also throughout the county depending on location and proximity to school complexes, other jurisdictions (Peachtree City, Tyrone, etc.) and larger lot sizes and open space available within the unincorporated county. This disparity can be attributed to a deficit of new housing being built within the city limits.
Median Value
Median Gross Rent
Median Year Structure Built
$224,100
$1,157
1996
Value Of Owner-Occupied Housing Units
Mortgage Status
5% 36%
5%
76%
39%
14%
76%
36% 39%
14% 6% 6% % %
24%
%
24%
% Under $100K
$100K to $200K
$200K to $300K
$300K to $400K
$400K to $500K
$500K to $1M
Without Mortgage 24%
With Mortgage
76%
Over $1M
34
Market Demand 2022 Housing Study Summary Recommended Market Rate For-Sale Residential Product Offerings (5 years) Product
Product Description
Lot Width
Demand
Garage Situation
Square Feet Range
Square Feet Range
Avg. SF
Typical Price Range
Typical Price Range
Average Price
Avg. $/SF
Entry Townhomes
2 - 3 Story Townhouse
18'-22'
136
Surface parked, or 12 car garage front loaded
1,600
2,200
1,900
$325,000
$395,000
$360,000
$189
Move-Up Town-homes
2 - 3 Story Townhouse
20' - 24'
40
Attached front &/or rear-loaded
2,000
2,600
2,300
$395,000
$475,000
$435,000
$189
Upgrade Town-homes
2 - 3 Story Townhouse
24'-28'
20
Attached front &/or rear-loaded
2,500
3,500
3,000
$475,000
$595,000
$535,000
$178
Small Lot Detached Villa
1.5-Story SFD
26'
90
Attached rear loaded
1,900
2,400
2,150
$370,000
$445,000
$407,500
$190
Small Lot Cottage
2-Story Cottage Product
40' x 150'
110
Attached rear loaded
2,400
3,200
2,800
$470,000
$595,000
$532,500
$190
Conventional SFD
Two-Story 34 BR product on average lot
55' - 70'
320
Two-car garage, front- loaded
2,000
2,900
2,450
$395,000
$535,000
$465,000
$190
Estate/ Rural SFD
Two-Story 4 6BR detached homes on larger lots
100'+
120
Side loaded, 2 or 3car garage
2,600
5,000
3,800
$520,000
$745,000
$632,500
$166
Source Data: 2022 Housing Market Study
Recommended Market Rate Rental Residential Product Offerings (5 years) Product Description
DU/Ac.
Demand
Home Square Feet
Home Square Feet
Avg. SF
Typical Rent Range
Typical Rent Range
Average Rent
Avg. $/SF
Rental Townhomes
1-2 Stories, garage or driveway parked
4-10
50
1,000
1,600
1,300
$1,600
$2,400
$2,000
$1.54
Garden Apartments
3-4 Stories, surface parked
10-30
700
1,300
900
$1,400
$2,000
$1,700
$1.89
Garden- Urban Apartments
3-4 Stories, surface parked, typically with elevators
40-60
600
1,200
800
$1,300
$2,000
$1,650
$2.06
Midrise Apartments
4-5 Stories, around or adjacent to structured parking
60-100
600
1,200
800
$1,200
$2,400
$1,800
$2.25
Product
55+ Apartments
Assisted Living
Rental SFD
3-4 Stories, surface parked, typically with elevators 3-4 Stories, surface parked, typically with elevators 1-2 Stories, garage parked
400
40-60
120
800
1,400
1,100
$1,600
$2,500
$2,050
$1.86
40-60
100
650
900
775
$3,000
$4,000
$3,500
$4.52
3-4
50
2,000
3,000
2,500
$2,000
$2,600
$2,300
$0.92
Source Data: 2022 Housing Market Study
35
Economic Development Workforce Population and Prominent Industries The city's proximity to I-85 and I-75 hinders the ability to market the city to larger industrial and/or office uses. In contrast both Newnan and Peachtree City have direct access to the interstate and established industrial parks which make them more marketable to industrial, manufacturing and logistics facilities. Fayetteville is situated to provide for a short commute to major employment centers within the southern crescent of metroAtlanta, including Hartsfield-Jackson International Airport, the Aerotropolis, as well as businesses and industries located within the I-85/I-75 corridors. As seen in workflow patterns, the majority of workers commuting to and from the city tend to live in the surrounding communities, work locally or commute from these areas into other employment centers. An estimated 14,310 people are employed within the city limits with approximately 41% earning more than $40,000 annually; 31% earning between $15-$40,000 annually; and 28% earning less than $15,000 annually. The majority of jobs paying more than $40,000 annually are in the healthcare or public administration fields. Of those individuals working within the city limits, an estimated 13,609 commute to work which indicates a potential shortage of housing options for those wanting to live and work within the city. Approximately 17% of people who work in the city live within a 4-mile radius of the city limits while another 12% within or close to Tyrone, Peachtree City and Jonesboro.
36
Top Employers Employment data managed by the city indicates the public sector employs a significant number of individuals who work within the city. While the public sector provides high quality jobs for residents, it does not directly add to the tax base of the city especially since these properties are tax-exempt.
Fayette County Board of Education
2,700
Fayette Hospital (Piedmont)
1,536
Fayette County Board of Commissioners
700
Wal-mart Stores, Inc
401
Kroger
332
Publix
304
Olive Garden
243
Trilith is responsible for an estimated 3,700 jobs, including those related to the 60-plus businesses located on site. Trilith's business ecosystem attracts investment capital, innovators, and entertainment-related businesses.
Chic-fil-a 178
City of Fayetteville 170
Concrete Supply Co 165 0
1,000
2,000
3,000
37
Economic Development Major Industries and Optimal Business Targets The latest census data shows the largest employment sectors within the city are educational services and healthcare, followed by transportation and arts/entertainment. Construction/manufacturing/warehouse jobs are primarily within the eastern and northern sectors while medical and technical jobs are primarily to the west. Most public sector and public administration jobs are concentrated downtown. The city's target industry sectors include small business, retail and film production support services, professional and corporate office users, computers and technology, and health services.
Educational services, and health care and social assistance
1,633
Arts, entertainment, and recreation, and accommodation and food services
931
Professional, scientific, and management, and administrative and waste management services
910
Manufacturing
712
Retail trade
687 554
Other services, except public administration Finance and insurance, and real estate and rental and leasing
484 453
Public administration
Construction
297
Information
289
Wholesale trade
WORKPLACE AREA CHARACTERISTICS
1,033
Transportation and warehousing, and utilities
132
Agriculture, forestry, fishing and hunting, and mining
500
1,000
1,500
38
Broadband Element Broadband is typically defined as a specific type of internet connection faster than non‐broadband internet, it uses wide bandwidth, and the service provides multiple signals at once. Bandwidth refers to the maximum rate at which an internet connection can transmit data. The Georgia Broadband Program defines an area as being served by broadband if at least 80% of locations within a census block have access to a fixed, terrestrial broadband provider with at least 25 megabits per second (Mbps) download speeds and 3 Mbps upload speeds. Critical Infrastructure like utilities, transportation facilities, and technology are essential to everyday business function and community growth. In 2018 the Georgia General Assembly amended the provisions of local planning in Georgia by passing the "Achieving Connectivity Everywhere (ACE) Act," intended to facilitate the enhancement and extension of high-speed internet access in communities that lack such infrastructure and the vast resources it provides. As the first step in planning for this critical, potentially catalytic infrastructure, the "Ace" Act requires all local governments to incorporate the "promotion of the deployment of broadband internet services" into their local plan. The map below shows that the city is well served with broadband service. Both the Federal Communications Commission and the Georgia Department of Community Affairs data indicate that citywide broadband service and high-speed internet coverage are available with several service providers. Also the latest American Community Survey (ACS) stated that 95 percent of households had a computer and 89 percent are served with broadband internet. Georgia Broadband Availability Map
95.7% Households with a computer, percent, 2016-2020
89 % Households with a broadband Internet subscription, percent, 2016-2020 Source: 2022 Georgia Broadband Availability Map https://broadband.georgia.gov/2022-georgia-broadband-availability-map
39
Value Per Acre Activity Centers are areas within the city that are currently or anticipated to become locations of significant commercial and/or mixed-use development. This 2022 Update identifies four major Activity Centers : Innovative Mixed Use (Trilith), Medical Complex (Piedmont Fayette), Downtown Core, and the 85 North Corridor (Fayette Pavilion). In 2020 the city commissioned Urban 3 to analyze property tax generation and value per acre trends within the city. The Value Per Acre Analysis (below) shows the two areas within the county that dominate the value per acre map - the taller purple spike represents Piedmont Fayette Hospital and the associated medical offices with the second purple spike represents Trilith Studios and the Town at Trilith. The Urban 3 analysis suggested that fiscally-healthy cities should have a downtown core that is six times as productive as the surrounding county. Downtown Fayetteville is about twice as productive as the rest of Fayette County. Medical offices around Piedmont Fayette Hospital and the construction near Trilith Studios are currently making up much of the difference. These more productive developments put Fayetteville in a position that allows the city to focus on growing the downtown.
40
Property Value & Land Use One of the primary funding sources for local governments is derived from property taxes and charges for services. Residential properties are the highest contributor in Fayetteville. A tax base that is balanced between commercial/industrial and residential uses will ensure reasonable property tax rates in the future.
Top Tax Value (Assessed Value) By Land Use 2012
$393,340,653 $341,459,925
$41,599,160 $10,903,338 Residential
Commercial
Industrial
$161,400 Agricultural
$8,054,235 Utility
Motor Vehicle
Top Tax Value (Assessed Value) By Land Use 2021
$658,806,034
$406,944,247
$38,524,050 Residential
Commercial
Industrial
$5,322,536
$13,010,676
Agricultural
Utility
$6,505,680 Motor Vehicle
41
Principal Property Taxpayers The chart below provides an overview of the assessed value for the top property taxpayers in 2021. As mentioned in the Urban 3 study and evident from the revenue generation data, leveraging the development and redevelopment of existing commercial nodes increases vibrancy, character, and a sense of community and provides a substantial economic impact. Top Property Taxpayers (Assessed Value) Brent Scarbrough & Co Inc
$30,192,632
Pinewood Atlanta
$27,071,931
Renamed Trilith
DDRTC Fayette Pavilion I & II
$12,329,476
DDRTC Fayette Pavilion I & II
$10,136,452
DDRTC Fayette Pavilion III & IV
$9,844,504
CCC-PWF, LLC
$8,946,436
Renamed Trilith
Cobblestone Apartments LLC
$8,466,888
Pinewood Forrest LLC
$8,382,328
Renamed Trilith
Heartis Fayetteville $7,510,000
Piedmont Fayette Medical & Office Bldg I $6,601,684 0
20,000,000
42
Existing Land Use The City of Fayetteville encompasses 12.8 square miles. The majority of land is developed with single family detached residential subdivisions. Approximately 14% of the overall land mass is consumed with commercial development, primarily concentrated along Highway 85 and culminating with the Fayette Pavilion shopping center. Fayette Pavilion has in excess of 1.5 million square feet of big box retail and at one time was the largest assemblage of commercial space within the state. Fortunately the retail complex continues to draw patrons from outside the Fayetteville/Fayette County zip codes, increasing sales tax revenue for both the city and county. The Existing Land Use Map provides a citywide perspective of current growth and land-use patterns. The analysis was completed by conducting a thorough review of GIS data provided by city staff. In addition, a windshield survey was conducted to further capture accurate data to analyze and update the Existing Land Use Map.
Existing Land Use Single Family Residential
Business Park
Multifamily Residential
Industrial
Commercial
Public Institutional
Parks and Open Space
Vacant Land
43
Existing Land Use Over 50% of all parcels within the city are zoned for residential use, with the most significant development being the Town at Trilith. Single-family detached residential developments occupy the majority of the city's land mass, Permit records show the majority of multi-family residential development occurred in the 1990's and early 2000's prior to the 2007 recession. Since then the bulk of residential development within the city has centered around the single-family detached product. In recent years the city has experienced an increase in requests for multi-family developments of all sizes and scopes. In several public work sessions the discussion has centered on the need to redevelop certain areas with mixed-use development which has led to the approval of two multi-use residential projects within the downtown core. As available land becomes scarce, new residential development has been more dependent on infill, rezoning request and redevelopment opportunities. Developers have requested greater densities to offset the higher land values and development costs. Commercially zoned land is primarily located along major corridors and state routes, and there are limited areas zoned for industrial development. Commercial uses in the City have historically benefited from the lack of retail in smaller cities in the area and the regional transportation routes. While many neighborhoods in the City were established in the 1990s, commercial growth followed the traditional development patterns with commerce at the center of town, then expanding along the corridors as the population increased. There has been less commercial growth in recent years as the real estate market has changed. The City has experienced limited redevelopment of older commercial properties, and residents have been outspoken during public meetings about the necessity for projects to revitalize the aging shopping centers. Recent changes in retail and office markets have added uncertainty to the continued possible development options for some commercial properties in the City. There are considerable commercial properties throughout the City with the potential for redevelopment or repositioning themselves for present market demands. Characteristics of potential redevelopment sites include significant amounts of surface parking.
44
Rethinking The Norm
Other cities and counties in
the Atlanta Metro area have encouraged this auto-centric type of development and are now experiencing budget short falls. Fayetteville’s decisions on future development will determine the direction of the City’s fiscal health for decades
How well Fayetteville handles further growth will be the deciding factor in what type of city it becomes. Encouraging traditional neighborhood design, infill development, and a more connected road network could lead to an economically-sustainable city. On the other hand, if left unchecked, development will likely move towards autocentric shopping centers and suburbs that are ultimately unable to pay for the infrastructure they require. As the city nears build out, much of the remaining opportunities to shape future growth will be through infill of under-developed properties or through redevelopment of obsolete or declining areas.
45
3 FAYETTEVILLE TOMORROW
46
Public Input The Comprehensive Plan Advisory Committee (CPC) was comprised of community stakeholders including neighborhood and Homeowner Association representatives, non-profit and civic leaders, business owners and other community members as well as representation from the City Council, Planning and Zoning Commission and Downtown Development Authority. The purpose of the CPC was to engage the community and to work with City Staff as the 2022 Update was being prepared. The first action of the CPC was the analysis and review of current conditions, demographic changes and the community vision. The 2022 Update was developed with a cohesive vision, along with achievable goals, objectives and implementation strategies based on feedback provided through the public input process and then confirmed by the CPC. The 2022 Update also includes amendments to the Future Land Use Map, special interest area plans and additional plan recommendations which were developed with input from city staff, the CPC and the public. The Draft Comprehensive Plan - 2022 Update was presented the CPC and the Planning and Zoning Commission prior to forwarding to City Council with a request to authorize Staff to transmit the plan to ARC for review. The 2022 Update was officially adopted on September 15, 2022. The planning process is summarized below:
2
1 Existing Conditions & Fact Finding
Listening and Vision Review
• Existing conditions analysis • Kick-Off Meeting • Steering Committee
• One Visioning Workshops • Steering Committee Meeting
Meeting #1
#2
3 Draft and Finalize Plan
• Steering Committee Meeting #3 • Draft Plan • Finalize and Transmittal • Public plan review
47
Public Input Community members provided input throughout the planning process, both in person and online. The engagement activities focused on identifying priority needs and opportunities and building consensus around a community vision and goals for the future. Comprehensive Plan Committee (CPC) The CPC was comprised of community stakeholders including neighborhood and Homeowner Association representatives, non-profit and civic leaders, business owners and other community members as well as representation from the City Council, Planning and Zoning Commission and Downtown Development Authority. The purpose of the CPC was to engage the community and to work with City Staff as the 2022 Update was being prepared. Kick-off Public Hearing City Staff initiated the 2022 Update of the Comprehensive Plan by holding a public hearing in the Council Chambers on Tuesday, March 3, 2022 at 6:00 p.m. The public was invited to attend and participate in this public hearing. The purpose of the public hearing was to brief the community on the process and opportunities for public participation. Community Meeting #1 – Existing Conditions Workshop The first community workshop was held on April 18, 2022 at 6:00 p.m. in city hall. The workshop was designed to give attendees an opportunity to share input on the assessment completed by Noel Consulting related to housing and commercial development. Community Meeting #2 – Visioning/SWOT Analysis Workshop The second community workshop was held on May 10th at 6:00 p.m. in city hall. The workshop was structured with exercises for open-ended responses. It was designed to solicit feedback on future development patterns and to identify areas where the city should focus its resources. Attendees were asked to provide a list of "small victories" and "big ideas" for the city, in addition to being encouraged to rate community assets and map future growth areas. They were also asked to provide general feedback on any areas of concern.
48
Public Input Community Meeting #3 – Visioning/SWOT Workshop The last public workshop was held at a local community center to get direct input from senior citizens on the future. Attendees were asked to add to the list of "small victories" and big ideas for the future. Participants were also encouraged to rate community assets and map future growth areas. They also provided general feedback on any areas of concern. 2021 LCI Study/Fayetteville Forward In 2021 as a part of the Livable Centers Initiative (CLI) Study, the city conducted a virtual community charrette on February 11-12 to develop a collective vision for the downtown core. A portion of the charrette was devoted to discussing the history of development patterns within the city and reviewing the recommendations from previous planning studies. Participants were then encouraged to re-imagine a future for the city and to share input on areas to preserve and/or change as well as perspectives on future land use, development patterns, accessibility and mobility, and parks and open space. Each of these sessions was conducted virtually and engaged 60-80 participants. 2022 Visioning Charrette Following up on the work of the Fayetteville Forward LCI Study, a cross- disciplinary team conducted a design vision workshop with city officials in late April. The goal was to create inspiring visions for key streets and critical city parcels of downtown Fayetteville and to outline a strategy for implementation.
49
50
Public Input Community Meeting Summary
VOICES from the COMMUNITY • Opportunity to live and work in the city
• Stop overbuilding apt. complexes for town. Traffic congestion
• Empty building need to be used for business
• More business coming to town
• Copy cat Trilith you need a model
• Fiscally sustainable and profitable development
• Redevelopment of the pavilion
• Pedestrian facilities that are safe, connected and separated from traffic
• Refurbish empty or partially occupied strip centers
• Do not build additional apartments until you fill and rent what you got
• Younger population
• Affordable senior housing - income based
51
Public Input Key Takeaways At each public workshop, attendees consistently ranked the city's small-town charm, parks, and community events with high marks. Public safety and the Senior Center (Fayette County) were additional areas that received high marks. The lowest-ranked areas included traffic and transportation, housing options and family ties. Other concerns included the increase in multi-family development, aging shopping centers, making downtown more walkable, and ensuring balanced growth. Housing Economic Growth
Family Ties 30
Schools
20
Transportation
10
Businesses
Parks/Open Space
0
History
Small town Charm
Medical Service/Hospital
Events Historic District
52
Challenges and Opportunities From the previous studies and community meeting, a number of specific priority issues emerged which ultimately
Needs/Challenges
Assets
guided the development of the updated core goals and recommended actions/projects. The following list of needs and opportunities were identified during a series of input meetings .
• New City Center Park including the playground, walkways, a picnic pavilion, a splash pad and lawn space • Small town Charm/Historic District • Existing street network is a great foundation to build upon in creating a vibrant walkable downtown • Historic buildings that contribute to the Southern/ small town charm • Community events are well attended and have created strong bonds • Piedmont hospital and other medical establishments provide vital services • Moderately affluent, established city with a quality school district and several local employment anchors • Presence of Georgia Military College and Georgia Film Academy • Proximity to Hartsfield-Jackson International Airport • Proximity to Atlanta • Pinewood Atlanta Studio and all the related businesses and workers that contribute to the Fayetteville economy • Infill development and undeveloped land • Excellent fire and emergency response • Established neighborhoods and housing stock
• Refurbish empty or partially occupied strip centers, aging Shopping Centers • Parking downtown seems limited, need clear signage to make it less confusing. • Improve the existing parks and add more open spaces • More community artwork in the downtown and new programming for community events • Old houses are deteriorated, lack of maintenance • More community artwork in the downtown • More sidewalks, bicycle paths and multi-use trails. • Improve older parks and provide more green space • Lack of pedestrian facilities that safe, especially downtown • Planned/intentional businesses in square that drive walkability • Reduce the impact of conflicting land uses • Improve older parks and provide more green space • Better traffic management city wide • Major state and U.S. highways transect the downtown • Traffic congestion and high speeds in downtown • Separated bike lanes/temporary road diet on streets such as Jeff Davis or Beauregard • Aging infrastructure needs continuous follow-up and maintenance • More housing options for seniors and young professional
53
VISION A unique place to call home, a community building from the past, working together creating a better future, while preserving our small town charm.
54
General Guiding Principles Guiding principles are the values city leaders should use to establish a framework for decision-making throughout the life of the Comprehensive Plan. These principles were conceived through robust and meaningful conversations with the CPC, city leaders, residents and the business community.
Manage Growth
Economic Vitality
Vibrant Neighborhoods
Historic Preservation
Natural Beauty
Exceptional Design
Connected Communities
Context Responsive Infill
55
Land Use and Development Goals and Policies GOAL ONE: Improve Property Tax Base to diversify and strengthen the fiscal health of the city L-1.1: Update and pursue goals of the Economic Development Plan. L-1.2: Investigate the development of more TAD districts L-1.3: Pursue more Business Park development to accommodate our economic development targets. GOAL TWO: Improve Aesthetics L-2.1: Encourage more parks, street trees, median landscaping and gateways. L-2.2: Continue with high architectural and site design standards L-2.3: Revisit the sign ordinance rules for temporary signs to ensure that the City maintains its appearance. L-2.4: Encourage the growth of the arts and cultural community. L-2.5: Minimize street frontages lined by parking lots and blank walls GOAL THREE: Make Downtown Fayetteville more vibrant and walkable L-3.1: Get more people living Downtown to support businesses L-3.2: Recruit more businesses to Downtown L-3.3: Study financial and engineering feasibility of regional stormwater detention in a water feature (such as a lake or enhanced creek/river/canal) Downtown L-3.4: Improved/ additional wayfinding signage L-3.5:Encourage pedestrian improvements within Downtown including but not limited to sidewalks, pathway systems, multi use trails connecting park areas, businesses, and neighborhoods to Downtown
56
Land Use and Development Goals and Policies GOAL FOUR: Ensure development is complementary
L-4.1: Finalize and adopted the update zoning ordinance to reflect goals of the Comprehensive Plan
L-4.3: Ensure appropriate density transitions and buffering between incompatible uses. L-4.4: Preserve and protect the desired character and value of well-established neighborhoods and natural resources from encroachment by incompatible uses.
L-4.5: Support the redevelopment of underutilized parcels
L-4.7: As necessary, undertake detailed studies, plans for growth centers, and mixed-use centers to identify areas appropriate for density mixed-use development L-4.8: Support residential infill development and redevelopment that responds to local preference and demand for innovative, high quality housing, that is sensitive to surrounding residential areas, and that supports community character goals and objectives.
57
Housing & Neighborhoods Goals and Policies GOAL ONE: Get more people living Downtown to support businesses H-1.1: Examine opportunities for higher density development in the activity centers (Trilith, Downtown, Pavillion, etc.) only as part of mixed-use development. H-1.2: Actively recruit mixed use developers. H-1.3: Encourage the development of townhouses that are externally oriented toward the street and neighborhood, not inwardly oriented or oriented toward parking lots. H-1.4: Encourage the development of smaller lot detached homes in walking distance of Downtown amenities.
GOAL TWO: Encourage development of housing for every step of the life cycle H-2.1: Investigate strategies to promote workforce housing, especially for government employees.
H-2.2: Address identified need for smaller single family detached housing with a higher architectural design standard located in walkable mixed use environments. This could be downtown or in a developer created mixed use environment. Care should be taken to limit the number of walkable mixed use developments outside of Downtown so as to not reduce the demand for living Downtown.
H-2.3: Reconsider City standards for required open space set aside for all zoning districts.
H-2.4: Work with community partners to stabilize and improve neighborhoods adjacent to downtown. H-2.5:Target rehabilitation in neighborhoods that need assistance to mend and enhance the existing housing stock. H-2.6: Consider conducting an bi-annual market study to determine demand based housing and employment needs. H-2.7:Revise regulations and administrative procedures to ensure new residential and mixed-use development provides sufficient public open space, green space, and pedestrian connectivity. H-2.8: Ensure new housing density complies with market demand recommendations from the 2022 housing market study.
58
Quality of Life Goals and Policies GOAL ONE: Continue to cultivate Fayetteville's distinct identity as a safe, welcoming city with attractive places to live; and highquality city programs and services. QL 1.1: Maintain property standards and enforcement to ensure that neighborhoods and buildings remain safe and livable QL 1.2: Preserve Fayetteville unique character QL 1.3: Maintain public infrastructure, buildings, equipment and open space that meets the demand of future community needs. QL 1.4: Support the vision of a community where everyone has access to the resources and opportunities needed to live healthy, active lives. GOAL TWO: Protect open space, natural, and sensitive areas. QL 2.1: Identify open space and sensitive areas that should be preserved for natural recreation areas QL 2.2: Develop a plan to retain a variety of natural areas for use by Fayetteville citizens QL 2.3: Foster dynamic, accessible public spaces and parks QL 2.4: Provide a range of public spaces, programs, and facilities that meet community needs for recreation and leisure
59
Transportation Goals and Policies GOAL ONE: Ensure coordination with state, regional, county, and local partners. T-1.1: Participate in the Fayette County Transportation Plan. T-1.2: Develop a more cooperative relationship with the Georgia Department of Transportation to help meet local objectives for state controlled roads. T-1.3: Participate in Fayette County Trails Plan in order to connect Fayetteville to larger countywide network. T-1.4: Pursue state and federal funding for community identified transportation high priorities T-1.4: Strategically locate and regularly maintain freight routes T-1.5: Work with GDOT and other stakeholders to make SR 54 and SR 85 in the downtown more safe and pedestrian friendly
GOAL TWO: Maintain or enhance the quality of new and existing infrastructure. T-2.1: Prioritize projects that have the most impact to the most people. T-2.2: Compile and prioritize safety improvements based on accident data. T-2.3: Prioritize creating more of a grid street network and "complete streets" to ensure alternative routes. T-2.4: Prioritize projects that support a more walkable Downtown. T-2.5: Pedestrian improvements including crosswalks and signals. T-2.6: Improved/additional wayfinding signage T-2.7: Promote connectivity of our road network to improve the quality of life in our residential neighborhoods. T-2.8: Require interparcel access in new development T-2.9: Implements traffic calming schemes, such as narrow travel lanes, on-street parking, mid-block crossings, and street trees to slow traffic and increase safety for all modes of transportation. T-2.10:Design all new facilities and upgrade existing facilities to comply with all federal, state, and local safety standards.
60
Transportation Goals and Policies GOAL THREE: Provide viable and attractive pedestrian facilities T-3.1: Review and refine the City of Fayetteville Trails Plan
T-3.2: Identify and fill gaps in the trail network. Find opportunities for future trails, complete connections to existing segments, implement projects, and pursue new trail connections to create a more functional trail network.
T-3.3: Improve the network of pedestrian facilities (sidewalks) by creating a safe and accessible network throughout the City. Sidewalks of required widths, well-marked crosswalks and approved pedestrian-scaled lighting should be installed to create an inviting and well used pedestrian system.
GOAL FOUR: Continue progress of making Downtown more walkable.
T-4.1: Coordinate with Land Use Goals.
T-4.2: Connect streets to create more of a grid.
T-4.3: Utilize shorter blocks to increase walkability T-4.4: Update Downtown commercial and mixed use zoning districts to enhance the pedestrian experience by creating scenic vistas and promoting street facing retail with store windows and sidewalk cafes. T-4.5:Develop a downtown streetscape plan.
T-4.5: Add more parks and fountains that will enhance the pedestrian experience.
T-4.6: Provide more downtown parking and signage for the parking.
T-4.7: Create a detailed parking management plan and signage
61
Economic Development Goals and Policies GOAL ONE: Attract people to live here who: • Will appreciate the Fayetteville lifestyle which can best be described as: Active, Outdoors, Family- oriented, Embrace a sense of community, Educated workforce E-1.1: Reconsider City standards for required open space set aside for all zoning districts. E-1.2: Create a green ribbon of parks and trails that connects the entire city. E-1.3: Support a healthy, diverse mix of businesses in Fayetteville GOAL TWO: Develop a Downtown Plan to create a unique destination in Downtown Fayetteville E-2.1: Work with consultant on economically feasible development strategies. E-2.2: Create a comprehensive marketing plan for Downtown. E-2.3: Encourage buildings in walkable areas to be oriented to the street and have facades designed with abundant windows and human scale architectural features GOAL THREE: Business Retention and Expansion E-3.1: Create synergy with local businesses by communicating with existing businesses E-3.2: Working together with the Fayette County Development Authority and Chamber of Commerce on business retention, expansion, and attracting developing the workforce local businesses need. E-3.3: Encourage educational enhancements to make Fayetteville the place to live for all school attendance zones. (i.e. post secondary training and professional development opportunities) E-3.4: Enhance the branding campaign. E-3.5: Encourage the creation (entrepreneur), retention, and expansion of local businesses E-3.6: Encourage sustainable practices in locating, designing, constructing, and maintaining development in the city. GOAL FOUR: Enhance Commercial Corridors. E-4.1: Encourage commercial redevelopment that offers amenities and atmosphere to attract top-tier commercial tenants. E-4.2: Identify underutilized properties (i.e., buildings assessed at considerably less than the total property value) and, encourage redevelopment E-4.3: Encourage structured parking and minimize surface parking, particularly adjacent to public rights-of-way E-4.4: Prepare individual Small Area Plans, for each of the Activity Centers that clearly demonstrate the desired mix of uses, residential density, building intensity, design aesthetic, specific street locations and multimodal connections, infrastructure improvements, parking, and open space.
62
Economic Development Goals and Policies GOAL FIVE: Encourage and facilitate broadband service throughout the city. E-5.1: Consider adopting the model Broadband Ordinance
E-5.2: Consider becoming a Broadband Ready Community
E-5.3: Promote broadband as an asset and strength of the community for businesses and residents
63
WORK PROGRAM & ACCOMPLISHMENTS
64
Community Work Plan This is the review of the Community Work Program from the next five years (2022-2026). This recognizes implementation actions the local government or other entities intend to take during the first five-year time frame of the planning period. This can include any ordinances, administrative systems, community improvements or investments, financing arrangements, or other programs or initiatives to be put in place to realize the plan goals. The Report of Accomplishments immediately follows the Community Work Program and provides an overview of the status of Short-Term Work Program Goals that were previously established for the period 2017-2022.
65
Community Work Plan Project
2022
2023
2024
2025
2026
Comp. Year
Cost Estimate
Funding Source
Responsible Party
Status
Economic Development GOAL ONE: Improve Property Tax Base to diversify and strengthen the fiscal health of the city
L-1.1:
Update and pursue goals of the Economic Development Plan
•
•
•
•
•
2022
$5,000/yr
GF
Economic Development
Underway
L-1.2:
Utilize TAD #1 to ensure the appropriate redevelopment of greyfields
•
•
•
•
•
2026
Project based
TAD increment
Economic Development
Underway
2023
$90,000
GF
Main Street/DDA
Underway
2026
$40,000
Main Street Tourism/ Hotel Motel Tax
Main Street/DDA
Underway
Funding Source
Responsible Party
Status
GOAL THREE: Make Downtown Fayetteville more vibrant and walkable
L-3.4:
Plan to update and expand Downtown wayfinding signage
•
GOAL TWO: Improve Aesthetics
L-2.4:
Host events/activities to attract residents and tourists to the downtown area
Project
•
2022
•
2023
•
2024
•
2025
•
2026
Comp. Year
Cost Estimate
Facilities & Services GOAL ONE: Continue to cultivate Fayetteville's distinct identity as a safe, welcoming city with attractive places to live; and high-quality city programs and services. QL 1.3:
Design/Construct New Fire Station 93
2024
$7,454,430
100% Impact Fees
Fire Department
Underway
QL 1.3:
Tactical Support Fire Apparatus
•
2025
$600,000
CPF
Fire Department
Underway
QL 1.3:
Station 91 Expansion
•
2025
$126,247
IFF
Fire Department
Underway
QL 1.3:
Community Building
•
2025
1 ,465,058
IFF
Public Services
Underway
QL 1.3:
Fire Apparatus - Engine
•
2025
$638,718
100% Impact Fees
Fire Department
Underway
QL 1.3:
Police Dept. Office Space Expansion
•
2025
$626,796
100% Impact Fees
Police Department
Underway
QL 1.3:
Aerial Fire Apparatus
•
2025
$1,000,000
100% IFF
Fire Department
Underway
QL 1.3:
New Station 94
2026
$2,203,386
IFF
Fire Department
Underway
2022
$205,278
100% Impact Fees
Public Services
Underway
•
•
•
•
•
•
GOAL THREE: Provide viable and attractive pedestrian facilities L-3.5
The Ridge Boardwalk (Trail project)
•
66
Community Work Plan Project
2022
2023
2024
2025
2026
Comp. Year
Cost Estimate
Funding Source
Responsible Party
Status
Intergovernmental Coordination GOAL ONE: Ensure coordination with state, regional, county, and local partners
T-1.1. to T-1.5
Work with local governments to coordinate adjacent land uses, ensure efficient provision of services, and refine municipal boundaries
•
•
•
•
•
Ongoing
N/A
N/A
Administration
Underway
Project
2022
2023
2024
2025
2026
Comp. Year
Cost Estimate
Funding Source
Responsible Party
Status
Land Use GOAL FOUR: Ensure development is complementary
L-4.1
Audit and revise the City’s Zoning Ordinance to achieve the goals of the Comprehensive Plan
•
2022
$70,000
GF
Planning
Underway
L-4.1
Audit and revise the City’s Sign Ordinance to achieve the goals of the Comprehensive Plan
•
2022
$20,000
GF
Planning
Underway 1
GOAL FOUR: Continue progress of making Downtown more walkable T-4.2, T-4.3, T-4.5,
Implement the Downtown Visioning Charrette recommendations where feasible.
T-4.2, T-4.3, T-4.5,
Facilitate the implementation of the "Fayetteville Forward" LCI Plan (2020) recommendations where feasible.
•
•
•
•
•
•
2
2024
20,000,000
Public/Private
Planning
Underway
Ongoing
$40,000
GF
Planning
Underway
GOAL FOUR: Enhance Commercial Corridors
E-4.4:
Prepare individual Small Area Plans, for each of the Activity Centers
•
•
•
•
•
Ongoing
$25,000 yr
GF, Grants
Planning/ Public Services
Underway
Project
2022
2023
2024
2025
2026
Comp. Year
Cost Estimate
Funding Source
Responsible Party
Status
GF, Grants
Planning and Economic Development
Underway
Natural & Cultural Resources GOAL TWO: Protect open space, natural, and sensitive areas. QL 2.1. to QL 2.4
Encourage more parks, street trees, median landscaping and gateways.
•
•
•
•
•
Ongoing
$40,000
67
Community Work Plan Project
2022
2023
2024
2025
2026
Comp. Year
Cost Estimate
Funding Source
Responsibl e Party
Status
Transportation GOAL TWO: Maintain or enhance the quality of new and existing infrastructure.
T-2.10
Conceptual plan for new pedestrian crossings on Highway 85 North and Highway 54 East as identified in the Comprehensive Plan
•
2018
$10,000
GF
Planning
Underway
T-2.10
Implement LCI Plan transportation projects as funding becomes available.
•
2020
$12,247,000
40.7% Impact Fees; SPLOST, GF
Public Services
Underway
T-2.10
Jeff Davis Shoulder
•
2023
$492,786
Public Services
Underway
T-2.10
Stonewall/85 Left Turn
•
2023
$142,234
Public Services
Underway
T-2.10
Lafayette/Tiger Trail Roundabout
•
2023
$1,228,345
Public Services
Underway
T-2.10
Highway 54/Gingercake
•
2023
$11,752
Public Services
Underway
T-2.10
Highway 85 Streetscape
•
2023
$30,134
Public Services
Underway
T-2.10
Highway 85 Median
•
2023
$377,526
Public Services
Underway
T-2.10
Lafayette Ave Extension
•
2024
$952,090
40.7% Impact Fees; SPLOST, GF
Public Services
Underway
T-2.10
Lafayette/Glynn
•
2024
$257,622
40.7% Impact Fees; SPLOST, GF
Public Services
Underway
T-2.10
Redwine/Ramah Road Roundabout
•
2024
$1,282,094
40.7% Impact Fees; SPLOST, GF
Public Services
Underway
T-2.10
Veterans Pkwy Small Roundabout (Sandy Creek)
•
2024
$1,004,940
Public Services
Underway
T-2.10
Fischer Road Extension (Downtown Expansion) City Center
•
2024
$16,026,175
Public Services
Underway
T-2.10
Highway 54/Grady Avenue
•
2024
$783,827
Public Services
Underway
Planning, Public Services
Underway
40.7% Impact Fees; SPLOST, GF 40.7% Impact Fees; SPLOST, GF 40.7% Impact Fees; SPLOST, GF 40.7% Impact Fees; SPLOST, GF 40.7% Impact Fees; SPLOST, GF 40.7% Impact Fees; SPLOST, GF
40.7% Impact Fees; SPLOST, GF 40.7% Impact Fees; SPLOST, GF 40.7% Impact Fees; SPLOST, GF
4
GOAL ONE: Ensure coordination with state, regional, county, and local partners. T-1.1:
Participate in the 2022 Fayette County Transportation Plan
4. Removed due to shift in daily operation
•
2023
$40,000
GF
68
Community Work Plan Project
2022
2023
2024
2025
2026
Comp. Year
Cost Estimate
Responsible Party
Status
Public Services
Underway
Public Services
Underway
Public Services
Underway
GF, LCI
Planning/ Public Services
Underway
40.7% Impact Fees; SPLOST, GF
Public Services
Underway
GF
Planning, Public Services
Funding Source
Transportation GOAL TWO: Maintain or enhance the quality of new and existing infrastructure.
T-2.10
Veterans Pkwy 4-lane expansion (1.5 mile)
•
2025
$8,932,802
T-2.10
Habersham Extension
•
2025
$1,004,940
T-2.10
Bradley Sidewalk
•
2024
$500,000
T-2.9
Develop SR 85 North Corridor study to transition the corridor from suburban to urban
•
2024
$80,000
40.7% Impact Fees; SPLOST, GF 40.7% Impact Fees; SPLOST, GF 40.7% Impact Fees; SPLOST, GF
GOAL THREE: Provide viable and attractive pedestrian facilities
T-3.2
Hwy 54 Hospital Area Bridge and Multi-Use Path (Hospital Area Paths and Crosswalk)
•
2024
$4, 200,000
4
GOAL FOUR: Continue progress of making Downtown more walkable. T-4.1 to T4.7:
Development of a Downtown "Complete Streets" Plan
4. Removed due to shift in daily operation
•
2024
$100,000
Underway
69
70
Report of Accomplishments Project
Start Year
Comp. Year
Cost Estimate
Funding Source
Responsible Party
Status
Economic Development Hire Economic Development Director to pursue the Comprehensive Plan Economic Development Goals of business retention and expansion, business attraction and recruitment AND the Land Use Goal of Improving the City’s property tax base.
2017
2017
$80,000
GF
Administration
Complete
Host events/activities to attract residents and tourists to the downtown area
1996
Ongoing
$40,000
Main Street Tourism/ Hotel Motel Tax
Main Street/DDA
Complete
Facilities & Services Park improvements: Gazebo
2018
2019
$11,342
87.87% Impact Fees; SPLOST, GF
Public Services
Complete
Park improvements: The Ridge
2018
2019
$105,477
87.87% Impact Fees; SPLOST, GF
Public Services
Complete
The Ridge Trails 2
2018
2021
$11,795
100% Impact Fees
Public Services
Complete
Build a new City Hall
2018
2019
$14,000,000
GF
Administration
Complete
New Park Lands (Purchased and constructed City Center Park)
2019
2040
2,759,071.89
IFF
Public Services
Complete
Work with public institutions to redevelop vacant or underutilized public buildings in the DHD.
2002
2022
$5,000/yr
GF/Grants/LCI
Economic Development
Cancelled
2002
2022
$5,000/yr
GF
Planning
2016
2018
$2,222,000
Utilize existing infrastructure by encouraging infill and redevelopment as opposed to Greenfield development Design/Construct New Fire Station #3
1
2
63.99 percent IFF/36.01 percent CPF
Cancelled
3
Fire Department
Cancelled
Housing Review Zoning Ordinance and design standards to ensure that they allow for and encourage a variety of housing options
Removed due to shift in daily operation Removed due to shift in daily operation Removed, project now under with Fire Station 93
2000
2022
$2,000/yr
GF
Planning
Complete
71
Report of Accomplishments Project
Start Year
Comp. Year
Cost Estimate
Funding Source
Responsible Party
Status
Economic Development Hire Economic Development Director to pursue the Comprehensive Plan Economic Development Goals of business retention and expansion, business attraction and recruitment AND the Land Use Goal of Improving the City’s property tax base.
2017
2017
$80,000
GF
Administration
Complete
Host events/activities to attract residents and tourists to the downtown area
1996
Ongoing
$40,000
Main Street Tourism/ Hotel Motel Tax
Main Street/DDA
Complete
Facilities & Services Park improvements: Gazebo
2018
2019
$11,342
87.87% Impact Fees; SPLOST, GF
Public Services
Complete
Park improvements: The Ridge
2018
2019
$105,477
87.87% Impact Fees; SPLOST, GF
Public Services
Complete
The Ridge Trails 2
2018
2021
$11,795
100% Impact Fees
Public Services
Complete
Build a new City Hall
2018
2019
$14,000,000
GF
Administration
Complete
New Park Lands (Purchased and constructed City Center Park)
2019
2040
2,759,071.89
IFF
Public Services
Complete
$2,000/yr
GF
Planning
Complete
Housing Review Zoning Ordinance and design standards to ensure that they allow for and encourage a variety of housing options
2000
2022
72
Report of Accomplishments Project
Start Year
Comp. Year
Cost Estimate
Funding Source
Responsible Party
Status
Land Use Downtown Master Plan
2017
2022
$30,000
GF
Planning
Complete
Hire additional Code Enforcement Officer to pursue the City’s aesthetic goals
2018
2018
$40,000
GF
Planning
Complete
Facilitate the implementation of the "Re-defining Downtown" LCI Plan (2002) recommendations where feasible.
2003
Ongoing
$12,247,000
LCI, SPLOST
Public Services
Complete
Natural & Cultural Resources Build a new Downtown Park
2019
2020
Included in new City Hall cost estimate
GF
Administration/ Public Services
Complete
Parks Study to include engineering and feasibility study for water feature in a park
2018
2019
$465,000
GF
Planning
Complete
Implement diverse programming at the Amphitheater
2006
2017
$165,000/yr
Main Street Tourism Assoc./
Continue diverse programming at the Amphitheater
Complete
Promote organized walking tours of the Downtown Historic District from the Holliday Dorsey Fife Museum
2004
2022
N/A
Main Street/DDA
Main Street/DDA
Complete
Continue to implement Main Street objectives as they relate to preservation of cultural resources.
1996
2022
N/A
N/A
Main Street/DDA
Complete
$40,000
Main StreetHotel/Mot el TaxVendor Fees
Main Street/DDA
Complete
Continue to sponsor cultural activities and events in the Main Street District
1996
2022
Transportation Participate in the 2018 - Fayette County Transportation Plan
2017
2018
$40,000
GF
Planning, Public Services
Complete
Participate in the Fayette County Trails Plan
2017
2018
$40,000
GF
Planning, Public Services
Complete
Develop a City trails plan that will include identification of opportunities to provide connectivity between residential areas and other uses through multi-use trails/sidewalks and greenspace.
2018
2019
$75,000
SPLOST
Planning, Public Services
Complete
Veterans Pkwy Large Roundabout x 2
2017
2022
$3,240,834
Public/Private
Public Services
Complete
Church St. Extension (Hood Ave Conn/SR92)
2011
2016
$140,000 (City)
IFF (100%)
Public Services
Complete
73
Report of Accomplishments Project
Start Year
Comp. Year
Cost Estimate
Funding Source
Responsible Party
Status
Public Services Implement City SPLOST program
Grady/Beauregard - Roundabout
On-going On-going
2022
$11,649,324
2017
$958,643
Install additional street trees and landscape medians as funding becomes available
2017
2022
$5,000/yr
Require inter-connectivity of roadways within and between new and existing commercial and mixed use developments.
2004
2022
Hospital Area Paths and Crosswalk
2011
2018
SPLOST, LCI, DOT, Grants, Private 40.7% Impact Fees; SPLOST, GF
Public Services
Public Services
Complete
Completed 1
GF (Tree Bank)
Planning, Public Services
Cancelled
$1,000/yr
GF
Public Services
Cancelled
$650,000
GF, Grants
Public Services
Cancelled
2
3
Removed due to shift in daily operation Removed, project was more related to daily operation, now listed in the city ordinance Project Merged with the Hospital Trail Project
74
3 INTEGRATED LAND USE
75
ZONING MAP
76
Future Development Map Framework A number of key considerations contributed to the restructuring of the future land use designations adopted as a part of this update:
▪ Neighborhoods include a mix of housing types and choices at varying price ranges; with density and mixed-use at the center and lower density housing towards the edge.
▪ Neighborhood Centers are strategically located at intersections to maximize access, visibility and economic viability. These centers should include a range of commercial uses within walking distance of housing, serving the neighborhood primarily, but also serving existing, adjacent residential areas.
▪ A single, prominent employment center, or Activity Center, serves as the major employment and revenue-generating specialized uses. Activity Centers often have specialized uses and needs and may be dominated by a single user such as a campus. In addition, a forthcoming zoning rewrite and small area plans will be the primary mechanism for implementing the Future Land Use Map.
Updated Comprehensive Plan
Forthcoming New Zoning Ordinance
Small Area Plans
77
NEW FUTURE LAND USE MAP
01. North 85 Corridor
04. Innovation Mixed Use Center
02.Downtown Core
03.Medical Center
Neighborhood Residential 1 Neighborhood Residential 2
Activity Centers
Business Park
01-North 85 Corridor
Industrial
02- Downtown Core
Mixed Residential Neighborhood Center
03 - Medical Center 04- Innovation Mixed Use Center
Public Institutional Parks, Recreation and Conservation
78
PROPOSED NEW FUTURE LAND USE MAP
01. North 85 Corridor
04. Innovation Mixed Use Center
02.Downtown Core
03.Medical Center
Neighborhood Residential 1 Neighborhood Residential 2
Activity Centers
Business Park
01-North 85 Corridor
Industrial
02- Downtown Core
Mixed Residential Neighborhood Center
03 - Medical Center 04- Innovation Mixed Use Center
Public Institutional Parks, Recreation and Conservation
78
NEIGHBORHOODS Neighborhoods are not all the same - some are established, some are changing, some are emerging, and some are not yet built. The 2022 Update establishes the Neighborhood land use designation which is intended to identify residential areas that require attention to physical details, careful planning and connectivity. This plan focuses on stabilizing, nurturing, and reinvesting in distinct areas where deterioration has negatively affected their vibrancy and livability. Specific goals and objectives have been incorporated into this plan to assist the city with adapting to the impacts of future growth and changes in the real estate market.
79
PREVIOUS FUTURE LAND USE RESIDENTIAL Low Single Family
Townhome
Medium Single Family
Multifamily
High Density Single Family
80
NEW FUTURE LAND USE RESIDENTIAL Neighborhood Residential 1 (Low, Medium, and High Single Family Detached) Neighborhood Residential 2 (Single Family Attached, i.e Townhomes)
Mixed Residential (Multifamily )
81
Neighborhood Residential 1 Existing Conditions Located throughout the city are neighborhoods with single-family detached homes on lots of varying sizes, with nearby uses such as retail centers, parks, recreational areas, places of worship and schools.
Vision The Neighborhood future land use category is intended for single-family detached residential development and aims to recognize, maintain, support, and enhance the existing residential character of these areas. Future development within this land use category will primarily be single-family detached subdivisions that may include complementary uses such as public facilities and parks.
Key Implementation Strategies ▪ Intended for single-family detached homes of varying architectural style ▪ Where infill opportunities exist, development density should be compatible with the adjacent neighborhoods scale and integrate character and neighborhood-defining features ▪ Buildings designed with a pedestrian scale ▪ Identify opportunities to increase walkability and connectivity with outdoor spaces, sidewalks and path system ▪ Include sidewalks on both sides of all internal streets ▪ Minimize the potential for incompatible land uses (e.g. high traffic generators, noisy users, etc.) within or next to single-family neighborhoods. ▪ Encourage the use of landscape buffers and/or natural vegetation to mitigate the impacts that such land uses could have on residential neighborhoods. ▪ Prohibit higher density residential (e.g. duplexes, apartments) or high-density non-residential land uses (e.g. commercial and industrial uses) in single-family residential areas. ▪ Continue streetscape and infrastructure improvements in aging developments.
82
Neighborhood Residential 1 Land Use
Primary Uses
Recommended Zoning
Primarily single-family detached (SF) Small-scale civic/public uses Places of worship Parks/recreation/green space R-70 R-40 R-30 R-15 R-22
Development Characteristics Building Form Mobility Open Space
Low-rise residential buildings with similar setbacks and lot sizes Well-connected local street network supports walking, bicycling, and driving. Typically private yards and improved common areas
83
Neighborhood Residential 2 Existing Conditions Located in three distinct areas: along or near Highway 85, North Jeff Davis Avenue and Jimmie Mayfield Boulevard, these moderate to high-density neighborhoods include a range of duplexes and/or attached units.
Vision This land use designation is intended to allow for smaller single-family detached residences, duplexes, quadplexes, condominiums and townhouses. Public and institutional uses such as parks, schools or churches may also be built within this designation. The scale and height of revitalization projects and future development should be compatible with the surrounding community's existing and planned character which could include a mix of smaller single-family lots and/or a mix of attached residential. Regardless of the type and density of housing, there is a high standard of product provided. Neighborhoods should be well lit, with attractive landscaping, amenities, and aesthetics.
Key Implementation Strategies ▪ Encourage new housing designs that are attractive and emphasize the structure from the street, rather than the garage. ▪ Where practical, new developments should be designed with vehicle access from a rear alley along with internal sidewalk connectivity throughout the development and to adjoining properties ▪ Encourage the construction of narrow streets in new neighborhoods and require sidewalks on both sides of all streets ▪ Minimize the potential for incompatible land uses (e.g. high traffic generators, noisy users, etc.) within or next to Two-Family/Townhouse Residential areas. Where such uses do occur in close proximity, encourage the use of landscape buffers to mitigate the impacts that such land uses could have on residential neighborhoods. ▪ Plan for interconnected road and open space networks in new residential areas ▪ Identify opportunities to increase walkability and connectivity with outdoor spaces ▪ Discourage the use of cul-de-sacs in new neighborhoods whenever possible. ▪ Promote property upkeep and maintenance through effective code compliance ▪ Buildings designed with a pedestrian scale
84
Neighborhood Residential 2 Land Use Primary Uses
Recommended Zoning
Primarily small lot single family residential and attached residential
R-THC Residential Townhouse Condominium
Development Characteristics Building Form
Single-family detached residential Low- to mid-rise attached residential
Mobility
Well-connected and dense street network and short blocks, encourage walking, bicycling and driving.
Open Space
Privately owned, common space and small parks, greenways and open space
85
Mixed Residential Existing Conditions Primarily located along Lanier Avenue, the parcels with this land use designation are developed with a range of single-family detached and/or attached residential.
Vision This land use designation is intended to provide a compatible variety of residential units as well as recreational and community facilities, with a focus on providing single-family detached as well as a variety of attached residential product (duplex, triplex, quadplex), multi-family residential, townhomes and condominiums along with public and institutional uses such as parks, schools and places of worship.
Key Implementation Strategies ▪ Require residential developments to provide on-site open space areas and amenities ▪ Where practical, new developments should be designed with vehicle access from a rear alley along with internal sidewalk connectivity throughout the development and to adjoining properties ▪ Encourage the construction of narrow streets in new neighborhoods and require sidewalks on both sides of all streets ▪ Support the construction of "complete streets" ▪ Plan for interconnected road and open space networks ▪ Discourage the use of cul-de-sacs whenever possible. ▪ Link parking lots to building entrances by pedestrian walkways that are physically separated from vehicular movement areas ▪ Promote property upkeep and maintenance through effective code compliance ▪ Encourage the use of balconies, porches, stoops, garden walls, varied building and facade setbacks, varied roof designs, bay windows, and similar design features in new mixed residential project designs. In general, multi-family dwelling units should be designed so that they appear to be a grouping of smaller residential units. ▪ Promote architectural design that is compatible with the surrounding neighborhood including building and facade materials, building height, building bulk, setbacks, window and door styles and placements, roof designs and color scheme.
86
Mixed Residential Land Use Primary Uses
Recommended Zoning
Single-family detached and attached residential
RMF-15 Multi-Family Residential
Development Characteristics Building Form
Single-family detached Attached residential
Mobility
Well-connected and dense street network and short blocks, encourage walking, cycling, and driving.
Open Space
Privately owned, common space and small parks, greenways and open space
87
PREVIOUS FUTURE LAND USE COMMERCIAL Business Park Suburban Commercial Suburban Office Public Institutional (Schools) Walkable Mixed Use
88
Nodes + People = Centers The most significant change in the 2022 Update is how the city classifies commercial development. Studies show that allowing and promoting varying levels of activity within a development can promote pedestrian activity and business vitality along corridors and create a rhythm of development, which helps to segment the linear corridor into distinct areas that will create a greater sense of place. North 85 Corridor
Innovation Mixed Use Center
Medical Center Downtown Core
Neighborhood Centers
Activity Centers
These areas encourage a mixture of small-scale commercial, low-intensity office, restaurants, specialty retail, medical and service uses that cater to the surrounding residential neighborhoods.
Activity centers are often referred to as character areas and encourage a “holistic” approach to long-range planning by integrating the community’s vision and desires with actual land use patterns; Activity Centers: • Downtown Core = Downtown Mixed Use Center • North 85 Corridor - Fayette Pavilion • Medical Center = Piedmont Fayette Hospital Complex • Innovation Mixed Use Center - Trilith Studios/Town at Trilith
89
Neighborhood Centers Existing Conditions Neighborhood Centers are primarily located on major thoroughfares and near concentrations of existing or planned residential neighborhoods. Current developments and uses include smaller strip centers, shopping centers with grocery stores, storage facilities, offices, retail establishments, restaurants, and services.
Vision This future land use category includes small-scale neighborhood supporting retail, office and service uses which preserve the residential character through building scale, building appearance, landscaping and signage. With the proximity to the Downtown Core and adjacent residential developments, the neighborhood centers will include some infill. Mixed-use developments are envisioned to revitalize aging shopping centers and help buffer the quieter residential neighborhoods. New development and redevelopment in these areas should be compact in form, with free-standing commercial structures and/or some vertical mixed-use structures. These areas should include a network of pedestrian-friendly and welldesigned streetscapes with a distinctive sense of place.
Key Implementation Strategies ▪ Actively promote redevelopment of aging retail centers ▪ Transform parking lots into pedestrian-friendly parking plazas with buffered walkways, parklets and commercial pad sites ▪ Create pedestrian connections to the main building entrances and the adjoining sidewalk networks ▪ Encourage connected street grid network with small blocks and wide pedestrian walkways as properties are redeveloped ▪ Improve mobility within the shopping center and to nearby shopping districts by establishing streetscape hierarchy ▪ Strategically buffer conflicting land uses such as residential areas and/or roadways with open space ▪ Create dedicated circulation for delivery vehicles to minimize conflict between pedestrians and service vehicles ▪ Establish a consistent development pattern along the corridors by implementing design guidelines for building design and materials, sidewalks, landscaping and signage ▪ Require inter-parcel access between developments ▪ Encourage buildings to face the street and locate parking to the side and rear as retail centers redevelop ▪ Provide bicycle and pedestrian amenities, including covered walkways, benches, lighting and bike racks ▪ Reduce parking requirements and encourage adaptive reuse ▪ Consider the use of “build-to” lines and street-oriented customer entrances to encourage walking and neighborhood connections. ▪ Design buildings and sites for pedestrians not just automobiles.
90
Neighborhood Centers Land Use
Primary Uses
Recommended Zoning
Neighborhood-serving retail / commercial Small-scale office Green space For properties identified as having strong revitalization potential, projects with smaller footprints should be considered with a mix of uses. There should be direct linkages between residential and commercial uses; O-I Office and Institutional C-2 Community Commercial C-3 Highway Commercial
Development Characteristics Building Form
Mobility
Open Space
Low-rise retail structures with a walkable, landscaped public realm
Encourage safe and comfortable access by all modes of travel
Plazas, patios, and courtyards; landscaping and natural open space is encouraged
91
Neighborhood Centers
Today
92
Neighborhood Centers
Tomorrow
93
Innovation Mixed-Use Existing Conditions This master planned development includes Trilith Studios and the Town at Trilith, including a variety of detached and attached residential dwelling units, retail and commercial, office, restaurant and internal amenities.
Vision This land use category is intended to facilitate a carefully controlled mix of land uses which may include any combination of the following: office, retail, restaurants, residential, community facilities, and highquality industrial that is compatible with neighboring uses. This category is also intended to encourage and facilitate the conservation of open land and other natural resource features.
94
Innovation Mixed Use Overview Land Use
Primary Uses
Recommended Zoning
Mixed-use Retail/commercial/restaurant Office Lodging Hotel Single-family detached Apartments Townhomes Micro-homes Parking garages Indoor/outdoor event center
Create new zoning designation for areas within specified activity node. This should permit a mixture of land uses.
Development Characteristics Building Form
Mobility
Open Space
Mid- or high-rise buildings with active ground floors and building step backs on upper floors
Encourage safe and comfortable access by all modes of travel
Improved open space is a key feature; many public and private spaces
95
Innovation Mixed Use
96
Innovation Mixed Use Key Implementation Strategies In accordance with New Urbanism principles, the master planned development will continue to adhere the following standards : ▪ The neighborhood, the district, and the corridor are the essential elements of development and redevelopment in the metropolis. They form identifiable areas that encourage citizens to take responsibility for their maintenance and evolution. ▪ Neighborhoods should be compact, pedestrian friendly, and mixed-use. Districts generally emphasize a special single use, and should follow the principles of neighborhood design when possible. Corridors are regional connectors of neighborhoods and districts; they range from boulevards and rail lines to rivers and parkways. ▪ Many activities of daily living should occur within walking distance, allowing independence to those who do not drive, especially the elderly and the young. Interconnected networks of streets should be designed to encourage walking, reduce the number and length of automobile trips, and conserve energy. ▪ Within neighborhoods, a broad range of housing types and price levels can bring people of diverse ages, races, and incomes into daily interaction, strengthening the personal and civic bonds essential to an authentic community. ▪ Concentrations of civic, institutional, and commercial activity should be embedded in neighborhoods and districts, not isolated in remote, single-use complexes. Schools should be sized and located to enable children to walk or bicycle to them. ▪ The economic health and harmonious evolution of neighborhoods, districts, and corridors can be improved through graphic urban design codes that serve as predictable guides for change. ▪ A range of parks, from tot-lots and village greens to ballfields and community gardens, should be distributed within neighborhoods. Conservation areas and open lands should be used to define and connect different neighborhoods and districts.
97
Medical Center Existing Conditions The Medical Center activity center includes the Piedmont Fayette Hospital and adjoining medical buildings. Piedmont is a leading community hospital and one of the largest employers in Fayetteville with nearly 2,700 doctors, nurses, and other professionals. The activity center offers 24-hour emergency services, cancer care, health care, transplant center, women’s health, and more. This area encompasses a contiguous area of land generally located around the intersection of the Veterans Parkway, Sandy Creek Road and Highway 54 West.
Vision The vision for the area is one of mutual compatibility and support among differing uses with people living and working in the community. It includes a neighborhood that encourages people to live and work within the area and promote development that is consistent with, and transitions to, the established neighborhood scale. Future development will create a center that is a walkable, multi-modal community with a variety of transportation options with enhanced connections and safe pedestrian routes.
Key Implementation Strategies • Establish new zoning designation for areas within a specified activity node to permit a mix of land uses, similar to the Trilith development but at a smaller scale • Maintain existing hospital as an economic anchor for the community and support the future growth of healthcare and healthcare related businesses • Implement interconnected street grid network with small blocks and wide pedestrian walkways • For new mixed-use developments, streets should include landscaping, pedestrian-scale lighting, and street furniture. Public gathering areas should be encouraged. Buildings should be limited to no more than three stories and should include facade variation and fenestration. Parking should be located to the rear or side of buildings. • Require inter-parcel access between developments and parallel access to the medical center • Support the growth, stability and diversity of the residential communities by ensuring a continued mix of housing types • Establish direct, pedestrian friendly circulation and crossing patterns that connect uses with trails and bicycle and pedestrian routes. Provide pedestrian friendly crossings.
98
Medical Center Overview Land Use
Primary Uses
• Medical offices and other medical-related uses • Higher Density Residential • Retail (stand-alone or ground-floor as part of mixed-use development) • Hotel • Civic uses that support residential uses, such as schools and places of worship
Recommended Zoning
Create new zoning designation for areas within specified activity nodes. This should permit a mixture of land uses.
Development Characteristics Building Form
Commercial, institutional, multi-family or mixed-use buildings
Mobility
Encourage safe and comfortable access by all modes of travel
Open Space
Improved open space is a key feature; many public and private spaces
99
Medical Center
100
North 85 Corridor Existing Conditions This Activity Center includes several existing commercial sites along North 85 and other areas with commercial land uses. The most prominent is the Fayette Pavilion with multiple big box retailers and supporting retail, commercial and restaurant uses. The corridor is easily accessible by car but not easily accessible to adjoining residential developments. Vacancy in the corridor is generally low but is burdened by infill retailers such as discounters, thrift stores and churches.
Vision A vibrant commercial corridor with a mix of aesthetically pleasing and well-maintained mixed use developments that are interconnected with each other as well as the adjoining residential developments.
Key Implementation Strategies ▪ Actively promote redevelopment of the commercial areas and work with property owners to encourage higher occupancy rates and help maintain high occupancies rates through business retention and recruitment ▪ Reduce parking requirements and encourage existing retail centers to redevelop into mixed-use centers ▪ Reintroduce internal grid street networks along with pedestrian-friendly connections. Convert unused parking areas into pedestrian-friendly parking plazas with buffered walkways, parket, and commercial pad sites. ▪ Create pedestrian connections to the main building entrances and the adjacent sidewalk network. ▪ Improve mobility within the shopping center and to nearby shopping districts by focusing streetscape improvements ▪ Strategically buffer from or connect to adjacent uses of conflicting land uses, and open space, protect residential neighborhoods, and the highway ▪ Create dedicated circulation for large vehicles so that retail warehousing uses do not conflict with improvements geared towards creating a pedestrian-friendly environment ▪ Establish a consistent development pattern along the corridor by implementing design guidelines for signage, sidewalks, and landscaping ▪ Require inter-parcel access between developments ▪ As shopping plazas redevelop, encourage buildings to face the street and locate parking to the side and rear ▪ Provide bicycle and pedestrian amenities, including covered walkways, benches, lighting, and bike racks • Continue code compliance efforts to maintain an attractive appearance of shopping centers and buildings.
101
North 85 Corridor Overview Land Use
Primary Uses
Recommended Zoning
Shopping centers Standalone retail uses Personal services Restaurants Mixed use (including office and ground-floor retail/commercial)
Create new zoning designation for areas within specified activity node. This should permit a mixture of land uses.
Development Characteristics Building Form
Mid- or high-rise buildings with active ground floors and building step backs on upper floors
Mobility
Very well-connected street network with small blocks and highly walkable connections
Open Space
Improved open space is a key feature; many public and private spaces
102
North 85 Corridor
103
North 85 Corridor Overview
104
Downtown Core Existing Conditions Land use within downtown are characterized by a predominance of institutional uses, single-family homes, and commercial/retail facilities. Records indicate that much of the downtown core was constructed between 1880 and 1920. Since then the downtown has grown more modestly and consistently resulting in the development of previously undeveloped or underdeveloped areas along major transportation routes and redevelopment within the historic downtown square. Recent developments like the city center park has brought new life to downtown, and the two state highways present a challenge to the vision of a walkable, safe and pedestrian-friendly downtown.
Vision This land use designation is intended to encourage pedestrian-oriented retail, office, service, community facility and residential uses. The vision for the downtown core is centered on pedestrian-oriented and walkable development where people living, working and visiting should be able to park their car and easily walk from place to place. The vision for the recent LCI Study centered around moving downtown Fayetteville Forward through catalytic and equitable placemaking, enhanced legibility of the built environment, and creative guidelines for sustainable developments.
Key Implementation Strategies ▪ Prioritize walkability and connectivity ▪ Require inter-parcel access between developments ▪ Develop a comprehensive sidewalk network to enhance safety, emphasize walkability in the street grid and pedestrian scale. ▪ Improve zoning ordinance to permit a mixture of uses ▪ Use code to enhance pedestrian experience, and unified streetscaping (improving aesthetics) ▪ Codify historic inspiration as a guide for new buildings ▪ Emphasis on placemaking/Downtown as a destination ▪ Add more parks, landscaping, and trees ▪ Emphasis on historic character and Identify infill parcels and ownership for redevelopment opportunities ▪ Create distinct character areas ▪ Establish Street Frontage Typologies, Improve Public Space Domains ▪ Adopt architectural design guidelines ▪ Adopt a Complete Street policy ▪ No new auto-oriented commercial developments ▪ Historic buildings originally constructed for residential use must retain their residential architecture regardless of the use or mix of uses ▪ All sites are designed for the convenience of pedestrians first and vehicles second
105
Downtown Core
106
Downtown Core Overview Land Use
Primary Uses
Recommended Zoning
Shopping centers Standalone retail uses Personal services Restaurants Residential
Create new zoning designation for areas within specified activity nodes. This should permit a mixture of land uses.
Development Characteristics
Building Form
Buildings are also designed with the convenience of pedestrians in mind. All buildings have street entrances and the primary façade(s) and architectural treatments are street facing
Mobility
Blocks are small and streets are interconnected in a grid fashion to the extent practicable. Streets are tree lined and sidewalks are wide.
Open Space
Improved open space is a key feature; many public and private spaces
107
Downtown Core
108
Parks, Recreation and Conservation Existing Conditions The use and enjoyment of outdoor spaces have long been a source of joy and quality of life for residents and visitors. There are currently six (6) public parks, and the city is committed to enhancing these spaces to benefit the general public.
Vision This land use category is for land dedicated to active or passive recreational uses as well as green space and wildlife management. It is in this area that residents have an opportunity to connect with nature through activities that promote physical activity and healthy lifestyles. These areas may be either publicly or privately owned.
Key Implementation Strategies • Preserve and protect environmental areas that protect wildlife and vegetative resources. • Work collectively with surrounding and overlapping governments and non-profit agencies on the preservation and enhancement of woodlands and open space areas. • Identify opportunities for future open space in neighborhoods that are undersupplied in public recreation and open space opportunities. • Enhance public access to parks and recreational facilities by making necessary infrastructure improvements.
109
Parks, Recreation and Conservation Overview Land Use
Primary Uses
Recommended Zoning
Playgrounds Public parks Nature preserves Golf courses Recreation centers Pedestrian and/or bike trails Dog parks Pavilions Amphitheaters and similar uses
OS - Open Space
Development Characteristics Building Form
Mobility
Open Space
Typically low rise recreation, maintenance and other support facilities
Along all street types; Encourage safe and comfortable access by all modes of travel
Open space is the primary element
110
Business Park Existing Conditions Business parks are located along or in close proximity to major corridors, the existing developments include offices, warehouse space, and light manufacturing . There are several acres of undeveloped land with this designation.
Vision This category is for land dedicated to maximize the potential for job creation. This classification is for land dedicated to offices, research and development, healthcare and education. It will be supportive of other related uses such as hotels, restaurants, and small scale retail. Business park sites will typically be over five acres and master planned to have easy internal circulation in a planned campus atmosphere.
Key Implementation Strategies • Business park sites will typically be over five acres and master planned to have easy internal circulation in a planned campus atmosphere. • Sites are clean, well landscaped, and heavily buffered. • In general, business park uses will not generate significant truck traffic. • New development should include appropriate landscaping and buffering elements including street trees, parking lot landscaping and perimeter screening. • Screening should be provided between incompatible land uses, especially residential uses. • Pedestrian connections should be established between developments and along roadways to improve the connectivity of the area.
111
Business Park Overview Land Use Primary Uses
Recommended Zoning
Office and Institutional Medical Office Business Park Business Park
Development Characteristics Building Form
Architectural styles will vary, but site design will have a character similar to that of a college campus.
Mobility
Encourage safe and comfortable access by all modes of travel and pleasant pedestrian connections between buildings
Open Space
Significant greenspace is a key feature; many public and private spaces
112
Industrial Existing Conditions There are limited industrial areas within the city and most are fully occupied.
The most recent
development is located along Promenade Parkway.
Vision Located to minimize impact on surrounding uses, the industrial classification is for land dedicated to manufacturing facilities, processing plants, factories, warehousing and wholesale trade facilities, and any other uses with significant truck traffic or any use that has detrimental visual (or other sensory) impact that cannot be concealed by its building and landscaping. Sites have a traditional industrial design and appearance.
Key Implementation Strategies • Protect remaining industrial sites for signature opportunities. • New development should include appropriate landscaping and buffering elements including street trees, parking lot landscaping and perimeter screening • Screening should be provided between incompatible land uses, especially residential uses. • Pedestrian connections should be established between developments and along roadways to improve the connectivity of the area.
113
Industrial Overview Land Use
Primary Uses
Recommended Zoning
Primarily light manufacturing Research & development Warehousing Distribution Processing plants Wholesale trade facilities Light Industrial and Heavy Industrial
Development Characteristics Building Form
Mobility
Open Space
Typical high-bay, single-story and large/ long manufacturing or warehousing buildings
Encourage safe and comfortable access by all modes of travel
Improved open space is a key feature; many public and private spaces
114
Public Institutional Existing Conditions The Fayette County Public School System comprises 14 elementary, five middle, and five high schools, as well as an adult community school. Along with the administrative offices, there are three schools in the city limits.
Vision This area allows for the location of public and non-profit institutions, and organizations that provide regular services to and for the general public. This includes certain state, federal, and/or local government and institutional land uses. These are ideally located in areas distributed throughout the city with emphasis being on proximity to residential areas and areas with intense population activity during the day. While most of these areas are generally envisioned solely for Public/Institutional use, there are times that these uses will be found in other appropriate character areas.
Key Implementation Strategies • Strategic open spaces should be provided throughout the district that provide both passive and active recreational opportunities which could include parks, common gathering spaces, and gardens. • New development within the district should include appropriate landscaping and buffering elements including street trees, parking lot landscaping and perimeter screening, and building perimeter landscaping. • Screening should be provided between non-residential and residential uses. • Parking and service areas should be minimized where possible by locating the building prominently on the site with parking and service areas to the rear or side of the building
115
Public Institutional Overview Land Use
Primary Uses
Recommended Zoning
Educational facilities Churches Cemeteries Government uses such as city hall, government building complexes, public safety stations, libraries, post offices, community centers, senior centers, recycling collection centers, and recreation centers. Create new zoning designation for areas.
Development Characteristics Building Form
Mobility
Open Space
Primarily office and/or civic buildings
Encourage safe and comfortable access by all modes of travel
Improved open space is a key feature; many public and private spaces
116
APPENDIX
LEGAL NOTICE AND COMMUNITY SIGN IN SHEET
1st Kickoff Public Meeting March 3, 2022
1st Public Meeting: https://www.facebook.com/fayettevillega.gov/videos/2080045055497946
APRIL 2022 - PUBLIC MEETING SIGN IN SHEET
APRIL 2022 - PUBLIC MEETING SIGN IN SHEET
MAY 2022 - "POP -UP" PUBLIC MEETING SIGN IN SHEET
MAY 2022 - "POP -UP" PUBLIC MEETING SIGN IN SHEET
BIG AND SMALL IDEAS - PUBLIC COMMENTS
APRIL & MAY MEETING COMMENTS
MISSION REVIEW - PUBLIC COMMENTS
APRIL & MAY MEETING COMMENTS
COMMUNITY ASSET REVIEW - PUBLIC COMMENTS
TOTAL
( WRITE IN ) ( WRITE IN )
APRIL MEETING = BLUE DOTS MAY MEETING = ORANGE DOTS
Final Adoption Public Meeting September 15, 2022
https://www.facebook.com/fayettevillega.gov/videos/1421039291740832
2022 HOUSING STUDY
CITY OF FAYETTEVILLE HOUSING MARKET ANALYSIS CITY OF FAYETTEVILLE MARCH 2022 www.NoellConsulting.com
CONTACT | 404.681.0006
Executive Summary
CITY OF FAYETTEVILLE HOUSING MARKET ANALYSIS Exhibit 1 Fayetteville Land Use Map Potential Future Housing Development
Fayetteville
Trilith
Piedmont
Downtown
The City of Fayetteville is fairly developed, but there are pockets of opportunity for new housing development to occur. The map to the left shows existing concentrations of land use, with areas of opportunities for future development highlighted in red circles. Higher density forms of housing such as apartments and townhomes, should be located near Downtown, Piedmont, and Trilith, where density is naturally higher and a mix of land uses join together. Additionally, senior living facilities and apartments should be located along heavily trafficked corridors for visibility purposes.
Lower density housing such as single family subdivisions and estate lots can be located near the City's edge where density is naturally lower and existing residential homes are more spread out.
SOURCE: Noell Consulting Group, Google Earth 3/18/2022
CITY OF FAYETTEVILLE HOUSING MARKET ANALYSIS Exhibit 2 Summary of Recommended Market Rate For-Sale Residential Product Offerings Product Attached Products
Product Description
Square Feet Range
Lot Width
Garage Situation
Avg. SF
1,900
$325,000 $395,000
Typical Price Range
Average Price
Avg. $/SF
Target Market Audience
Estimated Demand Level
$360,000
$189
First time buyers, Single-parent families, singles, couples
27/year, up to 136 through 2026
Entry Town-homes
2 - 3 Story Townhouse
18'-22'
Surface parked, or 11,600 2,200 2 car garage front loaded
Move-Up Town-homes
2 - 3 Story Townhouse
20' - 24'
Attached front &/or rear-loaded
2,000 2,600
2,300
$395,000 $475,000
$435,000
$189
Mix of working singles & couples
8/year, up to 40 through 2026
Upgrade Town-homes
2 - 3 Story Townhouse
24'-28'
Attached front &/or rear-loaded
2,500 3,500
3,000
$475,000 $595,000
$535,000
$178
Mix of working singles & couples, retirees
4/year, up to 20 through 2026
Up to 18/year for a total of 90 through 2026
Detached Products
26'
Attached rear1,900 2,400 loaded
2,150
$370,000 $445,000
$407,500
Varies from movedowns (master $190 down) to young couples
40' x 150'
Attached rear2,400 3,200 loaded
2,800
$470,000 $595,000
$532,500
$190
More working couples and families
Up to 22/year for a total of 110 through 2026
Conventional SFD
Two-Story 3Two-car 4 BR product 55' - 70' garage, front- 2,000 2,900 on average loaded lot
2,450
$395,000 $535,000
$465,000
$190
Mostly families with children, some couples
Up to 64/year for a total of 320 through 2026
Estate/ Rural SFD
Two-Story 4 6BR detached homes on larger lots
$166
More established couples and families with children
Up to 24/year for a total of 120 through 2026
Small Lot Detached Villa
1.5-Story SFD
Small Lot Cottage
2-Story Cottage Product
SOURCE: Noell Consulting Group
3/18/2022
100'+
Side loaded, 2,600 5,000 2 or 3-car garage
3,800
$520,000 $745,000
$632,500
CITY OF FAYETTEVILLE HOUSING MARKET ANALYSIS Exhibit 3 Summary of Recommended Market Rate Rental Residential Product Offerings Product Attached Products
Product Description
DU/Ac.
Home Square Feet
Avg. SF
Typical Rent Range
Average Rent
Rental Townhomes
1-2 Stories, garage or driveway parked
Garden Apartments
3-4 Stories, surface parked
GardenUrban Apartments
3-4 Stories, surface parked, typically with elevators
40-60
600 1,200
800
$1,300 $2,000
$1,650
Midrise Apartments
4-5 Stories, around or adjacent to structured parking
60-100
600 1,200
800
$1,200 $2,400
$1,800
55+ Apartments
3-4 Stories, surface parked, typically with elevators
40-60
800 1,400
1,100
$1,600 $2,500
$2,050
IL/AL
3-4 Stories, surface parked, typically with elevators
40-60
650 900
775
$3,000 $4,000
$3,500
4-10
10-30
1,000 1,600
700 1,300
1,300
900
$1,600 $2,400
$1,400 $2,000
$2,000
$1,700
Avg. $/SF
Target Market Audience
Estimated Demand Level
$1.54
Starter families, Couple w/dogs, Empty Nesters
Up to 50 through 2026, though price band is comparable to conventional MF flats shown below, so demand can be reallocated from flats.
Garden, G-Urban, and Midrise all $1.89 attract similar audiences, but the lower the density the lower the cost, and thus more $2.06 affordable to attract more moderate incomes. In this market Garden = $50-85k, GardenUrban $60-100k, $2.25 and Midrise $65150k+
Estimated at 400 units of additional demand beyond the current pipeline (Walton and Meridian) through 2026.
$1.86
Typically 60-80 years old, 70% female, 70% couples
Demand for one smaller scale facility, under 120 units, through 2026.
$4.52
Typically 70-90 years old, heavily skews to single female
Demand for one additional facility of +/- 100 beds through 2026.
$0.92
Starter families, Couple w/dogs, Empty Nesters. HHs waiting to build/buy
Up to 50 through 2026
Detached Products
Rental SFD
SOURCE: Noell Consulting Group
3/18/2022
1-2 Stories, garage parked
3-4
2,000 3,000
2,500
$2,000 $2,600
$2,300
Location Analysis
CITY OF FAYETTEVILLE HOUSING MARKET ANALYSIS Exhibit 4 Overview of Metro Area Population Trends Atlanta-Sandy SpringsRoswell MSA
The City is located in Fayette County, within the Atlanta-Sandy Springs-Roswell Metropolitan Statistical Area (MSA). The Atlanta MSA includes 29 counties, with ten central counties belonging to the Atlanta Regional Commission (ARC) and forming the core of the MSA. Roughly 78% of the population of the MSA lives within this ten county core. From 2000 to 2010 only 67% of all growth occurred in this ten county core, however, since 2010 roughly 85% of all growth has occurred in this ten county core as younger and older generations increasingly seek walkable neighborhoods, both in urban and suburban areas. Fayette County had considerable growth from 2000 to 2010 with an annual growth rate of 1.6%. Since 2010, the County has experienced a positive growth rate of 1.0% although slower as in previous years as some cities in Fayette County, such as Peachtree City, have slowed construction. However, the story for the City of Fayetteville is more positive. The City of Fayetteville outpaced many of the fastest growing counties, from 2000 to 2010, with 3.6% annual growth. Since 2010, The City's growth rate is still strong and has outpaced all counties in the MSA except for Cherokee County from 2010 to 2020 with an annual growth rate of 1.7%.
LAND AREA
ANNUAL GROWTH
ANNUAL % GROWTH
GEOGRAPHY
SQ MILES
% MSA
2020
% of MSA
2000-10
2010-20
2000-10
2010-20
2000-10
2010-20
LAND / CAPTURE RATIO
Cherokee County
422
4.8%
266,620
4.5%
7,244
5,227
4.2%
2.2%
7.1%
5.2%
1.08
Clayton County
142
1.6%
297,595
5.0%
2,291
3,817
0.9%
1.4%
2.2%
3.8%
2.36
Cobb County
339
3.9%
766,149
12.8%
8,033
7,807
1.2%
1.1%
7.8%
7.8%
2.01
DeKalb County
268
3.1%
764,382
12.8%
2,603
7,249
0.4%
1.0%
2.5%
7.3%
2.37
Douglas County
200
2.3%
144,237
2.4%
4,023
1,183
3.7%
0.9%
3.9%
1.2%
0.52
Fayette Co. (exl. Fayetteville)
44
0.5%
100,237
1.7%
1,051
962
1.2%
1.0%
1.0%
1.0%
1.90
City of Fayetteville
150
1.7%
18,957
0.3%
480
301
3.6%
1.7%
0.5%
0.3%
0.18
Fulton Co. (excl. Atlanta)
394
4.5%
580,420
9.7%
10,079
8,010
2.3%
1.5%
9.8%
8.0%
1.78
133
1.5%
486,290
8.1%
378
6,603
0.1%
1.5%
0.4%
6.6%
4.34
Gwinnett County
430
4.9%
957,062
16.0%
21,687
15,174
3.2%
1.7%
21.2%
15.2%
3.08
Henry County
322
3.7%
240,712
4.0%
8,458
3,679
5.5%
1.7%
8.3%
3.7%
1.00
Rockdale County
130
1.5%
93,570
1.6%
1,510
836
2.0%
0.9%
1.5%
0.8%
0.56
10-County ARC Core
2,974
34.1%
4,716,231
78.8%
67,837
86,926
1.8%
2.0%
66.3%
87.3%
2.56
Exurban Counties
5,739
65.9%
1,267,876
21.2%
34,492
12,700
3.5%
1.0%
33.7%
12.7%
0.19
MSA Total
8,713
100.0%
5,984,107
100.0%
102,329
99,626
2.2%
1.8%
100.0%
100.0%
1.00
City of Atlanta
SOURCE: Noell Consulting Group, U.S. Census Bureau
3/18/2022
POPULATION
10 County Atlanta Regional Commission
CAPTURE OF REGION
CITY OF FAYETTEVILLE HOUSING MARKET ANALYSIS Exhibit 5 Description of the Primary Market Area
The City of Fayetteville is located in the center of Fayette County. Historically, Fayetteville was predominately an agricultural area of cotton fields with sprawling homes on large acre lots.
Recently, Fayetteville has worked to restore the historic streetscape and Downtown country charm, while still welcoming new residents and businesses.
Primary Market Area Comparison Area
SOURCE: Noell Consulting Group, Google Maps
3/18/2022
CITY OF FAYETTEVILLE HOUSING MARKET ANALYSIS Exhibit 6 Inbound Migration Flows for Fayette County Top Ten States Inbound Migration 1
Georgia
7,127
13%
2
New York
2,770
5%
3
Virginia
2,133
4%
4
Texas
2,020
4%
5
Ohio
1,846
3%
6
South Carolina
1,616
3%
7
North Carolina
1,527
3%
8
Tennessee
1,353
3%
9
Michigan
760
1% 1%
10 Illinois
726
Top Fifteen Counties Inbound Migration
The map in this exhibit shows the total inbound migration flows for Fayette County, Georgia utilizing 20152019 5-Year American Community Survey (ACS) Data. The leading out of market states are New York and Virginia representing retirees that are largely settling at locations closer to children and family. The county is very diverse with 67% local migrants with 23% of migrants coming from out of state or abroad. Naturally, most of the local migrants come from neighboring Walton County, Clayton County, and Fulton County --with in-Fayette same county migration at nearly 35%.
1
Walton County
Georgia
966
2
Clayton County
901
3
Fulton County
Georgia Georgia
4
Franklin County
Ohio
722
5
Chesterfield County
Virginia
703
6
Coweta County
Georgia
674
7
Harris County
Texas
653
8
Shelby County
Tennessee
592
9
Rockdale County
Georgia
572
10 Kings County
New York
512
11 Richland County
South Carolina
454
12 Wayne County
Michigan
448
13 Queens County
New York
433
14 Richmond County
New York
404
15 Henry County
3/18/2022
381
Georgia
Where Residents Migrate From Same County 5% 35%
28% 32%
SOURCE: Noell Consulting Group, US Census Bureau
746
Different County, Same State Different State Abroad
CITY OF FAYETTEVILLE HOUSING MARKET ANALYSIS Exhibit 7 Migration Demographics for Fayetteville, 2017 Percentage of Renters Among In-Migrants
7 75 years and over
70 to 74 years
Moved From Abroad
65 to 69 years
41% 59%
Moved From Different State
43%
57%
60 to 64 years
55 to 59 years
50 to 54 years
Moved Within County
45 to 49 years
26%
Different County, Same State
74%
40% 60%
40 to 44 years
35 to 39 years
30 to 34 years
26.8%
25 to 29 years 0
20
40
60
80
100
120
140
Moved from abroad
Moved from different state
Moved from different county within same state
Moved within same county
160
180
Renter vs Owner for Current Residents
73.2%
Renter Owner
In this exhibit NCG looks at the inbound migration data for the census defined City of Fayetteville. The graph on the left shows where people who moved to the City are coming from. For those who are new to market, those aged below 55 largely originated in other Georgia counties. That trend declines with the three age tiers from ages 55-60 and reemerges at the 65 and up age group. Among those three groups, intra-county migration was the most popular. Migrants from abroad were more heavily leaving ownership positions (59%) and migrants from other states were in a very similar position, 60% ownership positions. However, persons moving within Fayette County showed a heavy distribution of renters, 74% renters, over homeownership, 26%, who had moved within the County. Current residents in Fayetteville skew toward owning, 73%. SOURCE: Noell Consulting Group, US Census Bureau
3/18/2022
CITY OF FAYETTEVILLE HOUSING MARKET ANALYSIS Exhibit 8 Change in Population Density (Per Sq. Mile)
Population Density 2010 Census
Population Density 2022 5-Year ACS
The maps above show the change in population density around the City of Fayetteville. As illustrated by the concentrations of color, density of the area is centered around Fayetteville and spreads towards the cores of Peachtree City and Tyrone. The area around Downtown Fayetteville grew from 3,426 people per square mile to 3,786 from 2010 to 2022 - demonstrating a 10% increase in population density. SOURCE: Noell Consulting Group, Social Explorer
3/18/2022
CITY OF FAYETTEVILLE HOUSING MARKET ANALYSIS Exhibit 9 Change in Educational Attainment
Bachelor Degrees 2010 Census
Bachelor Degrees 2019 5-Year ACS
The maps in this exhibit show the change in the population, per census tract, aged 25+ that have obtained a bachelor's degree or more using the 2010 Census and 2019 5-Year ACS (American Community Survey) data. Historically, college educated individuals in Fayette County have been concentrated in the west and south west near Peachtree City and Tyrone, but over the past few decades college educated individuals have been pushing west increasing the educational attainment in Downtown Fayetteville, and Fayette County, as a whole. This surge is primarily due to many people being priced out of more established neighborhoods to the west. NCG believes, based on available data, educational attainment will continue to growth in the coming years. SOURCE: Noell Consulting Group, Social Explorer
3/18/2022
CITY OF FAYETTEVILLE HOUSING MARKET ANALYSIS Exhibit 10 Change in Median Household Income
Median Household Income 2010 Census
Median Household Income 2019 5-Year ACS
The maps above show the change in median household income above per census tract within Fayette County. Downtown Fayetteville shows an average median household income of $52,700 to $83,500 in 2019. There has been increases in median income throughout the city with concentrations of high-earning households to the west and south. There is a massive cluster of high earning households to the south and west of Fayette County which is predominantly family/empty nester homeowners who want to live close by one of Fayette County's highest rated schools. SOURCE: Noell Consulting Group, Social Explorer
3/18/2022
CITY OF FAYETTEVILLE HOUSING MARKET ANALYSIS Exhibit 11 Change in Median Home Value
Median Home Value 2010 Census
Median Home Value 2019 5-Year ACS
The above maps show the change in median home value of owner-occupied housing. Downtown Fayetteville stands out slightly with a 4% decrease in median home value since 2010. Further, the combined median home value of Downtown Fayetteville is 30% less than the Fayette County median home value of $281,400. While Downtown has some varying home values depending on the side of town you are on, the highest home values are concentrated to the west, in Peachtree City and Tyrone, as well as south of the city. The disparity can be attributed to a deficit of new housing being built in Downtown Fayetteville, as well as Peachtree City being an alternative solution to Downtown living. SOURCE: Noell Consulting Group, Social Explorer
3/18/2022
CITY OF FAYETTEVILLE HOUSING MARKET ANALYSIS Exhibit 12 Change in Family Households
Married-Couple Family Households With Children 2010 Census
Married-Couple Family Households With Children 2019 5-Year ACS
The above maps show the percentage of households, per census tract, that consist of a married-couple family household with children under the age of 18. Downtown Fayetteville showed 22% of this household type--a 15% decrease since 2010. A number of factors play into decreasing family households, such as aging population, younger families being priced out, better schools being located in Peachtree City, etc. but a more plausible explanation is that as the children leave the household and go to college, the parents then become empty nesters. As you will see later in the analysis, the population aged 18-34 is increasing as well as the over 55 population which confirms the exodus of 18 year olds from Fayette County to college. SOURCE: Noell Consulting Group, Social Explorer
3/18/2022
CITY OF FAYETTEVILLE HOUSING MARKET ANALYSIS Exhibit 13 Change in the Older Adult Population
Age: 55 + 2010 Census
Age: 55 +
2019 5-Year ACS
The maps above show the concentration of the population, per census tract, aged 55+. Downtown Fayetteville's surrounding community has seen an increase in population of people over 55 years of age. Since 2010, the tracts containing Downtown Fayetteville have seen the 55+ population grow more than 10% - consistent with the steady growth seen in neighboring areas. Peachtree City has seen a significant concentration and growth of residents aged 55 and over. This bodes well for Downtown Fayetteville as these persons are strong candidates for a downsize value play. SOURCE: Noell Consulting Group, Social Explorer
3/18/2022
CITY OF FAYETTEVILLE HOUSING MARKET ANALYSIS Exhibit 14 Change in the Younger Population
Age: 18-34 2010 Census
Age: 18-34
2019 5-Year ACS
This exhibit examines age of residents as of 2019 to examine the growing number of 18-34 aged cohorts in a given area. Downtown Fayetteville has seen an increase of younger demographics in the southern area of the City and a decline in younger populations in the northern area of the City. The shift in age is predominantly due to great schools being located to the west by Peachtree City and South of the City, as well as job cores for younger demographics located to the west, Trilith Studios and Piedmont Hospital, and manufacturing jobs to the east/north of the City. SOURCE: Noell Consulting Group, Social Explorer
3/18/2022
CITY OF FAYETTEVILLE HOUSING MARKET ANALYSIS Exhibit 15 Proximity and Connection of Fayetteville to Jobs Proximity to work is a key factor for residents choosing where to live. There are over 33,000 jobs paying at least $40,000 per year within 10 miles of the study area. The most popular sector within this area is educational services (15% of jobs) followed by Health Care and Social Assistance (12%) and Manufacturing (11%.) You can see the majority of jobs are concentrated along Highway 74 through Tyrone and Peachtree City, as well as Highway 85 through Kenwood and Downtown Fayetteville. The Downtown b eing farther away from the I-85 corridor that houses major job centers, such as the Airport, is a hindrance to the City and has lead to the exponential growth of Tyrone and Peachtree City. However, with new commercial development, Downtown Fayetteville will be able to provide more local employment options. Density of Jobs over $40k/year within 10 miles of Downtown Fayetteville (2019)
Employment w/in 10 Miles - Top 10 Industry Sectors Educational Services
15%
Health Care and Social Assistance
12%
#N/A
#N/A
Construction
10%
Public Administration
9%
Wholesale Trade
9%
Retail Trade
9%
Professional, Scientific, and Technical Services
10 Miles Jonesboro 5 Miles
6%
Transportation and Warehousing
3Miles Tyrone
5%
Administration & Support, Waste Management and Remediation
4% 0
1,000
2,000
3,000
4,000
5,000
6,000
Total Employment by Distance from Downtown Fayetteville Peachtree City 10 Miles
33,522
5 Miles
8,180
3 Miles
5,260
0
5,000
10,000
15,000
20,000
25,000
30,000
35,000
SOURCE: Noell Consulting Group, Google Maps, OntheMap, Gwinnett County
3/18/2022
Fayetteville Pavilion
CITY OF FAYETTEVILLE HOUSING MARKET ANALYSIS Exhibit 16 Fayetteville Jobs Fayetteville employs 14,310 people in the city limits. The largest employment sectors within the city are Healthcare and Social Assistance, followed by Construction and Public Administration. The City is broken down into Construction/manufacturing/warehouse jobs concentrated to the east and north, medical and techni cal jobs to the west, and public administration jobs concentrated in Downtown. Roughly 41% of City employees earn more than $3,333 per month or $40,000 annually, 31% earn between $1,250 -$3,3333 a month ($15,000 - $40,000 annually), and 28% earn less than $1,250 per month ($15,000 annually). Of the 14,310 employees, 13,609 live outside of Fayetteville's limits and commute in, po inting to what could be a lack of housing options for employees nearby. 701 Fayetteville residents live and work within the City, and 6,759 of residents commute out of the City for work.
Jobs by Earnings
More than $3,333 per month, 41%
Total Jobs in Fayetteville (2019)
$1,250 per month or less, 28%
Fayetteville Pavilion $1,251 to $3,333 per month, 31%
Inflow/Outflow of Workers
4.9% of total employees live and work in Fayetteville compared SOURCE: Noell Consulting Group, Google Maps, OntheMap, Gwinnett County 3/18/2022
Downtown Fayetteville
CITY OF FAYETTEVILLE HOUSING MARKET ANALYSIS Exhibit 17 Study Area Resident Work Outflow, Residents Earning Over $40,000/Year
Commuting patterns of residents can help identify target audiences for residential development. While residents making over $40k/year within a 4-mile radius work all over the metro Atlanta area, the highest concentration (12%) work at the Airport. A substantial amount work in nearby cities Fayetteville (8%) and Atlanta (5%).
ALPHARETTA KENNESAW DULUTH MARIETTA
LAWRENCEVILLE NORCROSS
Top 10 Workplace Locations (By Zip Code) 14% ATLANTA
12% 12%
10%
8%
8%
STOCKBRIDGE
6% 5%
4%
4%
FAYETTEVILLE 3%
2%
0%
COVINGTON
COLLEGE PARK
3%
2%
MCDONOUGH
PEACHTREE CITY 2%
2%
NEWNAN
#N/A
3-Mile radius from DT Lawrenceville
SOURCE: Noell Consulting Group, Google Maps, OnTheMap
3/18/2022
CITY OF FAYETTEVILLE HOUSING MARKET ANALYSIS Exhibit 18 Downtown Fayetteville Work Inflow, Residents Earning Over $40,000/Year
In the previous exhibit we looked at where residents of Fayetteville work. This exhibit shows where people who work inside the Fayetteville limits are commuting in from. The majority of jobs paying more than $40k/year in Fayetteville are in the healthcare or public administration fields. Roughly 17% of people who work within 4-miles of Fayetteville are already living close by and within the city. Another 12% of workers live nearby in Tyrone, Peachtree City, and Jonesboro.
DOWNTOWN ATLANTA
As the chart points out, Fayetteville is a central location where the majority of workers in a 4 mile radius South of I-20 prefer to live.
HARTSFIELD JACKSON AIRPORT
Top 10 Resident Locations (By Zip Code) 12%
STOCKBRIDGE JONESBORO
11%
10%
8%
FAYETTEVILLE
MCDONOUGH
8%
TYRONE
6%
PEACHTREE CITY NEWNAN 5%
4%
4%
3%
3%
3%
3%
3%
SENOIA
2%
0%
#N/A
3-Mile radius from DT Lawrenceville
SOURCE: Noell Consulting Group, Google Maps, OnTheMap
3/18/2022
CITY OF FAYETTEVILLE HOUSING MARKET ANALYSIS Exhibit 19 Crime Near the Subject Site
Douglasville
Atlanta
Stockbridge Fayetteville
McDonough
Newnan
The heat map within this exhibit shows area crime in relation to the City (provided by Crimegrade.com). The majority of crime in the City of Fayetteville occurs in the east side of the city and east neighborhoods. However, this pales in comparison to the amount of crime occurring in more established areas of Georgia, such as Atlanta, as well as some areas of Georgia similar to the Fayetteville area, Marietta and Douglasville, and those cities south of I-20 such as Stockbridge, McDonough, and Newnan. A low crime rate is excellent for future families moving to the area who want a safe place to raise a family. SOURCE: Noell Consulting Group, Crimegrade.com 3/18/2022
CITY OF FAYETTEVILLE HOUSING MARKET ANALYSIS Exhibit 20 Commuting from the City
Hartsfield-Jackson Airport 25-30 minutes
The map in this exhibit is a heat map showing commute times via automobile in the Charleston, SC metro area per data from the website Trulia.com. Stockbridge 35-40 minutes The subject site's proximity and future
direct connectivity to I-26, and from there I526, offers excellent access to the major job centers in the Charleston metro area.
Tyrone 15-20 minutes
Peachtree City 15-20 minutes Newnan 40-45 minutes
The site's location provides excellent access to Downtown Charleston's jobs and entertainment, while also providing convenience to other job markets through McDonough out the metro area. This central location 35-40over minutes provides a strong advantage competing properties in Mt. Pleasant, West Ashley, and Daniel Island as these areas offer limited proximity to job cores and entertainment options. This central location will be very attractive to split commuting couples / roommates, in which one roommate might work Downtown and the other at Boeing.
The map in this exhibit is a traffic map showing commute times via automobile in and around the Fayette County area per data from Google Maps. The City of Fayetteville's proximity to I-85 and I-75 hinders the location slightly, hence why other cities such as Newnan and Peachtree City have grown considerably given their g ood interstate access. However, Fayetteville is still within adequate driving distance to major employment cores such as Hartsfield-Jackson Airport, South Atlanta, and along I-85 and I-75 which are only 7- 13 miles (15-20 mins) away. Further, as seen previously in the work inflows map we see that the majority of workers live in the cities highlighted above as well a s work locally within the city or commute to the cores listed above. SOURCE: Noell Consulting Group, Trulia.com 3/18/2022
CITY OF FAYETTEVILLE HOUSING MARKET ANALYSIS Exhibit 21 Access to Bars & Restaurants Living close to restaurants and bar options is a key factor for many households when choosing where to locate, as well as for businesses when choosing office space. The heat map within this exhibit shows restaurant and bar options near the City that have been reviewed by users of Yelp.
TRILITH
PEACHTREE CITY
DOWNTOWN FAYETTEVILLE
There are more than two dozen dining options and bars in Downtown Fayetteville. Although the majority of dining options in Downtown are chain restaurants, there are some more boutique options such as Line Creek Brewery and City Cafe and Bakery. Farther west there are more options. geared towards a fancier dining experience at Trilith Studios. Farther west is Peachtree City which has a plethora of dining options from Breweries like Line Creek to Ted's Montana Grill. In terms of walkability, there are some restaurants within walking distance to Downtown, however most are accessible with a short drive. Although Downtown is well served, it will be important for the city to allow more unique infrastructure, like breweries or a dog park with beer and food. To the extent this can be maximized, the stronger the appeal of Downtown Fayetteville being seen as a lifestyle amenity that many residents coming from the north seek.
SOURCE: Noell Consulting Group, Yelp, Bing Maps
3/18/2022
CITY OF FAYETTEVILLE HOUSING MARKET ANALYSIS Exhibit 22 Access to Retail
FAYETTEVILLE
As with restaurants and bars, living close to retail and grocers is an important factor to residential households when choosing where to live and to an extent, office decision makers when choosing where to locate their business. By pulling Yelp data from the area we are able to visualize where key retail and shopping nodes are in relation to the City.
FAYETTEVILLE THE AVENUE
PEACHTREE CITY
PEACHTREE
SOURCE: Noell Consulting Group, Yelp, Bing Maps
3/18/2022
The largest retail corridors in Fayette County are located in Downtown Fayetteville and Peachtree City. Downtown Fayette offers a lot of shopping/retail options from large chain stores like Dick's or JCPenney as well as many grocery options such as Kroger and Publix. Peachtree City has many of the same offerings as well as some more boutique shopping/grocery options, such as Sprouts. All in all, the level of retail/shopping is more than suitable for the area. Future development ideas would be to add higher level shopping and retail to the area such as a Sprouts as the median income increases.
CITY OF FAYETTEVILLE HOUSING MARKET ANALYSIS Exhibit 23 Walkability Fayetteville Overall
Walkable environments are key to economic competitiveness and creating healthy communities. Increasingly, Millennials and sen iors are looking for walkable environments, with studies showing 80% of 18 to 34-year olds want to live in walkable neighborhoods and per AARP surveys roughly 60% of those over 50 want to live within one mile of daily goods and services. Christopher Leinberger of George Washington University completed a study of WalkUPs (Walkable Urban Places) throughout the na tion, including Atlanta, and discovered that office, retail, and rental housing achieved 30%, 144%, and 12% premiums respectively over their drivable, suburban counterparts. Furthermore, a s tudy completed by the Wall Street Journal indicated a 1.69% premium in home prices for a one-point increase in Walk Score. The City of Fayetteville is "Somewhat Walkable" according to Walk Score with much of the area still being dependent on vehicles to access grocery/retail/entertainment. However, foot traffic is still active in the area as shown by the white line s on The Strava map, Top Right map, Peachtree City's walkscore is very similar to the City of Fayetteville yet they have an infrastructure that allows golf carts to take presence over foot travel. To increase the Walkability of the City of Fayetteville, the city could invest in more sidewalks as well as nature trails to increase foot traffic to the area which will be a major draw for empty nesters as well as younger audiences. SOURCE: Noell Consulting Group, WalkScore, Strava
3/18/2022
CITY OF FAYETTEVILLE HOUSING MARKET ANALYSIS Exhibit 24 City School Districts
North Fayetteville Assigned Schools
South Fayetteville Assigned Schools
SOURCE: Noell Consulting Group, Great Schools
3/18/2022
This exhibit presents context with regard to the local school offerings in the City of Fayetteville, the north city limits and south city limits are separated out. Downtown Fayetteville's assigned elementary, middle, and high schools rank above average in quality. After market interviews, the highly rated schools are a major draw to younger families coming to the area and buying in the Downtown area, though this face should not turn off prospective family buyers with older aged children or emptynester/downsizer audiences not affected by the assigned schools.
BRANCH PROPERTIES, LLC LAUREL ISLAND MARKET ANALYSIS
Demographic Analysis
CITY OF FAYETTEVILLE HOUSING MARKET ANALYSIS Exhibit 25 City Demographic Profile 2022 Fayetteville captures roughly 17% of Fayette County's population, with a 2022 census estimate of 18,853 persons and 7,194 households living in the city. Fayetteville has a smaller population in comparison to similar Atlanta suburbs including Newnan, Peachtree City, and McDonough. Fayetteville's population is fairly diverse across age, race, and income cohorts. While being historically more rural than suburban analogs, recent development activity and housing market trends have fueled growth in Fayetteville.
City of Fayetteville Population 2022 Census Estimate 18,853 Households 7,194 Fayetteville Capture of County 2022 Census Estimate Households
17% 17%
Fayetteville Population by Age
65+ 18%
45-64 28%
Under 14 17%
Population
25-44 22%
Households
46,840
50,000 45,000 40,000 35,000 30,000 25,000 20,000 15,000 10,000 5,000 -
37,801 29,829 18,853
16,189
Newnan
13,938
Peachtree City
Fayetteville Population by Race Other 2% Two+ Asian Races 7% 4%
10,869
7,194
McDonough
Fayetteville
Fayetteville Household Income $150k+, 22%
Black 41%
Under $35k, 16% $35k- $50k, 10%
White 46%
15-24 15%
Source: NCG, US Census Bureau, Spotlight by Environics Analytics
3/18/2022
City Comparisons
112,303 42,919 2022 Census Estimates
Fayette County Population 2022 Census Estimate Households
$75k $150k, 35%
$50k $75k, 17%
CITY OF FAYETTEVILLE HOUSING MARKET ANALYSIS Exhibit 26 City Demographic Profile and Change 2010, 2022, and 2027 City of Fayetteville Population Census Count 2010 Census 15,945 2022 Census Estimate 18,853 2027 Census Estimate 19,918
Increase % Ann. Growth 2,908 1.52% 1,065 1.13%
Population by Age
2010
2022
Age 0 - 4 Age 5 - 9 Age 10 - 14 Age 15 - 17 Age 18 - 20 Age 21 - 24 Age 25 - 34 Age 35 - 44 Age 45 - 54 Age 55 - 64 Age 65 - 74 Age 75 - 84 Age 85+
778 1,097 1,326 875 573 579 1,367 2,259 2,636 2,051 1,252 773 379
866 1,020 1,271 866 772 1,012 1,829 2,258 2,492 2,624 2,170 1,170 503
Population by Race
2010
2022
White Alone 9,571 Black/African American 4,796 American Indian/Alaskan Native 54 Asian Alone 856 Native Hawaiian/Pacific 17 Some Other Race Alone 236 Two or More Races 415
8,649 7,700 73 1,368 32 334 697
Change 20102022 88 (77) (55) (9) 199 433 462 (1) (144) 573 918 397 124 Change 20102022 (922) 2,904 19 512 15 98 282
Source: NCG, US Census Bureau, Spotlight by Environics Analytics
3/18/2022
Households Owner Renter Total 2027 Est. 925 926 1,088 840 806 1,205 2,336 2,016 2,484 2,847 2,618 1,279 548 2027 Est. 7,965 9,020 81 1,604 38 382 828
Change 2022-2027 59 (94) (183) (26) 34 193 507 (242) (8) 223 448 109 45 Change 2022-2027 (684) 1,320 8 236 6 48 131
2010 4,561 1,433 5,994
MILLENNIALS
2022 5,117 2,077 7,194
Increase 556 644 1,200
% Ann. Growth 1.02% 3.75% 1.67%
EMPTY NESTERS
The City of Fayetteville has steadily grown since 2010. Based on 2027 census based estimates, the strongest growth will have occurred from 2010 - 2022 with an 18.2% population increase, or just over 1.5% per year. That growth primarily came from increases in the population aged 18 - 34 and 55 - 85+, and the Black/African American and Asian populations. This points to a growing number of young singles and professionals as well as empty nesters and retirees - many of whom will require greater variety in housing products. Decreases in the population age 5 - 17 and 35 - 54 indicate there are fewer families with young children in Fayetteville, again signaling a need for a variety of housing products
CITY OF FAYETTEVILLE HOUSING MARKET ANALYSIS Exhibit 27 Age and Income Analysis of the City of Fayetteville and Comparison to Fayette County 2000 - 2022 (Estimates) PMA Total Household Growth 2000 - 2022
15 - 24
25 - 34
35 - 44
45 - 54
55 - 64
65+
Total
$0 - $25,000
-26
-40
9
6
64
43
56
$25,000 - $35,000
-18
15
42
5
-65
178
157
$35,000 - $50,000
-17
-82
-89
-15
24
241
62
$50,000 - $75,000
116
-12
11
-97
59
138
215
$75,000 - $100,000
9
70
-50
12
153
248
442
$100,000 - $150,000
0
73
126
89
163
434
885
$150,000 - $200,000
0
28
51
149
174
139
541
$200,000 +
0
35
80
252
276
79
722
Total
64
87
180
401
848
1,500
3,080
City of Fayetteville Fayette County
The City of Fayetteville has seen very strong growth among all age and income cohorts, outpacing the rest of Fayette County in almost all categories. Fayetteville has grown by approximately 3,080 households from 2000-2022, and currently has 7,194 households in the city limits. The city's growth is primarily fueled by increases in households aged 15-24 and 55+ and households who earn more than $100,000 annually. This growth in affluence has contributed to growth in development of large single family homes, but growth in other household incomes and ages should also be supported by growth in diverse housing product and options.
Household Growth by Income
Household Growth By Age (HHs $50k+ Only) 7.6%
65+ 55 - 64
4.5%
45 - 54 35 - 44
0.3% -1.3%
5.6%
$150,000 - $200,000
2.1%
$100,000 - $150,000
1.3%
$75,000 - $100,000 2.8%
25 - 34
$50,000 - $75,000
2.3%
15 - 24 -3.0%
9.4%
-1.0%
1.0%
3.0%
5.0%
7.0%
City of Fayetteville
9.0%
14.5%
11.0% 13.0% 15.0% 17.0%
Fayette County
Source: NCG, US Census Bureau, Spotlight by Environics Analytics
3/18/2022
10.3% 9.5%
$200,000 +
8.5%
-0.1%
0.3% 1.0%
2.0% 2.5%
6.4%
0.5%
$35,000 - $50,000-1.2% -2.0%
4.7% 5.1%
0.0%
2.0%
City of Fayetteville
4.0%
6.0%
Fayette County
8.0%
10.0%
12.0%
CITY OF FAYETTEVILLE HOUSING MARKET ANALYSIS Exhibit 28 Summary of Renter Households in the City of Fayetteville, 2022 Income/Age Less than $15,000 $15,000 - $24,999 $25,000 - $34,999 $35,000 - $49,999 $50,000 - $74,999 $75,000 - $99,999 $100,000 - $149,999 Income $150,000 + Total
15 - 24
25 - 34
35 - 44
45 - 54
55 - 64
65 - 74
75 - 84
85+
Total
1 0 0 0 35 2 0 0 38
75 14 149 57 187 80 46 22 630
54 15 83 39 114 65 52 31 454
76 4 37 73 101 75 60 75 501
24 1 7 16 21 15 11 14 109
29 4 31 32 22 16 15 6 155
35 6 41 33 18 9 8 2 153
11 2 10 8 3 2 1 0 38
306 46 359 259 501 264 193 150 2,077
Of the 7,194 households in Fayetteville, roughly 29% or 2,077 are renter households. Of the renter households, 34% of them earn less than $35,000 a year, 24% earn between $50,000 $75,000, and 29% earn more than $75,000 annually. Households earning less than $35,000 annually are likely renting due to income restrictions and a lack of affordable housing options, but there is a strong share of renters who could afford to own but choose to rent. Renters are split fairly evenly amongst household type (singles, married couples, and other family), and age distribution (25-34, 35-44, and 45-54).
Target Market Income Distribution Income $150,000 + 7%
Target Market Age Distribution
$15,000 $24,999 2%
$100,000 $149,999 9% $75,000 $99,999 13% $50,000 $74,999 24%
$25,000 $34,999 17%
$35,000 $49,999 12%
75 - 84, 7.5% 65 - 74, 7.6%
15 - 24, 1.8%
Roommates 0.1%
25 - 34, 30.9%
55 - 64, 5.4%
Singles 30.9%
Married Couples 29.0%
45 - 54, 24.6%
SOURCE: Noell Consulting projections based on data obtained from the US Census and Claritas, Inc.
3/18/2022
Target Market HH Type Distribution
35 - 44, 22.3%
Other Family…
Unmarried Couples, 5.9%
CITY OF FAYETTEVILLE HOUSING MARKET ANALYSIS Exhibit 29 Typical Class A Renter Audiences and Opportunity Level and Product Type for City of Fayetteville Young Professionals
Empty Nesters
Singles over 35 seek Couples mostly in their 30s, Professionals working in the Mature couples and empty convenience in quieter with some late 20s and area seeking a lifestyle and nesters. Established and setting. Many have relocated early 40s. A mix of recently easy access to employment seeking home close to work to the area for work and may married and dating. May be and entertainment. and in the suburbs. choose to rent before buying. recent relocatees.
Families
Students/ Roommates
New parents and those with young and early school-aged children. Some single parents working in the area.
Students, recent graduates, and working roommates who moved our of their parents homes or are new to the area for jobs and school.
Use unit as crash pad and Tend to stay in more than A true home. Eat-in most Eat-in more often, but still Seeking space and place to unwind. Often more younger counterparts. More nights and host friends on a Most space for the money enjoy going out. Tend to functionality. Values finish active/out and about. Trade likely to cook and host. Value regular basis. seek spacious and keeping absolute rents stay local. Value amenities, levels and amenities but space for less rent. space, quality, but not kitchen and living areas. lower. Larger floorplans and have friends over on a will make trade-offs for Appreciate well-executed excessive finishes, and Often down-sizing and need with a minimum of 2BRs. frequently. price. building amenities. functional unit layouts. extra storage.
Income
$35,000-$75,000
$75,000-$150,000
$75,000-$200,000
$100,000-$200,000+
$75,000-$150,000
$50,000-$75,000
Typical Rent
$1,000 - $2,000
$1,500 - $3,000
$1,500 - $3,750
$2,500+
<$2,000
$1,500 - $2,000
Age Range
22 - 35
35 - 55
25-44
45-64
+35
18-24
Market Mix
25%
15%
30%
15%
10%
5%
STRONG
MODERATE
STRONG
MOD. BUT GROWING
MODERATE
LIMITED
Seek areas with a trendy local perception and proximity to entertainment, employment and retail. Downtown core and Trilith only areas in the County that feature this.
Value proximity to employment and retail, but will generally prefer quieter neighborhood areas.
Level of Opportunity for New Growth in City
Can afford higher end Typically either temporary product with dual incomes, Many will rent units while renters who want space will likely be saving to buy a waiting for homes to be built, for a growing family while home in the future. Often but a growing segment is waiting to build/buy, or look for more spacious choosing a rental lifestyle. lack financial means to product types. purchase.
Limited by higher rents in newer Class A, but still a small audience.
Distribution by Product Type TH/Villa Conventional Flats 55+ AgeTarg./Rest. SFD Summary:
20%
20%
20%
25%
50%
40%
25% 1%
80%
70%
70%
15%
10%
60%
58% 89%
-
10%
-
20%
-
-
5%
-
-
10%
40%
40%
-
13% 10%
The City of Fayetteville's diverse renter audiences lead to the potential support for a variety of rental product types, beyond the predominately conventional rental flat communities already in-place or in the coming pipeline. Consideration should be given to rental TH/villa, and/or 55+ rental communities.
SOURCE: Noell Consulting Group
3/18/2022
Est. Existing Mix
How They Use Their Units
Professional Couples
Market Indicated Mix
Description
Mature Singles
0%
CITY OF FAYETTEVILLE HOUSING MARKET ANALYSIS Exhibit 30 Summary of Owner Households in the City of Fayetteville PMA, 2022 Income/Age Less than $15,000 $15,000 - $24,999 $25,000 - $34,999 $35,000 - $49,999 $50,000 - $74,999 $75,000 - $99,999 $100,000 - $149,999 Income $150,000 + Total
15 - 24
25 - 34
35 - 44
45 - 54
55 - 64
65 - 74
75 - 84
85+
Total
0 0 0 0 0 0 0 0 0
13 18 34 22 111 82 76 40 395
22 44 45 36 163 160 205 135 811
30 12 19 63 136 172 220 312 965
55 24 23 83 165 208 238 346 1,142
49 49 68 119 126 156 235 106 909
52 61 82 110 94 78 116 39 632
32 38 39 50 31 30 31 12 262
252 247 310 484 827 886 1,121 991 5,117
There are approximately 5,117 households, 71% of the total households, who own their housing units in Fayetteville. Of the owner households, 25% earn less than $50,000 a year, 33% earn between $50,000 - $100,000, and a solid 41% earn more than $100,000 annually. Most home owners are married couples, between the ages of 45-64, and earn over $100,000. There is a strong share of singles and households aged 25-34 who also own homes in Fayetteville.
Target Market Income Distribution
Income $150,000 + 20%
$100,000 $149,999 22%
$15,000 $25,000 $24,999 $34,999 4% 6%
25 - 34 75 - 84 8.1% 13.0%
$35,000 $49,999 9%
$50,000 $74,999 16% $75,000 $99,999 18%
Source: NCG, Nielsen, US Census Data
3/18/2022
Target Market Age Distribution
65 - 74 18.7%
55 - 64 23.5%
Target Market HH Type Distribution Non-Related Roommates, 1.5%
35 - 44 16.7%
45 - 54 19.9%
Singles, 24.4%
Other Family, 12.8%
Married Couples, 61.4%
CITY OF FAYETTEVILLE HOUSING MARKET ANALYSIS Exhibit 31 Typical Market Rate Buyer Audiences and Opportunity Level and Product Type for City of Fayetteville Market Audience
Single Prof.
Prof. Couples
Young Families
Established Families
Seniors / Widows
Est. Existing Mix
Mature couples who are Retired senior couples and either looking to simplify some widows who are lifestyle with smaller looking for a maintenance homes, or upgrade to free lifestyle but don't want accommodate to leave the area. Will grandchildren and family appreciate quality and may visitors. Most likely to have money from prior purchase homes in pre- home sale to spend, but sale phases or build will be modest in spending custom dream homes to retirement incomes and retire in. likely to downsize.
Market Indicated Mix
Young and mature Typically fairly affluent Mix of first-time and moveprofessionals seeking dual working couples, up buyers from existing Established families with access to employment and primarily 35-45, value product in the market, or older children and entertainment. Often more both work access and relocates from out of teenagers. May include active/out and about. More neighborhood quality. market. Looking for a some executive willing to trade space for Most likely first time home that offers room to households and price. Often between the home buyers ready to grow as the family corporate employees, or Description ages of 20-35, and many settle in the suburbs, or expands. Will be divorced households and coming out of apartments looking for the best value concerned with school single parents. Likely nearby, or graduating and home for a decent price. districts, neighborhood upgrading into larger coming back to where they Often coming from rental safety, and where other homes or moving in from grew up and looking to communities in the City, young families are out of market. purchase their first home at as well as out-of-market located. an affordable price. move-ins.
Empty Nesters
Small Lot SFD
40%
40%
30%
10%
60%
70%
36%
5%
Conventional SFD
10%
30%
50%
60%
20%
10%
38% 16%
Estate Lot SFD
-
5%
10%
30%
5%
0%
13% 74%
Townhome/ Duplex/Condo
50%
25%
10%
-
15%
20%
13%
Income Range
$50,000 - $150,000
$100,000 - 200,000
$75,000 - 200,000
$150,000 - 500,000
$150,000+
$75,000+
Sale Price
Mostly under $400k
$400,000 - $600,000
$300,000 - $600,000
$450,000 - $1M+
$450,000+
$300,000 -$450,000
5%
15%
20%
30%
20%
10%
Estimated Mix in the Market
Typical Distribution by Product Type
5%
Citywide we believe Fayetteville has a lack of product diversity, with an estimated 90% being conventional single-family homes and/or estate homes. This leaves very little opportunity for those looking for lower price points, maintenance-free products, and/or homes in a more walkable lifestyle option. An estimated 50% of the market audiences have the majority of their preferences being non-typical SFD products, leaving a significant market gap. Also worth noting is that many of the under represented housing products are more dense, helping to justify higher land prices and smaller parcel sizes which is a majority of the undeveloped land in the City, but also helping to keep absolute home affordability.
SOURCE: Noell Consulting Group
3/18/2022
CITY OF FAYETTEVILLE HOUSING MARKET ANALYSIS Exhibit 32 Fayetteville Growth, Gentrification, and Implications to New Housing Product Needs Fayetteville Household Projected Growth Next 5 Years by Age and Income, 2022 - 2027 Income/Age
Min-Max Rent at 20Min-Max Sales 33% Income Price at 3x Income
15 - 24
25 - 34
35 - 44
45 - 54
55 - 64
65 - 74
75 - 84
85+
Total
Less than $15,000
-1
4
-13
-12
-14
3
0
-3
-36
$15,000 - $24,999
0
5
0
-1
0
4
9
6
23
$25,000 - $34,999
1
-9
-31
-16
-12
-24
-31
-16
-138
$35,000 - $49,999
1
12
-9
-1
16
33
11
11
74
$583 - $1,389
$105,000 - $149,999
$50,000 - $74,999
13
12
-64
-44
-27
4
-4
2
-108
$833 - $2,083
$150,000 - $224,999
$75,000 - $99,999
1
28
-38
-27
-14
36
10
4
0
$1,250 - $2,778
$225,000 - $299,999
$100,000 - $149,999
1
45
-22
-3
15
95
34
12
177
$1,667 - $4,167
$300,000 - $449,999
Income $150,000 +
0
50
27
95
143
95
23
6
439
$2,500+
$450,000+
Total
16
147
-150
-9
107
246
52
22
431
Land/construction costs do not justify without substantial subsidy
Market Risk Level High - Decreasing opportunity for the private sector to hit these price points without subsidy Medium - Moderate ability for the private sector to deliver this product without subsidy Low - Strong ability for the private sector to deliver this product without subsidy Without the ability for new housing stock to hit the potential demand levels, particularly rental product below $800 and for-sale product below $200,000, demographic projections forecast a loss in households earning less than $75,000, and the majority of future growth is projected from those earning greater than $100,000 through 2027. While much of the new apartment development is obtainable for those earning above $75,000, land and constriction costs are making it harder for those earning under $75k, and especiall y under $50k to rent in the community, making renter households earning $25-35k the most at risk. Garden apartments represent the best market based opportunity to solve this, or relying on LIHTC subsidized deals. New single-family homes are generally obtainable for those earning above $150,000, but it is largely only townhome and/or condominiums that are affordable to those earning $75-150k. Increasing land and construction costs are making it considerably harder for those earning $75-100k (often young singles/couples and starter families) to purchase. This makes those in the estimated 113-150% AMI levels ($75-100k) the most at risk. Starter townhomes, including one bedrooms and those without garages to maximize affordability, represent the best opportunity to solve this.
SOURCE: Noell Consulting Group based on data obtained from US Census and Claritas.
3/18/2022
CITY OF FAYETTEVILLE HOUSING MARKET ANALYSIS Exhibit 33 Fayetteville Depth For Affordable Units Fayetteville Households by Age and Income, 2022 15 - 24
25 - 34
35 - 44
45 - 54
55 - 64
65 - 74
75 - 84
85+
Total
AMI Levels (Based on 2 Person HH)
Est. Annual ForSale Demand
Est. Annual Rental Demand
Less than $15,000
1
23
39
49
82
82
72
44
392
Under 23%
NA
NA
$15,000 - $24,999
0
14
34
9
16
36
37
23
169
24-37%
NA
NA
$25,000 - $34,999
0
70
91
36
39
131
130
61
558
38-54%
NA
NA
$35,000 - $49,999
0
37
60
99
118
190
145
65
714
55-76%
NA
78
$50,000 - $74,999
123
166
237
187
205
176
108
36
1,238
77-112%
NA
NA
$75,000 - $99,999
11
113
216
220
241
203
84
32
1,120
113-150%
52
NA
$100,000 - $149,999
0
105
277
281
276
304
124
33
1,400
151-227%
NA
NA
228%+
NA
NA
Income/Age
Income $150,000 +
0
72
237
519
523
180
55
17
1,603
Total
135
600
1,191
1,400
1,500
1,302
755
311
7,194
Based on existing households and current tenure and turnover patterns (Census), the demand for affordable, subsidized for-sale units from households earning $75-100k, or approximately 120-150% AMI based on 2-person households is 52 units per year. Typically affordability for these households is for homes in the $225,000 - $300,000 range. For affordable subsidized rental units, the demand potential for households earning $35-50k, or approximately 60-80% AMI, is nearly 80 units per year.
SOURCE: Noell Consulting Group based on data obtained from US Census and Claritas.
3/18/2022
BRANCH PROPERTIES, LLC LAUREL ISLAND MARKET ANALYSIS
For-Sale Product Analysis
CITY OF FAYETTEVILLE HOUSING MARKET ANALYSIS Exhibit 34 Metro Atlanta Building Activity & Homeownership Trends Metro Atlanta Housing Unit Building Permits 1990-2020 2001-2007 2011-2020
80,000
Population Growth: Total Permits: Permits / Pop. Growth:
70,000
60,000 50,000 40,000
227,550 Permits Below Historic Average from 2008 to 2020
41,554 Average Annual Permits
30,000 20,000 10,000
2020
2019
2018
2017
2016
2015
2014
2013
2012
2011
2010
2009
2008
2007
2006
2005
2004
2003
2002
2001
2000
1999
1998
1997
1996
1995
1994
1993
1992
1991
1990
0
Atlanta Metro Home Ownership Rate by Quarter 73.0% 71.0%
69.0% 67.0% 65.0%
63.0% 61.0% 59.0%
57.0% 55.0%
Source: NCG, US Census Bureau
3/18/2022
Atlanta Metro Home Ownership Rate 4Q Rolling Avg
834,577 462,986 0.55
723,353 279,113 0.39
Pot. Missing Housing Units 122,171
Since 1990 Metro Atlanta permitted roughly 41,554 units annually peaking right before the Great Recession in 2004. Since the Great Recession permitting activity has been slow to recover despite substantial job and population growth. From 2001 to 2007 there were 0.55 permits per job, from 2011 to 2020 0.39 permits per new job. While some of this has been oversupply of housing being absorbed into the market, historic lows in for-sale vacancies indicate a lack of supply emerging over the last few years, inflating prices and resulting in a serious lack of affordable product today. This housing crunch can be seen in home price appreciation in many Atlanta suburbs and particularly in the city of Atlanta where demographic preference trends saw households flocking into the city and muted new inventory. Based on historic levels since 1990 the metro has underdelivered roughly 230,000 homes since 2008. Even since the recovery years of 2011 to 2020 the metro has lagged behind historic building activity, with a potential 122,171 units missing when measuring historic population growth to total permit activity. All these metrics indicate a market that has been severely undersupplied, particularly in desirable suburban and intown Atlanta locations where entitlement challenges, local opposition, and costs of construction have often limited new product delivery. This has forced many households into less established areas. Additionally, since peaking prior to the recession, the homeownership rate in the Atlanta metro has declined with renters making up a larger share of households with this trend much more pronounced in the city of Atlanta. After bottoming out in 2015, homeownership trends at a metro level began to slowly reverse and have picked up steam with historically low mortgage rates in 2020. That said, a lack of inventory post COVID has resulted in the rates again declining.
CITY OF FAYETTEVILLE HOUSING MARKET ANALYSIS Exhibit 35 Atlanta Metro Values & Housing Supply Limited new supply compared to historic averages has led to recent lows in active residential listings according to the Georgia Multiple Listing Service (GAMLS). The metro has seen negative growth in listings through out 2020 and 2021.
Active Residential Listings in Atlanta Metro 30%
30,000
20%
YoY Active Listings Growth
0%
20,000
-10% -20%
15,000
-30% 10,000
-40%
Negative YoY Growth since January 2020. -35%
-50%
Active Listings (GAMLS)
25,000
10%
5,000
-60% -70%
0
25.0%
16.6% YoY Growth through out 2021.
20.0%
YoY Growth
15.0% 10.0%
5.0% 0.0% -5.0% -10.0%
Source: NCG, S&P / Case-Shiller Home Price Indices, Georgia MLS
3/18/2022
2021-10-01
2021-01-01
2020-04-01
2019-07-01
2018-10-01
2018-01-01
2017-04-01
2016-07-01
2015-10-01
2015-01-01
2014-04-01
2013-07-01
2012-10-01
2012-01-01
2011-04-01
2010-07-01
2009-10-01
2009-01-01
2008-04-01
2007-07-01
2006-10-01
2006-01-01
2005-04-01
2004-07-01
2003-10-01
2003-01-01
2002-04-01
2001-07-01
2000-10-01
2000-01-01
1999-04-01
1998-07-01
1997-10-01
1997-01-01
1996-04-01
1995-07-01
1994-10-01
1994-01-01
1993-04-01
1992-07-01
1991-10-01
-20.0%
1991-01-01
-15.0%
210 200 190 180 170 160 150 140 130 120 110 100 90 80 70 60 50
Atlanta Case-Shiller Home Price Index
Case-Shiller Home Price Index: Atlanta & YoY Growth
With limited supply coming to market and strong demand for housing, particularly in dynamic urban and suburban environments, home values have seen a sharp increase since bottoming out in 2012 and continue to reach all time highs. According to the Case-Shiller Home Price Index of Atlanta, which measures repeatsales, home values have increased 16.6% on average year over year in 2021 despite the ongoing pandemic.
CITY OF FAYETTEVILLE HOUSING MARKET ANALYSIS Exhibit 36 Historical Home Price Trends - Case Shiller 150,000
25.0%
21.9%
15.0%
METRO JOB GROWTH
50,000
0
9.9%
9.9% 6.7% 7.3% 6.6% 3.7%
4.5%
8.9% 4.4%
3.5% 3.0%
4.4%
2.9%
5.1% 5.5%
6.1%
5.4% 5.9%
0.0%
-50,000
-3.3%
Avg. C-S Change 1996-2001 5.5%
2.6%
5.0%
-3.9%
-7.9% -150,000
3.5%
4.0%
0.0%
-100,000
Avg. C-S Change 20022003 3.2%
5.2%
10.0%
-12.8% -12.8% Avg. C-S Change 2007-2011 -8.1%
Avg. C-S Change 2012-2019 7.5%
-200,000
Projected Avg. Change 20202021 15.4%
Projected Avg. Change 20222025 5.3%
-5.0% -10.0%
Y-o-Y HOME VALUE CHANGE AS PERCENTAGE
20.0%
18.1%
100,000
-15.0% -20.0%
Metro Job Growth
Change in Case Shiller
This exhibit expresses the change in home values as a percentage increase/decrease from the previous year based on the Case Shiller Index. It then uses a historic correlation model based on annual job growth versus the home price index change (historically an approximate 70% correlation from 1996-2019) to forecast what will happen with home prices going forward as a result of the COVID recession and forecasted recovery. Based on the current recession due to COVID-19, one would have expected the Case-Shiller index to drop, but it in fact surged as those of means continued to buy despite the pandemic, and limited supply continued to push pricing to record levels. Going forward we forecast the market will come back to a more normalized state of supply/demand balance, however strong forecasted job gains, and potentially still supply constraints with the cost of lumber, is likely to result in strong continued growth of the index and thus home prices through 2025.
SOURCE: Noell Consulting Group, US Census Building Permits Survey, Moody's/Economy.com, Zillow
3/18/2022
CITY OF FAYETTEVILLE HOUSING MARKET ANALYSIS Exhibit 37 Historical and Projected Job Growth to New Home Sales Relationship in the Atlanta Metro ATLANTA METRO JOB GROWTH
(20,092)
2005
2006
2007
2009
2010
2011 - 2021: 45,341 Jobs/year
2011
2012
2013
2014
2015
2016
Historical Job Growth
2017
2018
2019
2020
24,071
23,808
35,055
57,059
118,510
74,854
64,575
57,575
83,692
78,333
88,483
60,067
42,283
62,808
(150,033)
(136,950)
2008
2005 - 2007: 50,257 Sales/year
-150,000 -200,000
(26,542)
-50,000 -100,000
2008 - 2010: -61,194 Jobs/year
48,292
0
66,150
50,000
69,833
Metro Job Growth
100,000
36,117
150,000
2022 - 2026: 51,700 Jobs/year
2021
2022
2023
2024
2025
2026
Projected Job Growth
The metro Atlanta for-sale market has experienced a strong recovery since the great recession, but has struggled with supply shortages since early 2013. Below we show new home closings as they relate to job growth, and over the 2011-2021 timeframe 36.2 new homes were sold for every 100 jobs that were added at the metro level. That said, the COVID-19 pandemic has created a recession resulting in job loss of over 150,000 jobs in 2020, but with a strong rebound occurring/forecasted to continue in 2021-2022. That said, 2020 did not act like any previous recession, with home sales still hitting highs not seen since before the last recession as those with means still purchased. That said, increasing construction costs and market concerns for how long the pandemic would continue (along with concerns for potential repeats) resulted in some cooling of sales in 2021 (a 7% drop in volume). Strong job gains in 2022 should result in a strong year, but then we expect decreasing job gains will start to cause the market to cool off through 2026.
ATLANTA METRO NEW HOME SALES
40,000 30,000
2005 - 2007: 50,257 Sales/year
2011 - 2021: 36.2 Sales/ 100 Jobs
2022 - 2026: 32.3 Sales/ 100 Jobs
2011 - 2021: 16,425 Sales/year
100
2022 - 2026: 16,715 Sales/year
80
60
2008 - 2010: 13,096 Sales/year
40
20 0 -20
20,000
38,638
20,315
11,381
7,592
6,352
7,660
11,135
12,606
15,579
18,234
19,689
21,714
21,430
23,985
22,293
24,887
20,541
16,125
11,428
10,591
0
55,334
10,000
-40
2005
2006
2007
2008
2009
2010
2011
2012
2013
2014
2015
2016
2017
2018
2019
2020
2021
2022
2023
2024
2025
2026
Historical New Home Sales SOURCE: Noell Consulting Group, MetroStudy and Economy.com | Moody's Analytics
3/18/2022
Projected New Home Sales
Sales/100 New Jobs
-60 -80 -100
New Home Sales/100 New Jobs
50,000 2005 - 2007: 81.8 Sales/ 100 Jobs
120
2008 - 2010: -21.4 Sales/ 100 Jobs
56,798
Metro New Home Sales
60,000
CITY OF FAYETTEVILLE HOUSING MARKET ANALYSIS Exhibit 38 Atlanta Metro New Home Sales and Attached Share
Metro New Home Sales
60,000
2005 - 2007: 50,257 Avg. New Sales 16.5% Attached
2011 - 2021: 16,425 Avg. New Sales 18.6% Attached
2008 - 2010: 13,096 Avg. New Sales 18.3% Attached
2022 - 2026: 16,715 Avg. New Sales 22.7% Attached
50,000 40,000
30,000 20,000
20.3%
22.4%
22.7%
20.3%
16.0%
17.1%
16.5%
15.6%
16.5%
16.5%
2005
2006
2007
2008 2009 2010 2011 2012 Single Family New Home Sales
2013
2014 2015 2016 2017 Attached New Home Sales
14.1%
14.7%
15.8%
19.1%
24.0%
25.0%
26.0%
2019 2020 2021 2022 2023 2024 Attached Share of New Home Sales
2025
2026
20.8%
23.4%
20.4%
20.0%
22.0%
10,000 0
2018
50.0% 45.0% 40.0% 35.0% 30.0% 25.0% 20.0% 15.0% 10.0% 5.0% 0.0%
Share of Attached
ATLANTA METRO NEW HOME SALES & ATTACHED CAPTURE
Prior to the great recession, attached product accounted for 16%-17% of all new home sales, however, during the recession and the following recovery period attached product sales rose into the 20%-23% range as new unattached product sales plummeted and large condo buildings, delivering during the recession, had product scooped up by investors / speculators and/or sold in distressed situations. Attached sales have slowly increased as a percentage of new sales since bottoming out in 2015, largely driven by townhome development, as people seek relative affordability in quality locations. As the Atlanta metro and its suburbs mature, we project this number to increase, averaging 22.6% of new sales over the next 5 years.
ATLANTA METRO NEW ATTACHED HOME SALES 10,000 8,000 7,000
2022 - 2026: 3,795 Attached Sales / Year
2011 - 2021: 3,062 Attached Sales / Year
2008 - 2010: 2,392 Attached Sales / Year
2005 - 2007: 8,308 Attached Sales / Year
6,000 5,000 4,000
SOURCE: Noell Consulting Group and MetroStudy
3/18/2022
2,857
2,754
2013
3,870
2012
4,519
1,835
2011
4,977
1,558
2010
4,537
1,442
2009
5,622
1,701
2008
4,465
2,312
2007
4,149
3,162
2006
2014 2015 2016 2017 Attached New Home Sales
2018
2019
2020
2021
2022
2023
2024
2025
2026
2,677
6,379
2005
2,202
9,447
0
9,098
1,000
3,114
3,000
SOURCE: Noell Consulting Group (based on surveys of properties) 2,000
2,083
New Attached Sales
9,000
CITY OF FAYETTEVILLE HOUSING MARKET ANALYSIS Exhibit 39 OTP Share of Atlanta Metro New Attached Sales 10,000 9,000 8,000 7,000 6,000 5,000 4,000 3,000 2,000 1,000 0
2005 - 2007: 58.8% Capture 59.4%
58.7%
58.2%
2008 - 2010: 53.2% Capture
68.6%
73.7%
60.7% 50.4% 43.0%
46.9% 46.7%
70.9%
72.7%
73.8%
67.3%
75.3%
74.0%
76.0%
78.0%
79.0%
80.0%
90.0% 80.0% 70.0%
2022 - 2026: 77.7% Capture
2011 - 2021: 69.0% Capture
52.9%
77.0%
60.0% 50.0% 40.0%
2005 - 2021: 63.4% Capture
30.0% 20.0% 10.0%
2005
2006
2007
2008
2009
2010 2011 2012 2013 2014 Historical New Attached Sales
2015 2016 2017 2018 2019 Projected New Attached Sales
2020
2021 2022 Capture
2023
2024
2025
2026
0.0%
OTP New Attached Capture Rate
Metro New Attached Sales
ATLANTA METRO NEW ATTACHED SALES W/ OTP SHARE
The Outside the Perimeter (OTP) submarket including popular core areas such as Smyrna, Roswell, Alpharetta, Forsyth among others has consistently captured 68-75% of the Metros new attached sales since 2014. As low inventory levels and increasing prices continue to put affordability pressure on the market, and demographic surges of first-time buyers and Empty Nester/Retirees increasing look for more maintenance-free product, we forecast this capture to maintain around 76-80% over the next five year period. This will result in sales volumes surpassing what has been demonstrated in the most recent 2011-2021 cycle, but continuing the more recent averages witnessed in 2017-2021.
OTP NEW ATTACHED SALES 2005 - 2007: 4,889 Avg. New Attached Sales
5,000
2008 - 2010: 1,272 Avg. New Attached Sales
2011 - 2021: 2,112 Avg. New Attached Sales
2022 - 2026: 2,948 Avg. New Attached Sales
2017 - 2021: 3,182 Avg. New Attached Sales
4,000
3,000
SOURCE: Noell Consulting Group and MetroStudy
3/18/2022
3,783
3,480
3,019
2,257
2,203
4,162
3,005
3,064
2,263
3,416
2010 2011 2012 2013 2014 2015 OTP - Historical New Attached Sales
1,899
1,622
2009
1,429
2008
970
2007
728
2006
676
1,165
2005
731
1,920
0
3,714
1,000
5,549
2,000 5,404
OTP New Attached Sales
6,000
2016 2017 2018 2019 2020 2021 OTP - Projected New Attached Sales
2022
2023
2024
2025
2026
CITY OF FAYETTEVILLE HOUSING MARKET ANALYSIS Exhibit 40 Fayette County (PMA - Primary Market Area) Capture of OTP New Attached Sales 2005 - 2007: 0.0% Capture
5,000 4,000
0.0%
0.0%
2011 - 2021: 0.1% Capture
2008 - 2010: 0.0% Capture 0.0%
0.0%
0.0%
0.0%
0.0%
0.0%
0.0%
0.0%
0.0%
0.0%
0.0%
0.0%
0.1%
0.4%
0.5%
0.2%
2022 - 2026: 1.3% Capture 2.0% 1.5% 1.0%
2.3%
0.0% -2.0% -4.0%
2,000 3,019
2,257
2,203
2021
3,480
3,416
2015 2016 2017 2018 2019 2020 OTP - Projected New Attached Sales
2022 2023 Capture
2024
2025
2026
3,783
4,162
3,005
3,064
2,263
1,899
1,622
2009 2010 2011 2012 2013 2014 OTP - Historical New Attached Sales
1,429
2008
970
2007
728
1,165
2006
676
1,920
2005
731
3,714
0
-6.0% 5,549
1,000
4.0% 2.0%
3,000
5,404
OTP New Attached Sales
6,000
-8.0% -10.0%
PMA New Attached Capture Rate
OTP NEW ATTACHED SALES & FAYETTE COUNTY CAPTURE
Historically Fayette County has had a significant lack of new attached homes offered, and this has only recently shifted with the addition of townhomes in Trilith (located within the City limits). To understand the potential captures the County (and it is assumed 100% of this would be within the City limits) could achieve, we examined demonstrated captures at analogous Cities such as Newnan and McDonough on the next exhibit. Based on these we are making a conservative estimate that the City could witness captures ramp up to average 1.3% through 2026, which would result in demand potential of nearly 40 attached homes per year.
FAYETTE COUNTY NEW ATTACHED SALES 50 40 30 20
35
45
45
50
2016 2017 2018 2019 2020 2021 PMA Projected New Attached Sales
19
8
15
2
0
0
2010 2011 2012 2013 2014 2015 PMA Historical New Attached Sales
0
2009
0
2008
0
0
2007
0
0
2006
0
0
2005
0
0
0
0
10
SOURCE: Noell Consulting Group and MetroStudy
3/18/2022
2022 - 2026: 39 Avg. New Attached Sales
2011 - 2021: 02 Avg. New Attached Sales
2008 - 2010: 00 Avg. New Attached Sales
2005 - 2007: 00 Avg. New Attached Sales
0
PMA New Attached Sales
60
2022
2023
2024
2025
2026
CITY OF FAYETTEVILLE HOUSING MARKET ANALYSIS Exhibit 41 Fayette County Analog City Attached Sales Comparison City Capture of OTP New Attached Sales 2015 - 2021
New Attached Capture Rate
CITY CAPTURES OF OTP NEW ATTACHED SALES
Fayetteville average: 0.1% capture McDonough average: 0.6% capture Newnan average: 0.5% capture Alpharetta average: 5.2% capture
1.8% 1.3% 0.8% 0.4%
0.3%
0.2%
0.1%
-0.2%
0.0%
0.0%
2015
2016
0.0%
0.0%
2017 Fayetteville Capture
2018 McDonough Capture
2019 Newnan Capture
2020
2021
Although Fayetteville has had a historically low capture of the total new attached sales OTP, the projected capture rate is not unreasonable when compared to the new attached sales and capture of analog cities. Newnan's capture is increasing at about 6% per year and McDonough's capture is increasing at about 65% per year, so if Fayetteville delivers new attached product it can achieve a capture rate between 1-2% from 2022-2026. Not show on the charts is the Alpharetta average capture of 5.2% and total new attached sales of 921 homes. Fayetteville can model their attached product after the high quality well executed Alpharetta stock and maintain the value of attached product.
NEW ATTACHED SALES Total New Sales 2015 - 2021
New Attached Sales
Fayetteville Historical New Attached Sales
Fayetteville: 25 sales McDonough: 148 sales Newnan: 109 sales Alpharetta: 921 sales
Newnan Historical New Attached Sales
70
McDonough Historical New Attached Sales
60 50 40 30
2015
2016
SOURCE: Noell Consulting Group and MetroStudy
3/18/2022
20 2017
3
3 2018
8
13 2019
35
57 2020
68
8
4
15
1
2
0
0
11
0
0
0
10
0
20 4 2021
30
CITY OF FAYETTEVILLE HOUSING MARKET ANALYSIS Exhibit 42 Sale History of Attached Product in Fayetteville New Attached Product Sales in PMA 2005-2021
2007 2008 2009
7
2010
6 6
2011 2012 2013 2014 2015 2016
2
2
2017
2
2018 2019 0 0 0 0 0 0 0 0 0 0 0 0 0 0 0
0 0 0 0 0 0 0 0 0 0 0 0 0
< $300,000 16
14
12
10
0
0 0 0 0 0 0 0 0 0 0 0 0
$300,000 - $400,000
0 0 0 0 0 0 0 0 0 0 0 0 0
$400,000 - $500,000
0 0 0 0 0 0 0 0 0 0 0 0 0 0 0
$500,000 - $750,000
$750,000 +
2020 2021
Historically, Fayetteville delivered no attached housing product until the delivery of Trilith in 2019. The Trilith attached product price point is much higher than that of entry townhomes, duplexes, and other attached product, pointing to a lack of diverse and affordable attached product that the City could benefit from providing. An increase in density and attached product can help offset increasing prices of land and construction costs, but product can be well designed to maintain high home values throughout Fayetteville. Attached product can also be located in concentrations, like in Trilith, near downtown in walkable areas where density is appropriate.
8
6
4
2
0
2005
2006
2007
2008
2009
< $300,000
Source: NCG, MetroStudy
3/18/2022
2010
2011
$300,000 - $400,000
2012
2013
$400,000 - $500,000
2014
2015
2016
$500,000 - $750,000
2017
$750,000 +
2018
2019
2020
2021
CITY OF FAYETTEVILLE HOUSING MARKET ANALYSIS Exhibit 43 Fayette County New Attached Sales & Distribution and City of Fayetteville's Capture 2022 118,510 21.0 24,887 20.0% 4,977 76.0% 3,783 0.5% 19
2023 57,059 36.0 20,541 22.0% 4,519 77.0% 3,480 1.0% 35
2024 35,055 46.0 16,125 24.0% 3,870 78.0% 3,019 1.5% 45
2025 23,808 48.0 11,428 25.0% 2,857 79.0% 2,257 2.0% 45
2026 24,071 44.0 10,591 26.0% 2,754 80.0% 2,203 2.3% 50
Projected Price Distribution < $300,000 $300,000 - $400,000 $400,000 - $500,000 $500,000 - $750,000 $750,000 +
2022 2 11 4 2 0
2023 3 21 7 3 0
2024 5 27 9 5 0
2025 5 27 9 5 0
2026 5 30 10 5 0
Potential Fair Share Capture3 < $300,000 $300,000 - $400,000 $400,000 - $500,000 $500,000 - $750,000 $750,000 +
2022 100% 100% 100% 100% 100%
2023 100% 100% 100% 100% 100%
2024 100% 100% 100% 100% 100%
2025 100% 100% 100% 100% 100%
2026 100% 100% 100% 100% 100%
Potential Annual Capture: < $300,000 $300,000 - $400,000 $400,000 - $500,000
2022 2 11 4
2023 3 21 7
2024 5 27 9
2025 5 27 9
2026 5 30 10
$500,000 - $750,000
2
3
5
5
5
$750,000 +
0
0
0
0
0
Potential Annual Capture:
19
35
45
45
50
Historic & Projected New Attached Sales in PMA2 NOTES: 1. Employment growth from Economy.com. 2. For the purpose of NCG's supply and demand analysis the Primary Market Area (PMA) Is defined as Fayette County. 3. Potential Fair Share capture is based on historic captures the City has achieved within the county. NCG predicts that any new attached product will locate directly within the city limits of Fayetteville, giving the city a 100% capture rate of product, as has been demonstrated thus far. 4. The results of our demand analysis indicate the City can support an annual average of approximately 40 new attached sales per year, or a total of 194 through 2026.
FORECAST
2011-2021 Average 45,341 36.2 16,425 18.6% 3,062 69.0% 2,112 0.1% 2
Employment Growth in the Metro1 Hist. & Project, Jobs to Total New Home Sales in Metro Per 100 Jobs Historic & Projected Total New Home Sales in Metro Percentage New Attached Sales of Total New Sales Historic & Projected New Attached Sales in Atlanta Metro OTP Capture of Atlanta Metro New Attached Sales Historic & Projected New Attached Sales in OTP PMA Capture of OTP New Attached Sales
2005-2021 Average 29,379 74.2 21,808 17.7% 3,870 63.4% 2,454 0.1% 1
*Please note that there could be some rounding errors in price band estimates
SOURCE: Noell Consulting Group, MetroStudy, Moodys / Economy.com
3/18/2022
2022-2026 Average 51,700 32.3 16,715 22.7% 3,795 77.7% 2,948 1.3% 39
CITY OF FAYETTEVILLE HOUSING MARKET ANALYSIS
Metro New Home Sales
ATLANTA METRO NEW HOME SALES & DETACHED CAPTURE 110,000 100,000 90,000 80,000 70,000 60,000 50,000 40,000 30,000 20,000 10,000 0
2005 - 2007: 50,257 Avg. New Sales 83.5% Detached
84.0%
82.9% 83.5%
2008 - 2010: 13,096 Avg. New Sales 81.7% Detached
84.4%
83.5% 83.5% 79.7%
85.9% 85.3%
2011 - 2021: 16,425 Avg. New Sales 81.4% Detached
84.2% 80.9%
79.7% 77.6% 77.3%
2005
2006
2007
2022 - 2026: 16,715 Avg. New Sales 77.3% Detached
79.6% 80.0%
79.2% 76.6%
2008 2009 2010 2011 2012 Detached New Home Sales
2013 2014 2015 2016 2017 Detached New Home Sales
78.0%
2018 2019 2020 2021 2022 2023 Detached Share of New Home Sales
76.0%
2024
75.0%
2025
74.0%
2026
88.0% 86.0% 84.0% 82.0% 80.0% 78.0% 76.0% 74.0% 72.0% 70.0% 68.0%
Share of Detached
Exhibit 44 Atlanta Metro New Home Sales and Detached Share
With the exception of the recovery post great recession, detached product has accounted for 82%-86% of all new home sales in the metro up until 2017. Since 2017 however there has been a significant decline in the detached home sale portion of the market, as affordability pressure increased following a strong economic run and associated price appreciation, which was only sped up further with the onset of COVID. While 2021 witnessed a slight bounce back, we forecast the trend will continue with a gradually declining % of detached sales as more attached products gain popularity both for their more affordable price point, but also in many areas their increased walkability and maintenance-free aspects.
ATLANTA METRO NEW DETACHED HOME SALES 60,000
2022 - 2026: 12,919 Detached Sales / Year
2011 - 2021: 13,363 Detached Sales / Year
2008 - 2010: 10,704 Detached Sales / Year
40,000 30,000
SOURCE: Noell Consulting Group and MetroStudy
3/18/2022
8,571
7,837
2013
12,255
2012
16,022
9,300
2011
19,910
6,102
2010
17,756
4,910
2009
18,363
5,891
2008
16,965
9,069
2007
17,565
17,153
2006
16,575
32,259
2005
15,557
45,887
0
47,700
10,000
13,377
20,000
SOURCE: Noell Consulting Group (based on surveys of properties)
10,523
New Detached Sales
50,000
2005 - 2007: 41,949 Detached Sales / Year
2014 2015 2016 2017 Detached New Home Sales
2018
2019
2020
2021
2022
2023
2024
2025
2026
CITY OF FAYETTEVILLE HOUSING MARKET ANALYSIS Exhibit 45 OTP Share of Atlanta Metro New Detached Sales ATLANTA METRO NEW DETACHED SALES W/ OTP SHARE 50,000
2011 - 2021: 89.1% Capture
2008 - 2010: 82.7% Capture
2005 - 2007: 84.4% Capture
40,000 30,000
84.6%
83.7%
87.2%
85.0% 82.3%
82.6%
84.0%
82.3%
89.3%
88.5%
88.6%
88.6%
97.3%
88.8%
87.6%
90.0%
88.6%
100.0%
2022 - 2026: 88.9% Capture 89.0%
88.0%
88.0%
95.0% 88.0%
83.3%
85.0% 2005 - 2021: 86.5% Capture
20,000
80.0%
10,000 0
90.0%
75.0% 2005
2006
2007
2008
2009
2010 2011 2012 2013 2014 Historical New Detached Sales
2015 2016 2017 2018 2019 2020 Projected New Detached Sales
2021 2022 Capture
2023
2024
2025
2026
OTP New Detached Capture Rate
Metro New Detached Sales
60,000
70.0%
While not a surprise, the market has witnessed nearly 90% of the new detached sales occurring OTP, as infill sites for low density products ITP are becoming increasingly scarce. We believe this trend will largely continue, resulting in a forecast of nearly 12,000 new detached sales per year Outside the Perimeter.
OTP NEW DETACHED SALES 40,000
2005 - 2007: 35,407 Avg. New Detached Sales
35,000
2008 - 2010: 8,850 Avg. New Detached Sales
2022 - 2026: 11,480 Avg. New Detached Sales
2011 - 2021: 11,902 Avg. New Detached Sales
30,000 25,000 20,000
SOURCE: Noell Consulting Group and MetroStudy
3/18/2022
17,276
17,919
14,260
10,785
7,542
6,897
16,264
14,866
15,589
14,678
2010 2011 2012 2013 2014 2015 OTP - Historical New Detached Sales
13,783
2009
11,841
2008
9,397
2007
8,107
2006
5,083
4,946
2005
4,043
7,493
0
14,112
5,000
27,427
10,000
38,420
15,000 40,374
OTP New Detached Sales
45,000
2016 2017 2018 2019 2020 2021 OTP - Projected New Detached Sales
2022
2023
2024
2025
2026
CITY OF FAYETTEVILLE HOUSING MARKET ANALYSIS Exhibit 46 Fayette County Capture of OTP New Detached Sales OTP NEW DETACHED SALES & FAYETTE COUNTY CAPTURE 40,000
2011 - 2021: 2.3% Capture
3.8%
35,000
2.5% 2.0% 1.5%
17,276
17,919
14,260
10,785
7,542
6,897
1.0%
16,264
14,866
15,589
4.0% 3.0%
2.5%
1.4%
1.4%
4.5% 3.5%
2.0%
14,678
9,397
2009 2010 2011 2012 2013 2014 OTP - Historical New Detached Sales
8,107
2008
5,083
2007
4,043
2006
4,946
2005
13,783
1.5%
2015 2016 2017 2018 2019 2020 OTP - Projected New Detached Sales
2021
2022 2023 Capture
2024
2025
2026
11,841
1.5%
4.0%
3.0% 2.5%
1.7%
7,493
0
1.3%
1.6%
14,112
5,000
1.4%
1.6%
27,427
10,000
1.4%
1.6%
38,420
15,000
3.3%
2.3%
25,000 20,000
3.0%
2.7%
30,000
2022 - 2026: 2.7% Capture 3.5%
0.5%
PMA New Detached Capture Rate
2008 - 2010: 1.6% Capture
2005 - 2007: 1.3% Capture
40,374
OTP New Detached Sales
45,000
0.0%
Historically Fayette County has averaged a 1-2% capture of the OTP new detached home sale market. Most recently, Trilith has enabled that capture to ramp up to nearly 3.5% when significant inventory was available. To understand demand potential, we are assuming the County can witness a ramp up to 4% of the OTP market if inventory was made available. As can be seen below this results in just over 315 average sales per year.
FAYETTE COUNTY NEW DETACHED SALES 2005 - 2007: 474 Avg. New Detached Sales
500
2008 - 2010: 142 Avg. New Detached Sales
300
358
356
324
264
276
401
498
474
202
240
2010 2011 2012 2013 2014 2015 PMA Historical New Detached Sales
234
275
2009
258
2008
311
2007
74
2006
61
122
2005
79
225
0
351
100
526
200
SOURCE: Noell Consulting Group and MetroStudy
3/18/2022
2022 - 2026: 316 Avg. New Detached Sales
2011 - 2021: 275 Avg. New Detached Sales
400
546
PMA New Detached Sales
600
2016 2017 2018 2019 2020 2021 PMA Projected New Detached Sales
2022
2023
2024
2025
2026
CITY OF FAYETTEVILLE HOUSING MARKET ANALYSIS Exhibit 47 Sale History of Detached Product in PMA New Detached Product Sales in PMA 2005-2021
Since the Great Recession, the bulk of the new detached sales market in the PMA has been the under $400k band. The delivery of Trilith, as well as new job gains associated with the hospital, and market wide appreciation rates have resulted in the majority of sales now occurring in the $400-750k bands.
2005 2006 2007 2008 2009 2010
2011 2012 2013
110
2014 2015 2016
61
2017
35
2018
13 < $300,000
10 $300,000 - $400,000
$400,000 - $500,000
$500,000 - $750,000
$750,000 - $1,000,000
3 $1,000,000 +
2019 2020 2021
600
500
400
300
200
100
0 2005
2006
2007
2008
2009 < $300,000
Source: NCG, MetroStudy
3/18/2022
2010
2011
$300,000 - $400,000
2012 $400,000 - $500,000
2013
2014
$500,000 - $750,000
2015
2016
$750,000 - $1,000,000
2017 $1,000,000 +
2018
2019
2020
2021
CITY OF FAYETTEVILLE HOUSING MARKET ANALYSIS Exhibit 48 Fayette County New Detached Sales & Distribution and City of Fayetteville's Potential Capture 2022 118,510 21.0 24,887 20.0% 4,977 90.0% 17,919 2.0% 358
2023 57,059 36.0 20,541 22.0% 4,519 89.0% 14,260 2.5% 356
2024 35,055 46.0 16,125 24.0% 3,870 88.0% 10,785 3.0% 324
2025 23,808 48.0 11,428 25.0% 2,857 88.0% 7,542 3.5% 264
2026 24,071 44.0 10,591 26.0% 2,754 88.0% 6,897 4.0% 276
Projected Price Distribution < $300,000 $300,000 - $400,000 $400,000 - $500,000 $500,000 - $750,000 $750,000 - $1,000,000 $1,000,000 +
2022 14 88 108 125 18 5
2023 11 71 125 123 21 6
2024 6 52 127 110 23 6
2025 0 32 117 90 21 5
2026 0 22 130 94 25 5
Potential Fair Share Capture3 < $300,000 $300,000 - $400,000 $400,000 - $500,000 $500,000 - $750,000 $750,000 - $1,000,000 $1,000,000 +
2022 30% 30% 35% 40% 50% 60%
2023 30% 30% 35% 40% 50% 60%
2024 30% 30% 35% 40% 50% 60%
2025 30% 30% 35% 40% 50% 60%
2026 30% 30% 35% 40% 50% 60%
Potential Annual Capture: < $300,000 $300,000 - $400,000 $400,000 - $500,000
2022 4 26 38
2023 3 21 44
2024 2 16 45
2025 0 10 41
2026 0 7 45
Historic & Projected New Detached Sales in PMA2 NOTES: 1. Employment growth from Economy.com. 2. For the purpose of NCG's supply and demand analysis the Primary Market Area (PMA) Is defined as Fayette County. 3. Potential Fair Share capture is based on historically demonstrated captures the City has witnessed of County sales across price bands. 4. The results of our demand analysis indicate the City has demand potential for an annual average of 118 new detached sales per year, and up to 588 total sales through 2026.
FORECAST
2011-2021 Average 45,341 36.2 16,425 81.4% 13,363 89.1% 11,902 2.3% 275
Employment Growth in the Metro1 Hist. & Project, Jobs to Total New Home Sales in Metro Per 100 Jobs Historic & Projected Total New Home Sales in Metro Percentage New Detached Sales of Total New Sales Historic & Projected New Detached Sales in Atlanta Metro OTP Capture of Atlanta Metro New Detached Sales Historic & Projected New Detached Sales in OTP PMA Capture of OTP New Detached Sales
2005-2021 Average 29,379 74.2 21,808 82.3% 17,938 86.5% 15,512 1.8% 287
$500,000 - $750,000
50
49
44
36
38
$750,000 - $1,000,000
9
11
11
11
12
$1,000,000 +
3
3
3
3
3
Potential Annual Capture:
131
131
121
100
105
*Please note that there could be some rounding errors in price band estimates
SOURCE: Noell Consulting Group, MetroStudy, Moodys / Economy.com
3/18/2022
2022-2026 Average 51,700 32.3 16,715 77.3% 12,919 88.9% 11,480 2.7% 316
CITY OF FAYETTEVILLE HOUSING MARKET ANALYSIS Exhibit 49 Analogous For-Sale/ Rental Product Community Map 11
1 12
8 9
Market Rate Apts
Units
Avg. Size
1 Lofts at Trilith
263
879
$2,109
$2.40
2 Meridian at Lafayette
210
966
$2,005
$2.08
3 Equinox at Knight
194
997
$1,627
$1.63
Market Rate Apts Avg
222
947
$1,914
$2.04
Independent Living
Units
Avg. Size
4 Heartis Fayetteville IL
80
789
55+ Rental (Tax Credit)
Units
Avg. Size
5 Hearthside Club Lafayette
125
970
For-Sale Single Family
3
6 5
2
4
7
13
SOURCE: Noell Consulting Group, Google Earth, Google Maps
3/18/2022
$3,573
$4.53
Avg. Rent Avg. $/SF $1,327
$1.37
Units/Lots Avg. Size Avg. Price Avg. $/SF 164
3,536
$334,875
$95
7 Apple Orchards
49
2,835
$380,000
$134
8 Trilith
600
2,145
$783,450
$365
10 Canoe Club
350
3,364
$525,549
$158
11 Brighton Homes
75
2,923
$451,658
$155
12 Annelise Park Drive
75
6,904
$992,500
$144
For-Sale Single Family Avg
219
3,618
$578,005
$175
9 Trilith (TH) 55+ For-Sale Communities 14
Avg. Rent Avg. $/SF
6 Villages Lafayette
For-Sale Townhomes 10
Avg. Rent Avg. $/SF
Units/Lots Avg. Size Avg. Price Avg. $/SF 100
1,589
$641,043
$403
Units/Lots Avg. Size Avg. Price Avg. $/SF
13 Garden Court
112
1,338
$188,000
$141
14 Fayette Meadows
129
2,288
$383,900
$168
55+ For-Sale Communities Avg
121
1,813
$285,950
$154
Average All Market Rate Apts
237
922
$2,057
$2.24
Average All Independent Living
80
789
$3,573
$4.53
Average All 55+ Rental (Tax Credit)
125
970
$1,327
$1.37
Average All Single Family
248
2,961
$495,106
$181
Average All Townhomes Average All 55+ For Sale
100 112
1,589 1,338
$641,043 $188,000
$403 $141
CITY OF FAYETTEVILLE HOUSING MARKET ANALYSIS Exhibit 50 Summary of the Competitive Communities by Product Type ID Community Name
Product Type
Year Built
Sold in past two years
Total Units
Weighted Unit Size Range Average Unit Size
6 Villages Lafayette
For-Sale Single Family
2018
41
164
1,845 5,227
7 Apple Orchards
For-Sale Single Family
2001
16
49
2,092 3,578
Base Price Range
Base Average Price
Base Average $/SF
3,536
$190,750
$479,000
$334,875
$95
2,835
$318,000
$442,000
$380,000
$134
8 Trilith
For-Sale Single Family
2017
68
600
475 5,663
2,145
$212,900
$1,650,000
$783,450
$365
10 Canoe Club
For-Sale Single Family
2006
10
350
3,247 3,899
3,364
$517,759
$561,157
$525,549
$158
11 Brighton Homes
For-Sale Single Family
2021
13
75
2,264 3,581
2,923
$425,325
$477,990
$451,658
$155
12 Annelise Park Drive
For-Sale Single Family
2004
10
75
4,014 9,793
6,904
$425,325
$477,990
$451,658
$144
ID Community Name
Product Type
Year Built
Sold in past two years
Total Units
Base Price Range
Base Average Price
Base Average $/SF
9 Trilith (TH)
Townhome
2017
26
100
$489,000
$641,043
$403
ID Community Name
Product Type
Year Built
Sold in past two years
Total Units
Base Price Range
Base Average Price
Base Average $/SF
13 Garden Court
55+ For-Sale Community
1992
17
112
1,226 1,450
1,338
$134,000
$242,000
$188,000
$141
14 Fayette Meadows
55+ For-Sale Community
2021
9
129
1,817 2,759
2,288
$376,900
$390,900
$383,900
$168
Market Average
2011
23
184
2,022
4,261
2,991
$343,329
$603,283
$460,015
$196
For-Sale Single Family Average
2011
26
219
2,323
5,290
3,618
$348,343
$681,356
$487,865
$175
For-Sale Townhomes Average
2017
26
100
1,214
2,397
1,589
$489,000
$708,507
$641,043
$403
55+ For-Sale Community Average
2007
13
121
1,522
2,105
1,813
$255,450
$316,450
$285,950
$154
SOURCE: Noell Consulting Group, CoStar 3/18/2022
Weighted Unit Size Range Average Unit Size 1,214 2,397
1,589
Weighted Unit Size Range Average Unit Size
$708,507
CITY OF FAYETTEVILLE HOUSING MARKET ANALYSIS Exhibit 51 Comparison of Key Competitive/Analogous Communities For-Sale Product in the Market - Weighted Average 55+ For-Sale Communities $870,000
Annelise Park Drive $144/SF
For-Sale Single Family For-Sale Townhomes
$770,000
Trilith $365/SF
$670,000
PRICE
Trilith (TH) $403/SF $570,000 Canoe Club $158/SF Brighton Homes $155/SF
$470,000
Fayette Meadows $168/SF
$370,000 Exhibit 55 (Page 2 of 2)
Apple Orchards $134/SF Villages Lafayette $95/SF
$270,000
Garden Court $141/SF
$170,000 1,200
1,700
SOURCE: Noell Consulting Group based on surveys of properties.
3/18/2022
2,200
2,700 SIZE
3,200
3,700
4,200
CITY OF FAYETTEVILLE HOUSING MARKET ANALYSIS Exhibit 52 Competitive SFD Community - The Villages at LaFayette: Park (110 Mansfield Drive) COMMUNITY OVERVIEW
SALES PACE
Developer: Lennar Homes
Construction began in Q3 2017. 1.5 / mo. 1 actively selling; 0
Sales Pace: under construction; 3 future lots; 3 lots remaining
Delivery: Q1 2018 Presale: Began Q3 2017 Type: 164 SFDs 32' - 48'
Grounds maintenance; 5 pocket parks located throughout
Construction: Cement Siding
Features & community; pet stations located throughout community; Amenities: playground; sport court w/ regulation pickle ball; swimming pool
Parking Type: Rear-entry garage
plaza with sun shields
Spaces/Ratio: Private 2 car garage
WalkScore®: (18) Car-Dependent
HOA Fees: Annual Assoc. Fee: $710; $145 initiation fee
PRODUCT PROGRAM
3B/2.5b
Recently Sold (2020+) 11
0
$190,750 $389,900
$311,055
1,845 2,562
Average Size 2,172
$103 $152
Avg. $/SF $143
3B/3b
2
0
$330,000 $435,000
$382,500
2,503 2,654
2,579
$132 $164
$148
3B/3.5b
4
0
$235,900 $345,000
$298,475
2,125 2,400
2,260
$111 $144
$132
4
0
$300,000 $400,900
$341,225
2,348 5,227
3,100
$77 $128
$110
6
0
$275,000 $405,000
$355,250
2,157 2,957
2,427
$127 $137
$146
10
0
$300,000 $479,000
$377,958
2,348 3,407
2,827
$128 $141
$134
1
0
$475,000 $475,000
$475,000
2,904 2,904
2,904
$164 $164
$164
5B/3.5b
3
1
$319,900 $380,000
$356,633
2,700 3,160
2,903
$118 $120
$123
SUMMARY:
41
$190,750 $479,000
$334,875
1,845 5,227
3,536
$77 $164
$95
Appliances and Tech
Windows and Balconies
Typical Upgrades
Financing and Incentives
Vinyl tilt-in windows with wood returns; a front porch and covered, rear patio.
Not offered
NA
Unit Type
Unit Count
Unit Mix
Only the total unit count in the neighborhood is known. Data is from recent sales
4B/2.5b 4B/3b 4B/3.5b 5B/2.5b
164
Actively Selling
Closing Price Range
Avg. Price
Unit Size Range
Effective PSF
UNIT FINISHES Ceiling Height and Finish
Lighting
10’ Ceilings on Main Floor
Recessed can lighting
Flooring
Electrolux® Stainless Steel Appliances including 36” Gas 3” Plank Shaw® Timberlake® Fairfield Cabinets with 42” Cooktop, Vent Hood, WaveTouch Engineered Uppers and Crown Molding, Granite Double Ovens (Standard and Hardwood Flooring, Kitchen Countertops Speed cooking), Ring® Video ceramic tile in bath Doorbell; Samsung SmartThingsTM Hub
MARKET AUDIENCE Mix of empty nesters, downsizers, and young professionals/single parents from Atlanta. Typically airport-area workers, including some Delta attendants.
SOURCE: Noell Consulting Group
3/18/2022
Countertops, Cabinets and Bath Detail
SUMMARY Previously developed by Ravin Homes (most custom homes); Lennar purchased in 3Q 2017 (production).
total units are 173
CITY OF FAYETTEVILLE HOUSING MARKET ANALYSIS Exhibit 53 Competitive SFD Community - Apple Orchard (Apple Blossom Lane, Winesap Way, Stayman Park) COMMUNITY OVERVIEW
SALES PACE
Developer: Unknown
Phased construction began in 1999. All units were delivered by
Sales Pace: 2004. No active sales. Most recent resale was a 3B/3b for
Delivery: Q1 2001
$395,000 which sold in March 2022.
Presale: Unknown Type: 49 SFDs on less than 1-acre sites Construction: Concrete Siding, Stick Built, Wood/Frame
Features & Fees cover grounds maintenance and park area in center of Amenities: neighborhood
Parking Type: Private attached garage in rear of building Spaces/Ratio: Private 2 car garage in rear
WalkScore®: (41) Car-Dependent
HOA Fees: Annual Assoc. Fee: $500 ($46/mo.)
PRODUCT PROGRAM Recently Sold (2020+) 4
Actively Selling 0
3B/3b
1
0
4B/3b
6
Total Unit Count
Closing Price Range
Avg. Price
Unit Size Range
$295,000 $342,000
$318,500
1,704 2,493
Average Size 2,099
$137 $173
Avg. $/SF $152
$395,000 $395,000
$395,000
2,353 2,353
2,353
$168 $168
$168
0
$343,000 $385,000
$364,000
2,092 3,438
2,765
$112 $164
$132
1
0
$365,000 $365,000
$365,000
2,688 2,688
2,688
$136 $136
$136
2
0
$340,000 $354,000
$347,000
3,227 3,227
3,227
$105 $110
$108
5B/3b
1
0
$318,000 $318,000
$318,000
3,578 3,578
3,578
$89 $89
$89
5B/4b
1
0
$442,000 $442,000
$442,000
2,901 2,901
2,901
$152 $152
$152
$318,000 $442,000
$380,000
2,092 3,578
2,835
$89 $168
$134
Appliances and Tech
Windows and Balconies
Typical Upgrades
Financing and Incentives
SS appliance package w/electric range, microwave, fireplace
Punch windows, Private patio/deck
None
N/A
Unit Type 3B/2.5b
Unit Mix
Only the total unit count in the neighborhood is known. Data is from recent sales
4B/3.5b 4B/4.5b
SUMMARY:
16
49
Effective PSF
UNIT FINISHES Ceiling Height and Finish 9'+ ceilings
Lighting
Flooring
Wide plank Hw on Varies, lighted fans in main, tile in bath, Dark granite countertops in kitchen, bedrooms, chandeliers, carpet in beds and white granite in bath, framed walk in decorative pendants, decorative on second floor if shower with separate tub in master. track lighting in bath there is one.
MARKET AUDIENCE Broad mix of mature suburban home owners, some empty-nesters, and maturing families seeking new housing in Fayette County.
SOURCE: Noell Consulting Group
3/18/2022
Countertops, Cabinets and Bath Detail
SUMMARY 49 custom homes on less than one acre lots. Master's on second floor for some while other homes have master on main floor.
CITY OF FAYETTEVILLE HOUSING MARKET ANALYSIS Exhibit 54 Competitive SFD Community - Trilith (290 Heatherden Ave) COMMUNITY OVERVIEW
SALES PACE
Developer: Halbert Development / Pinewood Atlanta Studios
Construction began in Q2 2015. They are still building, with the
Sales Pace: construction of Phase 3 of the development underway. Sales
Delivery: Q4 2017
pace in 2021 was roughly 3 (2.8) units sold per month.
Presale: Began Q1 2017 Type: 600 SFDs
118 acres of green space
Features & Community wellness center 15 miles of pedestrian pathways Amenities: Gardens and playgrounds
Construction: Brick 4 Sided Parking Type: Private attached garage
Multiple swimming pools
Spaces/Ratio: Private 2 car garage
WalkScore®: N/A
HOA Fees: Typical annual assoc. Fee: $2,400
PRODUCT PROGRAM Recently Sold Actively Selling (2020+) 3 0 4 2 14 4 13 1 2 1 Only the total unit count in 6 0 the neighborhood is 3 0 known. Data is from 3 1 recent sales 8 0 3 1 6 3 1 0 2 0
Unit Type
Unit Count
Unit Mix
1B/1b 2B/2b 2B/2.5b 3B/2.5b 3B/3b 3B/3.5b 4B/2.5b 4B/3b 4B/3.5b 4B/4b 4B/4.5b 4B/5b 6B/5.5b *Currently in Phase 3 of Construction
SUMMARY:
600
68
100%
Ceiling Height and Finish
Lighting
10' ceilings on main
Custom designer lighting
Flooring
Wide-plank hardwood flooring
MARKET AUDIENCE Buyers all over; tv stars, investors, from out of town, few families with kids, some empty-nesters, majority from Atlanta metro area. SOURCE: Noell Consulting Group
3/18/2022
Base Price Range
Avg. Price
Unit Size Range
$212,900 $265,000 $519,900 $679,900 $385,000 $599,900 $384,000 $729,900 $524,000 $589,900 $524,900 $625,000 $459,900 $479,900 $774,900 $1,279,000 $470,302 $1,299,900 $661,500 $977,500 $975,150 $1,599,900 $1,200,000 $1,200,000 $1,500,000 $1,650,000
$233,933 $574,900 $507,269 $559,660 $556,950 $566,850 $466,567 $1,012,933 $877,807 $779,667 $1,273,317 $1,200,000 $1,575,000
475 565 1,342 1,343 1,122 2,178 1,098 2,178 1,680 1,680 1,488 1,827 1,748 1,748 2,376 2,391 2,178 2,717 2,464 3,149 2,506 5,663 3,149 3,149 3,235 3,235
Average Size 527 1,342 1,409 1,743 1,680 1,735 1,748 2,385 2,568 2,749 3,617 3,149 3,235
$212,900 $1,650,000 $783,450 UNIT FINISHES Countertops, Cabinets and Appliances and Tech Bath Detail
475 5,663
2,145
Marble countertops in bathrooms & kitchens. Wood custom cabinetry w/ custom paint or stained finishes. Granite, marble & stone counter top selections & apron front kitchen sink are standard.
Bosch appliance package, plumbing fixtures in popular finishes by Delta. Pre-wired for electric vehicle charging station.
$469 $506 $343 $350 $351 $353 $275 $535 $478 $310 $389 $381 $510
Avg. $/SF $444 $428 $360 $321 $332 $327 $267 $425 $342 $284 $352 $381 $487
$216 $535
$365
Effective PSF $448 $387 $275 $335 $312 $342 $263 $326 $216 $268 $283 $381 $464
Windows and Balconies
Typical Upgrades
Financing and Incentives
Private courtyards
NA
N/A
SUMMARY
600 detached residences, 100 townhomes, and 600 apartments/condos. Massive, multiplephase mixed-use planned community. Next door to Trilith Studios.
CITY OF FAYETTEVILLE HOUSING MARKET ANALYSIS Exhibit 55 Competitive TH Community - Trilith (290 Heatherden Ave) COMMUNITY OVERVIEW
SALES PACE
Developer: Halbert Development / Pinewood Atlanta Studios
Construction began in Q1 2017. 1.8 / mo. As of 2022, the rate is
Sales Pace: less 1 unit a month.
Delivery: Q4 2017 Presale: Began Q4 2017 Type: 100 THs
118 acres of green space
Features & Community wellness center 15 miles of pedestrian pathways Amenities: Gardens and playgrounds
Construction: Brick 4 Sided Parking Type: Private attached garage
Multiple swimming pools
Spaces/Ratio: Private 3 car garage
WalkScore®: N/A
HOA Fees: Annual Assoc. Fee: $2,400
PRODUCT PROGRAM Recently Sold (2020+) 1 Only the total unit count in the neighborhood is 14 known. Unit mix is unknown. Data is from recent sales
Unit Type
Unit Count
2B/2.5b/TH 3B/2.5b/TH
SUMMARY:
100
Unit Mix
26
100%
Actively Selling 3
Base Price Range
Avg. Price
Unit Size Range
$649,900 $649,900
$649,900
1,214 1,214
Average Size 1,214
$535 $535
Avg. $/SF $535
1
$489,000 $708,507
$632,186
1,754 2,397
1,964
$279 $296
$322
74%
$489,000 $708,507
$641,043
1,214 2,397
1,589
$279 $535
$403
Effective PSF
UNIT FINISHES Ceiling Height and Finish
10' ceilings on main
Lighting
Custom designer lighting
Flooring
Countertops, Cabinets and Bath Detail
Appliances and Tech
Windows and Balconies
Typical Upgrades
Financing and Incentives
Wide-plank hardwood flooring
Marble countertops in bathrooms and kitchens. Solid wood custom cabinetry with custom paint or stained finishes. Granite marble and stone counter top selections and apron front kitchen sink are standard.
Bosch appliance package, plumbing fixtures in popular finishes by Delta. Pre-wired for electric vehicle charging station.
Private front porch
NA
N/A
MARKET AUDIENCE
SUMMARY
Buyers all over; tv stars, investors, from out of town, few families with kids, some empty-nesters, majority from Atlanta metro area.
600 detached residences, 100 townhomes, and 600 apartments/condos. Massive, multiplephase mixed-use planned community. Next door to Pinewood Atlanta Studios.
SOURCE: Noell Consulting Group
3/18/2022
CITY OF FAYETTEVILLE HOUSING MARKET ANALYSIS Exhibit 56 Competitive/Analogous Communities - Canoe Club Community Overview ◘ Developer: Euram-Macauley One, LLC/Reynolds Capitol Group, LLC ◘ Lot sales and construction began in 2006, still ongoing ◘ HOA fees: $700 Community Features ◘ Master planned community of approximately 600 acres ◘ 350 homesites along 2 freshwater lakes ◘ Lake-adjacent cottage with fitness center, pool, coffee bar, addtl. New Construction Sales from Q4 2019 Beds ALL 4 5 Year Q4 2019 2020 2021
AVG Price
AVG SF
AVG $/SF
Avg Lot SF
$
525,549
3,364
$
158.34
66,726
$
517,759
3,247
$
161.01
70,551
$
561,157
3,899
$
146.17
49,513
All
Sales 4B
Sales 5B
20
17
3
10
9
1
9
6
3
Master planned community with custom homes as well as pre-built or pre-designed options. Includes access to 2 freshwater lakes along with wharf docks and canoe storage. Lake cottage includes some traditional amenities like lighted tennis courts, sunroom, coffee bar, fitness center, catering kitchen, and lap pool. Located within convenient driving distance of historic downtown Fayetteville as well as Trilith. All home sites 1 acre or more.
SOURCE: Noell Consulting Group, Metrostudy
3/18/2022
CITY OF FAYETTEVILLE HOUSING MARKET ANALYSIS Exhibit 57 Competitive SFD Community - Brighton Homes (110 Eastmark Wy, Fayetteville, GA 30214) COMMUNITY OVERVIEW
SALES PACE
Developer: Pulte Homes
Recent sales data indicates that five homes were sold in the month of December (2021) alone which is a strong pace. Sales
Sales Pace: have slowed as construction slowed with the most recent sale was
Delivery: Q4 2021 Presale: N/A
in March of 2022.
Size: 1-2 stories Construction: Pour Concreate; Stick Built; some with brick vaneer Parking Type: 2 car garage parking
Features & None Amenities:
Spaces/Ratio: 2 per unit WalkScore®: (0) Car-Dependent
HOA Fees: $117 Per mo.
PRODUCT PROGRAM Unit Type 2B/2.5b 4B/2.5b 5B/4.5b SUMMARY:
Unit Count
Unit Mix
Only the total unit count in the neighborhood is known. Complete unit mix is unknown. Data is from recent sales
Recently Sold (2020+) 2
Actively Selling 1
Base Price Range $425,325 $458,990
$442,158
2,264 2,430
Average Size 2,347
$188 $189
Avg. $/SF $188
5
3
$438,569 $477,990
$460,526
2,854 3,140
2,982
$154 $152
$154
6
0
$486,110 $642,990
$534,316
3,336 3,581
3,472
$146 $180
$154
13
17%
$425,325 $477,990
2,264 3,581
2,923
$146 $189
$155
75
Avg. Price
$451,658
Unit Size Range
Effective PSF
UNIT FINISHES Exterior
Brick/hardy plank
Ceiling / Lighting
Flooring
Cabinets
9’ ceilings finished, Hardwood floors in Modern designed shaker cabinets, recessed can, living and kitchen, track lighting in tile in bath, carpet with Brushed nickel pulls bath in bedrooms MARKET AUDIENCE
Many buyers are empty nesters, 55+, and families. Attracted to convenience to job cores at the Airport, Atlanta, as well as local job cores.
SOURCE: Noell Consulting Group
3/18/2022
Countertops
Granite/quartz with tile back splash
Appliances
Bath
Windows
Quartz, walkin showers Stainless appliances, gas cook top with with separate Large double pane windows double ovens, and vent hoods tubs in master
Outdoor Space Misc.
Porches and decks
-
CITY OF FAYETTEVILLE HOUSING MARKET ANALYSIS Exhibit 58 Competitive SFD Community - Annelise Park Drive: Park (Vinings Walk; Annelise Park Drive,) COMMUNITY OVERVIEW
SALES PACE
Developer: Multiple Developers
Construction began in 2005 and the community has been slowly adding on through the years. As of 2022, there are 22 lots ready
Sales Pace: to build with 3 lots breaking ground. There is no estimated time
Delivery: Q1 2004
of delivery.The current data is only resales.
Presale: N/A Type: 75 SFDs custom mini-mansions Construction: Cement Siding
Features & Pool, clubhouse, sports courts Amenities:
Parking Type: 2-3 car garages Spaces/Ratio: 2-3 car garages
WalkScore®: (18) Car-Dependent
HOA Fees: Annual Assoc. Fee: $1,000
PRODUCT PROGRAM Recently Sold (2020+)
Actively Selling
Base Price Range
Avg. Price
Unit Size Range
Average Size
Effective PSF
Avg. $/SF
6B/5.5b
6
1
$849,900 $1,425,000
$1,007,483
4,014 9,793
6,754
$146 $212
$149
5B/4b
1
1
$875,000 $875,000
$875,000
4,248 4,248
4,248
$206 $206
$206
1
0
$880,000 $880,000
$880,000
4,128 4,128
4,128
$213 $213
$213
1
0
$560,000 $560,000
$560,000
5,974 5,974
5,974
$94 $94
$94
1
0
$825,000 $825,000
$825,000
6,755 6,755
6,755
$122 $122
$122
10
13%
$560,000 $1,425,000
$992,500
4,014 9,793
6,904
$94 $213
$144
Unit Type
Unit Count
Unit Mix
Only the total unit count in the neighborhood is known. Data is from recent sales
5B/4.5b 5B/5b 5B/7b
SUMMARY:
75
UNIT FINISHES Ceiling Height and Finish
Lighting
Flooring
Countertops, Cabinets and Bath Detail
Appliances and Tech
Windows and Balconies
Typical Upgrades
Financing and Incentives
10’ Ceilings on Main Floor; in some cases vaulted ceilings
Recessed can lighting, lighted fans, chandeliers
Hardwood Flooring, ceramic tile in bath, carpet in bedrooms
Custom 42” Uppers and Crown Molding, Granite Kitchen and bathroom countertops. Framed walk in showers, double vanities, large soaking tub in master.
Custom, Stainless Steel Appliances including gas cooktop, Double Ovens, granite island
Large double pane windows with metal returns; porches and covered rear patio.
Previously, upgrades were up to the discretion of the owner. The future phase will be uniform with no upgrades.
NA
MARKET AUDIENCE Mix of empty nesters and families from local area who work in Atlanta, airport-area workers, including some Delta pilots, and healthcare workers. Most recent inquires have been from out of state, California and New York.
3/18/2022
SUMMARY Previously developed by various home builders (most custom homes); Currently being developed by Heather homes.
BRANCH PROPERTIES, LLC LAUREL ISLAND MARKET ANALYSIS
Rental Product Analysis
CITY OF FAYETTEVILLE HOUSING MARKET ANALYSIS Exhibit 59 Historical and Projected Job Growth to Apartment Absorption Relationship in Atlanta Metro
Note: Class A apartments are defined as CoStar's 3, 4 & 5 Star properties and exclude military, senior, and vacation properties.
Atlanta Metro Job Growth
2005
2007
2009
2010
2011
2012
2013
2014
Historical Job Growth
2015
2016
2017
2018
Projected Job Growth
2019
2020
35,055
57,059
118,510
74,854
64,575
57,575
62,808
78,333
88,483
60,067
83,692
(150,033)
2008
42,283
48,292
2006
24,071
2004
2011 - 2019: 63,770 Jobs/year
23,808
2003
(20,092)
-150,000
(136,950)
-100,000
2004 - 2007: 53,688 Jobs/year
(26,542)
-50,000
66,150
0
69,833
30,475
50,000
36,117
2008 - 2010: -61,194 Jobs/year
100,000
(23,100)
Metro Job Growth
150,000
2025
2026
2022 - 2026: 51,700 Jobs/year 2021
2022
2023
2024
The graphs on this page track the relationship between job creation and Class A apartment absorption. While population and wage growth are strongly related to apartment absorption, job growth figures capture many of these trends. Additionally, the relationship between job creation and apartment absorption can illuminate demographic trends and shifts in preferences. This relationship in the Atlanta metro has steadily risen since coming out of the Great Recession as young professionals have put off home ownership and many empty-nesters have sought to downsize with developers meeting this demand, often in urban, walkable areas, with an increasing amount of deliveries (thus net absorption). Despite the jobs fall out from the coronavirus pandemic in 2020, the metro absorbed over 14,800 units, and with a significant rebound in jobs occurring in 2021, an additional record of over 17,000 units were absorbed. Moving forward, NCG projects the net absorption to jobs relationship to grow with continued strong job growth and a lack of for-sale product within the Metro unable to meet demand, particularly at more modest price points, with just over 8,000 apartments absorbed on average per year over the five-year projection period.
20,000 16,000 14,000 10,000
2022 - 2026: 8,044 Apts/year
2022 - 2026: 15.6 Apts/ 100 Jobs
-10
6,000
7,939
4,165
2,653
9,031
6,321
4,769
1,061
3,994
6,808
4,011
7,357
4,848
9,773
10,152
9,099
14,836
17,385
13,629
9,415
7,362
5,000
4,814
0
-20
6,573
2,000
20 10
8,000 4,000
30
0
2003
2004
2005
2006
2007
2008
2009
2010
2011
2012
2013
2014
2015
2016
2017
2018
2019
2020
2021
2022
2023
2024
2025
2026
Historical Absorption
SOURCE: Noell Consulting Group, Costar, Economy.com | Moody's Analytics
3/18/2022
2020 - 2021: 16,111 Apts/year 2020 - 2021: -42.9 Apts/ 100 Jobs
2011 - 2019: 9.9 Apts/ 100 Jobs
2008 - 2010: -11.0 Apts/ 100 Jobs
2004 - 2007: 9.9 Apts/ 100 Jobs
12,000
2011 - 2019: 6,345 Apts/year
5,317
Metro Apartment Absorption
2008 - 2010: 6,707 Apts/year
2004 - 2007: 5,333 Apts/year
18,000
Projected Absorption
Absorption/100 New Jobs
-30
-40
Metro Absorption/100 New Jobs
Atlanta Metro Class A Apartment Absorption
CITY OF FAYETTEVILLE HOUSING MARKET ANALYSIS
4,814
5,000
7,362
13,629
17,385
14,836
9,099
10,152
9,415
2022 - 2026: 8,044 Avg. Abs. 41.7% Capture
COVID OTP Capture Spike
9,773
4,848
4,011
6,808
3,994
1,061
4,769
6,321
9,031
7,357
2011 - 2021: 8,120 Avg. Abs. 46.9% Capture
2008 - 2010: 6,707 Avg. Abs. 47.6% Capture
2,653
4,165
7,939
6,573
20,000 18,000 16,000 14,000 12,000 10,000 8,000 6,000 4,000 2,000 0
2004 - 2007: 5,333 Avg. Abs. 59.1% Capture
5,317
Metro Apartment Absorption
Atlanta Class A Apartment Absorption & Outside the Perimeter (OTP) Capture
2003 2004 2005 2006 2007 2008 2009 2010 2011 2012 2013 2014 2015 2016 2017 2018 2019 2020 2021 2022 2023 2024 2025 2026 Historical Metro Absorption
Projected Metro Absorption
100.0% 90.0% 80.0% 70.0% 60.0% 50.0% 40.0% 30.0% 20.0% 10.0% 0.0%
Regional Capture Rate
Exhibit 60 Outside the Perimeter (OTP) Capture of Atlanta Metro Class A Apartment Absorption
Outside the Perimeter (OTP) Capture of Metro Absorption
The Atlanta regional core, defined as "OTP" or Outside the Perimeter (the local reference for Interstate 285 that rings the City of Atlanta), has seen a decreasing share of absorption since 2003 as renters increasingly seek job proximity and dynamic, walkable intown neighborhoods. However, in recent years, there has been a small uptick with apartment units added to several suburban mixed-use developments and historic downtowns. This uptick became more pronounced during the COVID 19 pandemic, as many choose to relocate out of urban areas to save money given a decreased need for commuting. That said, we do believe this was a temporary spike that will gradually cool (as already demonstrated in 2021) as more and more employees are required to go back into the office, even if only for a few days per week, and urbanization trends return. Moving forward, while individual years will vary as the pipeline delivers, we project OTP to capture roughly 42% of metro absorption through 2026. Overall, this equates to an average of just over 3,300 units absorbed annually from 2022 - 2026.
Outside the Perimeter (OTP) Class A Apartment Absorption
10,000 8,000 6,000
1,926
2,000
2,945
3,766
6,133
8,314
9,638
3,423
4,832
3,966
61
2,950
1,754
3,740
3,149
40
2003 2004 2005 2006 2007 2008 2009 2010 2011 2012 2013 2014 2015 2016 2017 2018 2019 2020 2021 2022 2023 2024 2025 2026 Historical Outside the Perimeter (OTP) Absorption Projected Outside the Perimeter (OTP) Absorption
SOURCE: Noell Consulting Group and Costar
3/18/2022
3,577
736
2,737
4,533
4,608
0
4,975
2,000
2,334
4,000
SOURCE: Noell Consulting Group (based on surveys of properties)
3,671
Regional Apartment Absorption
2022 - 2026: 3,354 Apts/Yr
2011 - 2021: 3,806 Apts/Yr
2008 - 2010: 3,194 Apts/Yr
2004 - 2007: 3,154 Apts/Yr
12,000
CITY OF FAYETTEVILLE HOUSING MARKET ANALYSIS Exhibit 61 Fayette County Submarket Capture of Outside the Perimeter (OTP) Apartment Absorption
2004 - 2007: -0.1% Capture
10,000
2008 - 2010: 0.1% Capture
2022 - 2026: 5.1% Capture
2011 - 2021: 1.1% Capture
8,000 6,000
1,926
2,000
2,945
3,766
6,133
8,314
9,638
3,423
4,832
3,966
61
2,950
1,754
3,740
3,149
40
2,334
3,671
3,577
736
2,737
0
4,533
2,000
4,608
4,000 4,975
Regional Apartment Absorption
12,000
2003 2004 2005 2006 2007 2008 2009 2010 2011 2012 2013 2014 2015 2016 2017 2018 2019 2020 2021 2022 2023 2024 2025 2026 Historical Absorption Projected Absorption Fayette County Capture
30.0% 20.0% 10.0% 0.0% -10.0% -20.0% -30.0% -40.0% -50.0% -60.0% -70.0%
Capture Rate
Outside the Perimeter (OTP) Class A Apartment Absorption & Fayette County Capture
Over the past cycle (2011-2021) Fayette County has averaged just 1.1% capture of the OTP market, however in more recent years, new deliveries at mixed-use developments such as the Lofts at Trilith and Downtown walkable deals such as Meridian, have shown the potential to boost the capture. In addition to more of these urban-suburban town centers helping to increase capture going forward, COVID has also helped to spur the increase of the build-to-rent SFD & TH market, much of which is in the pipeline for areas like Fayette County, indicating the demand potential is there going forward. Given these trends, along with an overall push to the suburbs and more affordable markets as a result of more work remote situations, we forecast this capture to have the potential to increase to as high as 5-10% of the OTP market. The result is a forecasted annual average of approximately 170 units per year through 2026.
Fayette County Class A Apartment Absorption 2004 - 2007: -02 Avg. Absorption
250
150
-100
173
180
236
264
5
95
160 -2
73
171
15
-15
-32
-17
38 -25
19 -23
0 -8
-5
0 -50
6
50
17
100
2003 2004 2005 2006 2007 2008 2009 2010 2011 2012 2013 2014 2015 2016 2017 2018 2019 2020 2021 2022 2023 2024 2025 2026 Fayette County Historical Absorption Deliveries
SOURCE: Noell Consulting Group and Costar
3/18/2022
2022 - 2026: 171 Avg. Absorption
2011 - 2021: 42 Avg. Absorption
2008 - 2010: 04 Avg. Absorption
200
-36
Submarket Apartment Absorption
300
CITY OF FAYETTEVILLE HOUSING MARKET ANALYSIS Exhibit 62 (Page 1 of 2) Fayette County Apartment Supply and Demand Analysis
Employment Growth in the Metro1 Projected Jobs to New Apt. Absorption In Metro Est. Supportable New Apt Absorption in Metro Outside the Perimeter (OTP) Capture of Metro Est. Supportable New Apt Absorption Outside the Perimeter (OTP) Fayette County Capture of New Apt. Abs. w/in OTP Fayette County New Apartment Absorption
'03-'20 Average 23,998 27.5 6,595
'11-'20 Average 42,390 19.2 8,120
2021 74,854 23.2 17,385
2022 118,510 11.5 13,629
2023 57,059 16.5 9,415
FORECAST 2024 35,055 21.0 7,362
2025 23,808 21.0 5,000
2026 24,071 20.0 4,814
2022- 2026 Average 51,700 15.6 8,044
51% 3,374 0.6% 19
47% 3,806 1.1% 42
48% 8,314 1.1% 95
45.0% 6,133 0.1% 5
40.0% 3,766 7.0% 264
40.0% 2,945 8.0% 236
40.0% 2,000 9.0% 180
40.0% 1,926 9.0% 173
41.7% 3,354 5.1% 171
1/ Employment growth from Economy.com 2/ Noell Consulting Group analysis based on larger analysis and trends of the market. 3/ Fayette County submarket shown above SOURCE: Noell Consulting Group, CoStar, Economy.com
3/18/2022
CITY OF FAYETTEVILLE HOUSING MARKET ANALYSIS Exhibit 62 (Page 2 of 2) Fayette County Apartment Supply and Demand Analysis Fayette County New Apartment Absorption NOTES: 1. The numbers found beneath the year columns for each project indicate the percentage of the year the projects are expected to be in lease-up. 2. Projects that delivered in 2020 or 2021, but were/are currently in lease-up are designated in PURPLE, with the number of outstanding units as of January 1st, 2022 listed. Projects that are currently under construction are designated in GREEN. 3. Based on our demand forecast we believe there is positive demand for up to an additional 500 units within the City. These may come in a variety of product types - rental TH, rental SFD, multifamily flats, etc. but represent the otal volume the market can support.
5 Year Pipeline Premier Lofts at Trilith (Capstone Communities) Walton Fayetteville (Walton Communities) Meridian on the Square (Miles Hill) Potential Future Project Potential Future Project
Total Unmet Demand (After the addition of 500 New Units):
3/18/2022
0.25
2023 264
2024 236
1.00
0.25 1.00
These projects added to see how many units the market can support and still maintain supply/demand balance
Total, Projects Known Matriculation Factor Total, All Projects w/Matriculation Total Deliveries (in units)
SOURCE: Noell Consulting Group, CoStar, Economy.com
2022 5
2025 180
1.00
2026 173
1.00
Total 857 Total 5 270 220 250 250
0.3 100% 0.3 0
1.0 100% 1.0 270
1.3 100% 1.3 220
1.0 75% 1.8 188
1.0 66% 1.2 165
995 843
5
-6
16
-8
8
15
843
CITY OF FAYETTEVILLE HOUSING MARKET ANALYSIS Exhibit 63 Historic and Projected Vacancy and Rent Growth of Class A Properties in the Fayette County Rental Submarket SUBMARKET ABSORPTION, DELIVERIES, & TOTAL VACANCY Historic Ann. Avg. 6.2%
300 250
7.0%
200 150 100
6.2%
6.1% 5.7% 5.9% 5.7% 5.7%
6.6% 5.5%
5.0%
7.7%
7.1%
Projected Ann. Avg. 4.2%
8.4%
8.1%
9.0% 8.0%
7.1%
7.0%
5.7%
5.1% 5.2%
6.0%
5.1% 4.9% 4.7%
4.1%
3.9% 3.9%
50
5.0%
3.5%
4.0% 3.0%
0
2.0%
-50
1.0%
-100
2002 2003 2004 2005 2006 2007 2008 2009 2010 2011 2012 2013 2014 2015 2016 2017 2018 2019 2020 2021 2022 2023 2024 2025 2026 Net Absorption Units
Deliveries Units
Total Vacancy Percent
0.0%
Historical Vacancy (2002-2020)
The result of our supply demand analysis can be seen here, with validation that even the addition of an additional 500 units above the current pipeline will still enable the market to maintain lower vacancy rates and push strong rate growth through 2026.
EFFECTIVE RENT VS VACANT STOCK 250
Historic Ann. Avg. 2.5%
18.1%
200 10.3%
150 100 50 0
3.4%
-0.3%
1.0%
-2.9%
5.3% 4.9%
2.7%
1.4% -2.7%
1.6%
9.8% 5.2%
5.1%
3.3%
14.00%
11.3% 4.4%
5.8% 5.8% 6.5%
-0.4%
9.00% 4.00%
-1.00%
-4.3%
Vacancy Units
24.00% 19.00%
2002 2003 2004 2005 2006 2007 2008 2009 2010 2011 2012 2013 2014 2015 2016 2017 2018 2019 2020 2021 2022 2023 2024 2025 2026
SOURCE: Noell Consulting Group, CoStar
3/18/2022
0.1%
Projected Ann. Avg. 6.8%
Effective Rent Growth/Yr
-6.00%
CITY OF FAYETTEVILLE HOUSING MARKET ANALYSIS Exhibit 64 Estimated Demand Potential for New Market Rate Independent and Assisted Living Units in the City of Fayetteville Senior Household Demand Total Senior Households (65+) 2022, City of Fayetteville /1
2,368
Seniors 65-84, $50k Income + /1
1,234
% Not already in Nursing Home/Indp.-Assisted Living/Living with Family /2
76%
Preference for Age-Restricted Apartments (55+, IL) /2
66.0%
Annual Turnover /4
11.8%
Total Currently Supportable Age-Restricted Apartments
73
Growth through 2027 of Age/Income-Qualified Seniors Preferring Age-Restr.
17
Total Annual Demand
90
Factoring in Lost Seniors (at 5%) /5
95
Factoring in 10% Vacancy Rate /5
106
City of Fayetteville Capture - Those Remaining in City
85%
Est. Annual Senior Demand in City of Fayetteville Number of Competitive Indp/Ass. Senior Living Facilities in Fayetteville
3
2 1
90 3
Potential New Development Fair Share Capture
25%
Net Annual Demand Potential at Fair Share Capture (55+ and/or IL)
22
Total Annual Units Supported Assuming Add'l 30% Assisted Living Units /5
29
While limited, demand exists for market rate senior housing (in either 55+ or an IL/AL facility) at an estimated 30 beds per year within the City of Fayetteville. This would likely translate into one new 90 bed facility supported every three years. 1 1/ Claritas, Inc. for HHs 65+. 2/ AARP based on National average. 3/ Noell Consulting using modified estimates from the US Census. 4/ US Census Bureau 5/ From previous interviews and research with analogous facilities in the SE. SOURCE: Noell Consulting, Claritas, AARP, US Census
3/18/2022
Heartis Fayetteville
2 Azalea Estates of Fayetteville 3
Oaks at Fayetteville
CITY OF FAYETTEVILLE HOUSING MARKET ANALYSIS Exhibit 65 Summary of the Competitive Communities by Product Type Product Type
1 Villages at Lafayette
Market Rate Apts
2014
97%
263
603 1,388
2 Meridian at Lafayette
Market Rate Apts
2015
100%
210
576 1,369
3 Equinox at Knight
Market Rate Apts
2016
96%
194
711 1,285
ID Community Name
Product Type
4 Heartis Fayetteville IL
Independent Living
ID Community Name
Product Type
5 Hearthside Club Lafayette
Year Built % Leased
2017
100%
Year Built % Leased
Total Units
Total Units
80
Total Units
Absolute Effective Rent Range
Weighted Average Rent
879
$1,600 $2,800
$2,109
$2.40
51%
966
$1,505 $2,485
$2,005
$2.08
35%
997
$1,438 $1,863
$1,627
$1.63
28%
Absolute Effective Rent Range
Weighted Average Rent
$3,134 $3,933
$3,573
Absolute Effective Rent Range
Weighted Average Rent
$800 $2,150
$1,327
$1.37
44%
Weighted Unit Size Range Average Unit Size 654 900
789
Weighted Unit Size Range Average Unit Size 717 1,384
970
Weighted Percent Average Less than $/SF 2B/2b
Weighted Percent Average Less than $/SF 2B/2b $4.53
45%
Weighted Percent Average Less than $/SF 2B/2b
55+ Rental (Tax Credit)
2018
100%
125
99%
174
652
1,265
920
$1,695
$2,646
$2,128
$2.40
41%
Market Average
2016
Market Rate Apts
2015
98%
222
630
1,347
947
$1,514
$2,383
$1,914
$2.04
38%
Independent Living Average
2017
100%
80
654
900
789
$3,134
$3,933
$3,573
$4.53
45%
55+ Rental (Tax Credit) Average
2018
100%
125
717
1,384
970
$800
$2,150
$1,327
$1.37
44%
SOURCE: Noell Consulting Group, CoStar
3/18/2022
Year Built % Leased
Weighted Unit Size Range Average Unit Size
ID Community Name
CITY OF FAYETTEVILLE HOUSING MARKET ANALYSIS Exhibit 66 Comparison of Key Competitive/Analogous Communities For-Sale Product in the Market - Weighted Average 55+ Rental Communities (Tax Credit) $3,700
Market Rate Apartments
Heartis Fayetteville IL $4.53/SF
Independent Living
$3,200
PRICE
$2,700
Lofts at Trilith $2.40/SF
$2,200
Meridan at Lafayette $2.08/SF
Exhibit 71 (Page 2 of 2)
Equinox at Knight $1.63/SF
$1,700
Hearthside Culb Lafayette (Tax Credit) $1.37/SF $1,200
600
700
800
SOURCE: Noell Consulting Group based on surveys of properties.
3/18/2022
900
1,000
SIZE
1,100
1,200
1,300
1,400
1,500
CITY OF FAYETTEVILLE HOUSING MARKET ANALYSIS Exhibit 67 Competitive Rental Community - Premier Lofts at Trilith (301 Veterans Pky) OVERVIEW
Developer Name Pace Lynch Corporation
App. + Admin. Fee: $75/app + $200/admin
Owner Name Pinewood Forrest Real Estate
Pet Fees: $350 fee + $30/mo
Property Manager Name Capstone Companies - Premier Lofts at PinewoodOther For Fees: $30/mo valet trash Year Built 2019-2020
Parking Fees: $50/mo for 2nd vehicle
Number Of Stories 4
Parking Type: Surface/parking deck
Lease Up Pace: N/A
Total Spaces 442
PRODUCT PROGRAM
SUMMARY
Walk Score®: 15 (Car-Dependent)
Spaces/Bed: 1.09
According to the leasing agent, there is a wide mix of age demographics with many young professionals working at
Market Audience: local hospital, airport, and other south Atlanta employers as well retirees and families.
Multi-phase apartment complex that is part of the Pinewood Forest ecosystem, including for-sale resi, retail, office, and movie studio. Leasing has just begun, with 18 units online and another 18 coming online March 1st. All unit
Building Summary: phases are expected to be complete and online by the end of Q3 2020, for a total of 263 units that will also include some Studios and 3B's.
Unit Type
Unit Count
Unit Mix
Available Units
Percent Leased
Quoted Effective Rent Range
Avg. Rent
Jr. 1B/1b 1B/1b 1B/1b/D 2B/2b 2B/2b/D 3B/2b 3B/2.5b
17 114 3 104 13 10 2
6% 43% 1% 40% 5% 4% 1%
0 5 1 0 0 1 0
100.0% 95.6% 66.7% 100.0% 100% 90% 100%
$1,600 $1,600 $1,775 $2,014 $2,065 $2,095 $2,075 $2,550 $2,091 $2,091 $2,561 $2,750 $2,800 $2,800
$1,600 $1,922 $2,080 $2,328 $2,091 $2,706 $2,800
SUMMARY:
263
100%
7
97.3%
$1,600 $2,800
$2,109
Unit Size Range 603 623 805 964 1,059 1,377 1,377
603 791 805 1,132 1,059 1,388 1,377
603 701 805 1,040 1,059 1,387 1,377
603 1,388
879
FINISHES AND AMENITIES
Ceiling Height and Finish: 9' ceilings Lighting and Fixtures: Black track lighting in kitchen/bath, glass pendants in kitchen, lighted fans in living/bedroom Flooring: LVT throughout Cabinets and Hardware: Shaker cabinets w/ SS pulls Countertops: Granite countertops; subway tile backsplash Appliance Package: Flat top electric SS appliances with standard SS refrigerator Laundry and Bath Detail: Stackable full size washer and dryer Windows and Balconies: Large double pane windows Additional Features: French doors leading to balcony/patio (in select units) Community Features 24-hour fitness center, lounge, courtyard, pool, grill stations, clubhouse w/ entertainment room, and Amenities: dog park, on-site retail/restaurant, electric vehicle charging stations
Source: Noell Consulting Group, CoStar
3/18/2022
Weighted Avg. Size
Current Conc.
None
Effective $/SF Range Avg. $/SF $2.65 $2.65 $2.55 $2.85 $2.57 $2.60 $2.15 $2.25 $1.97 $1.97 $1.86 $1.98 $2.03 $2.03
$2.65 $2.74 $2.58 $2.24 $1.97 $1.95 $2.03
$1.86 $2.85
$2.40
CITY OF FAYETTEVILLE HOUSING MARKET ANALYSIS Exhibit 68 Competitive Rental Community - The Meridian at Lafayette (665 Lafayette Ave) OVERVIEW
Developer Name -
App. + Admin. Fee: $85/app + $250/admin
Owner Name Cowart Building Group
Pet Fees: $350 fee + $30/mo
Property Manager Name Matrix - The Meridian at Lafayette
Other Fees: $45-$85/mo storage
Year Built 2017
Parking Fees: Free surface, $150/mo garage
Number Of Stories 3
Parking Type: Surface/assigned garage
Lease Up Pace: 25 units/mo
Total Spaces 317
PRODUCT PROGRAM
SUMMARY
Walk Score®: 39 (Car-Dependent)
Spaces/Bed: 0.88
Primarily 60% local families, with the rest comprising of young professionals working at local hospital, airport, and
Market Audience: other south Atlanta employers.
New apartment community adjacent to Downtown Fayetteville and the price leader in Fayetteville. Offers an updated
Building Summary: finished and amenity package and the only community in the competitive set offering dens. Unit Type
Unit Count
Unit Mix
Available Units
Percent Leased
Quoted Effective Rent Range
Avg. Rent
1B/1b 2B/2b 2B/2b/Den 3B/2b
74 112 9 15
35% 53% 4% 7%
0 1 0 0
100.0% 99.1% 100.0% 100.0%
$1,505 $1,825 $1,990 $2,190 $2,385 $2,385 $2,485 $2,485
$1,720 $2,098 $2,385 $2,485
SUMMARY:
210
100%
1
99.5%
$1,505 $2,485
$2,005
Unit Size Range 576 1,006 1,329 1,369
729 1,201 1,329 1,369
692 1,063 1,329 1,369
576 1,369
966
FINISHES AND AMENITIES
Ceiling Height and Finish: 9'-10' ceilings Lighting and Fixtures: Track in kitchen, pendants over island Flooring: Vinyl HW in kitchen, bath and living room. Carpet in bedroom. Cabinets and Hardware: 42" shaker with vertical pulls Countertops: Two packages, cloud white granite or harbor white granite Appliance Package: Whirlpool stainless steel with smooth top range Laundry and Bath Detail: Full sized, washer/dryer, tub/shower combo, standing showers in select units Windows and Balconies: Standard punch windows, balconies in select units Additional Features: USB outlets Community Features Salt water pool, grilling stations, fire pit, car detailing station, conference room, tenant lounge, pet and Amenities: park, fitness center
Source: Noell Consulting Group, CoStar
3/18/2022
Weighted Avg. Size
Current Conc. None
Effective $/SF Range Avg. $/SF $2.50 $2.61 $1.82 $1.98 $1.79 $1.79 $1.82 $1.82
$2.49 $1.97 $1.79 $1.82
$1.79 $2.61
$2.08
CITY OF FAYETTEVILLE HOUSING MARKET ANALYSIS Exhibit 69 Competitive Rental Community - Equinox at Knight (100 Knight Way) OVERVIEW
Developer Name N/A
App. + Admin. Fee: $100/app + $300/admin
Owner Name Boardwalk Wealth
Pet Fees: $400 fee + $45/mo
Property Manager Name Alexander Properties - Equinox at Knight Year Built 1988
Parking Fees: -
Number Of Stories 3
Parking Type: Surface
Lease Up Pace: N/A
Total Spaces 388
SUMMARY
Walk Score®: 13 (Car-Dependent)
PRODUCT PROGRAM
Other Fees: -
Spaces/Bed: 1.04
Roughly equal percentages of healthcare workers, air-line employees, studio workers, and locals. There is a 50/50
Market Audience: split in age demographics
An old class A apartment community east of Downtown Fayetteville. Currently, the only community in the competitive
Building Summary: set offering dens, sunrooms, and patios. Unit Type
Unit Count
Unit Mix
Available Units
Percent Leased
Quoted Effective Rent Range
Avg. Rent
1B/1b 2B/1b 2B/b/D 2B/2b 3B/2b
54 30 40 30 40
28% 15% 21% 15% 21%
3 0 2 2 1
94.4% 100.0% 95.0% 93.3% 98%
$1,438 $1,468 $1,513 $1,513 $1,653 $1,653 $1,748 $1,748 $1,798 $1,863
$1,455 $1,513 $1,653 $1,748 $1,831
SUMMARY:
194
100%
8
95.9%
$1,438 $1,863
$1,627
Unit Size Range 711 932 1,027 1,128 1,208
FINISHES AND AMENITIES
Ceiling Height and Finish: 9'-10' ceilings Lighting and Fixtures: Fluorescent light in kitchen, flush lighting in living area, no ceiling fans in bedrooms Flooring: Vinyl HW in kitchen, bath and living room. Carpet in bedroom. Cabinets and Hardware: 42" shaker with SS knobs, subway tile backsplash Countertops: Granite throughout Appliance Package: Standard black appliances with gas range Laundry and Bath Detail: Community washer/dryer, standards tub/shower combo Windows and Balconies: Standard punch windows, balconies in select units Additional Features: Fire places in every unit, walk-in closets, sunrooms/patios available in select units Community Features Swimming pool, Playground, fitness center, sport/activities court, and tennis courts and Amenities:
Source: Noell Consulting Group, CoStar
3/18/2022
Weighted Avg. Size
786 932 1,027 1,128 1,285
753 932 1,027 1,128 1,247
711 1,285
997
Current Conc.
None
Effective $/SF Range Avg. $/SF $1.87 $2.02 $1.62 $1.62 $1.61 $1.61 $1.55 $1.55 $1.45 $1.49
$1.93 $1.62 $1.61 $1.55 $1.47
$1.45 $2.02
$1.63
CITY OF FAYETTEVILLE HOUSING MARKET ANALYSIS Exhibit 70 Competitive 55+ Community - Garden Court: Park (Garden Ct., Courtyard Lane, Arbor Way, Wilbanks Drive) COMMUNITY OVERVIEW
SALES PACE
Developer: Lennar Homes
Construction began in Q1 2021 with presales beginning in
Sales Pace: February 2021. So far 63 have been built with 66 remaining.
Delivery: Q1 2021
This is Phase 1 of 5 planned phases.
Presale: February 23 2021 Type: Master on main 55+ community design Construction: Cement Siding, Stick Built
Features & Clube House and Pool Amenities:
Parking Type: 2 car garages per unit Spaces/Ratio: 2 car garages per unit
WalkScore®: (22) Car-Dependent
HOA Fees: $114/mon
PRODUCT PROGRAM Unit Type
Unit Count
2B/2b
Unit Mix
There are three designs with floor plans from 2B's to 3B's. Data is from recent sales
3B/2b
SUMMARY:
Recently Sold (2020+)
Actively Selling
Base Price Range
Avg. Price
Unit Size Range
Average Size
Effective PSF
Avg. $/SF
3
2
$376,900 $390,900
$384,883
1,817 2,104
1,968
$186 $207
$196
6
1
$401,900 $446,395
$419,708
2,084 2,759
2,585
$162 $193
$162
$376,900 $390,900
$383,900
1,817 2,759
2,288
$162 $207
$168
Appliances and Tech
Windows and Balconies
9
129
UNIT FINISHES Ceiling Height and Finish
Lighting
9'-10’ Ceilings with crown molding
Recessed can lighting, lighted fans in living and bedrooms, chandilers in kitchen, track lighting in bathroom
Flooring
modern 42" shaker cabinets in all with Standard punch SS gas cooktop with seperated windows, some with LVT in living rooms, tile in brushed nickel pulls, granite/marble double oven, and refrigerators with back yards, others only bath, carpet in bedrooms throughout, farmless walk in showers, water/ice dispenser modern tile in bath/shower have a front yard.
MARKET AUDIENCE Mix of empty nesters, retirees, and families. The community was designed for 55+ community but accepts everyone no matter the age. 75% are over 55( 60% single 40% couples) with the rest being a mix of families and other audience demographics. According to the listing agent, all tenants are locals who are moving due to downsizing and/or wanting to be close to good schools . SOURCE: Noell Consulting Group
3/18/2022
Countertops, Cabinets and Bath Detail
Typical Upgrades
Financing and Incentives
None
$5,000 towards closing If the future owners use their insurance agent.
SUMMARY Quiet neighborhood close to Downtown Fayetteville. Typical product for 55+ communities (master on main with limited two story homes).
CITY OF FAYETTEVILLE HOUSING MARKET ANALYSIS Exhibit 71 Competitive 55+ Community - Garden Court: Park (Garden Ct., Courtyard Lane, Arbor Way, Wilbanks Drive) COMMUNITY OVERVIEW
SALES PACE
Developer: N/A
Construction began in 1990 and ended in 1992. Recent sales
Sales Pace: have the property reselling at around 11 units per year, or
Delivery: Q1 1992
almost 1 unit a month.
Presale: Began selling in 1990 Type: 112 duplexes Construction: Cement Siding
Features & None Amenities:
Parking Type: 1 car garages per unit Spaces/Ratio: 1 car garages per unit
WalkScore®: (22) Car-Dependent
HOA Fees: N/A
PRODUCT PROGRAM Unit Type
Unit Count
Unit Mix
Recently Sold (2020+)
Actively Selling
Closing Price Range
Avg. Price
Unit Size Range
Average Size
Effective PSF
Avg. $/SF
2B/2b
112
100%
17
0
$134,000 $242,000
$185,682
1,226 1,450
1,285
$109 $167
$145
SUMMARY:
112
$134,000 $242,000
$188,000
1,226 1,450
1,338
$109 $167
$141
Appliances and Tech
Windows and Balconies
Typical Upgrades
Financing and Incentives
lower level houses with black appliances where the high priced ones have SS appliances and refrigerators with French doors,, fire places in all units
Standard punch windows, some with fenced in back yards, others only have a front yard.
None
Typically lower income
17
UNIT FINISHES Ceiling Height and Finish
Lighting
Flooring
Countertops, Cabinets and Bath Detail
10’ Ceilings
Recessed can lighting, lighted fans, chandeliers
Carpet/LVT in living rooms, LVT's in bath, carpet/LVT in bedrooms
Standard 42" shaker cabinets in all, laminate in lower priced houses granite in higher priced ones
MARKET AUDIENCE Mix of empty nesters, retirees, 55+. Typical of retirees who don’t have a lot of money and don't want to deal with the hassle of having a lot of land which is typical of most SFD's in the Fayetteville area. SOURCE: Noell Consulting Group
3/18/2022
SUMMARY Quiet neighborhood close to Downtown Fayetteville. Typical product for 55+ communities that are of lower economic status.
Fayetteville - Hwy 85 Corridor Market Analysis
1
DETACHED FOR-SALE DEMAND IN COUNT Y • This data shows the historic and future demand potential for single-family detached product in the County • Strong job growth projections in the Metro for 2022 and 2023 will continue to drive strong demand • The County’s capture of the Metro has been trending up thanks to new developments such as Trilith increasing awareness and inventory New Single Family Detached Home Sales Region
2005-2020 Avg. Annual Sales
2015-2020 Avg. Annual Sales
2021-2025 Projected Avg. Annual Sales
Atlanta Metro
18,021
19,800
16,678
Fayette County Share (%)
1.7%
2.2%
2.7%
Fayette County
314
362
421
2
ATTACHED FOR-SALE DEMAND IN COUNT Y • This data shows the historic and future demand potential for single-family attached product for the County • Metro wide the percentage of attached new home sales of all new sales has been increasing, primarily as a means of offering greater affordability, but also as growing demographic segments chose more maintenance-free living such as first-time home buyers and Empty Nester downsizers • While attached product has been rare in the County historically, Trilith and increased lifestyle offerings in Downtown Fayetteville bring new opportunities for buyers to consider the product and we therefore believe it will see increased demand going forward, ultimately matching the metro average of 20-22% of all new home sales being attached. In Fayette County these will likely all be fee-simple townhomes. New Single Family Attached Home Sales Region
2005-2020 Avg. Annual Sales
2015-2020 Avg. Annual Sales
2021-2025 Projected Avg. Annual Sales
Atlanta Metro
3,635
3,189
3,888
Fayette County Share (%)
0.1%
0.2%
1.95%
Fayette County
4
5
76
3
MULTIFAMILY RENTAL RESIDENTIAL DEMAND • Coweta and Fayette County have seen an increase share of Class A multifamily absorption since 2011 • Absorption in Fayette County has largely been limited by lack of new supply • Increasing lifestyle environments in Newnan, Trilith, and potential Downtown Fayetteville will increase the market’s capture moving forward • NCG’s forecasted demand of 276 units annually from 2021-2025 allows for absorption of the planned deals in the pipeline and up to an additional 250-300 units within the County by 2025 Net New Multifamily Absorption Region
2011-2020 Avg. Annual Apt Abs.
2015-2020 Avg. Annual Apt. Abs.
2021-2025 Projected Avg. Annual Apt. Abs.
Atlanta Metro
7,187 units
9,349 units
12,561 units
Coweta & Fayette County Share
2.0%
2.5%
3.9%
Coweta & Fayette County
143 units
233 units
494 units
Fayette County Share
25.4%
28.7%
55.9%
Fayette County
36 units
67 units
276 units
Sources: CoStar, NCG
4
RETAIL DEMAND IN COUNT Y • Nationally, and throughout the Atlanta metro, retail growth has been dwindling as more retail expenditures shift to online sales. That said, net absorption is still seen in areas of increasing population density and as newer retail concepts – primarily in food and beverage and professional services are introduced • With retail in Fayette’s core serving a larger market area than just the county, and strong new household growth in those areas, we forecast the county capture to steadily increase in the coming years
Net New Retail Absorption Region
2002-2011 Avg. Annual Retail Abs.
2012-2020 Avg. Annual Retail Abs.
2021-2025 Projected Avg. Annual Retail Abs.
Atlanta Metro
5.6 Million SF
2.65 Million SF
1.9 Million SF
Fayette County Capture
3.1%
2.5%
3.87%
Fayette County Absorption
174,000 SF
67,000 SF
73,500 SF
5
OFFICE DEMAND IN COUNT Y • The local office market has been stagnant in recent years with 3 years showing negative absorption since 2016 • However, there has been limited new product added to attract prospective users to the market • NCG estimates the County will absorb close to 62,000 SF of Class A office space annually, Trilith likely to get first several years given existing space • Given annual absorption levels office product should be provided in the 5,000 - 20,000 SF range, ideally in high value areas such as proximity to retail, parks / trails, with high visibility
Net New Office Absorption Region
2002-2011 Avg. Annual Office Abs.
2012-2020 Avg. Annual Office Abs.
2021-2025 Projected Avg. Annual Office Abs.
Atlanta Metro
2,150,476 SF
2,351,877 SF
1,033,785 SF
Fayette County Capture
3.9%
1.7%
5.9%
Fayette County Absorption
83,014 SF
40,451 SF
61,362 SF
6
CORRIDOR CAPTURE AND FORECASTED DEMAND Since 2015, approximately 1 million SF of new commercial and multifamily space has been added to the Fayette County market Of this, 60,000 SF was within the Highway 85 north corridor, or a 6% capture. With Peachtree City limiting development, and Trilith and the Fayetteville LCI increasing market perception/awareness of the Fayetteville market, we believe this capture can grow up to a 10-20% range. Land Use
2021-2025 Annual Forecasted County Demand
Est. Highway 85 Corridor Capture
2021-2025 Annual Forecasted Highway 85 Demand
Detached For-Sale
421
5%
21
Attached For-Sale
76
20%
15
Multifamily
276
15%
41
Retail
73,500 SF
15%
11,025 SF
Office
61,362 SF
10%
6,136
7
DEMAND REALIZATION IN THE CORRIDOR While demand exists, it is unlikely detached (SFD) homes will be built in the corridor given the lack of remaining greenfield sites. If realized this would be in the form of small lot (35’-55’) product. While attached/TH demand is limited in the corridor today, we believe pent-up years of demand from 2021-2023 will combine to sell out the new units coming online at Satterfield, then new demand will be available for approximately 30 additional units in 2024 -2025. Multifamily demand will likely come in the form of one new 200 +/- unit community within the 20212025 time frame. Most retail demand will continue to be small outparcels and back filling existing tenants that may close – more on this in a few slides. Office demand is limited, but potential for adaptive reuse of older retail centers in the corridor. Likely to be one in the 30-40,000 SF range by 2025.
Land Use
2021-2025 Annual Forecasted Highway 85 Demand
Detached For-Sale
21
Attached For-Sale
15
Multifamily
41
Retail
11,025 SF
Office
6,136
8
OVERVIEW OF HWY 85 CORRIDOR 3.8 Million SF of commercial space ▪ 3.5 M retail ▪ 266k office ▪ 67.5k industrial/flex ▪ 0 MF
4,994 jobs ▪ 83% pay below $40k ▪ 99% commute in
9
RETAIL MARKET OVERVIEW
(150,000) (200,000)
8,000
16,680 106,918
0
11,438 187,780
4.0%
10.0% 8.0%
(10,193)
5.2%
0
8,964 2,139
0 123,430
12,320 98,547
6.5%
(120,530)
(100,000)
7.8%
8.5%
(63,258)
(50,000)
12,713 33,752
0
0
50,000
7.8%
(122,545)
8.6%
12.0%
12.0%
9.7%
0
150,000
9.9%
(112,575)
10.9%
3,338 55,445
200,000 100,000
14.0%
12.4%12.7%
0 24,077
Since 2008, approx. 73k SF added – mostly free standing outparcels Net absorption has gone up and down, losing big tenants and then taking 1-2 years to fill Total net absorption since 2008 only 49,000 SF Vacancy is currently low, but rate growth has been flat for over a decade
250,000
0
▪ 79% in 15 shopping centers of 20k SF+ ▪ Over 40% located in Fayette Pavilion alone
Local Retail Activity: 2008-2021 YTD - Class A/B Properties
(153,701)
3.5 Million SF
4.6%
2008 2009 2010 2011 2012 2013 2014 2015 2016 2017 2018 2019 2020 2021 Deliveries SF Net Absorption SF Total Vacant Percent % Total YTD
6.0% 4.0% 2.0% 0.0%
10
REGIONAL DRAWING TRADE AREA Majority of patrons come from within 15-miles Most from Fayette County, but also Fairburn, Union City, Senoia
11
RETAIL SALES LEAKAGE Demand potential is high for many store categories, however several are likely less desirable for the corridor: ▪ Motor vehicle and parts dealers ▪ Gasoline stations
Strongest acceptable opportunities are for: ▪ Full-service restaurants ▪ Health and personal care ▪ General merchandise ▪ These uses tend to be in small boxes on out parcels, or in the case of general merchandise – large anchor boxes (Target, Sam’s Club, Costco, etc.) ▪ Most out parcels opportunities are gone, and large anchor space does not exist without redevelopment
12
EXISTING RETAIL CENTERS We examined the 15 shopping centers along the corridor are rated them for redevelopment potential Rating was based on: ▪ Age ▪ % leased ▪ Current rental rates ▪ Tenant strength
A; Strong fundamentals, low redev. opportunity B; Moderate fundamentals, redev. 5-10 years C; Poor fundamentals, high redev. opportunity
13
REDEVELOPMENT ECONOMICS A properties are in the $150+/SF value and result in a land value to high for redevelopment B properties are +/$100/SF in value and result in a land value that would require high density development C properties are less than $100/SF in value and result in a land value under $750k/acre
C
B
A
14
REDEVELOPMENT ECONOMICS - RESIDENTIAL Land values of existing centers along the corridors, even C grade, will not make residential redevelopment feasible. Future residential additions will largely need to be on remaining greenfield sites.
15
REDEVELOPMENT ECONOMICS - COMMERCIAL Current office lease rates in the greater Fayette market will make new construction speculative office space difficult unless part of a larger mixeduse development. Opportunities do exist to adaptively reuse older retail spaces into creative office and bring to market at lower lease rates that will be accepted. 16
REDEVELOPMENT ECONOMICS - MULTIFAMILY Multifamily development is often the primary driver for redevelopment given its strong market demand, and ability to pay higher land prices with increased density. While the current market will not support structured parking (unless subsidized), both Garden-Urban and 3-4 story garden (w/elev) product will justify redevelopment of the B and C grade centers in the corridor.
17
INFILL OPPORTUNITIES In addition to the full scale redevelopment opportunities examined, we believe there are also opportunities for infill along the corridor. The addition of multifamily on underutilized portions of existing centers, can help to enhance them
*Heat map of patron activity at Fayette Pavilion from cell phone use
18
ADAPTIVE REUSE OPPORTUNITIES The low values associated with the Grade B and C properties make them prime for adaptive reuse if their land area is too small for full redevelopment. Acquisition of these properties for $100/SF or less allows them to support adaptive reuse budgets of $175-200/SF, and still hit rent levels supported in the market of $20-25/SF.
19
DEVELOPMENT RECOMMENDATIONS 1. Promote full redevelopment of C grade shopping centers on large land parcels (5 acres+) close to Downtown; Fayette Place (Davis Development?), Fayetteville 85 Center/Fayetteville Center North. Leverage the in-place TAD to make more attractive to developers. 2. Aid adaptive reuse on C grade shopping centers on small land parcels (under 5 acres) close to Downtown; Glynn Hood Plaza. Leverage the in-place TAD to make more attractive to developers. 3. Facilitate select infill multifamily development opportunities where it will strengthen retail support; Fayette Pavilion, Banks Crossing (JC Penny) 4. Continue to allow development of retail outparcels and/or infill residential where feasible
3 4 2 1
20
2022 DOWNTOWN VISIONING STUDY
VISION OF FAYETTEVILLE REPORT
Prepared for Fayetteville, Georgia on-site April 28-30, 2022 INTENT Following up on the work of Moving Fayetteville Forward and the Livable Cities Initiative, a crossdisciplinary team conducted a design vision workshop with city officials. The goal was to create inspiring visions for key streets and critical city parcels of downtown Fayetteville and to outline a strategy for implementation.
SCHEDULE RECAP On the first day, the team created preliminary designs for improvements to the transportation network and concept plats for priority parcels. The second day was focused on detailed study of the critical parcels and creating an outline regulatory framework to review and permit infill projects within the study area. On the final day, the team refined concepts according to feedback and revised concepts for a final round of presentation and feedback.
Studio pinup. At the end of each day, the team hosted an open feedback session. Suggestions and critiques were immediately incorporated into the next day’s work.
PRINCIPAL FINDING In general, the team finds development prospects in the city are very strong based on the fundamentals. Residential demand is high as indicated in prior reports and reflected by active permits and inquiries. If the city can slow the traffic and codify a system supporting appropriate infill, the vibrant walkable vision for Downtown Fayetteville will become an inspiring reality.
NEXT STEPS
Short listing building types. At the feedback sessions, community members helped the team narrow down the list of candidate building types for a pre-approved building program.
1. Exploratory work plan re: GDOT conversation a. Overview call w/ referred traffic engineer b. Execute scope to make a schematic case to GDOT. c. Goal is to get GDOT to agree to receive an application. Then engage a detailed follow-on scope, including legal counsel. 2. Program outline for pattern zone a. Overview call: components, optional integrations, benchmark pricing b. Concept program proposal is focused on pocket neighborhoods and main street buildings. 3. Adopt the Unified Development Ordinance (UDO) and Downtown Mixed-Use zone (DMU). a. Set the expectation for regular amendment packages. Prepared for Fayetteville, Georgia
Charrette Report — Page 1 of 20
IMPLEMENTATION FRAMEWORK NEGOTIATED AGREEMENT WITH GDOT. Downtown Fayetteville is currently bisected in each cardinal direction by roadways under GDOT jurisdiction. These roads are designed to highway standards and prioritize traffic volume and traffic speed. In contrast, rights-of-way in active downtowns are designed to be streets that accommodate pedestrian movement at least as well as vehicular movement. Execution of a streetscape improvement plan will require a negotiated agreement–or even a transfer of jurisdiction–with GDOT. The team considers this recommendation mission critical to providing the type of living environment the citizens and city officials of Fayetteville want to enjoy and share with future generations. Without significant streetscape changes, Downtown Fayetteville’s full potential will remain suppressed.
PARKING The team recommends the city maximize the use of existing parking and postpone the construction of a parking deck; however the team also identified future sites for planning purposes. Sufficient downtown parking is available but underutilized due to a lack of connecting pedestrian infrastructure such as safe and comfortable sidewalks and adequate lighting. The entire downtown area, including city center and the square, is within a 3 minute walk of existing surface parking lots. The city can address present and future parking needs through shared use agreements with private parking lot owners and construction of parking on streets within existing right-of-way.
PRECISION CODE AMENDMENTS Certain sections of the new UDO and DMU still need to be amended. The team observed that the use unit tables and ADU and cottage court codes may be improved with downtown-focused revisions.
PATTERN ZONE / PRE-APPROVED BUILDING PROGRAM The proposed UDO and DMU is a substantial step forward and should be adopted as soon as possible. To maximize its impact, combining the DMU with a pre-approved building program would help guide the local market to build appropriate infill development in the right places.
PROACTIVE REPLATS In the case of large tracts, the team recommends the city replat these parcels for small-scale projects in a proactive manner. Replatting these parcels for traditional lot sizes and arrangements will open a large market of buyers and developers that is currently unaddressed.
Prepared for Fayetteville, Georgia
Charrette Report — Page 2 of 20
STREET IMPROVEMENTS CONVERSION TO 2-WAY TRAFFIC: LANIER AVE AND STONEWALL AVE Downtown Fayetteville is presently dominated by high-speed automobile traffic. Conversion of 1-way streets to 2-way traffic has been demonstrated to dramatically improve business revenues and desirability of residences by significantly reducing operating speeds (and therefore road noise) and increasing accessibility by allowing the site to be conveniently accessed from either direction.
LANE REDUCTION AKA ROAD DIET The team recommends reducing the number of lanes on Glynn St between Grady Ave and Lanier Ave from four travel lanes to two travel lanes with planted medians and left turn pockets or turn lanes. This creates more room for safe pedestrian and cycling facilities and for parking. This configuration can accommodate existing traffic counts if it includes network improvements. 1. Segment A: Between Grady and Stonewall, include a center turn lane. 2. Segment B: Between Stonewall and Lanier, remove the center turn lane in favor of angled parking on both sides of the street. 3. Segment C: North of Lanier, keep four travel lanes but install a tree-lined median in the center turn lane. 4. Major opportunity for network improvement: Roundabout at Grady Ave and Glynn St. a. Segment A starts at this roundabout. It’s a signal to drivers they are entering downtown. b. Lee Street links into the new roundabout. This will help with development on the east and southeast sides of the downtown and reduce pressure on Glynn. c. A vehicular connection on Williamsburg Way to Jeff Davis should be considered a high priority connection.
NEGOTIATING WITH GDOT 1. Engage a traffic engineer with experience in roundabout design, lane reductions, and 2-way conversions. 2. Prepare for a protracted negotiation as you would with any state agency. Persistence is key. 3. Broach conversations about transferring jurisdiction of the street or changing its designation from a principal highway to a business route. 4. Reference the ITE Context-sensitive Highway Design manual and the NACTO Street Design Guide.
GENERAL STREET IMPROVEMENTS The team recommends the city create an accelerated work plan for the repair and widening of existing sidewalks and installation of new sidewalks, on-street parking, lighting, and street trees, prioritizing and scheduling work on each street. Most downtown streets are of sufficient width to install parallel parking on the existing paved section without reductions in roadway capacity. 1. On some streets, a protected cycling facility may be more appropriate than parallel parking. The team observed the LCI trails map will be complemented by on-street linkages. 2. Returning Stonewall and Lanier to two way operation will require adjustments to traffic signals throughout the downtown network. 3. When feasible, construct raised intersections on Stonewall and Lanier at the square and in other appropriate locations.
Prepared for Fayetteville, Georgia
Charrette Report — Page 3 of 20
Raised Intersection Prepared for Fayetteville, Georgia
Charrette Report — Page 4 of 20
CONCEPT: ROUNDABOUT LOCATIONS
Blue outline represent 3 minute walking areas from existing surface parking lots.
Charrette Report — Page 5 of 20
CONCEPT PARKING PLAN
SUMMARY RECOMMENDATIONS 1. Postpone the construction of a parking deck indefinitely. The entire downtown has coverage via existing lots.
3. Negotiate shared use and management agreements with area churches who own large parking lots in downtown
2. Link walkability and lighting improvements with effective use of existing parking capacity.
4. Construct on-street parallel parking on most streets. (designated in pink)
Prepared for Fayetteville, Georgia
Existing street spaces New street spaces Existing parking lots
NOTES 1. Stonewall has one fewer lane than Lanier, but the principle is the same.
Charrette Report — Page 6 of 20 Prepared for Fayetteville, Georgia
CONCEPT STREET SECTIONS: LANIER AVENUE AND STONEWALL AVENUE
Prepared for Fayetteville, Georgia
Charrette Report — Page 7 of 20
CONCEPT STREET SECTIONS: GLYNN STREET
Prepared for Fayetteville, Georgia
Charrette Report — Page 8 of 20
CONCEPT STREET SECTIONS: GLYNN STREET
Prepared for Fayetteville, Georgia
Charrette Report — Page 9 of 20
CONCEPT STREET SECTIONS: GLYNN STREET
SUMMARY RECOMMENDATIONS 1. Prioritize adaptive reuse of the existing building. The second floor can undergo a residential conversion. Furthermore, the building’s location and depth allows for the interior to be divided into leasehold units and for the back of the building to become a second front. 2. Construct modest apartment buildings on the north side of the existing parking lot as liner buildings.
3. Replace the existing, underused parks with apartment and mixeduse buildings in a courtyard format. This maintains the open space concept while providing living space and the associated tax revenue. 4. This model maintains a substantial surface parking lot in the middle of the property. This parking lot could be the site of a parking structure in the future.
Charrette Report — Page 10 of 20
VIEW
Prepared for Fayetteville, Georgia
COUNTY ADMINISTRATION BUILDING AND LAND
Prepared for Fayetteville, Georgia
Charrette Report — Page 11 of 20
VIEW OF NEW CORNER NEXT TO SQUARE
SUMMARY RECOMMENDATIONS 1. Create a new pedestrian street on the parcel in front of city hall framed by substantial, 3-story mixed-use walkup buildings. 2. Retain existing historic houses fronting Stonewall east of city hall and when the timing is right for infill, companion walkup apartment buildings facing Lanier could be constructed.
3. Encourage the renovation of the Masonic Lodge and apartment buildings. Instead of demolishing these assets, pair complementary new construction with renovation and stormwater improvements. Note: The conversion to 2-way traffic on Stonewall and Lanier is critical to these recommendations.
Charrette Report — Page 12 of 20
VIEW
Prepared for Fayetteville, Georgia
PARCELS WITH DOUBLE FRONTAGE ON STONEWALL AND LANIER
Prepared for Fayetteville, Georgia
Charrette Report — Page 13 of 20
VIEW: NEW PEDESTRIAN STREET FRAMING VIEW OF CITY HALL
Charrette Report — Page 14 of 20
SITE ON GRADY AVE
Conservation plan. This uses the same techniques as the development plan but preserves 40% of the total space for conservation.
SUMMARY RECOMMENDATIONS 1. Pre-approve the plan sets with the best market fit: Detached and attached single-units, convertible garages and guest suites, 2- and 3- story townhouses, ADU’s with carriage variants, apartment houses.
2. Replat and prescribe courtyard and pocket neighborhood formats in critical locations. 3. Permit most building types by right, including walkup buildings Center connection.
Prepared for Fayetteville, Georgia
Development-oriented plan. Using pocket neighborhoods and a smart grid system of new streets and alleys, this plan maximizes the buildable area.
Prepared for Fayetteville, Georgia
Charrette Report — Page 15 of 20
PLAN: POCKET NEIGHBORHOOD
VIEW
Prepared for Fayetteville, Georgia
Charrette Report — Page 16 of 20
VIEW: POCKET NEIGHBORHOOD
Prepared for Fayetteville, Georgia
Charrette Report — Page 17 of 20
PLAN: ENTRY COURT TO GRADY AVE PARCEL
VIEW
Prepared for Fayetteville, Georgia
Charrette Report — Page 18 of 20
VIEW: ENTRY COURT TO GRADY AVE PARCEL
Charrette Report — Page 19 of 20
PARCELS NORTH OF LANIER
1. Pursue coordinated replats and likely street and alley utility layouts with the present property owners so that this land is infill-ready when the owners are ready to execute a new transaction. 2. Plat the project such at one parcel can be developed at a time with subsequent developers completing the frontages on new streets. 3. Focused commercial use and apartment houses may be appropriate adjacent to Lanier Ave, but a majority of the site should be developed with compact single-family building types.
4. Use the northwest corner as a district stormwater facility. 5. The use of pre-approved plans would work well for these parcels, simplifying the permitting process and encouraging the development of city approved plans to create the desired aesthetic for this new neighborhood. 6. Consider companion construction to the west on the Hampton Inn site and to the North on the corner of the school site.
Prepared for Fayetteville, Georgia
SUMMARY RECOMMENDATIONS
PATTERN ZONE / PRE-APPROVED BUILDING PROGRAM HOW IT WORKS A pattern zone is an overlay code that supplements the underlying code by pre-approving specific buildings for construction on specific parcel. The city licenses architectural assets for construction by applicants and associates them with an expedited review process and supplemental criteria for site design and development. Using the plans is voluntary; applicants can still propose custom architecture via conventional review procedures. The result is a program that dramatically reduces
www.fayettevillear-patternzone.com
Explore
Find a Contractor
Pattern Zone
Find a Lender
About
Contact
My Account
Pre-Approved Buildings for your Property
Pre-Approved for 404 S. College Ave.
404 S. College Ave.
Sears Bungalow Single Family 1800 Sq. Ft. 3 beds 2 Bath
Cab Forward Single Family 1800 Sq. Ft. 3 beds 2 Bath
Garage Cottage Accessory Dwelling Unit 1200 Sq. Ft. 2 beds 1 Bath
Flex House 1 Single or Two Family 1800 Sq. Ft. 3 beds 2 Bath
Flex House 2 Single or Two Family 1800 Sq. Ft. 3 beds 2 Bath
Apartment House Four Family 1200 Sq. Ft. 2 beds 1 Bath
Walkup Apartment
Garden Cottage 1
Garden Cottage 2
Zoning Details
Neighborhood Conservation Zoning (NC) Pre-Approved Building Types for this Property • Single Family (all types) • Accessory Dwelling Unit (all types) • Flex House • Live Work • Duplex (all types)
• Apartment House (all types) • Walkup Apartment (two story)
Pre-Approval Map
PATTERN ZONING | MBL PLANNING
IMPLEMENTATION PHASES Program and policy design. Short list building types, define applicable areas, outline review processes. Technical implementation. Short list and select specific buildings, site diagrams, supplemental development criteria, policy and process construction.
Pre-approved building program. Multiple buildings are pre-approved for most parcels to ensure variety.
www.fayettevillear-patternzone.com
Explore
Find a Contractor
Pattern Zone
Find a Lender
About
Contact
My Account
Pre-Approved Buildings for your Property
your project is here
Program launch. Data onboarding, software demonstrations, process testing, launch event, affirmative marketing workplan.
Enter an Address in Fayetteville AR
1 2 3 find your property
CANDIDATE BUILDING TYPES
Search a Map
pick a building
Search Buildings
get a permit
Contact a Planner
• Cottages w/ carriage variants. PATTERN ZONING | MBL PLANNING
• Guest suites / garage. • Detached fee simple, small and modest size.
Program platform. An online platform makes accessing and administering the program straightforward.
• Attached fee simple. • ADUs - attached and detached. • Duplexes. • Apartment houses (up to 4 units). • Residential and mixed-use walkups. • ACUs (Accessory Commercial Units). • Carriage buildings.
CANDIDATE SITE FORMATS • Fee-simple, primary dwelling (conventional). • Fee-simple courts, detached and attached. • Rear yard accessory structures. time-to-market in addition to direct savings.
It’s about the pattern. From a single building type four variations were ultimately pre-approved in Bryan, TX. These buildings are also pre-approved for construction in multiple site formats: as a primary dwelling, accessory unit, or pocket neighborhood. Images by MBL Planning, used with permission.
Prepared for Fayetteville, Georgia
Charrette Report — Page 20 of 20
CONTRIBUTORS R John Anderson, Anderson | Kim Architecture & Urban Design Hannah Carroll, Smith Planning Group Dennis Decker, b + c Studio Dan Osborne, MakeUP Design Operation Matthew Petty, The Infill Group Bob Smith, Smith Planning Group Randy Vinson, Live/Work Building Company
APPENDIX Credentials
2021 LCI STUDY
Livable Centers Initiative (LCI) Study for Downtown Fayetteville, Georgia September 2021
Downtown Fayetteville Livable Centers Initiative (LCI) Study
Client
Denise Brookins | Director, Planning and Zoning David Rast | Director, Community Development
Mollie Bogle | Atlanta Regional Commission
Core Team Ray Gibson | City Manager Brian Wismer | Director, Economic Development Carl Martin | Local Property Owner
Project Lead Sheba Ross | Project Director Shelby Morris | Project Manager Doug Childers | Urban Planning Leader Marwah Garib | Urban Designer
Rev. Thomas Martin | Fayetteville First United Methodist Walter Rodriguez | Town Square Jewelers Sam Burch | Historian/Local Resident/Lanier Rick Seaman | Twisted Taco/Business Owner Jim Thomas | Fayetteville First Baptist Church
Project Consultants Hayley Todd | Existing Conditions and Zoning Doug McClure | Landscape Architecture Russell Harrington | Landscape Architecture
Vickie Turner | Historian/Local Artist/Mainstreet
Livable Centers Initiative (LCI) Study for
David Burnett | Local Business Owner Matt Teague | Local Developer /Walton
Danny England | Existing Conditions and Character Analysis
Sarah Murphy | Local Resident/Planning Commission Chair
Downtown Fayetteville, Georgia September 2021
Bonita Askew Berry | Local Property/Sugar Hill Hazel Askew| Historian/Local Resident/Sugar Hill
Darrell Howard | Mobility Neil Desai | Zoning
Sonja Gibson | Local Resident/Villages/Business Owner Alfred Lee Dingler | Local Resident/Jeff Davis/ Business Owner
David Laube | Economic Development and Market Study Jordan Rowe | Economic Development and Market Study
Rev. Velma Grant | Pastor/Sugar Hill Rev. Allyson Lawrence | Fayetteville First United Methodist Katie Pace | Southern Conservation Trust
2
Caroline Evans | Community Engagement Amanda Hutton | Community Engagement
3
Downtown Fayetteville Livable Centers Initiative (LCI) Study
02 Analysis
01 Overview
4
12
6
HKS | PEC | Office of Design | NV5 | Noell Consulting Group | Blue Cypress
03 Engagement
06 Implementation
04 Vision
98
72
05 Recommendations
200
104
5
01
Overview
Downtown Fayetteville Livable Centers Initiative (LCI) Study
01.1
Overview | Analysis | Engagement | Vision | Recommendations | Implementation
Overview The LCI study is implementation-focused and hence features a multi-disciplinary team that will integrate urban planning & design, existing conditions, community engagement, market analysis, transportation, and zoning, in a collective vision for the Downtown Fayetteville study area. Key questions were asked from the perspective of these disciplines to kick-off the project and were accounted for in the final implementation matrix.
Project Profile
Process for the study: Investigate 01
Explore 2a
Existing Conditions Recommend 2b
housing variety
The Atlanta Regional Commission’s Livable Centers Initiative (LCI) is a grant program that incentivizes local jurisdictions to re-envision their communities as vibrant, walkable places that offer increased mobility options, encourage healthy lifestyles and provide improved access to jobs and services. The study area encompasses about 900 acres and addresses the Main Street area (sometimes referred to as the historic district) and includes downtown, and areas to Lafayette Avenue to the west, Gwinnett Street to the east, Georgia Avenue and North Jeff Davis Drive to the north and Grady Avenue and just north of Williamsburg Way to the south.
destination
A four-step process was established to acknowledge the work done through previous efforts and to ground the project by learning from precedents, prioritizing goals, developing actionable recommendations and documenting with clarity for an achievable outcome. The process hinged on community engagement with the goal to achieve sustainable outcomes using equitable decision-making methods, and deepen relationships and trust between government organizations, design teams and communities.
parks and recreation
Multi-use trails
placemaking parking
improved intersections
8
bike network
emphasize historic character
unified streetscape
How can we use current conditions to lead us to future possibilities?
VA L I D AT E
CONSTRAINTS
FRAMEWORK
CONNECTIVITY
PREVIOUS EFFORTS
ENVIRONMENTAL AND PHYSICAL
ZONING AND LAND USE
STREETS AND MOBILITY
MIX OF USES
C H A R ACT E R
O P E N S PAC E
SY N T H E S I S
MARKET STUDIES
ARCHITECTURAL VOCABULARY
PUBLIC PARKS AND ASSETS
INFERENCE
Community Engagement What involvement and engagement opportunities work well in Fayetteville?
offices
clear signage Prioritize walkability enhance pedestrian experience
Document 2c
GUIDE
I M AG I N E
ROA D M A P
ADVERTISE
PROJECT MANAGEMENT AND CORE TEAMS
COMMUNICATIONS PROGRAM
INPUT STRATEGY
INFORMATION EXCHANGE
LISTEN
I N T E R ACT
F E E D BAC K
COMMUNITY MEETINGS
CHARRETTE
SUMMARY AND RECOMMENDATIONS 9
Downtown Fayetteville Livable Centers Initiative (LCI) Study
Overview | Analysis | Engagement | Vision | Recommendations | Implementation
Market Analysis
Design Guidelines
How can we ensure that our plans are grounded in market and financial reality?
What are the components for a holistic solution that harmonizes the built environment and the public realm?
ASSESS
EXAMINE
FORECAST
DEMOGRAPHICS
LAND USE PERFORMANCE
SUPPLY AND DEMAND
I M PAC T
S T R AT E G Y
ZONING AND GUIDELINES
SUMMARY AND RECOMMENDATIONS
PRECEDENTS
NEIGHBORHOODS
IDENTITY
BENCHMARK ANALYSIS
CHARACTER
PLACEMAKING
G AT E WAY S
PEOPLE-FIRST
CLARITY
PORTALS
PUBLIC REALM
STREETSCAPE
E VA L U AT E
C O L L A B O R AT I O N
FRAMEWORK
MULTIPLE SCHEMES
PLAN DEVELOPMENT
STANDARDS AND GUIDELINES
Streets and Mobility
Zoning
How can we achieve balance between mobility and placemaking?
What method(s) will lead to the type of development and overall place envisioned for the Main Street District?
10
OPTIONS
M U LT I - M O D A L
E Q U I TA B L E
REFUGE
MOBILITY
CONNECTIVITY
ACCESSIBILITY
SAFETY
VEHICLES
IDENTITY
S T R AT E G Y
PARKING
PLACEMAKING
SUMMARY AND RECOMMENDATIONS
FRAMEWORK
FRAMEWORK
FRAMEWORK
USE BASED
CHARACTER BASED
TRANSECT BASED
FRAMEWORK
FRAMEWORK
FRAMEWORK
FORM BASED: TRANSECT
FORM BASED: FRONTAGE
FORM BASED: BUILDING TYPE
FRAMEWORK
AT T R I B U T E S
INFORM
OVERLAY
HISTORIC DESIGNATIONS AND DISTRICTS
DESIGN GUIDELINES
11
02
Analysis
Downtown Fayetteville Livable Centers Initiative (LCI) Study
Overview | Analysis | Engagement | Vision | Recommendations | Implementation
02.1 Existing Conditions
STUDY AREA OVERVIEW
Previous Plan Comparative Narrative
N JEFF DAVIS ST
A background analysis was conducted to review relevant background information from previous and on-going plans and studies, planned infrastructure improvements, relevant regulatory documents, and existing conditions documentation of land use, physical design characteristics, transportation systems, environmental features, parks and open space systems, city needs, and historic resources. GIS based data was gathered and evaluated to understand demographics and health information.
W LANIER AVE
Analyzed Plans
E LANIER AVE STONEWALL AVE
•
2002 LCI Downtown Planning Study
•
2010 LCI Supplemental Study
•
2016 Market Study
•
2019 Paths Master Plan
GLYNN ST S
Recurring themes and goals amongst previous plans:
0
HKS | PEC | Office of Design | NV5 | Noell Consulting Group | Blue Cypress
Use code to enhance pedestrian experience
»
Unified streetscaping (improving aesthetics)
»
Permit variety of housing types in proximity to downtown core
»
Codify historic inspiration as a guide for new buildings
•
Emphasis on placemaking/Downtown as a destination
•
Specific marketing campaign for Downtown
Improve Aesthetics •
Parks, landscaping, trees
•
Emphasis on historic character
•
Unified signage standards referencing historic character
Acquire / Identify Parcels for Redevelopment •
Identify ownership
•
Focus on those located in proximity of Downtown core to create unified streetscape
Prioritize Walkability •
Comprehensive sidewalk network
•
Multi-use trails -- for improved connectivity with Fayetteville and Fayette County
•
A seat at the table for the Fayette County Plan
•
Enhance safety
Revitalize Downtown
12
»
0.25
0.50 Miles
N
•
Emphasize walkability in street grid and pedestrian scale
•
Improve zoning ordinance to permit a mixture of uses
Continuing Needs and Opportunities Moving Forward: •
Identify infill parcels and ownership for redevelopment opportunities
•
Create distinct character areas
•
Emphasis on parks and recreation
•
Facilitate better communication between public and city officials
Existing Conditions | Market Study | Lessons from Phase 1
13
Downtown Fayetteville Livable Centers Initiative (LCI) Study
Overview | Analysis | Engagement | Vision | Recommendations | Implementation
Context
Landmarks
Parks
Water Body
Schools
TRILITH STUDIOS
LAKE VICTOR
PIEDMONT FAYETTE HOSPITAL
WALKER LAKE FUN SPOT AMERICA THEME PARKS ATLANTA CITY OF LAFAYETTE LAKE
LAKE EDITH Y W H
92
S ILE 4M
W
LA NI ER
S MILE 3.75
ST S GLYNN
AV E
LAKE BENNETT FOWLER LAKE
E LA NIE R AV E
S ST NN GLY
+ D LV DB IEL F AY EM MI M JI
OLD FAYETTE COUNTY COURTHOUSE
R SD AVI FF D S JE
CITY OF FAYETTEVILLE BOUNDARY
ATLANTA
HARTSFIELD JACKSON ATLANTA INTERNATIONAL AIRPORT
+
FAYETTEVILLE
N
14
HKS | PEC | Office of Design | NV5 | Noell Consulting Group | Blue Cypress
Existing Conditions | Market Study | Lessons from Phase 1
15
Downtown Fayetteville Livable Centers Initiative (LCI) Study
Overview | Analysis | Engagement | Vision | Recommendations | Implementation
Community Assets
Landmarks
Parks
Water Body
Schools
PYE LAKE SOUTHERN CRESCENT TECHNICAL COLLEGE
FAYETTEVILLE ELEMENTARY SCHOOL
FAYETTE COUNTY HIGH SCHOOL
FAYETTE COUNTY ALTERNATIVE SCHOOL
SOUTHERN GROUND AMPHITHEATRE
LAFAYETTE ECENTER
FAYETTEVILLE FIRST BAPTIST CHURCH
HOLLIDAY-DORSEY FIFE MUSEUM
FAYETTEVILLE FIRST UNITED METHODIST
WL AN IER
FAYETTEVILLE CITY CEMETERY
OLD TRAIN DEPOT
AV E
NEW FAYETTEVILLE CITY HALL AND PARK
G RA DY
AV E
EL AN IER
FAYETTE COUNTY PUBLIC LIBRARY SOUTHERN CONSERVATION TRUST
N YN GL
N
CHURCH STREET PARK
T SS VI A D FF JE
EDGEFIELD BAPTIST CHURCH
AV E
S ST
ISLAMIC COMMUNITY CENTER OF ATLANTA
STONEWALL AV E
FAYETTE COUNTY OFFICE BUILDING EXISTING FAYETTEVILLE CITY HALL
+
HERITAGE PARK
FAYETTE COUNTY PROBATE COURT
OLD FAYETTE COUNTY COURTHOUSE
KOREAN FAYETTEVILLE FIRST BAPTIST
WATER TOWER
FLIPPER CHAPEL AME
ATLANTA
HARTSFIELD JACKSON ATLANTA INTERNATIONAL AIRPORT
MAY HARP PARK
+
FAYETTEVILLE
N
16
HKS | PEC | Office of Design | NV5 | Noell Consulting Group | Blue Cypress
Existing Conditions | Market Study | Lessons from Phase 1
17
Downtown Fayetteville Livable Centers Initiative (LCI) Study
Overview | Analysis | Engagement | Vision | Recommendations | Implementation
Parks and Open Space Analysis
FO RR ES TA VE
ST
HILLSDALE DR NG LY NN
Parks and open spaces serve all residents of the community, and provide opportunities for community members of various backgrounds to come together for a variety of purposes
JEFFERSON AVE
Introduction AVE HOOD
15 E UT IN M K AL W 5
The City of Fayetteville, GA has made many efforts over the previous years to improve their parks and open spaces, and intentionally plan how these parks and open spaces can compliment the surrounding built environment. This section will address the efforts that have been made in the past to improve parks and open spaces in the city, and what issues and opportunities still exist today.
E UT IN M
LAFAYETTE AVE
1 2
N JEFF DAVIS DR
E UT IN M
5
CHURCH ST
10
Parks and open spaces have been a critical aspect of successful community planning since the beginning of the 20th Century. Ever since the birth of community planning and city design, parks and open space have served as the “glue” that holds the city together by providing pedestrian and vehicle friendly linkages between important nodes in the city, promoting physical health and mental well being for the residents of the community, and providing space for public community events to take place which improves the quality of life for the community residents. Parks and open spaces serve all residents of the community, and provide opportunities for community members of various backgrounds to come together for a variety of purposes.
GA 54
R AV NIE E LA W LANIER AV W STONEWALL AVE
GA 54
2 1 | Church Street Park
2 | May Harp Park
FAYETTEVILLE CITY CEMETERY Y AD GR
4
E AV
6
S
JE FF
DA VI S
DR
5 Minute Walk 10 Minute Walk
CONSERVATION TRUST
15 Minute Walk Existing Street
3 | Courthouse Square
4 | Heritage Park
S GL YNN ST
LVD IELD B MAYF JIMMIE
6 | New City Center Park
R YD DLE BRA
5 | Southern Ground Amphitheater
BEA UR EGA RD BLV D
Development Opportunity Existing Open Space
Proposed Park
Open Space
Water
N
18
HKS | PEC | Office of Design | NV5 | Noell Consulting Group | Blue Cypress
Existing Conditions | Market Study | Lessons from Phase 1
19
Downtown Fayetteville Livable Centers Initiative (LCI) Study
The 2002 LCI study identified opportunities for public space, new development, and traffic calming mobility interventions that would be conducive to pedestrian connectivity, community events, and preservation of green space. 2002 LCI Study In 2002, the City of Fayetteville conducted an LCI Study, and as part of this study the community was engaged as to what issues and opportunities they saw the city facing. During this engagement, the community identified certain issues such as a need for a useful open space in Downtown Fayetteville, and the desire to provide a more pedestrian friendly environment downtown. Some of the opportunities the community identified include reduced traffic congestion, and increased facilities for pedestrians and bicyclists, as well as added public open spaces and green spaces able to host cultural events. At the time of this study, only 3% of the total city acreage was dedicated to parks and open spaces. Some of these areas include a park downtown, a pocket park north of Lanier Avenue on Church St., a cemetery, and an amphitheater constructed in conjunction with The Villages development. This discussion led to the identification of certain future projects that could help add more park space and open space to Downtown Fayetteville including a new Fayetteville Village Green to be surrounded by mixed use development and pedestrian amenities which can be used to host community events, the development of a central open space on Church St. as part of a green way in the Main Street Residential District, preservation of existing green space along Beauregard Blvd., redevelopment of the city park by the county office building, develop a greenway system connecting major city landmarks and residential clusters, and construct landscaped entry gateways at major intersections and nodes into the downtown area.
2010 LCI Study In 2010, an LCI supplemental study was conducted that identified three different development areas within the city. One of these developments, called Market Place at Lafayette, proposed the development of an attractive storm water management area which separates it from the accessing road that also provides a usable green space for the users of the development. In 2016, a Downtown Market Study was conducted to identify the issues and opportunities for downtown development. As part of this study, it was identified there is a need for a downtown square to serve as a starting point for development. This square was proposed to be located by the existing green space surrounding the Old Fayetteville County Courthouse. This study also identified a need for greenway that links the downtown area to the surrounding residential areas of the city. In 2017 the City of Fayetteville conducted a downtown re-development plan identifying three separate parcels for redevelopment potential near Lanier Avenue and Stonewall Avenue. This study included a network of proposed streets to lay the foundation for the future development parcels improving efficiency of pedestrian transportation throughout the area. The proposed layout and design 2 added 6.56 acres of green space to the downtown area connected with pedestrian friendly amenities including street and parking lot trees, rooftop gardens, a village green, a storm water park, a pedestrian tree ally with string lights, open art plazas, bioswales, amphitheater lawn with fountains, tree bosques,rain gardens, and playgrounds.
Overview | Analysis | Engagement | Vision | Recommendations | Implementation
2017 LCI Study A comprehensive plan for the City of Fayetteville was also produced in 2017, which identified a total of 279.42 acres of land (3.71%) dedicated to parks and open space. Although there have been many planning and design efforts since the 2002 LCI Study, the amount of land still dedicated to parks and open space in 2017 had not increased much since 2002. The Comprehensive Plan identified issues related to parks and open space including the need for more sidewalks and multi-use paths to improve connectivity for improved walk-ability, the need for pedestrian oriented development that creates a safe distinction between the pedestrian and vehicular environments, the need to improve aesthetics around the gateways leading into the downtown area, and the need to increase the amount of parks and green space in the downtown area. It also identified that as an opportunity the city had SPLOST funding available for land acquisition of park space, and expressed the community’s desire to improve parks and green space within the city in the community driven goals and objectives. The Comprehensive Plan also identified several projects that would increase the amount of parks and open space in the city including the construction of a new downtown park, a feasibility study for park water features, park improvements at the existing gazebo, park improvements at The Ridge, development of a city trails plan for connectivity, and the continued installation of street trees and landscaped medians. Some of the record of accomplishments identified in the Comprehensive Plan related to parks and open space include the implementation of the Open Space Plan for the development and preservation of parks and green spaces throughout the city, the identification of opportunities to provide green space connectivity, and the development of local and regional partnerships to preserve existing green spaces and develop a regional multi-use trail system.
2002 LCI Study Area
The 2017 LCI study produced a comprehensive plan for the city of Fayetteville and identified issues related to walkability and pedestrian access.
Within the same year, Fayette County voted to approve Special Local Option Sales Tax (SPLOST) which was meant to fund a variety of improvement projects throughout the city. Some of the projects related to parks and open spaces include the construction of a bridge crossing to connect the Fayette Piedmont Hospital to the existing path system, a master plan design for the expansion of the multi-use path systems, and landscaping medians on Hwy 85. 2010 LCI Area Potential Development Opportunities Map
20
HKS | PEC | Office of Design | NV5 | Noell Consulting Group | Blue Cypress
Existing Conditions | Market Study | Lessons from Phase 1
21
Downtown Fayetteville Livable Centers Initiative (LCI) Study
Overview | Analysis | Engagement | Vision | Recommendations | Implementation
Lunch on the Lawn | Source: City of Fayetteville
2018 Capital Improvement The 2018 Capital Improvements Element further expands on how the city intends to provide future land for parks and open spaces with the use of impact fees for future development. It identifies the current parks located within the city as Jack Day Park, Burch Park, Jeff Davis Park, Patriot Park, and Church Street Park. It also identifies The Ridge as a large 308 acre conservation area. The trails located within the city include the Redwine Multiuse Path, the Patriot Park walking trail, and the Lester Road Multi-use Path. This study also identifies future growth projections for parks and open space to increase by approximately 22 acres by 2040 and conservation acres to increase by 234 acres, and identifies the funding methodology to accomplish this goal. One of the projects that this study identifies that will increase park space within the city is the addition of an 8 acre city park to be included within the design of a new City Hall building. The City of Fayetteville 2019 State of the City Address reinforced this desire by announcing the project for a new city center complex that includes amenities for the community to the public. The City of Fayetteville has completed many studies identifying the community’s desire for an increase in parks and open space, and these desires are now starting to be developed as the city plans to continue to grow and prosper. City of Fayetteville 2017 Comprehensive Plan Tax Allocation Districts
The 2018 Capital Improvement Study builds off of previous LCI studies through thoughtful research while also asking new, relevant questions to provoke innovative solutions for public park space.
The City of Fayetteville has completed many studies identifying the community’s desire for an increase in parks and open space, and these desires are now starting to be developed as the city plans to continue to grow and prosper.
City of Fayetteville 2017 Comprehensive Plan Future Land Use Map
22
HKS | PEC | Office of Design | NV5 | Noell Consulting Group | Blue Cypress
Existing Conditions | Market Study | Lessons from Phase 1
23
Downtown Fayetteville Livable Centers Initiative (LCI) Study
Overview | Analysis | Engagement | Vision | Recommendations | Implementation
2018 Master Path Plan Analysis In March of 2018, a community stakeholder meeting was conducted that focused on the Master Path Plan and the development of a county-wide network of sidewalks, side paths (bi-directionally multi-use path along side of roadways), greenway trails, and bicycle routes. This meeting brought a variety of community members from various backgrounds together in an effort to identify common community interests. Community desires for various locations for bicycle routes, pedestrian walkways, and golf cart facilities including sidepaths, greenway trails, shoulder bikeways, signed shared roadway, and sidewalks were discussed and cataloged. The meeting generated a significant amount of feedback for desired pathway connections. Common desired connection locations included a sidepath connections between Peachtree City and Fayetteville along Redwine Road, a sidepath on SR 54, and bicycle facilities on Bernhard Road and Brooks Woolsey Road. Common desired connection destinations include a regional trail connection in southern Peachtree City as well as connections to the Starr’s Mill school cluster as a starting point for the development of the Master Path Plan. The Master Path Plan includes design guidelines that cover the specifics of the path designs and how they should be constructed in relation to the existing environment. The Master Path Plan discusses a City Hall project that will update land-use, pedestrian transportation networks and traffic patterns within the downtown area, while at the same time being integrated with expansion efforts of paths and sidewalks throughout the city, including enhancing the network of streets connecting SR 54, SR 85, Beauregard Blvd, and Grady Avenue. The City of Fayetteville used SPLOST funding in 2018 to purchase approximately eight acres of land from the Fayette County Board of Education for the development of a city park adjacent to the Fayette County Public Library and new City Hall building providing many opportunities for pedestrian and bicycle connectivity.
RECOMMENDATIONS
Project Type Greenway Sidewalk Sidepath Signed Share the Road Existing Paths
“The MPP will connect population centers, schools, parks, commercial land use, and other recreational opportunities. The MPP will accommodate pedestrians, bicyclists, and golf cart users.”
Major Roads
Woolsey
Streets
Tyrone
Railroads
Peachtree City
Lakes
Fayetteville
Greenspace
Brooks
Recommendations Report November 2019
2019 Fayette Transportation Plan and Master Path Plan
24
HKS | PEC | Office of Design | NV5 | Noell Consulting Group | Blue Cypress
Existing Conditions | Market Study | Lessons from Phase 1
25
Downtown Fayetteville Livable Centers Initiative (LCI) Study
Overview | Analysis | Engagement | Vision | Recommendations | Implementation
Path Connectivity Needs Population Centers •
Peachtree City/Tyrone
•
Fayetteville
•
Woolsey
•
NE Fayette County
Activity Centers •
Town Centers
•
Commercial Centers
RECOMMENDATIONS
Project Type Major Activity Centers Population Centers Path Connection Needs
26
Major Roads
Woolsey
Streets
Tyrone
Railroads
Peachtree City
Lakes
Fayetteville
Greenspace
Brooks
HKS | PEC | Office of Design | NV5 | Noell Consulting Group | Blue Cypress
Slope Analysis Map Slope analysis illustrates feasibility of future building sites.
0
0.25
0.5
1 Miles
Existing Conditions | Market Study | Lessons from Phase 1
N
27
Downtown Fayetteville Livable Centers Initiative (LCI) Study
Overview | Analysis | Engagement | Vision | Recommendations | Implementation
Mobility Mobility System Analysis
Purpose
Questions to Consider
•
To better understand the mobility systems of the LCI study area and the places that they serve within Downtown.
•
What gaps exist within the transportation system?
•
•
To understand the operational characteristics of the mobility network.
What information is missing from the existing conditions analysis?
•
Where can traveler safety be improved?
•
To serve as a basis for a discussion about changes and improvements to the mobility network.
•
Where are the opportunities to improve bicycle and pedestrian mobility?
•
Where are the opportunities to improve access and connections?
Roadway Facilities Map •
Depicts roadway functional classification within the study area
•
Illustrates signalized intersections within the study area
Traffic Volumes and Level of Service Map •
Illustrates roadway traffic volumes as identified by GDOT count stations.
•
Illustrates roadway level of service based on traffic volumes and roadway characteristics
Active Transportation Facilities Map
NORTH JEFF DAVIS DRIVE
28
HKS | PEC | Office of Design | NV5 | Noell Consulting Group | Blue Cypress
•
Illustrates bike lanes, multi-use paths, and sidewalks
Existing Conditions | Market Study | Lessons from Phase 1
29
Downtown Fayetteville Livable Centers Initiative (LCI) Study
Overview | Analysis | Engagement | Vision | Recommendations | Implementation
Summary of Previous Studies
Previous Plans Comparative Analysis
Recurring Themes And Goals 1.
2.
Aesthetics »
Improve downtown street-scape
»
Unify street-scape along travel corridors into Downtown
Prioritize connectivity and walk-ability »
Use redevelopment to create smaller blocks
»
Use redevelopment to develop downtown street grid
»
3.
30
Between SR 54/Stonewall Avenue and Grady Avenue
»
Develop comprehensive sidewalk network
»
Connect with Fayette County multi-use trail system
»
Inter-parcel connectivity
Parking
2002 LCI Study
2019 Fayette Transportation Plan
»
Increased need/demand for parking downtown
»
Explore the potential for shared-use parking
»
Parking placement for new development
The City of Fayetteville undertook an LCI Study in 2002. The study identified a series of transportation improvements intended to improve connectivity and circulation within Fayetteville’s downtown area. The LCI recommendations mainly focused on congestion relief strategies, safety improvements, and non-motorized travel alternatives. Specifically, the study recommended implementing intersection and traffic signal improvements along SR 85/Glynn Street between LaFayette Avenue and SR 54/Stonewall Avenue. The study also recommended safety improvements for SR 85/Glynn Street, namely the installation of medians.
The Fayette Transportation Plan is Fayette County’s Comprehensive Transportation Plan (CTP) and identifies a set of short-term, intermediate, and long-range transportation system development opportunities. As it relates to the City of Fayetteville, specifically the LCI study area, the Fayette Transportation Plan primarily identifies opportunities to develop the County’s Master Path Plan. It envisions a network of multi-use side paths and trails that run through the Downtown, connecting to provide cross-county and regional movement. Additionally, the Fayette Transportation Plan lends support for the City of Fayetteville’s use of Special Purpose Local Option Sales Tax (SPLOST) program funding, and the development of the Fayetteville City Center.
Continuing Needs and Opportunities •
Continue operational improvements
•
Continue to enhance traveler safety
•
Develop a connected street network
•
Support redevelopment and place-making activities
•
Develop local bicycle network and infrastructure
•
Enhance pedestrian mobility
2010 LCI Supplemental Study The 2010 LCI Supplemental Study is an update to the 2002 LCI Study. Like the 2002 study, the 2010 LCI Supplemental addressed connectivity and circulation within Downtown Fayetteville. The LCI Supplemental placed an increased focused on walk-ability and access management. It also presented concept plans for:
Incorporate bicycle infrastructure
•
Extending Hillsdale Drive to SR 85/Glynn Street
»
Widen existing bike lanes from 4 to 6 feet
•
Extending Church Street to Kathi Avenue
»
Extend existing Class II bike facility to Jeff Davis
•
»
Connect existing bike facilities with the larger mobility network
Intersection improvements at SR 92/Forrest Avenue at SR 85/Glynn Street
•
Church Street at Kathi Avenue
•
Hood Avenue at SR 92/Forrest Avenue Roundabout
»
4.
5.
Identify additional bicycle infrastructure opportunities
2019 Traffic Engineering Study The 2019 Traffic Engineering Study is an operational analysis of several roadway intersections within the Fayetteville LCI area, focusing on the major roadways entering and exiting Downtown Fayetteville from the north. The Traffic Engineering Study is periodically updated and has been used to identify, prioritize, and program low-cost, easy to implement intersection and signal modifications. Referenced in the 2010 LCI Supplemental Study, the Traffic Engineering Study has been credited with improving vehicular flow through Downtown Fayetteville, reducing delay-based congestion, and improving roadway safety.
Operational and Safety Improvements »
Continue intersection improvements
»
Address access management along SR 54 and SR 85
»
Extend landscaped median on SR 85/Glynn Street South
»
Improve Beauregard Boulevard and SR 85/Glynn Street South intersection
HKS | PEC | Office of Design | NV5 | Noell Consulting Group | Blue Cypress
Existing Conditions | Market Study | Lessons from Phase 1
31
Downtown Fayetteville Livable Centers Initiative (LCI) Study
Overview | Analysis | Engagement | Vision | Recommendations | Implementation
Grady Avenue
Roadway Network Inventory
Downtown Fayetteville’s roadway network is not comprised of the traditional grid pattern of streets. Instead, the LCI study area’s roadways are organized in loose hierarchical street classification system. These classifications - principal arterials, minor arterials, collectors, and local streets - define a roadway’s desired functional and operational characteristics. The Fayetteville LCI study area contains approximately 22 miles of total roadway. Principal and minor arterials, 4.1 miles and 2.5 miles respectively, serve as the primary access routes to Fayetteville’s downtown area, and are the principal vehicular travel routes into, out of, and through the LCI study area. Approximately 6.2 miles of collector roads and 9.2 miles of local streets provide for the study area’s internal circulation. Functionally classified roadways include:
Beauregard Boulevard Beauregard Boulevard is a two-lane minor arterial roadway with nodes within the LCI study area at SR 85/Glynn Street and Grady Avenue. Beauregard Boulevard is characterized by large lot residential development and undeveloped land parcels within the study area.
State Route 54/Lanier Avenue
LaFayette Avenue
State Route (SR) 54/Lanier Avenue is functionally classified as a principal arterial. For the entirety of its length across the middle of the LCI study area, SR 54 is a median divided facility. For approximately 1.15 miles through Downtown Fayetteville, SR 54 is split into a one-way pair of eastwest streets identified as Lanier Avenue (westbound) and Stonewall Avenue (eastbound). In addition to providing access and thru travel to Downtown, SR 54 connects to residential neighborhoods and commercial development at either end of the study area. West of SR 85/Glynn Road, SR 54/Lanier Avenue hosts a Class II bikeway.
LaFayette Avenue is an east-west roadway that connects SR 85/Glynn Street and SR 54/Lanier Avenue. Although classified as a local roadway by GDOT, the City of Fayetteville has identified LaFayette Avenue as a collector roadway. The facility is the primary access to the Villages at LaFayette, a planned community. Between SR 85/Glynn Street and Tiger Trail, LaFayette Avenue is a three-lane (two lanes westbound, one lane eastbound) roadway. It serves traffic related to the Fayette County Public Schools as both administrative functions, and the Fayette County High School are located along the street. West of Tiger Trail, LaFayette Avenue becomes a two-lane median divided roadway that primarily serves residential land uses within the Villages at LaFayette planned community. At Campaign Trail, LaFayette Avenue becomes a one-way roadway going westbound toward SR 54/Lanier Avenue. Eastbound oneway traffic travels along Campaign Trail through the Villages at LaFayette. On-street bike lanes are present on both LaFayette Avenue and Campaign Trail.
State Route 85/Glynn Street SR 85/Glynn Avenue traverses Fayetteville from north to south and is a five-lane (four-travel lanes and a two-way left-turn lane) roadway. It is functionally classified by the Georgia Department of Transportation (GDOT) as a principal arterial north of SR 54/Lanier Avenue. South of SR 54/Lanier Avenue, SR 85/Glynn Road is functionally classified as a minor arterial. Along the entirety of its length through the City of Fayetteville, SR 85 primarily serves various commercial land uses.
Jeff Davis Drive Jeff Davis Drive is a four-lane roadway facility that is functionally classified as a minor arterial roadway. Traversing the city from north to south, Jeff Davis Drive changes design cross-sections and development character several times within the LCI study area.
Through rethinking the role of existing roads, solutions are proposed that provide pedestrian connectivity, traffic-calming, and vehicle access where it is most necessary.
32
Grady Avenue is a two-lane major collector roadway that connects SR 54/Lanier Avenue with Beauregard Boulevard and SR 85/Glynn Street. Grady Avenue’s development character is variable over its length, with commercial and office developments located at its nodes with SR 54/ Lanier Avenue and SR 85/Glynn Street. Grady Avenue is characterized by residential development and large undeveloped parcels between its two major intersections.
HKS | PEC | Office of Design | NV5 | Noell Consulting Group | Blue Cypress
The LCI study area’s roadways are controlled by a variety of traffic control devices. Most intersections internal to residential neighborhoods within the study area are stop controlled by all-way signs. This is consistent with the low-speed and walkable nature of the study area’s neighborhoods. The LCI study area, however, does not have a consistent street grid, and the street network is reflective a suburban community whose development follows a linear path along major travel corridors. Traffic signals are present along arterial roadway that traverse the study area and bisect the downtown area. These signals help to facilitate higher volumes of traffic flow at major intersections.
Grady Ave.
Existing Conditions | Market Study | Lessons from Phase 1
33
Downtown Fayetteville Livable Centers Initiative (LCI) Study
Overview | Analysis | Engagement | Vision | Recommendations | Implementation
Roadway Operations
Since the early 2000s, traffic volumes on SR 54/Lanier Avenue and SR 85/Glynn Street have declined, and appear to have plateaued. 2019 Average Annual Daily Traffic (AADT) taken from GDOT’s Traffic Analysis and Data Application (TADA) system shows that AADT along SR 54/Lanier Avenue west of Downtown was 26,700 vehicles per day. West of SR 85/Glynn Street, the SR 54 one-way pair comprised of W. Lanier Avenue (eastbound) and Stonewall Avenue (westbound) has an AADT of 11,500 vehicles per day and 13,100 vehicles per day, respectively. East of SR 85/Glynn Street, Lanier Avenue has an AADT of 11,500 vehicles per day; Stonewall Avenue has an AADT of 10,300 vehicles per day. East of Downtown, SR 54/Lanier Avenue has an AADT of 24,000. SR 85/Glynn Street, between LaFayette Avenue and SR 54/ Lanier Avenue, has an AADT of 32,200 vehicles per day. SR 85, between Stonewall Avenue and Beauregard Boulevard, has an AADT of 25,200 vehicles per day. Between Beauregard Boulevard and Grady Avenue, SR 85 has an AADT of 22,200 vehicles per day. Jeff Davis Drive near Rabbit Run has an AADT of 17,700 vehicles per day. Grady Avenue near Bradford Square has an AADT of 13,000 vehicles per day. Grady Avenue near Beauregard Boulevard has an AADT of 10,900 vehicles per day. AADT data were evaluated using the Florida Department
Roadway Facilities in the Study Area
of Transportation’s General Annual Average Daily Volumes table. This tool is specific to signalized arterials in urbanized areas and considers roadway design characteristics such as thru travel lanes, medians, and exclusive turn lanes. It also considers speed characteristics, directionality, and roadway ownership. The table below illustrates the AADT versus the available capacity per the volume General Annual Average Daily Volumes.
Data shows that traffic volume has plateaued on major streets. Fayetteville moves forward by considering how streets are not only efficient, but also safe.
Route
Count Location
Capacity
AADT
LOS
SR 54/E. Lanier Ave
E. of Booker Ave
33,800
24,000
C
SR 54/E. Lanier Ave
E. of Jeff Davis Dr
12,480
11,800
C
SR 54/E. Lanier Ave
W. of Jeff Davis Dr
12,480
11,500
C
SR 54/W. Lanier Ave
W. of SR 85/Glynn St.
12,480
11,500
C
SR 54/W. Lanier Ave
W of Grady Ave
33,800
26,700
C
SR 54/Stonewall Ave W
W. of SR 85/Glynn St.
12,480
13,100
E
SR 54/Stonewall Ave E
E. of Jeff Davis Dr
12,480
12,300
D
SR 54/Stonewall Ave E
W. of Jeff Davis Dr
12,480
10,300
C
SR 85/Glynn St. N
N. of SR 54/Lanier Ave
33,800
32,200
C
SR 85/Glynn St. S
S. of SR 54/Stonewall Ave
33,800
25,200
C
SR 85/Glynn St. S
N of Beauregard Blvd
33,800
22,200
C
Jeff Davis Drive
Near Rabbit Run
30,420
17,700
C
Grady Ave
Near Bradford Square
10,920
13,000
E
Grady Ave
W. of Beauregard Blvd
10,920
10,900
E
Table 1. Roadway Volume vs. Capacity
34
HKS | PEC | Office of Design | NV5 | Noell Consulting Group | Blue Cypress
Existing Conditions | Market Study | Lessons from Phase 1
35
Downtown Fayetteville Livable Centers Initiative (LCI) Study
ST AT ER OU TE 85 ,9 2
Overview | Analysis | Engagement | Vision | Recommendations | Implementation
32,300 AADT
STATE ROUT E 54
24,000 AADT
26,700 ADT
25,200 AADT
Local Traffic Counts
Traffic Volume and Level of Service in the Study Area The 2019 Traffic Engineering Study went further to analyze roadway operations and evaluated several intersections within the LCI area. Because this evaluation process is ongoing and past improvements recommendations have been implemented, most of the intersections analyzed operate sufficiently under existing conditions. The SR 54/Lanier Avenue at Grady Avenue intersection and the SR 85/Glynn Street South at Beauregard Boulevard intersections were the two exceptions. Both intersections operate at a level of Service D, which is not bad but also not good. They are expected to experience significant delays under future conditions without any new development being added to them. The 2019 Traffic Engineering Study is included in the Appendix.
Traffic Volume and Level of Service in the Study Area
36
HKS | PEC | Office of Design | NV5 | Noell Consulting Group | Blue Cypress
Existing Conditions | Market Study | Lessons from Phase 1
37
Downtown Fayetteville Livable Centers Initiative (LCI) Study
Overview | Analysis | Engagement | Vision | Recommendations | Implementation
Active Transportation Facilities
Pedestrian Accommodations Sidewalks or shared-use paths are generally present along all streets within the LCI study area, with a few exceptions. The pedestrian experience when traveling on these facilities varies greatly and is dependent on factors such as: •
Traffic volume
•
Sidewalk width and physical condition
•
Quality of the sidewalk surface
•
Obstructions
•
The presence of landscaping and street furniture
•
Public art (g) building frontages, and
•
Neighboring use
W. Lanier Avenue and Stonewall Avenue, between SR 85/ Glynn Avenue N. and Tiger Trail, features a pedestrian realm that accommodates employees and visitors to the area. Street furniture, e.g., sitting benches and landscaping, provide a comfortable pedestrian environment where people are encouraged to stroll, linger, and sit along W. Lanier Avenue and Stonewall Avenue. Sidewalks along the LCI area's other arterial and collector roadways and local streets also facilitate pedestrian travel. Marked crosswalks facilitate pedestrian crossings at intersections through downtown Fayetteville along the primary travel corridors. Generally, marked crosswalks are present on all legs of signalized or all-way stopcontrolled intersections. Some side-street stop-controlled intersections – LaFayette Avenue at SR 85/Glynn Street N. and Beauregard Boulevard/Redwine Road – are missing crosswalks to facilitate movements between sidewalk endings/beginnings.
Some of the pedestrian network challenges include gaps in the network, especially between facilities located on functionally classified roadways and local streets, and between regional facilities entering the study area from different directions. Identified challenges include the brick sidewalk pavers along both Lanier Avenue and Stonewall Avenue. While attractive and adding to the downtown area's historic charm, this decorative surface material could potentially pose risks to mobility challenged individuals, particularly to those who are unsteady on their feet or use mobility assistance devices such as walkers, canes, or wheelchairs. This is especially true if the pavers are not well maintained. Risks to travelers come from loose, tilted, or cracked pavers or large gaps between them. Another identified challenges to travelers using sidewalks and side paths, especially on local streets, is adequate maintenance (or lack thereof) of vegetation adjacent to the facilities. Overgrown bushes, low hanging tree branches, and grass growing onto the path can push travelers off the sidewalk/ sidepath and street.
Bicycle Facilities There are two Class II bicycle facilities within the LCI study area. Class II facilities, commonly referred to as bike lanes, are dedicated facilities for bicyclists immediately adjacent to automobile traffic. Class II facilities are identified with striping, pavement markings, and signage. The West Lanier Avenue bike lane extends approximately 1,500 feet from SR 85/Glynn Street North to Tiger Trail. The LaFayette Avenue bike lane extends from Tiger Trail to SR 54/W. Lanier Avenue, through the Villages at LaFayette community. Pedestrian and Bike Network in the LCI Study Area
The LCI study area ensures that the pedestrian experience is safe, comfortable, and continuous. Giving people the ability to walk or bike lowers traffic volume and enables them to be healthier through physical activity. LaFayette Ave. Bike Lane Photo Credit: Google Streetview
38
HKS | PEC | Office of Design | NV5 | Noell Consulting Group | Blue Cypress
W. Lanier Ave. Bike Lane & Side Path Photo Credit: Google Streetview
Existing Conditions | Market Study | Lessons from Phase 1
39
Downtown Fayetteville Livable Centers Initiative (LCI) Study
Bicyclists traveling within the LCI area can utilize the onstreet bicycle infrastructure, off-street infrastructure such as shared-use trail facilities, and bicycle-friendly street, i.e., roads that are low-volume and low-speed, to access and move around the study area. At present, there are no public bicycle parking or storage facilities, especially within the downtown area.
Parking
Overview | Analysis | Engagement | Vision | Recommendations | Implementation
85/Glynn Street and Less Street, a total of twenty (20) onstreet parking spaces are available to the store front shops. Forty-eight (48) on-street parking spaces also are available around the Historic Courthouse. An estimated 340 parking spaces are available in public surface parking lots within downtown. This includes 224 parking spaces at the Fayette County Annex Complex, 20 spaces at the Holiday Dorsey Five Museum, and 28 spaces at 145 Lanier Avenue. Each of these is within walking distance to downtown attractions and restaurants.
The 2002 LCI Study discussed the need for additional public parking to support commercial and mixed-use land uses. As noted in that study, the existing parking supply for existing commercial and mixed-use parking was underutilized during peak demand periods by an estimated 40-50%. The subsequent 2010 LCI Supplemental Study recommended incorporating shared use parking for new development when feasible, reducing parking requirements as an incentive for redevelopment, and adding bicycle parking. Additionally, the 2010 study recommended making public parking more easily accessible. This sentiment was echoed by City of Fayetteville staff during the project kickoff meeting, particularly during discussions about creating and utilizing civic spaces. City staff shared plans for the new City Hall development pointed out that public parking will be available as a part of this project, renovations to the Fayetteville Library, and the development of the proposed City Center Parkway.
An estimated 340 parking spaces are available in public surface parking lots within downtown... Each of these is within walking distance to downtown attractions and restaurants.
A high-level windshield survey was performed of parking using Google maps and information obtained from the City of Fayetteville’s website. The survey was intended to identify existing on-street and public parking supply within Downtown and inform a census of public surface parking. Between SR 85/Glynn Street between Lanier Avenue and Stonewall Avenue and along Stonewall Avenue between SR
Public Parking in Downtown Fayetteville
Downtown Shops - Stonewall Parking
40
Fayette County Annex Parking
HKS | PEC | Office of Design | NV5 | Noell Consulting Group | Blue Cypress
Existing Conditions | Market Study | Lessons from Phase 1
41
Downtown Fayetteville Livable Centers Initiative (LCI) Study
Overview | Analysis | Engagement | Vision | Recommendations | Implementation
GLYNN ST
340 Publicly Accessible Parking Spaces Surface Lots (272 Parking Spaces)
5
On-Street Parking (68 Parking Spaces) Parking Count
28 7 W LANIER AVE
5 9
19
9
20 STONEWALL AVE W
Historic Courthouse Parking
7
49
In addition to the existing on-street and surface parking, the City of Fayetteville will expand its parking inventory in 2021 with the opening of its new City Hall complex. 218 parking spaces are included as a part of this facility’s development. The parking will be situated along two parallel driveways located on either side of the new complex. These driveways will enable entry and egress onto Stonewall Avenue and entry and egress onto a new east-west roadway, City Center Parkway, located south of the development. Parking along the driveways will be configured like head-in onstreet parking spaces and protected by curb-extensions that frame the driveways’ travel lanes. Eighttwo (82) parking along the new City Center Parkway also will be head-in parking protected from the travel way by curb extensions. In total, 300 new parking spaces will be created with the new City Hall development and the City Center Parkway’s first phase.
8 HWY 92
175
PKWY.
JOHNSON AVE 0
250
Future Downtown Parking
500 Feet
N
42
HKS | PEC | Office of Design | NV5 | Noell Consulting Group | Blue Cypress
An additional 300 parking spaces will be added to Fayetteville’s downtown parking inventory with the opening of the new Fayetteville City Hall complex. 218 surface parking spaces are included on the City Hall campus. 82 on-street spaces are include in the first phase of the new City Center Parkway.
Existing Conditions | Market Study | Lessons from Phase 1
43
Downtown Fayetteville Livable Centers Initiative (LCI) Study
Overview | Analysis | Engagement | Vision | Recommendations | Implementation
LCI Study Area Character Area
Built Environment and Zoning
Planned Development Recent Development
Existing Character Analysis
Open Spaces Floodplain Building Footprints
Purpose
Existing Map & Table
•
•
Commercial Residential
•
•
To gain a better understanding of the built and natural characteristics of the Downtown study area and the various places that they create within Downtown. To observe how recent and new developments impact or will impact the prevailing character of their surroundings.
Depict “character areas” based on common: building forms, orientation of buildings toward streets, setbacks, front yard treatment, street characteristics, property lines, and land uses.
•
The table assigns a number and descriptive name for each character area, along with identifying the type of place it is (a District, Corridor, Node, or Neighborhood), The numbers on the map correspond with those in the accompanying table.
•
The colors of the character areas correspond with the predominant land use (red for commercial, yellow for residential, purple for industrial, and brown for institutional) the predominant building type present, the zoning districts that currently apply, along with many character attributes.
To serve as a basis for a discussion with the City about the prevailing character areas and their future treatment through zoning.
Industrial Institutional
Existing Character Areas Map The numbers on the map correspond with those in the accompanying table. 0
0.25
1 Mile N
The Villages at Lafayette Park
44
HKS | PEC | Office of Design | NV5 | Noell Consulting Group | Blue Cypress
Existing Conditions | Market Study | Lessons from Phase 1
45
Downtown Fayetteville Livable Centers Initiative (LCI) Study
Overview | Analysis | Engagement | Vision | Recommendations | Implementation
Character Area Description
46
No.
Character Area Name
Streets
Place Type
Predominant Building Type
Existing Zoning
Land Uses
Typical Parcel Size (ft)
Street CrossSection
Sidewalk Width (ft)
Streetscape Amenities
Building Setback (ft)
Front Yard
Building Dimensions
Landmarks
0
Old Town
N Glynn St & Stonewall Ave
District
Attached Downtown Row
C-1
Retail
22 X 85
P__@__P
5
Planters, Orn. Street lights, Trash Receptacles
0
N/A
2 Stories
Old Courthouse & Square
1
N Glynn Mixed
N Glynn St
Corridor
Commercial
C-1
Commercial, Residential, Vacant
95 X 200
__@__ __|__
7 Sb / 5 Nb
Pavers (Sb), Orn. Street lights (Sb)
30-66
Lawn, Parking
1-2 Stories
2
Church District
Lanier Ave, Stonewall Ave, Johnson Ave, Lee St, Church St
District
Churches, Garden Apartments
C-1
Religious, Hotel, Residential
Varies
Multiple Streets
5
Pavers, Orn. Street lights
0-56
None, Parking
N/A
First United Methodist Church, Holiday Inn Express
3
N Glynn Strip Commercial
N Jefferson
Corridor
Retail Pads
C-3, C-2, Dr-15
Retail
150 X 330
__|__
4
N/A
70
Lawn
1 Story
Ford Dealership
4
Church St Mixed Corridor
Booker Ave, Hill Street, Holly Ave
Corridor
Churches
Dr-15
Religious, Residential, Park
70 X 130
__
5
N/A
34-40
Lawn
1 Story
Church St Park
5
E Georgia Mixed Corridor
E Georgia Ave
Corridor
Detached Houses
Dr-15
Commercial, Government, Residential
150 X 140
__
5
N/A
30
Lawn, Parking
1-2 Stories
Post Office
6
N Jefferson Davis Office Corridor
N Jefferson Davis Dr
Corridor
Converted Houses
Rp, O-I, C-2, C-1
Profession Offices, Medical Offices
120 X 300
4
Grass Verge
90
Lawn
1-2 Stories
United Community Bank
7
Lanier/Booker Neighborhood
E Lanier Ave & Booker Ave, Hill St, Holly Ave
Neighborhood
Detached Houses
C-2, R-30, Dr-15, O-I
Residential
120 X 300
Multiple Streets
6
N/A
40-50
Lawn
1 Story
N/A
8
S Jefferson Davis Industrial Node
S Jefferson Davis Ave
Node
Industrial Garage
M-1
Industrial
360 X 230
__@__
N (Sb)
N/A
83
Grass Berm, Parking
1 Story
Mask Tire
HKS | PEC | Office of Design | NV5 | Noell Consulting Group | Blue Cypress
__@__ __|__
Existing Conditions | Market Study | Lessons from Phase 1
47
Downtown Fayetteville Livable Centers Initiative (LCI) Study
48
Overview | Analysis | Engagement | Vision | Recommendations | Implementation
No.
Character Area Name
Streets
Place Type
Predominant Building Type
Existing Zoning
Land Uses
Typical Parcel Size (ft)
Street CrossSection
Sidewalk Width (ft)
Streetscape Amenities
Building Setback (ft)
Front Yard
Building Dimensions
Landmarks
9
E Lanier & S Jefferson Corner
E Lanier Ave & S Jefferson Ave
Node
Gas Stations
C-3, C-2
Retail, Religious
238 X 245
__@__ ___
5, 5
Pavers
0-100
Parking
1 Story
Islamic Community Center
10
Old Train Depot
W Lanier Ave
Node
Attached Downtown Row
Rp
Retail, Commercial
27 X 245
_ _ _P
10
Pavers
0
N/A
1 Story
Water Tower
11
Courthouse Square
S Jefferson Davis Dr, Center Dr
District
Courthouses, Offices
C-1, O-I, R-22, Dr-15
Institutional
N/A
6, 4
N/A
N/A
Parking
3 Stories
Municipal Court
__|__ __
12
Lee St Homes
Lee St
Corridor
Detached Houses
C-3, C-1, Rp
Residential
115 X 160
__
4-5
Orn. Streetlights
20-60
Lawn
2 Stories
N/A
13
S Glynn Offices
S Glynn St
Corridor
Converted Houses
C-2, C-1, Rp
Commercial, Government
160 X 260
__@__
5
Pavers, Double-Arm Orn. Streetlights
45-50
Lawn
1-2 Stories
Fire Department
14
Beauregard Blvd Homes
Beauregard Blvd
Corridor
Detached Houses
C-3-, C-1, R-30
Residential
250 X 270
__
4 (Sb)
N/A
120
Lawn
2 Stories
Tree Cover
15
S Glynn Industrial Strip
S Glynn St
Corridor
Industrial Box
C-3, C-1, Rp
Commercial
280 X 250
__@__
7 (Nb), 5 (Sb)
N/A
30-100
Parking
1 Story
Fayette Mower
HKS | PEC | Office of Design | NV5 | Noell Consulting Group | Blue Cypress
Existing Conditions | Market Study | Lessons from Phase 1
49
Downtown Fayetteville Livable Centers Initiative (LCI) Study
LAKESHO ONEOFFICE AND TWO RESIDENTIALRE DRIVE INSTITUTIONAL ANDFAMILY
RESIDENTIAL TOWNHOUSE CONDOMINIUM COMMUNITY COMMERCIAL
RP C-3
RESIDENTIAL PROFESSIONAL HIGHWA WAY COMMERCIAL HIGHWAY
RATFORD ATFORD WAY A
RMF-15 RESIDENTIAL C-1 MULTI-FAMILY DOWNTOWN COMMERCIAL R-THC C-2
HA B ER SHAM HABERSH AM PLACE
ST
C-2RUNNING COMMERCIAL BEAR TFR CTURING M-1 COMMUNITY MANUFA LIGHT MANUFACTURING A IL C-3M-2 HIGHWAY COMMERCIAL HEAV A Y MANUFA F CTURING HEAVY MANUFACTURING
HI
KELLY L DRIVE
GH W
NO RTH PAR PA AR DRI VE
AY
HONEYSUCKLE LANE
HILLSDAL HILLSDALE L E DRIVE
RA B B
K
92
N
C AR O
R TH
HUNTERS WALK
PYE COURT CO
FEN W YCK COMMONS FENWYCK
ET
I
COU
AD
K
RT
E
E AC N
PL
S
EET
W
LA
A E CIRC DGAT OO
D
NE
E AT
0
0.25
0.50
IVE DR
50
PEC COU
WALT ON W
1 Miles
HKS | PEC | Office of Design | NV5 | Noell Consulting Group | Blue Cypress
C-3 Highway Commercial
N
AY
This district is created to provide and protect areas for community shopping and service facilities convenient to residential neighborhoods.
living environment for residents of the district.
This district is created to provide retail trade and service establishments compatible with surrounding residential and office-institutional areas, and for business activities which primarily cater to the traveling public. The C-3 district requires larger yard areas, greater setbacks, and lower building densities than are permitted in the downtown commercial district.
OI Office-Institutional
C-4 High Intensity Commercial
This district is created to provide areas in which business, professional, educational, and institutional uses can be compatibly mixed in close proximity to residential land uses. Intensive commercial land uses are restricted or prohibited so as to maintain a healthful living environment for residents
This district is created to provide a location for intense retail commercial land uses, requiring large tracts of land and a location away from residential land uses. The C-4 district allows for retail business with a gross floor area greater than 75,000 square feet; however, centers which have these large retail stores must conform to a higher level of development standards. Properties zoned C-4 must entirely abut a minimum of two, four-lane state highways. The four-lane section of the highway shall be at least five miles in length.
of adjacent residential districts.
MO Medical/Office This district is created to provide a campus like setting that allows for the establishment of local and regional medical centers. The medical/office zoning district also provides the opportunity for allied health services, as well as necessary support businesses, to locate within the MO district. This district is created to enhance and protect the central business district of the city by providing for those commercial uses requiring a central location.
GR CO
Y LI N DA W A KE DRIVE
LAURIEN S TR
Zoning Districts Located Within Downtown
C-1 Downtown Historic Mixed-Use District
VAR D L EV
AY
AY G WA
SANDRA STREET
AP
W
D EV AR UL
NE S
BO
WI
RD
CL
AR
EN
H
U
ER NT
INDUSTRIAL WAY A
R
O
LE
LA ACL E
BAT A ES AV A ENUE
Y RD T YA COUR LA NE A A R B OR W AY
N
URE GA
MIR
R RT
VE
WIL LIA MSBUR
RK
L EARLY T C OUR
A ENUE AV AVENUE
ER D RI
EN COU RD
W
NE
JACK JACK K D. D. DE TTMER I NG DETTMERIN G
C EN T
TA Y MAN PA P
UE
S
EN
MEDFORD DRIVE
Main Street Zoning
LON G LONG AV A AVEN ENUE UE E
RE REGA R D B E AU COURT
AV
L EE EE ST ST REET EET
STREET SOUTH S OU T H YNN STREET GL G LYN
CO URT XTON COURT BRAXTON BRAX
ME
Y
E OW HT E H IG D R IV
C-2 Community, Commercial
This district is created to provide an area in which residential, business, professional, educational, and institutional uses can be compatibly mixed while maintaining a healthful
EA S T GA
The following district designations are from the City’s zoning regulations (Sec. 94-31) and are meant to be referenced with the Existing Zoning column in the Existing Character Areas Table.
RP Residential Professional
A ENUE Y AV LY L LL HOL HO
J OH NSON AVENUE JOHNSON VE N UE
E SPA PAR RRO ROW S C OV
WALKER
AD
UE
T EET RE TR ST LS L LL H HIIL
IL RA
R
N AV E
UE BOOK BO O KER R AV EN
ST STONEW N E WA STO ALL LL A AV V ENUE N U E EA
A AVENUE ENUE E WEST N EWALL AV ON S TO ST
RE UA
G
BENNET BENNET TT STREET STREET
NG
I
T
E T
LAN LANIER NIER AVENUE AV ENUE WES WEST ST
R
ER IIE L AN
DO
AC
ST E
AVENUE EAST IA
T R EE S ST
M
S
TH PATH O NE N E PA
N PHE
RG
LA
EN UE
GEO
OW B RO O
AV
CHURCH CHURCH STREET STREET
TE
C CARVER ARVER S STREET TR REET
NO RT H D RIVE NORTH DAV IS DRIVE JEFF JEF F DAVIS
TI TI GER TRAIL R AIL TR
E LL SW OR PO TH INT E
LIN TO HA N RD CONCO CO N C O RD L HO L T R U O C COURT LL OW K PA RK D ON PARK CLAN CL A NDON AC E TERR TER R ACE
RT C O U RT A L COU O N IAL COL CO LONI
T
D
GN IIG PA
BRADFORD SQ
AMF M F OR D CA
T
E
WA S SH HIING NGT TON TO N STREET ET
C LE IRCLE
GWINNETT GW INN ETT STREET
ST
PINE C
ENUE WE AV VENUE
E
M
PL
Y FA
OV ER S T OV WE NS M MO NS CO MM
CA
SHARON DRIVE
SID E TR EESIDE TREE CE ACE TERRA TERR
LA
R MI LL ERMIL PEPPE PEPP NG A ND IING L LAND
CLAIRE AVENUE A
E R IAG L A NE
PINE S TR E
UE A ENU AV AVENU
VE NU E AVENUE RGI A A GEOR GEORGIA
BRENDA LANE
I T RUN
ITTANY CHASE BR
RUNNING BEAR TR A M-1OS LIGHT MANUFACTURING SPA P CE OPEN SPACE IL
GE ORGIA
Existing Zoning District Designations Study
A ENUE AV JEFFERSON AVENUE
A HI KAT
CONDITIONAL C-3 PROJECT PLANNEDWDEVELOPMENT IN O NA C-4PCD INTENSITY COMMERCIAL U E HIGH DR PLANNED COMMUNITY DEVELOPMENT VEN I VE BP RD BUSINESS PARK REDEVELOPMENT DISTRICT
DEER TRAIL
H
DAV AVIS PL ACE
M DRIIVE
C C-3 PDP
HO
URCHILL RT COUR
HABERSH A
MOC C-3 MEDICAL OFFICE C-3 CONDITIONAL WINLAKESHO RE DRIV ON OI C-4 OFFICE INSTITUTIONAL A D COMMERCIAL HIGHAND INTENSITY RI V E C-1BP DOWNTOWN COMMERCIAL P RK BUSINESS PA PARK
CH
RT NO
KAY LEE KAY COURT
D
SINGLE FAMILY RESIDENTIAL OFFICE MEDICAL
DR-15 OI
D R I VE
J EFF
CIRCLE DRIVE
AR
R-70 MO
N ST R D RIV E EET DR
DW IN AY W
N
W
LA
DANIEL COURT
GL YN
R
URT
E
SINGLE FAMILY RESIDENTIAL PROFESSIONAL RESIDENTIAL
J EFF F F DAV DAVIS IS
E
B
OS
COMMERCE DRIV VE
DOG W O O D
IV
M TI
RD
MCIN TOSH CROSSING
RT
R
NU E D AVE PCD
R-30 FAMILY RESIDENTIAL R-THC SINGLE RESIDENTIAL TOWNHOUSE CONDOMINIUM R-40 RP
PLANNED DEVELOPMENT OD DRIVEPROJECT GLEWO TA N PLANNED COMMUNITY DEVELOPMENT VE RI D REDEVELOPMENT DISTRICT D O O OPEN SPACE EW G ED W
G GILBERT ROA D
E
HEAVY MANUFACTURING
PDP
D
SINGLE FAMILY RESIDENTIAL SINGLE FAMILY L RESIDENTIAL
R-15 FAMILY RESIDENTIAL DR-15 SINGLE ONE AND TWO F MILY FA L RESIDENTIAL R-22 FAMILY RMF-15SINGLE MULT L I-FAMILY L RESIDENTIAL RESIDENTIAL
M-2 E
R-10 R-70
CO U
O
R-30 SINGLE FAMILY L RESIDENTIAL Streets R-40 SINGLE FAMILY L RESIDENTIAL Main Street Parcels
Overview | Analysis | Engagement | Vision | Recommendations | Implementation
The existing LCI study area has many zoning districts which makes it harder to create a unified vision of Downtown Fayetteville. Consolidating zoning districts is essential to implement the UDO plan.
M-1 Light Manufacturing This district is created to provide a location for those light industrial uses which are able to meet comparatively rigid specifications for nuisance-free operation and which do not create excessive noise, odor, smoke, or dust or possess other objectionable characteristics which might be detrimental to surrounding neighborhoods, or to the other uses permitted in the district.
MS Main Street Architectural Overlay This district is created to promote the beautification of the city, preserve the historic and distinctive architecture and design qualities of the downtown area of the city, and to recognize and protect the unique character and integrity of the downtown area while also allowing for productive land use. This district may overlay any zoning district.
OS Open Space This district is created to limit development on certain water bodies, watercourses, floodplains, wetlands, groundwater recharge areas, and lands which serve important environmental functions and provide recreational opportunities and open areas for residents. The district is also created to protect lands of natural beauty, tracts of forests, and areas of archaeological and historical significance; and to prevent commercial, residential, and Existing Conditions | Market Study | Lessons from Phase 1
51
Downtown Fayetteville Livable Centers Initiative (LCI) Study
Overview | Analysis | Engagement | Vision | Recommendations | Implementation
industrial development from encroaching into flood zones, lands with severe grades of 15 degrees and more, naturally dangerous areas, and to protect the undeveloped nature of lands within the district from the adverse impacts of development. No property shall be zoned OS when said property contains man-made water bodies individually in excess of 500 acres in size.
R-30 Medium Density Single Family Residential This district is created to provide single-family residential areas with minimum lot sizes of 30,000 square feet protected from the depreciating effects of small lot development and high density and from the encroachment of those uses which are incompatible with a desirable residential environment.
DR-15 Two-Family Residential This district is created to provide areas for high density oneand two-family residential uses with minimum lot sizes of 15,000 square feet for single-family residences and 18,000 square feet for duplexes.
Zoning Districts Not Located Within Downtown R-70 Low Density Single-Family Residential This district is created to provide single-family residential areas with a lot size of no less than 87,120 square feet protected from the depreciating effects of small lot development and high density and from the encroachment of those uses which are incompatible to desirable residential environment.
RMF-15 Multifamily Residential This district is created to provide orderly development of high-density residential areas for one-family, two-family, and multifamily dwellings with minimum lot sizes of 15,000 square feet for single-family detached dwellings and 8,000 square feet for first unit, 5,000 square feet for each additional unit for multifamily development, but in no event shall the number of bedrooms exceed 16 per acre.
R-THC Residential Townhouse-Condominium R-40 Low Density Single-Family Residential This district is created to provide single-family residential areas with a minimum lot size of 43,560 square feet, protected from the depreciating effects of small lot development and high density and from the encroachment of those uses which are incompatible to desirable residential environment.
R-22 Medium Density Single-Family Residential This district is created to provide single-family residential areas with minimum lot sizes of 22,500 square feet where a central system for the collection of sewage and distribution of water is provided. Said areas being protected from the depreciating effects of small lot development and high density and from the encroachment of those uses which are incompatible with a desirable residential environment.
This district is created to provide for high density, singlefamily, attached fee simple residential development. The minimum size of a R-THC development is five acres and the density of residential development shall be limited to a maximum of six dwelling units per acre.
MHP Mobile Home Park The mobile home district provides for the establishment of mobile home parks located on unsubdivided land which has single ownership and control, and for mobile home subdivisions where private lots are available for sale to individual mobile homeowners.
M-2 Heavy Manufacturing. This district is created to provide and protect areas for those industrial uses which cannot comply with the more restrictive requirements of the M-1 district.
R-15 High Density Single-Family Residential The Meridian Apartments located in the Planned Community Development zoning district (PCD)
This district is created to provide for site-built housing, or industrialized building which complies with all requirements of the zoning ordinance. With this district, the city seeks to provide for single-family residential areas with higher population densities and lot sizes of 15,000 square feet.
BP Business Park The business park zoning district is created to provide planned, mixed use development along major thoroughfare or expressway corridors, so that accesses onto these corridors are kept to a minimum in order to protect these corridors as expressways and so that persons entering the city along those corridors will receive a good first impression, and to maintain a quality appearance which will stabilize or increase property values.
Retail at Stonewall Avenue and Glynn Street located in the Downtown Commercial zoning district (C-1)
52
HKS | PEC | Office of Design | NV5 | Noell Consulting Group | Blue Cypress
Existing Conditions | Market Study | Lessons from Phase 1
53
Downtown Fayetteville Livable Centers Initiative (LCI) Study
Overview | Analysis | Engagement | Vision | Recommendations | Implementation
LCI Study Area Character Area Planned Development Recent Development
Recent Developments in Study Area
Open Spaces
RABBIT’S RUN
Floodplain Building Footprints
The following images depict representative building types of the “Recent Developments” as highlighted in the Existing Character Areas Map. The new developments that are currently under construction or planned may add new building types, architectural styles, and open spaces to Downtown. Furthermore, new developments outside of Downtown, such as Trilith, also will add new building types, architectural styles, and open spaces to the City.
Commercial
JEFFERSON INTOWN PLACE
Residential Industrial Institutional
SPRINGHILL SUITES
THE VILLAGES AT LAFAYETTE PARK
MERIDIAN ON THE SQUARE
Rabbit’s Run
The Village at Lafayette Park
MERIDIAN APARTMENTS FAYETTE COUNTY ADMINISTRATION
NEW CITY HALL AND PARK
WALTON
Fayette County Administration
The Meridian Apartments
SPARROW’S COVE
0
0.25
1 Mile N
Jefferson Intown Place
54
HKS | PEC | Office of Design | NV5 | Noell Consulting Group | Blue Cypress
Sparrow’s Cove
Existing Conditions | Market Study | Lessons from Phase 1
55
Downtown Fayetteville Livable Centers Initiative (LCI) Study
Overview | Analysis | Engagement | Vision | Recommendations | Implementation
LCI Study Area Mixed Residential Med. Scale Commercial/Office Small Scale Commercial/Office
Study of Character based on Program
High-Intensity Commercial and Redevelopment Historic Core Downtown Gateway Established Neighborhood
The existing land uses and character of the study area has been extensively documented and described across a number of documents over the last 20 years: The 2003 Downtown LCI Planning study, the 2016 Conceptual Downtown Master Plan, and the 2017 Fayetteville Comprehensive Plan. While some new structures have been built in the study area during this time, the outdated zoning resolution from the 1990s still guides development and building form standards today. Thus, the existing character and land uses have not changed substantially since these studies were conducted. This hybrid map groups existing land uses according to geographical proximity and existing zoning. This map was created subjectively through a combination of on-theground observations of the study area, known patterns of existing zoning in the study area, and geographic proximity between similar uses and building forms. While not a perfect or scientific means of classification, breaking down the study area into thematic sections will help to identify specific goals and organize priorities in later phases of the study. Below is a description of the rationale behind each of the existing ‘character areas’ as defined by the existing character/existing land use hybrid map:
Historic Core This area is defined by the historic character of the structures, including the Old Fayette county courthouse. Land uses in this area include County and City government buildings, the library, and churches.
Small Scale Commercial and Office
Support/Services/Senior Uses
These areas are roughly bounded by Lanier Avenue and Stonewall Avenue on either side of the Historic Core district. Land uses in these areas consist of smaller commercial or office uses, which are often in repurposed single-family home structures.
Medium Scale Commercial and Office These areas are located further from the downtown core on the far eastern and western sides of the study area. Land uses in these areas consist of dedicated professional office parks and buildings that were constructed for commercial uses.
High-Intensity Commercial This area is located due north of the Historic Core district on either side of N Glynn Street. This area is characterized by the higher-intensity commercial uses such as drive-thrus, shopping centers, car-dealerships and other auto-oriented uses that require significant amounts of impervious coverage. The land use and character of the North Glynn corridor is in stark contrast with the Historic Core it abuts at the south end.
Established Neighborhoods This area is bounded by the edges of the study area on the south and east, by E Lanier Avenue to the north, and S Jeff Davis Drive to the west. Land uses in this area consist of smaller, single-family residential structures or compatible uses, such as schools.
Breaking down the study area into thematic sections helps to identify project goals and organize priorities in later phases of the LCI study. 0
0.25
1 Mile N
56
HKS | PEC | Office of Design | NV5 | Noell Consulting Group | Blue Cypress
Existing Conditions | Market Study | Lessons from Phase 1
57
Downtown Fayetteville Livable Centers Initiative (LCI) Study
Overview | Analysis | Engagement | Vision | Recommendations | Implementation
Source: Atlanta Home Trends
Downtown Gateway The downtown gateway character areas are located along N Jeff Davis drive to the north and S Glynn Street to the south of the Historic Core character area. The northern extent of this character area is characterized by smaller businesses in detached or historic structures. The southern extent of this character area is characterized by older commercial uses on an auto-oriented scale. Both of these areas exist as geographical gateways to the Historic Core, and are grouped together under the assumption that the same type of redevelopment and emphasis on streetscaping, traffic calming, and walkability could be of benefit here.
PCD/Mixed Residential These are broad character areas located in the northwestern corner and northern extent of the study area. These areas are currently comprised of primarily residential uses with residential zoning districts, however, there are other uses mixed sporadically throughout. This district allow for a more specific, distinct planning vision to guide future development.
Support/Services/Senior Uses Historic Core
This character area is less categorically defined than others and is better defined in geographical terms. This character consists of the southeastern extent of the study area, roughly bounded by Lee Street on the west and Johnson Avenue to the north. Existing, larger-scale structures also help to define this character area, including the senior center, the Court building, and the sheriff’s department. south and east, by E Lanier Avenue to the north, and S Jeff Davis Drive to the west. Land uses in this area consist of smaller, single-family residential structures or compatible uses, such as schools.
Olf Fayette County Courthouse | Source: Shutterstock
58
HKS | PEC | Office of Design | NV5 | Noell Consulting Group | Blue Cypress
Existing Conditions | Market Study | Lessons from Phase 1
59
Downtown Fayetteville Livable Centers Initiative (LCI) Study
Overview | Analysis | Engagement | Vision | Recommendations | Implementation
Existing Buildings on Abandoned lots and Vacant Lot Opportunities
1
2 3
5
4 1 2
3
4
5
Identification of sites where new development can occur indicates opportunities for immediate application of the LCI recommendations.
60
HKS | PEC | Office of Design | NV5 | Noell Consulting Group | Blue Cypress
Existing Conditions | Market Study | Lessons from Phase 1
61
Downtown Fayetteville Livable Centers Initiative (LCI) Study
Overview | Analysis | Engagement | Vision | Recommendations | Implementation
02.2 Market Study Summary Of Forecast Demand By Product Type (2020-2025)
Small Lot Single Family Detached
Office
Demand in 2021-25: 100 units/year Estimated Pricing: $400,000 - $600,000 Estimated Density: 4-6 units/acre Parking: 2-car front/rear entry garages Notes: Strong land value, good transitional use, great for all household types. Likely to run into land limitations.
Demand in 2021-25: + / - 25,000 SF Estimated Pricing: $20-$25/SF Full Service Estimated Density: 10,000 SF/acre Parking: 4/1,000 SF Notes: Population servicing office uses including medical and smaller private firms.
Townhomes
Retail / Service
Demand in 2021-25: Estimated Pricing:
Demand in 2021-25: 90,000 - 140,000 SF Estimated Pricing: $20-25/SF NNN Estimated Density: 8,000 SF/acre Parking: 5/1,000 SF Notes: Potential for small-format grocer / hardware store, majority is F&B & service-oriented w/ pharmacy / drug store.
15 units/year $300,000 - $375,000 $425,000 - $475,000 Estimated Density: 8-14 units/acre Parking: 2-car front/rear entry garages Notes: Mix of conventional and luxury townhomes. High land value, limited depth. Good transitional use, great for ENs & starter families.
Rental Apartments Demand in 2021-25: Estimated Pricing:
250-300 units above pipeline. $1.45/SF | THs $2.15/SF | 55+ $1.75/SF | Conv. Estimated Density: 25-45 units/acre Parking: 1.5/unit OR 1/bed Notes: Opportunity to leverage existing downtown environment & provide for “missing middle” housing options & grow workforce housing.
62
HKS | PEC | Office of Design | NV5 | Noell Consulting Group | Blue Cypress
Existing Conditions | Market Study | Lessons from Phase 1
63
Downtown Fayetteville Livable Centers Initiative (LCI) Study
Overview | Analysis | Engagement | Vision | Recommendations | Implementation
Development Impacts
Single Family/ Townhomes
Multifamily Rental
Condo
Retail
Office
More residents frequenting establishments
More services / amenities in area
All development can remove unwanted uses, increase city tax digest/improve services, & increase property values Greatest retail support Pros
Low intensity use in/near neighborhoods More eyes on street, increased safety Opportunities for new residents / existing residents to downsize Strongest attainability
More eyes on street
More jobs Living wages Local jobs Workers frequent and support retail
Low intensity use in urban environment
More transient population
Increased Density
Might get undesirable retail
Does not provide significant retail support
Increased density
Often geared towards wealthy due costs
Jobs are not high wages
Creates dead zones at night
Cons
All uses will increase property values (higher taxes) and traffic
THE MERIDIAN APARTMENTS
64
HKS | PEC | Office of Design | NV5 | Noell Consulting Group | Blue Cypress
Existing Conditions | Market Study | Lessons from Phase 1
65
Downtown Fayetteville Livable Centers Initiative (LCI) Study
Overview | Analysis | Engagement | Vision | Recommendations | Implementation
COVID-19 Impact
•
The Atlanta metro lost over 100,000 jobs due to the pandemic
•
Much of these in retail, hospitality, and population servicing industries
•
Most jobs projected to recover starting in late 2021 and back to pre-pandemic levels by year end 2022
•
The for-sale residential market has remained strong particularly at higher sales prices result of historic low supply delivered since the Great Recession
•
The rental market metro-wide has remained strong with highest level of absorption in its history, however, rental rate growth has slowed and absorption has been strongest in the suburbs as well as value-oriented properties
•
Mixed-use environments both urban and suburban continue to be in high demand, with the lack of these environments in the suburbs pushing demand even further for suburban town centers
•
Rising home prices and a lack of supply coupled with changing tenure preferences has created new rental product types including professionally managed rental townhomes and rental single-family developments
•
The pandemic has exacerbated retail trends of the shift away from big box stores to more online shopping and less need for brick & mortar locations.
•
While many stores still desire a brick & mortar location to engage customers, these spaces need to be “right-sized” as there is less inventory need and a desire to keep absolute rents low
•
A result is an increasing mix of food & beverage as “anchors” to any retail development along with support from population servicing retail
•
Experiential / destination retail has become extremely important in creating successful retail environments
•
Similar to retail, the pandemic has exacerbated office trends that were already in place which were a shift to more remote / flexible work environments
•
While this might lead to less office space needed per employee this could be offset by a shift away from dense office settings
•
While more remote work scenarios could reduce demand for office space, this trend is very sector
•
Hospitality has been hit hardest by the pandemic and will take years to recover with many companies currently limiting business travel and large gatherings.
FROM FAYETTEVILLE CITY MANAGER’S WEEKLY REPORT
66
HKS | PEC | Office of Design | NV5 | Noell Consulting Group | Blue Cypress
Existing Conditions | Market Study | Lessons from Phase 1
67
Downtown Fayetteville Livable Centers Initiative (LCI) Study
Overview | Analysis | Engagement | Vision | Recommendations | Implementation
02.3 Lessons from Analysis
Market Analysis
Parks and Open Space
68
•
The City of Fayetteville has completed many studies identifying the community’s desire for an increase in parks and open space.
•
Open space aesthetics, identity, gateways, and streetscapes are a priority given previous studies. Next steps are to identify specific opportunities for existing open space improvements and locations for new proposed spaces.
HKS | PEC | Office of Design | NV5 | Noell Consulting Group | Blue Cypress
•
The analysis indicates significant demand for single family and attached townhouses. The identification, prioritization, and policy incentives that encourage the desired scale and character of development should be evaluated to align with the overall vision of the Downtown Fayetteville LCI Study.
•
Demand for office space is limited as only 19% of residents work in Fayetteville in comparison to 35% of residents that commute over 25 miles to work. Future studies should identify work and lifestyle changes as a result of the COVID-19 pandemic.
Other Questions / Comments •
Fayetteville leadership should determine whether to prioritize attracting major employers or improving quality of life and local amenities to benefit local residents and attract others.
•
The LCI study should focus on engaging marginalized and underserved residents to be benefited by the plan without displacement.
Mobility •
Past analyses emphasize the need for infrastructure to optimize walking and biking. This LCI study should reinforce the Master Path Plan while considering a bold vision of a highly networked open space that is independent of the road system.
•
Community feedback for parking is pivotal for a deeper study and consideration.
Existing Conditions | Market Study | Lessons from Phase 1
69
Downtown Fayetteville Livable Centers Initiative (LCI) Study
03 70
HKS | PEC | Office of Design | NV5 | Noell Consulting Group | Blue Cypress
Engagement
Downtown Fayetteville Livable Centers Initiative (LCI) Study
Overview | Analysis | Engagement | Vision | Recommendations | Implementation
03.1 Engagement Timeline Overview
The project process was divided into four phases as outlined below. Starting with outreach and communications activities to build study awareness and excitement within the community, laying the groundwork for meaningful input and community engagement during the next phases, and initiating a strong following by community members.
Investigate The study process began with a soft kick-off of the project via the City’s multiple communications channels. This work was carried out through the release of a study flyer in late December 2020 that communicated the project goals and process and informed the community of input opportunities that would debut in early 2021.
Explore In this phase, a virtual community charrette was conducted to craft a collective vision for the LCI study area.
Recommend The teams recommendations were presented to the community via a hybrid setting.
Document This phase was to document and finalize the recommendations including the community engagement process and input.
72
HKS | PEC | Office of Design | NV5 | Noell Consulting Group | Blue Cypress
Investigate | Explore | Recommend + Document
73
Downtown Fayetteville Livable Centers Initiative (LCI) Study
Overview | Analysis | Engagement | Vision | Recommendations | Implementation
03.2 Investigate Re-visit
Overview
Study Website Launch
The first few months of the LCI study process included a flurry of outreach and communications activities to help position the project for success. These activities focused on building study awareness and excitement within the community, laying the groundwork for meaningful input and community engagement during the next phase, and initiating a strong following by community members.
Early January 2021 saw the launch of the study website:
Soft Project Kick-off The study process began with a soft kick-off of the project via the City’s multiple communications channels. This work was carried out through the release of a study flyer in late December 2020 that communicated the project goals and process and informed the community of input opportunities that would debut in early 2021.
74
www.fayettevillelcistudy.com This site will serve as the information hub for study information as well as a centralized location for all outreach activities. The City’s Planning and Zoning page links directly to the site: https://fayetteville-ga.gov/city-departments/ community-development/planning-and-zoning/livablecenters-initiative-lci/, furthering ease of access to project information.
HKS | PEC | Office of Design | NV5 | Noell Consulting Group | Blue Cypress
Photo Scavenger Hunt Initiation
Core Team Establishment & Welcome
Early January 2021 also marked the start of a fun, webbased photo scavenger hunt. Community members can take photos from anywhere in the Downtown study area, capturing characteristics they feel best fits with their response to the hashtags of:
The City established, confirmed, and welcomed a 17-member “Core Team” to serve as champions of the study process and help guide the plan’s outcomes. The project team delivered a formal welcome via email the first week of February, encouraging members to participate in the charrette and scavenger hunt while helping get the word out about the process.
#MoreOfThisDowntown – a photo to display something they like to see more of in Downtown #LessOfThisDowntown – a photo to display something they would like to see less of in Downtown #MyFayettevilleFavorite – a photo that shows their favorite place/thing in Fayetteville Participants submit responses via email or social media and are entered for a raffle prize from local businesses. Photos and raffle winners will be featured at the February Design Charette, creating a bridge between the project kick-off and the February community meetings.
Advertising and Communications Activities During the Investigate stage, the study, its goals, and current/upcoming activities were promoted in multiple ways, including via the City’s Facebook and Instagram accounts, Next Door, weekly eblasts, and monthly City News publication. The team also established a project updates email sign-up on the study website and sent out its first update to the group.
Charrette Save the Date & Promotions The Community Design Charrette – a community work session where community members are asked to roll up their sleeves and help plan for Downtown’s next phase – was scheduled for February 11th and 12th. An online registration tool was established on the project website – giving community members the option to participate in one or both 1.5-hour sessions (to be held on Thursday evening and Friday mid-day).
Investigate | Explore | Recommend + Document
75
Downtown Fayetteville Livable Centers Initiative (LCI) Study
Overview | Analysis | Engagement | Vision | Recommendations | Implementation
Questions from Analysis and Site Visits
Questions
Targeted towards Community
Targeted towards Client
What are the community acceptable levels of density?
Targeted towards Community
Questions
Targeted towards Client
x
What are some of your favorite downtowns in Georgia or in other states and why?
x
What are the positive and negative characteristics of the existing parks and open spaces? What is desirable, what is undesirable?
x
What activities do you want to take place within future and existing parks and open space (recreation, community gathering, event planning, physical health, economic development, nature appreciation, etc.)?
x
How should the character areas be treated where there has been recent new development or where there is development planned?
x
What types of amenities and nodes are desired for greenspace connections (pocket parks, bike paths, walking trails, multi-use pathways, seating areas, water features, plazas, community gathering spaces with commercial partnership, dog parks, etc.)?
x
x
How do you interpret density –by height or other? How does the community feel about rental product versus ownership product? Does this vary by product type? (Rental townhomes / cottages vs conventional apartments) Are there demographics and/or household types / housing types missing in the community? x Young professionals? Opportunity for households to downsize? Would the community support a shared centralized parking deck? x
A centralized shared parking deck would unlock the development potential of many sites given the costs of parking and current rent levels of many uses
What types of retail and/or services do you have to leave the community for? And where do you go for this retail and / or services?
x
What is Fayetteville missing?
x
x
In 5 years from now what other Atlanta regional community do you envision Fayetteville looking like?
What character areas should be preserved?
x
How should the character areas be treated where there has been recent new development or where there is development planned?
x
The 2018 Future Land Use Map shows much of the Downtown study area as “Walkable MixedUse.” Is this desirable and feasible given the Existing Character Map and Table? Should the Downtown study area be more variable in character?
x
What parts of the downtown area should be preserved into the future?
x
What parts of the downtown area do you want to see change or improve in the future?
x
What is your opinion of the new residential development that’s taken place in downtown Fayetteville? (i.e., The Village, The Meridian, scattered new housing subdivisions). Could you see yourself moving there soon or in the future? If you already live in downtown, what made you choose to live there?
x
76
HKS | PEC | Office of Design | NV5 | Noell Consulting Group | Blue Cypress
Investigate | Explore | Recommend + Document
77
Downtown Fayetteville Livable Centers Initiative (LCI) Study
Overview | Analysis | Engagement | Vision | Recommendations | Implementation
03.2 Explore Re-Engage + Focus
Virtual Community Design Charrette (February 11-12, 2021)
Overview A virtual community charrette was conducted on February 11th and 12th, 2021 to craft a collective vision for the downtown study area of Fayetteville by taking the lessons learned from history and past efforts and reimagine a future that engages all the stakeholders and is healthy for the environment and the community. Participants shared input on areas to preserve and change as well as perspectives on future land uses, Downtown access and mobility, and open space. Both meetings were conducted virtually via zoom.
Re-engage The first day was to re-engage the community..
Focus The second day was built on discussion and input provided and collected from the first day.
78
HKS | PEC | Office of Design | NV5 | Noell Consulting Group | Blue Cypress
Investigate | Explore | Recommend + Document
79
Downtown Fayetteville Livable Centers Initiative (LCI) Study
Overview | Analysis | Engagement | Vision | Recommendations | Implementation
Photo Scavenger Hunt
80
HKS | PEC | Office of Design | NV5 | Noell Consulting Group | Blue Cypress
Investigate | Explore | Recommend + Document
81
Downtown Fayetteville Livable Centers Initiative (LCI) Study
82
HKS | PEC | Office of Design | NV5 | Noell Consulting Group | Blue Cypress
Overview | Analysis | Engagement | Vision | Recommendations | Implementation
Investigate | Explore | Recommend + Document
83
Downtown Fayetteville Livable Centers Initiative (LCI) Study
Overview | Analysis | Engagement | Vision | Recommendations | Implementation
PRESERVE
PRESERVE
•
Existing parks, open and green spaces such as courthouse square and the amphitheater.
•
•
Current community events and activities.
Existing local businesses and restaurants and shops.
CHANGE CHANGE •
Heritage Park and May Hart parks need updates and improvements.
•
Current park network lacks connectivity.
IMAGINE •
•
•
OPEN SPACES
•
Less chains and big businesses.
•
Less car dealerships.
IMAGINE
USES
More parks and open spaces with programming and memorial spaces (sports courts, equipment, roller skating, arts, veteran and African American memorial space). More community events such as fests, community swaps, car shows, movie nights. Dedicated multi-use paths connecting to activity nodes and green network to enhance connectivity and pedestrian and bike safety.
•
More local small businesses, shopping and restaurants in downtown.
•
Mixed income housing for different demographics (affordable, middle income, young and older families).
•
Mixed-use developments and diversity in uses and amenities (commercial, office + housing).
•
New uses such as meeting space, art gallery, outdoor dining in downtown.
•
Attract residents and businesses to downtown.
PRESERVE •
CHANGE •
Less auto-centric; more pedestrian and bike friendly by improving safety and infrastructure.
•
Less traffic congestion and high speeds in downtown.
•
Parking in downtown is limited, need clear signing to make it less confusing.
IMAGINE
84
PRESERVE
Senior services have good programs, but could be built up and improved.
•
More parking in downtown.
•
Relieving traffic through road diets.
HKS | PEC | Office of Design | NV5 | Noell Consulting Group | Blue Cypress
•
MOBILITY
BUILDINGS
Preserve historic character and old buildings.
CHANGE •
Old houses are deteriorated, lack of maintenance,
•
Downtown shops are vacant and need activity.
IMAGINE •
Infill developments to provide density and walkable to downtown.
•
Re-purpose unused buildings re-purpose and improve existing buildings.
•
New developments to be compatible with historic character
Investigate | Explore | Recommend + Document
85
Downtown Fayetteville Livable Centers Initiative (LCI) Study
What is your vision for Fayetteville?
Overview | Analysis | Engagement | Vision | Recommendations | Implementation
“Preserve neighborhood and small town feel.”
“No jobs for young professionals; current commute time is very long.”
“Fayetteville as an inviting, affordable and authentic town with a sense of pride.”
“Fayetteville should be the heart not an artery.”
“Pinterest Worthy.”
“Infill Development.”
86
HKS | PEC | Office of Design | NV5 | Noell Consulting Group | Blue Cypress
“Providing growth opportunities.”
“Need sustainability element to be incorporated into plan!”
“Repurpose unused property and buildings.”
Investigate | Explore | Recommend + Document
87
Downtown Fayetteville Livable Centers Initiative (LCI) Study
Overview | Analysis | Engagement | Vision | Recommendations | Implementation
The Birth of ‘moving Fayetteville Forward’
Survey Results
During the community charrette, participants were asked for suggestions regarding naming the LCI initiative. The top choice was Fayetteville Forward. The word ‘moving’ was later added by the team to suggest active motion.
TOP PLACES TO GO DOWNTOWN
TOP PRIORITY
1. Restaurants and Bars 2. Fayette County Public Library 3. Courthouse Square
57%
WANT TO SEE MORE VARIETY DOWNTOWN
Expand and connect to Fayetteville multi-use path network
33%
49%
24%
WANT TO EXPAND DEDICATED BIKE LANES
WANT MORE GREENSPACE DOWNTOWN
WANT TO EXTEND SIDEWALKS TO ADDRESS GAPS IN THE SIDEWALK NETWORK
YES
82%
WANT MORE SHOPS AND RESTAURANTS DOWNTOWN
Mobility
Downtown
To additional off-street parking
NO
TOP PRIORITY
To the addition of a parking deck
More patios and outdoor cafe dining
WHAT WE HEARD ONLINE AND PAPER SURVEY
Suggestion Boxes Designed by Local Artists
29%
Open Spaces
Housing
Want to see more recreational activities
42%
Are supportive of adding more cottages on limited sized lots as a housing option
39%
Want to see more pop-up markets and food booths
TOP HOUSING OPTIONS
1. Cottages 2. Townhomes 3. Entry level housing
YOU WANT TO SEE MORE
Input boxes were designed and decorated by a group of Fayetteville local artists. The boxes were used to receive feedback from the community and were strategically places in accessible locations in the city including the Fayette County Library, City Hall and Church Street Park.
88
HKS | PEC | Office of Design | NV5 | Noell Consulting Group | Blue Cypress
1. Multi-use Pathways 2. Pocket Parks 3. Water Features
TOP PRIORITY
23%
WANT MORE OPEN SPACE
21%
WANT MORE LIGHTING
Keep Downtown Authentic
40%
Of people thought empty-nesters could utilize additional housing options
TOP PRIORITY More afforable housing options for young professionals Investigate | Explore | Recommend + Document
89
Downtown Fayetteville Livable Centers Initiative (LCI) Study
Overview | Analysis | Engagement | Vision | Recommendations | Implementation
04.3 Recommend and Document
Hybrid Community Meeting A Community Town Hall meeting was attended by elected officials and several local residents in June 2021. Presenters reported on months of research and community feedback and gave recommendations to the City regarding many quality-of-life infrastructure improvements . Participants engaged in-person and online. Part 1 of the meeting focused on the Presentation of Project Overview and Progress including Connections and Nodes, Mobility , Codifying the place and the impact of feedback and preferences. Part 2 engaged the audience online through break-out rooms and in-person through large printed boards to garner feedback and preferences. This section highlights the main takeaways from the Explore and Recommend Community Meeting.
90
HKS | PEC | Office of Design | NV5 | Noell Consulting Group | Blue Cypress
Investigate | Explore | Recommend + Document
91
Downtown Fayetteville Livable Centers Initiative (LCI) Study
Overview | Analysis | Engagement | Vision | Recommendations | Implementation
MIXED-USE MULTIF FAM MILY HOUSING
MULTIFAMILY HOU USING
Lower scale and aesthetiic sim milar to image (B) are most preferre ed esp pecia ally with restaurants and active ro oo oftop ftop sp spaces. paces. Large monolithic developm ments are not desired (as in images A and d E) E). Glass and contemporary styles / matterials are not preferred (as in im mage D).
General push back reg garding tall and big buildings. Modern n aesthetic desired, how wever, not too eclectic as in ima age G.
OFFICE
Note: Images highlighted in green indicate most desired and images indicated in red were the least desired images.
92
HKS | PEC | Office of Design | NV5 | Noell Consulting Group | Blue Cypress
Small scale office buildings with 1-3 stories serving small businesses are mostly prefered, (ssim milar to image E). Unlike images ((B),(C) and (G), contemporary faca fac ades with less glass and modern brick patterns are preferred (Similar to images A and D). General support for adaptive reuse.
RETAIL + ACTIVE EDGE Wid de sidewalks, overhangs and d outdoor dining spaces are d desired. The group liked morre colorful facades, such as in image (F). Collonade sttructures are generally not preferred.
Investigate | Explore | Recommend + Document
93
Downtown Fayetteville Livable Centers Initiative (LCI) Study
Overview | Analysis | Engagement | Vision | Recommendations | Implementation
“Future materiality should complement and bllend with current charactter and herrittage of Fayettteville.”
General Comments
“More natu ural settin ngs.”
PUBLIC REAL LM: PARKS + OPE EN SPACES There is a gene eral apprehension towarrds large paved areas. Sidew walks and buffers with more e treess and landscape were preferred.
NO Too much concrete, gardenstyle apartment buildings, large im mpervious surfaces, overpowering buildings. “Active rooftop spa aces and usab ble parkletts will be wo onderful”
“Build upon current small town feel, yet modern modernize!” nize e!
YES PUBLIC REALM: SIDE EWALKS, BIKE PATHS + STREET FURNITURE S
Note: Images highlighted in green indicate most desired and images indicated in red were the least desired images.
94
HKS | PEC | Office of Design | NV5 | Noell Consulting Group | Blue Cypress
Mosst participants indicated a desire to have a more active urban feel as well as separating cyclists c ycl and pedestrians with wide planting buffers.
Quaint architectural style, diverse flexible spaces, contextsensitive wayfinding, Brick facades.
“L Lov ve the iidea of planning a space s for activities such c as food trucks or open o air markkets.”
Investigate | Explore | Recommend + Document
95
Downtown Fayetteville Livable Centers Initiative (LCI) Study
04 96
HKS | PEC | Office of Design | NV5 | Noell Consulting Group | Blue Cypress
Vision
Downtown Fayetteville Livable Centers Initiative (LCI) Study
Overview | Analysis | Engagement | Vision | Recommendations | Implementation
04.1 The Big Idea
RESPECT
NATURE
moving Fayetteville Forward
Maintain the authenticity of Fayetteville Preserve natural assets Leverage Parks, landscaping, trees
Vision
Elevate access for improved mental health and emotional well-being Emphasize historic character Unify signage standards referencing historic character
Through deep community engagement, this project was named: moving Fayetteville Forward. In doing a vested exploration of what the opportunities are for Downtown Fayetteville, it was determined that the movement that was desired needed to be multidirectional. To demonstrate this aspiration , the team tapped into the visual of a compass to create the guiding principles that will illustrate the priorities of the study and identify the performance metrics that will help maintain the accountability of the process for the Livable Centers Initiative.
The Vision for moving Fayetteville Forward is to reimagine the possibilities in Downtown through catalytic equitable placemaking, enhanced legibility of the built environment, and creative guidelines for healthy, sustainable developments that will empower its diverse communities.
PRIORITIZE
REVITALIZE
WALKABILITY
ECONOMY Diversify economy
Improve walk scores
Imagine new developments
Integrate sidewalks with
creatively to revitalize the
public realm
economy
Incorporate Multi-use trails
Strengthen economic impact by
and improve connectivity with
mixing uses
Fayetteville and Fayette County
Plan feasible developments
Focus on Downtown core
aligned with market study
accessibility to create unified
Promote small businesses and
streetscape
art+culture organizations
Guiding Principles ENHANCE The guiding principles for a project are tenets that will be a tool for decision making and accountability. The cardinal directions of North, South, East and West of a compass have been adapted to indicate the priorities of the study: Nature, Social, Economy and Walkability.
SOCIAL Emphasize spaces for community interaction Enhance safety
This aligns with the goals that the Atlanta Regional Commission has while investing in such initiatives for the cities. The guiding principles inform an actionable framework on which the recommendations are built. Character themes portray the individual identity of different zones in the area where key nodes are inserted for the community to meaningfully gather. The places and spaces are intentionally connected through a network of links that offer the legibility and access indicated in the over-arching vision.
98
HKS | PEC | Office of Design | NV5 | Noell Consulting Group | Blue Cypress
Empower Community - led action Celebrate Social, racial and intergenerational diversity Promote shared, flexible spaces
99
Downtown Fayetteville Livable Centers Initiative (LCI) Study
Overview | Analysis | Engagement | Vision | Recommendations | Implementation
The Framework
AV
E
ST D B LV
T S G
LY N
N S
RD GA
T N S
DR
LY N
LEY
S G
Existing Open Space
IS
D
R
D B LV
Proposed Park
AV
YFIEL
Proposed Inner Loop
D
IE MA
D
FF
JIMM
Proposed Outer Loop
AD
AU
JE
R
D
D
BE
D
BR
S G LY
IS
D B LV
RE
S
YFIEL
AU
AV
IE MA
DR
BE
D
JIMM
LEY
AD
DR
BR
NN ST
D
B LV
B LV
LEY
Existing Open Space
FF
E
ELD
AD
Proposed Nodes
JE
AV
YFI
BR
heritage of Fayetteville’s 200 years of existence.
S
Y
R
D
MA
D
RA
IS
G
MIE
AV
V
GA 54
E
E
D
R A
AV
FF
IE LAN
W S TO N E WA L L AV E
W S TO N E WA L L AV E
The Root speaks to the rich foundation set in this area by the Sugar Hill community, the religious institutions and the civic organizations. It indicates growth that speaks to the dichotomy of the present and the future that is deeply rooted in the
E
W L A N I E R AV
GA 54
JE
JIM
AV
D
GA 54
V
Y
Y
B LV
R A
D
D
RD
IE LAN
RA
RA
GA
N L A FAY E T T E AV E
G
G
S
GE
OT
RD
O ER
Outer Loop 4.0 Miles
GA 54
GA
E S TO N E WA L L AV E
J E F F E R S O N AV E
G EO R G I A AV E
W L A N I E R AV
TH
new developments like Trilith. It lends itself to be characterized by innovation
E
CHURCH ST
L A FAY E T T E AV E
E L A N I E R AV
GA 54
western portion of the study area is closer in proximity to both natural assets and
AV
G EO R G I A AV E
RE
CORE
W S TO N E WA L L AV E
The Edge mirrors the historical aspect of the root by being a play of the phrase - at the Leading edge. This
T
Inner Core Loop 2.2 Miles
E
ED
ES
H O O D AV E
GA 54
THE
YN
H O O D AV E
RE
L A FAY E T T E AV E
W L A N I E R AV
RR
J E F F E R S O N AV E
AU
LAGE
The Core pays homage to the history of Fayetteville with the preservation of many notable places of interest. It is also home to the new government buildings that together with the local businesses shape the main street.
HILLSDALE DR
GL
FO
N J E F F D AV I S D R
T
HILLSDALE DR
N
N YN GL
ES
N
RR
BE
E
CHURCH ST
E VIL
ST
THE THRESHOLD
AV
H O O D AV E
TH
FO
N
T
N
to nature
ES
HILLSDALE DR
J E F F E R S O N AV E
YN
RR
GL
FO
ST
just right for communities to thrive
this area echoes the homely features of walkable urbanism with connections
CHURCH ST
Preserving the character set by the Villages at LaFayette,
N J E F F D AV I S D R
this area serves as a portal to the new downtown district with its mix of uses that are
N J E F F D AV I S D R
A Threshold is the entrance or start of something and
as it becomes the nexxus where creative mixed use developments can be featured.
IDENTIFY CHARACTER THEMES
Areas distinguished by common characteristics based on physical environment analysis and community perception
100
HKS | PEC | Office of Design | NV5 | Noell Consulting Group | Blue Cypress
GATHER
CONNECT
NODES
LINKS
Strategic focus points for orientation, pause, celebration and engagement. New nodes provide placemaking opportunities unique to each character area.
Routes along which people move throughout the city that offer legibility and access.
101
Downtown Fayetteville Livable Centers Initiative (LCI) Study
05 102
HKS | PEC | Office of Design | NV5 | Noell Consulting Group | Blue Cypress
Recommendations
103
Downtown Fayetteville Livable Centers Initiative (LCI) Study
Overview | Analysis | Engagement | Vision | Recommendations | Implementation
FO RR ES TA VE
ST NG LY NN
Recommendations
HILLSDALE DR
20 MI NU TE
JEFFERSON AVE
15 MI NU TE AVE HOOD
6
10 MI NU TE
As stated earlier in this document, Fayetteville needs more programmed open spaces. In addition to preserving the existing parks and open spaces, there are four proposed new parks as shown on the map on the opposite page.
5M INU TE
The analysis below shows how the proposed parks close the walkshed gaps with the LCI study area. This ensures all of the residents of the LCI study area are within at least 15 minute walk to a park or programmed open space. The next spread details the proposed parks and public spaces as well as streetscape enhancements.
WA LK
5 N GLYNN ST
CHURCH ST
Introduction
N JEFF DAVIS DR
05.1 Parks and Open Space
LAFAYETTE AVE
GA 54
R AV NIE E LA
2 W LANIER AV
BOOKER AV
W STONEWALL AVE
GA 54
3
Legend 5 Minute Walk
Legend
PLANNED CITY PARK
10 Minute Walk
S
Y AD GR
15 Minute Walk
E AV
Existing Open Space Proposed Open Space
DA VI S
S GL YNN ST
BEA UR EGA RD BLV D
R YD DLE BRA
LVD IELD B MAYF JIMMIE
Walkshed Analysis of Proposed Parks and Open Spaces within the LCI boundary.
Four new parks are proposed to ensure all residents of the study area are within a 15-minute walk to a park.
5 Minute Walk 10 Minute Walk 15 Minute Walk
DR
20 Minute Walk Existing Street Development Opportunity
Existing Street
Walkshed Analysis of Existing Parks and Open Spaces
JE FF
1
Existing Open Space
Water
4
Existing Park
Proposed Park
Open Space
Water
N
Proposed Parks and Open Spaces 104
HKS | PEC | Office of Design | NV5 | Noell Consulting Group | Blue Cypress
Parks and Open Space | Mobility | Capital Improvement | Built Environment
105
Downtown Fayetteville Livable Centers Initiative (LCI) Study
1
Overview | Analysis | Engagement | Vision | Recommendations | Implementation
Southern Conservation Trust Preserve
4
Continue Preservation of forest land next to the Southern Conservation Trust. The vacant parcel west of the Southern Conservation Trust could be developed in a way where conditions exist requiring the developer to connect trail systems in the development by the stream to the Southern Conservation Trust as well as the planned community green space on the Fisher Avenue extension.
2
•
Outdoor education opportunities
•
Natural walking trails that take advantage of the stream.
•
Health and exercise
•
Disc golf
•
Playgrounds for children
The vacant space along E Lanier Avenue and S Jeff Davis Drive, and also along Booker Avenue, provide an excellent opportunity to provide transition space between the residential community in this area to the downtown commercial area. This could be accomplished in a variety of ways, but adding public park space in this area that provides a variety of functions would work well.
•
Walking trails
•
Community event space
•
Playground for children
•
Dog park
•
Mixed use of small scale commercial (dining and or shopping) on the edges facing the street.
•
A place for people to enjoy the city before or after going to an event at the amphitheater.
•
Pedestrian connection through the residential area linking this vacant area to the downtown.
Potential Public Gathering space / small park The vacant spaces between E Lanier Avenue and E Stonewall Ave provide a great opportunity for a mixed-use development that provides an open park space linkage between the two streets.
106
•
Playgrounds for children
•
Dog Park
•
Open spaces for community events
•
Physical and mental health
•
This would also potentially serve as a node of connection between the enhanced pedestrian gateway along N Jeff Davis Drive and the residential community.
•
Small scale commercial development for the use of restaurants or shopping could also be incorporated into the park space.
•
Abernathy Greenway along Abernathy Road in Roswell is a good example of a liner park alongside of a vehicular roadway.
Outdoor Public / Park Space to transition between amphitheater & downtown The vacant lot adjacent to the existing amphitheater provides a great opportunity to create linkage between the amphitheater and the residential area leading to downtown. This could be done with a combination of park space that is more of a natural feel than a developed feel with the following programming:
3
Transitional Park
•
Open green spaces provide opportunities for community events close to the downtown area.
•
Adding mixed use options makes the place more easily inhabitable which creates public interest.
•
Potential to be used as a public park when not being used for community events.
HKS | PEC | Office of Design | NV5 | Noell Consulting Group | Blue Cypress
5
6
Pocket Park •
Public space node
•
Gateway to north 85 corridor
•
Possible location for a community garden, playground for children or other neighborhood initiatives.
Streetscape The historic homes purposed for commercial use along N Jeff Davis Drive provide a good opportunity to begin a gateway into the downtown area. Pedestrian activity could be enhanced with more of a separation between the sidewalk and the road with enhanced low maintenance landscaping within the landscape strip. •
Seating nodes within the enhanced pedestrian pathways should be designed appropriately to connect to the local businesses. Perhaps there is an incentive for business owners to provide enhanced seating nodes along the sidewalk that lead into their place of business and also provide a nice feature for the users of the sidewalk. Pocket parks with private partnership
•
There was strong desire for more local outdoor dining options. The large front yards of these old historic homes facing N Jeff Davis provide a great opportunity to meet this desire.
•
Historic Roswell, GA on Canton Street is good example of this.
Parks and Open Space | Mobility | Capital Improvement | Built Environment
107
Downtown Fayetteville Livable Centers Initiative (LCI) Study
Overview | Analysis | Engagement | Vision | Recommendations | Implementation
Recommendations
HOOD AVE
More tourists and locals are expected to visit and live in the city’s downtown area with this influx in population, creating a need for better and safer downtown amenities to support its residents and visitors. There is a need for public spaces where people can interact and define the community’s aesthetic quality, economic activity, health, and sustainability. New design strategies should therefore be implemented to develop a strong framework for the infrastructure amenities needed to get people out of their cars to socialize, interact with their environment, and discover other mobility options.
GA 54
R AV NIE E LA W LANIER AV W STONEWALL AVE
GA 54
Existing Pedestrian and Cycling Network
Legend
Existing Sidewalk
Existing Open Space
Existing Street
Water
S
JE FF
DA VI S
DR
Existing trail Proposed Outer Loop Proposed Inner Loop Existing sidewalk Master Path Plan Recommendation Development opportunity
S GL YNN ST
Existing Open Space
BEA UR EGA RD BLV D
Existing Bike Lane
LVD IELD B MAYF JIMMIE
HKS | PEC | Office of Design | NV5 | Noell Consulting Group | Blue Cypress
LAFAYETTE AVE
R YD DLE BRA
108
Advocates for (re)developing Fayetteville’s core transportation network to work for the city’s residents, businesses, and visitors. This requires flexibility in its design application and implementation so that mobility priorities and guidance for transportation investments are identified to improve resident’s quality of life and access to goods or services.
CHURCH ST
GEORGIA AVE
E AV
3.
Defines ideal standards for Complete Streets in local areas. “Complete Streets” refer to the concept that roadways should be designed with all users in mind, not just motorists. These standards apply context-sensitive design approaches to roadway redesign that enable safe, convenient, and comfortable travel or access for users of all ages and abilities regardless of their mode of transportation. This effort will support walking and bicycling within Fayetteville.
Outer Loop 4.0 Miles
Y AD GR
2.
Recognizes the physical constraints, context, and character of the surrounding built and natural environment. It recommends policies and projects that strengthen the pedestrian, bicycle, and vehicle transportation network within the LCI study area.
JEFFERSON AVE
Inner Core Loop 2.2 Miles
A Mobility Framework, detailed below, was formulated by NV5 to guide the future development and growth of Downtown Fayetteville. The overarching goal of this framework is to implement the desired public infrastructure investments within the city’s existing specifications for streets and roadways. These investments are needed to support more private developments in the downtown area and ensure all users of transportation networks leading to or from these developments can travel safely, reliably, and independently between them in adequate and accessible ways. The proposed framework should be used to rethink how existing street networks and public rights-of-way can be re-purposed or better utilized to move Fayetteville Forward into a future and prosperous community.
1.
HILLSDALE DR
N JEFF DAVIS DR
FO RR ES TA VE
Introduction
The proposed Mobility Framework for Fayetteville:
NG LY NN
ST
05.2 Mobility
Proposed Park Existing Park
Active Mobility Masterplan N
Existing Open Space
Parks and Open Space | Mobility | Capital Improvement | Built Environment
109
Downtown Fayetteville Livable Centers Initiative (LCI) Study
Overview | Analysis | Engagement | Vision | Recommendations | Implementation
Inner and Outer Loop Segments These three Mobility Framework guidelines will assist city staff with identifying a street design hierarchy so that mobility investments and place-making strategies are prioritized and applied within the LCI study area. Doing so will create unique pedestrian and storefront opportunities in targeted redevelopment locations as well as present several project recommendations that can enhance local mobility. This includes improved pedestrian and bicycle capacities through downtown, connecting residential and commercial areas with parks and open space, and creating stronger linkages to neighboring communities. Applying these approaches to Downtown Fayetteville will position the city for any future public transit investments and advance the city’s livability goals.
The Inner and Outer Loops are an assemblage of existing sidewalks and trails that enable travelers to walk, run, or bike around downtown Fayetteville’s inner core, connecting with the city’s cultural and historic assets. The loop system aims to connect the different sections of the downtown mixed use district through a cohesive pedestrian and cyclist paths that connect to the existing and proposed open spaces. As both loops path through the various character theme areas (see Section 04: Vision) , the trails would have a similar character in the respective areas as detailed below.
Purpose And Application The Outer Loop is envisioned to be identified by a unique wayfinding signage system and divided into two (2) distinctive segments: the Community Trail and the Ecology Trail.
The recommendations within the Mobility Framework are intended to provide a broad vision for streets within downtown Fayetteville and the LCI study area. It is intended to supplement and provide a baseline for decision-making on a case-by-case basis using the professional judgment of the designer. The recommendations provided herein offer directions for incorporating Complete Street principles and practices, especially as the city looks to finalize its Unified Development Ordinance (UDO) and update its Public Works Design Manual, other standards, and practices. Although these street typologies are focused on the LCI study area, they also may have wider application.
3
2
This section would have opportunities to highlight local art, artists and community members and groups including veterans and civil rights activists.
The built up character of the Fayetteville’s downtown area present unique challenges for implementing changes to its streets. However, new development on vacant parcels and redevelopment of existing land offer opportunities few cities will experience to remake their street system. It should be noted that implementation of the Mobility Framework’s recommendations is not one size fits all, and the recommendations provide a range of feasible, cost-effective approaches to achieving mobility facility design objectives. The street typologies presented are intended to illustrate how different travel modes can be balanced within an existing right-of-way while minimizing modification of the curb and drainage system, thereby minimizing cost of implementation. At the same time the street typologies offer preferred dimensions and treatments that may only be applicable when a roadway is being rebuilt. In practice, a specific design may more strongly emphasize some street design objectives while providing baseline treatments for others.
1
3
2
Trail Loops Character Map Photo Courtsey of Pannier Graphics.com
Project decisions will continue to be made through the combination of expert and community input, City Council direction, available resources, site conditions and other factors. Opportunities to reduce environmental impacts should be routinely considered, along with other project objectives. Broadly speaking, the city will seek to cost-effectively maximize the benefits to the public, to distribute street improvements equitably and to serve all members of the community.
3
Outer Loop: Ecology Trail Segment (The Edge + The Village) This section connects Fayette Elementary School and the Fayette County High school to the Southern Conservation Trust passing along the Pye Lake Watershed. This section of the outer loop would have synergy with the schools, including students using it for commute, opportunities for student work exhibitions. Also, there is an opportunity to connect with Southern Conservation Trust educational mission by providing educational markers and signage of natural landscapes such as flood plains and wetlands, as well as habitats and ecosystems.
Southern Conservation Trust Trail Trailhead’s are an important introduction to a facility. Their design can either support an overall theme for a trail or convey a story for a trail segment. Trailheads often include amenities such as trail maps, benches, trash receptacles, portalets , bike repair stations, etc. They also can be designed so that they provide parking for hikers who might arrive by car.
Outer Loop: Community Trail Segment (The Root)
1
Inner Loop: Historic Core Trail Segment (The Core) This inner loop is envisioned to be identified by a unique wayfinding signage system, emphasized by markers and signage of historic properties, landmark and events.
110
HKS | PEC | Office of Design | NV5 | Noell Consulting Group | Blue Cypress
Parks and Open Space | Mobility | Capital Improvement | Built Environment
111
Downtown Fayetteville Livable Centers Initiative (LCI) Study
Overview | Analysis | Engagement | Vision | Recommendations | Implementation
Major Type 1: Thoroughfare Major Type 2: Commercial Street Major Type 2: Commercial Boulevard Major Type 3: Mixed-Use
Framework
Commercial Street Type 2: Main Street
NG LY NN
Roadway Network Policy Recommendations
ST
Commercial Street Type 1: Connector
Commercial Street Type 3: Commercial Alley
FO RR ES TA VE
Residential Street Residential Boulevard
HILLSDALE DR
N PARK DR
RABBIT’S RUN
Shared Public Way
JEFFERSON AVE
Typical
KATHI AVE
Policy Recommendations HOOD AVE
Adopt a Complete Street Policy “Complete streets” refers to the concept that roadways should be designed with all users in mind, not just motorists. The policy should include language that addresses all users and travel modes, applies to all types of transportation projects, recognizes the importance of a complete street network, directs designers to use the latest design guidance, identifies specific implementation steps, and creates measurable performance standards to evaluate whether the policy is meeting its goals.
HOO D AV E
LAFAYETTE AVE
LEE ST
S GLYNN ST
1 Unified Development Ordinance (Draft), City of Fayetteville, GA. Chapter 300 - Land Development. Article 1. Street, Sidewalks, and Public Paces. Section 301.1-301.4. pp. 103-112. City of Fayetteville, GA, January 2021.
BE AU RE GA RD BLV D
Minor Streets. Minor Streets are used for local circulation in residential areas providing access to abutting property.
N JEFF DAVIS DR
JOHNSON AVE
CITY CENTER PKWY
VD D BL FIEL MAY MIE JIM
»
HOLLY AVE
JOHNSON AVE
HERATIGE PKWY
E AV
Collector Streets. Collector Streets channel local traffic into the major/minor collector and arterial system. Collectors provide circulation within residential subdivisions or commercial and industrial areas.
AVE KER BOO
HILL ST
W STONEWALL AVE
GA 54
Y AD GR
»
V IER A EE E LAN AV L AL W NE O ST
W LANIER AV
The City of Fayetteville, through their Unified Development Ordinance (UDO), prepared a simplified three (3) tiered street hierarchy, classifying all streets, roads, and highways1 as: Major Streets. Major Streets are intended to provide swift and safe movement of traffic through the community.
GEORGIA AVE
GA 54
A Street Typology can augment the traditional roadway functional classification method by providing a user-oriented classification system that goes beyond considering the street system as a mere conveyor of automobiles. The typology classification system focuses on contextual approaches to roadways that consider nearby land uses and multiple user groups that create a sense of place rather than solely focusing on traffic volumes and speeds as functional roadway design parameters.
»
CHURCH ST
VE
Street Typologies
UDO Streets
GEORGIA AVE
TIGER TRAIL
The traditional functional classifications of streets provide a hierarchy that correlates traffic flow to land access. Traffic volume, speed, and level of service provide the basis for roadway design criteria. However, this classification system falls short in considering non-vehicular users of the public right-of-way (pedestrians, bicyclists, and transit) and is void of context for how the street impacts adjacent land uses and vice versa.
LAFAYETTE A
Establish a Street Typology
FENWYCK CMNS
S
JE FF
DA VI S
DR
R YD DLE BRA
New Street Typologies
112
HKS | PEC | Office of Design | NV5 | Noell Consulting Group | Blue Cypress
Parks and Open Space | Mobility | Capital Improvement | Built Environment
N
113
Downtown Fayetteville Livable Centers Initiative (LCI) Study
Overview | Analysis | Engagement | Vision | Recommendations | Implementation
UDO Street Types The UDO street hierarchy establishes prerequisite minimums for roadway and street design to include dimensional requirements for right-of-way (ROW), surface pavement, and sidewalks. The UDO street hierarchy also establishes access requirements. It is within the boundaries of the UDO street hierarchy and typologies that the Fayetteville LCI’s proposed Mobility Framework sits.
Commercial Street Type 1: Connector
2.
Industrial Streets. A street serving primarily industrial developments.
3.
Commercial Streets. A street serving primarily commercial development.
4.
Residential Streets. A street primarily function to provide access to residential uses.
5.
Alleys. A public thoroughfare or way that provides a secondary means of access to abutting property.
Commercial
Major Streets. A street that provides swift and safe movements of traffic through the community. Commercial Street Type 2: Main Street
Commercial Street Type 3: Commercial Alley
Description
Transportation Function
Residential Street
UDO Street Types
Industrial
Mobility Framework Streets. The Mobility Framework’s proposes eleven (11) street design typologies for four (4) of the five (5) UDO street typologies (Industrial Streets were not included). The design variations have been matched to their principal UDO street typology to provide continuity between the UDO right-of-way and minimum pavement width requirements, and the Framework’s street design concepts. Each of the street typology variations is intended to provide design flexibility and to inform the reimagining and overall (re)design of streets, specifically within the LCI study area. Table 1 illustrates how the street design variations align with the City of Fayetteville’s existing UDO street classification hierarchy and street typology.
Transportation Function
Collector Streets
In addition to establishing a street hierarchy, the UDO also establishes five (5) street typologies. They include: 1.
Description
N/A
A secondary street network characterized by moderate traffic emphasizing moving people through and between neighborhood and access to property.
Emphasizes throughput
Streets characterized by a diverse mix of retail and office fronting the street, heavy foot traffic, and people using several types of transportation to circulate.
Balances access and throughput; pedestrians are priority
Small scale pedestrian-oriented streets characterized by low traffic and low speeds, a diverse mix of retail and office fronting the street, heavy foot traffic, bikes, and both nonmotorized and micro-mobility travel modes
Emphasizes access
N/A
N/A
Streets primarily serving residential areas characterized by relatively low traffic and low speeds, housing, separated walkways, and sometimes on-street parking
Emphasizes access; pedestrians are priority
Residential Street
Residential Boulevard
Major Streets Minor Streets
Major Thoroughfare
Major Type 2A:
Major Type 2B: Major Boulevard
Auto-oriented street characterized by large scale commercial land uses and moderate to high amounts of traffic that emphasizes throughput. Auto-oriented street characterized by a mix of smaller scaled commercial land uses and housing, moderate to high amounts of traffic, and that seeks to balance throughput and access.
Emphasizes throughput
Emphasizes throughput
Balances access and throughput
Residential Street
Streets primarily serving residential areas characterized by relatively low traffic and low speeds, housing, separated walkways, and sometimes on-street parking
Emphasizes access
Residential Alley
A small-scale street or alley with no curbs primarily used for vehicular access to adjacent residential properties either through individual garages, shared surface parking, or sharedmulti vehicle parking facilities.
Emphasizes access
Shared Public Way
A small-scale pedestrian-oriented street or alley with no curbs or separate areas for various types of transportation characterized by delivery vehicles, heavy foot traffic, bikes, and both and non-motorized and micro-mobility travel modes.
Alleys
Major Streets
Major Commercial
Auto-oriented street characterized by moderate to high amounts of traffic, and emphasis on throughput.
Residential Street
Major Type 1:
Major Type 3: Mixed-Use
Street characterized by a diverse mix of retail, housing, office and/or institutional land uses serving people using several transportation modes to circulate, but with increased motor vehicle demand.
Balances access and throughput
Emphasizes non-motorized access; pedestrians are priority
Table 1. UDO/Mobility Framework Street Typology Matrix
114
HKS | PEC | Office of Design | NV5 | Noell Consulting Group | Blue Cypress
Parks and Open Space | Mobility | Capital Improvement | Built Environment
115
Downtown Fayetteville Livable Centers Initiative (LCI) Study
Overview | Analysis | Engagement | Vision | Recommendations | Implementation
Place Types
Street Type Selection & Design
Place types represent the context of the surrounding area and are simplified categories that combine land use, development patterns, and density. Identifying the most appropriate place type—considering the existing and future context of an area—is the first step in selecting an appropriate street type. Individual projects may pass through several place types, which may require transitioning between multiple street types along the corridor.
The conventional approach to street design is based primarily on a roadway’s functional classification (arterial, collector, local, etc.). Functional classification is a surrogate for motor vehicle traffic volume and speed. Higher classifications (e.g., arterial streets) tend to carry higher volumes of traffic at higher speeds. Lower classifications (e.g., local streets) tend to carry lower volumes of traffic at lower speeds.1 However, there are several limitations to this approach, primarily:
The Fayetteville LCI area includes a variety of development patterns and land uses. A highly-simplified set of place types has been assembled in an attempt to capture and summarize development characteristics and describe their mobility attributes. The proposed zoning districts and place types are presented in Table 2 below along with descriptions of the idealized mobility characteristics.
Lack of Context Sensitivity
DMU Sub-District(s)
Place Type Activity Center
Historic Core
Mobility Description Areas with high amounts of circulation across and along streets, with a high proportion of people accessing buildings by walking or on bike
Mixed-Use Core Mixed-Use
Areas or corridors with a mix of uses, with people accessing buildings using multiple modes of transportation
Residential Neighborhood
Areas with single and multi-family homes, oftentimes with adjacent schools and parks
Neighborhood Residential
The City of Fayetteville anticipates adopting new character-based zoning districts within the LCI study area as a part of this work effort. The zoning districts encompass several place types and potential future land uses. Note, however, that place types relate to, but do not replace, the city’s zoning districts.
Step 2 - Transportation Function The current approach assumes a constant relationship between the amount of car traffic and the function of the street. However, two streets can carry the same amount of traffic but serve different functions. Streets through activity centers located near Fayetteville’s downtown core might emphasize access and lower speeds, while streets along the LCI study area’s periphery might emphasize throughput (the quick and efficient movement of people) at higher speeds.
Preparing for the Future Gateway Commercial Boulevard Commercial
Place types represent the context of the surrounding area and are simplified categories that reflect land use, development patterns, and density. The first step in selecting the appropriate street type is identifying the most appropriate place type. Planners and/or designers should take into consideration both the existing and future context of an area. Keep in mind that individual street projects may pass through multiple place types. This means that it may be necessary to transition between multiple street types along the corridor.
Access versus Throughput
Transitional Residential Mixed Use Neighborhood
The current approach lacks a consistent method for making street designs respond appropriately to the surrounding context. Take for example SR 54/Lanier Avenue West and North Jeff Davis Drive. Both roadways are classified as major streets, but exist in vastly different development contexts and should thus be designed differently. Under the current approach, it can be challenging to design major streets that support walkable, vibrant places.
Step 1 - Place Type
Commercial Center/Corridor
Areas oriented toward automobile traffic, with parking lots placed between streets and buildings
Table 2. Place Types
As Fayetteville continues to grow, it is important that streets are designed to be compatible with new development types (ex. walkable mixed use). The current street design approach is less conducive to designing streets that respond to and support such development patterns. Note: The Mobility Framework’s street typologies do not replace the traditional functional classification system which should still be used for federal funding and design purposes or where the city code requires it be utilized. All design parameters are subject to engineering review to ensure the safety and functionality of each system.
Street Type Selection Approach The recommended approach to street design will first take into consideration (1) the existing hierarchical street classification; (2) the context of the surrounding area (in the case of a greenfield or redevelopment project – the expected context of the surrounding area), and; (3) the intended function of the street. Ideally, this approach will result in streets designed to serve all anticipated users. The street type selection approach is comprised of three steps.
The transportation function of a street is determined first by identifying place type and secondly by conventional factors (e.g., traffic demand). Transportation function exists on a spectrum with one end emphasizing throughput and the other end emphasizing local access and small-scale, localized circulation. Throughput describes the efficient movement of people at greater distances, often at higher speeds. Safely maximizing throughput typically requires physically separating modes and limiting the number of intersections and driveways along a corridor. Access describes peoples’ ability to reach destinations and individual properties along a street by any mode. Access-oriented streets are typically lower-speed with higher levels of foot traffic. Transportation function may be determined by answering the following questions: »
Are there several destinations along the street?
»
How much foot or bike traffic (currently or potentially) is present?
»
Is the street an important cross-town travel link?
Step 3 - Street Types Street types, as applied herein, represent common combinations of place types and transportation functions. The street types presented within the Mobility Framework provide, offering a shortcut to address common street design situations with flexibility so that the LCI’s objectives might be implemented as envisioned. The street cross-section layouts included herein serve as starting points for the design of individual streets and include a range of parameters and set of priorities for the inclusion of various street elements (e.g., bike lanes versus on-street parking).
1 Street Types Selection and Design Parameters. Complete Street Ames. June 15, 2018.
116
HKS | PEC | Office of Design | NV5 | Noell Consulting Group | Blue Cypress
Parks and Open Space | Mobility | Capital Improvement | Built Environment
117
Downtown Fayetteville Livable Centers Initiative (LCI) Study
Overview | Analysis | Engagement | Vision | Recommendations | Implementation
Street Type Application The relationship between these place type, street function, and street type is shown in Figure 1. Street types are selected by first identifying the appropriate place type for the context, choosing the appropriate transportation function, and then selecting the resulting street type produced by the matrix. In some situations, multiple street type options are appropriate. Selecting between the multiple options requires considering the fine-grained context and constraints within the corridor.
Throughput Emphasis
Major Type 3: Mixed-Use Activity Center
N/A
Commercial Street Type 2: Main Street
Mixed-Use
Major Type 3: Mixed-Use
N/A
Commercial Street Type 2: Main Street
# of Travel Lanes
Pavement Width (min)
Center Turn Lane / Median
Bikeway Type
On-Street Parking
Place-Type
Major Street Type 1: Thoroughfare
80 ft
2-6
24 ft
Standard
Bike lane or shareduse path
None
Commercial Center/ Corridor
80 ft
2-4
24 ft
Optional
Bike lane or shareduse path
Optional
Commercial Center/ Corridor
Major Street Type 2B: Major Boulevard
Emphasis Access Commercial Street Type 3: Commercial Alley
Major Street Type 3 Mixed-Use
Shared Public Way
Commercial Street Type 3: Commercial Alley
Commercial Street
Residential Boulevard
Type 1: Connector
80 ft
60 ft
Shared Public Way
2-4
24 ft
2
24 ft
Residential
Commercial Street Type 1: Connector
60’
Residential Street Residential Alley
Optional
Not preferred
Shared roadway or
Optional, parallel pref.
shared-use path
Commercial Center/ Corridor
Bike lane or
Commercial Center/ Corridor
None Shared roadway
Residential
2
26 ft
Type 2: Main Street
Optional, Not preferred
Bike lane or Shared roadway
Parallel pref., angled
Major Type 1: Thoroughfare
Residential Boulevard
Major Type 2: Major Commercial
Major Type 3: Mixed-Use Commercial Street Type 1: Connector
Commercial Street Type 2: Main Street
Type 3: Commercial Alley
Activity Center 50’
No Centerline
20 ft
Not compatible
Shared roadway
Case-by-case design flexibility is built into the Mobility Framework and can be applied to any of the included street typologies by shifting street elements within the UDO right-of-way standards. The design parameters established by the UDO for each street type include minimum values which in most cases can accommodate the desired street design. In cases where values outside of the parameters are necessary or desirable to accommodate elements such as bicycles, paths, and on-street parking, the design engineer should consider and balance the needs of all modes, emphasizing safety above all else, and especially pedestrians and bicyclists. As mentioned in Step 1, land use contexts (and therefore place types) can change across the length of a corridor, and multiple street types may be applied to different segments of a single roadway. For example, a corridor may be primarily categorized as an Arterial Street, however a commercial node along it may result in a segment being classified as a Mixed Use Street. The street design elements will change accordingly, reflecting the designated street type and its economic and mobility objectives.
HKS | PEC | Office of Design | NV5 | Noell Consulting Group | Blue Cypress
Mixed-Use Commercial Center/ Corridor
Industrial Street
N/A
N/A
N/A
N/A
N/A
N/A
N/A
Residential Street
50 ft
No Centerline
20 ft
Not compatible
Shared roadway
Nondelineated
Residential
Residential Boulevard
50 ft
No Centerline
20 ft
Standard
Shared roadway
Nondelineated
Table 3. Place Types
118
None
Commercial Street Type 3: Commercial Alley Street
Mixed-Use Commercial Center/ Corridor
Commercial Street Commercial Center/ Corridor
Mixed-Use
Activity Center
Commercial Street Major Type 2: Major Boulevard
Activity Center
Bike lane or
Types
Place Type
Major Type 2: Major Boulevard
ROW Width (min)
Major Street Type 2A: Major Commercial
Transportation Function Balanced Access and Throughput
Mobility Framework Street Types
Residential Alley
20 ft
No Centerline
10 ft
Not compatible
N/A
None
Shared Public Way
20 ft
No Centerline
10 ft
Not compatible
N/A
None
Mixed-Use Residential Residential Activity Center Mixed-Use
Table 3. Street Typology Standards
Parks and Open Space | Mobility | Capital Improvement | Built Environment
119
Downtown Fayetteville Livable Centers Initiative (LCI) Study
Overview | Analysis | Engagement | Vision | Recommendations | Implementation
1. MAJOR STREET
12 FT TRAVEL LANE
12 FT TWTL
12 FT TRAVEL LANE
12 FT TRAVEL LANE
PROPERTY LINE 4 FT
11 FT
UTILITY / 6 FT SIDEWALK PLANTING BUFFER
SIDEWALK + GREEN BUFFER
12 FT SHARED TRAVEL LANE
12 FT TRAVEL LANE
12 FT TRAVEL LANE
12 FT TWTL
12 FT SHARED TRAVEL LANE
4 FT UTILITY / 6 FT PLANTING SIDEWALK BUFFER
80 FT ROW
PROPERTY LINE
12 FT TRAVEL SIDEWALK LANE + GREEN BUFFER
PROPERTY LINE
9 FT
PROPERTY LINE
1
PROPERTY LINE
PROPERTY LINE
1.1 Thoroughfare
2
Major Street Type 1: Thoroughfares Typical
N
1.1.1 Description Thoroughfares are are characterized by their size, high traffic volumes of fast-moving traffic, and emphasis on through-traffic.
Glynn Street North of Hood Ave Existing Condition
1.1.3 Place Type Commercial Center/Corridor
Major Street Thoroughfare Street Section Example
1.1.5 Transportation Function
1.1.7 Local Examples
Throughput Emphasis
1
SR 85/Glynn St north of Hood Ave
2
SR 85/Glynn St south of Beauregard Blvd
1.1.2 Priority Design User
1.1.4 Zoning DMU Sub-Districts
1.1.6 Considerations
Vehicles
Gateway Commercial (DMU-GC)
Traffic volume and speeds
(Future) Public Transit
Boulevard Commercial (DMU-BC)
Access management (driveway consolidation) Bicycle mobility and safety Pedestrian comfort and safety Future transit service access/mobility
120
HKS | PEC | Office of Design | NV5 | Noell Consulting Group | Blue Cypress
Parks and Open Space | Mobility | Capital Improvement | Built Environment
121
Downtown Fayetteville Livable Centers Initiative (LCI) Study
Overview | Analysis | Engagement | Vision | Recommendations | Implementation
1. MAJOR STREET
2
9 FT
12 FT TRAVEL SIDEWALK LANE + GREEN BUFFER
1
12 FT TRAVEL LANE
12 FT TWTL
12 FT TRAVEL LANE
12 FT TRAVEL LANE
11 FT
PROPERTY LINE
PROPERTY LINE
PROPERTY LINE
PROPERTY LINE
1.2A Major Commercial
6 FT 12 FT 6 FT UTILITY / SHARED TRAVEL LANE SIDEWALK PLANTING BUFFER
SIDEWALK + GREEN BUFFER
10 FT TRAVEL LANE
12 FT TWTL
10 FT TRAVEL LANE
12 FT SHARED TRAVEL LANE
6 FT 6 FT UTILITY / PLANTING SIDEWALK BUFFER
80 FT ROW
PROPERTY LINE
PROPERTY LINE
3
Image via Google Streetview Major Street 1.2A Major Commercial Typical
South Jeff Davis Existing Condition.
N
1.2A.1 Description Major Commercial Streets are are characterized by their size, high traffic volumes, fast-moving traffic, emphasis on through-traffic, and adjacency to dense concentrations of commercial land uses.
1.2A.3 Place Type Commercial Center/Corridor
Major Commercial Street Section and Plan
1.2A.5 Transportation Function
1.2A.7 Local Examples
Throughput Emphasis
1
SR 85/Glynn St between Hood Ave to LaFayette Ave
2
Jeff Davis Dr between Jefferson Ave and Fenwyck Comns
3
Jeff Davis Dr. between Johnson Ave and Jimmie Mayfield Blvd
1.2A.2 Priority Design User
1.2A.4 Zoning DMU Sub-Districts
1.2A.6 Considerations
Vehicles
Gateway Commercial (DMU-GC)
Traffic volume and speeds
(Future) Public Transit
Boulevard Commercial (DMU-BC)
Access management (driveway consolidation) Bicycle mobility and safety Pedestrian comfort and safety Future transit service access / mobility
122
HKS | PEC | Office of Design | NV5 | Noell Consulting Group | Blue Cypress
Parks and Open Space | Mobility | Capital Improvement | Built Environment
123
Downtown Fayetteville Livable Centers Initiative (LCI) Study
Overview | Analysis | Engagement | Vision | Recommendations | Implementation
1. MAJOR STREET
8 FT
2
SIDEWALK + GREEN BUFFER
12 FT TRAVEL LANE
12 FT TRAVEL LANE
14 FT MEDIAN
12 FT TRAVEL LANE
12 FT TRAVEL LANE
10 FT
PROPERTY LINE
PROPERTY LINE
1
PROPERTY LINE
PROPERTY LINE
1.2B Major Boulevard
8 FT SIDEWALK
SIDEWALK + GREEN BUFFER
6 FT GREEN BUFFER
12 FT SHARED TRAVEL LANE
10 FT TRAVEL LANE
8 FT MEDIAN
10 FT TRAVEL LANE
12 FT SHARED TRAVEL LANE
6 FT GREEN BUFFER
8 FT SIDEWALK
80 FT ROW
4
PROPERTY LINE
PROPERTY LINE
3
Major Street Type 1.2B: Major Boulevard Typical
North Jeff Davis Existing Condition.
N
1.2B.1 Description
1.2B.3 Place Type
Major Boulevard is are characterized by its size, high traffic volumes, fastmoving traffic, adjacency to dense concentrations of commercial land uses, and a center median. Major Boulevards emphasis both access to property and vehicular mobility.
Mixed-use
1.2B.2 Priority Design User
1.2B.4 Zoning DMU Sub-Districts
Major Boulevard Section and Plan
1.2B.5 Transportation Function
1.2B.7 Local Examples
Access and Throughput Balance
1
Jeff Davis Dr from SR 85 to Jefferson Ave
2
Jeff Davis Dr from Fenwyck Comns to Johnson Ave
3
SR 54 from East Study Area Boundary to Rising Star Montessori Academy
4
SR 54 from West Study Area Boundary to LaFayette Ave
Residential
1.2B.6 Considerations Traffic volume and speeds Vehicles
Mixed-Use Core (DMU-MUC)
Access management (driveway consolidation)
Non-motorized Travelers
Mixed-Use Neighborhood (DMU-MUN)
Bicycle mobility and safety
Transitional Residential (DMU-TR)
Pedestrian comfort and safety Future transit service access / mobility
124
HKS | PEC | Office of Design | NV5 | Noell Consulting Group | Blue Cypress
Parks and Open Space | Mobility | Capital Improvement | Built Environment
125
Downtown Fayetteville Livable Centers Initiative (LCI) Study
Overview | Analysis | Engagement | Vision | Recommendations | Implementation
1. MAJOR STREET
14 FT SIDEWALK + GREEN BUFFER
15 FT TURN LANE
12 FT TRAVEL LANE
12 FT TRAVEL LANE
12 FT TURN LANE
9 FT
PROPERTY LINE
PROPERTY LINE
PROPERTY LINE
PROPERTY LINE
1.3 Mixed-Use
6 FT SIDEWALK
SIDEWALK + GREEN BUFFER
12 FT 6 FT UTILITY / SHARED TRAVEL LANE PLANTING BUFFER
10 FT TRAVEL LANE
12 FT TWTL
10 FT TRAVEL LANE
12 FT SHARED TRAVEL LANE
80 FT ROW
6 FT 6 FT UTILITY / SIDEWALK PLANTING BUFFER
3
2
PROPERTY LINE
4
Image via Google Streetview
Major Street Type 1.3: Mixed-Use Typical
Mixed-Use Streets are are characterized by their emphasis on access to property and vehicular mobility and serve a variety of land uses ranging from low-intensity industrial uses to residences, shops, services, and offices. Mixed-use streets’ land uses and development character are constantly changing.
Vehicles Non-motorized Travelers (Future) Public Transit
Stonewall Ave West Existing Condition.
N
1.3.1 Description
1.3.2 Priority Design User
PROPERTY LINE
1
Mixed-Use Street Section and Plan
1.3.3 Place Type
1.3.5 Transportation Function
Activity Center
Access and Throughput Balance
Design flexibility to support land development Aesthetics, lighting, and street furnishing Integration of civic/public and green spaces
Mixed-use Commercial Center / Corridor
1.3.4 Zoning DMU Sub-Districts
1.3.6 Considerations
1.3.7 Local Examples
Traffic volume and speeds
1
Jeff Davis between Our Father’s House Florist and Johnson Ave
Local business access and freight loading/unloading
2
SR 85/Glynn St between LaFayette Ave and Beauregard Blvd
Access management to minimize vehicle/pedestrian conflicts
3
SR 54/Lanier Ave between Rising Star Montessori Academy and LaFayette Ave
4
SR 54/Stonewall Ave between LaFayette Ave and Booker Ave
Historic Core (DMU-HC) Mixed-Use Core (DMU-MUC) Bicycle mobility and safety Gateway Commercial (DMU-GC) Pedestrian comfort and safety
126
HKS | PEC | Office of Design | NV5 | Noell Consulting Group | Blue Cypress
Parks and Open Space | Mobility | Capital Improvement | Built Environment
127
Downtown Fayetteville Livable Centers Initiative (LCI) Study
Overview | Analysis | Engagement | Vision | Recommendations | Implementation
2. COMMERCIAL STREET
PROPERTY LINE
PROPERTY LINE
6
PROPERTY LINE
PROPERTY LINE
2.1 Connector
7 12 FT SIDEWALK + GREEN BUFFER
2 1
12 FT TRAVEL LANE
12 FT TWTL
12 FT TRAVEL LANE
10 FT SIDEWALK
12 FT SIDEWALK + GREEN BUFFER
8 FT UTILITY / PLANTING BUFFER
12 FT SHARED TRAVEL LANE
8 FT UTILITY / PLANTING BUFFER
10 FT SIDEWALK
60 FT ROW
8
11
12 FT SHARED TRAVEL LANE
4
9
PROPERTY LINE
3
5
PROPERTY LINE
10
Image via Google Streetview Commercial Street Type 2.1: Connector Typical
LaFayette Ave Existing Condition.
N
2.1.1 Description Connectors are streets that move people through and between neighborhoods. They connect to surrounding areas and land uses together. Connectors provide continuous walking and bicycling routes, becoming a secondary network of streets to the arterial street systems.
Connector Section and Plan
2.1.4 Zoning DMU Sub-Districts
Efficient vehicle movements/vehicle progression
Transitional Residential (DMU-TR)
Access management to minimize vehicle/pedestrian conflicts
Mixed-Use Neighorbohood (DMU-MUN)
Bicycle mobility and safety
Gateway Commercial (DMU-GC)
Pedestrian comfort and safety
2.1.2 Priority Design User
2.1.5 Transportation Function
Vehicles
Throughput Emphasis
4
City Center Pkwy | from City Hall East Driveway to SR 85/Glynn St South (Future)
5
Grady Ave | from SR 54 to SR 85/Glynn St South
6
North Park Drive | from SR 85/Glynn Street North to North Jeff Davis Drive
Aesthetics, lighting, and street furnishing
7
Kathi Ave/Hood Ave/Forrest Ave | from Hood/Forrest Ave Roundabout to N. Jeff Davis Drive
2.1.7 Local Examples
8
Georgia Avenue | from SR 85/Glynn Street North to Church Street
9
S. Jeff Davis Drive from Jimmie Mayfield Boulevard to End of Study Area
10
LaFayette Avenue Extension | from SR 85/Glynn Street North to Church Street (Future)
11
LaFayette Avenue Extension | from SR 54-Stonewall Avenue to City Center Parkway
1
Tiger Trail from SR 54/Stonewall Ave to Hood Ave
2.1.3 Place Type
2.1.6 Considerations
2
LaFayette Ave from Fayette County BOE Driveway to Tiger Trail
Residential
Property Access
3
City Center Pkwy | from Grady Ave to City Hall West Driveway (Future)
Commercial Center / Corridor
Traffic Speeds
128
HKS | PEC | Office of Design | NV5 | Noell Consulting Group | Blue Cypress
Parks and Open Space | Mobility | Capital Improvement | Built Environment
129
Downtown Fayetteville Livable Centers Initiative (LCI) Study
Overview | Analysis | Engagement | Vision | Recommendations | Implementation
2. COMMERCIAL STREET
6 FT
1
18 FT PARKING
SIDEWALK
16 FT SHARED TRAVEL WAY
10 FT PARALLEL PARKING
10 FT
PROPERTY LINE
PROPERTY LINE
PROPERTY LINE
PROPERTY LINE
2.2 Main Street
8 FT SIDEWALK
SIDEWALK
6 FT GREEN BUFFER
10 FT PARKING LANE
12 FT TRAVEL LANE
10 FT TRAVEL LANE
6 FT GREEN BUFFER
8 FT SIDEWALK
60 FT ROW
4
3
PROPERTY LINE
5
Image via Google Streetview
Commercial Street Type 2: Main Street Typical
N
2.2.1 Description Main Streets are defined by the character of the varied land uses surrounding them. These are generally oriented towards non-motorized travel and commercial store frontages serving people conducting daily errands, meeting with friends, shopping, and playing. Main Streets should comfortably accommodate many users, including pedestrians, bicyclists, and drivers.
Lee Street North of Stonewell Ave Existing Condition.
Main Street Section and Plan
2.2.3 Place Type
2.2.5 Transportation Function
2.2.7 Local Examples
Activity Center
Access and Throughput Balance
1
Church St from SR 85 to Georgia Ave
Mixed-Use
Access Emphasis (in commercial corridors / nodes)
2
Church St from North of SR 54/Lanier Ave to SR 54/Stonewall Ave
3
Lee St from SR 54/Lanier Ave to Johnson Ave
4
LaFayette Ave from SR 85/Glynn St North to Fayette County BOE Driveway
5
City Center Pkwy from City Hall West Driveway to City Hall East Driveway (Future)
Commercial Center / Corridor
2.2.6 Considerations 2.2.2 Priority Design User
PROPERTY LINE
2
2.2.4 Zoning DMU Sub-Districts Local business access and deliveries
Vehicles
Historic Core (DMU-HC)
Non-motorized Travelers
Mixed-Use Core (DMU-MUC)
Pedestrian comfort and safety Design flexibility to support land development Aesthetics, lighting, and street furnishing
130
HKS | PEC | Office of Design | NV5 | Noell Consulting Group | Blue Cypress
Parks and Open Space | Mobility | Capital Improvement | Built Environment
131
Downtown Fayetteville Livable Centers Initiative (LCI) Study
Overview | Analysis | Engagement | Vision | Recommendations | Implementation
2. COMMERCIAL STREET
6 FT
18 FT PARKING
26 FT SHARED TRAVEL WAY
PROPERTY LINE
PROPERTY LINE
PROPERTY LINE
PROPERTY LINE
2.3 Commercial Alley
10 FT SIDE PATH
SIDEWALK
6 FT FURNITURE ZONE
10 FT TRAVEL LANE
10 FT TRAVEL LANE
6 FT FURNITURE ZONE
8 FT SIDEWALK
50 FT ROW
1
4
2
PROPERTY LINE
PROPERTY LINE
3
Image via Google Streetview Commercial Street Type 2.3: Commercial Alley Typical
N
2.3.1 Description Commercial Alleys are low-speed small-scale streets oriented towards pedestrians and adjacent commercial land uses. Vehicles may use Commercial Alleys, but typicaly only in small numbers.
Bennett Street North of Stonewall Ave Existing Condition.
Commercial Alley Section and Plan
2.3.3 Place Type
2.2.5 Transportation Function
2.2.7 Local Examples
Activity Center
Access Emphasis
1
Mixed-Use 2
Twisted Taco Alley from SR 54 W. Lanier Ave to SR 54 W Stonewall Ave Johnson Ave from SR 85/Glynn St South to Lee St
2.3.2 Priority Design User
2.3.4 Zoning DMU Sub-Districts
2.2.6 Considerations
3
Bennett St from SR 54 W. Lanier Ave to SR 54 W Stonewall Ave
Non-motorized Travelers
Historic Core (DMU-HC)
Local business access and deliveries
4
City Hall Exit Extension from SR 54 W. Lanier Ave to SR 54 W Stonewall Ave
Mixed-Use Core (DMU-MUC)
Pedestrian comfort and safety Aesthetics, lighting, and street furnishing
132
HKS | PEC | Office of Design | NV5 | Noell Consulting Group | Blue Cypress
Parks and Open Space | Mobility | Capital Improvement | Built Environment
133
Downtown Fayetteville Livable Centers Initiative (LCI) Study
Overview | Analysis | Engagement | Vision | Recommendations | Implementation
3. RESIDENTIAL STREET
PROPERTY LINE
PROPERTY LINE
PROPERTY LINE
6
PROPERTY LINE
3.1 Residential Street
7
4 1
12 FT SIDEWALK + GREEN BUFFER
2
26 FT SHARED TRAVEL WAY
12 FT SIDEWALK + GREEN BUFFER
10 FT SIDE PATH
5 FT UTILITY / PLANTING BUFFER
10 FT TRAVEL LANE
10 FT TRAVEL LANE
50 FT ROW
5 FT UTILITY / PLANTING BUFFER
10 FT SIDE PATH
10 3
5
PROPERTY LINE
9 8
PROPERTY LINE
11
Image via Google Streetview Residential Street Type 3.1: Residential Street Typical
N
3.1.1 Description Residential Streets primarily serve neighborhoods. They are quieter than mixed-use and connector streets, and have relatively low traffic volumes and low speeds. Though they have minimal activity relative to other street types, Residential Streets play a key role in supporting the social life of a neighborhood.
3.1.2 Priority Design User
Church Street North of Lanier Ave Existing Condition.
Residential Street Section and Plan
3.1.4 Zoning DMU Sub-Districts
3.1.6 Considerations
Transitional Residential (DMU-TR)
Traffic Speeds
Mixed-Use Neighborhood (DMU-MUN)
Property Access
Neighborhood Residential (DMU-NR)
Pedestrian comfort and safety
Open Space / Conservation
Integration of Public and Green Spaces Aesthetics, lighting, and street furnishing
Non-motorized Travelers
3.1.3 Place Type
3.1.5 Transportation Function Access Emphasis
3.1.7 Local Examples 1
Georgia Ave from Church St to East Study Area Boundary
2
Church St from Georgia Ave to North of SR 54/Lanier Ave
Residential
134
HKS | PEC | Office of Design | NV5 | Noell Consulting Group | Blue Cypress
3
Lee St from Johnson Ave to Roadway End
4
LaFayette Ave from SR 54/Lanier Ave to Tiger Trail
5
Booker Ave from SR 54 to SR 54
6
Hillsdale Drive | from North Jeff Davis to East Study Area Boundary
7
North Park
8
East/West Johnson Avenue from Johnson Avenue to Jeff Davis Drive
9
North/South Johnson Avenue from Johnson Avenue to Jeff Davis Drive
10
Holly Avenue
11
Hill Street
Parks and Open Space | Mobility | Capital Improvement | Built Environment
135
Downtown Fayetteville Livable Centers Initiative (LCI) Study
Overview | Analysis | Engagement | Vision | Recommendations | Implementation
3. RESIDENTIAL STREET
12 FT TRAVEL LANE
VARIES GREEN BUFFER
PROPERTY LINE 5 FT SIDEWALK
3 FT GREEN / UTILITY BUFFER
14 FT SHARED TRAVEL LANE
6 FT MEDIAN
14 FT SHARED TRAVEL LANE
50 FT ROW
1
3 FT GREEN / UTILITY BUFFER
5 FT SIDEWALK
PROPERTY LINE
12 FT TRAVEL LANE
PROPERTY LINE
11 FT SIDEWALK + GREEN BUFFER
PROPERTY LINE
PROPERTY LINE
PROPERTY LINE
3.2 Residential Boulevard
Image via Google Streetview Residential Street 3.2: Residential Boulevard
N
Typical
3.2.1 Description Residential Boulevards primarily serve neighborhoods. They are quieter than mixed-use and connector streets, and have relatively low traffic volumes and low speeds. Like Residential Streets, Residential Boulevards play a key role in supporting the social life of a neighborhood.
Beauregard Boulevard North of Grady Avenue Existing Condition.
Residential Boulevard Section and Plan
3.2.3 Place Type
3.2.5 Transportation Function
Residential
Access Emphasis
3.2.4 Zoning DMU Sub-Districts
3.2.6 Considerations
Transitional Residential (DMU-TR)
Traffic Speeds
Mixed-Use Neighborhood (DMU-MUN)
Business Access
Neighborhood Residential (DMU-NR)
Bicycle mobility and safety
Open Space / Conservation
Pedestrian comfort and safety
3.2.7 Local Examples 1
Beauregard Boulevard | from City Center Parkway to Grady Avenue
3.2.2 Priority Design User Non-motorized Travelers
Integration of Public and Green Spaces Aesthetics, lighting, and street furnishing 136
HKS | PEC | Office of Design | NV5 | Noell Consulting Group | Blue Cypress
Parks and Open Space | Mobility | Capital Improvement | Built Environment
137
Downtown Fayetteville Livable Centers Initiative (LCI) Study
Overview | Analysis | Engagement | Vision | Recommendations | Implementation
4. ALLEYS
Residential Alleys are small-scale streets that typically only carry low numbers of vehicles accessing adjacent properties.
4.1.5 Transportation Function Access Emphasis
PROPERTY LINE
4.1.1 Description
PROPERTY LINE
4.1 Residential Alley
Note: This street typology to be incorporated in new developments or subdivisions.
4.1.6 Considerations
Vehicles
Residential Density
2 FT 6 INCHES ZONE
Residential
Integration of informal recreational / gathering spaces Property access and deliveries
4.1.4 Zoning DMU Sub-Districts
Lighting Utility services, e.g., Trash pickup
PROPERTY LINE
Sight lines/visibility
2 FT 6 INCHES ZONE
20 FT ROW
Accessibility / connectivity at more than one street
4.1.3 Place Type
15 FT SHARED TRAVEL LANE
PROPERTY LINE
4.1.2 Priority Design User
Mixed-Use Neighborhood (DMU-MUN) Neighborhood Residential (DMU-NR) Transitional Residential (DMU-TR)
4.1.7 Local Examples Any new residential neighborhood or subdivision to include mixeduse development
Residential Alley Section and Plan
138
HKS | PEC | Office of Design | NV5 | Noell Consulting Group | Blue Cypress
Parks and Open Space | Mobility | Capital Improvement | Built Environment
139
Downtown Fayetteville Livable Centers Initiative (LCI) Study
Overview | Analysis | Engagement | Vision | Recommendations | Implementation
4. ALLEYS
PROPERTY LINE
PROPERTY LINE
PROPERTY LINE
PROPERTY LINE
4.2 Shared Public Way
20 FT SHARED TRAVEL WAY
5 FT CLEAR ZONE
10 FT SHARED TRAVEL WAY
5 FT CLEAR ZONE
PROPERTY LINE
20 FT ROW
PROPERTY LINE
1
Image via Google Streetview Street Type 4.1: Shared Public Way Typical
Heritage Parkway Existing Condition.
N
4.2.1 Description
Shared Public Way Section and Plan
4.2.3 Place Type
4.2.5 Transportation Function
4.2.7 Local Examples
Shared public ways are public right-of-ways designed for pedestrian use. Small delivery vehicles and bicycles are also permitted to share the open space, but are not the emphasized user of these areas.
Activity Center
Access Emphasis
1
4.2.2 Priority Design User
4.2.4 Zoning DMU Sub-Districts
4.2.6 Considerations
Pedestrians
Historic Core (DMU-HC)
Local business access and deliveries
Mixed-Use Core (DMU-MUC)
Pedestrian comfort and safety
Mixed-Use Neighborhood (DMU-MUN)
Aesthetics, lighting, and street furnishing
140
Mixed-Use
HKS | PEC | Office of Design | NV5 | Noell Consulting Group | Blue Cypress
Heritage Pkwy from SR 54/Stonewall Ave to SR 85/Glynn St South
Parks and Open Space | Mobility | Capital Improvement | Built Environment
141
Downtown Fayetteville Livable Centers Initiative (LCI) Study
Overview | Analysis | Engagement | Vision | Recommendations | Implementation
Recommendations
NG LY NN
ST
05.3 Capital Improvements
In the absence of a Fayetteville street-specific design manual, the Mobility Framework recommends the Georgia Department of Transportation’s (GDOT) Pedestrian and Streetscape Guide be used to provide direction with best design practices for streets and roadways intended to support multi-modal travel. Further, the GDOT Plan Development Process1 and Plan Presentation Guide2 should also be consulted to ensure consistency across federal-aid, state and locally-funded transportation and streetscape projects.
HILLSDALE DR
N JEFF DAVIS DR
FO RR ES TA VE
HOOD AVE
JEFFERSON AVE
The recommendations that follow are based on existing transportation conditions analyzed and input gathered by the LCI project’s core team from public in-person and virtual meetings with the local community.
1.
New Roadway Connections
2.
Complete Street Enhancements
3.
Paths & Trails
4.
Pedestrian Safety Projects
5.
Inner and Outer Pedestrian Loops for Circulation Flow
CHURCH ST
Implement the following Capital Improvement Projects:
LAFAYETTE AVE
GA 54
R AV NIE E LA W LANIER AV W STONEWALL AVE
Descriptions for potential projects associated with each improvement project type, mentioned above, are illustrated in the image to the right and also detailed in the following pages.
GA 54
Y AD GR
S
S GL YNN ST
DA VI S
DR
LVD IELD B MAYF JIMMIE
R YD DLE BRA
State of Georgia Department of Transportation (2021). Plan Development Process Rev 3.3. Available from: http://www.dot. ga.gov/PartnerSmart/DesignManuals/PDP/PDP.pdf 2 State of Georgia Department of Transportation (2017). Plan Presentation Guide Rev 2.8. Available from: http://www.dot.ga.gov/ PartnerSmart/DesignManuals/Plan/Plan_Presentation_Guide.pdf
BEA UR EGA RD BLV D
E AV Roadway Projects 1
JE FF
Complete Streets Projects Trail and Path Projects Pedestrian Safety Projects
Capital Improvement Projects N
142
HKS | PEC | Office of Design | NV5 | Noell Consulting Group | Blue Cypress
Parks and Open Space | Mobility | Capital Improvement | Built Environment
143
Downtown Fayetteville Livable Centers Initiative (LCI) Study
Overview | Analysis | Engagement | Vision | Recommendations | Implementation
New Roadway Connections No.
Project Name
From
To
Description
1
City Center Parkway
Fisher Ave at SR 85/Glynn St S
Grady Ave
New roadway serving the Fayetteville City Hall complex, Walton Fayetteville Development and undeveloped land parcel
2
Beauregard Blvd Realignment
Beauregard Blvd
City Center Parkway
Realignment of Beauregard Boulevard from SR 85/Glynn Street to City Center Parkway
5
3
Fisher Avenue Extension
Lee St
Johnson Ave
Extend existing Fisher Avenue from Lee Street termini to Johnson Avenue
6
4
LaFayette Avenue South Extension
SR 54/Lanier Ave W
City Center Pkwy
New roadway connecting existing LaFayette Avenue Magnolia Office Park to City Center Parkway
7
5
LaFayette Avenue East Extension
SR 85/Glynn St
Church Ave
Extend existing LaFayette Avenue from SR 85/Glynn Street to Church Street
6
City Hall Drive Extension
SR 54/Lanier Ave W
SR 54/Stonewall Ave
New roadway connecting SR 54 /Lanier Avenue westbound to existing City Hall Driveway
7
Fayetteville Alleyway Project
SR 54/Lanier Ave W
SR 54/Stonewall Ave
New Alleyway between SR 54/Lanier Avenue and SR 54/ Stonewall Avenue, behind retail buildings.
7
4 1
3 2
Roadway Project
Complete Streets Enhancements No.
Project Name
From
To
Description
1
Hood Avenue/Kathi Avenue
SR 85/Glynn St N
Jeff Davis Dr
Bike lane / sharrow
2
West Georgia Avenue
SR 85/Glynn St N
Jeff Davis Dr
Close sidewalk gaps; sharrow
3
LaFayette Avenue
Campaign Tr
Church St
Bike lane / sharrow
4
Johnson Avenue
SR 85/Glynn St S
Jeff Davis Dr
Close sidewalk gaps; add sharrow
5
Tiger Trail
Hood Ave
SR 54 / Stonewall Ave W
Close sidewalk gap between Lanier Ave and Stonewall Ave; add sharrow
6
Church Avenue
Georgia Ave
SR 54 / Lanier Ave E
Sidewalk repair/improvement; sharrow
7
Jeff Davis Drive
Kathi Ave
Jimmie Mayfield Blvd
Upgrade sidewalk to sidepath; widen planting strip buffer; sharrow; formalize median with raised curb
8
Booker Avenue
SR 54 / Lanier Ave W
East Fayette Elementary
Sidewalk repair / improvement; pedestrian crossing at SR 54/ Stonewall Ave E
9
Heritage Parkway Shared Street
SR 54 / Stonewall Ave E
SR 85 / Glynn St S
Formalize as Commercial Shared Public Way
1
2
5
7
6 9 3
8 4
Complete Streets
144
HKS | PEC | Office of Design | NV5 | Noell Consulting Group | Blue Cypress
Parks and Open Space | Mobility | Capital Improvement | Built Environment
145
Downtown Fayetteville Livable Centers Initiative (LCI) Study
Overview | Analysis | Engagement | Vision | Recommendations | Implementation
Paths and Trails No.
Project Name
From
To
Description
1
Church Street Park Path
Church Street Park
Jeff Davis Dr
Multi-use pathway
2
Pye Lake Trail
City Center Pkwy
Pye Lake
Greenway trail, multi-use trail; side path
3
Bradford - Manassas Trail
City Center Pkwy
The Ridge Nature Preserve
Extend existing Fisher Avenue from Lee Street termini to Johnson Avenue
4
Southern Conservation Trust
City Center Pkwy
Grady Ave
Multi-use trail
5
City Center Trailhead
Pye Lake Trail at City Center Pkwy
Bradford-Manassas Trail at City Center Pkwy
Trailhead with parking
6
Booker Avenue Path
SR 54/Stonewall Ave E
Jeff Davis Dr / Booker Ave
Multi-use pathway
7
Fayetteville First Baptist Path
SR 54/Stonewall Ave E
Jeff Davis Dr
Multi-use pathway
8
Inner and Outer Loop Project
1
5
2
6
Assemblage of existing and proposed sidewalks and trails that enable travelers to walk, run, or bike around downtown Fayetteville’s inner core. For description of the project, see page 111.
3
7
4
Paths and Trail
Pedestrian Safety Projects No.
Project Name
From
To
Description
1
Ped Crossing Improvement
SR 54 / Lanier Ave W
Grady Ave
High-visibility crosswalk
2
Ped Crossing Improvement
SR 54 / Lanier Ave W
SR 85 / Glynn St S
High-visibility crosswalk; signal improvement
3
Ped Crossing Improvement
SR 54 / Stonewall Ave W
SR 85 / Glynn St S
High-visibility crosswalk; signal improvement
9
4 3
Pedestrian Safety Projects
146
HKS | PEC | Office of Design | NV5 | Noell Consulting Group | Blue Cypress
Parks and Open Space | Mobility | Capital Improvement | Built Environment
147
Downtown Fayetteville Livable Centers Initiative (LCI) Study
Overview | Analysis | Engagement | Vision | Recommendations | Implementation
1
Other Project Recommendations
IMPROVEMENT PROJECTS: PUBLIC SPACES Existing 1.
Rabbits Run
2.
Fenwyck Clubhouse
3.
May Harp Park
4.
Church Street Park
5.
Historic Fayette County Courthouse Lawn
6.
Heritage Park Gazebo
7.
Southern Ground Amphitheater
Pursue Shared Parking Ordinances
8.
Fayetteville City Cemetery
The City of Fayetteville should pursue shared parking agreements with the Fayette County Annex, the Fayetteville First Baptist Church, First United Methodist Church, and the Fayetteville First United Methodist Church as a cost-effective alternative to the construction of a new structured parking facility. Additional analysis of Downtown Fayetteville’s parking inventory and parking demands is needed to determine existing parking demand peak hours, surplus and deficits in available spaces, and optimal time frames for public or private events.
9.
Heritage Park Lawn
Establish Street Frontage Typologies, Improve Public Space Domains Street Frontage Typologies are inherent to identifying the function and purpose of streets in their area. Frontage Types are integral in creating the appropriate nexus between public and private realms within streets and blocks. Frontages types regulate how the private realm relates to the public domain, ensuring harmony between the two. Frontage type regulations determine what building types, public realm elements, and building elements are permitted or required based on the street’s development character. Frontage typologies include standards for sidewalks, street furniture, landscaping, outdoor retail displays, cafe areas, utilities, etc. Such standards allow the vision and goals articulated herein to be realized over time through incremental development practices and changing architectural styles and materials. The Built Environment and Zoning recommendations describe the frontage typologies and their locational application in more detail.
2 7 4 5 6 8 9
10. Fayette County Superior Courthouse Lawn 11.
3
10
Winesap Way Public Space
11
Proposed
5 1.
City Hall Greenway
2.
Tiger Trail Park
3.
Southern Conservancy Park
4.
Booker Pocket Parks
5.
Kathi Park
6.
Stonewall Park
2
1
4 6 3
Existing Public Spaces Proposed Public Spaces Existing Open Space
148
HKS | PEC | Office of Design | NV5 | Noell Consulting Group | Blue Cypress
Parks and Open Space | Mobility | Capital Improvement | Built Environment
149
Downtown Fayetteville Livable Centers Initiative (LCI) Study
Overview | Analysis | Engagement | Vision | Recommendations | Implementation
Improvement Projects: Street Parking 5 No.
Street Parking Locations and Spaces
Existing
Proposed
1
City Hall, Entrance Drive
0
112
2
City Hall, Exit Drive
0
67
3
City Center Parkway
0
123
4
Glynn Street, southbound direction
5
9
5
Glynn Street, northbound direction
7
7
6
Stonewall Street, facing courthouse
9
9
7
Stonewall Street, facing storefronts
5
7
8
Lee Street, facing courthouse
14
18
9
Lee Street, facing UMC
7
7
10
Lee Street, facing storefronts
7
7
54
366
Total Available Parking Spaces
8
4
9 10
6 1
7 2
Street Parking
3
Existing Public Spaces Proposed Public Spaces Existing Open Space Typical/Conventional Street
Improvement Projects: Shared Parking No.
Surface Parking Locations and Spaces
Existing Public Spaces
Proposed Shared Spaces
1
Library Lot
157
157
2
Fayette County Facility Lot
0
206
3
Lanier Avenue Lot
28
32
4
Fayetteville FBC Lot
0
51
5
Fayetteville UMC Lot 1
0
21
6
Fayetteville UMC Lot 2
0
71
7
Fayetteville UMC Lot 3
0
42
185
580
Total Available Parking Spaces
3 7 5
6 4 2
1
Street Parking Shared Surface Lot Parking Existing Public Spaces Proposed Public Spaces
1 Existing Open Space
ACRE 0.25
150
HKS | PEC | Office of Design | NV5 | Noell Consulting Group | Blue Cypress
N
Typical/Conventional Street
MILES
Parks and Open Space | Mobility | Capital Improvement | Built Environment
151
Downtown Fayetteville Livable Centers Initiative (LCI) Study
Overview | Analysis | Engagement | Vision | Recommendations | Implementation
Circulation Flow Summary
NEW STREET TYPOLOGIES
CAPITAL IMPROVEMENT PROJECTS
N
152
PUBLIC DOMAIN & PARKING
N
N
Arterial
Neighborhood
Typical
Roadway Projects
Trail and Path Projects
Outer Trail Loop
Street Parking
Proposed Public Spaces
Outer Trail Loop
Mixed-Use
Main Street
Outer Trail Loop
Complete Streets Projects
Pedestrian Safety Projects
Inner Trail Loop
Shared Surface Lot Parking
Existing Open Space
Inner Trail Loop
Commercial Boulevard
Commercial Alley
Inner Trail Loop
Existing Public Spaces
Typical/Conventional Street
Connector
Shared Public Way
HKS | PEC | Office of Design | NV5 | Noell Consulting Group | Blue Cypress
Parks and Open Space | Mobility | Capital Improvement | Built Environment
153
Downtown Fayetteville Livable Centers Initiative (LCI) Study
Overview | Analysis | Engagement | Vision | Recommendations | Implementation
Downtown Mixed Use District (DMU) The study area scope for the Livable Centers Initiative
05.4 Built Environment Zoning Update Overview
Introduction Purpose
Structure & Organization The Downtown Mixed Use Zoning Code is not a conventional zoning code like the zoning in other parts of the City. The subdistricts within Downtown Mixed Use Zoning Code are based on the existing and/or future character and built form of sections of Downtown rather than on the predominant type of land use permitted in that area. The Downtown Mixed Use Zoning Code regulates more aspects of the built environment than a conventional zoning code typically regulates. Each subdistrict has an intent statement that describes the general vision for the future of that subdistrict with respect to development, scale, open spaces, and other attributes. The opposite page show the proposed zoning map. The next pages describe the intents of each zoning district and the permitted building types within each district as well as outline the regulations within each zoning sub-district and provide architectural character references.
How To Apply The Development Guidelines?
Character Themes
LCI ZONING
The Downtown Mixed Use Zoning Code is intended to implement the overall aims of the Downtown Mixed Use District as set forth in the Unified Development Ordinance (cite), which is based on the City’s 2017 Comprehensive Plan vision for walkable, mixed use Downtown. The subdistricts that comprise the Downtown Mixed Use Zoning Code have their roots in the analyses depicted in the Moving Fayetteville Forward Living Cities Initiative Plan.
Themes for 5 sectors that reflect the past, the present and the future of the study area
Downtown Sub-districts (DMU- ) Classification of districts within the DMU that will codify the development pattern
The LCI Zoning encompasses four layers: the overall Downtown Mixed Use District, the character themes outlined in Section 04: Vision, the Downtown Sub-Districts, and the Regulations for each Permitted Building Type within a Sub-District. For each zoning district , development guidelines are detailed pertaining to the following: Zoning District Intent - The intent of the zoning regulations with respect to the form and character of development. Character Reference Area - The character(s) of the zoning district Adjacent Street Typologies - Which street typologies outlined in the mobility section are proposed within the said zoning district to understand the synergies between the street typologies, permitted building types and uses. Character Reference - This section outlines the desired building character in the district including architectural design guidelines. Permitted Building Types - This is a list of building typologies permitted Building Placement - Location of the building on the lot, including setbacks.
Building Types + Regulations Guidelines for the various aspects of site, buildings, open spaces and detail design
Building Form - Recommended height and massing of a building Site and Parking Access - Pedestrian and vehicular access to the building including parking and entrance location Supplemental Standards from Unified Development Ordinance (UDO) - Other relevant standards that should be followed in accordance to the UDO.
154
HKS | PEC | Office of Design | NV5 | Noell Consulting Group | Blue Cypress
The four layers of Fayetteville LCI zoning
Parks and Open Space | Mobility | Capital Improvement | Built Environment
155
Downtown Fayetteville Livable Centers Initiative (LCI) Study
Overview | Analysis | Engagement | Vision | Recommendations | Implementation
Historic Core (DMU-HC)
Zoning Map Mixed Use Core (DMU-MUC) Gateway Commercial (DMU-GC)
The following sub-districts are established for development within downtown areas and are collectively called the Downtown Mixed Use Zoning Code. These sub-districts achieve the purpose of consolidation while also maintaining the characteristic features of the different areas.
ST
Mixed Use Neighborhood (DMU-MUN)
NG LY NN
Boulevard Commercial (DMU-BC)
Historic Core (DMU-HC) Transition Residential (DMU-TR)
2.
Mixed Use Core (DMU-MUC)
3.
Gateway Commercial (DMU-GC)
Neighborhood Residential (DMU-NR)
4.
Mixed Use Neighborhood (DMU-MUN)
Open Space District (DMU-OS)
5.
Boulevard Commercial (DMU-BC)
Retain Existing Zoning
6.
Transition Residential (DMU-TR)
7.
Neighborhood Residential (DMU-NR)
8.
Open Space Conservation
FO RR ES TA VE
HILLSDALE DR
N JEFF DAVIS DR
1.
HOOD AVE
JEFFERSON AVE
SSTT R RATFORD ATFORD WAY WAY A
RUNNING M-1 LIGHT MANUFA CTURING BEAR TFR A M-1 LIGHT MANUFACTURING IL
HI H IG GH HW W
KELLY L DRIVE KELLY DRIVE
HEAV A Y MANUFA F CTURING HEAVY MANUFACTURING
PDP PDP
PLANNED PLANNED DEVELOPMENT DEVELOPMENT PROJECT PROJECT
PCDE PCD VENU
PLANNED COMMUNITY DEVELOPMENT DEVELOPMENT PLANNED COMMUNITY
OPEN SPACE SPA P CE OPEN
HUNTERS WALK HUNTERS WALK FEN W YCK COMMONS COMMONS FENWYCK
W
P RK PA
AY
GWINNETT GW INN ETT STREET STREET
PIN PINEECC
HH UU
S S
EET
HKS | PEC | Office of Design | NV5 | Noell Consulting Group | Blue Cypress
RMF-15 MULTI-FAMILY RESIDENTIAL RESIDENTIAL TOWNHOUSE CONDOMINIUM RESIDENTIAL PROFESSIONAL
EN CO DEN RD AR A
MO
MEDICAL OFFICE
URTY CO COUR LA N LA A R BOR A RB
OI
LAKESHORE DRIV OFFICE AND INSTITUTIONAL
C-1
DOWNTOWN COMMERCIAL
C-2
COMMUNITY COMMERCIAL
C-3
HIGHWAY COMMERCIAL
C C-3
CONDITIONAL C-3 WI N ON A D HIGH INTENSITY COMMERCIAL RI V E BUSINESS PARK
C-4 BP
RUNNING BEAR TR A M-1 LIGHT MANUFACTURING IL M-2
HEAVY MANUFACTURING
PDP
PLANNED DEVELOPMENT PROJECT
UE PCD EN O D AV
Y AY LI N N DA DA W WA LI
Existing Zoning Map 156
PPLL AACC EE
LLA AN NEE
M M EE AAD DO OW WB BR RO OOO
LAURIEN S TR
R ER TE N NT
ONE AND TWO FAMILY RESIDENTIAL
RP
UE E NU A EN AV LY AVE HOLL LLY HO R ER WE OW RT TO U RT T H E H E CO OU IV IG DR IV HIG K C H K DR
CCLL AARR EENN DDOO NN
CHURCH CHURCH STREET STREET JACK JACK K D. D. DETTMERING DE TTMER I NG
LLEE EE ST STR REET EET
STREET SOUTH N STREET S OU T H NN GLY G LYN
REG GA ARD URE RD E AU B BEA UR RTT OU C CO
LE
VA R
MEDFORD DRIVE
A WAY G WAY BURG WILL IAMS IAMSBUR WILL
D
A ENUE AV AVENUE
CE NT CE NT ER ER DR DR I VE I VE
AP
WALKE WALKER R
LY Y RL EARL EA T URT COUR CO
L ON G LONG A ENUE AV E AVENUE
SINGLE FAMILY RESIDENTIAL
DR-15
N
PLANNED COMMUNITY DEVELOPMENT
RD
REDEVELOPMENT DISTRICT
OS
OPEN SPACE
R YD DLE BRA
VEE SPA SPA PAR OV RRO ROW CO WS SC
Y Y A AV VE EN NU UE E
BENNETT BENNET TT STREET STREET
II
E
G G R RA AD D
NO RT H D RIVE NORTH DAV IS DRIVE JEFF JEF F DAVIS
TI TIG R AIL TR GER ER TRAIL
J OH NS ON A E N UE JOHNSON AV VENUE
R-70
GA 54
S
JE FF
DA VI S
DR
LD BLVD MAYFIE JIMMIE
CO URT XTON COURT BRAXTON BRAX
WALL AV A EWALL ENUE E WEST NE AVENUE WEST S TON STO
T ST S TON E WA STO NEW LL AV EA AS AV E ALL ENUE N UE E
G G
UE BOO KE BOO KER V EN EN UE R AV AV A R
T ET EET RE TR L SST LLL IL H HI
IILL RRAA TT
LAN NIER A V ENUE WEST WES ST LANIER AVENUE
R R
U EN NU AV VE ER RA N IIE LA AN L
SINGLE FAMILY RESIDENTIAL
E AV
D D
G N NG M MEE E E TT
EE
C AC LA PL P
R-40
W STONEWALL AVE
R-THC
ST EA A ST EE E
RA T
TERRAC TER R ACEE
T T O NE P AT H H O NE PAT
EET ET TR E STR SS NS HE EN PH EP S TE ST
SINGLE FAMILY RESIDENTIAL
Y AD GR
N GN AIIG PPA M M CCAA
DRIVE
OV E R ST ER ES T OV WE W NS O NS MO OM MM CO C
AV A VE UE EN NU E
SINGLE FAMILY RESIDENTIAL
R-30
LEE ST
EELLLL SSW WO O PPO OIN I NTT RRTTH H EE C O U RTT N IA L COUR COLO CO LONIAL LLIN IN NTT HHAA OONN D R CONCORD CO N C O LL HHOO LL T R U CO COURT LLLL OOW W K PA RK ON PARK CLAND CL A NDON
ID E TR EESIDE TREES E TER R AC CE TERRA
WAS SHIN HINGT WAS TON N GTO N STR STREE ET EET
EAST ENUE EAST AVENUE IA AV GIA RG R
R-22
W LANIER AV
N
E E T TT TE E
O EO G GE
SINGLE FAMILY RESIDENTIAL
LA
YY FFAA D SS RD LLAA CCAAMF OR MF O
MI LL PEPPER MILL PEPPER G LA ND I N G LANDIN
CARVER CARVER STR REET STREET
LE CLE RC IIR
SINGLE FAMILY RESIDENTIAL
R-15
R AV NIE E LA
R
AVE NU E RGI A AVENUE GEOR GEORGIA
R-10
O
GA 54
E
GE ORG GE ORGIA ENUE W IA A WE AV VENUE ES T ST
LAFAYETTE AVE F
B
PYE PYE COURT CO
OS OS
A
Main Street Parcels
ITTANY CHASE CHASE RITTANY BR B
UE A ENU AV AVENUE
T
Streets
GE L L AN AGE ANE RIA E C AR AR RI C
N N O O R R T TH H
R
M TI
REDEVELOPMENT REDEVELOPMENT DISTRICT DISTRICT
JEFFERSON AVENUE A ENUE AV JEFFERSON
M DRI DRIIV VE M E
A AY Y9 92 2
U
Legend
TT REEE PINE PINE ST STRE
RD RD
RA R BB AB BIT IT RUN RUN
NOR TH NOR ARK TH PA PARK DRIV DRIV E E
A HI KAT KATHI
M-2 M-2
ABERSH AA H HABERSH
BP BP
HA B ER SHAM HABERSHAM PLACE PLACE
CHURCH ST
CONDITIONAL C-3 CONDITIONAL C-3 WIN ON A D HIGH HIGH INTENSITY INTENSITY COMMERCIAL COMMERCIAL RIV E BUSINESS P RK BUSINESS PA PARK
C-4 C-4
HILLSDAL L E DRIVE DRIVE HILLSDALE
S GL YNN ST
C C-3 C C-3
RCHILL URCHILL H U COUR CH T C RT COUR
BEA UR EGA RD BLV D
HIGHWA WAY COMMERCIAL HIGHWAY COMMERCIAL
RT
COMMUNITY COMMUNITY COMMERCIAL COMMERCIAL
C-3 C-3
HONEYSUCKLE HONEYSUCKLE LANE LANE
CIRCLE DRIVE
C-2 C-2
G G
DOWNTOWN COMMERCIAL DOWNTOWN COMMERCIAL
F DA A VIS AV IS PL PLAC ACE E
INDUSTRIAL INDUSTRIAL WAY WAY A
LAKESHORE DRIVE E OFFICE AND AND INSTITUTIONAL INSTITUTIONAL OFFICE
C-1 C-1
AY LEE K EE KAYL RT COURT COU
E DRIVE
OI OI
G GLL YYN NN N
MEDICAL OFFICE MEDICAL OFFICE
JJE EFF F F DAV DAVIS IS
RESIDENTIAL RESIDENTIAL PROFESSIONAL PROFESSIONAL
MO MO
DD AARR W DDW AAYY
RP RP
SST D RIIV DR VE
The existing and new zoning maps have been illustrated for comparison so that the changes can be tracked as the ordinance gets enforced. The following pages are a comprehensive guide to both public officials and private developers to ensure that all new development is cohesive and represents the vision of the livable centers initiative both in the built environment and the public realm.
N
Proposed Zoning Map Parks and Open Space | Mobility | Capital Improvement | Built Environment
157
Downtown Fayetteville Livable Centers Initiative (LCI) Study
Overview | Analysis | Engagement | Vision | Recommendations | Implementation
Zoning Intent
Zoning District
Historic Core (DMU-HC)
Mixed Use Core (DMU-MUC)
Gateway Commercial (DMU-GC)
Mixed Use Neighborhood (DMU-MUN)
Character Theme Area
The Core
The Edge, The Core, The Gateway, The Root
The Gateway, The Edge, The Root
The Root, The Edge
Intent
The intent of this subdistrict is to preserve the historic character and scale of this area as expressed through the form and architecture of the existing historic building stock. New development in this area will be scaled and designed to complement the buildings located around the Old Fayette County Courthouse.
The intent of this subdistrict is to continue the evolution of this part of Downtown, in combination with the Historic Core, as the center of civic, commercial, social, cultural, and spiritual life in the City, where people can undertake a wide variety of activities, enjoy public open spaces, and walk safely and comfortably. New development in this district may be scaled slightly larger than the traditional mixed use buildings in the Historic Core and include a mix of uses with commercial activity on the ground level and residential units on upper levels.
These subdistricts are located at or near the edges of Downtown along one of the major corridors. The intent of this subdistrict is to encourage the development of prominent buildings with attractive facades and appealing commercial uses that would create a lively ambiance as people arrive into Downtown.
The intent of this subdistrict is to create pocket neighborhoods where a sufficient amount of land is available. Pocket neighborhoods are primarily residential in nature, consisting of a variety of residential building types along with some mixed use buildings with community-serving amenities, all of which are situated within a network of shared open spaces.
Zoning District
Boulevard Commercial (DMU-BC)
Transition Residential (DMU-TR)
Neighborhood Residential (DMU-NR)
Open Space District (DMU-OS)
Character Theme Area
The Gateway
The Edge, The Core, The Gateway, The Root, the Village
The Root, The Gateway
The Edge
Intent
The intent of this subdistrict is to preserve the existing character and form of the buildings and landscapes of the section of the N. Jeff Davis Drive corridor that is characterized by converted or purpose-built buildings with residential architectural styles containing commercial uses.
The intent of this subdistrict is to serve as a transition between a mixed use or commercial district and a low-intensity residential area through the development of multi-unit residential buildings.
The intent of this subdistrict is to preserve the character and scale of longstanding residential neighborhoods of detached houses while allowing for new residential building types including cottage houses, cottage courts, and duplexes
This district is intended to protect and preserve valued environmental, scenic, and historic resources within the city, as well as to accommodate agricultural and horticultural uses that require areas of open land on which to operate in order to minimize potential impacts upon neighboring uses.
158
HKS | PEC | Office of Design | NV5 | Noell Consulting Group | Blue Cypress
Parks and Open Space | Mobility | Capital Improvement | Built Environment
159
Residential Building Types
Open Space District
Neighborhood Residential (DMUNR)
Transition Residential (DMUTR)
Boulevard Commercial (DMUBC)
Mixed Use Neighborhood (DMU-MUN)
Building Matrix
Gateway Commericlal (DMU-GC)
Mixed Use Core (DMU-MUC)
Historic Core (DMU-HC)
Open Space District
Neighborhood Residential (DMUNR)
Transition Residential (DMUTR)
Boulevard Commercial (DMUBC)
Mixed Use Neighborhood (DMU-MUN)
Gateway Commericlal (DMU-GC)
Overview | Analysis | Engagement | Vision | Recommendations | Implementation
Mixed Use Core (DMU-MUC)
Building Matrix
Historic Core (DMU-HC)
Downtown Fayetteville Livable Centers Initiative (LCI) Study
Residential Building Types
HOUSE
DUPLEX
A detached structure consisting of one residential unit located on a lot.
A structure on a lot consisting of two residential units attached vertically or stacked horizontally.
CARRIAGE HOUSE
MULTIPLEX (FOURPLEX)
An accessory residential unit located to the side or rear of a house on the same lot.
A detached structure on a lot containing four dwelling units, two on the ground floor and two on the second floor, with shared or individual entrances from the street.
Image Credit: Platt Builders
COTTAGE COURT
MULTIPLEX (FIVE TO TWELVE)
A series of detached houses arranged around a shared open space.
A detached structure on a lot containing from five to twelve dwelling units, two on the ground floor and two on the second floor, with shared or individual entrances from the street.
Image Credit: rosschapin.com
Note: Building Type Guidelines should be studied along with Zoning District Guidelines. (insert link)
160
HKS | PEC | Office of Design | NV5 | Noell Consulting Group | Blue Cypress
Parks and Open Space | Mobility | Capital Improvement | Built Environment
161
Residential Building Types
Open Space District
Neighborhood Residential (DMUNR)
Transition Residential (DMUTR)
Boulevard Commercial (DMUBC)
Mixed Use Neighborhood (DMU-MUN)
Gateway Commericlal (DMU-GC)
Building Matrix
Mixed Use Core (DMU-MUC)
Historic Core (DMU-HC)
Open Space District
Neighborhood Residential (DMUNR)
Transition Residential (DMUTR)
Boulevard Commercial (DMUBC)
Mixed Use Neighborhood (DMU-MUN)
Gateway Commericlal (DMU-GC)
Overview | Analysis | Engagement | Vision | Recommendations | Implementation
Mixed Use Core (DMU-MUC)
Building Matrix
Historic Core (DMU-HC)
Downtown Fayetteville Livable Centers Initiative (LCI) Study
Mixed Use Building Types
TOWNHOUSES (ATTACHED)
MAIN STREET BUILDING
Three or more residential units that are attached vertically and that each have separate entrances.
An attached 2- to 3-story building with ground floor commercial space and residential or commercial space on upper floors.
TOWNHOUSES (STACKED)
LIVE/WORK BUILDING
Three or more residential units that arestacked horizontally.
An attached or detached structure consisting of one residential unit above or behind a fire-separated, flexible ground floor with a nonresidential use.
COURTYARD BUILDING
A building with ground floor commercial use and residential units on upper floors.
Multiple attached or stacked residential units with access from a shared courtyard.
MIXED USE BUILDING
Credits: Missing Middle Housing
Note: Building Type Guidelines should be checked along with zoning districts. (insert link)
162
HKS | PEC | Office of Design | NV5 | Noell Consulting Group | Blue Cypress
Parks and Open Space | Mobility | Capital Improvement | Built Environment
163
Commercial Building Types COMMERICAL HOUSE A converted house or purpose-built building designed like a house that contains a commercial use.
Open Space District
Neighborhood Residential (DMUNR)
Transition Residential (DMUTR)
Boulevard Commercial (DMUBC)
Mixed Use Neighborhood (DMU-MUN)
Gateway Commericlal (DMU-GC)
FLEX COMMERCIAL BUILDING A building with taller ceilings than a typical commercial building that can accommodate a variety of commercial and light industrial activities.
COMMERCIAL BUILDING (PROMINENT) A stately commercial building, typically a bank, designed with traditional architectural features.
Mixed Use Core (DMU-MUC)
Building Matrix
Historic Core (DMU-HC)
Open Space District
Neighborhood Residential (DMUNR)
Transition Residential (DMUTR)
Boulevard Commercial (DMUBC)
Mixed Use Neighborhood (DMU-MUN)
Overview | Analysis | Engagement | Vision | Recommendations | Implementation
Gateway Commericlal (DMU-GC)
Mixed Use Core (DMU-MUC)
Building Matrix
Historic Core (DMU-HC)
Downtown Fayetteville Livable Centers Initiative (LCI) Study
Public Building Types CIVIC BUILDING (SMALL) A minor government or institutional building.
COMMERCIAL BUILDING (SMALL) A single-story building containing a commercial use.
CIVIC BUILDING (PROMINENT) A distinctive government or institutional building.
MIXED COMMERCIAL BUILDING A two-story building consisting of the same or multiple commercial uses.
164
HKS | PEC | Office of Design | NV5 | Noell Consulting Group | Blue Cypress
Note: Building Type Guidelines should be checked along with zoning districts. (insert link)
Parks and Open Space | Mobility | Capital Improvement | Built Environment
165
Downtown Fayetteville Livable Centers Initiative (LCI) Study
Building Design Principles
Overview | Analysis | Engagement | Vision | Recommendations | Implementation
•
Monotnous repetition of the same architecture expression is discouraged, especially any wall surface over 30 feet in length should include at least one change in plane. Larger buildings shall be divided into bays of 25 to 40 foot widths that are articulated by pilasters, piers, differentiation in material, texture, or color, or by variations in the wall plane.
•
Styles that are not recommended include faux colonial reproductions employing the use of false columns and accent pieces along storefronts.
•
Materials should be selected based on their visual characteristics, quality, and durability. Carbon sequestering (the process of capturing and storing atmospheric carbon dioxide to reduce the amount of carbon dioxide in the atmosphere with the goal of reducing global climate change), urban heat island reducing, and locally sourced/ ethically made materials are ideal like lighter colored pavements/ white sealed asphalt where applicable. For examples of preferred materials, visit the mindful materials resource. The mindful materials Library aggregates product sustainability information while minimizing redundant effort on the part of both manufacturers and designers. Building Materials: Primary Materials: Not less than 80 percent of each street-facing Facade shall be constructed of one or more primary materials comprised of tested and proven, high quality, durable, and natural products. For Facades over 100 square feet, more than one Primary Material shall be used. Changes between Primary Materials must occur only at inside corners. The following are considered acceptable Primary Materials: Brick masonry; Native stone; Glass curtain wall. Accent Materials: The following Accent Materials may make up no more than 20% of the surface area on each Façade. Accent Materials are limited to: Pre-cast masonry (for trim and cornice elements only); Gypsum Reinforced Fiber Concrete (GFRC—for trim elements only); Recycled Metal (for beams, lintels, trim elements and ornamentation, and exterior architectural metal panels and cladding only); Glass block.
Buildings design should take into account the following design principles as per the UDO: a.
Size - the relationship of the project to its site.
b.
Scale - the relationship of the building to those around it.
c.
Massing - the relationship of the building’s various parts to each other.
d.
Fenestration - the placement of windows and doors.
e.
Rhythm - the relationship of fenestration, recesses and projection.
f.
Setback - the relation to setback of immediate surroundings.
g.
Materials - their compatibility with the surrounding developments.
h.
Context - the overall relationship of the project to its surroundings.
General Design Guidelines The following guidelines apply to all districts : •
A building’s massing should relate to its site location, use, and architectural context. The massing of a building can be defined as the overall geometry (length, width and height) of its perceived form. Massing is a significant factor that contributes to establishing the character of a specific building. Of particular importance in defining the massing of a building is the overall height of the form, both actual and perceived, as well as the geometry of the roof.
•
Continuous, street-facing facades shall have additional design elements such as variations in the width, height, and rhythm at the street level to add interest, enhance the building appearance, establish greater depth in the facade, and enliven the pedestrian realm. Blank walls that can be seen from any street (public or private) are prohibited.
•
Façade composition and color should be mindful of the existing context with no sharp contrast.
•
Roofs shall be expressed in a visually interesting manner that complements the existing buildings. With the exception of singlefamily residences, the use of awnings on buildings is encouraged to provide protection from sun, wind, and rain, and to improve aesthetics of the building exterior.
•
Franchise architecture for single or multiple buildings within a development should be avoided in order to create buildings that complement one another. Franchises or national chains should follow the guidelines to be compatible with the development in which it is located, utilizing similar architectural design, building materials or color selections to blend with the surrounding development.
166
•
•
These materials should not be used without prior approval: Metal building without a masonry base course or other architectural features; Prefabricated steel panels; Highly reflective, shiny, or mirrorlike materials; Mill-finish (non-colored) aluminum metal windows or doorframes; Aluminum, vinyl or fiberglass siding or roofing materials; Un-faced or painted concrete block; Pre-cast concrete panels or exposed, unfinished foundation walls; or Exposed plywood or particle board.
The Vision for moving Fayetteville Forward is to reimagine the possibilities in Downtown through catalytic equitable placemaking, enhanced legibility of the built environment, and creative guidelines for healthy, sustainable developments that will empower its diverse communities.
The Zoning ordinance and Design guidelines for each district have been graphically respresented in response to this vision. This provides a toolkit not only for developers and investors targeting specific development opportunities, but also for the Planning & Facilities Department of the City Of Fayetteville in terms of the permiting and approval process. The sheets are intended to be read in conjunction with the Unified Development Ordinance as they mutually inform each other.
The architecture and landscape design should represent cues from local climate, topography, history, and character, and incorporate modern, climate-sensitive, and environmentally-conscious design considerations to create healthier, more productive, and more sustainable places to live, work, play and rest.
HKS | PEC | Office of Design | NV5 | Noell Consulting Group | Blue Cypress
Parks and Open Space | Mobility | Capital Improvement | Built Environment
167
Downtown Fayetteville Livable Centers Initiative (LCI) Study
Overview | Analysis | Engagement | Vision | Recommendations | Implementation
1. Historic Core (DMU-HC) 1.05 Character
Potential Public Gathering Space
Reference: Rear Parking
se d-U xe i M 3: pe Ty r jo Ma
Co mm erc ial Str ee t
jor Ma
1.01 Intent
Typ e2 :M ain Str ee t
se d-U xe Mi : 3 pe Ty
Design Guidelines: Massing & Scale
Facade Composition
•
The preservation of existing historical building massing should be prioritized where possible.
•
Fenestration rhythm should not be extreme in difference to the existing vernacular of adjacent buildings.
•
When applicable, adaptive reuse should be considered after the structural integrity can be assessed.
•
Trim materials, glass, and details should appropriately match the character and quality of existing historic facades.
1.04 Street Typologies
•
Buildings need to conform to a three-part – base, middle, top – configuration.
•
High transparency at the ground level with visual connection to activity is strongly recommended in this district.
Major Type 1.3: Mixed-Use
•
Buildings shall feature an architecturally distinct base to address and enhance the meeting of the building and ground.
Common* * Except for Attached Townhouses open space requirement is Private space
Commercial Street Type 2.2: Main Street
1.02 Character Areas
•
Commercial Street Type 2.3: Commercial Alley Residential Street Type 3.1 Residential Street
•
•
•
168
HKS | PEC | Office of Design | NV5 | Noell Consulting Group | Blue Cypress
Roof Lines •
Roof forms of new buildings should be kept consistent with existing buildings. Gabled and hipped roofs are not appropriate for new structures in this district.
•
Gutters and downspouts of new construction should be kept consistent in appearance with historic gutters and downspouts. They should not obstruct windows or architectural details.
The massing of new construction in this district must be in the interest of walkability; ex. no large set backs from the sidewalk
Active Frontage The Core
Discouraged
Front Setbacks minimal to encourage building interaction with street
1.03 Open Space The intent of this subdistrict is to preserve the historic character and scale of this area as expressed through the form and architecture of the existing historic building stock. New development in this area will be scaled and designed to complement the buildings located around the Old Fayette County Courthouse.
X
Recommended
Storefront windows shall utilize a bulkhead or other design feature to transition the building to the ground and establish depth and interest in the façade. Building entrances shall be easily identifiable. When appropriate, buildings should incorporate changes in mass, surface, lighting, or finish to emphasize entranceways. Buildings should incorporate alcoves, arcade, awnings, covered walkways, porticoes, or roofs that protect pedestrians from the rain and sun.
Style & Materiality •
New construction shall utilize materials common on surrounding historic buildings where possible.
•
Innovative use of regular materials such as brick and stone is encouraged but not required. For example, An expressive pattern can be created in the front façade by offsetting the bricks used to create the typical bond, so they project from the surface or different color combinations can be used.
Parks and Open Space | Mobility | Capital Improvement | Built Environment
169
Downtown Fayetteville Livable Centers Initiative (LCI) Study
Overview | Analysis | Engagement | Vision | Recommendations | Implementation
1. Historic Core (DMU-HC)
C
A
Lot Limit
Lot Limit
C Street Typology as shown in 1.04
A
C
B
E
Lot Limit
C
Lot Limit
F E
B
B D
A
B
1.06 Permitted Bldg. Types
1.07 Building Placement A
1.08 Building Form
B
D
C
E
F
1.09 Site/Parking Access & Open Space
Front Setback (min/max)
Side Setback (min)
Rear Setback (min)
Front Lot Line Coverage (min)
Building Height (min/max)
Building Width (max)
Impervious Coverage of Lot (max)
Vehicular Access
Parking Location & Type
Pedestrian Access
Commercial Building (Small)
0 ft/10 ft
5 ft
15 ft
75%
1.5 stories
150 ft
80%
Rear Alley, Side Street, or Front
Rear Yard, Side Yard
Primary Entrance from Front
Commercial Building (Prominent)
0 ft/10 ft
10 ft
15 ft
75%
2 stories / 2.5 stories
150 ft
80%
Rear Alley, Side Street, or Front
Rear Yard, Side Yard
Primary Entrance from Front
Main Street Building / Live/Work Building
0 ft/10 ft
5 ft
5 ft
90%
2 stories / 3 stories
150 ft
90%
Rear Alley or Side Street
Rear Yard
Primary Entrance from Front
Civic Building (Small)
0 ft/10 ft
10 ft
10 ft
N/A
1.5 stories / 2 stories
N/A
80%
Rear Alley, Side Street, or Front
Rear Yard, Side Yard
Primary Entrance from Front
Civic Building (Prominent)
0 ft/10 ft
15 ft
15 ft
N/A
2.5 stories / 5 stories
N/A
60%
Rear Alley, Side Street, or Front
Rear Yard, Side Yard
Primary Entrance from Front
Townhouses (Attached)
0 ft/10 ft
0 ft between units, 10 ft min between buildings
25 ft
85%
2 stories / 3 stories
150 ft
70%
Rear Alley or Side Street
Rear Yard
Primary Entrances from Front
Multiplex (Fourplex)
0 ft/10 ft
5 ft
25 ft
85%
2 stories / 2.5 stories
50 ft
70%
Rear Alley Side Street
Rear Yard
Primary Entrance from Front
1.10 Supplemental Standards A. See Article 6. of UDO (Conditional Uses) for Conditional Uses. B. See Section 401.23. of UDO (Projections into Required Yards.) for Structural and Architectural Projections. C. See Section 401.29. of UDO (Accessory Buildings.) for Accessory Building Regulations. 170
D. See Section 401.35. of UDO (Fences and Walls) for Fencing and Wall Regulations.
G. See Section 402.43 of UDO (Loading area requirements) for Loading Requirements
E. See Section 401.36. of UDO (Height Exceptions.) for Height Limitation Exceptions.
H. See Section 403.19 of UDO (Site Design.) for Landscaping Requirements
F. See Section 402.8 of UDO (Off-street automobile parking) for Off-Street Parking Requirements
I. See Section 404.13. of UDO (Screening of Utilities and Trash Enclosures - Design Standards) for Screening Standards.
HKS | PEC | Office of Design | NV5 | Noell Consulting Group | Blue Cypress
J. See Chapter 400, Article 5. of UDO (Building and Site Lighting) of for Lighting and Fixture Requirements, Illumination Levels, and Fixture Mounting Height. H. See Section 406.18. of UDO (Signange - Downtown Mixed Use District) for Signage Regulations and Requirements
Parks and Open Space | Mobility | Capital Improvement | Built Environment
171
Downtown Fayetteville Livable Centers Initiative (LCI) Study
Overview | Analysis | Engagement | Vision | Recommendations | Implementation
2. Mixed Use Core (DMU-MUC) 2.05 Character Reference Active Roof
Mixed-Use Commercial Building
Reference:
Ma jor Ty pe 3: Mi xe dUs e
Rear Parking
Recommended
X
Discouraged
Proposed Transitional Park
Corner Plaza Pocket Park
Mixed-Use Commercial Live-Work
se d-U xe i M 3: pe Ty r o j Ma Mixed-Use Commercial
Rear Parking
2.01 Intent
2.03 Open Space The intent of this subdistrict is to continue the evolution of this part of Downtown, in combination with the Historic Core, as the center of civic, commercial, social, cultural, and spiritual life in the City, where people can undertake a wide variety of activities, enjoy public open spaces, and walk safely and comfortably. New development in this district may be scaled slightly larger than the traditional mixed use buildings in the Historic Core and include a mix of uses with commercial activity on the ground level and residential units on upper levels.
Common* * Except for Mixed Use Building open space requirement is Common (at top of building)
Massing & Scale
Major Type 1.2A: Major Commercial
The Edge
Residential Street Type 3.1: Residential Street
The Root
Residential Street Type 3.2: Residential Boulevard
The Threshold
Alley Type 4.2: Shared Public Way
Development located at signalized intersections of major streets shall include pedestrian-oriented, community serving commercial uses such as a bookstore, coffee shop, or local market.
•
Buildings shall be designed to accommodate a minimum first floor finished ceiling height of twelve feet (12’) to allow for retail commercial uses at the ground floor. The minimum interior depth of these commercial spaces shall be 25 feet.
•
Upper floors of mixed-use buildings shall be stepped back when adjacent to single-family residences to ensure and protect privacy.
Variations in the width, height, and rhythm of street-facing facades are encouraged along any block face.
•
Street-facing facades shall have additional design elements at the street level to add interest, enhance the building appearance, establish greater depth in the facade and enliven the pedestrian realm.
•
•
•
•
HKS | PEC | Office of Design | NV5 | Noell Consulting Group | Blue Cypress
In order to integrate new buildings with the existing urban fabric, new buildings are encouraged to incorporate pocket parks and attractive plaza areas between buildings that allow light to reach adjacent buildings.
Active Frontage
•
172
Upper stories, which are less likely to be occupied by retail tenants may have a smaller percentage of window opening area with window proportions different from ground level.
•
Commercial Street Type 2.1: Connector Commercial Street Type 2.3: Commercial Alley
The fenestration at the first floor of Mixed Use Core buildings should be composed of a 70% of window area in order to promote pedestrian-oriented uses with a high degree of transparency along the street. Uses shall be readily discernible to passers-by. Visually extend interior spaces outside through paving and glazing to create the concept of an indoor/ outdoor room
Buildings shall be located, designed, and programmed to activate open spaces, promote pedestrian activities, provide visual interest, and create an enjoyable, vibrant, and mixed- use environment
Major Type 1.2B: Major Boulevard
The Core
•
•
2.04 Street Typologies
Major Type 1.3: Mixed-Use
2.02 Character Areas
Design Guidelines:
Storefront windows shall utilize a bulkhead or other design feature to transition the building to the ground and establish depth and interest in the facade. Entrances have to be definied. Provide a transitional design feature(s) such as an opaque wooden barrier between public spaces and residential spaces at the ground floor to distinguish between the public and private realms.
Facade Composition
Roof Lines • •
Green roofs and gardens are highly encouraged. Activate any podium upper level with open stairwells and lively programs (Ex. Restaurants, entertainment, retail, etc.)
Style & Materiality • •
This district can include a mix of architecture styles ranging from contemporary to traditional. The monotonous repetition of details on the building facade is not recommended.
Parks and Open Space | Mobility | Capital Improvement | Built Environment
173
Downtown Fayetteville Livable Centers Initiative (LCI) Study
Overview | Analysis | Engagement | Vision | Recommendations | Implementation
2. Mixed Use Core (DMU-MUC)
A
Lot Limit
E
C
Lot Limit
C Street Typology as shown in 2.04
A
C
B
E
Lot Limit
C
Lot Limit
F
B
B D
A
B
2.06 Permitted Bldg. Types
2.07 Building Placement A
2.08 Building Form
B
D
C
E
F
2.09 Site/Parking Access
Front Setback (min/max)
Side Setback (min)
Rear Setback (min)
Front Lot Line Coverage (min)
Building Height (min/max)
Building Width (max)
Impervious Coverage of Lot (max)
Vehicular Access
Parking Location & Type
Pedestrian Access
Mixed Commercial Building
5 ft / 15 ft
5 ft
5 ft
75%
2 stories / 3 stories
200 ft
75%
Rear Alley, Side Street, or Front
Rear Yard, Side Yard
Primary Entrance from Front
Commercial Building (Prominent)
10 ft / 20 ft
10 ft
15 ft
N/A
2 stories / 2.5 stories
200 ft
75%
Rear Alley, Side Street, or Front
Rear Yard, Side Yard
Primary Entrance from Front
Mixed Use Building
5ft / 15 ft
10 ft
25 ft
90%
3 stories / 5 stories
200 ft
90%
Rear Alley, Side Street, or Front
Rear Yard, Side Yard
Primary Entrance from Front or Corner
Live/Work Building
5 ft / 15 ft
5 ft
5 ft
90%
2 stories / 3 stories
200 ft
90%
Rear Alley, Side Street, or Front
Rear Yard, Side Yard
Primary Entrance from Front
Civic Building (Prominent)
20 ft / No max
15 ft
5 ft
90%
3 stories / 4 stories
200 ft
70%
Rear Alley, Side Street, or Front
Rear Yard, Side Yard
Primary Entrance from Front or Side
Multiplex (Five to Twelve)
5ft / 15 ft
5 ft
25 ft
N/A
2 stories / 2.5 stories
80 ft
70%
Rear Alley, Side Street, or Front
Rear Yard
Primary Entrances from Front
Townhouses (Stacked)
5ft / 15 ft
5 ft
25 ft
N/A
3 stories / 4 stories
200 ft
70%
Rear Alley, Side Street, or Front
Rear Yard
Primary Entrance from Front
2.10 Supplemental Standards A. See Article 6. of UDO (Conditional Uses) for Conditional Uses. B. See Section 401.23. of UDO (Projections into Required Yards.) for Structural and Architectural Projections. C. See Section 401.29. of UDO (Accessory Buildings.) for Accessory Building Regulations. 174
D. See Section 401.35. of UDO (Fences and Walls) for Fencing and Wall Regulations.
G. See Section 402.43 of UDO (Loading area requirements) for Loading Requirements
E. See Section 401.36. of UDO (Height Exceptions.) for Height Limitation Exceptions.
H. See Section 403.19 of UDO (Site Design.) for Landscaping Requirements
F. See Section 402.8 of UDO (Off-street automobile parking) for OffStreet Parking Requirements
I. See Section 404.13. of UDO (Screening of Utilities and Trash Enclosures - Design Standards) for Screening Standards.
HKS | PEC | Office of Design | NV5 | Noell Consulting Group | Blue Cypress
J. See Chapter 400, Article 5. of UDO (Building and Site Lighting) of for Lighting and Fixture Requirements, Illumination Levels, and Fixture Mounting Height. H. See Section 406.18. of UDO (Signange - Downtown Mixed Use District) for Signage Regulations and Requirements
Parks and Open Space | Mobility | Capital Improvement | Built Environment
175
Downtown Fayetteville Livable Centers Initiative (LCI) Study
Overview | Analysis | Engagement | Vision | Recommendations | Implementation
3. Gateway Commercial (DMU-GC)
jor Ma
e Typ
ard lev ou B l ia erc mm o 2: C
(Prominent) Commercial Building
Front Vehicular Entrance with side parking to improve pedestrian experience
3.05 Character Reference Reference: Recommended
Public Plaza Activates the Street
Discouraged
Rear Parking
X
Primary Pedestrian Entrance from Front Plaza
Re sid en tia lS tre et
3.01 Intent
Side Vehicular Entrance
3.03 Open Space These subdistricts are located at or near the edges of Downtown along one of the major corridors. The intent of this subdistrict is to encourage the development of prominent buildings with attractive facades and appealing commercial uses that would create a lively ambiance as people arrive into Downtown.
Common
Design Guidelines: Massing & Scale
Facade Composition
•
•
Storefront windows shall utilize a bulkhead or other design feature to transition the building to the ground and establish depth and interest in the façade.
•
Provide human scaled architectural features is particularly important in areas where pedestrian activity is occurring or encouraged. The highest level of detail shall occur close to pedestrian areas, near streets and entries and around the ground floor.
Activate Frontage
3.04 Street Typologies
•
For buildings on a parcel abutting a primary street, the primary building entrance must face either: a.The primary street sidewalk; or b. A pedestrian-oriented outdoor space such as a public square, plaza, or courtyard
•
The ground-floor building walls facing a primary street shall provide transparent windows or doors with views into the building for a minimum of 60% of the building frontage between 2½ and 7 feet above the sidewalk and 90% of the transparent windows or doors area shall remain clear to allow views into the building unless the proposed use has unique operational characteristics which preclude building openings.
Major Type 1.1: Thoroughfare
3.02 Character Areas
Major Type 1.2A: Major Commercial Major Type 1.2B: Major Boulevard
The Threshold
Major Type 1.3: Mixed-Use
The Edge
Commercial Street Type 2.1: Connector
The Root
•
•
176
Building widths have to be broken into multiples of 50’ along major street and 100’ along secondary street to respond to pedestrian scale. For maximum width, refer zoning table.
HKS | PEC | Office of Design | NV5 | Noell Consulting Group | Blue Cypress
Buildings shall feature an architecturally distinct base to address and enhance the meeting of the building and ground. Building entrances shall be easily identifiable. When appropriate, buildings should incorporate changes in mass, surface, lighting, or finish to emphasize entranceways.
Roof Lines •
Green roofs and use of solar panels are highly encouraged in these low scale buildings.
•
Activate any podium upper level with open stairwells and lively programs (Ex. Restaurants, entertainment, retail, etc.)
•
Roof forms may be flat or sloped. All flat roofs shall employ trim, variation in brick coursing, a projecting cornice or projecting parapet to visually “cap” the building.
Style & Materiality •
This district should have a predominant architecture style that is contemporary and less traditional
•
The monotonous repetition of details on the building facade is not recommended and visual interest with mix of two primary materials is encouraged.
Parks and Open Space | Mobility | Capital Improvement | Built Environment
177
Downtown Fayetteville Livable Centers Initiative (LCI) Study
Overview | Analysis | Engagement | Vision | Recommendations | Implementation
3. Gateway Commercial (DMU-GC)
E
C
A
Lot Limit
A
E
Street Typology as shown in 3.04
A
C
B
Lot Limit
B
Lot Limit
C
Lot Limit
F
B A
D B
3.06 Permitted Bldg. Types
3.07 Building Placement A
3.08 Building Form
B
D
C
E
F
3.09 Site/Parking Access
Front Setback (min)
Side Setback (min)
Rear Setback (min)
Front Lot Line Coverage (min)
Building Height (min/max)
Building Width (max)
Impervious Coverage of Lot (max)
Vehicular Access
Parking Location & Type
Pedestrian Access
Commercial Building (Small)
30 ft
15 ft
15 ft
40%
1 story / 1.5 stories
N/A
60%
Side Street or Front
Rear Yard, Side Yard
Primary Entrance from Front
Commercial Building (Prominent)
30 ft
15 ft
15 ft
40%
2 stories / 2.5 stories
N/A
60%
Side Street or Front
Rear Yard, Side Yard
Primary Entrance from Front
Mixed Commercial Building
30 ft
15 ft
15 ft
40%
2 stories / 3 stories
N/A
60%
Side Street or Front
Rear Yard
Primary Entrance from Front
Flex Commercial Building
30 ft
15 ft
15 ft
40%
1 story / 3 stories
N/A
60%
Side Street or Front
Rear Yard, Side Yard
Primary Entrance from Front
3.10 Supplemental Standards A. See Article 6. of UDO (Conditional Uses) for Conditional Uses. B. See Section 401.23. of UDO (Projections into Required Yards.) for Structural and Architectural Projections. C. See Section 401.29. of UDO (Accessory Buildings.) for Accessory Building Regulations.
178
D. See Section 401.35. of UDO (Fences and Walls) for Fencing and Wall Regulations.
G. See Section 402.43 of UDO (Loading area requirements) for Loading Requirements
E. See Section 401.36. of UDO (Height Exceptions.) for Height Limitation Exceptions.
H. See Section 403-19 of UDO (Site Design.) for Landscaping Requirements
F. See Section 402.8 of UDO (Off-street automobile parking) for OffStreet Parking Requirements
I. See Section 404.13. of UDO (Screening of Utilities and Trash Enclosures - Design Standards) for Screening Standards.
HKS | PEC | Office of Design | NV5 | Noell Consulting Group | Blue Cypress
J. See Chapter 400, Article 5. of UDO (Building and Site Lighting) of for Lighting and Fixture Requirements, Illumination Levels, and Fixture Mounting Height. H. See Section 406.17. of UDO (Signange - Downtown Mixed Use District) for Signage Regulations and Requirements
Parks and Open Space | Mobility | Capital Improvement | Built Environment
179
Downtown Fayetteville Livable Centers Initiative (LCI) Study
Overview | Analysis | Engagement | Vision | Recommendations | Implementation
4. Mixed Use Neighborhood (DMU-MUN) 4.05 Character Reference
Access to trails and active spaces through network of walkways
Reference: Common spaces / Neighborhood green
X
Recommended
Discouraged
Community amenity building
St re et
Ty pe 1: Co nn ec to r
Cluster and courtyard configuration
4.01 Intent The intent of this subdistrict is to create pocket neighborhoods where a sufficient amount of land is available. Pocket neighborhoods are primarily residential in nature, consisting of a variety of residential building types along with some mixed use buildings with community-serving amenities, all of which are situated within a network of shared open spaces.
4.02 Character Areas
Image Credit: rosschapin.com
Co m m er cia l
Buildings oriented towards central common spaces
4.03 Open Space
Design Guidelines:
Open space that is commonly owned and managed by all residents of a pocket neighborhood is a key feature in fostering community. It is intended that it be adequately sized and centrally located with individual dwelling entrances oriented towards the open space.
Massing & Scale
Facade Composition
•
Each cluster shall contain a minimum of four and a maximum of twelve dwellings to encourage a sense of community.
•
•
It is recommended to raise cottages off the ground. When cottages are clustered close together, a few steps up to a porch allows for a visual separation between community space and private space.
Nested Houses configuration is encouraged to increase privacy in a cluster. Layout of homes should be with an open side and a closed side so that neighboring homes ‘nest’ together - with no window peering into a neighbor’s living space.
•
Fenestration rhythm should not be extreme in difference to the adjacent development. For example mixed use buildings should follow the windows and opening style of adjacent residential buildings. Trim materials, glass, and details should complement the character and quality of the residential vernacular.
At least 75 percent of the dwelling units of a pocket neighborhood shall abut a common open space; and all of the dwelling units shall be within 60 feet walking distance measured from the nearest entrance of the dwelling along the shortest safe walking route to the nearest point of the common open space. The common open space shall have dwellings abutting at least two sides.
Activate Frontage •
From each residential unit, clear access to any existing/future trail and sidewalk network is strongly recommended.
•
Every dwelling shall have a covered entry porch oriented toward the common open space or street. This porch shall be open on at least two sides, and shall not be enclosed. An exception is in mixed-use buildings that may have covered entry porches located off of an access alley lane
•
•
Gabled and hipped roofs are permitted. A mix of flat and sloped roofs are encouraged for diversity.
•
High transparency at the ground level with visual connection to activity is strongly recommended in this district for mixed use buildings
•
Gutters and downspouts of new construction should be kept consistent in appearance with other residential buildings in this district.
•
For residential units on the ground level, direct access to the sidewalk is recommended but not required.
4.04 Street Typologies
The Edge
Major Type 1.2B: Major Boulevard
The Root
Commercial Street Type 2.1: Connector Residential Street Type 3.1: Residential Street Alley Type 4.1: Residential Alley
Roof Lines
Style & Materiality •
New construction following a specific architectural vernacular is not required but should respect the existing buildings in the area.
•
Use of transparent material including but not limited to glass should be limited in this district for residential uses.
Alley Type 4.2: Shared Public Way
180
HKS | PEC | Office of Design | NV5 | Noell Consulting Group | Blue Cypress
Parks and Open Space | Mobility | Capital Improvement | Built Environment
181
Downtown Fayetteville Livable Centers Initiative (LCI) Study
Overview | Analysis | Engagement | Vision | Recommendations | Implementation
4. Mixed Use Neighborhood (DMU-MUN) C C
E
Street Typology as shown in 4.04
A
A
C
Lot Limit
B
E
Lot Limit
B
Lot Limit
Lot Limit
F
C
B D A
B
4.06 Permitted Bldg. Types
4.07 Building Placement
4.08 Building Form D
4.09 Site/Parking Access & Open Space
E
F
Front Lot Line Coverage (min)
Building Height (min/max)
Building Width (max)
Impervious Coverage of Lot (max)
25 ft
N/A
2 stories / 4 stories
150 ft
5 ft
25 ft
N/A
1.5 stories / 2 stories
10 ft
5 ft
25 ft
N/A
Multiplex (Five to Twelve)
10 ft
5 ft
25 ft
Townhouses (Attached)
10 ft
10 ft
Townhouses (Stacked)
10 ft
Courtyard Building
10 ft
A
B
C
Note: No more than 20% of lots in this district may be developed as duplexes to promote diverse housing
Front Setback from Common Open Space or Street (min)
Side Setback (min)
Rear Setback (min)
Mixed Use Building
10 ft
10 ft
Duplex
10 ft
Multiplex (Fourplex)
Vehicular Access
Parking Location & Type
Pedestrian Access
75%
Rear Alley, Side Street, or Front
Rear Yard or Shared Facility
Primary Entrance from Front
50 ft
75%
Rear Alley
Rear Yard or Shared Facility
Primary Entrance from Front
2 stories / 2.5 stories
50 ft
75%
Rear Alley
Rear Yard or Shared Facility
Primary Entrance from Front
N/A
2 stories / 2.5 stories
80 ft
75%
Rear Alley
Rear Yard or Shared Facility
Primary Entrance from Front
25 ft
N/A
2 stories / 3 stories
150 ft
75%
Rear Alley
Rear Yard or Shared Facility
Primary Entrance from Front
10 ft
25 ft
N/A
3 stories / 3.5 stories
150 ft
75%
Rear Alley
Rear Yard or Shared Facility
Primary Entrance from Front
10 ft
25 ft
N/A
3 stories / 3.5 stories
100 ft
75%
Rear Alley
Rear Yard or Shared Facility
Primary Entrances from Front
4.10 Supplemental Standards A. See Article 6. of UDO (Conditional Uses) for Conditional Uses. B. See Section 401.23. of UDO (Projections into Required Yards.) for Structural and Architectural Projections. C. See Section 401.29. of UDO (Accessory Buildings.) for Accessory Building Regulations.
182
D. See Section 401.35. of UDO (Fences and Walls) for Fencing and Wall Regulations.
G. See Section 402.43 of UDO (Loading area requirements) for Loading Requirements
E. See Section 401.36. of UDO (Height Exceptions.) for Height Limitation Exceptions.
H. See Section 403-19 of UDO (Site Design.) for Landscaping Requirements
F. See Section 402.8 of UDO (Off-street automobile parking) for OffStreet Parking Requirements
I. See Section 404.13. of UDO (Screening of Utilities and Trash Enclosures - Design Standards) for Screening Standards.
HKS | PEC | Office of Design | NV5 | Noell Consulting Group | Blue Cypress
J. See Chapter 400, Article 5. of UDO (Building and Site Lighting) of for Lighting and Fixture Requirements, Illumination Levels, and Fixture Mounting Height. H. See Section 406.17. of UDO (Signange - Downtown Mixed Use District) for Signage Regulations and Requirements
Parks and Open Space | Mobility | Capital Improvement | Built Environment
183
Downtown Fayetteville Livable Centers Initiative (LCI) Study
Overview | Analysis | Engagement | Vision | Recommendations | Implementation
5. Boulevard Commercial (DMU-BC) 5.05 Character Reference Side Vehicular Entrance
Reference:
Front Setback as Active Landscape
jor Ma
rd va ule o al B rci me m o :C e2 Typ
Prominent Commercial Building
5.03 Open Space The intent of this subdistrict is to preserve the existing character and form of the buildings and landscapes of the section of the N. Jeff Davis Drive corridor that is characterized by converted or purposebuilt buildings with residential architectural styles containing commercial uses.
Common
Design Guidelines: Massing & Scale
Roof Lines
•
•
A variety of pitched roofs are permitted to respect the residential character.
•
Gutters and downspouts of new construction should be kept consistent in appearance with other commercial buildings in this district.
5.04 Street Typologies
The massing of new construction in this district must be in the interest of walkability. Existing sidewalk networks should be well connected to new construction.
Activate Frontage Major Type 1.2A: Major Commercial Major Type 1.2B: Major Boulevard
5.02 Character Areas
•
From each parcel, clear access to any existing/future trail and sidewalk network is strongly recommended.
•
Porches and outdoor areas within the commercial parcels that are within sight lines of the existing sidewalk network should be mindful of the pedestrian experience.
•
The Threshold
If applicable, landscaping and native planting for larger front-yards is recommended with indication of type of business with clear signage.
Facade Composition
184
Discouraged
Rear Parking
Prominent Commercial Building
5.01 Intent
X
Recommended
Commercial House
HKS | PEC | Office of Design | NV5 | Noell Consulting Group | Blue Cypress
•
Façade composition and color should be mindful of existing buildings on Jeff Davis Drive and respond to traditional facade elements as seen in current conditions.
•
Fenestration rhythm should not be extreme in difference to the existing vernacular.
•
Trim materials, glass, and details should attempt to best match the character and quality of the commercial vernacular
Style & Materiality •
The predominantly white and grey combination of colors and materials to be complemented with new development.
•
Innovative use of common materials such as brick, stone, and metal is encouraged.
•
The use of transparent material (glass) should be limited in this district.
Parks and Open Space | Mobility | Capital Improvement | Built Environment
185
Downtown Fayetteville Livable Centers Initiative (LCI) Study
Overview | Analysis | Engagement | Vision | Recommendations | Implementation
5. Boulevard Commercial (DMU-BC) C
E
F C
Lot Limit
E
A
Lot Limit
B
A
Lot Limit
A
Lot Limit
C
Street Typology as shown in 5.04
A
C
D B
5.06 Permitted Bldg. Types
B
5.07 Building Placement A
D
B
5.08 Building Form
B
D
C
E
F
5.09 Site/Parking Access & Open Space
Front Setback (min)
Side Setback (min)
Rear Setback (min)
Front Lot Line Coverage (min)
Building Height (min/max)
Building Width (max)
Impervious Coverage of Lot (max)
Vehicular Access
Parking Location & Type
Pedestrian Access
Commercial House
65 ft
15 ft
25 ft
N/A
1 story /1.5 stories
N/A
75%
Front
Rear Yard
Primary Entrance from Front
Commercial Building (Prominent)
65 ft
15 ft
25 ft
N/A
2 stories / 2.5 stories
N/A
75%
Front
Rear Yard
Primary Entrance from Front
Carriage House (See UDO Sec. 206.63 Accessory Dwelling Unit)
5.10 Supplemental Standards A. See Article 6. of UDO (Conditional Uses) for Conditional Uses. B. See Section 401.23. of UDO (Projections into Required Yards.) for Structural and Architectural Projections. C. See Section 401.29. of UDO (Accessory Buildings.) for Accessory Building Regulations.
186
D. See Section 401.35. of UDO (Fences and Walls) for Fencing and Wall Regulations.
G. See Section 402.43 of UDO (Loading area requirements) for Loading Requirements
E. See Section 401.36. of UDO (Height Exceptions.) for Height Limitation Exceptions.
H. See Section 403.19 of UDO (Site Design.) for Landscaping Requirements
F. See Section 402.8 of UDO (Off-street automobile parking) for OffStreet Parking Requirements
I. See Section 404.13. of UDO (Screening of Utilities and Trash Enclosures - Design Standards) for Screening Standards.
HKS | PEC | Office of Design | NV5 | Noell Consulting Group | Blue Cypress
J. See Chapter 400, Article 5. of UDO (Building and Site Lighting) of for Lighting and Fixture Requirements, Illumination Levels, and Fixture Mounting Height. H. See Section 406.17. of UDO (Signange - Downtown Mixed Use District) for Signage Regulations and Requirements
Parks and Open Space | Mobility | Capital Improvement | Built Environment
187
Downtown Fayetteville Livable Centers Initiative (LCI) Study
Overview | Analysis | Engagement | Vision | Recommendations | Implementation
6. Transitional Residential (DMU-TR) 6.05 Character Reference
Attached Townhouses Side Vehicular Entrance
Reference: Recommended
X
Discouraged
Rear Parking Multiplex (Five to Twelve)
Maj or T ype 2:
Front Pedestrian Access
Com me rcia l
Bou leva rd
Multiplex (Five to Twelve)
Front Pedestrian Access
Side Vehicular Entrance
6.01 Intent The intent of this subdistrict is to serve as a transition between a mixed use or commercial district and a low-intensity residential area through the development of multi-unit residential buildings.
6.03 Open Space
Design Guidelines:
Common
Massing & Scale •
* Except with Duplex and Townhouses (Attached), open space is to be Private
6.04 Street Typologies Major Type 1.2A: Major Commercial
6.02 Character Areas The Core
Residential Street Type 3.1: Residential Street
Utilize a segmented facade treatment on larger buildings.
•
Vary the articulation of the massing.
•
•
Differentiate between the base of the building and the top of the building to enhance the pedestrian realm. Base treatments shall be cohesive across facades and integrated with the architectural character of the building.
•
The predominant building material may be complimented with other secondary materials used in limited areas of the facade to highlight architectural features.
•
Accent materials, which would generally not be acceptable on large areas of the facade, may be used in limited areas of the facade to highlight architectural features.
HKS | PEC | Office of Design | NV5 | Noell Consulting Group | Blue Cypress
Roof lines:
Provide a transitional design feature(s) between common spaces (lobbies, corridors, etc.) and residential spaces at the ground floor to distinguish between the public and private realms.
•
Porches, outdoor areas, and active frontages facing pedestrian areas are encouraged.
•
Front doors or common vestibules shall face a street or a courtyard that provides a publicly accessible and direct walkway to a street. Such courtyards shall be landscaped, shall generally exclude
Roof features, such as solar collectors, shall be designed and placed in a manner that is compatible and harmonious with the roof slope and overall architectural character of the building.
Style & Materiality
Activate Frontage •
The Threshold
188
Changes in wall planes, layering, horizontal datums, vertical datums, building materials, color, or fenestration shall be incorporated to create simple and visually interesting buildings in attached settings..
•
Alley Type 4.1: Residential Alley
The Village
Facade Composition •
Locate multiple buildings along any given block face.
The Edge The Root
Break up long, monotonous, uninterrupted walls if the buildings front the public realm, through at least one of the following methods :
•
Major Type 1.2B: Major Boulevard Commercial Street Type 2.1: Connector
vehicles, and shall be visible from a street where feasible.
Parks and Open Space | Mobility | Capital Improvement | Built Environment
189
Downtown Fayetteville Livable Centers Initiative (LCI) Study
Overview | Analysis | Engagement | Vision | Recommendations | Implementation
6. Transitional Residential (DMU-TR) C Street Typology as shown in 6.04
A
C
A
C
A
D A
6.06 Permitted Bldg. Types
B
B
6.07 Building Placement A
Note: On parcels with an area of 2 acres or more, at least 30 percent of the lots shall be developed as a Multiplex building type.
E
Lot Limit
B
Lot Limit
Lot Limit
F
Lot Limit
C
D
B
6.08 Building Form
B
D
C
E
F
6.09 Site/Parking Access & Open Space
Front Setback (min/max)
Side Setback (min)
Rear Setback (min)
Front Lot Line Coverage (min)
Building Height (min/max)
Building Width (max)
Impervious Coverage of Lot (max)
Vehicular Access
Parking Location & Type
Pedestrian Access
Duplex
15 ft
10 ft
30 ft
N/A
1.5 stories / 2.5 stories
50 ft
70%
Rear Alley, Side Street, or Front
Rear Yard
Primary Entrance from Front
Multiplex (Fourplex)
15 ft
10 ft
30 ft
N/A
2 stories / 2.5 stories
50 ft
70%
Rear Alley, Side Street, or Front
Rear Yard
Primary Entrance from Front
Multiplex (Five to Twelve)
15 ft
10 ft
30 ft
N/A
2 stories / 3.5 stories
80 ft
70%
Rear Alley or Side Street
Rear Yard
Primary Entrance from Front
Townhouses (Attached)
15 ft
10 ft
30 ft
N/A
2 stories / 3.5 stories
150 ft
70%
Rear Alley, Side Street, or Front
Rear Yard
Primary Entrance from Front
Townhouses (Stacked)
15 ft
10 ft
30 ft
N/A
3 stories / 4 stories
150 ft
70%
Rear Alley, Side Street, or Front
Rear Yard
Primary Entrance from Front
6.10 Supplemental Standards A. See Article 6. of UDO (Conditional Uses) for Conditional Uses. B. See Section 401.23. of UDO (Projections into Required Yards.) for Structural and Architectural Projections. C. See Section 401.29. of UDO (Accessory Buildings.) for Accessory Building Regulations.
190
D. See Section 401.35. of UDO (Fences and Walls) for Fencing and Wall Regulations.
G. See Section 402.43 of UDO (Loading area requirements) for Loading Requirements
E. See Section 401.36. of UDO (Height Exceptions.) for Height Limitation Exceptions.
H. See Section 403.30 - 403.31 of UDO (Street Tree and Internal Landscaping Requirements for New Subdivisions.) for Tree Placement and Landscaping Requirements.
F. See Section 402.8 of UDO (Off-street automobile parking) for OffStreet Parking Requirements
HKS | PEC | Office of Design | NV5 | Noell Consulting Group | Blue Cypress
J. See Chapter 400, Article 5. of UDO (Building and Site Lighting) of for Lighting and Fixture Requirements, Illumination Levels, and Fixture Mounting Height. H. See Section 406.17. of UDO (Signange - Downtown Mixed Use District) for Signage Regulations and Requirements
I. See Section 404.13. of UDO (Screening of Utilities and Trash Enclosures - Design Standards) for Screening Standards.
Parks and Open Space | Mobility | Capital Improvement | Built Environment
191
Downtown Fayetteville Livable Centers Initiative (LCI) Study
Overview | Analysis | Engagement | Vision | Recommendations | Implementation
7. Neighborhood Residential (DMU-NR) 7.05 Character Reference Shared Amenity (e.g. Community Garden)
Side Vehicular Entrance
Rear Parking
Reference: X
Recommended
Discouraged
t ree l St a i t en sid Re
Cottage Court
Front Pedestrian Access
7.01 Intent
Design Guidelines:
7.03 Open Space The intent of this subdistrict is to preserve the character and scale of longstanding residential neighborhoods of detached houses while allowing for new residential building types including cottage houses, cottage courts, and duplexes
Building Type
Open Space
House
Private
Cottage Court
Shared Courtyard
Duplex
Private or Common
7.04 Street Typologies 7.02 Character Areas
•
•
•
The Threshold The Root
Avoid and modulate long, monotonous, uninterrupted walls if the buildings front the public realm. Differentiate between the base of the building and the top of the building to enhance the pedestrian realm. Base treatments shall be cohesive across facades and integrated with the architectural character of the building.
Activate Frontage
Residential Street Type 3.1: Residential Street Alley Type 4.1: Residential Alley
•
Massing & Scale •
Provide a transitional design feature(s) between public spaces and residential spaces at the ground floor to distinguish between the public and private realms.
Gabled and hipped roofs are encouraged. If applicable, research on the desired vernacular is highly recommended.
Style & Materiality •
The architecture of new buildings should complement the vernacular architecture
•
The use of metal panel is discouraged.
•
Homogenous and monotonous architectural expressions not recommended.
•
Styles that are not recommended include faux colonial reproductions employing the use of false columns and accent pieces along storefronts
Porches, outdoor areas, and active frontages facing pedestrian areas are encouraged.
Facade Composition •
Changes in wall planes, layering, horizontal datums, vertical datums, building materials, color, or fenestration shall be incorporated to create simple and visually interesting buildings.
•
Blank, windowless walls in excess of 750 square feet are prohibited when facing a public street unless required by the Building Code.
•
In instances where a blank wall exceeds 750 square feet, it shall be articulated or intensive landscaping shall be provided.
Roof Lines
192
HKS | PEC | Office of Design | NV5 | Noell Consulting Group | Blue Cypress
Parks and Open Space | Mobility | Capital Improvement | Built Environment
193
Downtown Fayetteville Livable Centers Initiative (LCI) Study
Overview | Analysis | Engagement | Vision | Recommendations | Implementation
7. Neighborhood Residential (DMU-NR) C
E
Street Typology as shown in 7.04
A
C
A
C
A
7.07 Building Placement A
F
B
7.08 Building Form
B
D
C
E
F
7.09 Site/Parking Access & Open Space
Front Setback (min)
Side Setback (min)
Rear Setback (min)
Front Lot Line Coverage (min)
Building Height (min/max)
Building Width (max)
Impervious Coverage of Lot (max)
House
20 ft
10 ft
30 ft
N/A
1 story / 2.5 stories
50 ft
Cottage Court
20 ft
10 ft
25 ft
N/A
1 story / 1.5 stories (up to 2 stories for rear building)
Duplex
20 ft
10 ft
25 ft
N/A
1.5 stories / 2.5 stories
Note: On parcels with an area of 2 acres or more, at least 30 percent of the lots shall be developed as a permitted building type other than House.
Lot Limit
B B
7.06 Permitted Bldg. Types
E
Lot Limit
A
Lot Limit
B D
Lot Limit
C
Vehicular Access
Parking Location & Type
Pedestrian Access
70%
Rear Alley, Side Street, or Front
Rear Yard, Side Yard
Primary Entrance from Front
N/A
70%
Rear Alley, Side Street
Rear Yard
From Front through Shared Courtyard
50 ft
70%
Rear Alley, Side Street, or Front
Rear Yard
Primary Entrance from Front
7.10 Supplemental Standards C. See Section 401.29. of UDO (Accessory Buildings.) for Accessory Building Regulations.
F. See Section 402.8 of UDO (Off-street automobile parking) for OffStreet Parking Requirements.
D. See Section 401.35. of UDO (Fences and Walls) for Fencing and Wall Regulations.
G. See Section 402.43 of UDO (Loading area requirements) for Loading Requirements.
E. See Section 401.36. of UDO (Height Exceptions.) for Height Limitation Exceptions.
194
HKS | PEC | Office of Design | NV5 | Noell Consulting Group | Blue Cypress
H. See Section 403.30 - 403.31 of UDO (Street Tree and Internal Landscaping Requirements for New Subdivisions.) for Tree Placement and Landscaping Requirements.
H. See Section 406.17. of UDO (Signange - Downtown Mixed Use District) for Signage Regulations and Requirements. I. See Section 206.63. of UDO (Accessory Dwelling Unit (ADU)) for Residential Accessory Dwelling Unit Regulations and Requirements.
I. See Section 404.13. of UDO (Screening of Utilities and Trash Enclosures - Design Standards) for Screening Standards. J. See Chapter 400, Article 5. of UDO (Building and Site Lighting) of for Lighting and Fixture Requirements, Illumination Levels, and Fixture Mounting Height.
J. See Section 206.64. of UDO (Cottage Court for Tiny Homes) for Regulations and Requirements of Cottage Courts.
Parks and Open Space | Mobility | Capital Improvement | Built Environment
195
Downtown Fayetteville Livable Centers Initiative (LCI) Study
Overview | Analysis | Engagement | Vision | Recommendations | Implementation
8. Open Space District (DMU-OS) 8.05 Character Reference
Proposed Outer Loop
Reference: Recommended
Fayette Environmental Education Center (FEEC)
X
Discouraged
pe Ty et re St al ci er m om C or ct ne on C 1:
d levar l Bou entia Resid
Proposed Outer Loop
8.01 Intent This district is intended to protect and preserve valued environmental, scenic, and historic resources within the city, as well as to accommodate agricultural and horticultural uses that require areas of open land on which to operate in order to minimize potential impacts upon neighboring uses.
8.02 Character Areas
Design Guidelines:
The Edge
•
Preservation of natural landscapes and maintenance of areas for public interaction for health, wellness and recreational benefits
•
Impervious Surface Area limited to 10% beyond which no alteration of natural landscape is permitted
•
Plant species native to the Piedmont Region of Georgia only.
8.03 Street Typologies
•
Singlular non-native species such as grass lawns are not permitted.
•
Potential compatible Programs: Nature Preservation, Education, Horticulture, Play Areas
•
Environmental and geotechnical assessment have to be completed before any programmatic intervention.
Commercial Street Type 2.1: Connector Residential Street Type 3.2: Residential Boulevard
8.05 Supplemental Standards A. See Section 205.6. of UDO (Open Space District) for Open Space District Regulations, including Permitted Uses, Land Distrubance and Landscaping. B. See Chapter 200, Article 6. of UDO (Conditional Uses) for Conditional Uses. C. See Chapter 300, Article 2 (Watershed Management) Of Udo For Watershed Development Standards And Additional Design Requirements.
196
D. See Section 401.23. of UDO (Projections into Required Yards.) for Structural and Architectural Projections.
H. See Section 402.43 of UDO (Loading area requirements) for Loading Requirements.
E. See Section 401.35. of UDO (Fences and Walls) for Fencing and Wall Regulations.
I. See Section 403.8 - 403.14 of UDO (Tree Protection Standards.) for Tree Protection and Preservation Standards.
F. See Section 401.36. of UDO (Height Exceptions.) for Height Limitation Exceptions.
J. See Section 404.13. of UDO (Screening of Utilities and Trash Enclosures - Design Standards) for Screening Standards.
G. See Section 402.8 of UDO (Off-street automobile parking) for OffStreet Parking Requirements.
K. See Chapter 400, Article 5. of UDO (Building and Site Lighting) of for Lighting and Fixture Requirements, Illumination Levels, and Fixture Mounting Height.
HKS | PEC | Office of Design | NV5 | Noell Consulting Group | Blue Cypress
L. See Section 406.18. of UDO (Signange - Downtown Mixed Use District) for Signage Regulations and Requirements.
Parks and Open Space | Mobility | Capital Improvement | Built Environment
197
Downtown Fayetteville Livable Centers Initiative (LCI) Study
06 200
HKS | PEC | Office of Design | NV5 | Noell Consulting Group | Blue Cypress
Implementation
Downtown Fayetteville Livable Centers Initiative (LCI) Study
Overview | Analysis | Engagement | Vision | Recommendations | Implementation
Introduction The implementation matrix is created to be accountable to the initial questions put forth at the kick-off of the LCI Study. While each may be categorized in terms of priority, the overarching goal of implementation is to be intentional and calculated with each action item such that each builds off a previous action. Ultimately, the moving Forward Fayetteville Vision will be fulfilled through consistently acting on the tasks. Stakeholders and funding possibilities are listed as a starting point to initiate decisions by the City. Continuous community engagement will be key to keep the momentum.
Outer Loop 4.0 Miles
GA 54 N ST S GLYN
Pocket Park Transitional Park Space Create gateway to downtown
Inner Core Loop 2.2 Miles
N
Create gateway
City Hall Park
Potential catalytic site for mixed use development
R SD VI A D FF JE
WL to downtown Potential Public AN IER AV Gathering Space E
EL AN IER
ST ON EW AL LA VE
Transitional Park AV E
Southern Conservation Trust Trail
GA 54
ST S NN GLY
202
HKS | PEC | Office of Design | NV5 | Noell Consulting Group | Blue Cypress
Y M JIM
D EL FI Y A M
VD BL
Potential catalytic site for mixed use development
203
Downtown Fayetteville Livable Centers Initiative (LCI) Study
Overview | Analysis | Engagement | Vision | Recommendations | Implementation
EC. Existing Conditions How can we use current conditions to lead us to future possibilities? Priority
Item No.
Work Type
EC.01
Planning
Continue to ensure that the City of Fayetteville is adequately staffed and fully empowered to act
EC.02
Public Realm
Continue preservation of forest land next to the Southern Conservation Trust
EC.03
Development
Perform feasibility study of existing buildings and vacant or underutilized lots
Project High
EC.04
EC.05
EC.06
Development
Continue to create relationships with future business owners and developers
Planning
Continue coordination with Georgia Main Street program to commit to neighborhood and downtown revitalization
Public Realm
Rabbit's Run Improvement Project
Med
Low
Responsible Parties
How can we use current public space to lead us to future possibilities? Potential Funding Sources
Work Type
EC.07
Public Realm
EC.08
•
City of Fayetteville, landscape architect
Priority
Item No.
Responsible Parties
Potential Funding Sources
City of Fayetteville, landscape architect
General funds
•
City of Fayetteville, landscape architect
General funds
•
City of Fayetteville, landscape architect
Fundraiser events, general funds
•
City of Fayetteville, landscape architect
General funds
•
City of Fayetteville, landscape architect
General funds
•
City of Fayetteville, landscape architect
Project High
Public Realm
Med
Low
Fenwyck Clubhouse Improvement Project
•
May Harp Park Improvement Project
EC.09
Public Realm
Church Street Park Improvement Project
EC.10
Public Realm
Historic Fayette County Courthouse Lawn Improvement Project
EC.11
Public Realm
Heritage Park Gazebo Improvement Project
EC.12
Public Realm
Southern Ground Amphitheater Improvement Project
EC.13
Public Realm
Fayetteville City Cemetery Improvement Project
Public Realm
Heritage Park Lawn Improvement Project
Public Realm
Fayette County Superior Courthouse Lawn Improvement Project
Public Realm
Winesap Way Public Space Improvement Project
General funds
EC.14
EC.15
EC.16
Immediate Short-Term Long-Term
204
HKS | PEC | Office of Design | NV5 | Noell Consulting Group | Blue Cypress
205
Downtown Fayetteville Livable Centers Initiative (LCI) Study
Overview | Analysis | Engagement | Vision | Recommendations | Implementation
SM. Streets & Mobility How can we achieve balance between mobility and placemaking? Priority
Item No.
Work Type
SM.01
Public Realm
Create public/park space between amphitheater and downtown
SM.02
Public Realm
Create park space between E. Lanier Ave and S Jeff Davis Dr.
SM.03
Public Realm
Create transitional park along E. Lanier Ave and S Jeff Davis Dr.
SM.04
Public Realm
Create pocket park, playground, or community garden
Public Realm
Create gateway into downtown by improving N. Jeff Davis Dr. streetscape
SM.06
Mobility
Item No.
Work Type
•
City of Fayetteville, landscape architect
General funds
SM.09
Mobility
City Center Parkway - Fisher Ave at SR 85/Glynn St S to Grady Ave
•
City of Fayetteville, landscape architect
General funds
SM.10
Mobility
Beauregard Blvd Realignment
•
City of Fayetteville, landscape architect
General funds
SM.11
Mobility
Fisher Avenue Extension
•
City of Fayetteville, landscape architect
General funds
SM.12
Mobility
LaFayette Avenue South Extension
•
City of Fayetteville, Downtown Improvement Partnership, landscape architect
REBC, general funds, improvement district funding
SM.13
Mobility
SM.14
Mobility
•
City of Fayetteville Planning Department, landscape architect
Responsible Parties
Establish street frontage typologies
SM.07
Public Realm
Improve public space domains
SM.08
Mobility
Pursue shared parking ordinances
Priority
Potential Funding Sources
Project High
SM.05
How can we achieve balance between mobility of roadways and placemaking?
Med
• •
Low
Responsible Parties
Potential Funding Sources
•
Already underway. Developer and City of Fayetteville
Developer
•
Developer and City of Fayetteville
TSPLOST**, developer
City of Fayetteville
TSPLOST, general funds
•
Developer and City of Fayetteville
TSPLOST, developer
LaFayette Avenue East Extension
•
City of Fayetteville
TSPLOST
City Hall Drive Extension
•
City of Fayetteville
TSPLOST, general funds
City of Fayetteville and Downtown Development Authority (DDA)
TSPLOST, general funds/DDA funding
Project High
SM.15 TSPLOST, general funding, DDA
City of Fayetteville Planning Department
General funds
Mobility
Fayetteville Alleywall Project
REBC = Roadside Enhancement and Beautification Council grant
REBC = Roadside Enhancement and Beautification Council grant
TSPLOST = Transportation Special Purpose Local Option Sales Tax
TSPLOST = Transportation Special Purpose Local Option Sales Tax
TAP = Transportation Alternatives Program
TAP = Transportation Alternatives Program
LMIG = Local Maintenance & Improvement grant
LMIG = Local Maintenance & Improvement grant
HSIP = Highway Safety Improvement Program
HSIP = Highway Safety Improvement Program
STBG = Surface Transportation Block Grant Program
STBG = Surface Transportation Block Grant Program
206
HKS | PEC | Office of Design | NV5 | Noell Consulting Group | Blue Cypress
Low
•
General funds, LCI
City of Fayetteville, Downtown Development Authority (DDA)
Med
•
Immediate Short-Term Long-Term
207
Downtown Fayetteville Livable Centers Initiative (LCI) Study
Overview | Analysis | Engagement | Vision | Recommendations | Implementation
SM. Streets & Mobility
How can we achieve balance between paths, trails, and placemaking?
How can we achieve balance between complete streets and placemaking? Priority
Item No.
Work Type
Project
Responsible Parties High
SM.16
Mobility
SM.17
Mobility
SM.18
Mobility
•
Hood Avenue/Kathi Avenue Bike Lane/Sharrow
West Georgia Avenue Sidewalk/ Sharrow
Johnson Avenue Mobility Sidewalk/Sharrow
Tiger Trail SM.20
Mobility Sidewalk/Sharrow
Church Avenue SM.21
Mobility Sidewalk Improvement/Sharrow Jeff Davis Drive
SM.22
Mobility
Sidewalk Upgrades, Planting Strip Buffer, Sharrow, Raised Curb Booker Avenue
SM.23
Mobility
Sidewalk Upgrades, Pedestrian Crossing Heritage Parkway Shared Street
SM.24
Mobility Commercial Shared Public Way
City of Fayetteville
SM.25
Mobility
Church Street Park multi-use pathway
SM.26
Mobility
Pye Lake Trail greenway, multi-use trail, and sidepath
SM.27
Mobility
Bradford-Manassas Trail
SM.28
Mobility
Southern Conservation Trust multiuse trail
City of Fayetteville
TAP, LMIG, TSPLOST, general funds
•
City of Fayetteville
TAP, LMIG, general funds
SM.29
Mobility
City Center Trailhead and parking
•
City of Fayetteville
TAP, general funds
SM.30
Mobility
Booker Avenue multi-use pathway
City of Fayetteville
TAP, LMIG, general funds
• •
City of Fayetteville
•
City of Fayetteville
•
City of Fayetteville and Downtown Development Authority (DDA)
Southern Conservation Trust, landscape architect
TAP, Recreational Trails
Southern Conservation Trust, landscape architect
TAP, Recreational Trails
•
Southern Conservation Trust, landscape architect
TAP, Recreational Trails
•
City of Fayetteville, Developer, Southern Conservation Trust, landscape architect
Developer, TAP, general funds
City of Fayetteville Fayette County, landscape architect
TAP, TSPLOST
• • •
•
Responsible Parties
Potential Funding Sources
•
City of Fayetteville and GDOT
HSIP, TAP, LMIG, TSPLOST
SR-54/Lanier Ave W to SR-85/ Glynn St S-visibility crosswalk and signal improvement
•
City of Fayetteville and GDOT
HSIP, TAP, LMIG, TSPLOST
SR-54/Stonewall Ave W to SR-85/ Glynn St S-visibility crosswalk and signal improvement
•
City of Fayetteville and GDOT
HSIP, TAP, LMIG, TSPLOST
Work Type
SM.31
Mobility
SR-54/Lanier Ave W to Grady Avevisibility crosswalk
SM.32
Mobility
SM.33
Mobility
Project High
TAP, TSPLOST, general funds
REBC = Roadside Enhancement and Beautification Council grant
TSPLOST = Transportation Special Purpose Local Option Sales Tax
TSPLOST = Transportation Special Purpose Local Option Sales Tax
TAP = Transportation Alternatives Program
TAP = Transportation Alternatives Program
LMIG = Local Maintenance & Improvement grant
LMIG = Local Maintenance & Improvement grant
HSIP = Highway Safety Improvement Program
HSIP = Highway Safety Improvement Program
STBG = Surface Transportation Block Grant Program
STBG = Surface Transportation Block Grant Program
HKS | PEC | Office of Design | NV5 | Noell Consulting Group | Blue Cypress
TAP, GA Rec. Trails
Low
Priority
Item No.
REBC = Roadside Enhancement and Beautification Council grant
208
City of Fayetteville, landscape architect
Med
How can we achieve balance between pedestrian safety and placemaking?
TAP, REBC, general funds
TAP, TSPLOST, general funds/DDA funding
Potential Funding Sources
High
Potential Funding Sources
TAP, LMIG, general funds
Responsible Parties
Project
TAP, LMIG, TSPLOST, general funds
•
Bike Lane/Sharrow
Low
Work Type
City of Fayetteville
•
LaFayette Avenue
SM.19
Med
Priority
Item No.
Med
Low
Immediate Short-Term Long-Term
209
Downtown Fayetteville Livable Centers Initiative (LCI) Study
Overview | Analysis | Engagement | Vision | Recommendations | Implementation
How can we achieve balance between proposed public space and placemaking? Item No. Priority
Item No.
Work Type
Project
Responsible Parties High
Med
Low
Public Realm
SM.35
Public Realm
Proposed Tiger Trail Park
SM.36
Public Realm
Proposed Southern Conservancy Park
Public Realm
Proposed Booker Pocket Parks
SM.38
Public Realm
Proposed Kathi Park
SM.39
Public Realm
Proposed Stonewall Park
SM.37
Proposed City Hall Greenway
•
City of Fayetteville, landscape architect
• • • • •
City of Fayetteville, landscape architect
General funds
City of Fayetteville, landscape architect
General funds
City of Fayetteville, landscape architect
General funds
City of Fayetteville, landscape architect
General funds
City of Fayetteville, landscape architect
General funds
Priority Work Type
Project
Responsible Parties High
Med
Low
SM.48
SM.49
SM.50
SM.51
Mobility
City Hall, Entrance Drive
SM.41
Mobility
City Hall, Exit Drive
SM.42
Mobility
City Center Parkway
SM.43
SM.44
SM.45
SM.46
210
Mobility
Mobility
Mobility
Mobility
• • •
City of Fayetteville
• •
Glynn Street southbound
Stonewall Street facing courthouse
Stonewall Street facing storefronts
General funds
City of Fayetteville
General funds, developer
•
City of Fayetteville, Downtown Development Authority (DDA)
General fund/DDA funding
City of Fayetteville, Downtown Development Authority (DDA)
General fund/DDA funding
•
City of Fayetteville, Fayette County Library System, Downtown Development Authority (DDA)
City/County general funds, DDA Funding
•
City of Fayetteville, Fayette County Government, Downtown Development Authority (DDA)
City/County general funds, DDA funding.
•
City of Fayetteville, Downtown Development Authority (DDA)
General fund/DDA funding
•
City of Fayetteville, Downtown Development Authority (DDA)
General fund/DDA funding
•
City of Fayetteville, Downtown Development Authority (DDA)
General fund/DDA funding
•
City of Fayetteville, Downtown Development Authority (DDA)
General fund/DDA funding
•
City of Fayetteville, Downtown Development Authority (DDA)
General fund/DDA funding
Lee Street, facing courthouse
Mobility
Mobility
Mobility
Mobility
Lee Street, facing UMC
Low
•
Lee Street, facing storefronts
Library Lot
Fayette County Facility Lot
Mobility
Lanier Avenue Lot
SM.53
Mobility
Fayetteville FBC Lot
SM.54
Mobility
Fayetteville UMC Lot
SM.55 LMIG, STBG
•
City of Fayetteville, Downtown Development Authority (DDA), GDO
LMIG, STBG, general fund/DDA funding
•
City of Fayetteville, Downtown Development Authority (DDA), GDO
HKS | PEC | Office of Design | NV5 | Noell Consulting Group | Blue Cypress
General fund/DDA funding
Med
LMIG, STBG
City of Fayetteville, GDOT
Glynn Street northbound
Mobility
General funds
City of Fayetteville
City of Fayetteville, GDOT
•
City of Fayetteville, Downtown Development Authority (DDA)
High
Potential Funding Sources SM.52
SM.40
Potential Funding Sources
General funds
How can we achieve balance between street parking and placemaking? Item No.
Responsible Parties
Project
Potential Funding Sources SM.47
SM.34
Priority Work Type
LMIG, STBG, general fund/DDA funding
SM.56
Mobility
Mobility
Fayetteville UMC Lot 2
Fayetteville UMC Lot 3
REBC = Roadside Enhancement and Beautification Council grant
HSIP = Highway Safety Improvement Program
TSPLOST = Transportation Special Purpose Local Option Sales Tax
STBG = Surface Transportation Block Grant Program
TAP = Transportation Alternatives Program LMIG = Local Maintenance & Improvement grant
Immediate Short-Term Long-Term
211
Downtown Fayetteville Livable Centers Initiative (LCI) Study
Overview | Analysis | Engagement | Vision | Recommendations | Implementation
CE. Community Engagement
DG. Design Guidelines
What involvement and engagement opportunities work well in Fayetteville?
What are the components for a holistic solution that harmonizes the built environment and the public realm?
Priority
Item No.
Work Type
Project
Responsible Parties High
CE.01
Community
Potential Funding Sources
Med
Low
Create digital platform for community to leave comment on future projects to be implemented
CE.02
Community
Strategize how to involve community comment on future projects to be implemented
CE.03
Community
Create framework for guiding how community can be involved in future project implementation
CE.04
Community
Host annual events to establish relationships with developers
CE.05
Community
Create a portion of website dedicated for prospective business owners
Priority
Item No.
Work Type
DG.01
Planning
Establish a street typology guide
DG.02
Planning
Adopt architectural design guidelines
DG.03
Planning
Adopt a Complete Street policy
Project
Responsible Parties High
Med
Z. Zoning What method(s) will lead the type of development and overall place envisioned for the Main Street District?
MA. Market Analysis
Priority
Item No.
Work Type
Z.01
Planning
Priority Work Type
MA.01
Planning
Responsible Parties High
MA.02
MA.03
MA.04
MA.05
212
Project
Perform inventory of existing funding, pipeline funding, and opportunities for funding
Development
Create strategy for land acquisition for capital improvements
Development
Strategize recruitment of third parties to examine market conditions of first-degree priority projects
Development
Development
Med
Low
HKS | PEC | Office of Design | NV5 | Noell Consulting Group | Blue Cypress
Potential Funding Sources
•
City of Fayetteville
Recommend hiring third party zoning consultant.
•
City of Fayetteville
Recommend hiring third party zoning consultant.
•
City of Fayetteville
Recommend hiring third party zoning consultant.
•
City of Fayetteville
Recommend hiring third party zoning consultant.
High
Potential Funding Sources
Establish code to align with City's ordinance structure as Sec 202.6, Downtown Mixed-Use Zoning
Med
Low
Modify schedule of land uses within UDO to account for each of the DMU subdistricts;
Z.02
Planning
Remove placeholders within tables throughout UDO dedicated for the DMU districts; Change the language under Sec 202.6 to refer to the Downtown Mixed-Use Zoning document
Z.03
Planning
Revise the UDO
Planning
Adopt Downtown Mixed-Use Zoning Ordinance and Revised UDO
Create RFQs for project developers Create RFPs for architectural design of key catalytic sites
Responsible Parties
Project
How can we ensure that our plans are grounded in market and financial reality?
Item No.
Low
Potential Funding Sources
Z.04
213
Downtown Fayetteville Livable Centers Initiative (LCI) Study
Short-Term vs. Long-Term Projects in Moving Fayetteville Forward When faced with implementation, it is often viewed as a direct relationship between money and impact. However, in the collective vision for Fayetteville, it is possible to flip that script: what happens if actionable items become prioritized by the center of the vision compass?
Overview | Analysis | Engagement | Vision | Recommendations | Implementation
Time-Based Implementation Relationship with Vision Compass [Note: only "high" priority classified projects represented below]
Nature
As each action item in the previous tables was evaluated, it was determined that some were addressing a specific direction of the vision compass, while others were located toward the center, able to address every direction. The radial priority matrix seeks to address that the actionable items in the center need the most immediate attention and can happen much faster than the other items: many of these items are policy-based recommendations that other action items might play off of.
EC.15 EC.06 EC.07
Within the matrix, each high priority item falls within a zone: "Long Term”, "Short Term", and "Immediate." Immediate items are listed at the bottom as they are the most important first steps toward implementation. Other items that are important but might take more time/planning, such as many items that fall under mobility, are located on the outer rings.
EC.08
SM.02
SM.03
EC.02 EC.14
SM.07 SM.29
Te r
Imme dia t
SM.08 DG.04 DG.03
DG.01
DG.02
Z.03 Z.02
SM.21
Sh or t
EC.03
e
SM.14
Te rm
m
SM.37 SM.38 SM.39
SM.25 SM.16 SM.11 SM.17 SM.18 SM.10 SM.20SM.19
Walkability
g
EC.11
SM.27
The matrix allows the city, as well as stakeholders, to visualize each action item's place on the matrix while seeing how each is able to be tied directly back to the original vision. While it is ideal that each project is able to be implemented eventually, the radial priority matrix takes the highest priority items from the table and shows that each may take a different amount of time.
Lo n
Z.01
EC.01
SM.47 SM.48 SM.49
MA.01
Economy SM.53 MA.02 SM.54 SM.56
CE.02 SM.31 SM.32 SM.33
CE.04 SM.06
CE.05
MA.03
SM.15 MA.04
Social
To keep the momentum initiated by the moving Fayetteville Forward implementation matrix, it is critical to consider both the importance and timeframe of the tasks.
214
HKS | PEC | Office of Design | NV5 | Noell Consulting Group | Blue Cypress
DG.01
DG.02
DG.03
EC.01
Establish a street typology guide
Adopt architectural design guidelines
Adopt a Complete Street policy
Continue to ensure that the City of Fayetteville is adequately staffed and fully empowered to act.
CE.02
Z.01
Z.02
Strategize how to involve community comment on future projects to be implemented
Establish code to align with City's ordinance structure as Sec 202.6, Downtown Mixed-Use Zoning
Modify schedule of land uses within UDO to account for each of the DMU subdistricts; remove placeholders within tables throughout UDO dedicated for the DMU districts; change the language under Sec 202.6 to refer to the Downtown Mixed-Use Zoning document
215
Fayetteville Livable Centers Initiative (LCI) Study | DRAFT VERSION - DO NOT DISTRIBUTE
A 203
HKS | PEC | Office of Design | NV5 | Noell Consulting Group | Blue Cypress
Appendix : Market Study
Fayetteville Livable Centers Initiative (LCI) Study | DRAFT VERSION - DO NOT DISTRIBUTE
Appendix A | Market Study
Overall, the trend in the south metro, including Fayette County and Fayetteville, has been decreasing growth rates and a decreasing share of the metro’s population growth.
Metro Atlanta Overview
The Atlanta metro consists of 29 counties surrounding the city of Atlanta, the economic and cultural hub of the region, and is the 9th largest metro in the country at 6 million people. There are tend central “core” counties that belong to the Atlanta Regional Commission (ARC), the regional planning and intergovernmental coordination agency for the metro, which harbor most of the metro’s population and jobs. The metro’s economy is the 9th largest in the country with a GDP of $397.3 billion and home to 30 Fortune 1000 companies.
Metro Atlanta Demographic Overview The ten-county core (ARC) accounted for 75% of all population growth from 2010-2019, up from 66% the previous decade. More urban counties such as Fulton and DeKalb were the main beneficiaries of this growth as younger & older households have increasingly sought vibrant, walkable communities in both urban & suburban areas w/ proximity to jobs & lifestyle amenities Despite consisting of 1.9% of the metro population, Fayette County saw its share of growth decrease from 1.6% (2000-2010) to 1.1% since. Overall, the trend in the south metro, including Fayette County and Fayetteville, has been decreasing growth rates and a decreasing share of the metro’s population growth.
Land Area
Population
Annual Growth
Annual % Growth
Growth Share
Geography
SQ Miles
% of CBSA
2019
% of CBSA
200010
201019
200010
201019
200010
201019
Cherokee County
422
4.9%
258,773
4.3%
7,244
4,936
4.2%
2.1%
7.1%
6.1%
Clayton County
142
1.6%
292,256
4.9%
2,291
3,648
0.9%
1.3%
2.2%
4.5%
Cobb County
340
3.9%
760,141
12.6%
8,033
8,007
1.2%
1.1%
7.8%
9.8%
DeKalb County
268
3.1%
759,297
12.6%
2,603
7,489
0.4%
1.0%
2.5%
9.2%
Douglas County
200
2.3%
146,343
2.4%
4,023
1,549
3.7%
1.1%
3.9%
1.9%
Fayette County
194
2.2%
114,421
1.9%
1,530
873
1.6%
0.8%
1.5%
1.1%
Fulton County
527
6.1%
1,063,937 17.7%
10,458
15,928
1.2%
1.6%
10.2%
19.5%
Gwinnett County
430
5.0%
936,250
15.6%
21,687
14,548
3.2%
1.7%
21.2%
17.8%
Henry County
322
3.7%
234,561
3.9%
8,458
3,404
5.5%
1.6%
8.3%
4.2%
Rockdale County
130
1.5%
90,896
1.5%
1,510
631
2.0%
0.7%
1.5%
0.8% Major Job Core
10-County Arc Core
2,974
34.2%
4,656,875
77.4%
67,837
61,014
1.8%
1.4%
66.3%
74.8%
Exurban Counties
5,712
65.8%
1,363,489
22.6%
34,492
20,501
3.5%
1.6%
33.7%
25.2%
Atlanta
CBSA Total
8,686
100.0%
6,020,364
100.0%
102,329
81,515
2.2%
1.5%
100.0%
100.0%
Core Counties
South Atlanta Metro
3,823
44.0%
1,201,148
20.0%
21,199
12,011
2.2%
1.1%
20.7%
14.7%
Fayetteville
13
0.1%
17,991
0.3%
480
227
3.6%
1.4%
0.5%
0.3%
Metro Outline N
Source: NCG, U.S. Census Bureau
205
HKS | PEC | Office of Design | NV5 | Noell Consulting Group | Blue Cypress
206
Fayetteville Livable Centers Initiative (LCI) Study | DRAFT VERSION - DO NOT DISTRIBUTE
Appendix A | Market Study
Growth Visualized
Atlanta Metro Population Density
County Share of Population Growth & Educated Population Growth 25.0%
20.0%
Overall, Fayette County has a relatively low population density when put into a regional context, with most of the metro population concentrated to the north. Population density plays an important role:
Fulton County Gwinnett County
15.0% Forsyth County
10.0%
Cobb County
Cherokee County
DeKalb County
5.0%
0.0% 0.0%
Fulton, Dekalb, & Cobb Counties have seen a disproportionate share of growth among educated people compared to overall population growth. This key demographic attracts office-using employers, retailers, and is often an indicator of households with high income potential.
•
Many regional retailers seek a central location with regional access and high population counts within 10-20 miles when focusing on site selections.
•
Most office users seek proximity to diverse population centers with access to a variety of housing types in order to attract employees.
Fayette County 5.0%
10.0%
15.0%
20.0%
25.0%
30.0%
Sources: NCG, U.S. Census Bureau
Local Population Growth Comparison
* **
Region
2000
2010
2019
2021
2026
2000-’10 Ann. % Growth
2010-’21 Ann. % Growth
2021-’26 Ann. % Growth
City of Fayetteville
11,148
15,945
17,991
18,567
19,611
3.64%
1.35%
1.10%
Fayette County
91,262
106,567
114,421
115,897
121,187
1.56%
0.79%
0.90%
Atlanta Metro
4,263,447
5,286,728
6,020,364
6,137,994
6,489,854
2.17%
1.45%
1.12%
Georgia
8,186,491
9,687,653
10,617,423
10,769,971
11,272,730
1.70%
1.02%
0.92%
20-MILE RADIUS
Population estimates and projections for 2021 & 2026 are provided by Claritas w/ 2000, 2010, & 2019 U.S. Census Bureau Data The Atlanta Metro is defined as the Atlanta-Sandy Springs-Alpharetta, GA Core-Based Statistical Area (CBSA)
Population Density, 2018 (5-Year American Community Survey) Sources: NCG, U.S. Census Bureau
207
HKS | PEC | Office of Design | NV5 | Noell Consulting Group | Blue Cypress
208
Fayetteville Livable Centers Initiative (LCI) Study | DRAFT VERSION - DO NOT DISTRIBUTE
Appendix A | Market Study
Median Income
Proximity to High Income Households
While all regions in the metro have relatively affluent areas, the northern suburbs of Atlanta tend to have the greatest concentration of affluence with notable concentrations in the eastern and northern portions of the city of Atlanta. Concentrations of affluent households attract employers seeking highly educated workers and retailers seeking proximity to high spending households. Fayette County, particularly in Peachtree City, has the highest concentration of affluent households in the south Atlanta metro.
•
Local median incomes have a wide range from $52,000 to $111,500.
•
Median income in Fayetteville is $73,526, a 25.8% increase since 2010, and 7.6% higher than metro median incomes.
•
Median income in Fayette County tends to be highest in and around Peachtree City due to quality schools and a predominately large single-family product type.
$79,271
•
Median incomes in Fayette County are 32% higher than the metro.
$111,544
•
Fayette County median income growth has significantly lagged behind regional growth.
$83,958
$52,778 $72,946
Household Median Income
Region
2010
2019
2010-2019 % Change
City of Fayetteville
$58,438
$73,526
25.8%
Fayette County
$82,216
$90,145
9.6%
Atlanta Metro
$57,550
$68,316
18.7%
Georgia
$49,347
$58,700
19.0%
United States
$51,914
$62,843
21.1%
Sources: NCG, U.S. Census Bureau
20-MILE RADIUS
Median incomes in Fayette County are 32% higher than the metro.
Median Household Income, 2018 (5-Year American Community Survey)
209
HKS | PEC | Office of Design | NV5 | Noell Consulting Group | Blue Cypress
210
Fayetteville Livable Centers Initiative (LCI) Study | DRAFT VERSION - DO NOT DISTRIBUTE
Appendix A | Market Study
Educational Attainment
Proximity to Educated Households
Concentrations of highly educated households are attractive to both office-using employers and retailers. Many office users desire proximity to a highly educated workforce and retailers often use educational attainment levels as a key metric when determining site locations. Additionally, households with high educational attainment levels have high income potential and are strong indicators of neighborhood stability. The northern & eastern portions of the city of Atlanta and the north metro suburbs have the highest concentrations of high educational attainment households. In the south, Fayette County stands out, but a lack of high concentrations of educated households has limited major office growth and relocation locally and on the south side of Atlanta.
•
Fayette County has a higher percentage of population w/ college degrees than the metro as a whole.
•
The highest concentrations of people w/ college degrees in Fayette County are found in and around Peachtree City.
•
In Fayetteville 28% - 45% of people have college degrees, with the city’s overall percentage of 38.7% in-line w/ the metro.
•
Growth among college educated population in Fayetteville has lagged behind the region.
44.8%
40.8%
+
28.3% 36.9%
40.3%
Percentage of Population (25+ Years) with Bachelor’s Degree Region
2010
2019
2010-2019 % Change
City of Fayetteville
36.0%
38.7%
7.5%
Fayette County
41.5%
46.2%
11.3%
Atlanta Metro
34.4%
38.6%
12.2%
Georgia
27.2%
31.3%
15.1%
United States
27.9%
32.1%
15.1%
Sources: NCG, U.S. Census Bureau
20-MILE RADIUS
Growth among college educated population in Fayetteville has lagged behind the region by 4.7%.
Population 25+ with Bachelor’s Degree or More, 2018 (5-Year American Community Survey)
211
HKS | PEC | Office of Design | NV5 | Noell Consulting Group | Blue Cypress
212
Fayetteville Livable Centers Initiative (LCI) Study | DRAFT VERSION - DO NOT DISTRIBUTE
Appendix A | Market Study
Household Types and Current Local & Regional Rental Stock
Proximity & Connection of the Subject Area to Jobs
As a percentage, Fayette County has half as many renter households compared to the region and nation While Fayetteville has nearly 29% renter households, this is still significantly less than the metro, state, and national percentage of 36-37%. Nearly 50% of rental product in Fayetteville consists of older single-family homes and duplexes / quadplexes. Roughly 20% of rental product is newer Class A product that is most attractive to the younger, affluent, educated population ~500 units of Class A product will deliver in Downtown Fayetteville along w/ ~300 units in Trilith, bringing more desirable product to market that will attract affluent renter audiences.
Region
Total Households
Owner Households
Renter Households
Renter Occ. %
City of Fayetteville
6,833
4,860
1,973
28.9%
Most high paying jobs ($40,000+) are in Downtown / Midtown Atlanta, edge cities such as Perimeter & Cumberland, and northern suburbs. Outside of the airport area, most jobs are 30+ miles away. 45% of $40,000+ jobs located within 30-miles. 25% of high-paying jobs within 30-miles are in transportation, manufacturing, and wholesale trade sectors. These industries are concentrated heavily south of the city of Atlanta due to the major interstates which links Atlanta and the airport to Port of Savannah.
Industry Sector Transportation and Warehouse
12.2%
Professional, Scientific, and Technical Services
10.9%
Healthcare and Social Assistance
10.7%
Educational Services
10.5%
Public Administration
7.9%
Manufacturing
6.7%
Wholesale Trade
6.1%
Information
5.4%
Finance and Insurance
5.4%
Construction
4.4%
30 MILE RADIUS
Fayette County
40,285
33,015
7,270
18.0%
Atlanta Metro
2,104,360
1,331,251
773,109
36.7%
Georgia
3,758,798
2,377,773
1,381,025
36.7%
United States
120,756,048
77,274,381
43,481,667
36.0%
City of Fayetteville Product Type
Unit Count
Percentage of Rental Housing
Single Family Attached & Detached
917
36.9%
Duplexes & Quadplexes
298
12.0%
Class B & C
794
32.0%
MIDTOWN AND DOWNTOWN ATLANTA
AIRPORT
NEWNAN
+ FAYETTE COUNTY
GRIFFIN
Class A
210
8.5%
Class A in Mixed-Use
263
10.6%
Total
2,482
100%
Employees Earning More than $40,000 (2018)
213
HKS | PEC | Office of Design | NV5 | Noell Consulting Group | Blue Cypress
214
Fayetteville Livable Centers Initiative (LCI) Study | DRAFT VERSION - DO NOT DISTRIBUTE
Appendix A | Market Study
Roughly 35% of Fayette County residents commute over 25 miles to work. Work Destination of Fayette County Residents
Roughly 50% of Fayette County residents work in and around the airport or south. The greatest concentrations of employment are at the airport, in Peachtree City / Fayette County, and then Downtown / Midtown with the rest of employment scattered through out the metro. With the airport and adjacent areas being a significant draw for Fayette County workers, future growth at and around the airport will serve as a significant demand driver for Fayette County and the subject area. Roughly 35% of Fayette County residents commute over 25 miles to work, which is significantly higher than the metro average of 22%. Only 22% commute less than 10 miles, compared to metro average of 35%. These figures indicate county serves primarily as a bedroom community.
Top Work Destinations
MIDTOWN AND DOWNTOWN ATLANTA
~50% OF RESIDENTS WORK AROUND THE AIRPORT OR SOUTH
AIRPORT
Location
Share
Airport
20.9%
Downtown / Midtown Atlanta
10.3%
Fayette County
10.3%
8.5%
Peachtree City Coweta County
2.8%
Cumberland
2.5%
Perimeter Center
2.3%
Clayton County
2.2%
South Fulton
2.1%
Buckhead
1.2%
N
Distance
NEWNAN
215
HKS | PEC | Office of Design | NV5 | Noell Consulting Group | Blue Cypress
PEACHTREE CITY
Employment
Atlanta CBBA 40 Miles
1,296,270 967,609
30 Miles
589.806
15 Miles
125,733
216
Fayetteville Livable Centers Initiative (LCI) Study | DRAFT VERSION - DO NOT DISTRIBUTE
Appendix A | Market Study
SHARE OF JOB GROWTH Where Jobs Are Being Created, 2010-2018 (Private Jobs Only)
While Metro Atlanta has seen significant job growth, this growth has not been equally spread. Since 2010, growth among $40,000+ jobs has primarily occurred in the Atlanta core and northern suburbs. The lack of job growth in southern metro suburbs is a contributing factor to declining population growth rates. Chicken & egg story. South metro needs more educated workers to attract more high-paying jobs, however these workers want to be located near existing jobs and in high lifestyle areas.
SHARE OF JOB GROWTH: 49%
Total Jobs Gained
NORTH METRO SHARE OF JOB GROWTH: 37%
South Metro Core Metro
53,364 136,610
North Metro FAYETTEVILLE
+
181,240 50,000
100,000
150,000
200,000
SOUTH METRO SHARE OF JOB GROWTH: 14%
While Metro Atlanta has seen significant job growth, this growth has not been equally spread. *
217
Job data provided by U.S. Census Bureau’s Longitudinal Employer-Household Dynamic data and includes private jobs only w/ salaries $40,000
0
HKS | PEC | Office of Design | NV5 | Noell Consulting Group | Blue Cypress
12.5
25
50 Miles
N
218
Fayetteville Livable Centers Initiative (LCI) Study | DRAFT VERSION - DO NOT DISTRIBUTE
Appendix A | Market Study
2,977
Inflow / Outflow Of $40,000+ Workers
TOTAL JOBS ATLANTA
LCI STUDY AREA
12,394
+
22,404
+
5,262
Fayette County Fayetteville County City
0
10
20 Miles
19% of Fayette County residents work in Fayette County. Increasing housing variety and creating / improving unique lifestyle options will increase this percentage.
219
N
29.8% of people working in Fayette County who earn over $40,000 live in Fayette County, which is significantly less than other comparable metro counties. This percentage most likely is low due to limited urban typologies offered in Fayette County. 19% of Fayette County residents work in Fayette County, which is in-line with comparable counties. This could be tough to improve without significantly increasing local job offerings which would be a challenge.
County
% of Workers Living in County
% of Residents Working in County
Forsyth
31.7%
17.3%
Cherokee
42.0%
16.0%
Coweta
47.5%
21.2%
Average
40.4%
18.2%
Fayette
29.8%
19.0%
HKS | PEC | Office of Design | NV5 | Noell Consulting Group | Blue Cypress
Local Job Map 0
0.25 Miles
N
220
Fayetteville Livable Centers Initiative (LCI) Study | DRAFT VERSION - DO NOT DISTRIBUTE
Appendix A | Market Study
Top 10 Industry Sectors in Study Areas
Sector
Local Schools Share
Public Administration
Fayette County has one of the best school systems in the metro and is a major asset in attracting residents, particularly those seeking single family housing. Schools near the study area tend to be ranked lower than schools elsewhere in the county which could limit housing premiums as homeowners seek to be located in more desirable districts.
39%
Educational Services
23%
Healthcare and Social Assistance
9%
Accommodation and Food Services
8%
Retail Trade
6%
Finance and Insurance
5%
Other Services (Excluding Public Administration)
3%
Professional, Scientific, and Technical Services
2%
Transportation and Warehousing
1%
Administration and Support
1%
Fayette County Public Schools Ranked #6 Best School District in Georgia by Niche
Total Jobs by Annual Earnings
Annual Earnings
Employment 53.6%
$40,000 + 29.7%
$15,001 - $39,999 < $15,000
16.7%
Fayette County Public Schools Ranked #8 Best School District in Georgia by School Digger
HIGHLY RANKED PEACHTREE CITY SCHOOLS
Please note that this data is based on federal employment data and these jobs are not always located at the addresses reported, for example, teachers are often shown working at the board of education address, not the specific school they’re working at.
Fayette County GreatSchool.org Elementary School Rankings
221
HKS | PEC | Office of Design | NV5 | Noell Consulting Group | Blue Cypress
222
Fayetteville Livable Centers Initiative (LCI) Study | DRAFT VERSION - DO NOT DISTRIBUTE
Appendix A | Market Study Population
Demographic Overview LCI Study Area
2021 Estimate
1,588
2010 Census
1,474
Growth 2010-2021
7.73%
Growth 2010-2021, Annualized
0.70%
Average Age
45.7
Households The local area is fairly affluent, with median incomes well above the state and metro average, however, significantly below that of the county. The area has seen limited growth among households / population, primarily due to limited new development in the area. Nearly 24% of the households are renter households, well above the county’s average, however below that of the metro and national averages.
2021 Estimate
544
2010 Census
481
Growth 2010-2021
13.10%
Growth 2010-2021, Annualized
1.19%
Owner Occupied
414
Renter Occupied
130
Percent Renter Occupied
23.9%
2021 Average Household Income
$104,004
2021 Median Household Income
$77,748
Housing
LCI STUDY AREA
Median Home Value
$234,761
Median Year Built
1990
Average Household Size
2.24
Households By Income (2020)
0
0.25
0.50
1 Miles
223
HKS | PEC | Office of Design | NV5 | Noell Consulting Group | Blue Cypress
N
Share
< $24,999
56
10%
$25,000 - $34,999
35
6%
$35,000 - $49,999
74
14%
$50,000 - $74,999
98
18%
$75,000 - $99,999
72
13%
$100,000 - $124,999
58
11%
$125,000 - $149,999
45
8%
$150,000 - $199,999
50
9%
$200,000 - $249,999
27
5%
$250,00+
29
5%
224
Fayetteville Livable Centers Initiative (LCI) Study | DRAFT VERSION - DO NOT DISTRIBUTE
Appendix A | Market Study
Youth and Senior Citizens A strong community is one where all people, regardless of age, gender, race or socio-economic status, play a role. In such a community, everyone has something to offer and something to receive from each other. This interdependence is possible by leveraging the unique strengths of different social groups. This map recognizes the mix of generations.
A strong community is one where all people, regardless of age, gender, race or socioeconomic status, play a role. Source: The Citizen
Youth and Senior Citizens
225
HKS | PEC | Office of Design | NV5 | Noell Consulting Group | Blue Cypress
0
0.25
0.50
1 Miles
N
226
Fayetteville Livable Centers Initiative (LCI) Study | DRAFT VERSION - DO NOT DISTRIBUTE
Appendix A | Market Study
+
+
Health Analysis
Supermarket
+
Top Health Risks Leading causes of premature death:
Leading causes of age-adjusted death: 1.
Ischemic Heart and Vascular Disease
1.
Ischemic Heart and Vascular Disease
2.
Cancer
2.
Motor Vehicle Crashes
3.
Cerebrovascular Disease
3.
Suicide
4.
All Other Mental and Behavioral Disorders
4.
Cancer of the Trachea, Broncus, and Lung
5.
Alzheimer’s Disease
5.
Accidental Poisoning
Data in Fayette County. Source: Piedmont Fayette Hospital Community Needs Assessment
Air Quality
PARTICULATE MATTER LEVEL 30 PG/M3
PM2.5
20 PG/M3
10 PG/M3
0 PG/M3 2000
2002
2004
2006
2008
2010
Fayetteville, GA
2012
2014
2016
2018
US
+ Particulate Matter (PM2.5) level in 2018 was 8.69. This is about average. Closest monitor was 11.7 miles away from the city center. http://pics4.city-data.com/sgraphs/city/air-pollution-pm2-5-Fayetteville-GA.png
Healthy Food Access Percentage of the population that lives farther than 1 mile (urban) or 10 miles (rural) from the nearest supermarket with healthy food
227
HKS | PEC | Office of Design | NV5 | Noell Consulting Group | Blue Cypress
+ 0
0.25
0.5
1 Miles
N
228
Fayetteville Livable Centers Initiative (LCI) Study | DRAFT VERSION - DO NOT DISTRIBUTE
Appendix A | Market Study
AGING RETAIL
Strengths, Challenges, And Opportunities 12-MILES, ROUGHLY 20-30 MINUTES TO I-75 AND I-285
Strengths The subject area is in a moderately affluent, established suburban county with a quality school district and several local employment anchors (primarily government), and an established square with historic courthouse offering a walk-able, urban grid not found locally. There exist numerous underutilized parcels near the downtown square prime for redevelopment or infill.
AGING RETAIL AND INDUSTRIAL USES
Challenges Trilith (formerly Pinewood Forest) and Peachtree City soak up a significant amount of local demand for residential and new retail with Trilith offering quality housing in an urban, walk-able format with significant park and recreational space. Downtown has limited park space, which should be addressed, and much of the eastern portion of the historic square is occupied by surface parking and churches who limit vibrancy. Overall limited amount of undeveloped land, and many existing uses still economically viable and not yet ripe for redevelopment.
REDEVELOPMENT OPPORTUNITY
Opportunities Downtown Fayetteville can leverage the city’s established grid to provide unique to market for-sale and rental product in a walk-able format at a price discount to competing areas such as Trilith. Due to entitlement challenges elsewhere in the county, much of this demand can be captured by Downtown Fayetteville. Smaller lots can be utilized as residential infill in the form of town homes with larger mixed-use developments focused on providing ground floor commercial space for local serving retail and office where appropriate.
REDEVELOPMENT OPPORTUNITY SURFACE PARKING AND LIMITED USE STRUCTURES
PROPOSED / EXISTING DEVELOPMENT
REDEVELOPMENT OPPORTUNITY
Downtown Fayetteville can leverage the city’s established grid to provide unique to market for-sale and rental product in a walk-able format at a price discount to competing areas such as Trilith. N
229
HKS | PEC | Office of Design | NV5 | Noell Consulting Group | Blue Cypress
230
Fayetteville Livable Centers Initiative (LCI) Study | DRAFT VERSION - DO NOT DISTRIBUTE
Appendix A | Market Study
Demand
Multifamily Rental Residential
Coweta and Fayette County have seen an increase share of Class A multifamily absorption since 2011. Absorption in Fayette County has largely been limited by lack of new supply. Increasing lifestyle environments in Newnan, Trilith, and potential Downtown Fayetteville will increase the market’s capture moving forward. NCG’s forecasted demand of 243 units annually from 2021-2025 allows for absorption of the planned deals in the pipeline and up to an additional 250-300 units within the study area.
Comparables In order to assess the opportunity for multifamily rental product within the study area, NCG examined the newest and best performing comps in the local area.
1
2 3
1.
The Dylan at Fairburn (formerly Crofthouse)
2.
Premiere Lofts at Trilith (formerly Pinewood)
3.
The Meridian at Lafayette
4.
Camden Peachtree City
In order to assess the opportunity for multifamily rental product within the study area, NCG examined the newest and best performing comps in the local area. Premiere Lofts at Trilith is the newest delivery and located in a mixed-use environment. Product currently commands $1.77 / SF, an ~18% premium to the market. New multifamily product within the study area most likely would command around $1.70 - $1.80 / SF with premiums primarily generated by the walkable environment of Downtown Fayetteville.
4
FAYETTE COUNTY
Product Type
Year Built
TotalUnits
Vacancy
Avg. Unit Size (SF)
Avg. Unit Price
$/SF
Comment
The Dylan
2020
276
26%
897
$1,385
$1.54
In lease up, avg 17 units / mo
Premiere Lofts at Trilith
2020
263
41%
955
$1,692
$1.77
In lease up, avg. 15.5 units / mo
The Meridian at Lafayette
2017
210
1%
966
$1,471
$1.52
Located in study area
Camden Peachtree City
2001
399
4%
1,027
$1,499
$1.46
Region
2011-2020 Avg. Annual Apt Abs.
2015-2020 Avg. Annual Apt. Abs.
2021-2025 Projected Avg. Annual Apt. Abs.
Atlanta Metro
7,602 units
9,133 units
10,228 units
Coweta & Fayette County Share
1.9%
2.4%
4.1%
Coweta & Fayette County
137 units
222 units
419 units
Fayette County Share
28.8%
32.4%
58.1%
Fayette County
39 units
72 units
243 units
Sources: CoStar, NCG
Class A multifamily absorption in Fayette County has largely been limited by lack of new supply.
Sources: CoStar, NCG
231
HKS | PEC | Office of Design | NV5 | Noell Consulting Group | Blue Cypress
232
Fayetteville Livable Centers Initiative (LCI) Study | DRAFT VERSION - DO NOT DISTRIBUTE
Appendix A | Market Study
HISTORIC HOME IN DOWNTOWN FAYETTEVILLE For-Sale Residential Comparables
1
6 7 2
3
4
8
9
5
FAYETTE COUNTY
Attached Product (Town Homes)
233
HKS | PEC | Office of Design | NV5 | Noell Consulting Group | Blue Cypress
Detached Product
1.
Trilith
5.
Newnan Vines
2.
Villages at Lafayette Park
6.
Trilith
3.
Lexington Village
7.
Villages at Lafayette Park
4.
Everton Creekside
8.
Oakleigh Manor
9.
Everton Creekside
234
Fayetteville Livable Centers Initiative (LCI) Study | DRAFT VERSION - DO NOT DISTRIBUTE
Appendix A | Market Study
For-Sale Attached Comparables
Community
Picture
Years Active
Unit Types
Size Range (SF)
Avg. Unit Size (SF)
Price Range
Avg. Price
$/SF
2018+
3-4 Bed / 2.5-3.5 Bath
1,712 - 2,397
1,820
$434,900 - $679,900
$526,685
$290
Villages at Lafayette Park
2003-2004
3 Bed / 2.5-3.5 Bath
1,792 - 2,243
2,071
$190,750 - $245,000
$223,108
$108
Lexington Village
2007-2012
3 Bed / 3.5 Bath
1,732 - 2,192
2,034
$275,000 - $308,200
$292,619
$145
Everton Creekside*
2020+
3 Bed / 2.5-3.5 Bath
2,218 - 2,404
2,287
$296,000 - $317,000
$308,000
$135
Newnan Views
2019+
3 Bed / 3.5 Bath
2,052 - 3,653
2,586
$465,000 - $674,491
$537,674
$213
Trilith
*
235
All data is sourced from RedFin & MetroStudy using demonstrated sales except Everton Creekside which uses current listings
HKS | PEC | Office of Design | NV5 | Noell Consulting Group | Blue Cypress
236
Fayetteville Livable Centers Initiative (LCI) Study | DRAFT VERSION - DO NOT DISTRIBUTE
Appendix A | Market Study
For-Sale Detached Comparables
Community
Picture
Years Active
Unit Types
Size Range (SF)
Avg. Unit Size (SF)
Price Range
Avg. Price
$/SF
2018+
2-6 Bed / 1.5-5.5 Bath
1,098 - 3,349
1,862
$384,000 - $1,200,000
$589,580
$320
Villages at Lafayette Park*
2017+
3-5 Bed / 2.5-3.5 Bath
2,256 - 3,407
2,661
$292,300 - $400,000
$328,825
$124
Oakleigh Manor
2017+
3-5 Bed / 2-4.5 Bath
2,358 - 3,984
3,443
$350,000 - $545,541
$435,634
$129
Everton Parkside
2016+
3-5 Bed / 3-4.5 Bath
2,682 - 3,998
3,225
$464,000 - $632,455
$525,676
$164
Trilith
NOTE: *
237
All data is from homes built 2015+ and sold within last 2 years. Data is provided by RedFin and MetroStudy Villages at Lafayette Park stalled halfway during The Great Recession and saw new development & sales begin in earnest in 2017+
HKS | PEC | Office of Design | NV5 | Noell Consulting Group | Blue Cypress
238
Fayetteville Livable Centers Initiative (LCI) Study | DRAFT VERSION - DO NOT DISTRIBUTE
Appendix A | Market Study
Building Permits Tracking Metro Atlanta Building Permits & Home Pricing
5,000
140 4,000
3,000
2,000
90 1,000
64 58
60 40
0
26 21
0
800
14.9%
12.6% 10.3%
600
10.8%
11.7%
10.3%
12.3% 9.9%
200 0
15.0%
11.5%
8.5%
7.0%
400
11.7%
10.0% 5.0%
1,333 1,308
885
595
548
511
503
684
916
925
1,090 1,252 1,201 1,236 1,310 1,098
2005 2006 2007 2008 2009 2010 2011 2012 2013 2014 2015 2016 2017 2018 2019 2020
29
711103
$200,000 - $299,999
2016
33
548
2216
$300,000 - $399,999
$ $400,000 - $499,999
2017
27 20 1110 9 6 5
10 12 21211431 2
64
$500,000 - 599,999 9
$600,000 - $700,000
> $700,000
21 2
234
108
2011 446 407
2012
392
2013
222 200
2015 2016
$300,000 - $399,999
$400,000 - $499,999
$500,000 - 599,999
37 49
30
> $700,000
23
$600,000 - $700,000
4 8 7 12 11 24 19 20
55 61
15 14 23 18 20 27 25 19
38
93
106 109
2017 10 2 5 8 8 17 20 16
$200,000 - $299,999
2014
32 26
< $200,000
2019
2010
596 582 589 623 569 447
200
2018
2020
189
300
0
25.0% 20.0%
17.6%
15.5%
43 36
2015 52
2018 2019 2020
32
% Above $400,000
Average Sales Price
1,200
47
31 28 33 26 40 66 82 83
Total Detached Resales by Year & Percentage Above $400,000
15.3%
400
100
22.3%
5854
50 34 46 79 83 105 134 152
Total Sales & Percentage Above $400,000 In Primary Market Area
500
296 315
Annual Sales
600
1,400
74
61
Detached Resales by Price Point, 2010-2020 700
1,000
12
< $200,000
1-Unit Permits
60 2000 2001 2002 2003 2004 2005 2006 2007 2008 2009 2010 2011 2012 2013 2014 2015 2016 2017 2018 2019 2020
432
2014
21
15
2013
96
87 76
80
20
S&P / Case-Shiller Index (Base = Jan. 2020)
70
100
349 342
80
2012
103
262
100
119
116
120
105 102 123 177 181
110
2010 2011
140
471
120
Detached New Sales by Price Point, 2010-2020
412
130
246
150
Detached Sales By Price Point In Primary Market Area
Annual Sales
S&P / Case-Shiller Index (Base = Jan. 2000)
Construction has not kept up w/ demand which has led to soaring values.
160
Metro Atlanta 1-Unit Private Building Permits
6,000
170
0.0%
Total Detached New Sales by Year & Percentage Above $400,000
350 250 200 150
27.3%
33.7%
36.4%
26.2%
25.0%
23.1% 11.1%
418
380
173
80.0% 70.0% 60.0% 50.0%
30.1%
100 50
68.2% 61.1%
53.9%
300
0
239
64.9%
400
103
61
16
13
27
16.7%
21.9%
40.0%
28.6%
30.0% 20.0%
6.4%
233
186
210
199
141
185
149
107
2005 2006 2007 2008 2009 2010 2011 2012 2013 2014 2015 2016 2017 2018 2019 2020
HKS | PEC | Office of Design | NV5 | Noell Consulting Group | Blue Cypress
10.0%
% Above $400,000
Average Sales Price
450
0.0%
31
240
Fayetteville Livable Centers Initiative (LCI) Study | DRAFT VERSION - DO NOT DISTRIBUTE
Appendix A | Market Study
Detached For-Sale Demand In Primary Market Area
Attached For-Sale Demand In Primary Market Area
This data shows the historic and future demand potential for single-family detached product for the Primary Market Area (PMA) which consists of the ZIP Codes 30214 & 30215.
This data shows the historic and future demand potential for single-family attached product for the Primary Market Area (PMA) which consists of the ZIP Codes 30214 & 30215.
Given Downtown Fayetteville’s unique lifestyle offering within the market NCG estimates the LCI study area could potentially capture up to 50% of the PMA demand, although this number may be limited based on the availability of sites and land costs.
Given Downtown Fayetteville’s unique lifestyle offering within the market NCG estimates the study area could potentially capture up to 50% of the PMA demand.
Region
2005-2020 Avg. Annual Sales
2015-2020 Avg. Annual Sales
2021-2025 Projected Avg. Annual Sales
Region
2005-2020 Avg. Annual Sales
2015-2020 Avg. Annual Sales
2021-2025 Projected Avg. Annual Sales
Atlanta Metro
17,871
16,212
16,678
Atlanta Metro
3,733
3,449
4,544
Fayette County Share (%)
1.8%
2.2%
3.0%
Fayette County Share (%)
0.1%
0.2%
0.8%
Fayette County
314
361
500
Fayette County
4
7
35
PMA Share (%)
51.8%
45.8%
40.5%
PMA Share (%)
50.0%
90.0%
90.0%
PMA
163
165
203
PMA
2
6
31
New Single Family Detached Home Sales
New Single Family Attached Home Sales
WOODSTOCK WEST BY WALTON
Source: City Of Fayetteville
241
HKS | PEC | Office of Design | NV5 | Noell Consulting Group | Blue Cypress
242
Fayetteville Livable Centers Initiative (LCI) Study | DRAFT VERSION - DO NOT DISTRIBUTE
Appendix A | Market Study
Office Comparables
Existing office space within the market was primarily built prior to the recession with rents ranging from $18 - $24 Full Service / SF. Vacancy of the buildings profiled averages 18.1% with an average parking ratio of 4.3 spaces per 1,000 SF.
3
4
There is limited market activity with a new speculative office building recently delivered in Pinewood Forest with estimated rents around $30 / SF Full-Service. Additional activity includes an in-market employer building and occupying a build-to-suit space.
5
1 2
6 7
243
Property Name
Address
Floors
Size
Rent
Rent Type
Vacancy Rate
Parking Ratio
Year Built
1
741 W Lanier Ave.
741 W Lanier Ave
2
22,420
$16.00
NNN
13.3%
4.00
2005
2
Grady Village - Bldg 100
600 W Lanier Ave
1
15,525
$14.00
NNN
8.1%
5.00
2009
3
Prestige Park
874 W Lanier Ave
2
41,450
$20.50
MG
10.5%
4.80
2007
4
100 World Dr
100 World Dr
2
35,000
$23.00
FS
26.1%
7.72
2007
5
Gateway Plaza
101 World Dr
4
60,000
$22.00
FS
0%
4.32
2001
6
Commerce Center
500 Westpark Dr
3
39,130
$24.00
FS
56.2%
4.00
1999
7
Commerce Point
525 Westpark Dr
4
52,000
$24.00
FS
12.6%
4.00
2008
HKS | PEC | Office of Design | NV5 | Noell Consulting Group | Blue Cypress
244
Fayetteville Livable Centers Initiative (LCI) Study | DRAFT VERSION - DO NOT DISTRIBUTE
The local market has been stagnant in recent years with 3 years showing negative absorption since 2016. However, there has been limited new product added to attract prospective users to the market.
Appendix A | Market Study
Office Demand In Local Area
The above table tracks local market office growth driven by conventional market activity within the local area (ZIP Codes 30214 & 30215). The local market has been stagnant in recent years with 3 years showing negative absorption since 2016. However, there has been limited new product added to attract prospective users to the market. NCG estimates the local area will absorb 13,000 14,000 SF of Class A office space annually, Trilith likely to get first 3 years given existing space. This would indicate 25,000 SF - to 30,000 SF of additional unmet demand through 2025. Given annual absorption levels office product should be provided in the 5,000 - 20,000 SF range, ideally in high value areas such as proximity to retail, parks / trails, with high visibility.
Region
2002-2011 Avg. Annual Office Abs.
2012-2020 Avg. Annual Office Abs.
2021-2025 Projected Avg. Annual Office Abs.
Atlanta Metro
1,997,415 SF
2,310,388 SF
1,460,486 SF
South Atlanta Share
16.6%
9.5%
10.3%
South Atlanta Absorption
330,915 SF
218,385 SF
150,462 SF
Local Share
13.9%
6.6%
9.1%
Local Absorption
46,086 SF
14,380 SF
13,683 SF
320 W Lanier Ave | Source: Showcase.com
245
HKS | PEC | Office of Design | NV5 | Noell Consulting Group | Blue Cypress
246
Fayetteville Livable Centers Initiative (LCI) Study | DRAFT VERSION - DO NOT DISTRIBUTE
Appendix A | Market Study
Local Retail History
Retail Demand Local Trade Area
4.8 million of retail space exists within 3-miles of the subject area, primarily located along Glynn St N (Route 85) with Fayette Pavilion being a major regional retail center.
For the purpose of retail supply and demand analysis NCG utilized a 9-mil trade area radius. Additionally, competing retail centers / cores were considered (highlighted in red) when determining potential capture rates of current unmet demand.
Since the recession, the local retail sector has seen significant retail compression due to limited new deliveries and consistent absorption. Major recent leases include Ashley HomeStore (30,000 SF), DSW (23,370 SF), Shoppers World (30,000 SF), and Burlington (49,000 SF).
4.8 million SF of Existing Retail
(150,000)
Deliveries SF
Net Absorption SF Total
8.3%
6,400
9,361
8,000
4.8% 4.9%
173,292
16,680
115,374
0
0
117,477
12,621
120,679
11,232
50,398
9,390
46,911
0
20,334
63,378
93,162
0 (142,154)
(100,000)
(146,483)
(50,000)
(118,832)
0
6.8%
13.0%
(115,159)
7.5%
12,295
8.3%
100,000 50,000
10.4% 8.2%
10.2%
8,964
9.2%
12.6%
10.5%
37,276
150,000
11.3%
(52,084)
13.4%
200,000
Vacant Percent % Total
2008 2009 2010 2011 2012 2013 2014 2015 2016 2017 2018 2019 2020 YTD
8.0% 3.0% (2.0%) (7.0%)
9-MILE RADIUS
(12.0%)
Local Retail Activity: 2008-2021 YTD
247
HKS | PEC | Office of Design | NV5 | Noell Consulting Group | Blue Cypress
248
Fayetteville Livable Centers Initiative (LCI) Study | DRAFT VERSION - DO NOT DISTRIBUTE
Appendix A | Market Study
Estimated Retail Demand In Local Trade Area
Store Type (Excl. General Merch. & Gas)
Demand Potential1 Supply
Leakage (Inflow)
Per Capita
% in NonRegional CTrs2
Sales in Non-Reg Local Sales in % Local Sales2 Ctrs Non-Reg Ctrs
Furniture and Home Furnishings
$72,025,004
$61,131,418
$10,893,586
$272
30%
$21,607501
50%
$10,803,750
Furniture Stores
$43,350,088
$25,609,15
$17,740,930
$164
30%
$13,005,026
50%
$6,502,513
$218
5%
1,489
Home Furnishing Stores
$28,674,915
$35,522,261
($6,847,346)
$108
30%
$8,602,475
50%
$4,301,237
$328
5%
656
Electronics & Appliance Stores
$60,941,261
$45,858,543
$15,082,718
$230
50%
$30,470,631
25%
$7,617,658
$518
5%
735
Bldg. Materials, Garden Equipment & Supply
$291,372,849
$217,937,467
$73,435,382
$1,102
75%
$218,529,636
80%
$174,823,709
Bldg. Materials & Supply Stores
$355,720,762
$200,286,939
$55,433,823
$967
75%
$191,790,572
80%
$153,432,457
$218
5%
35,126
Lawn & Garden Equipment
$35,652,086
$17,650,529
$18,001,557
$135
75%
$26,739,065
80%
$21,391,252
$328
5%
3,265
Food & Beverage Stores
$613,606,627
$640,552,372
($56,945,745)
$2,320
80%
$490,885,302
85%
$417,252,506
Grocery Stores
$556,606,856
$620,948,495
($64,341,639)
$2,105
80%
$445,285,485
85%
$378,492,662
$475
5%
39,841
Specialty Food Stores
$15,344,760
$6,067,745
$9,277,015
$58
80%
$12,275,808
85%
$10,434,437
$270
5%
1,931
Beer, Wine & Liquor Stores
$41,655,011
$13,536,133
$28,118,878
$158
80%
$33,324,009
85%
$28,325,407
$554
5%
2,555
Health & Personal Care
$274,728,924
$212,473,326
$62,255,598
$1,039
90%
$247,256,032
80%
$197,804,825
$641
5%
15,425
Clothing & Clothing Accessories
$154,286,423
$107,615,965
$46,670,458
$583
33%
$50,914,520
33%
$16,801,791
Clothing Stores
$109,519,282
$92,527,339
$16,991,943
$414
33%
$36,141,363
33%
$11,926,650
$402
5%
1,484
Shoe Stores
$24,566,177
$8,603,112
$15,963,065
$93
33%
$8,106,838
33%
$2,675,257
$287
5%
466
Jewelry, Luggage & Leather Goods
$20,200,964
$6,485,514
$13,715,450
$76
33%
$6,666,318
33%
$2,199,885
$631
5%
174
Capture Rate of Trade Area
Subject Site Core Capture 2,145
38,391
44,327
2,124
$51,749,619
$27,404,796
$24,344,823
$196
50%
$25,874,810
50%
$12,937,405
Sporting Goods, Hobby, Musical Instrument
$47,009,827
$26,395,183
$20,614,644
$178
50%
$23,504,914
50%
$11,752,457
$273
5%
2,152
Book & Music Stores
$4,739,792
$1,009,613
$3,730,179
$18
50%
$2,369,896
50%
$1,184,948
$280
5%
212
$556,820,425
$419,429,034
$137,391,391
$2,100
70%
$391,788,260
80%
$313,430,608
Department Stores
$39,733,936
$22,053,474
$17,680,462
$150
10%
$3,973,394
80%
$3,178,715
$310
5%
513
Warehouse Clubs and Superstores
$517,086,488
$397,375,561
$119,710,927
$1,955
75%
$387,814,866
80%
$310,251,893
$750
5%
20,683
$86,649,376
$40,169,344
$46,480,032
$328
75%
$64,578,710
85%
$54,626,023
Florists
$3,991,646
$1,261,275
$2,730,371
$15
90%
$3,592,481
100%
$3,592,481
$316
5%
568
Office Supplies, Stationery & Gifts
$18,682,606
$27,322,213
($8,639,607)
$71
75%
$14,011,955
95%
$13,311,357
$283
5%
2,353
Used Merchandise Stores
$12,457,396
$11,460,936
$996,460
$47
100%
$12,457,396
95%
$11,834,526
$283
5%
2,092
Other Miscellaneous Store Retailers
$51,517,728
$124,920
$51,392,808
$195
67%
$34,516,878
75%
$25,887,658
$210
5%
6,164
Food Service & Drinking Places
$483,845,521
$359,431,733
$124,413,788
$1,830
80%
$387,076,417
38%
$147,890,131
Full-Service Restaurants
$228,240,388
$134,578,548
$93,661,840
$863
80%
$182,592,310
25%
$45,648,078
$431
25%
26,466
Limited-Service Eating Places
$207,578,248
$216,347,184
($8,768,936)
$785
80%
$166,062,598
50%
$83,031,299
$279
5%
14,902
Drinking Places (Alcoholic)
$16,221,973
$3,588,494
$12,633,479
$61
80%
$12,977,578
50%
$6,488,789
$400
25%
4,055
Snack / Non-Alcoholic Drink Places
$31,804,912
$4,917,507
$26,887,405
$120
80%
$25,443,930
50%
$12,721,965
$560
25%
5,679
Sporting Goods, Hobby, Book & Music
General Merch. Stores
Miscellaneous Store Retailers
TOTAL
249
Est. Sales/SF
$2,646,026,029
HKS | PEC | Office of Design | NV5 | Noell Consulting Group | Blue Cypress
$2,132,003,998
$514,022,031
$10,006
73%
$1,928,981,816
70%
$1,353,988,406
2,364
21,196
11,177
51,102
$385
188,987
250
Fayetteville Livable Centers Initiative (LCI) Study | DRAFT VERSION - DO NOT DISTRIBUTE
Appendix A | Market Study
Store Type (Excl. General Merch. & Gas)
Existing Population in Typical Store SF Local Trade Area
Market Depth for Estimated SF Adequate Store Demand for Subject Area Size
Furniture and Home Furnishings
2,145
0
0
Summary Of Estimated Retail Demand Furniture Stores
1,489
7,969
0
0
Home Furnishing Stores
656
4,214
0
0
Retail demand exists for a building material & supply store. Lowe’s and Home Depot are both located north of the subject area, so a candidate would most likely be an Ace Hardware / neighborhood serving type store. Demand exists within the trade area for a smaller grocery, with most of this demand coming from south and east of the subject area where households are under served. Given the nearby grocers a full-service large-scale national brand grocer is unlikely, but a smaller grocer such as a Lidl.
Electronics & Appliance Stores
735
6,577
0
0
Bldg. Materials, Garden Equipment & Supply
38,391
35,126
35,126
Bldg. Materials & Supply Stores
35,126
25,000
35,126
25,000
Lawn & Garden Equipment
3,265
4,200
0
0
There are small amounts of demand across various store types. While not enough for a standalone store, these uses could potentially fill stalls or portions of boutique lifestyle brand stores. Food service is the major driver of retail today and there appears to be significant demand for full-service restaurants as well as some demand for limited-service restaurants, a bar, and snack / drink shops such as a smoothie store or coffee shop. While not shown, NCG estimates an additional 10,000 15,000 SF of currently under-served population servicing businesses such as hair salon, banks, and child day care facilities.
Food & Beverage Stores
44,327
0
20,000
Grocery Stores
39,841
45,000
0
20,000
Specialty Food Stores
1,931
1,988
0
0
Beer, Wine & Liquor Stores
2,555
3,196
0
0
Health & Personal Care
15,425
12,544
12,544
12,544
Clothing & Clothing Accessories
2,124
0
0
Local Retail Rents
Clothing Stores
1,484
3,500
0
0
Shoe Stores
466
2,950
0
0
Jewelry, Luggage & Leather Goods
174
1,494
0
0
0
0
Property Name
Address
SF Leased
Price/SF
Rent Type
125-127 Pavilion Parkway
Shoppers World
30,000
$7.00
NNN
119-123 Pavilion Parkway
Ashley HomeStore
30,000
$7.30
NNN
Sporting Goods, Hobby, Musical Instrument
2,152
2,713
0
0
125-127 Pavilion Parkway
Burlington
49,000
$11.00
NNN
Book & Music Stores
212
2,674
0
0
725 E Lanier Ave
Farmers Insurance
1,250
$14.50
FS
0
0
1307 Glynn St
State Farm
1,400
$15.00
NNN
834 Glynn St
Ionic VR
1,820
$16.00
NNN
1240 Highway 54 W
The Skin Society
1,826
$18.50
NNN
105-113 Pavilion Parkway
BurgerIM
2,397
$29.00
NNN
100 Promenade Parkway
T-Mobile
3,000
$33.60
NNN
270 Glynn St N
Available
1,000 – 7,000
$14.50
NNN
Food Service & Drinking Places
51,102
535 Glynn St N
Available
1,200 – 6,300
$20.50
NNN
Full-Service Restaurants
26,466
Limited-Service Eating Places
Sporting Goods, Hobby, Book & Music
General Merch. Stores
HKS | PEC | Office of Design | NV5 | Noell Consulting Group | Blue Cypress
21,196
Department Stores
513
30,000
0
0
Warehouse Clubs and Superstores
20,683
80,000
0
0
6,164
6,164
Miscellaneous Store Retailers
11,177
Florists
568
1,424
0
0
Office Supplies, Stationery & Gifts
2,353
3,578
0
0
Used Merchandise Stores
2,092
2,500
0
0
Other Miscellaneous Store Retailers
6,164
2,000
6,164
6,164
51,102
51,102
3,212
26,466
26,466
14,902
2,400
14,902
14,902
Drinking Places (Alcoholic)
4,055
2,000
4,055
4,055
Snack / Non-Alcoholic Drink Places
5,679
2,100
5,679
5,679
TOTAL
251
2,364
188,987
104,936
124,936
252
Fayetteville Livable Centers Initiative (LCI) Study | DRAFT VERSION - DO NOT DISTRIBUTE
B 253
HKS | PEC | Office of Design | NV5 | Noell Consulting Group | Blue Cypress
Appendix : Community Survey
Fayetteville Livable Centers Initiative (LCI) Study | DRAFT VERSION - DO NOT DISTRIBUTE
Appendix B | Community Survey
Q2 What are the top places you go to in Downtown? (select three) Answered: 1,016
Fayette County Public Library
Community Engagement Survey
Southern Conservation...
Comprehensive Results
)%#-* )%#-* (#'* (#'*
Courthouse Square Downtown churches
Overview
Skipped: 25
((#%, ((#%, ,#'- ,#'-
Fayetteville City...
('#*- ('#*-
The community survey conducted in February 2021 yielded input from over a 1000 participants. Church Street Park
Q1: How Often do you go to Downtown Fayetteville? Answered: 1,031
)#)( )#)( &%#*( &%#*(
Amphitheater
Skipped: 10 Downtown restaurants ...
&'#&' &'#&'
Everyday
3-5 times per week
&.#+. &.#+.
1-2 times per week
&.#,. &.#,.
Heritage Park
(#)) (#))
Fayetteville City Cemetery
'#.* '#.*
Other (please specify) 0%
Every other week
&)#%+ &)#%+
'(#'- '(#'-
Rarely
10%
20%
30%
40%
50%
10%
20%
30%
40%
50%
60%
70%
80%
90% 100%
60%
70%
80%
90% 100%
ANSWER CHOICES
RESPONSES
Fayette County Public Library
40.85%
415
Southern Conservation Trust
3.25%
33
Courthouse Square
33.07%
336
Downtown churches
7.28%
74
Fayetteville City Hall/Fayette County Government Complex
32.58%
331
Church Street Park
4.43%
45
ANSWER CHOICES
RESPONSES
Everyday
12.12%
125
Amphitheater
10.53%
107
3-5 times per week
19.69%
203
Downtown restaurants and bars
67.91%
690
1-2 times per week
19.79%
204
Heritage Park
3.44%
35
Every other week
11.06%
114
Fayetteville City Cemetery
2.95%
30
Once a month
14.06%
145
Other (please specify)
14.47%
147
Rarely
23.28%
240
TOTAL
255
&)#), &)#),
&&#%+ &&#%+
Once a month
0%
+,#.& +,#.&
HKS | PEC | Office of Design | NV5 | Noell Consulting Group | Blue Cypress
1,031
Total Respondents: 1,016 #
OTHER (PLEASE SPECIFY)
DATE
256
Fayetteville Livable Centers Initiative (LCI) Study | DRAFT VERSION - DO NOT DISTRIBUTE
257
Appendix B | Community Survey
1
Restaurants Gremlin Growlers
3/19/2021 4:01 PM
44
Just passing through Driving Thru
2/26/2021 11:44 AM
2
Restaurants Diggers
3/19/2021 1:50 PM
45
Downtown area Downtown is not an happening place needs a new look
2/26/2021 8:48 AM
3
Icca Islamic community center
3/18/2021 8:47 PM
46
barbershop/salon Shenanigan’s hair salon
2/26/2021 1:07 AM
4
Parks/Open Spaces mcdonough park, pavillion
3/17/2021 7:14 PM
47
Restaurants Gremlin Growlers
2/25/2021 8:41 PM
5
Restaurants Restaurants
3/13/2021 10:39 AM
48
Stores Uniquely Gifted
2/25/2021 8:29 PM
6
Log Cabin
3/12/2021 6:22 PM
49
Restaurants Gremin Growlers
2/25/2021 8:28 PM
7
My workplace My office
3/12/2021 11:03 AM
50
Doctor/Dentist
2/25/2021 7:02 PM
8
mall The Mall
3/9/2021 5:44 PM
51
Restaurants Sam Burch’s
2/25/2021 6:39 PM
9
barbershop/salon Barbershop
3/6/2021 6:07 PM
52
Stores I LIVE IN THE CITY SO I WALK, SHOP AND VISIT NEIGHBORS THROUGHOUT
2/25/2021 5:28 PM
10
Downtown area Walk around the downtown area
3/6/2021 11:26 AM
53
Government Offices County Government Offices
2/25/2021 5:08 PM
11
post office post office, bank
3/5/2021 9:37 PM
54
My workplace I work at Ballard Law Office
2/25/2021 4:55 PM
12
No Comment/None No comment
3/5/2021 6:51 PM
55
Just passing through Passing through
2/25/2021 3:01 PM
13
Stores Stores
3/5/2021 9:46 AM
56
My workplace Work at the LEC
2/25/2021 2:53 PM
Stores Great Frame Up, Dentist
14
Stores Junk Mammas Store
3/5/2021 9:37 AM
57
Parks/Open Spaces Run/Walk through it.
2/25/2021 12:43 PM
15
bank Heritage Bank
3/5/2021 8:05 AM
58
Government Offices Board of Education
2/25/2021 8:55 AM
16
Restaurants City Cafe
3/4/2021 8:33 PM
59
Stores Dirty south strength and conditioning
2/25/2021 5:27 AM
17
barbershop/salon Hair Salon
3/4/2021 5:00 PM
60
School School
2/24/2021 9:44 PM
18
Downtown area American Legion log cabin
3/4/2021 7:46 AM
61
Restaurants City Cafe
2/24/2021 9:04 PM
19
Stores Downtown shops
3/3/2021 11:40 AM
62
My workplace I work right next to the cemetary
2/24/2021 5:13 PM
20
Stores Home Depot
3/3/2021 11:34 AM
63
Stores May visit SCT wen open
2/24/2021 3:04 PM
21
post office Post office
3/3/2021 9:28 AM
64
Just passing through Just driving through
2/24/2021 1:31 PM
22
Restaurants Twisted taco
3/3/2021 8:36 AM
65
Just passing through Only transit the area North and South bound
2/24/2021 11:37 AM
23
Doctor/Dentist Piedmont Hospital
3/2/2021 8:15 PM
66
bank
2/24/2021 10:41 AM
24
No Comment/None None of the above
3/2/2021 8:13 PM
67
My Home I live in the orange area
2/24/2021 8:20 AM
25
Doctor/Dentist Dentists
3/2/2021 4:50 PM
68
Restaurants City Cafe
2/24/2021 8:16 AM
26
Parks/Open Spaces Fayetteville Pavilion
3/2/2021 4:04 PM
69
Restaurants
2/24/2021 7:30 AM
27
Museum History museum
3/2/2021 12:04 PM
70
No Comment/None None
2/24/2021 7:03 AM
28
barbershop/salon Barber Shop (Sam’s)
3/2/2021 10:54 AM
71
Spa Spa
2/24/2021 6:22 AM
29
Restaurants Dunkin Donuts right off the square
3/2/2021 10:20 AM
72
2/24/2021 5:21 AM
30
bank The Southern Credit Union
3/2/2021 10:05 AM
Parks/Open Spaces Only time I visit downtown is when the county had the events like neon light night and vaccinate your dog day. It not a lot to do downtown that is kid friendly. I hope with this project there is more to do with families with small kids.
31
Stores Crystal Store
3/2/2021 9:10 AM
73
Government Offices Tag office/voting
2/24/2021 12:36 AM
Government Offices
Restaurants GOP HQ, bank, trstsurants
Stores Junk Mamas store, city cafe
32
Stores Shopping
3/2/2021 9:04 AM
74
Stores Businesses
2/24/2021 12:00 AM
33
Doctor/Dentist chiropractor/massage
3/2/2021 7:49 AM
75
Doctor/Dentist Chiropractor stores
2/23/2021 11:37 PM
34
My workplace Work and Home
3/2/2021 7:19 AM
76
My workplace My office
2/23/2021 11:28 PM
35
post office post office
3/1/2021 10:49 PM
77
Restaurants Eating
2/23/2021 11:11 PM
36
post office Post office and drycleaners
3/1/2021 9:29 PM
78
Parks/Open Spaces General walking around the whole area
2/23/2021 11:01 PM
37
Stores Kroger and Publix grocery store
3/1/2021 8:03 PM
79
Stores Junk Mama's
2/23/2021 10:54 PM
38
Stores Stores and parks
3/1/2021 4:21 PM
80
Doctor/Dentist
2/23/2021 10:46 PM
39
Parks/Open Spaces walking routine
3/1/2021 9:28 AM
81
Stores Specialty shops- antiques etc
2/23/2021 10:36 PM
40
My Home Residence in Lafayette Park Subdivision
2/28/2021 9:17 PM
82
My workplace Own a business there
2/23/2021 10:19 PM
41
post office Post Office
2/28/2021 6:23 PM
83
Stores Shops
2/23/2021 9:32 PM
42
barbershop/salon Hair Salon-Hair At the Square
2/27/2021 8:27 AM
84
Stores Junk Mamas General Store
2/23/2021 8:57 PM
43
bank Credit Union
2/26/2021 4:36 PM
85
Stores Junk Mama’s General Store
2/23/2021 8:50 PM
HKS | PEC | Office of Design | NV5 | Noell Consulting Group | Blue Cypress
Stores Mask Tire and Dentist
258
Fayetteville Livable Centers Initiative (LCI) Study | DRAFT VERSION - DO NOT DISTRIBUTE
Appendix B | Community Survey
86
Stores Gas station
2/23/2021 8:46 PM
87
Stores Shops
2/23/2021 8:11 PM
88
Stores Junk Mama’s General Store
2/23/2021 7:53 PM
89
Parks/Open Spaces Playing Pokemon Go in the Square
2/23/2021 7:00 PM
90
Restaurants Restaurants
2/23/2021 4:54 PM
91
No Comment/None None
2/23/2021 2:44 PM
92
School FCHS
2/23/2021 2:38 PM
93
bank Banking
2/23/2021 2:17 PM
94
My workplace Work
2/23/2021 1:48 PM
95
Stores Shopping
2/23/2021 1:08 PM
96
Just passing through drive through to get to work/ daughter's school
2/23/2021 12:12 PM
97
Government Offices FCBOE
2/23/2021 11:57 AM
98
Parks/Open Spaces May Harp Park
2/23/2021 11:52 AM
99
Doctor/Dentist Chiropractor
2/23/2021 10:30 AM
100
My workplace Work
2/23/2021 10:28 AM
101
Restaurants Dunkin’ Donuts
2/23/2021 10:05 AM
102
Government Offices city offices
2/23/2021 9:44 AM
103
No Comment/None No
2/23/2021 9:41 AM
104
Restaurants fast food
2/23/2021 9:30 AM
105
My Home Parks/Open Spaces My home is located downtown- on Grady Ave. we are walking/biking/playing in this area all the time.
2/23/2021 9:24 AM
106
Spa Spa
2/23/2021 9:10 AM
107
Stores Junk mamas, Shearnanigans salon
2/23/2021 9:08 AM
108
Stores Junk Mamasy
2/23/2021 8:21 AM
109
Restaurants Restaurant
2/23/2021 7:50 AM
110
Stores Reigning Victory Dance Studio
2/23/2021 7:42 AM
111
Restaurants Twisted Taco
2/23/2021 7:26 AM
112
My Home Parents home
2/23/2021 6:40 AM
113
School Fayette High
2/23/2021 6:32 AM
114
No Comment/None Other stuff
2/23/2021 6:27 AM
115
Stores Reigning Victory Dance Studio
2/23/2021 5:43 AM
116
Restaurants
Stores Restaurants and stores
2/23/2021 3:09 AM
117
Government Offices Courthouse (new, not old)
2/23/2021 2:03 AM
118
Parks/Open Spaces May Harp Park
2/23/2021 1:10 AM
119
Restaurants gremlin growlers
2/23/2021 12:10 AM
120
My workplace Work Place
2/23/2021 12:06 AM
121
Restaurants Gremlin Growlers
2/22/2021 11:55 PM
122
My workplace Work
2/22/2021 11:54 PM
123
bank BANK
2/22/2021 11:48 PM
124
Restaurants Gremlins Growlers
2/22/2021 11:39 PM
125
Restaurants Gremlin growlers
2/22/2021 11:36 PM
126
bank
2/22/2021 11:27 PM
127
post office Post office
2/22/2021 11:15 PM
128
Just passing through Drive through
2/22/2021 10:59 PM
259
post office
Stores Bank, post office, store
HKS | PEC | Office of Design | NV5 | Noell Consulting Group | Blue Cypress
129
My Home I live smack in the city
2/22/2021 10:52 PM
130
Doctor/Dentist Simply Chiropractic
2/22/2021 10:47 PM
131
My Home My property
2/22/2021 10:00 PM
132
Stores Shopping
2/22/2021 9:42 PM
133
Restaurants Dunkin Donuts
2/22/2021 9:40 PM
134
Stores Local stores
2/22/2021 9:23 PM
135
My Home
2/22/2021 8:41 PM
136
School Fayette County High School
2/22/2021 8:32 PM
137
Parks/Open Spaces Pavilion
2/22/2021 8:07 PM
138
bank Bank
2/22/2021 7:59 PM
139
post office Horrendous post office
2/22/2021 7:31 PM
140
My workplace Work
2/22/2021 7:27 PM
141
Government Offices Historical society
2/22/2021 7:14 PM
142
Restaurants Resturants
2/22/2021 6:40 PM
143
Stores Junk Mama's
2/22/2021 6:04 PM
144
My Home home
2/22/2021 4:35 PM
145
barbershop/salon J Sam’s Barbershop
2/22/2021 12:27 PM
146
Stores Jewelry store
2/19/2021 11:07 PM
147
Government Offices Fayettte County Tag Office
2/19/2021 7:52 AM
Parks/Open Spaces I live within that downtown area and I walk almost daily.
260
Fayetteville Livable Centers Initiative (LCI) Study | DRAFT VERSION - DO NOT DISTRIBUTE
Appendix B | Community Survey
Q3 Which of the following would encourage you to come to Downtown more often? Select all that apply. Answered: 1,035
Skipped: 6
(&#)% (&#)%
More parking
'*#(& '*#(&
More sidewalks More shops and restaurants
-'#'' -'#''
More variety of activities
Traffic Do something with traffic speed and volumn. Can't walk around without danger of being hit be cars.
3/16/2021 5:51 PM
4
Dog Park Dog Park
3/12/2021 9:02 PM
5
Traffic Much, much less traffic
3/11/2021 7:07 PM
6
Traffic Traffic Conditions
3/9/2021 5:44 PM
7
Crime Less crime from more apartments
3/9/2021 3:47 PM
8
Paths and exercise Mountain bike trails
3/6/2021 6:07 PM
9
Restaurants and bars Cool restaurants/outdoor dining
3/4/2021 5:00 PM
10
Dog Park Dog park
3/3/2021 11:20 PM
11
Pool and splashpad Pool
3/3/2021 6:52 PM
12
Crime
3/3/2021 1:00 PM
13
Design More inviting..aesthetically pleasing area, more driving space, less congestion between Stonewall, Lanier and Glynn. When entering the downtown area I would think nice shape lamp poles every so many feet apart. and turned on every night
3/3/2021 12:17 PM
14
Restaurants and bars More bars
3/3/2021 12:14 PM
15
Pool and splashpad Splashpad
3/3/2021 11:40 AM
16
Family Events more family activities
3/3/2021 11:16 AM
17
Pool and splashpad Community pool
3/2/2021 4:04 PM
18
Culture and Events Maybe a social committee to promote social activities (obviously while following DCD guidelines of social distancing, etc.)
3/2/2021 12:56 PM
19
Culture and Events Museums, art galleries
3/2/2021 12:04 PM
20
Dog Park dog park
3/2/2021 11:25 AM
21
Culture and Events Less racism!!
3/2/2021 9:10 AM
22
Dog Park Dog park!!!!!!
3/2/2021 7:12 AM
23
Culture and Events Fayetteville is growing faster than ever now. The large influx of new cultures and opportunities shows that Fayetteville could be on the path of exponential growth.
3/1/2021 11:33 PM
24
Paths and exercise outdoor eating, walkable
3/1/2021 10:49 PM
25
Playgrounds Playgrounds! Biking! Food!
3/1/2021 10:16 PM
*,#&% *,#&%
More greenspace a...
)-#+% )-#+% ))#%+ ))#%+
Multi-use paths More bike facilities
&,#(. &,#(.
Safer streets and spaces
')#&* ')#&*
Additional playground...
')#-( ')#-(
Other (please specify) 0%
.#), .#), 10%
20%
30%
40%
50%
60%
70%
80%
90% 100%
Traffic No more apartments! You are ruining Fayetteville! So much crime and traffic!
ANSWER CHOICES
RESPONSES
26
Paths and exercise More outdoor dining options and pedestrian spaces
3/1/2021 10:06 PM
More parking
31.40%
325
27
Culture and Events More activities for young adults
3/1/2021 7:34 PM
More sidewalks
25.31%
262
28
Dog Park More dog parks.
3/1/2021 5:13 PM
29
Traffic Less reckless drivers speeding.
3/1/2021 4:21 PM
30
Paths and exercise Public Basketball Gym or rec center
3/1/2021 4:07 PM
31
Culture and Events Events
2/28/2021 9:05 PM
32
Paths and exercise Make golf cart use accessible
2/27/2021 11:19 AM
33
Dog Park dog park
2/27/2021 11:14 AM
34
Traffic Easier traffic patterns
2/26/2021 9:43 AM
More shops and restaurants
82.22%
851
More variety of activities
57.10%
591
More greenspace and access to nature
48.60%
503
Multi-use paths
44.06%
456
More bike facilities
17.39%
180
Safer streets and spaces
24.15%
250
35
Dog Park Dog park
2/26/2021 4:20 AM
Additional playground facilities
24.83%
257
36
Dog Park Dog Park
2/26/2021 12:14 AM
Other (please specify)
9.47%
98
37
Dog Park We need a dog park
2/25/2021 8:41 PM
38
Retail liquor shop (bottle shop)
2/25/2021 7:02 PM
39
Design Better Lighting -Jack Demmering Way
2/25/2021 5:08 PM
Total Respondents: 1,035
261
3
#
OTHER (PLEASE SPECIFY)
DATE
40
Traffic less traffic congestion
2/25/2021 3:01 PM
1
Dog Park Pet Friendly spaces.
3/17/2021 6:31 PM
41
Restaurants and bars Getting the brewery that’s been approved
2/25/2021 12:59 PM
2
Traffic easier/less congested crosswalks (square area not very pedestrian friendly)
3/16/2021 6:00 PM
42
Dog Park DOG PARK!!!!
2/25/2021 12:43 PM
HKS | PEC | Office of Design | NV5 | Noell Consulting Group | Blue Cypress
262
Fayetteville Livable Centers Initiative (LCI) Study | DRAFT VERSION - DO NOT DISTRIBUTE
Appendix B | Community Survey
43
Retail more retail - wider sidewalks - mask mandate
2/25/2021 8:38 AM
83
Culture and Events Evening food trucks
2/23/2021 1:10 AM
44
Dog Park Dog park
2/24/2021 7:47 PM
84
Dog Park Dog park
2/22/2021 11:39 PM
45
Pool and splashpad Splash pad!!!
2/24/2021 6:59 PM
85
Public transport that could get me there
2/22/2021 11:15 PM
46
Traffic Better traffic flow, less traffic.
2/24/2021 4:52 PM
86
Dog Park Dog friendly
2/22/2021 11:12 PM
47
Wheelchair Accessibility If it was more wheelchair accessible
2/24/2021 1:39 PM
87
Culture and Events Turn Old Courthouse into Arts Center, for classes and exhibits
2/24/2021 1:31 PM
Culture and Events More diverse businesses and fewer Confederate-looking eateries. More culture is needed in doento. It's not a museum nor do we need to be reminded of "old town" Fayetteville.
2/22/2021 11:01 PM
48 49
Dog Park Dog parks. Look at
2/24/2021 11:44 AM
50
Paths and exercise More pedestrian friendly areas--like in Europe with their walkplatz center squares
2/24/2021 11:37 AM
51
Paths and exercise Golf cart paths
52
88
More interesting housing options. Big houses, courtyard communities, true lofts.
2/22/2021 10:20 PM
89
Paths and exercise Golf Cart Path
2/22/2021 9:43 PM
2/24/2021 11:06 AM
90
Culture and Events Entertainment venues
2/22/2021 8:57 PM
Dog Park Dog park
2/24/2021 10:48 AM
91
Retail liquor store
2/22/2021 8:54 PM
53
Paths and exercise Pedestrian only areas
2/24/2021 9:53 AM
92
Paths and exercise Golf Cart Paths
2/22/2021 8:48 PM
54
Family Events Outdoor community space for concerts in park, community festivals, family fun events
2/24/2021 8:59 AM
93
2/22/2021 8:41 PM
55
Paths and exercise Cart path connection down redwine
2/24/2021 8:04 AM
Paths and exercise more Greenspace so you dont always have to be adjacent to the extremely loud roads. Some pretty quiet areas to have picnics with friends and grab a coffee or sweets. Activities in a quieter place than the courthouse square. Seasonal activities like ice skating.
56
Traffic Removing the 2 highways that run through.
2/24/2021 7:12 AM
94
Culture and Events Art Center
2/22/2021 8:18 PM
57
Paths and exercise Downtown needs to make visitors safe and welcome; moms with strollers don’t even feel comfortable walking around downtown with their kids right now as things are!
2/24/2021 6:32 AM
95
Wheelchair Accessibility Wheelchair accessible parking and access to restaurants
2/22/2021 8:16 PM
96
Culture and Events farmer's market, bagel shop, outside exercise or yoga classes, dog park, bike racks
2/21/2021 12:16 AM
58
Crime Less crime
2/24/2021 12:00 AM
97
Design Better maintained sidewalks, TRASH CANS and lighting
2/23/2021 11:01 PM
Paths and exercise Wider Sidewalks. Eliminate the four parking spaces in front of businesses on Glynn Street for wider pedestrian spaces and outdoor seating.
2/20/2021 9:45 PM
59 60
All the above
2/23/2021 10:36 PM
98
2/19/2021 6:59 PM
61
Paths and exercise Golf cart paths
2/23/2021 10:34 PM
Wheelchair Accessibility WHEELCHAIR ACCESSIBLE FEATURES (playground, picnic benches, gazebos and anything else you put in there!!)
62
Culture and Events A theater
2/23/2021 9:49 PM
63
Paths and exercise Bike lanes
2/23/2021 8:45 PM
64
Pool and splashpad Splash park
2/23/2021 3:26 PM
65
Culture and Events Art , Fine wine and food ,and music events. Modern look
2/23/2021 3:20 PM
66
Playgrounds Parks and playgrounds, picnic area
2/23/2021 12:58 PM
67
Restaurants and bars A brewery!! Or two
2/23/2021 12:24 PM
68
Shipping Container Shops for Small Businesses
2/23/2021 11:52 AM
69
Traffic Less traffic. It’s aweful
2/23/2021 11:16 AM
70
Traffic Less traffic.
2/23/2021 10:22 AM
71
Family Events More family friendly events
2/23/2021 10:17 AM
72
Paths and exercise side walks that would connect. There are sidewalks that just end. I would walk to downtown if I would not have to walk on the side of the road with no sidewalks!
2/23/2021 9:57 AM
73
Pool and splashpad Splash pad or other outdoor gathering spaces
2/23/2021 9:53 AM
74
Traffic Better traffic control. The traffic at 54/85 just keeps getting worse and worse. Also, better accessibility for the disabled.
2/23/2021 9:30 AM
75
Pool and splashpad Splash pad- we have 3 small kids
2/23/2021 9:24 AM
76
Restaurants and bars Less "chain" restaurants; must stress more variety of activities
2/23/2021 9:17 AM
77
Restaurants and bars Need more restaurants and I know people like food trucks
2/23/2021 9:10 AM
78
Family Events More family friendly businesses. More night life options for date nights.
2/23/2021 9:01 AM
79
Restaurants and bars More restaurants
2/23/2021 7:34 AM
80
Restaurants and bars Good restaurants not fast food chains
2/23/2021 7:29 AM
81
Restaurants and bars Non-chain shops and restaurants
2/23/2021 7:01 AM
82
Paths and exercise Golf cart patas, gated playgrounds
2/23/2021 1:56 AM
Q4 Which of the following segments of the Fayetteville community, if any, do you feel could be better supported by additional housing options Downtown? Answered: 1,021
None of the above
&+#)* &+#)*
Young professional...
HKS | PEC | Office of Design | NV5 | Noell Consulting Group | Blue Cypress
*'#%& *'#%&
Families with children age...
()#*, ()#*,
Empty-nesters (families wh...
(.#.+ (.#.+ &*#(- &*#(-
Retirees 75+ Families with live-in elde...
&'#&) &'#&)
People with disabilities
&)#'% &)#'%
Other (please specify) 0%
263
Skipped: 20
)#+% )#+% 10%
20%
30%
40%
50%
60%
70%
80%
90% 100%
264
Fayetteville Livable Centers Initiative (LCI) Study | DRAFT VERSION - DO NOT DISTRIBUTE
Appendix B | Community Survey a mix of all of the above
2/23/2021 4:01 PM
27
No More Housing NO to housing!
2/23/2021 2:38 PM
ANSWER CHOICES
RESPONSES
None of the above
16.45%
168
28
No More Housing NO MORE APARTMENTS
2/23/2021 11:16 AM
Young professionals (recent high school and college graduates)
52.01%
531
29
White collar professionals looking for luxury living close to retail and without home maintenance.
2/23/2021 10:25 AM
Families with children ages 18 and younger
34.57%
353
30
You need much more night life before young folks will want to live there
2/23/2021 9:10 AM
Empty-nesters (families where children have grown up and moved out)
39.96%
408
31
No More Housing I do not think the city center is well suited for housing
2/23/2021 7:35 AM
Retirees 75+
15.38%
157
32
Singles (any age) Singles and middle age without children.
2/23/2021 6:46 AM
Families with live-in elderly family members
12.14%
124
33
Just be inclusive
2/23/2021 4:46 AM
People with disabilities
14.20%
145
34
Anything except apartments
2/23/2021 3:09 AM
Other (please specify)
4.60%
47
35
Low Income Affordable homes for younger families
2/23/2021 1:56 AM
36
High income housing
2/23/2021 1:30 AM
37
Singles (any age) Singles and 28 to 55 year olds
2/22/2021 11:01 PM
Total Respondents: 1,021
265
26
#
OTHER (PLEASE SPECIFY)
DATE
38
All
2/22/2021 9:47 PM
1
Mid age professionals
3/17/2021 8:15 PM
39
2/22/2021 8:57 PM
2
Low Income Low income
3/5/2021 8:43 AM
No More Housing Downtown should be a quaint business district, keep high density housing out
3
No More Housing Prefer limited additional housing in downtown
3/5/2021 8:31 AM
40
Couples Young college educated married couples with good income
2/22/2021 8:18 PM
4
No More Housing No more housing downtown, crowded enough
3/3/2021 3:17 PM
41
No More Housing Stop building dense housing.
2/22/2021 8:00 PM
5
Depends on job type and locations
3/2/2021 12:57 PM
42
No More Housing Don't want to see housing in downtown.
2/22/2021 7:31 PM
6
Retirees Retirees especially need community within easy access
3/2/2021 12:04 PM
43
Film Industry Employees
2/22/2021 6:15 PM
7
Couples Double Income No Kid couples
3/2/2021 7:49 AM
44
Low Income We need lower cost housing options. Teachers, cops, etc. need affordable housing options, too.
2/22/2021 5:54 PM
8
Low Income The individuals who are less fortunate in Fayetteville. As of now, all the places are hidden away where no one goes. Just a bit of a push of support for them to become more stable.
3/1/2021 11:33 PM
45
Couples young newlyweds without kids
2/21/2021 12:16 AM
46
We need everyone.,.,.,.,to comment an be heard
3/1/2021 8:17 PM
I believe all of the above groups could benefit from appropriate housing and facilities in the downtown district. But young people/families will provide growth for our town and need to be a priority.
2/20/2021 9:45 PM
9 10
Diversity of ethnicity
3/1/2021 8:03 PM
47
Depends on the housing built.
3/1/2021 7:04 PM
People-oriented housing and walkable neighborhood design should be encouraged in general. All the above groups of people should be accommodated for. Fayette County is losing young people at an alarming rate, so a concentrated focus on them is important.
2/20/2021 9:45 PM
11 12
Singles (any age) Single adults with dogs.
3/1/2021 5:13 PM
13
No More Housing Do you believe we need more housing options in Downtown? We wouldn't like to have a nightmare downtown, but a balance between a city and an urban community.
3/1/2021 4:21 PM
14
Hi
2/28/2021 9:17 PM
15
No opinion
2/27/2021 11:19 AM
16
Disabled
Retirees Affordable Housing for Elderly and Disabled
2/26/2021 1:02 PM
17
Singles (any age) Single individuals that work for Fayette County
2/26/2021 6:43 AM
18
Low Income Facilities for people in need, homeless, abused
2/25/2021 5:35 PM
19
empty lot between DD and Ford would be great location for a smaller housing unit for people without children who would enjoy walking to downtown. I am not sure we should be adding housing on a larger scale than that.
2/25/2021 8:38 AM
20
Housing 100k-150k
2/24/2021 7:58 PM
21
Singles (any age) Single MOMS!!!
2/24/2021 6:59 PM
22
Couples Couples who have decided to not have children, singles of any age
2/24/2021 4:27 PM
23
High school students. No jobs no recreation
2/24/2021 11:44 AM
24
Low Income Poor people, like me, who have college degrees and jobs and still can’t afford more than $800/mth apartments
2/23/2021 7:00 PM
25
Politicians and developers
2/23/2021 6:28 PM
26
a mix of all of the above
2/23/2021 4:01 PM
HKS | PEC | Office of Design | NV5 | Noell Consulting Group | Blue Cypress
266
Fayetteville Livable Centers Initiative (LCI) Study | DRAFT VERSION - DO NOT DISTRIBUTE
Appendix B | Community Survey
Q5 Taking into account your answer to question 4, which of the following housing types and/or programs would you support seeing more of (or being incorporated into) Downtown? Answered: 974
Accessory dwelling units
Skipped: 67
.#)* .#)* )&#,. )&#,.
Townhomes Cottages (housing on...
)'#)% )'#)% &)#,- &)#,-
Apartments
'.#*, '.#*,
Condos Entry level housing for...
(%#-% (%#-%
Aƅordable housing for...
('#,* ('#,*
Programs to support...
'(#+& '(#+&
Assisted housing
,#+% ,#+%
Duplex/triplex/ quadplex
.#** .#**
Other (please specify) 0%
&(#.+ &(#.+ 10%
20%
30%
40%
50%
60%
80%
90% 100%
OTHER (PLEASE SPECIFY)
DATE
1
No More Housing No more housing. Traffic and crime is a nightmare!
3/19/2021 1:50 PM
2
No More Housing None
3/18/2021 8:43 PM
3
Mixed Use Housing Cooperatives
3/16/2021 3:33 PM
4
No More Housing None
3/16/2021 7:47 AM
5
No More Housing too crowded now
3/14/2021 12:39 AM
6
Owner-occupied Housing Properties that have to be owned not rented
3/9/2021 3:47 PM
7
No More Housing None. Plenty of options outside of downtown.
3/8/2021 12:09 PM
8
live/work spaces
3/7/2021 12:30 PM
9
Affordable Housing Mixed Affordable Housing
3/5/2021 9:46 AM
10
Tiny Homes Tiny homes
3/5/2021 8:43 AM
11
No More Housing None
3/4/2021 7:40 PM
12
Affordable Housing Housing with inlaw suites
3/3/2021 9:14 PM
13
No More Housing None
3/3/2021 6:52 PM
14
No More Housing Don't want anymore
3/3/2021 5:22 PM
15
No More Housing No more housing
3/3/2021 3:17 PM
16
No More Housing none
3/3/2021 2:32 PM
17
Single Family Homes Houses only
3/3/2021 1:00 PM
18
No More Housing None too many houses being built on small lots being built.
3/3/2021 12:35 PM
19
No More Housing No housing in downtown area
3/3/2021 12:17 PM
20
Single Family Homes Quality 3Br 2ba homes for young families in good districts
3/3/2021 11:40 AM
21
No More Housing none of the above
3/3/2021 11:16 AM
22
Affordable Housing Affordable housing for the group you’d like to attract.
3/3/2021 4:37 AM
23
No More Housing None
3/2/2021 8:13 PM
24
No More Housing No housing should be downtown
3/2/2021 5:19 PM
25
Tiny Homes Tiny homes
3/2/2021 12:57 PM
26
No More Housing None.
3/2/2021 12:56 PM
27
elevators or no stairs
3/2/2021 12:04 PM
28
No More Housing No additional housing
3/2/2021 11:43 AM
29
No More Housing NONE traffic already bad
3/2/2021 7:19 AM
30
Only high in living complexes
3/2/2021 6:48 AM
ANSWER CHOICES
RESPONSES
Accessory dwelling units
9.45%
92
Townhomes
41.79%
407
31
No More Housing none
3/2/2021 5:45 AM
Cottages (housing on limited size lots)
42.40%
413
32
No More Housing None
3/2/2021 1:04 AM
Apartments
14.78%
144
33
Lofts Lofts apartment
3/1/2021 10:00 PM
Condos
29.57%
288
34
No More Housing None
3/1/2021 8:18 PM
Entry level housing for recent graduates
30.80%
300
35
No More Housing I don’t think we need more housing downtown.
3/1/2021 7:04 PM
32.75%
319
36
No More Housing None
3/1/2021 5:17 PM
Affordable housing for retirees
37
single room occupancy housing.
3/1/2021 5:13 PM
Programs to support existing homeowners (such as rehabilitation)
23.61%
230
38
7.60%
74
No More Housing Fayetteville is growing too fast. I don't want to see it in 10 years over crowded with all the problems big cities have.
3/1/2021 4:21 PM
Assisted housing Duplex/triplex/quadplex
9.55%
93
39
No More Housing No more apartments, townhomes-this causes increase in traffic, congestion of space. Preserve and restore what’s there.
3/1/2021 3:20 PM
Other (please specify)
13.96%
136
40
No opinion
2/27/2021 11:19 AM
41
Single Family Homes Single family residence
2/26/2021 8:39 PM
Total Respondents: 974
267
70%
#
HKS | PEC | Office of Design | NV5 | Noell Consulting Group | Blue Cypress
268
Fayetteville Livable Centers Initiative (LCI) Study | DRAFT VERSION - DO NOT DISTRIBUTE
269
Appendix B | Community Survey
42
No More Housing Why destroy the town square? We moved to this town for what it was.. Not what you are doing to it.
2/26/2021 9:43 AM
43
No More Housing None of the above
2/26/2021 8:46 AM
44
Affordable Housing Affordable housing for singles
2/26/2021 6:43 AM
45
Affordable Housing Airedale housing in general for current Fayetteville residents
2/26/2021 6:03 AM
46
No More Housing none
2/26/2021 5:55 AM
47
No More Housing would prefer to see more businesses, not housing downtown. while I understand the need to bring in the work/play/live aspect - I feel like more retail/restaurants, greenspace would benefit this town.
2/25/2021 11:10 PM
48
No More Housing None
49
tiny homes. Single family only with at least 1 acre lots. 80
Mixed Use Housing Live, work, play village’s.see Berry Farm south of Franklin TN.
2/23/2021 11:40 AM
81
No More Housing none there is enough housing already
2/23/2021 11:13 AM
82
No More Housing Standard homes with at least ¹/² acre lots
2/23/2021 10:42 AM
83
Affordable Housing Affordable apartments/lofts above storefronts
2/23/2021 10:30 AM
84
No More Housing None.. Fayetteville does not need to grow. We have too much traffic now.
2/23/2021 10:22 AM
85
No More Housing None I’d rather have more activities not housing. It will cause even more traffic/side street parking
2/23/2021 9:53 AM
2/25/2021 9:16 PM
86
No More Housing None
2/23/2021 9:22 AM
No More Housing Too crowded now - don't need any more housing in downtown area.
2/25/2021 6:01 PM
87
No More Housing NONE- the streets can't take the extra traffic
2/23/2021 8:40 AM
50
See answer above
2/25/2021 5:35 PM
88
No More Housing None. We need more restaurants and activities and less housing downtown.
2/23/2021 8:34 AM
51
No More Housing do not support, traffic too bad already
2/25/2021 3:01 PM
89
No More Housing Don’t want housing in Downtown
2/23/2021 8:15 AM
52
Affordable Housing
Tiny Homes An affordable tiny house development for young adults
2/25/2021 2:53 PM
90
No More Housing Don’t see a problem with out housing
2/23/2021 7:51 AM
53
No More Housing None. I think there is plenty of housing around Fayetteville City, there is just nothing to do in the city.
2/25/2021 12:43 PM
91
No More Housing None
2/23/2021 7:41 AM
54
No More Housing I don't think we need any more housing
2/25/2021 10:51 AM
92
No More Housing I do not think the city center is well suited for housing
2/23/2021 7:35 AM
55
if we add apartments it should be on a smaller scale
2/25/2021 8:38 AM
93
No More Housing None.
2/23/2021 7:14 AM
56
Affordable Housing Affordable Housing for Teachers and Families
2/24/2021 7:58 PM
94
Stop letting churches in and hospice centers
2/23/2021 6:33 AM
57
No More Housing Non of the above, too crowded already. Plenty of spaces to live outside of the downtown area.
2/24/2021 4:52 PM
95
Mixed Use Housing Live/work/play setup would be most efficient!
2/23/2021 6:20 AM
96
No More Housing none
2/23/2021 5:36 AM
58
No More Housing None of the above
2/24/2021 3:17 PM
97
No More Housing None
2/23/2021 5:35 AM
59
No More Housing More residential density always leads to more traffic, so less quality of downtown business enjoyment -- Downtown Fayetteville was never meant to be an urban center.
2/24/2021 1:31 PM
98
Mixed Use Housing Mixed use development- move county complex !
2/23/2021 5:12 AM
99
No More Housing None
2/23/2021 3:29 AM
60
Single Family Homes Single family homes
2/24/2021 8:41 AM
100
Affordable Housing
101
No More Housing None of these. They lower the income bracket and attract the wrong type of residence
2/23/2021 1:30 AM
102
No More Housing Housing above street level businesses. Or no housing at all. Traffic sucks.
2/23/2021 1:10 AM
103
No More Housing No more buildings!
2/23/2021 12:07 AM
104
No More Housing None
2/22/2021 11:55 PM
105
No More Housing No housing downtown
2/22/2021 11:44 PM
106
No More Housing None.
2/22/2021 11:31 PM
107
No More Housing None
2/22/2021 11:27 PM
108
Mixed Use Housing Live/work with the 1st floor business & the remaining floors residences
2/22/2021 11:12 PM
109
Single Family Homes Rowhouses/Townhomes for Single-Family living. 2 luxury apartments maybe by Post Properties; make both types of dwellings gated communities
2/22/2021 11:01 PM
110
Affordable Housing Affordable housing for all. I can't buy a house for me and my children. Prices are outrageous and unobtain
2/22/2021 10:34 PM
111
No housing, more variety in the types of businesses, more restaurants- no chain restaurants. Outdoor dining, more would love to see a weekly farmer’s market similar to the one in PTC.
2/22/2021 9:58 PM
Single Family Homes
Tiny Homes Affordable family homes
2/23/2021 1:56 AM
61
No More Housing None....too much congestion
2/24/2021 8:41 AM
62
No More Housing None
2/24/2021 7:12 AM
63
No More Housing None. Build up downtown with no living spaces. Would add traffic and extra cars to the area.
2/24/2021 7:10 AM
64
Mixed Use Housing I would love to see multi use buildings with retails shops on the ground level and apartments above
2/24/2021 6:32 AM
65
No More Housing The square does not need anymore housing
2/24/2021 4:53 AM
66
Anything that interest the young people
2/24/2021 1:16 AM
67
No More Housing No housing
2/23/2021 10:19 PM
68
Live/work spaces
2/23/2021 10:07 PM
69
No More Housing Do not add any
2/23/2021 8:46 PM
70
No More Housing None
2/23/2021 8:31 PM
71
Affordable Housing Make it AFFORDABLE
2/23/2021 7:00 PM
72
No More Housing No new high density development
2/23/2021 6:28 PM
73
No More Housing None of the above.
2/23/2021 2:49 PM
112
No More Housing None
2/22/2021 9:22 PM
74
No More Housing There is no place for additional housing. To crowed now
2/23/2021 2:44 PM
113
No More Housing None
2/22/2021 8:57 PM
75
No More Housing NO to housing!
2/23/2021 2:38 PM
114
Single Family Homes Standard single houses
2/22/2021 8:53 PM
76
No More Housing Full size homes.
2/23/2021 1:30 PM
115
Lofts Lofts
2/22/2021 8:47 PM
77
No More Housing None
2/23/2021 12:43 PM
116
Single Family Homes Single family homes with garages
2/23/2021 12:24 PM
Mixed Use Housing I would only support apartments or condos that are multi use (stores on the bottom, housing on top)
2/22/2021 8:41 PM
78 79
No More Housing
2/23/2021 11:55 AM
117
No More Housing None, we need more and varied activities for downtown, not more housing
2/22/2021 8:32 PM
Single Family Homes
Tiny Homes No apartments, condos, duplex, or
HKS | PEC | Office of Design | NV5 | Noell Consulting Group | Blue Cypress
270
Fayetteville Livable Centers Initiative (LCI) Study | DRAFT VERSION - DO NOT DISTRIBUTE
Appendix B | Community Survey
118
No More Housing No housing
2/22/2021 8:29 PM
119
Single Family Homes Single Family housing like Apple Orchard
2/22/2021 8:18 PM
120
Single Family Homes Larger acreage lots and single family homes
2/22/2021 8:07 PM
121
This has to do with question 4, not 3. Same answer, stop building dense housing
2/22/2021 8:00 PM
122
Mixed Use Housing Mixed use live above retail/restaurant
2/22/2021 7:56 PM
123
No More Housing None of the above
2/22/2021 7:32 PM
124
No More Housing No housing please. This area can't support the additional traffic.
2/22/2021 7:31 PM
125
No More Housing NA would like shopping and restaurants but not housing
2/22/2021 7:28 PM
126
No More Housing None
2/22/2021 7:14 PM
127
Single Family Homes Single family housing
2/22/2021 7:12 PM
128
No More Housing None of the above no need for housing downtown
2/22/2021 6:55 PM
129
Mixed Use Housing Live/work combo
2/22/2021 6:29 PM
130
No More Housing None
2/22/2021 6:11 PM
131
Single Family Homes Single family
2/22/2021 6:08 PM
132
No More Housing Not interested in housing being placed Downtown
2/22/2021 5:50 PM
133
Lofts Apple orchard style, Alexandria VA or Pinewood Forest, possibly single story Loft on top of storefronts - - not cookie cutter mass produced housing or multi-story that will detract from charm of Town Square)
2/21/2021 12:16 AM
134
Mixed Use Housing I would LOVE to see multi-use buildings on the square/downtown grid (shops on bottom and apartments on top). I also think more of the higher density condos (like the spencer square subdivision by ihop) would thrive in Fayetteville.
2/20/2021 9:45 PM
Single Family Homes It is easy to do one of the extremes of providing high density apartments or large single family homes. Where most people want to be is in the “missing middle” of housing options. I support all varieties of housing downtown, but a concentrated effort on ADU’s duplexes, triplexes, quadplexes, and six-plexes should be sought.
2/20/2021 9:45 PM
Lofts Loft style above businesses; no large apartment or condo complexes
2/20/2021 12:58 PM
135
136
Townhomes (attached...
&%#,% &%#,% '%#(( '%#((
Apartment or condo buildi...
&.#,* &.#,* '*#(' '*#('
271
HKS | PEC | Office of Design | NV5 | Noell Consulting Group | Blue Cypress
Apartment or condo buildi...
,#.- ,#.- Apartment or condo buildi...
&%#,* &%#,*
+#-. +#-.
+#-, +#-,
)#'. )#'.
-#,+ -#,+
+#+. +#+.
*)#(& *)#(& &)#', &)#', Duplex/triplex/ quadplex
0%
)&#-& )&#-&
-#+% -#+%
&'#%) &'#%)
&*#,+ &*#,+
,#&) ,#&)
Skipped: 7
'+#%% '+#%%
,)#&* ,)#&*
-#*' -#*'
Q6 On a scale of 1 to 5 (with 1 being not supportive and 5 being very supportive), how supportive are you of furthering the development of the following housing types downtown. Answered: 1,034
+&#*. +&#*.
10%
20%
& " Cdi Hjeedgi^kZ
30%
40%
50%
60%
'
(
)
* " KZgn Hjeedgi^kZ
1 - NOT SUPPORTIVE
70%
80%
90% 100%
2
3
4
5 - VERY SUPPORTIVE
TOTAL
WEIGHTED AVERAGE
Townhomes (attached single family homes)
26.00% 266
8.60% 88
20.33% 208
19.75% 202
25.32% 259
1,023
3.10
Apartment or condo buildings (2-3 stories)
41.81% 426
10.70% 109
18.35% 187
15.21% 155
13.94% 142
1,019
2.49
Apartment or condo buildings (4-6 stories)
61.59% 619
12.04% 121
10.75% 108
6.87% 69
8.76% 88
1,005
1.89
Apartment or condo buildings (6-8 stories)
74.15% 743
7.98% 80
6.89% 69
4.29% 43
6.69% 67
1,002
1.61
Duplex/triplex/quadplex
54.31% 548
14.27% 144
15.76% 159
8.52% 86
7.14% 72
1,009
2.00
&-#(* &-#(* &*#'& &*#'& &(#.) &(#.)
272
Fayetteville Livable Centers Initiative (LCI) Study | DRAFT VERSION - DO NOT DISTRIBUTE
Appendix B | Community Survey
Q7 Currently, for what types of retail and/or services do you leave Fayetteville for, but would like to be able to do in Downtown in the future? Select all that apply. Answered: 1,027
Grocery shopping
Skipped: 14
&.#&- &.#&- ,,#+% ,,#+%
Eating out Clothes, gifts, or ot...
*,#-) *,#-)
Indoor recreational...
*)#+( *)#+(
Patio and outdoor café...
,'#&* ,'#&*
Indoor exercise (su...
'*#(' '*#('
Visits to doctor, dent...
&.#-+ &.#-+
Other (please specify) 0%
-#(, -#(, 10%
20%
30%
40%
50%
60%
70%
80%
Restaurants Fine dining
3/4/2021 7:29 AM
9
Restaurants
3/4/2021 7:03 AM
10
Arts & Culture Art classes
3/3/2021 11:20 PM
11
Bookstore Bookstore, greeting card stores
3/3/2021 9:14 PM
12
NA-Downtown has it all Don't leave. Everything I want is here
3/3/2021 5:22 PM
13
NA-Downtown has it all none
3/3/2021 3:17 PM
14
Organic food stores Fayetteville is lacking in organic foods, & general options
3/3/2021 11:40 AM
15
Outdoor Activities Outdoor activities
3/3/2021 11:02 AM
16
Organic food stores Trader joe's, or whole foods
3/2/2021 12:57 PM
17
Outdoor Activities outdoor playground for kids
3/2/2021 11:00 AM
18
Liquor Store Liquor Store
3/2/2021 10:54 AM
19
Liquor Store Liquor Store
3/2/2021 10:07 AM
20
Breweries
3/2/2021 7:49 AM
21
Arts & Culture Car Shows
3/2/2021 7:19 AM
22
Restaurants Places like Truetts Luau where eateries are familiar but different
3/1/2021 11:33 PM
23
Outdoor Activities
3/1/2021 10:49 PM
24
Dog Park Parks
3/1/2021 9:44 PM
25
Dog Park More dog parks, biking and hiking paths.
3/1/2021 5:13 PM
26
Outdoor Activities Passive recreational areas
3/1/2021 4:21 PM
27
Liquor Store Liquor Store
3/1/2021 3:44 PM
28
Restaurants I think more so the luxury/formal items that are usually at the major malls. I think that would be a good investment to have to be well rounded. Maybe a few more mid level dining options-enough of the fast food chains!
3/1/2021 3:20 PM
29
Outdoor Activities Walking/Biking Paths
2/28/2021 6:23 PM
90% 100%
Stores Coffee shops and indoor children’s activities
Restaurants micro brewery with out door recreation
Restaurants walkable spaces. Go for a walk, stop at cafe
ANSWER CHOICES
RESPONSES
30
Stores nail salon
2/28/2021 6:23 PM
Grocery shopping
19.18%
197
31
Stores Tattoo shops, indoor activities like ax throwing
2/26/2021 4:38 PM
Eating out
77.60%
797
32
Liquor Store Package Store
2/26/2021 11:44 AM
Clothes, gifts, or other general shopping
57.84%
594
33
Organic food stores How about justake the stores we have not have rotten food or almost past due meat..
2/26/2021 9:43 AM
Indoor recreational activities, such as shows, theatres, or movies
54.63%
561
34
Dog Park Dog Park / Water Pad for kids
2/26/2021 4:20 AM
Patio and outdoor café dining
72.15%
741
35
Dog Park Dog Park
2/26/2021 12:14 AM
Indoor exercise (such as yoga, indoor training, gym, etc.)
25.32%
260
36
Dog Park Dog park
2/25/2021 8:41 PM
Visits to doctor, dentist or other personal services
19.86%
204
37
Breweries Breweries!
2/25/2021 7:55 PM
Other (please specify)
8.37%
86
38
Organic food stores Health food conscious grocery stores
2/25/2021 5:35 PM
39
Arts & Culture Arts and Culture
40
Outdoor Activities
Total Respondents: 1,027
273
8
Restaurants
2/25/2021 5:22 PM Stores play space for kids outdoors, coffee shop
2/25/2021 4:53 PM
#
OTHER (PLEASE SPECIFY)
DATE
41
EVERYTHING
2/25/2021 12:43 PM
1
Organic food stores specifically-ORGANIC grocery stores
3/17/2021 7:14 PM
42
Arts & Culture Theatre ( Movie and Live)
2/25/2021 12:20 AM
2
Restaurants Better Resturants (e.g., Houstons, Ruth Chris)
3/16/2021 7:02 PM
43
Arts & Culture Dancing, etc
2/24/2021 9:06 PM
3
Restaurants Non franchised restaurants
3/16/2021 1:03 PM
44
Outdoor Activities Green spaces
2/24/2021 7:58 PM
4
Arts & Culture Activities that are more cultural; activities for children
3/14/2021 7:48 PM
45
Stores Local fine arts and artisan shops.
2/24/2021 4:52 PM
5
Liquor Store Alcohol purchase
3/5/2021 9:37 AM
46
Arts & Culture Arts and Crafts Center
2/24/2021 1:31 PM
6
Outdoor Activities Outdoor exercise
3/5/2021 8:43 AM
47
Arts & Culture Evening entertainment like dancing or live music
2/24/2021 11:44 AM
7
Restaurants
3/4/2021 8:33 PM
48
Bookstore
2/24/2021 4:54 AM
Stores Coffee shop
HKS | PEC | Office of Design | NV5 | Noell Consulting Group | Blue Cypress
Stores Bookstore
274
Fayetteville Livable Centers Initiative (LCI) Study | DRAFT VERSION - DO NOT DISTRIBUTE
275
Appendix B | Community Survey
49
Arts & Culture Art classes
2/24/2021 12:00 AM
50
Restaurants Microbrewery
2/23/2021 10:40 PM
51
Liquor Store Liquor store
2/23/2021 9:33 PM
52
Stores Container store
2/23/2021 9:01 PM
53
NA-Downtown has it all Fayetteville has everything
2/23/2021 8:46 PM
54
Arts & Culture
2/23/2021 8:46 PM
55
Stores Cycling shops
2/23/2021 8:45 PM
56
Work
2/23/2021 5:21 PM
57
Outdoor Activities Green spaces.
2/23/2021 4:51 PM
58
NA-Downtown has it all None. More development is inviting Riverdale/Clayton county residents into fayette.
2/23/2021 12:43 PM
59
Arts & Culture More of a Ponce City Market and Little Five Points feel
2/23/2021 11:52 AM
60
Stores None. I shop online.
2/23/2021 10:18 AM
61
Dog Park Playground!!! We often drive all the way to Newnan, Senioa or Peachtree City to get to a really good park.
2/23/2021 9:24 AM
62
Arts & Culture
Nightlife Night life. Date nights with live music. Live music
2/23/2021 9:01 AM
63
NA-Downtown has it all I would prefer no expan soon or increase in downtown fayetteville. I moved here because it was a bedroom community.
2/23/2021 8:59 AM
64
Grocery store Small grocer with affordable pricing
2/23/2021 8:15 AM
65
Breweries Locally owned and operated drinking/dining/brewery
2/23/2021 8:11 AM
66
Liquor Store Plant store, home decor, antiques
2/23/2021 7:09 AM
67
Stop letting churches in and hospice centers
2/23/2021 6:33 AM
68
Stores Spa/massage and Art/photography/music/sewing/computing classes
2/23/2021 1:10 AM
69
NA-Downtown has it all I don't want to do any of these in Fayetteville.
2/23/2021 12:07 AM
70
Privite owned, no "chains"
2/22/2021 11:55 PM
71
Dog Park Dog park
2/22/2021 11:04 PM
72
NA-Downtown has it all None really...
2/22/2021 10:56 PM
73
Organic food stores Specialty food - deli, bread bakery, imported goods
2/22/2021 10:42 PM
74
No more drive through eateries
2/22/2021 8:56 PM
Nightlife Nightlife
Liquor Store Liquor!!! Good lord let us have a liquor store
2/22/2021 8:54 PM
76
Dog Park Dog Park
2/22/2021 8:53 PM
77
Organic food stores Outdoor Activities the biking (golf cart) trails in PTC. Quiet walking trails at lake horton. Really nice playground in Senoia. Farmers market in PTC.
2/22/2021 8:41 PM
78
Arts & Culture shows
2/22/2021 8:32 PM
79
Liquor Store Package Store
2/22/2021 8:03 PM
80
Arts & Culture
2/22/2021 7:56 PM
81
Dog Park Parks and playgrounds
2/22/2021 7:02 PM
82
Stores Big box shopping
2/22/2021 6:04 PM
83
Liquor Store Book store like Books A Million. And a Gym with a pool
2/22/2021 8:41 AM
84
Liquor Store Stores upscale grocery, shoe store, tennis, healthy eating place, Italian restaurant, vinyl records, art places like pottery & wood painting, wine shop
2/21/2021 12:16 AM
85
Stores Boutique shops; community theater and/or graphic arts venues; NOT large strip mall shopping or large cinema complexes
2/20/2021 12:58 PM
86
Pool accessible pool, splash pad
2/19/2021 6:59 PM
Stores Bookstores, more small businesses, a theatre with live
Breweries Entertainment. Brewery’s, restaurants with live music
HKS | PEC | Office of Design | NV5 | Noell Consulting Group | Blue Cypress
Answered: 1,018
Skipped: 23
&#+& &#+&
(,#+- (,#+-
+#(* +#(*
'&#*) '&#*)
75
Bookstore
Q8 Prioritize ways to improve walkability in Downtown by ordering the below options from 1 to 7, putting the highest priority first and lowest priority last. You can order the options by either using the drop down menu next to each option or by dragging each option into your preferred order using your mouse.
&%#*- &%#*-
&)#-( &)#-( Expand and connect to...
Provide additional...
&%#&' &%#&'
&-#,* &-#,* &,#-) &,#-)
*#*& *#*&
&-#.* &-#.*
(#.& (#.&
'*#.& '*#.&
+#)& +#)&
&.#)+ &.#)+
'(#+. '(#+.
'+#)* '+#)*
'-#(& '-#(&
'*#&* '*#&*
''#(. ''#(. Extend sidewalks to...
&&#&) &&#&) ,#)( ,#)( )#(' )#(' '#,& '#,&
Create sidewalk or...
&)#%, &)#%, ,#(. ,#(. *#). *#). '#%% '#%%
276
Fayetteville Livable Centers Initiative (LCI) Study | DRAFT VERSION - DO NOT DISTRIBUTE
Appendix B | Community Survey
(#'. (#'.
*#%- *#%-
)#&. )#&.
*#,- *#,- -#*, -#*,
-#.- -#.- Provide additional...
Q9 Prioritize ways to support the local biking community in Downtown by ordering the below options from 1 to 6, putting the highest priority first and lowest priority last. You can order the options by either using the drop down menu next to each option or by dragging each option into your preferred order using your mouse.
Increase tree plantings al...
&+#%, &+#%,
&'#++ &'#++ &-#+) &-#+)
',#,) ',#,)
'-#(' '-#('
'(#-* '(#-*
Answered: 977
Skipped: 64
'%#.) '%#.)
&*#-, &*#-,
('#,% ('#,%
' ' ') ') '#') '#')
(,#.% (,#.% .#-' .#-' Expand dedicated bi...
-#'( -#'( &%#%' &%#%' Increase street and...
+#&( +#&(
&(#.( &(#.(
&'#%( &'#%(
Support electric bikes
+#,( +#,(
(,#-* (,#-*
(#,- (#,-
&,#(+ &,#(+
('#,- ('#,-
)#.+ )#.+
-#.+ -#.+
&*#'- &*#'- &)#-- &)#-- (.#'' (.#''
')#)% ')#)%
(#,, (#,,
('#'' ('#'' 0%
10%
20%
30%
40%
50%
60%
70%
80%
90% 100% Expand and connect to...
&
'
(
)
*
+
,
(#-. (#-.
&-#'( &-#'(
,#+, ,#+,
Establish a bike share...
*#+' *#+'
&.#'' &.#''
(#&% (#&% 1
2
3
4
5
6
7
TOTAL
SCORE
Expand and connect to Fayetteville's multi-use path network
37.68% 376
21.54% 215
14.83% 148
10.12% 101
5.51% 55
3.91% 39
6.41% 64
998
5.38
Extend sidewalks to address gaps in sidewalk network
23.69% 236
28.31% 282
22.39% 223
11.14% 111
7.43% 74
4.32% 43
2.71% 27
996
5.26
Provide additional pedestrian-level directional signage
1.61% 16
6.35% 63
10.58% 105
18.75% 186
17.84% 177
18.95% 188
25.91% 257
992
2.95
Create sidewalk or trail connections between major destinations in Downtown
19.46% 195
26.45% 265
25.15% 252
14.07% 141
7.39% 74
5.49% 55
2.00% 20
1,002
5.12
Provide additional seating locations
3.29% 33
4.19% 42
8.98% 90
16.07% 161
27.74% 278
23.85% 239
15.87% 159
1,002
3.04
Increase tree plantings along sidewalks
5.08% 51
5.78% 58
8.57% 86
12.66% 127
18.64% 187
28.32% 284
20.94% 210
1,003
2.97
Increase street and sidewalk lighting
9.82% 99
8.23% 83
10.02% 101
17.36% 175
15.28% 154
14.88% 150
24.40% 246
1,008
3.38
&#+& &#+&
HKS | PEC | Office of Design | NV5 | Noell Consulting Group | Blue Cypress
&-#.. &-#..
)#.& )#.&
'-#'. '-#'. &+#+& &+#+&
(#%% (#%% )*#+& )*#+&
Install bike racks and...
&#-* &#-* No opinion
'*#(- '*#(-
)#%) )#%)
*#,( *#,(
+#-& +#-&
&#,* &#,*
&
277
)+#)+ )+#)+
'
*+#%% *+#%%
(
)
*
+
0%
10%
20%
30%
40%
50%
60%
70%
278
Fayetteville Livable Centers Initiative (LCI) Study | DRAFT VERSION - DO NOT DISTRIBUTE
Appendix B | Community Survey
1
2
3
TOTAL
SCORE
32.70% 277
37.90% 321
13.93% 118
6.73% 57
3.78% 32
4.96% 42
847
4.74
Expand and connect to Fayetteville's multi-use path network
39.22% 342
32.22% 281
18.23% 159
5.62% 49
3.10% 27
1.61% 14
872
4.94
Install bike racks and storage
4.91% 42
16.61% 142
45.61% 390
25.38% 217
5.73% 49
1.75% 15
855
3.84
2.24% 19
6.13% 52
12.03% 102
37.85% 321
32.78% 278
8.96% 76
848
2.80
3.77% 32
3.89% 33
7.67% 65
19.22% 163
46.46% 394
18.99% 161
848
2.42
28.29% 245
3.00% 26
1.85% 16
4.04% 35
6.81% 59
56.00% 485
866
2.74
Expand dedicated bike lanes
Support electric bikes Establish a bike share program No opinion
4
5
6
(-#&' (-#&' &&#&. &&#&. Addition of a parking deck
&-#-& &-#-& &)#+* &)#+* &,#'( &,#'(
'&#,% '&#,% &+#'* &+#'*
Q10 On a scale of 1 to 5 (with 1 being not supportive and 5 being very supportive), how would the following solutions improve your experience driving in Downtown?
&(#,- &(#,- &,#+) &,#+)
&+#&) &+#&)
,#,- ,#,-
(#&+ (#&+ &*#.) &*#.)
&%#', &%#', Directional signage on...
'.#)& '.#)&
*#)( *#)(
On-street parking
(%#.- (%#.-
More landscaping ...
&-#%( &-#%(
&-#+) &-#+)
''#.% ''#.% ).#.* ).#.*
0%
(#+* (#+*
.#%& .#%&
)#&* )#&*
&%#.& &%#.& Expand Downtown...
&-#*+ &-#*+
&-#.' &-#.'
((#.% ((#.%
('#+( ('#+(
Additional oƅ-street...
'&#.' '&#.' '*#*( '*#*(
279
(%#+' (%#+'
Lowering speeds
HKS | PEC | Office of Design | NV5 | Noell Consulting Group | Blue Cypress
10%
20%
& " Cdi Hjeedgi^kZ
30%
40%
50%
60%
70%
80%
'
(
)
* " KZgn Hjeedgi^kZ
90% 100%
&,#%- &,#%- '-#+( '-#+( )+#*% )+#*%
280
Fayetteville Livable Centers Initiative (LCI) Study | DRAFT VERSION - DO NOT DISTRIBUTE 1 - NOT SUPPORTIVE
3
4
5 - VERY SUPPORTIVE
TOTAL
WEIGHTED AVERAGE
Directional signage on where to park
7.78% 78
10.27% 103
29.41% 295
18.64% 187
33.90% 340
1,003
3.61
Expand Downtown wayfinding signage
9.01% 90
10.91% 109
32.63% 326
21.92% 219
25.53% 255
999
3.44
On-street parking
16.14% 162
15.94% 160
30.98% 311
18.03% 181
18.92% 190
1,004
3.08
Additional off-street public parking
3.65% 37
4.15% 42
17.08% 173
28.63% 290
46.50% 471
1,013
4.10
Addition of a parking deck
38.12% 385
11.19% 113
18.81% 190
14.65% 148
17.23% 174
1,010
2.62
21.70% 219
16.25% 164
30.62% 309
13.78% 139
17.64% 178
1,009
2.89
3.16% 32
5.43% 55
18.56% 188
22.90% 232
49.95% 506
1,013
4.11
Lowering speeds More landscaping and greenery
281
2
Appendix B | Community Survey
#
OTHER (PLEASE SPECIFY )
DATE
26
Traffic flow diversion Lowering speed limits would create better walkability, bike-abilty, as well as decreasing volume of traffic noise to afford more enjoyable outdoor dining experiences.
2/24/2021 1:31 PM
27
Traffic flow diversion Divert through (i.e., transit or not-stopping) traffic away from downtown area, to assist with congestion
2/24/2021 11:37 AM
28
Other More parking for what? There is nothing to do in Fayette Downtown and no room to grow. Like usual Fayetteville has built everything at street level which doesn't allow for any expansion of bike paths, walking paths, etc.
2/24/2021 7:17 AM
29
Other Public transportation
2/24/2021 5:53 AM
30
Other Stop wasting money on things which don’t produce value. If you aren’t sure what I mean, feel free to reach out to me. My husband is a developer and I am an executive consultant for Fortune 100 companies across the country.
2/24/2021 12:05 AM
31
Signage & Lighting The signage downtown looks too urban . The previous signage was more fitting for the historic district . Probably too late to give an opinion but moving forward if we could just keep more of a historical feel to downtown and not try to urbanize the signage, street lighting, etc
2/23/2021 10:19 PM
32
Traffic flow diversion Sincrenize traffic lights better
2/23/2021 9:04 PM
33
Signage & Lighting Expand lighting to side streets
2/23/2021 8:45 PM
34
Traffic flow diversion Lowering speed doesn’t fix the people who don’t abide by the speed limit XD
2/23/2021 7:00 PM
35
Other Think Decatur and Athens Ga Downtown
2/23/2021 11:52 AM
36
Parking Parking deck near the library/BoE/Govt complex
2/23/2021 8:11 AM
37
Parking Centralized parking lots. Don't build decks. They're eyesores, potential crime attractors and expensive.
2/23/2021 7:26 AM
38
Mutli-use path Bike racks.
2/23/2021 6:33 AM
39
Other Stop letting churches in and hospice centers
2/23/2021 6:33 AM
40
Signage & Lighting Signs don't help much when a huge majority can't/won't read. Perhaps pictographs.
2/23/2021 4:46 AM
41
Other More places to go and things to do
2/23/2021 12:40 AM
42
Parking only support a 2 level parking deck.
2/22/2021 11:48 PM
43
Traffic flow diversion Develop another way to drive around the square, instead of driving into the square as the only option.
2/22/2021 11:31 PM
44
Other Edible plants/trees/greenery only There's poverty here
2/22/2021 10:34 PM
45
Mutli-use path Golf Cart Paths
2/22/2021 8:48 PM
46
Parking Additional parking will only be needed if fayetteville actually implements all the amazing downtown development plans we always hear about. At the moment, additional parking is not needed because there are not enough cool businesses and green spaces to draw in people.
2/22/2021 8:41 PM
1
Dog-friendly Dog Friendly Designated Areas
3/12/2021 9:02 PM
2
Signage & Lighting Moving store signage a little closer to street.
3/12/2021 7:49 AM
3
Traffic flow diversion To improve the experience of driving downtown .. do something about the congestion between Stonewall, Lanier and Glynn
3/3/2021 12:17 PM
4
Other It depends on what it is; if it is self sustainable, sure. Otherwise it is a budget drain.
3/3/2021 11:40 AM
5
Traffic flow diversion have the lights where they allows traffic to flow better
3/3/2021 11:16 AM
6
Mutli-use path Pedestrian bridge over Glynn Street!
3/3/2021 9:28 AM
7
Other No parking decks downtown but the hospital area needs to be able to build parking decks.
3/3/2021 9:12 AM
8
Traffic flow diversion Traffic lights suck
3/3/2021 2:16 AM
9
Eco-friendly ideas trees for shaded spots in the parking lots. solar panel shades are a better choice.
3/2/2021 6:32 PM
10
Land uses You must have a local coffee shop
3/2/2021 1:43 PM
11
Traffic flow diversion coordinated lights to improve traffic flow and bypass suggestions to side roads
3/2/2021 7:49 AM
12
Traffic flow diversion It’s not fixable due to traffic squeeze from road design. You shouldn’t be adding more people into this close ended congested area.
3/2/2021 1:04 AM
13
Traffic flow diversion Reroute GA 85. bigger turn lane from 85 south to west 54
3/1/2021 10:49 PM
14
Land uses More outdoor dining options!
3/1/2021 10:06 PM
47
Other Decorative Lighting in trees
2/22/2021 7:59 PM
15
Mutli-use path Wider sidewalks for golf carts
2/27/2021 11:19 AM
48
Parking Parking for larger vehicles with higher height clearances
2/22/2021 6:30 PM
16
Mutli-use path We should encourage people to ride bikes
2/25/2021 8:41 PM
49
Other more benches, tables or way to stop and enjoy the outdoors downtown
2/21/2021 12:16 AM
17
Land uses Picnic tables
2/25/2021 8:29 PM
50
2/20/2021 9:45 PM
18
Other Expand downtown. We need to support our local economy. The more area shops and restaurants that open near down town the better.
2/25/2021 8:28 PM
19
Other too much central planning & rules can eliminate entrepreneurial small shop/restaurant
2/25/2021 7:02 PM
20
Other Redevelop/eliminate the ugly open retail spaces that line SR 85 North
2/25/2021 6:21 PM
Other Downtown is currently NOT pedestrian friendly and does NOT encourage me to walk around and patronize local businesses. I go to other city’s downtowns and feel safe walking around their squares. Our downtown sidewalks are small, uneven, and constantly have poles/manholes/objects blocking ADA ramps. The cars are so close to the sidewalks that I feel unsafe walking along the stretch of shops. I think the parallel parking in front of the shops should be turned into wider sidewalk for bistro tables/seating and added buffer from cars. Slowing the cars would be beneficial as well.
21
Mutli-use path Golf cart path/lane & golf cart parking
2/25/2021 5:35 PM
51
2/20/2021 9:45 PM
22
Recreation we really need a play ground
2/25/2021 4:53 PM
23
Dog-friendly Dog Park
2/24/2021 7:47 PM
24
Traffic flow diversion Get rid of the one way pair
2/24/2021 4:27 PM
25
Traffic flow diversion two-way streets; radar signs showing your speed; narrowing lane widths
2/24/2021 2:16 PM
Parking Off-street parking should not occupy prime street-frontage that could otherwise be the site of new development downtown; a deck, would allow parking to go vertical and occupy less real estate. On-street parking is great, but the priority in streetscape design needs to be on PEOPLE, not cars. I know a major component is getting GDOT to recognize this, but the latest on-street parking improvement project along Stonewall Avenue was definitely still an auto-centric design. People-oriented design was not the preeminent issue for that project. Pedestrians actually are now forced to share storm water infrastructure as part of the design. . . Just food for thought.
HKS | PEC | Office of Design | NV5 | Noell Consulting Group | Blue Cypress
282
Fayetteville Livable Centers Initiative (LCI) Study | DRAFT VERSION - DO NOT DISTRIBUTE 52
Appendix B | Community Survey
Parking I would be very supportive of an underground parking facility, but not construction of a large above ground parking deck Traffic flow diversion Traffic calming, grid street netrowk, potentially additional traffic lights w dedicated pedestrian crossings,
53
2/20/2021 12:58 PM 2/18/2021 12:39 PM
&#,( &#,(
Recreational activities
&*#%+ &*#%+
&)#,& &)#,&
)*#), )*#),
'#%( '#%(
',#+, ',#+,
Physical Àtness
'&#*, '&#*,
1
2
3
4
5
28.40% 280
26.37% 260
23.53% 232
14.71% 145
4.97% 49
11.90% 117
25.43% 250
27.67% 272
21.57% 212
1.73% 17
2.75% 27
8.24% 81
3.55% 35
6.28% 62
Pop up markets, food booths, or other commercial activities to accommodate visitors
38.60% 386
Opportunities to appreciate nature (via enhanced landscaping, special plantings, benches for nature viewing, etc.)
16.15% 160
30%
6
40%
50%
60%
TOTAL
SCORE
2.03% 20
986
4.52
10.17% 100
3.26% 32
983
3.98
15.06% 148
26.75% 263
45.47% 447
983
2.01
9.83% 97
20.26% 200
34.85% 344
25.23% 249
987
2.48
22.20% 222
17.00% 170
9.10% 91
7.70% 77
5.40% 54
1,000
4.59
17.26% 171
13.52% 134
19.27% 191
15.44% 153
18.37% 182
991
3.44
7
'%#'+ '%#'+ ()#-* ()#-* '*#'( '*#'(
(#'+ (#'+
283
20%
.#-( .#-(
&%#&, &%#&,
'
10%
+#'- +#'-
'*#)( '*#)(
&
0%
(#** (#** 3.55%
&&#.% &&#.%
Community gatherings
&-#(, &-#(,
*#)% *#)%
Physical fitness '+#,* '+#,*
)#., )#.,
&*#)) &*#))
,#,% ,#,%
Private events
Private events
&.#', &.#',
.#&% .#&%
Community gatherings
-#') -#')
'(#*( '(#*(
Pop up markets, foo...
&(#*' &(#*'
Opportunities to appreciat...
&,#%% &,#%%
Recreational activities
'#,* '#,*
'+#(, '+#(,
&,#'+ &,#'+
''#'% ''#'%
Q11 Prioritize the activities you would like to see future and existing parks and open space in Downtown used for by ordering the below options from 1 to 6, putting the highest priority first and lowest priority last. You can order the options by either using the drop down menu next to each option or by dragging each option into your preferred order using your mouse.
'-#)% '-#)%
&+#&* &+#&*
(-#+% (-#+%
(
)
*
+
HKS | PEC | Office of Design | NV5 | Noell Consulting Group | Blue Cypress
284
Fayetteville Livable Centers Initiative (LCI) Study | DRAFT VERSION - DO NOT DISTRIBUTE
Appendix B | Community Survey
Q12 On a scale of 1 to 5 (with 1 being low priority and 5 being high priority), how much would you like to see the following amenities incorporated within Downtown’s greenspace and other public spaces?
&-#,( &-#,(
&&#%) &&#%)
&)#-, &)#-,
&'#.) &'#.) Community gathering...
((#(( ((#((
'*#&, '*#&,
Dog parks
&-#%) &-#%)
'+#&, '+#&,
'(#&. '(#&.
&+#*' &+#*'
*#*, *#*,
-#', -#',
0%
.#,* .#,*
-#(- -#(-
()#%( ()#%(
Seating areas
(&#,. (&#,.
Pocket parks
'%#.% '%#.%
'(#*& '(#*&
&(#,& &(#,&
'
(
2
3
4
5 - HIGH PRIORITY
8.27% 82
8.38% 83
31.79% 315
28.05% 278
13.71% 137
11.51% 115
27.73% 277
1.98% 20
3.87% 39
4.56% 46
50%
60%
70%
)
* " =^\] Eg^dg^in
WEIGHTED AVERAGE
23.51% 233
991
3.50
24.02% 240
23.02% 230
999
3.31
14.88% 150
28.27% 285
50.99% 514
1,008
4.22
4.46% 45
20.93% 211
26.49% 267
43.55% 439
1,008
4.00
5.57% 56
9.75% 98
34.03% 342
29.75% 299
20.90% 210
1,005
3.51
13.28% 134
13.68% 138
28.25% 285
23.29% 235
21.51% 217
1,009
3.26
35.58% 354
23.42% 233
28.04% 279
8.14% 81
4.82% 48
995
2.23
Plazas
14.01% 140
16.82% 168
34.03% 340
20.72% 207
14.41% 144
999
3.05
Community gathering spaces with commercial partnerships
11.04% 111
12.94% 130
33.33% 335
26.17% 263
16.52% 166
1,005
3.24
Dog parks
18.73% 189
14.87% 150
25.17% 254
18.04% 182
23.19% 234
1,009
3.12
Bike paths
&(#+- &(#+-
Walking trails
'-#'* '-#'*
Water features
',#,( ',#,(
Multi-use pathways
')#%' ')#%'
'(#'. '(#'.
Seating areas
'(#%' '(#%'
'&#*& '&#*&
Water features Memorials
(*#*- (*#*-
&#.- &#.- '(#)' '(#)'
(#-, (#-,
'-#%) '-#%)
Memorials
&)#-- &)#--
-#&) -#&)
'-#', '-#',
)#-' )#-'
*%#.. *%#..
&)#%& &)#%&
)#*+ )#*+
&+#-' &+#-'
)#)+ )#)+
#
OTHER (PLEASE SPECIFY)
DATE
1
Outdoor recreation Splash pad
3/3/2021 11:40 AM
2
Outdoor recreation people need a place to excercise outdoors via a pathway loop. We don't need more "memorials"
3/2/2021 6:32 PM
3
Outdoor recreation Child friendly places always include a public bathroom!!!!
3/2/2021 1:43 PM
4
Outdoor recreation bike paths that bypass the square for through traffic
3/2/2021 7:49 AM
5
Dog Park We NEED a dog park. People are going to peachtree city for dog parks and they end up spending their money for food and other dog items in peachtree city. We have a Petsmart and Hollywood feed that would benefit from a dog park and put money in our local economy
2/25/2021 8:28 PM
6
Other Memorials? Whose? How long before some woke movement turn thumbs-down?
2/25/2021 7:02 PM
()#%( ()#%(
Plazas
'%#.( '%#.(
80%
90% 100%
'%#,' '%#,'
'+#). '+#). )(#** )(#**
285
40%
TOTAL
&(#'- &(#'-
&&#*& &&#*&
Multi-use pathways
30%
& " Adl Eg^dg^in
1 - LOW PRIORITY Pocket parks
Walking trails
20%
'.#,* '.#,*
'-#%* '-#%*
Bike paths
10%
HKS | PEC | Office of Design | NV5 | Noell Consulting Group | Blue Cypress
&)#)& &)#)&
286
Fayetteville Livable Centers Initiative (LCI) Study | DRAFT VERSION - DO NOT DISTRIBUTE
Appendix B | Community Survey
PRYLQJ )D\HWWHYLOOH )RUZDUG b'RZQWRZQ &RPPXQLW\ 6XUYH\ 7
Dog Park DOG PARKS PLEASE
2/25/2021 12:43 PM
8
Other Community Garden projects
2/24/2021 7:58 PM
9
Dog Park Yes, Dog Park!!!
2/24/2021 7:47 PM
10
Outdoor recreation Extend sidewalks out just a little further into the community do we can access the paths into downtown. There is little to no parking on the outskirts to provide access to entry into the sidewalk system.
2/24/2021 5:20 PM
11
Other Again, besides the old courthouse, where is there greenspace? And to call May Harp Park a "park" is laughable.
2/24/2021 7:17 AM
12
Other We need a YMCA!!!
2/23/2021 10:54 PM
13
Outdoor recreation Playground, splash pads, community pool
2/23/2021 9:31 PM
14
Outdoor recreation Parks! Parks parks. We need at least one big nice park. With old growth trees, not trees pulled down and then replanted with dumb little tiny trees.
2/23/2021 7:00 PM
15
Other Outdoor live music other than Southern Ground
2/23/2021 10:25 AM
16
Outdoor recreation A really good playground!!!!!!
2/23/2021 9:24 AM
17
Other Make it look like savanaha- nice infrastructure, parks, walking, biking - you have to give folks a reason to want to be there - shopping, eating, entertainment
2/23/2021 9:10 AM
18
Dog Park No dog parks! Breeding ground for germs; liability for the city/ county. People don't monitor their dogs. This is a BAD idea!
2/23/2021 7:26 AM
19
Other Stop letting churches in and hospice centers
2/23/2021 6:33 AM
20
Pool / Splash pad Can we PLEASE GET A POOL . I've been waiting for 20+ years. Global warming is getting here!!
2/23/2021 1:10 AM
21
Pool / Splash pad splash pad
2/22/2021 11:04 PM
22
Pool / Splash pad Public pool
2/22/2021 10:34 PM
23
Pool / Splash pad Splash pad
2/22/2021 10:26 PM
24
Outdoor recreation playgrounds!!
2/22/2021 8:54 PM
25
Outdoor recreation Golf Cart Parking/Paths
2/22/2021 8:48 PM
26
Outdoor recreation We need child friendly activities. It's sad that we have to leave our town and support another town to play, swim, watch fireworks and parades
2/22/2021 8:47 PM
27
Other Downtown feels like concrete and cars right now. Landscaping is badly needed to hide the cars from spaces and make downtown more pleasant and beautiful.
2/22/2021 8:41 PM
Dog Park A dog park is a MUST. I also encourage descision making members to actually walk around downtown (not drive) and experience what it is like for a walker/biker in our city.
2/20/2021 9:45 PM
28
Q13 Prioritize the features you would like to see more of in Downtown by ordering the below options from 1 to 7, putting the highest priority first and lowest priority last. You can order the options by either using the drop down menu next to each option or by dragging each option into your preferred order using your mouse. '%#*+ '%#*+
.#.+ .#.+
&)#+, &)#+,
&)#%% &)#%%
&+#-) &+#-)
&*#++ &*#++ &-#-- &-#--
Benches
&)#.- &)#.-
Lighting
&'#'. &'#'.
&.#+& &.#+&
&(#'' &(#''
&)#,( &)#,(
,#)) ,#))
,#&+ ,#&+
)#', )#',
&*#&% &*#&%
Public art
&&#(- &&#(-
,#%- ,#%-
&&#,. &&#,.
*#-( *#-(
&&#)- &&#)-
Signage
.#(- .#(- &'#-& &'#-&
&(#') &(#')
''#.' ''#.'
&)#*- &)#*-
(,#,& (,#,&
''#)) ''#))
&,#+- &,#+-
'(#%+ '(#%+
Open space
&(#() &(#()
&,#-. &,#-.
&(#)) &(#))
&,#', &,#',
&)#+- &)#+- &(#-+ &(#-+ &'#%% &'#%% 12.00% &' &' %% %%
287
HKS | PEC | Office of Design | NV5 | Noell Consulting Group | Blue Cypress
.#+' .#+'
Trees
&)#,. &)#,. &(#,* &(#,* &%#-+ &%#-+ ,#,+ ,#,+
288
Fayetteville Livable Centers Initiative (LCI) Study | DRAFT VERSION - DO NOT DISTRIBUTE
Appendix B | Community Survey
Q14 Prioritize the following actions/investments for Downtown by ordering the below options from 1 to 10, putting the highest priority first and lowest priority last. You can order the options by either using the drop down menu next to each option or by dragging each option into your preferred order using your mouse.
&%#)% &%#)% ''#&) ''#&) '%#%- '%#%- Shrubs and Áowers
&*#-+ &*#-+ &(#(. &(#(. &%#.' &%#.'
,#,. ,#,.
,#'& ,#'&
0%
10%
20%
30%
40%
50%
60%
70%
80%
90% 100%
,#&+ ,#&+
+#*+ +#*+
.#+& .#+&
,#(- ,#(-
&%#(( &%#((
+#%* +#%* & 1 Benches
'
(
2
) 3
*
+
4
5
6
7
TOTAL
SCORE
9.96% 96
14.00% 135
15.66% 151
18.88% 182
19.61% 189
14.73% 142
7.16% 69
15.10% 146
11.38% 110
11.79% 114
11.48% 111
13.24% 128
14.58% 141
22.44% 217
23.06% 223
13.34% 129
13.44% 130
14.68% 142
13.86% 134
12.00% 116
9.62% 93
967
4.43
20.56% 199
14.67% 142
16.84% 163
14.98% 145
12.29% 119
13.22% 128
7.44% 72
968
4.47
Signage
4.27% 41
7.08% 68
5.83% 56
9.38% 90
12.81% 123
22.92% 220
37.71% 362
960
2.61
Trees
17.68% 171
17.89% 173
17.27% 167
14.79% 143
13.75% 133
10.86% 105
7. 76% 75
967
4.47
10.40% 101
22.14% 215
20.08% 195
15.86% 154
13.39% 130
10.92% 106
7.21% 70
971
4.39
Public art Open space Lighting
Shrubs and flowers
&(#'. &(#'.
,
964
Attracting major employ...
+#&* +#&*
&'#-- &'#--
Improving pedestrian...
-#+& -#+&
&(#-% &(#-%
4.03 .#.) .#.)
967
3.70
&&#++ &&#++
&(#+( &(#+(
.#(% .#(%
&,#&& &,#&&
,#&+ ,#&+
&+#-% &+#-%
)#-& )#-&
&.#.' &.#.'
&+#.' &+#.'
&)#(% &)#(%
Improving quality of l...
&'#+, &'#+,
&(#', &(#',
&&#%( &&#%(
&'#++ &'#++
&%#+' &%#+' -#', -#', -#+- -#+-
HKS | PEC | Office of Design | NV5 | Noell Consulting Group | Blue Cypress
Repurposing unused...
&&#(* &&#(* .#'' .#'' +#)- +#)-
+#*) +#*)
(#+* (#+*
*#)& *#)&
(#** (#**
'#** '#**
289
&.#,+ &.#,+
(#&) (#&)
290
Fayetteville Livable Centers Initiative (LCI) Study | DRAFT VERSION - DO NOT DISTRIBUTE
Appendix B | Community Survey
-#)' -#)' '&#)% '&#)%
(#'. (#'.
)#*' )#*'
*#&) *#&)
*#*) *#*)
)#*( )#*(
)#&& )#&&
&,#,* &,#,*
-#&& -#&&
&*#(& &*#(&
.#&( .#&( +#.% +#.%
(#'. (#'.
&)#&% &)#&%
&&#++ &&#++
Keeping Downtown...
'#'+ '#'+
&'#.- &'#.-
Improving walkability ...
Facilitating inÀll...
+#*- +#*-
&%#** &%#**
.#(+ .#(+
-#&& -#&&
,#*& ,#*&
.#'( .#'(
*#-- *#--
&-#.( &-#.(
-#'' -#''
*#)- *#)-
'%#(, '%#(,
,#&% ,#&%
+#*, +#*,
Encouraging diversiÀcat...
,#+% ,#+%
&'#-+ &'#-+
'#%( '#%(
,#(. ,#(. &'#'' &'#'' &+#(' &+#('
&+#+, &+#+,
('#)) ('#))
&%#&) &%#&)
+#.- +#.-
&%#', &%#',
Increasing non-motorize...
&'#'& &'#'& .#,, .#,, -#&) -#&) *#+% *#+%
291
30%
40%
50%
60%
70%
80%
&
'
(
)
*
+
,
-
.
90% 100%
&%
2
3
4
5
6
7
8
9
10
Attracting major employers to Downtown
7.79% 76
6.56% 64
7.38% 72
6.05% 59
6.15% 60
8.61% 84
9.94% 97
13.63% 133
17.11% 167
16.80% 164
976
Improving quality of life and local amenities to benefit current residents and attract more residents
19.92% 195
14.30% 140
12.67% 124
11.03% 108
10.62% 104
8.27% 81
8.68% 85
6.54% 64
5.41% 53
2.55% 25
979
&(#&+ &(#&+
Improving pedestrian safety
7.16% 70
9.61% 94
10.33% 101
13.29% 130
12.88% 126
13.80% 135
11.66% 114
9.30% 91
7.16% 70
4.81% 47
978
&&#'( &&#'(
Repurposing unused properties and buildings
16.92% 167
19.76% 195
13.27% 131
12.66% 125
11.35% 112
9.22% 91
6.48% 64
3.65% 36
3.55% 35
3.14% 31
987
Keeping Downtown authentic
21.40% 211
11.66% 115
8.11% 80
9.13% 90
6.90% 68
8.11% 80
9.23% 91
8.22% 81
7.10% 70
10.14% 100
986
Expanding greenspace
7.83% 77
10.27% 101
9.36% 92
12.61% 124
12.00% 118
12.21% 120
12.21% 120
9.77% 96
8.14% 80
5.60% 55
983
Improving walkability and pedestrian connections
8.42% 83
14.10% 139
17.75% 175
15.31% 151
12.98% 128
10.55% 104
7.51% 74
5.88% 58
5.48% 54
2.03% 20
986
Increasing nonmotorized access to Downtown
6.38% 63
6.98% 69
10.93% 108
11.34% 112
13.36% 132
11.94% 118
13.16% 130
11.23% 111
9.01% 89
5.67% 56
988
Facilitating infill development
2.26% 22
3.29% 32
5.14% 50
4.53% 44
6.58% 64
9.36% 91
12.86% 125
18.93% 184
20.37% 198
16.67% 162
972
Encouraging diversification of housing ty pes
3.29% 32
4.52% 44
5.54% 54
4.11% 40
6.57% 64
7.60% 74
7.39% 72
12. 22% 119
16.32% 159
32.44% 316
974
&&#() &&#()
&'#+& &'#+&
&'#'& &'#'&
20%
1
&%#.( &%#.(
.#(+ .#(+
Expanding greenspace
10%
+#(- +#(-
,#-( ,#-(
&'#%% &'#%%
0%
HKS | PEC | Office of Design | NV5 | Noell Consulting Group | Blue Cypress
&(#(+ &(#(+ &&#.) &&#.)
.#%& .#%& *#+, *#+,
TOTAL
S
292
Fayetteville Livable Centers Initiative (LCI) Study | DRAFT VERSION - DO NOT DISTRIBUTE
Appendix B | Community Survey
Q15 How did you find out about this survey?
&)#%) &)#%)
City’s Enews
City’s Facebook,...
*+#() *+#()
A family member or...
&(#+* &(#+*
The study website
(#%' (#%'
%#&% %#&%
Study Áyers
Other (please specify) 0%
&+#+, &+#+,
10%
20%
30%
40%
50%
60%
70%
80%
90% 100%
Nextdoor App Nextdoor app
3/9/2021 10:28 PM
15
Nextdoor App Nextdoor app
3/6/2021 6:07 PM
16
Nextdoor App Nextdoor app
3/5/2021 6:51 PM
17
Nextdoor App Nextdoor
3/5/2021 5:55 PM
18
Facebook Group Homeowners group
3/5/2021 9:37 AM
19
Nextdoor App Next Door FB page
3/5/2021 8:05 AM
20
Facebook Group Facebook group
3/5/2021 5:57 AM
21
Email email
3/4/2021 8:33 PM
22
Nextdoor App Nextdoor
3/4/2021 7:40 PM
23
Newspaper AJC
3/4/2021 3:25 PM
24
Word of Mouth Neighbor
3/4/2021 11:47 AM
25
Nextdoor App Nextdoor website
3/4/2021 8:44 AM
26
Nextdoor App Nextdoor app
3/4/2021 8:04 AM
27
Newspaper Community newsletter
3/4/2021 7:46 AM
28
Word of Mouth Next door neighbor
3/4/2021 7:29 AM
29
Nextdoor App Nextdoor app
3/4/2021 7:03 AM
30
Nextdoor App Nextdoor
3/4/2021 5:54 AM
31
Nextdoor App Next door App
3/3/2021 11:20 PM
32
Google Google
3/3/2021 9:06 PM
33
Newspaper AJC
3/3/2021 6:52 PM
34
Nextdoor App Nextdoor
3/3/2021 5:22 PM
ANSWER CHOICES
RESPONSES
City’s Enews
14.04%
144
City’s Facebook, Twitter, or Instagram accounts
56.34%
578
35
Nextdoor App Next door
3/3/2021 4:59 PM
A family member or friend
13.65%
140
36
Nextdoor App Nextdoor neighborhood group
3/3/2021 2:02 PM
The study website
3.02%
31
37
Nextdoor App Nextdoor app
3/3/2021 1:52 PM
Study flyers
0.10%
1
38
Nextdoor App Next door apt
3/3/2021 12:35 PM
Other (please specify)
16.67%
171
39
Word of Mouth Neighborhood Network
3/3/2021 12:17 PM
40
Nextdoor App nextdoor.com
3/3/2021 12:14 PM
41
Nextdoor App Nextdoor.com post
3/3/2021 11:40 AM
Total Respondents: 1,026
293
14
#
OTHER (PLEASE SPECIFY)
DATE
42
Newspaper AJC
3/3/2021 11:16 AM
1
Library
3/19/2021 5:12 PM
43
Google Internet
3/3/2021 11:02 AM
2
Email Email
3/18/2021 8:47 PM
44
Nextdoor App Nextdoor
3/3/2021 9:51 AM
3
Email I subscribe to City of Fayetteville
3/17/2021 7:56 PM
45
Nextdoor App Nextdoor
3/3/2021 9:50 AM
4
Word of Mouth Denise Brookins personally came to my house...very impressive
3/17/2021 6:08 PM
46
Newspaper AJC
3/3/2021 9:46 AM
5
x
3/17/2021 8:59 AM
47
Nextdoor App NextDoor
3/3/2021 9:32 AM
6
Community Center Senior Center
3/16/2021 5:51 PM
48
Nextdoor App Nextdoor
3/3/2021 9:12 AM
7
Community Center Services Center
3/16/2021 3:48 PM
49
Nextdoor App Nextdoor
3/3/2021 9:10 AM
8
Community Center Library
3/16/2021 3:33 PM
50
Facebook Group Neighborhood post
3/3/2021 8:36 AM
9
work
3/16/2021 8:57 AM
51
Nextdoor App Next Door
3/3/2021 8:31 AM
10
3/13/2021 9:24 PM
52
Google Google news
3/3/2021 8:02 AM
Google Google
3/3/2021 5:48 AM
Facebook Group
Word of Mouth HOA communication
11
Facebook Group
Word of Mouth HOA COMMUNTIES
3/13/2021 2:12 PM
53
12
Facebook Group
Word of Mouth HOA
3/13/2021 12:56 PM
54
Google Google
3/3/2021 2:16 AM
13
Email Email
3/11/2021 7:32 PM
55
Newspaper AJC
3/3/2021 12:17 AM
56
Newspaper Ajc.com
3/2/2021 10:36 PM
HKS | PEC | Office of Design | NV5 | Noell Consulting Group | Blue Cypress
294
Fayetteville Livable Centers Initiative (LCI) Study | DRAFT VERSION - DO NOT DISTRIBUTE
Appendix B | Community Survey
57
Google Google
3/2/2021 9:44 PM
100
Newspaper ajc
3/1/2021 2:06 PM
58
Google Google
3/2/2021 8:15 PM
101
Word of Mouth City Councilman, Joe Clark
2/28/2021 6:23 PM
59
Newspaper AJC
3/2/2021 8:13 PM
102
Email Email
2/26/2021 8:39 PM
60
Facebook Group Facebook friend
3/2/2021 6:32 PM
103
Word of Mouth Relative
2/26/2021 1:02 PM
61
Newspaper Atlanta Journal Southside article
3/2/2021 5:19 PM
104
Facebook Group On Facebook group living in fabulous Fayetteville
2/26/2021 8:49 AM
62
Newspaper AJC
3/2/2021 4:11 PM
105
Facebook Group Social media
2/26/2021 6:04 AM
63
Google Google feed
3/2/2021 3:37 PM
106
Facebook Group Gremlin Growler Facebook post
2/25/2021 8:25 PM
64
Facebook Group Facebook friend
3/2/2021 1:56 PM
107
Facebook Group Facebook
2/25/2021 8:17 PM
65
Newspaper AJC
3/2/2021 11:52 AM
108
Facebook Group Gremlin Growler shared FB post
2/25/2021 6:04 PM
66
Google google news
3/2/2021 11:25 AM
109
Facebook Group Shared post via Facebook
2/25/2021 4:55 PM
67
Google Google News
3/2/2021 11:22 AM
110
Google Gremlin Gowlers website
2/25/2021 4:44 PM
68
Newspaper Atlanta Journal Constitution
3/2/2021 10:40 AM
111
Facebook Group Living in Fabulous Fayetteville Facebook page
2/25/2021 3:56 PM
69
Newspaper AJC
3/2/2021 10:20 AM
112
Word of Mouth neighbor
2/25/2021 12:43 PM
70
Email Email. Newsletter
3/2/2021 10:07 AM
113
Facebook Group Facebook friend
2/25/2021 5:27 AM
71
Google Google
3/2/2021 9:54 AM
114
Word of Mouth Joe Clark
2/24/2021 9:20 PM
72
Google Google
3/2/2021 8:37 AM
115
Word of Mouth Joe Clark !
2/24/2021 6:20 PM
73
Newspaper Ajc
3/2/2021 8:22 AM
116
Email email
2/24/2021 2:16 PM
74
Newspaper AJC online article
3/2/2021 8:11 AM
117
Facebook Group Joe Clark FB post
2/24/2021 11:44 AM
75
Newspaper AJC
3/2/2021 7:50 AM
118
Facebook Group Facebook
2/24/2021 11:37 AM
76
Facebook Group city council rep on facebook
3/2/2021 7:49 AM
119
Facebook Group Facebook post by Joe Clark
2/24/2021 9:46 AM
77
Google Google feed
3/2/2021 6:50 AM
120
Email email
2/24/2021 8:04 AM
78
Newspaper AJC
3/2/2021 6:45 AM
121
Facebook Group Facebook page Living in Fabulous Fayetteville
2/24/2021 12:00 AM
79
Google Google
3/2/2021 6:14 AM
122
Facebook Group Lafayette Park Facebook page
2/23/2021 10:21 PM
80
Google Internet story
3/2/2021 6:06 AM
123
Facebook Group Facebook group
2/23/2021 10:07 PM
81
Google Internet news site
3/2/2021 1:04 AM
124
Facebook Group Someone shared it to the Fabulous Fayetteville group
2/23/2021 9:49 PM
82
Google Online
3/1/2021 11:01 PM
125
Facebook Group Fabulous Fayetteville Facebook
2/23/2021 9:33 PM
83
Google news.google.com
3/1/2021 10:49 PM
126
Facebook Group Facebook group- Living in Fabulous Fayetteville
2/23/2021 9:33 PM
84
Newspaper Ajc
3/1/2021 10:16 PM
127
Facebook Group Facebook
2/23/2021 9:19 PM
85
Google Google news
3/1/2021 10:04 PM
128
Word of Mouth FROM A CITY EMPLOYEE
2/23/2021 8:35 PM
86
Google Google news
3/1/2021 9:29 PM
129
Facebook Group Facebook
2/23/2021 4:51 PM
87
Newspaper Ajc
3/1/2021 9:25 PM
130
Facebook Group Fayetteville Facebook group
2/23/2021 3:41 PM
88
Google Google
3/1/2021 8:47 PM
131
Facebook Group Facebook
2/23/2021 3:26 PM
89
Newspaper News article
3/1/2021 8:18 PM
132
Nextdoor App Nextdoor app
2/23/2021 1:03 PM
90
Newspaper Ajc
3/1/2021 7:34 PM
133
Facebook Group Facebook
2/23/2021 12:56 PM
91
Newspaper Atlanta Journal Constitution
3/1/2021 7:27 PM
134
Email Email
2/23/2021 12:34 PM
92
Google Google main page
3/1/2021 6:27 PM
135
Facebook Group Living in Fab Fayetteville FB page
2/23/2021 12:15 PM
93
Newspaper Ajc
3/1/2021 4:21 PM
136
Facebook Group Fayette Community Page
2/23/2021 10:17 AM
94
Newspaper Ajc
3/1/2021 4:07 PM
137
Facebook Group Living Fabulous in Fayetteville
2/23/2021 10:05 AM
95
Facebook Group HOS
3/1/2021 3:53 PM
138
Facebook Group Oakleigh Manor Facebook page
2/23/2021 9:44 AM
96
Google Google
3/1/2021 3:44 PM
139
Facebook Group family member shared on facebook
2/23/2021 9:36 AM
97
Word of Mouth participant in the study
3/1/2021 3:29 PM
140
Facebook Group Fabulous Fayetteville Facebook page
2/23/2021 9:10 AM
98
Google Google stories
3/1/2021 3:20 PM
141
Nextdoor App Nextdoor
2/23/2021 8:48 AM
99
Google Google
3/1/2021 2:27 PM
142
Facebook Group Fayette County GA Community Discussion facebook
2/23/2021 8:40 AM
295
HKS | PEC | Office of Design | NV5 | Noell Consulting Group | Blue Cypress
296
Fayetteville Livable Centers Initiative (LCI) Study | DRAFT VERSION - DO NOT DISTRIBUTE
Appendix B | Community Survey
Q16 What is your relationship to the City of Fayetteville?
143
Facebook Group Fayette Facebook group
2/23/2021 8:26 AM
144
Facebook Group Posted on HOA website
2/23/2021 8:16 AM
145
Nextdoor App Nextdoor app
2/23/2021 8:12 AM
146
Facebook Group Facebook
2/23/2021 7:50 AM
147
Facebook Group Neighborhood Facebook post
2/23/2021 7:46 AM
148
Facebook Group Fabulous in Fayetteville Facebook page
2/23/2021 7:42 AM
149
Nextdoor App Neighborhood App
2/23/2021 7:26 AM
150
Word of Mouth Local business owner I’m friends with
2/23/2021 6:33 AM
151
Nextdoor App Nextdoor
2/23/2021 5:48 AM
152
Word of Mouth Someone on a city page suggested it
2/23/2021 1:56 AM
153
Facebook Group Facebook group
2/23/2021 12:07 AM
154
Facebook Group Living in Fayetteville Facebook Page
2/22/2021 11:51 PM
155
Facebook Group Link on Facebook
2/22/2021 10:20 PM
156
Facebook Group Neighborhood social media
2/22/2021 9:43 PM
157
In
2/22/2021 9:24 PM
158
Word of Mouth Neighbor
2/22/2021 9:09 PM
159
Facebook Group HOA Facebook Page
2/22/2021 9:06 PM
160
Nextdoor App Nextdoor.com
2/22/2021 8:48 PM
161
Facebook Group Our community Facebook page
2/22/2021 8:23 PM
162
Word of Mouth SAW IT ON HERE AND DOVE IN WANT TO SEE FAYETTEVILLE GROW
2/22/2021 7:57 PM
163
Facebook Group Facebook post with link
2/22/2021 7:43 PM
ANSWER CHOICES
RESPONSES
164
Nextdoor App Nextdoor
2/22/2021 7:31 PM
I live in Downtown Fayetteville.
18.54%
191
165
Facebook Group Fayette community discussion Facebook
2/22/2021 7:28 PM
I work in Downtown Fayetteville.
9.42%
97
166
Nextdoor App Nextdoor
2/22/2021 6:08 PM
669
Nextdoor App Nextdoor
2/22/2021 6:04 PM
I live elsewhere in Fayetteville.
64.95%
167 168
Word of Mouth Serve as residential committee member
2/22/2021 4:35 PM
I work elsewhere in Fayetteville.
7.77%
80
169
Nextdoor App NextDoor posting
2/21/2021 11:15 PM
I own a business in Fayetteville.
6.31%
65
170
Email email
2/21/2021 12:16 AM
I regularly visit Fayetteville.
16.41%
169
171
Word of Mouth Denise made me do it.
2/18/2021 12:39 PM
I live in a nearby community.
12.91%
133
Answered: 1,030
I live in Downtown...
Skipped: 11
&-#*) &-#*)
I work in Downtown...
.#)' .#)'
I live elsewhere in...
+)#.* +)#.*
I work elsewhere in...
,#,, ,#,,
I own a business in...
+#(& +#(&
I regularly visit...
&+#)& &+#)&
I live in a nearby...
&'#.& &'#.& 0%
10%
20%
30%
40%
50%
60%
70%
80%
90% 100%
Total Respondents: 1,030
297
HKS | PEC | Office of Design | NV5 | Noell Consulting Group | Blue Cypress
298
Fayetteville Livable Centers Initiative (LCI) Study | DRAFT VERSION - DO NOT DISTRIBUTE
Appendix B | Community Survey
Q17 What is your age? Answered: 1,026
17 years old or less
Skipped: 15
Answered: 1,023
Asian/PaciÀc Islander
%#'. %#'.
18-24 years old
&&#,. &&#,.
'(#,- '(#,-
45-54 years old
(#(' (#('
Other
'#'* '#'*
Prefer not to answer
&)#-& &)#-& 0%
10%
20%
*-#)+ *-#)+
Mixed Race
'%#++ '%#++
65+
%#*. %#*.
White (Caucasian)
'+#(' '+#('
55-64 years old
&)#*, &)#*,
Native American
35-44 years old
30%
40%
Skipped: 18
&#,+ &#,+
Black or African...
'#() '#()
25-34 years old
50%
60%
70%
ANSWER CHOICES
RESPONSES
17 years old or less
0.29%
18-24 years old
80%
0%
90% 100%
&.#%+ &.#%+ 10%
20%
30%
40%
50%
60%
70%
80%
90% 100%
ANSWER CHOICES
RESPONSES
3
Asian/Pacific Islander
1.76%
18
2.34%
24
Black or African American
14.57%
149
25-34 years old
11.79%
121
Native American
0.59%
6
35-44 years old
26.32%
270
White (Caucasian)
58.46%
598
45-54 years old
23.78%
244
Mixed Race
3.32%
34
55-64 years old
20.66%
212
Other
2.25%
23
65+
14.81%
152
Prefer not to answer
19.06%
195
TOTAL
299
Q18 What is your race?
HKS | PEC | Office of Design | NV5 | Noell Consulting Group | Blue Cypress
1,026
TOTAL
1,023
300
The Vision for moving Fayetteville Forward is to reimagine the possibilities in Downtown through catalytic equitable placemaking, enhanced legibility of the built environment, and creative guidelines for healthy, sustainable developments that will empower its diverse communities.
Livable Centers Initiative (LCI) Study for Downtown Fayetteville, Georgia September 2021
HKS | PEC | Office of Design | NV5 | Noell Consulting Group | Blue Cypress
FAYETTEVILLE’S CAPITAL IMPROVEMENTS ELEMENT
Capital Improvements Element
2022 Annual Update FY 2021 Financial Report & Community Work Program
Fayetteville, Georgia
Adopted:June June2,6,2022 2022
Introduction
This Capital Improvements Element Annual Update has been prepared based on the rules and regulations pertaining to impact fees in Georgia, as specified by the Development Impact Fee Act (DIFA) and the Department of Community Affairs (DCA) documents Development Impact Fee Compliance Requirements and Standards and Procedures for Local Comprehensive Planning. These three documents dictate the essential elements of an Annual Update, specifically the inclusion of a financial report and a schedule of improvements. According to DCA’s Compliance Requirements, the Annual Update: “… must include: 1) the Annual Report on impact fees required under O.C.G.A. 36-71-8; and 2) a new fifth year schedule of improvements, and any changes to or revisions of previously listed CIE projects, including alterations in project costs, proposed changes in funding sources, construction schedules, or project scope.” (Chapter 110-12-2.03(2)(c)) The Annual Update Financial Report covers FY 2021, while the Community Work Program is based on the most recent City of Note that DCA’s Compliance Requirements specify that the work program is to meet the requirements of Chapter 110-12-1-.04(7)(a), which is a reference to the work program requirements in a previous version 1
Fayetteville Capital Improvements Element, which was adopted July 19, 2018.
Financial Report The Financial Report included in this document is based on the requirements of DIFA, specifically: “As part of its annual audit process, a municipality or county shall prepare an annual report describing the amount of any development impact fees collected, encumbered, and used during the preceding year by category of public facility and service area.” (O.C.G.A. 36-718(c)) The required FY 2021 financial information for each public facility category appears in the main financial table (page 2); each of the public facility categories has a single, city-wide service area. The status of all impact fee projects, by public facility category, is shown on the tables on pages 3, 4 and 5.
Schedule of Improvements In addition to the financial report, the City has prepared a five-year schedule of improvements—a community work program (CWP)— as specified in DCA’s Compliance Requirements (Chapter 110-12-2-.03(2)(c)), which states that local governments that have a CIE must “update their entire Short Term [i.e., Community] Work Programs annually.”)1 According to DCA’s requirements,2 the CWP must include: A brief description of the activity; Legal authorization, if applicable; Timeframe for undertaking the activity; Responsible party for implementing the activity; Estimated cost (if any) of implementing the activity; and, Funding source(s), if applicable. All of this information appears in the Community Work Program portion of this document, beginning on page 6.
The City’s fiscal year runs from August 1 to July 31. of the Standards and Procedures for Local Comprehensive Planning. The correct current description is found at Chapter 110-12-1.04(2)(b)1.
2
Chapter 110-12-1-.03(3).
City of Fayetteville 2022 CIE Annual Update ___________________ 6.2.22 Adoption ________________________________________________ page 1
Financial Report
Annual Impact Fee Financial Report - Fiscal Year 2021
City of Fayetteville, GA Parks & Recreation
Fire Protection
Police
Roads
Service Area
City-wide
City-wide
City-wide
City-wide
Impact Fee Fund Balance August 1, 2020 Impact Fees Collected (August 1, 2020 through July 31, 2021)
1 2
Administration
Public Facility
CIE Prep 2
TOTAL
$
670,116.82 $ 1,259,068.35 $
360,060.18 $ 513,172.98 $ 58,685.35 $
-
$ 2,861,103.68
$
195,861.40 $
202,666.11 $
138,120.08 $ 252,288.71 $ 23,059.50 $
-
$
811,995.80
Accrued Interest
$
1,635.53 $
1,692.36 $
192.56 $
-
$
6,780.55
Subtotal: Fee Accounts
$
499,333.63 $ 767,568.42 $ 81,937.41 $
-
$ 3,679,880.03
(Impact Fee Refunds) 1
$
-
(Expenditures)
$
(72,002.50) $
Impact Fee Fund Balance July 31, 2021
$
Impact Fees Encumbered
$
867,613.75 $ 1,463,426.82 $
1,153.37 $
2,106.73 $
$
-
$
(8,608.33) $
-
$
(8,608.33)
(75,000.00) $
-
$
(7,500.00) $
-
$
(294,517.50)
795,611.25 $ 1,323,411.82 $
424,333.63 $ 767,568.42 $ 65,829.08 $
-
$ 3,376,754.20
795,611.25 $ 1,323,411.82 $
424,333.63 $ 767,568.42
$
-
$
(140,015.00) $
-
$ 3,310,925.12
The refund was made in FY21 to address a collection error made in FY20 that was described in the Annual Impact Fee Financial Report - Fiscal Year 2020. CIE Prep is the cost of creating the original Capital Improvements Element, subsequent Annual Updates, and Amendments.
City of Fayetteville 2022 CIE Annual Update ___________________ 6.2.22 Adoption ________________________________________________ page 2
Financial Report
PROJECT FINANCIAL TABLES: Fiscal Year 2021 Public Facility: Parks & Recreation Responsible Party: Public Services Department Service Area: City-wide
Project Description Carry-Over Projects** P.K. Dixon Park (219 acres) Holiday Dorsey Fife House Amphitheater Total Carry-Over Projects New Park Lands Park Acres New Recreation Facilities Picnic Pavillion Playground (Tot Lot) Gazebo Community Building Splash Pad Other Improvements 1 Other Improvements 2 New Trails The Ridge Trails 1 The Ridge Trails 2 The Ridge Boardwalk Other Trails Total New Projects Total Parks & Recreation
Project Project Start End Date Date
Maximum Maximum Percentage of Funding Local Cost of Funding from Possible from Project* Impact Fees Impact Fees
FY 2021 Impact Fees Expended $ $ $ $
Impact Fees Expended (Previous Years)
Impact Fees Encumbered
$ $ $ $
$ $ $ $
2003 2003 2003
** ** **
$ 499,265.64 $ 1,564,823.95 $ 2,560,364.00 $ 4,624,453.59
44.0% 100.0% 49.7%
$ 248,763.62 $ 1,826,287.00 $ 1,365,726.17 $ 3,440,776.79
2019
2040
$ 2,759,071.89
100.0%
$ 2,759,071.89 $
-
$
-
$
-
$
-
2016 2016 2018 2019 2019 2016 2018
2022 2022 2022 2025 2021 2030 2030
$ 24,663.74 $ 10,276.56 $ 10,223.03 $ 1,465,058.54 $ 522,551.49 $ 193,815.89 $ 95,074.16
76.07% 76.07% 76.07% 76.07% 43.21% 76.07% 76.07%
$ 18,763.09 $ 7,817.96 $ 7,776.66 $ 1,114,470.03 $ 225,770.76 $ 147,446.65 $ 72,322.91
$ $ $ $ $ $ $
-
$ $ $ $ $ $ $
-
$ $ $ $ $ $ $
-
$ $ $ $ $ $ $
-
2016 2018 2018 2025
2024 2025 2024 2040
$ 3,699.83 $ 10,631.95 $ 205,278.40 $ 99,591.01 $ 5,399,936.49
100.0% 100.0% 100.0% 100.0%
$ 3,699.83 $ 10,631.95 $ 205,278.40 $ 99,591.01 $ 4,672,641.14
$ $ $ $ $
-
$ $ $ $ $
-
$ $ $ $ $
-
$ $ $ $ $
-
$ 8,113,417.93
$ 72,002.50
$10,024,390.08
$ 36,001.25 375,603.10 36,001.25 435,685.05 72,002.50 $ 811,288.15
Total Impact Fees Expended to Date
-
$ 811,288.15
411,604.35 471,686.30 883,290.65
$ 883,290.65
$
397,805.63 397,805.62 795,611.25
Status/Remarks Debt Service** Debt Service** Debt Service**
Complete Complete Complete Complete
795,611.25
* Actual figures related to impact fee funding shown for completed projects. See CIE for Maximum Funding calculation. All figures are shown in Net Present Value. When impact fees were initially calculated for the carry-over projects, their actual construction costs were already known. Because each project created capacity to serve future growth and development, the percentage of the cost that is impact fee eligible was calculated based on the Level of Service standards in the Capital Improvements Element, which yielded the proportion of the project that was required to meet the needs of future growth and development. ** The noted projects are eligible for impact fee funding but were initially financed through the issuance of GO bonds. The City is recouping the impact fee share of the portion of the debt service attributable to the projects, to the extent of the percentage of the costs that created new capacity to serve new growth and development, but limited to the extent of impact fee collections and accumulations on hand. Because the pace of impact fee collections cannot be predicted, the date at which the recoupment will be completed cannot be determined NOTE: For projects that are not 100% impact fee funded, funding may be provided from the General Fund, the Capital Projects Fund, SPLOST or other local taxation sources, as determined each year during the annual budget adoption process.
City of Fayetteville 2022 CIE Annual Update ___________________ 6.2.22 Adoption ________________________________________________ page 3
Financial Report Public Facility: Fire Protection Responsible Party: Fire Department Service Area: City-wide
Project Description New Fire Truck (Quint)*
Project Project Start End Date Date 2016 2025
Maximum Maximum Percentage of Funding FY 2021 Local Cost of Funding from Possible from Impact Fees Project* Impact Fees Impact Fees Expended $ 1,005,779.06 100% $ 1,005,779.06 $ 89,072.68
Impact Fees Expended (Previous Years) $ 548,721.27
Total Impact Fees Expended to Date $ 637,793.95
New Station 93 (14,997 sf)
2018
2024
$ 7,454,430.00
83.8%
$ 6,248,292.56
$
$
$
New Fire Engine* Station 91 Expansion (1,254 sf) New Station 94 (4,846 sf) New Fire Trucks (2)
2018 2019 2026 2026
2025 2025 2028 2028
$ 606,889.41 $ 126,247.08 $ 2,203,386.00 $ 1,390,915.05 $ 11,781,867.54
100.00% 100.00% 43.9% 100.00%
$ 606,889.41 $ 126,247.08 $ 967,022.56 $ 1,390,915.05 $ 9,339,366.66
$ 50,942.32 $ $ $ $ 140,015.00
-
-
$ 200,920.69 $ $ $ $ 749,641.96
$ $ $ $ $
Impact Fees Encumbered $ 89,072.68
-
$ 879,312.74 251,863.01 $ 355,026.40 889,656.96 $ 1,323,411.82
Status/Remarks Lease-Purchase Site selection being finalized
Lease-Purchase
* The Quint and Engine were purchased in 2016 and 2018, respectively, with lease-purchase financing, and are included in the impact fee calculations for recoupment. All dollar figures are shown in Net Present Value. NOTE: For projects that are not 100% impact fee funded, funding may be provided from the General Fund, the Capital Projects Fund, SPLOST or other local taxation sources, as determined each year during the annual budget adoption process.
Public Facility: Police Department Responsible Party: Police Department Service Area: City-wide Maximum Project Project Percentage of Start End Local Cost of Funding from Project Description Date Date Project* Impact Fees Carry-Over Project Police (HQ) 2006 ** $ 6,746,135.00 38.1% Crime Scene Vehicle 2018 2024 $ 101,148.24 68.1% Office space expansion (6,218 sf) 2021 2025 $ 626,796.27 100.0% Expansion (7,372 sf) 2027 2030 $ 3,391,932.23 100.0% $ 6,746,135.00
Maximum Funding Possible from Impact Fees $ 1,817,803.74 $ 68,925.18 $ 626,796.27 $ 3,391,932.23 $ 5,905,457.42
FY 2021 Impact Fees Expended $ 75,000.00 $ $ $ $ 75,000.00
Impact Fees Expended (Previous Years) $1,458,440.13 $ $ $ $ 1,458,440.13
Total Impact Fees Expended to Date $ 1,533,440.13 $ $ $ $ 1,533,440.13
Impact Fees Encumbered $ 75,000.00 $ 68,925.18 $ 280,408.45 $ $ 424,333.63
Status/Remarks Debt Service**
* Actual figures related to impact fee funding shown for completed projects. See CIE for Maximum Funding calculation. All dollar figures are shown in Net Present Value. When the impact fee was initially calculated for this project (the Police Headquarters), its actual construction cost was already known. Because the project created capacity to serve future growth and development, the percentage of the cost that is impact fee eligible was calculated based on the Level of Service standards in the Capital Improvements Element, which yielded the proportion of the project that was required to meet the needs of future growth and development. ** The Police Headquarters is eligible for impact fee funding but was initially financed and constructed through the issuance of a GO bond. The City is recouping the impact fee share of the portion of the debt service attributable to the project, to the extent of the percentage of the cost that created new capacity to serve new growth and development, but limited to the extent of impact fee collections and accumulations on hand. Because the pace of impact fee collections cannot be predicted, the date at which the recoupment will be completed cannot be determined NOTE: The portion of the Police Headquarters project that is not eligible for impact fee funding was provided from taxes levied and applied to the bond issue sinking fund. NOTE: For projects that are not 100% impact fee funded, funding may be provided from the General Fund, the Capital Projects Fund, SPLOST or other local taxation sources, as determined each year during the annual budget adoption process.
City of Fayetteville 2022 CIE Annual Update ___________________ 6.2.22 Adoption ________________________________________________ page 4
Community Work Program Public Facility: Road Improvements Responsible Party: Public Services Department Service Area: City-wide Maximum Project Project Percentage of Start End Local Cost of Funding from Project Description Date Date Project Impact Fees Lafayette Ave Extension Ongoing 2026 $ 952,090.12 37.437% Lafayette/Glynn Street Ongoing 2026 $ 257,622.51 37.437% Jeff Davis Shoulder Ongoing 2025 $ 492,786.47 37.437% Stonewall/85 Left Turn Ongoing 2024 $ 142,234.04 37.437% LaFayette/Tiger Trail Ongoing 2024 $ 1,228,345.38 37.437% Highway 54/Gingercake Ongoing 2024 $ 11,752.53 37.437% Hood Ave Conn/SR92 Done 2017 $ 7,709,121.05 37.437% Highway 85 Median Design Ongoing 2023 $ 80,130.88 37.437% Highway 85 Medians Phase 1 Ongoing 2023 $ 89,054.60 37.437% Highway 85 Medians Phase 2 Ongoing 2023 $ 89,054.60 37.437% Highway 85 Medians Phase 3 Ongoing 2023 $ 89,054.60 37.437% Highway 85 Streetscape Ongoing 2023 $ 30,231.78 37.437% Redwine/Ramah Road Roundabout Ongoing 2024 $ 1,282,094.04 37.437% Veterans Pkwy Large Roundabout Done 2022 $ 1,451,580.34 37.437% Veterans Pkwy Small Roundabout Ongoing 2025 $ 1,004,940.23 37.437% (Sndy Crk) Veterans Pkwy 4-lane expansion Ongoing 2025 $ 8,932,802.07 37.437% (1.5 mile) Habersham Extension Ongoing 2025 $ 1,004,940.23 37.437% Fischer Road Extension Ongoing 2024 $ 16,026,175.47 37.437% (Downtown Expan.) Highway 54/Grady Avenue Ongoing 2024 $ 783,827.24 37.437% $ 41,657,838.17
Maximum Funding Possible from Impact Fees $ 356,436.87 $ 96,446.92 $ 184,485.97 $ 53,248.59 $ 459,859.39 $ 4,399.83 $ 2,886,087.05 $ 29,998.84 $ 33,339.64 $ 33,339.64 $ 33,339.64 $ 11,317.96 $ 479,981.44 $ 543,432.54 $
Impact Fees Expended (Previous Years) $ 8,873.37 $ 8,873.37 $ 20,820.25 $ 8,873.38 $ 50,307.07 $ $ 676,574.68 $ $ $ $ $ $ $ -
Total Impact Fees Expended to Date $ 8,873.37 $ 8,873.37 $ 20,820.25 $ 8,873.38 $ 50,307.07 $ $ 676,574.68 $ $ $ $ $ $ $ -
Impact Fees Encumbered Status/Remarks $ $ 87,573.55 Partially Engineered $ $ 35,000.00 $ 100,000.00 $ $ Completed $ 29,998.84 $ 33,339.64 $ 33,339.64 $ 33,339.64 $ 11,317.96 $ 100,000.00 $ Completed
-
$
-
$
-
$
-
$
-
$
-
$
-
$
-
376,222.53 $
-
$
-
$
-
$
-
-
$
-
$
-
$
203,659.15
-
$ $
$ 774,322.12 $
100,000.00 767,568.42
376,222.53 $
$ 3,344,200.23 $
FY 2021 Impact Fees Expended $ $ $ $ $ $ $ $ $ $ $ $ $ $ -
$ 5,999,767.97
$
$ 293,443.78 $ $ 15,595,571.36 $
-
$ 774,322.12 $
NOTE: All dollar figures are shown in Net Present Value. NOTE: For projects that are not 100% impact fee funded, funding may be provided from the General Fund, the Capital Projects Fund, SPLOST or other local taxation sources, as determined each year during the annual budget adoption process.
City of Fayetteville 2022 CIE Annual Update ___________________ 6.2.22 Adoption ________________________________________________ page 5
Community Work Program
2022-2026 COMMUNITY WORK PROGRAM3 Impact Fee Projects only
Project
Start Year
Comp. Year
Cost Estimate
Funding Source(s)
Responsible Party
100% Impact Fees 83.8% Impact Fees; 16.2% SPLOST 100% Impact Fees 100% Impact Fees 43.9% Impact Fees; 56.1% SPLOST 100% Impact Fees
Fire Department
Impact Fee Related Projects
3
FIRE PROTECTION New Fire Truck (Quint)
2016
2025
$1,005,779
Design/Construct New Fire Station 93
2018
2024
$7,454,430
Fire Apparatus - Engine Fire Station 91 Expansion
2018 2019
2025 2025
$606,889 $126,247
Construct Fire Station 94
2026
2028
$967,023
Fire Apparatus – 2 Engines POLICE DEPARTMENT
2026
2028
$1,390,915
Crime Scene Vehicle
2018
2024
$101,148
Police Dept. Office Space Expansion PARKS & RECREATION Park Land Acquisitions Park improvements: Community Building
2021
2025
$626,796
2019
2040
$2,759,071
2019
2025
$1,465,059
Park improvements: The Ridge Phase 1
2016
2030
$193,816
68.1% Impact Fees; 31.9% General Fund (CP) 100% Impact Fees 100% Impact Fees 76.1% Impact Fees; 23.9% General Fund (CP) 76.1% Impact Fees; 23.9% SPLOST and/or General Fund (CP)
Fire Department Fire Department Fire Department Fire Department Fire Department Police Department Police Department Public Services Public Services Public Services
Projects included in the most recently adopted Capital Improvements Element (7/19/18).
City of Fayetteville 2022 CIE Annual Update ___________________ 6.2.22 Adoption ________________________________________________ page 6
Community Work Program
Project
Start Year
Comp. Year
Cost Estimate
Park improvements: The Ridge Phase 2
2018
2030
$95,074
The Ridge Trails 1 The Ridge Trails 2 The Ridge Boardwalk Other Trails ROAD IMPROVEMENTS
2016 2018 2018 2025
2024 2025 2024 2040
$3,700 $10,632 $205,278 $99,591
Lafayette Ave Extension
On-going
2026
$952,090
Lafayette/Glynn Street
On-going
2025
$257,623
Jeff Davis Shoulder
On-going
2025
$492,786
Stonewall/85 Left Turn
On-going
2024
$142,234
Lafayette/Tiger Trail
On-going
2024
$1,228,345
Highway 54/Gingercake
On-going
2024
$11,753
Highway 85 Median Design
On-going
2023
$80,131
Highway 85 Medians Phase 1
On-going
2023
$89,055
Highway 85 Medians Phase 2
On-going
2023
$89,055
Highway 85 Medians Phase 3
On-going
2023
$89,055
Funding Source(s) 76.1% Impact Fees; 23.9% SPLOST and/or General Fund (CP) 100% Impact Fees 100% Impact Fees 100% Impact Fees 100% Impact Fees 37.4% Impact Fees; 62.6% General Fund (CP) 37.4% Impact Fees; General Fund (CP) 37.4% Impact Fees; 62.6% General Fund (CP) 37.4% Impact Fees; 62.6% General Fund (CP) 37.4% Impact Fees; 62.6% General Fund (CP) 37.4% Impact Fees; 62.6% General Fund (CP) 37.4% Impact Fees; 62.6% General Fund (CP) 37.4% Impact Fees; 62.6% General Fund (CP) 37.4% Impact Fees; 62.6% General Fund (CP) 37.4% Impact Fees; 62.6% General Fund (CP)
Responsible Party Public Services Public Services Public Services Public Services Public Services Public Services Public Services Public Services Public Services Public Services Public Services Public Services Public Services Public Services Public Services
City of Fayetteville 2022 CIE Annual Update ___________________ 6.2.22 Adoption ________________________________________________ page 7
Community Work Program Start Year
Comp. Year
Cost Estimate
Highway 85 Streetscape
On-going
2023
$30,232
Redwine/Ramah Road Roundabout
On-going
2024
$1,282,094
On-going
2025
$1,004,940
On-going
2025
$8,932,803
On-going
2025
$1,004,940
Fischer Road Extension (Downtown ExOn-going pansion)
2024
$16,026,175
Highway 54/Grady Avenue
2024
$783,827
Project
Veterans Pkwy Small Roundabout (Sandy Creek) Veterans Pkwy 4-lane expansion (1.5 mile) Habersham Extension
On-going
Funding Source(s) 37.4% Impact Fees; 62.6% General Fund (CP) 37.4% Impact Fees; 62.6% General Fund (CP) 37.4% Impact Fees; 62.6% General Fund (CP) 37.4% Impact Fees; 62.6% General Fund (CP) 37.4% Impact Fees; 62.6% General Fund (CP) 37.4% Impact Fees; 62.6% General Fund (CP) 37.4% Impact Fees; 62.6% General Fund (CP)
Responsible Party Public Services Public Services Public Services Public Services Public Services Public Services Public Services
City of Fayetteville 2022 CIE Annual Update ___________________ 6.2.22 Adoption ________________________________________________ page 8