

PRO PERT Y REPO RT


Numbers taken from averages of comparable active properties that are in your neighborhood with similar square footage, similar bed/ baths, ageof home. Updated on 7.31.25
Active Comparable Listings - Your Neighborhood
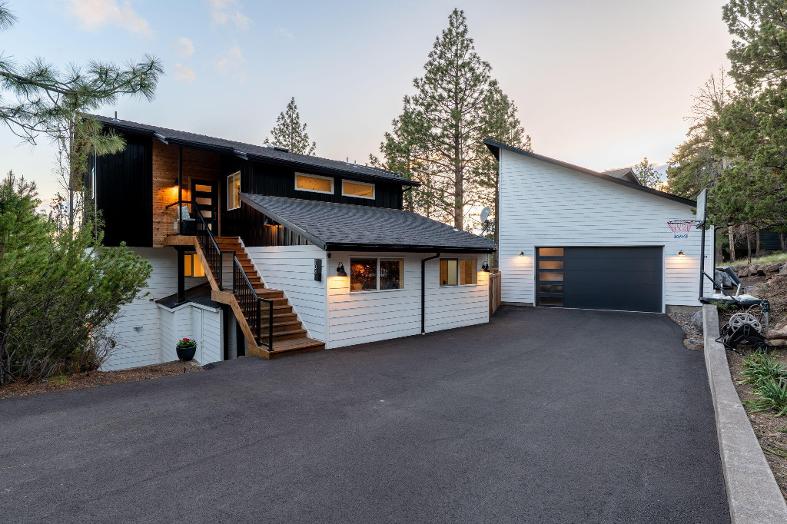
20 49 N W T r en t o n Aven ue
$1,525,000 2,995 Sq. Ft.
4 Bed | 4 5 Bath Built: 1988 .35 Acre Lot DOM: 78
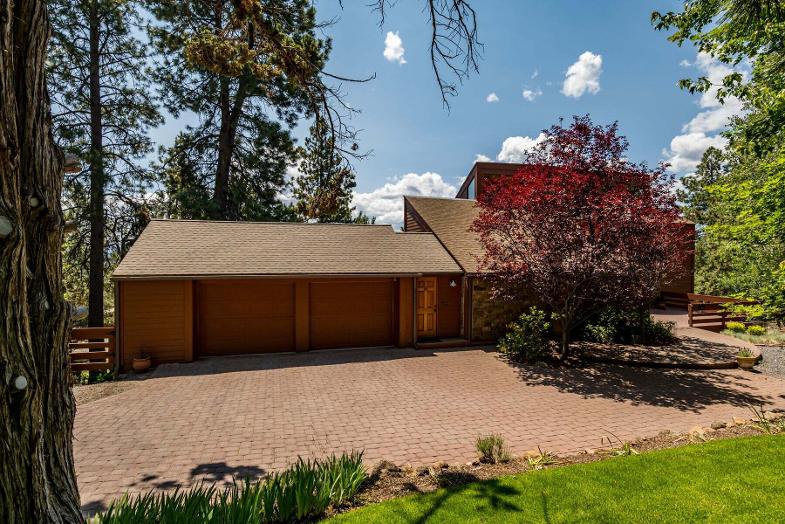
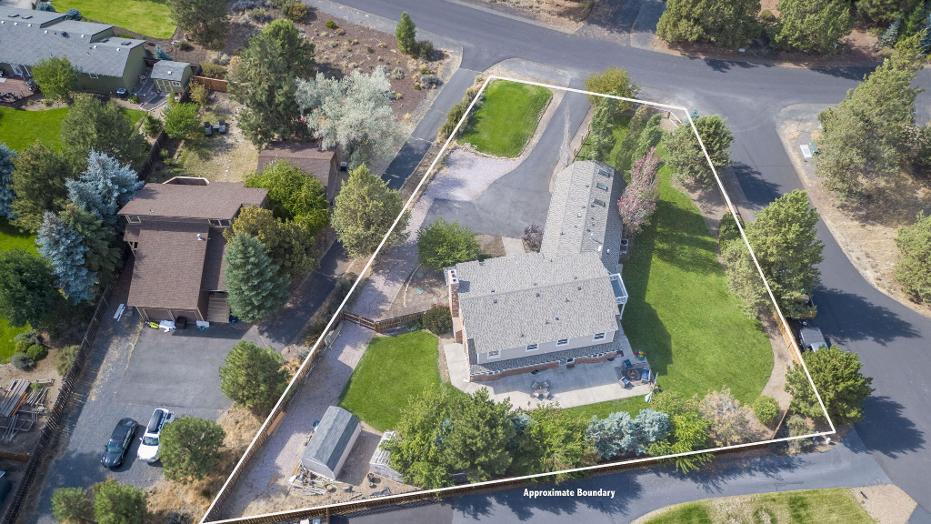
176 9 N W T r en t o n Aven ue
$1,500,000 3,806 Sq. Ft.
4 Bed | 2 5 Bath Built: 1973
.4 Acre Lot DOM: 178


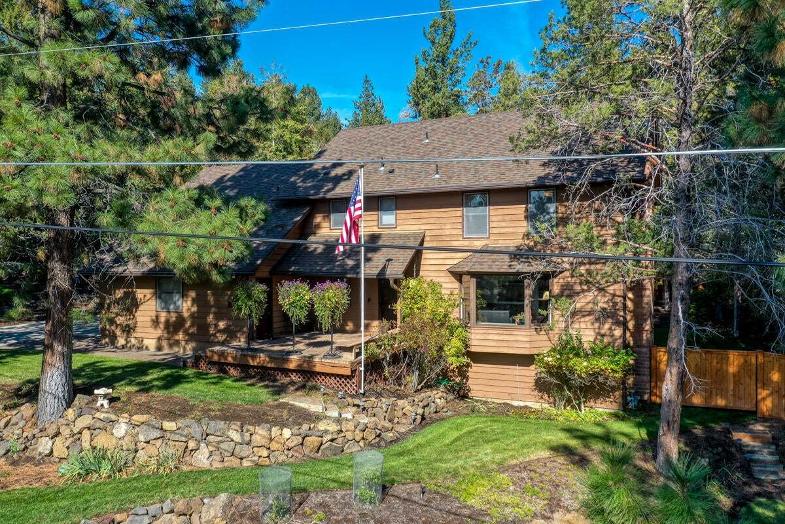
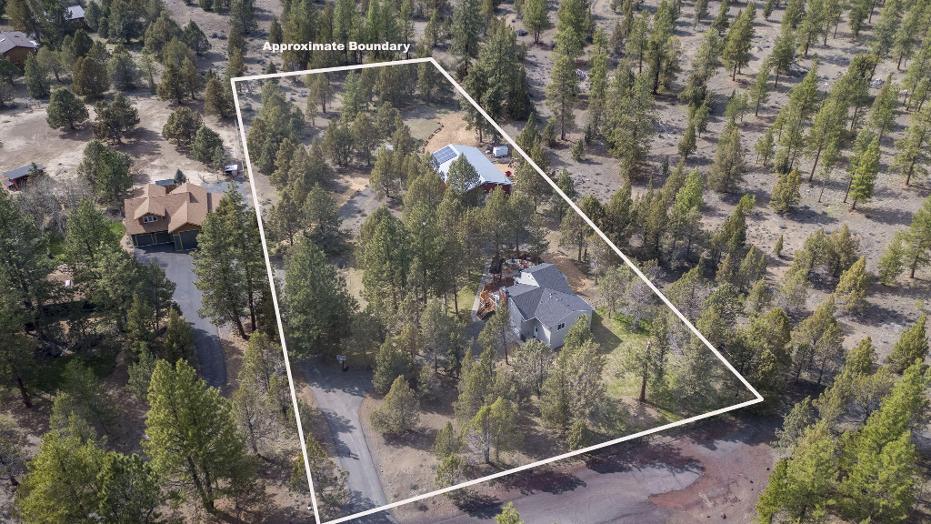
1562 N W V i ck sb ur g Aven ue
$1,250,000 2,942 Sq Ft
4 Bed | 2.5 Bath Built: 1976 .29 Acre Lot DOM: 133

AVERAGE DAYS ON MARKET % OF ORIGINAL LIST PRICE CURRENTLY LISTED AT 130 DAYS 94%
PRICE PER/ SQ FT - HOME
PRICE PER/ SQ FT - PROPERTY

Numbers taken from averages of comparable active properties that are comparable in all of Bend with similar square footage, similar bed/ baths, ageof home. Updated on 7.31.25
Active Comparable Listings - Across Greater Bend
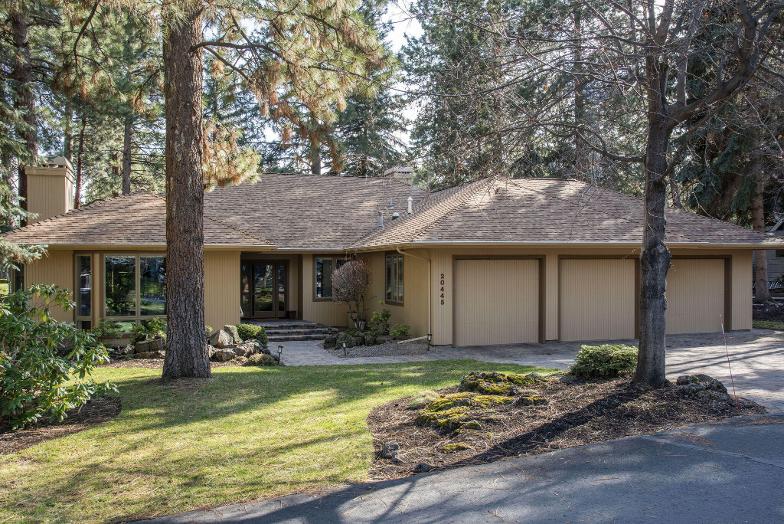
20 4 45 St eam b o at Co ur t ( S Ben d )
$899,900 3,236 Sq. Ft.
4 Bed | 3 5 Bath Built: 1990 .44 Acre Lot DOM: 108
61266 M t V i st a D r i ve ( SE Ben d )
$950,000 3,526 Sq. Ft.
5 Bed | 4 Bath Built: 1985 .47 Acre Lot DOM: 84
63589 Go l d Sp ur W ay ( W o f Ben d )
$1,399,999 3,168 Sq Ft



4 Bed | 2.5 Bath Built: 1976 2.35 Acre Lot DOM: 112 AVERAGE DAYS ON MARKET AVERAGE PRICE PER/ SQ FT - HOME
101DAYS $330

Numbers taken from averages of closed comparable active properties that are comparable in your neighborhood with similar square footage, similar bed/ baths, age of home.
Closed Comparable Listings
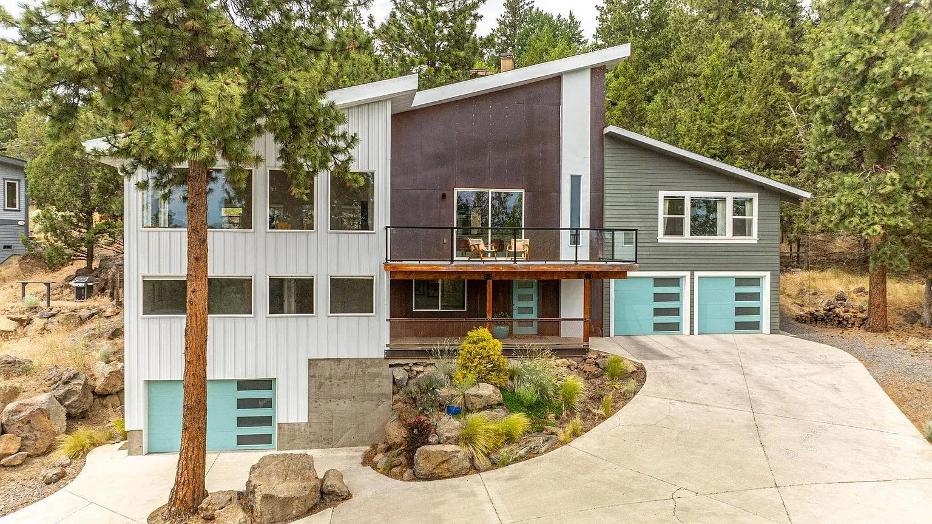
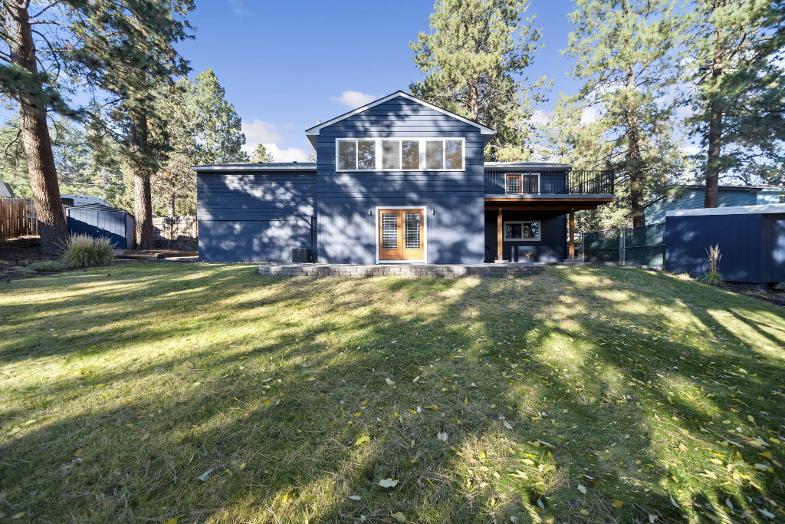
190 8 N W T r en t o n Aven ue
$1,480,000 3,024 Sq. Ft.
4 Bed | 3 Bath Built: 1978 .24 Acre Lot DOM: 51
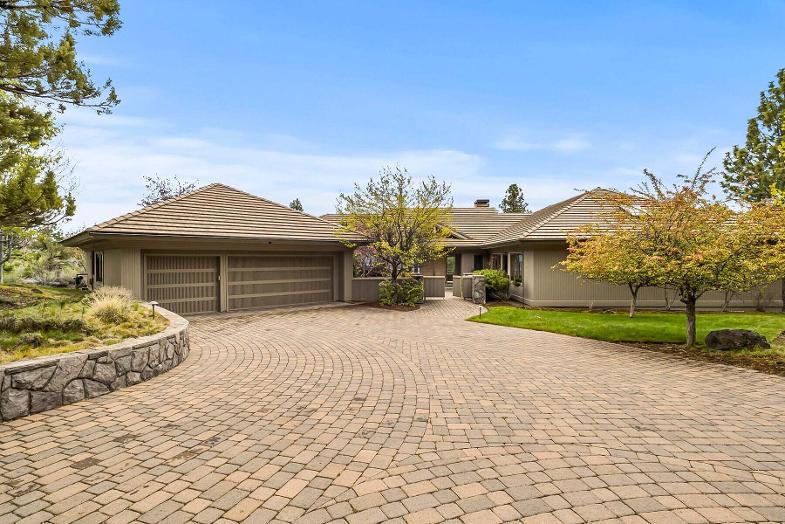
1143 N W H i l l si d e Par k D r i ve
$1,650,000 3,578 Sq. Ft.
3 Bed | 3 5 Bath Built: 1990 1.13 Acre Lot DOM: 116
1371 N W V i ck sb ur g Aven ue
$1,125,000 2,658 Sq Ft
4 Bed | 3 Bath Built: 1963 .28 Acre Lot DOM: 81



AVERAGE DAYS ON MARKET AVERAGE PRICE PER/ SQ FT - HOME 83 DAYS $458
% OF ORIGINAL LIST PRICE CURRENTLY LISTED AT AVERAGE PRICE PER/ SQ FT - PROPERTY 93% $89
Bend Market Report
M ar ket Summar y
Resident ial Homes
Cur r ent M ar ket - Year t o Dat e 20 25 compar ed t o 20 24
The statistics below provide an up-to-date snapshot of the listed inventory as of July 3rd, 2025. Median days on market is a good indicator of the average length of time the current inventory has been on the market.
2025
$755,000 Median SalePrice
$740,000
Median SalePrice
1,121 HomesSold
2024
1,118 HomesSold
36
Median Dayson Market
23
Median Dayson Market
Bend Market Condition
Buyer 's M ar ket
M ar ket Condit ions
Balanced M ar ket
4.7 Mont hs of Invent ory
Buyer'sMarket
Morethan 5 Monthsof Inventory
Buyer 's vs. Seller 's M ar ket
Balanced Market 3 - 5 Monthsof Inventory
Seller 's M ar ket
Seller'sMarket
Lessthan 3 Monthsof Inventory
The key similarities and differences between a buyer's and seller's market; and how these market factors impact each group.
Buyer's Market
More people selling homes than buying
MoreHomesto ChooseFrom
MoreNegotiating Power
Could Spend Lessthan Asking Price
PriceRestrictions
Rarely Competing Offers
Buyer's Market
More people selling homes than buying
TakesMoreTimeto Sell
Fewer OffersReceived
Could get Lower than Asking Price
May Haveto makeRepairsand/or Concessions
Seller's Market
More people buying homes than selling
Fewer Homesto ChooseFrom LessNegotiating Power
Need to beAbleto CloseQuickly
Could Spend Morethan Asking Price
Competition From Other Buyers
Seller's Market
More people buying homes than selling
HomeSellsQuickly
MultipleOffersLikely
Could get Morethan Asking Price
BuyersWilling to Overlook Repairs


