MARKET SNAPSHOT
2023 Q1





2023 Q1
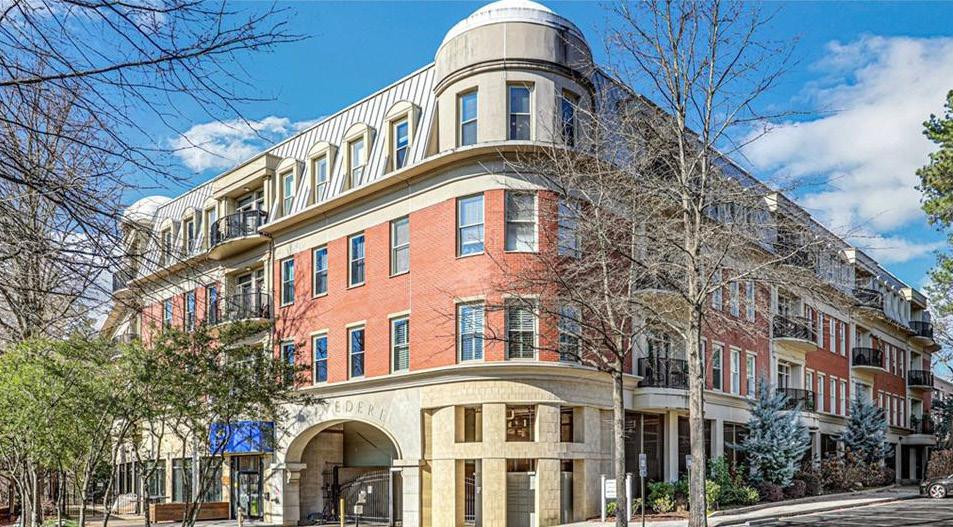
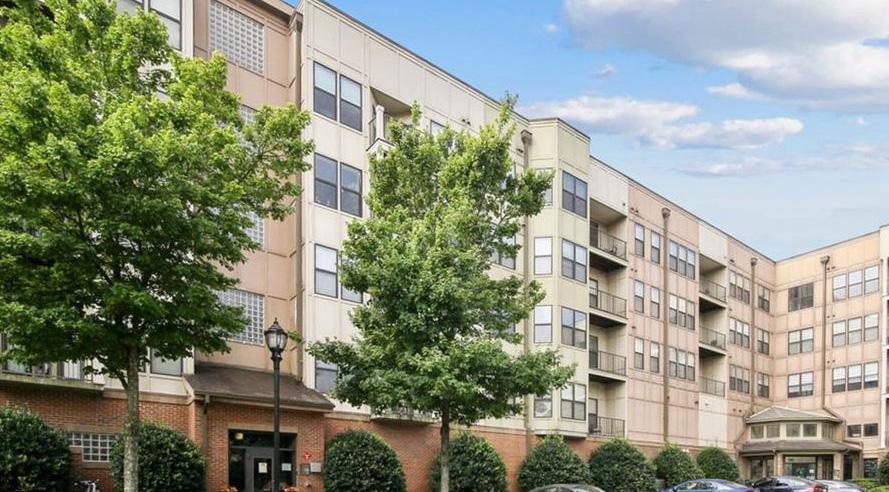
Condominiums
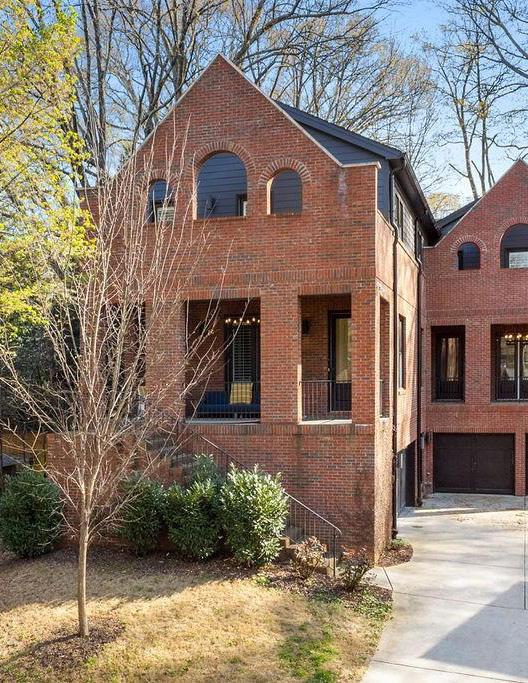
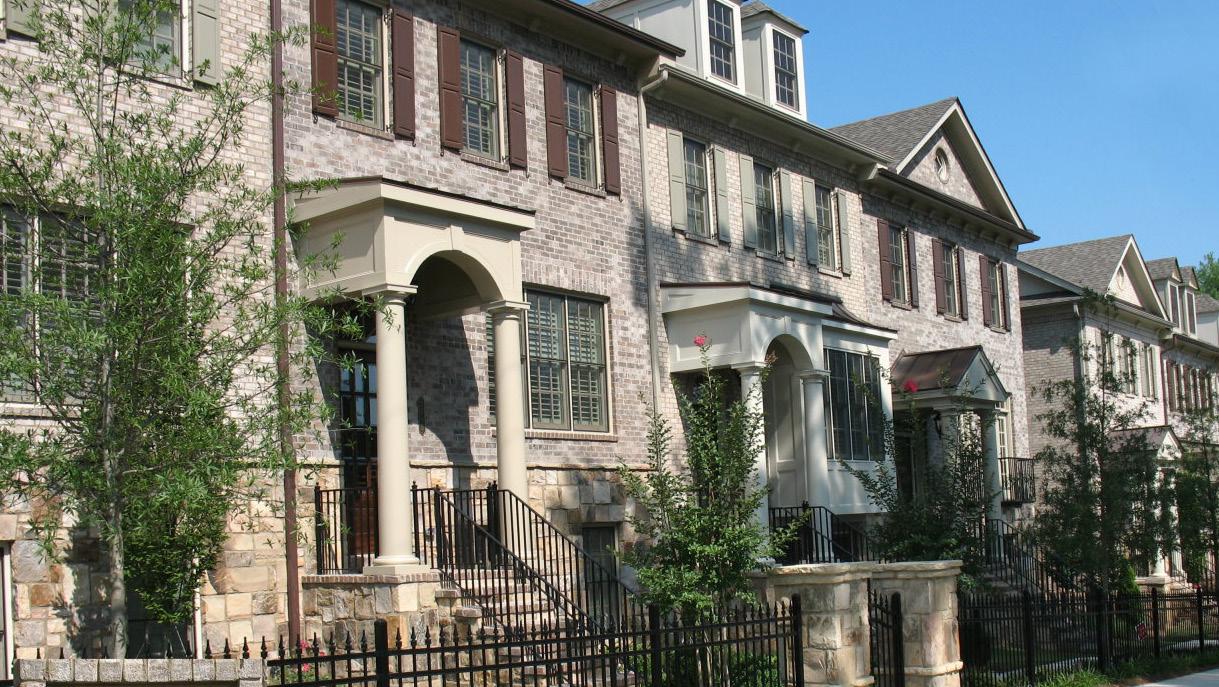
Townhomes
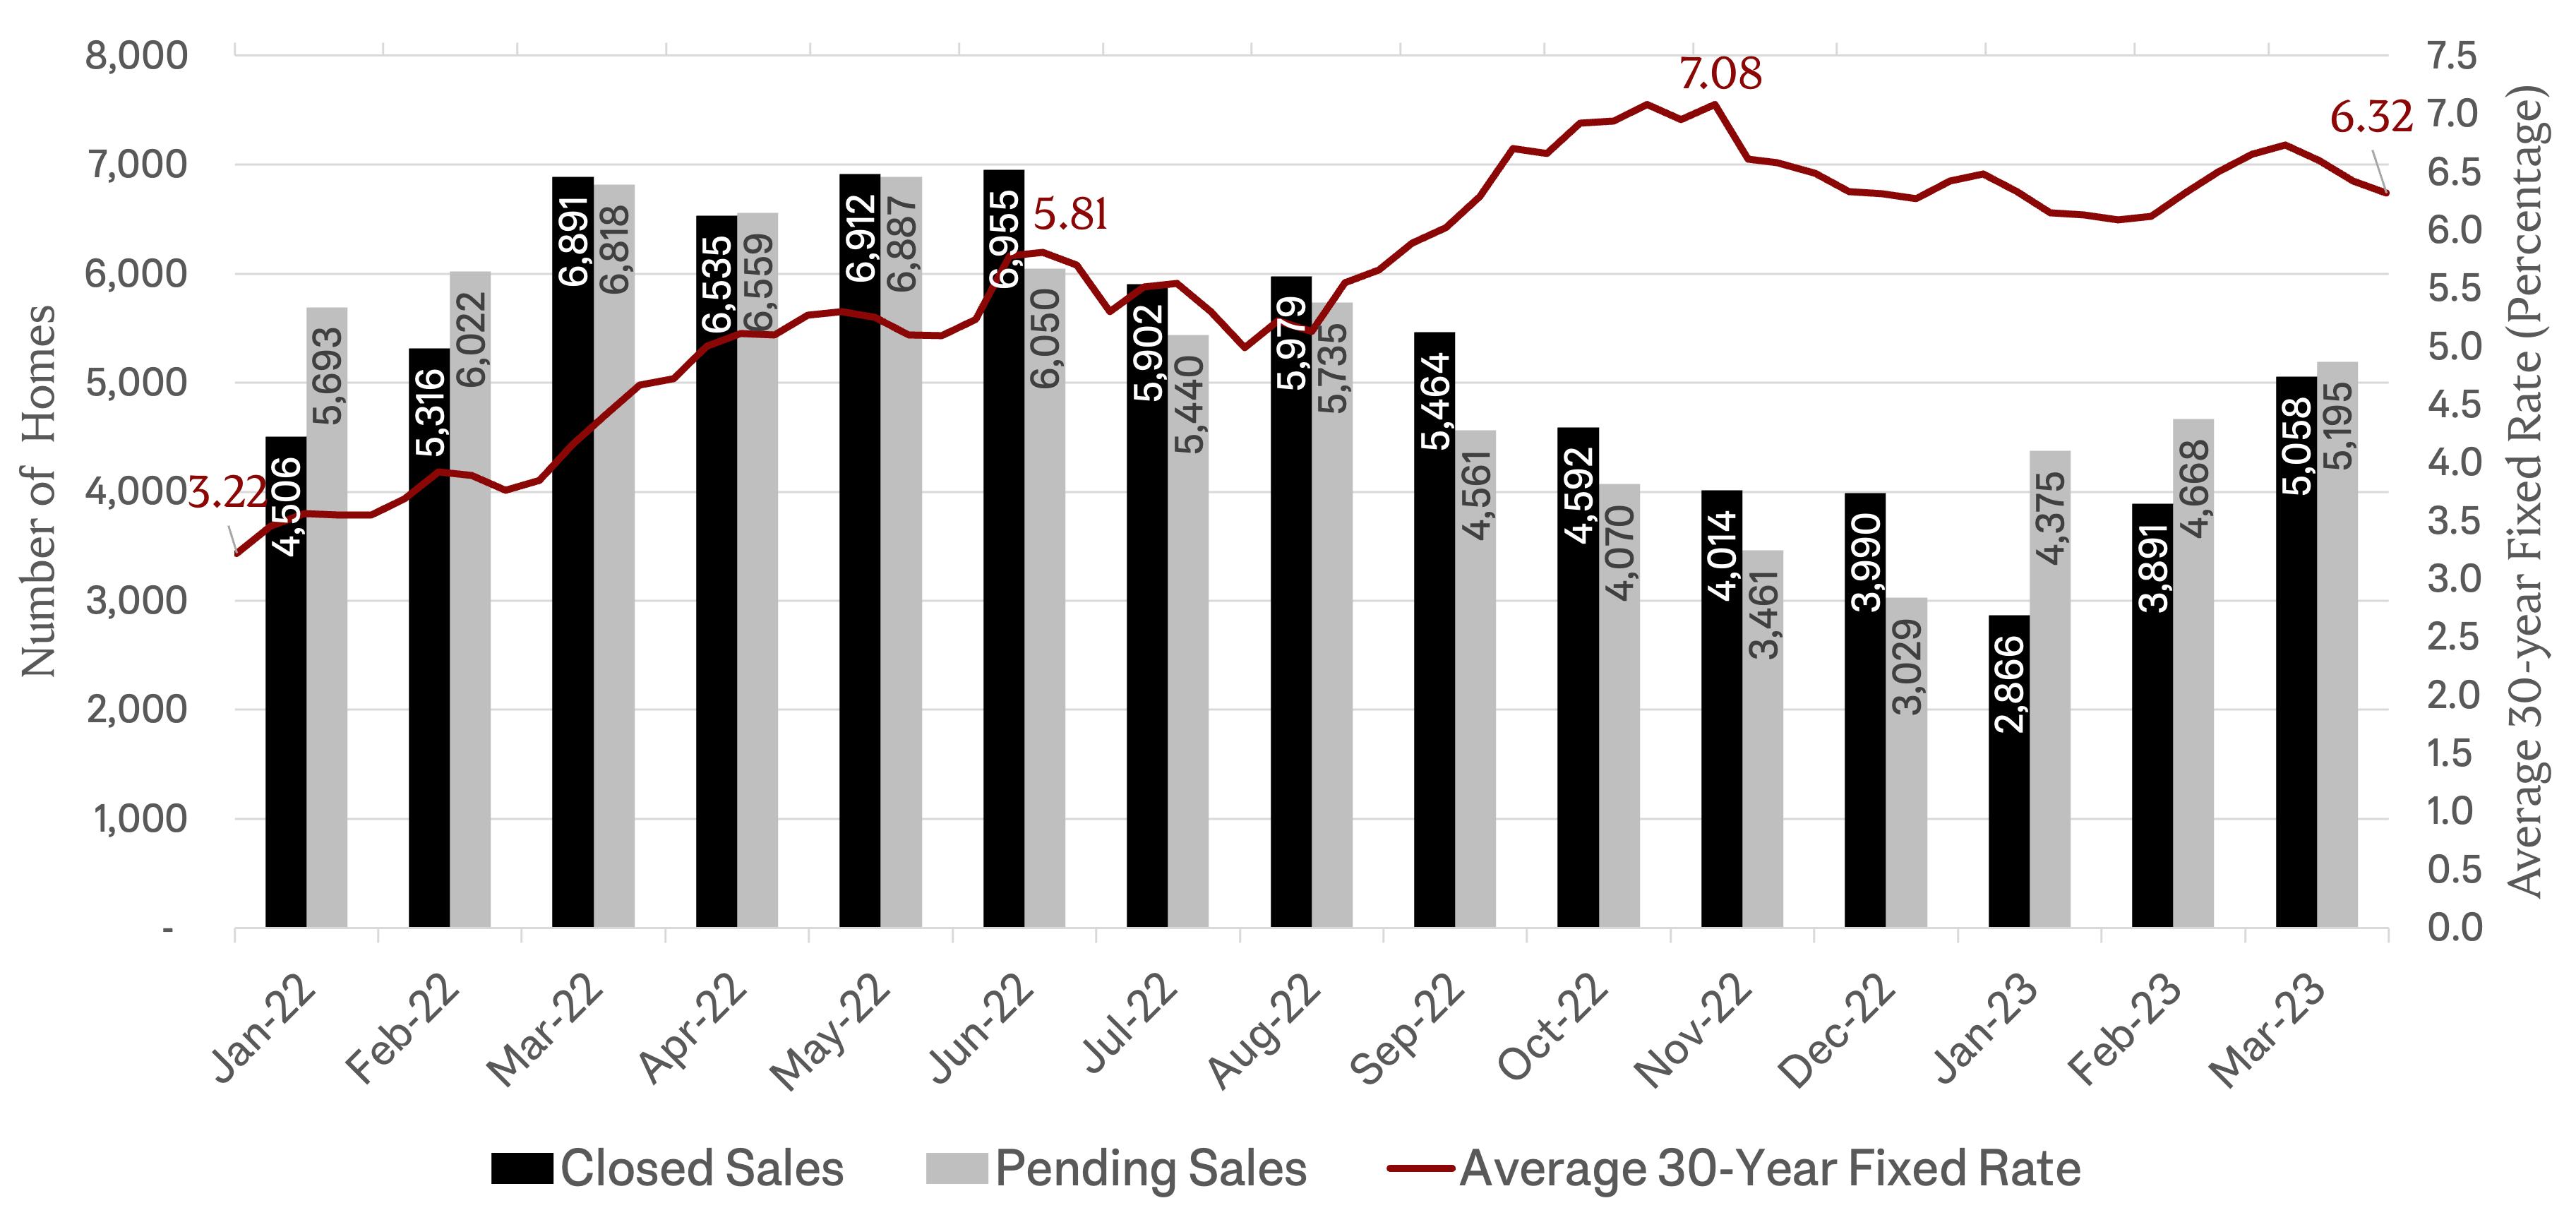
The real estate market has been largely defined by rising mortgage rates since summer 2022, when the average 30year fixed rate mortgage went over 5.25% for the first time in more than a decade. Q1 2023 marked a full year since interest rates began rising, and rates finally started to gradually decline. Now, patient would-be buyers who have been in “waiting mode” are slowly returning to the market.
February and March 2023 posted month-over-month (MOM) increases in closed sales in Metro Atlanta, signaling the start of the spring market. Although there is momentum brewing, home sales have not increased as dramatically as in a typical year, as interest rates remain elevated. There were 11,709 closed sales and 14,110 pending sales in Q1 2023. That was 25.3% fewer closed sales and 24.8% fewer pending sales than the average for Q1 from 2017 to 2022. Sales picked up each month of the quarter, jumping 35.7% MOM from January (2,866 closed sales) to February (3,891 closed sales) and 29.9% from February to March (5,058 closed sales).
On average, closed sales were down -28.1% YOY in Q1. Condominium sales had the largest year-over-year decline in closed sales (-41.9%), followed by single-family homes (-27.8%), with townhomes posting the fewest declines (-20%). In terms of price point, homes priced under $500,000 had the largest decline in home sales (-30.5% YOY), in part because home values have risen, moving homes into higher brackets. Homes priced $500,000 to $749,999 were down -23.1% YOY, those priced $750,000 to $999,999 were down -24% YOY, and homes over $1 million declined the least at -15% YOY. Most homes sold in the metro area were under $500,000 (69%).
Q1 2023 at a Glance
11,709 homes sold
$463,918 average sale price
1.8 months of inventory
44 average days on market
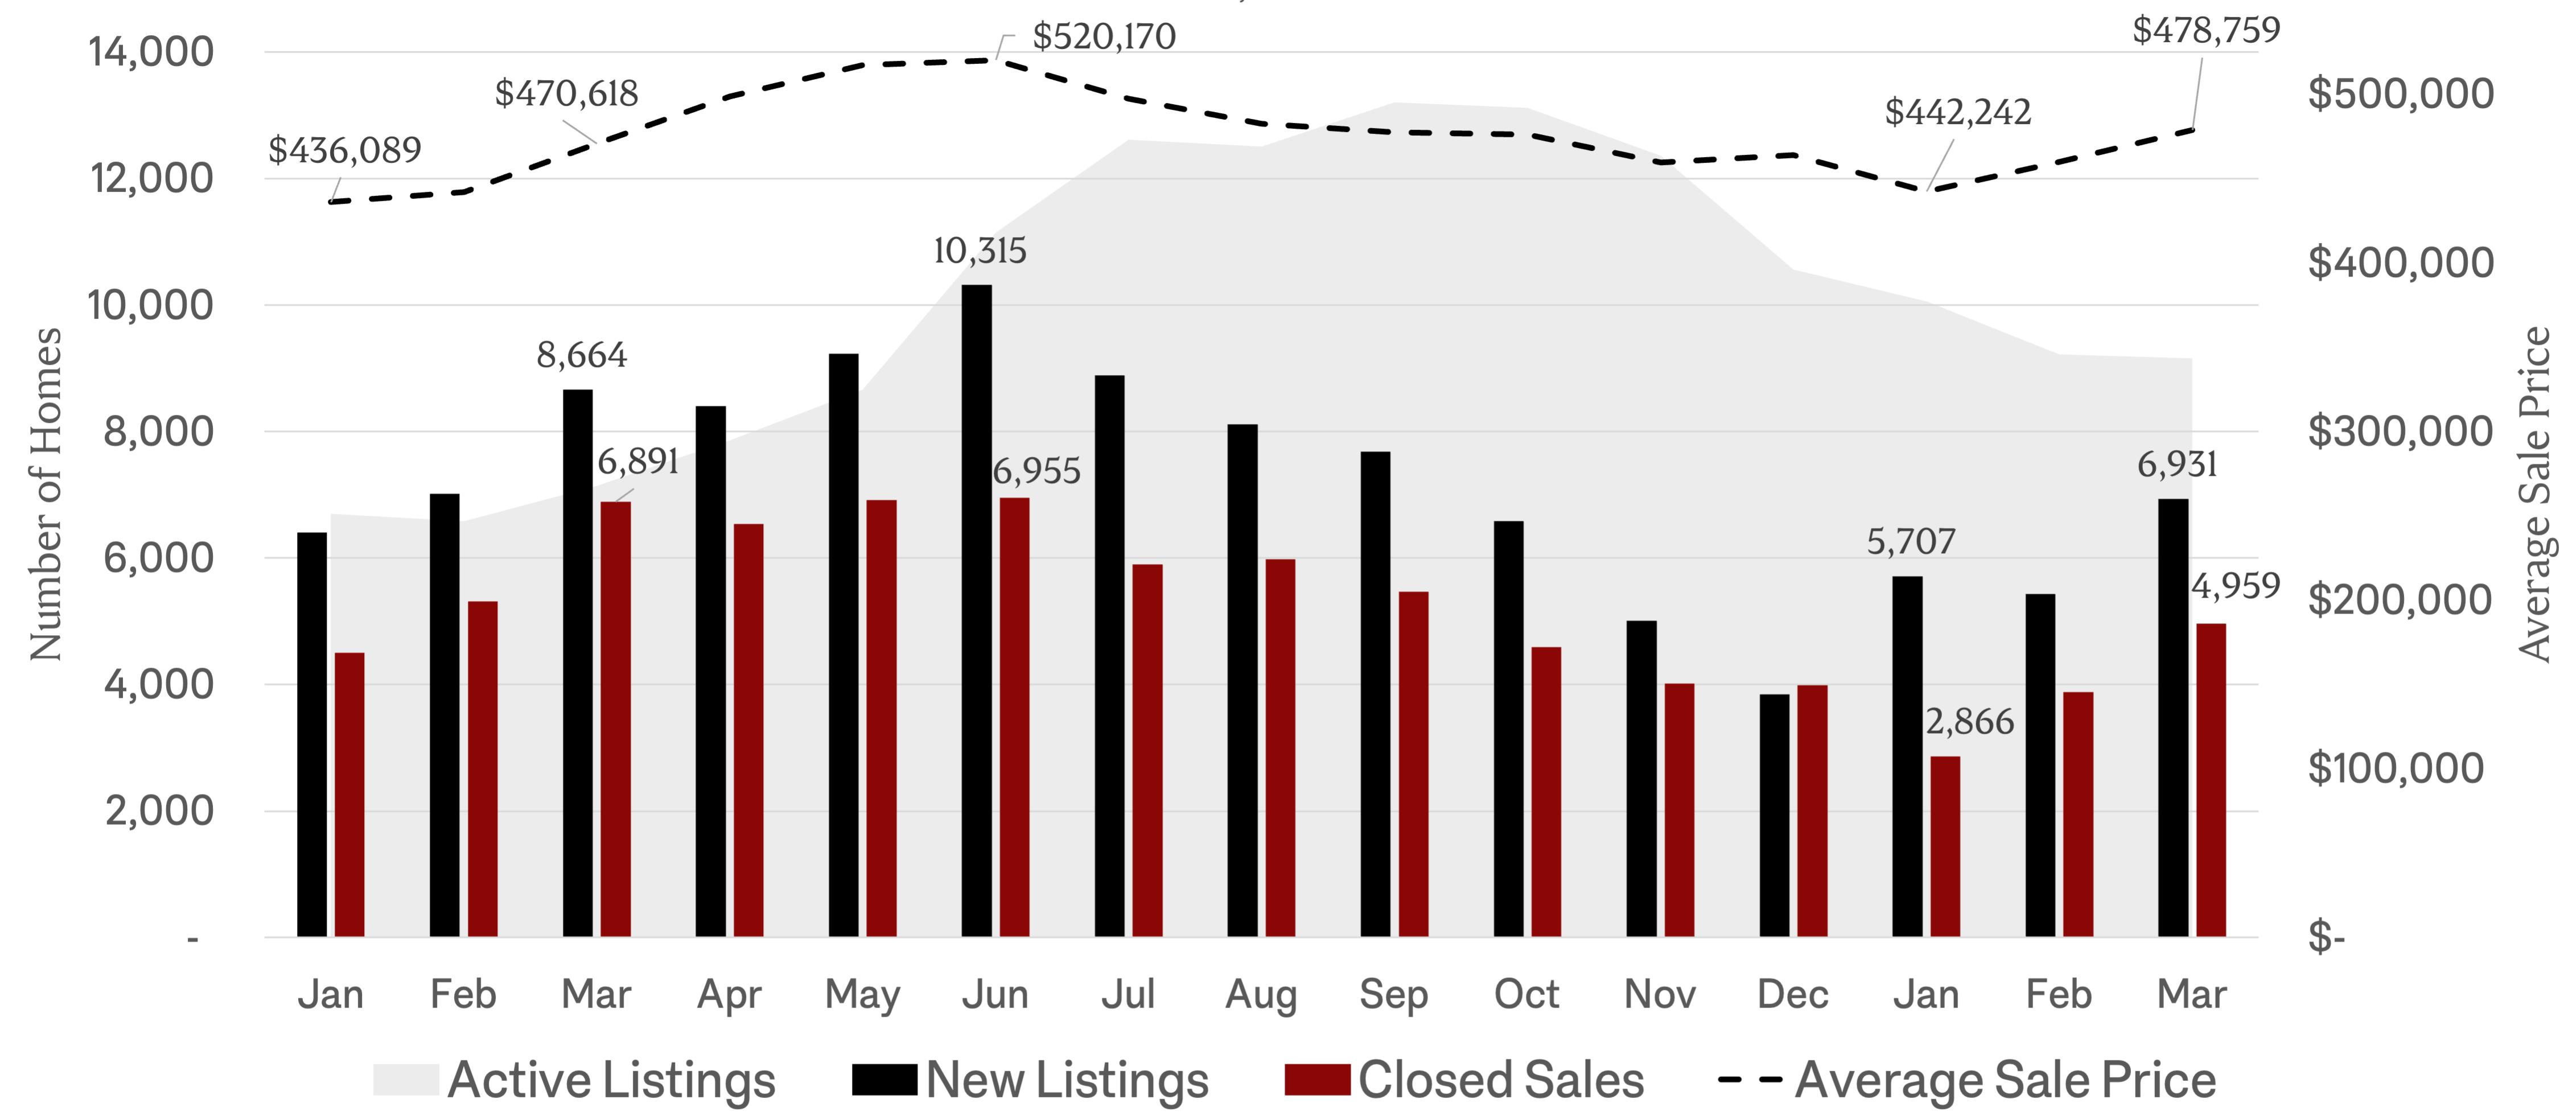
Home prices were up year-overyear in Q1, averaging $463,918 (+2.6% YOY). They rose steadily throughout the quarter—a normal seasonal trend— up 8.3% from January to March, when prices averaged $478,759. Homes
Source: FMLS InfoSparks, Greater Atlanta Area (Cherokee, Clayton, Cobb, DeKalb, Douglas, Fayette, Forsyth, Fulton, Gwinnett, Henry, and Rockdale Counties) All home types, All price points, Rolling 3-months as of March 2023
Metro Atlanta Supply Dynamics Summary (January 2022 - March 2023)
Source: FMLS InfoSparks, Greater Atlanta Area, All Home Types, January 2022 to March 2023
Metro Atlanta Market Summary (Q1 2023) q Down Year-Over-Year (YOY) p Up YOY
Source: FMLS InfoSparks, Greater Atlanta Area/City of Atlanta/ITP, All home types, All price points, Rolling 3-months as of March 2023 (year-over-year change compared to rolling 3-months as of March 2022), Retrieved 4/10/23
2023 Quarterly Average 30-Year Fixed Rate Mortgage Forecasts
2023 Q1 Q2 Q3 Q4
Freddie Mac (Oct. 2022)
6.6% 6.5% 6.4% 6.2%
Fannie Mae (Feb. 2023) 6.1% 6.0% 5.9% 5.7% Mortgage Bankers Association (Feb. 2023)
6.4% 6.1% 5.7% 5.3% National Association of Realtors (Mar. 2023) 6.7% 6.3% 5.9% 5.6%
sold for 96.2% of the original list price on average, a typical prepandemic range.
Inventory has been declining since November, as fewer existing homeowners with low rates have been willing to put their homes on the market. In Q1, there was 1.8 months of inventory, a level considered to be in the “seller’s market” range. This low level of inventory has contributed to rising yearover-year home prices despite lower demand due to interest rates. It has also been a source of frustration for buyers, who often feel there are not enough desirable homes to choose from. New listings rose in January for the first time since June 2022. There was a dip in new listings in February when interest rates rose, but they increased again in March, showing more sellers are ready to make a move.
where they are headed. As of April 13, 2023, the national average 30-year fixed rate mortgage was 6.27%. 1 Rates are expected to remain elevated but gradually decline throughout the year, likely ending the year in the mid- to high-5% range. Home sales are forecasted to increase throughout the year as lower interest rates make home ownership more affordable and latent demand returns. 2, 3, 4, 5 In the meantime, many lenders and new construction developers are continuing to offer incentives like rate buydowns or no-closing cost refinancing to reduce mortgage costs.
1 Fannie Mae Primary Mortgage Market Survey, Average 30-year Fixed Rate Mortgage as of 4/6/23
2 Freddie Mac, October 2022 Forecast
3 Fannie Mae, March 2023 Forecast
4 Mortgage Bankers Association, March 2023 Forecast
5 National Association of Realtors, March 2023 Forecast
Last spring, homes sold at a record pace of about two weeks. As interest rates rose, so did the average days on market. By February, it reached 46 days, a peak for this year but lower than the same time in 2019 (54 days), a typical pre-pandemic year. In March, it declined for the first time in 11 months to 43 days, a sign of buyers returning to the market. In some high demand submarkets, homes continue to sell in less than three weeks.
With interest rates impacting buying and selling decisions, it is important to understand
Home trends have varied significantly by submarket this year, as the desirability of individual homes and neighborhoods has become increasingly important. The rest of this report provides a snapshot of key metrics by home type (single-family homes, townhomes, and condominiums) and submarket, including neighborhoods Inside the Perimeter (ITP) and Outside the Perimeter (OTP).
To learn more about homes selling in your neighborhood or your dream location, reach out to your Engel & Volkers advisor for more detailed information about trends in your area.

Christa Huffstickler Founder & CEO Engel & Volkers Atlanta
Metro Atlanta Pending and Closed Sales vs. Interest Rates (January 2022 - March 2023)
Sources: FMLS InfoSparks, Greater Atlanta Area, All home types, All price points, January 2022 to March 2023, Retrieved 4/10/23; Fannie Mae Primary Mortgage Market Survey
Metro Atlanta Home Inventory (January 2022 - March 2023)
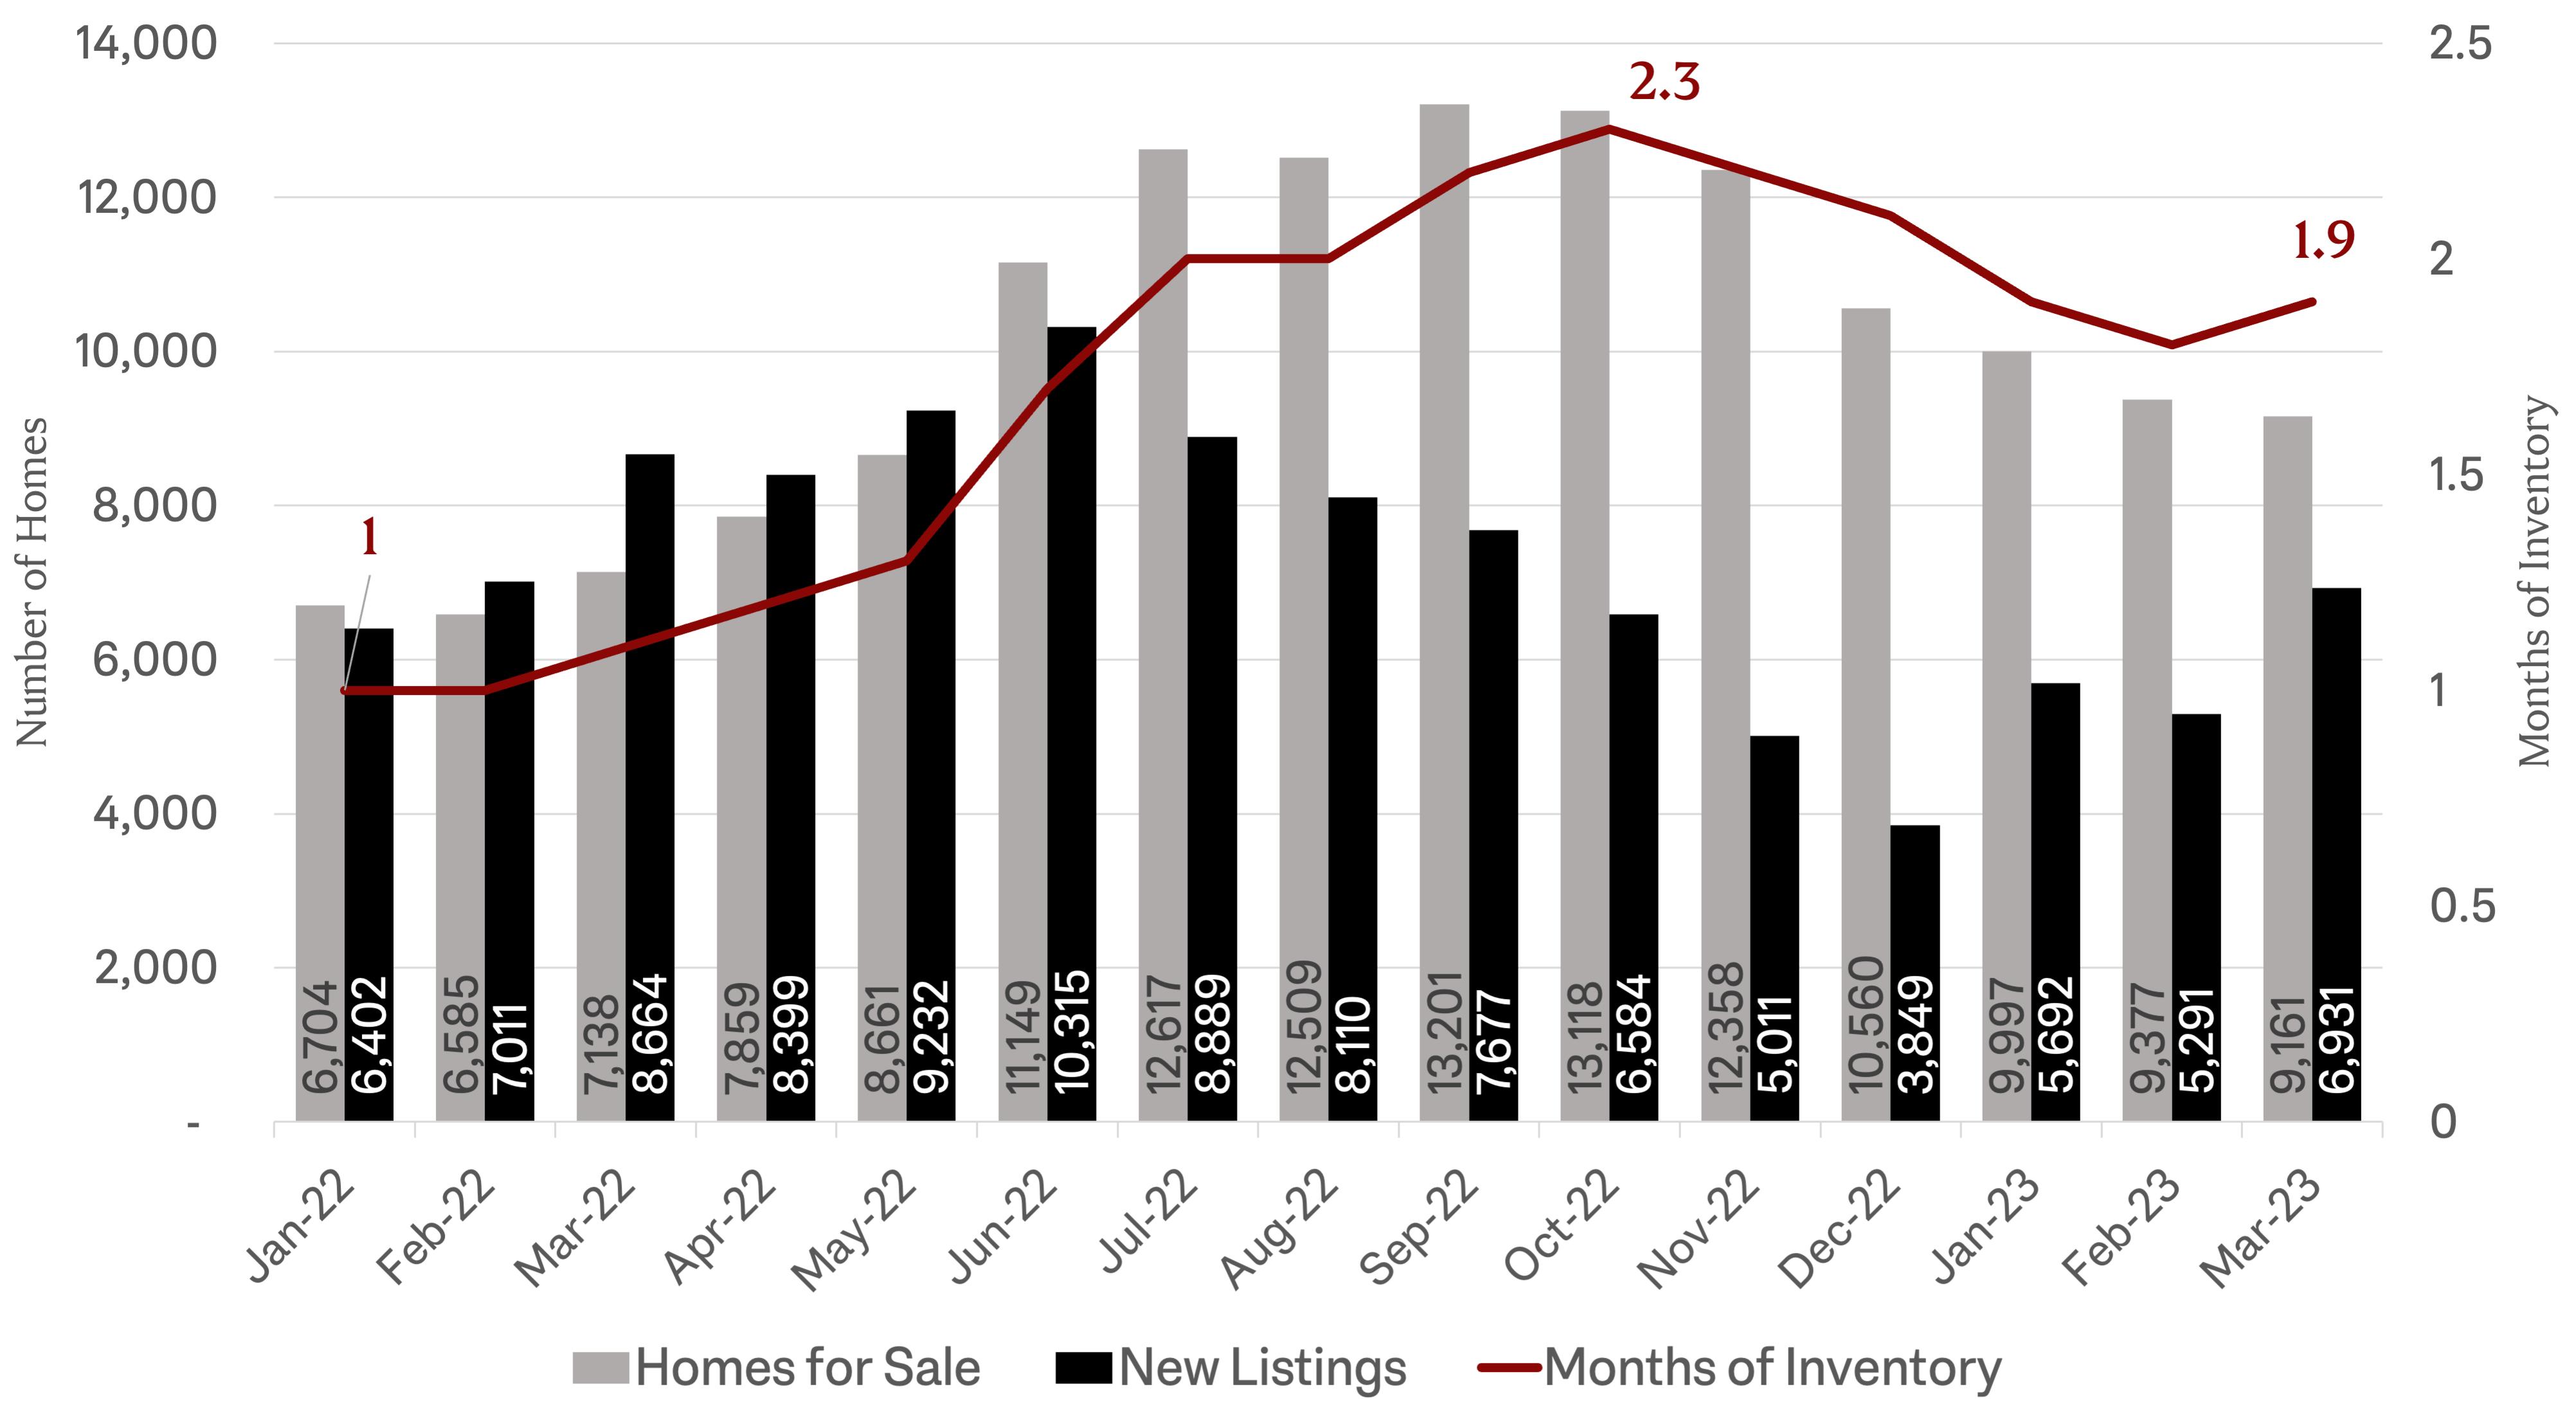
Source: FMLS InfoSparks, Greater Atlanta Area, All home types, All price points, January 2022 to March 2023, Retrieved 4/10/23







Source: FMLS, InfoSparks, TrendGraphix, Q1 2023 (1/1/23 to 3/31/23)

$1,175,000

Source: FMLS, InfoSparks, TrendGraphix, Q1 2023 (1/1/23 to 3/31/23)
Source: FMLS, InfoSparks, TrendGraphix, Q1 2023 (1/1/23 to 3/31/23)
$2,294,000
Source: FMLS, InfoSparks, TrendGraphix, Q1 2023 (1/1/23 to 3/31/23)


Source: FMLS, InfoSparks, TrendGraphix, Q1 2023 (1/1/23 to 3/31/23)

Source: FMLS, InfoSparks, TrendGraphix, Q1 2023 (1/1/23 to 3/31/23)

Source: FMLS, InfoSparks, TrendGraphix, Q1 2023 (1/1/23 to 3/31/23)


Source: FMLS, InfoSparks, TrendGraphix, Q1 2023 (1/1/23 to 3/31/23)


Source: FMLS, InfoSparks, TrendGraphix, Q1 2023 (1/1/23 to 3/31/23)


Source: FMLS, InfoSparks, TrendGraphix, Q1 2023 (1/1/23 to 3/31/23)

Source: FMLS, InfoSparks, TrendGraphix, Q1 2023 (1/1/23 to 3/31/23)


Source: FMLS, InfoSparks, TrendGraphix, Q1 2023 (1/1/23 to 3/31/23)


Source: FMLS, InfoSparks, TrendGraphix, Q1 2023 (1/1/23 to 3/31/23)

Source: FMLS, InfoSparks, TrendGraphix, Q1 2023 (1/1/23 to 3/31/23)




Source: FMLS, InfoSparks, TrendGraphix, Q1 2023 (1/1/23 to 3/31/23)

$1,078,029
Source: FMLS, InfoSparks, TrendGraphix, Q1 2023 (1/1/23 to 3/31/23)

Source: FMLS, InfoSparks, TrendGraphix, Q1 2023 (1/1/23 to 3/31/23)

Source: FMLS, InfoSparks, TrendGraphix, Q1 2023 (1/1/23 to 3/31/23)
Source: FMLS, InfoSparks, TrendGraphix, Q1 2023 (1/1/23 to 3/31/23)
Source: FMLS, InfoSparks, TrendGraphix, Q1 2023 (1/1/23 to 3/31/23)

Source: FMLS, InfoSparks, TrendGraphix, Q1 2023 (1/1/23 to 3/31/23)

Source: FMLS, InfoSparks, TrendGraphix, Q1 2023 (1/1/23 to 3/31/23)

Source: FMLS, InfoSparks, TrendGraphix, Q1 2023 (1/1/23 to 3/31/23)


Source: FMLS, InfoSparks, TrendGraphix, Q1 2023 (1/1/23 to 3/31/23)


Source: FMLS, InfoSparks, TrendGraphix, Q1 2023 (1/1/23 to 3/31/23)


Source: FMLS, InfoSparks, TrendGraphix, Q1 2023 (1/1/23 to 3/31/23)

Source: FMLS, InfoSparks, TrendGraphix, Q1 2023 (1/1/23 to 3/31/23)

Source: FMLS, InfoSparks, TrendGraphix, Q1 2023 (1/1/23 to 3/31/23)
HOMES

Source: FMLS, InfoSparks, TrendGraphix, Q1 2023 (1/1/23 to 3/31/23)

Source: FMLS, InfoSparks, TrendGraphix, Q1 2023 (1/1/23 to 3/31/23)


Source: FMLS, InfoSparks, TrendGraphix, Q1 2023 (1/1/23 to 3/31/23)


Source: FMLS, InfoSparks, TrendGraphix, Q1 2023 (1/1/23 to 3/31/23)

Source: FMLS, InfoSparks, TrendGraphix, Q1 2023 (1/1/23 to 3/31/23)




Source: FMLS, InfoSparks, TrendGraphix, Q1 2023 (1/1/23 to 3/31/23)



Source: FMLS, InfoSparks, TrendGraphix, Q1 2023 (1/1/23 to 3/31/23)



Source: FMLS, InfoSparks, TrendGraphix, Q1 2023 (1/1/23 to 3/31/23)


Source: FMLS, InfoSparks, TrendGraphix, Q1 2023 (1/1/23 to 3/31/23)


Source: FMLS, InfoSparks, TrendGraphix, Q1 2023 (1/1/23 to 3/31/23)

Source: FMLS, InfoSparks, TrendGraphix, Q1 2023 (1/1/23 to 3/31/23)
Source: FMLS, InfoSparks, TrendGraphix, Q1 2023 (1/1/23 to 3/31/23)
Source: FMLS, InfoSparks, TrendGraphix, Q1 2023 (1/1/23 to 3/31/23)
Source: FMLS, InfoSparks, TrendGraphix, Q1 2023 (1/1/23 to 3/31/23)


Source: FMLS, InfoSparks, TrendGraphix, Q1 2023 (1/1/23 to 3/31/23)
Source: FMLS, InfoSparks, TrendGraphix, Q1 2023 (1/1/23 to 3/31/23)
Source: FMLS, InfoSparks, TrendGraphix, Q1 2023 (1/1/23 to 3/31/23)
Source: FMLS, InfoSparks, TrendGraphix, Q1 2023 (1/1/23 to 3/31/23)
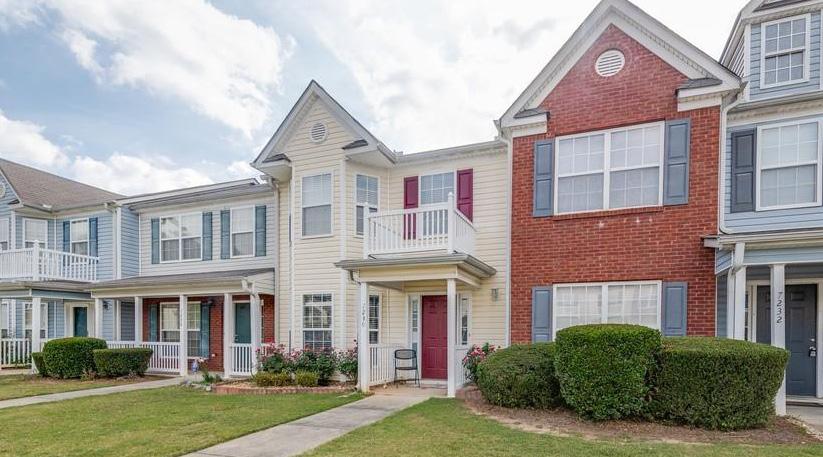

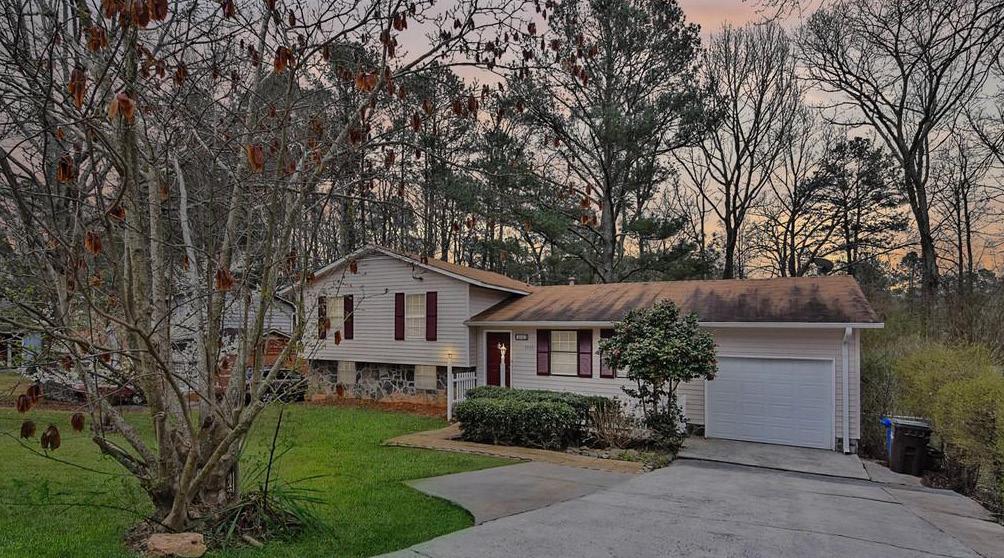
Source: FMLS, InfoSparks, TrendGraphix, Q1 2023 (1/1/23 to 3/31/23)
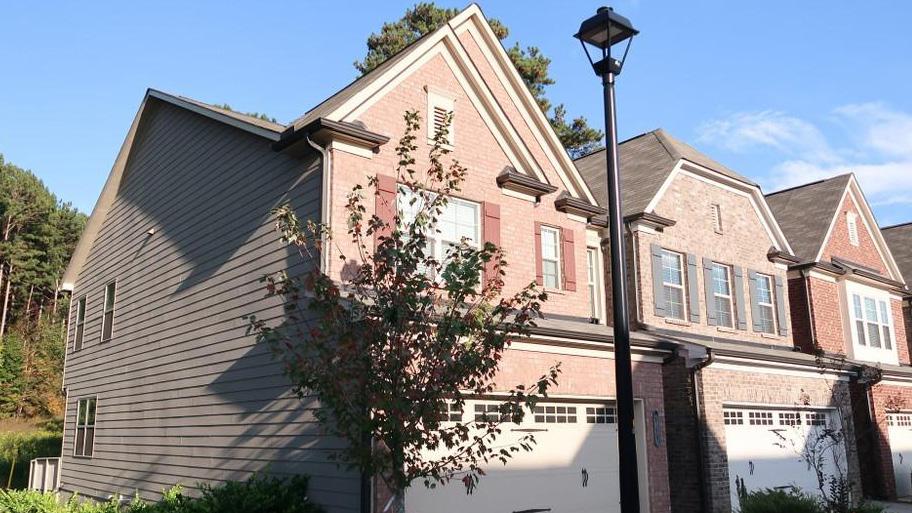
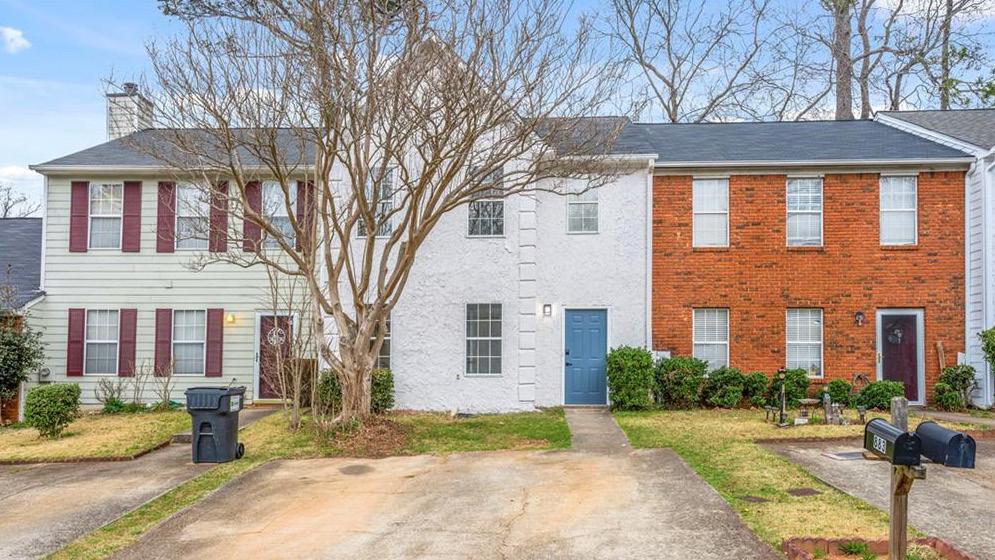
Source: FMLS, InfoSparks, TrendGraphix, Q1 2023 (1/1/23 to 3/31/23)
Source: FMLS, InfoSparks, TrendGraphix, Q1 2023 (1/1/23 to 3/31/23)
Source: FMLS, InfoSparks, TrendGraphix, Q1 2023 (1/1/23 to 3/31/23)
Source: FMLS, InfoSparks, TrendGraphix, Q1 2023 (1/1/23 to

Source: FMLS, InfoSparks, TrendGraphix, Q1 2023 (1/1/23 to 3/31/23)
Source: FMLS, InfoSparks, TrendGraphix, Q1 2023 (1/1/23 to 3/31/23)
The following key indicators are used throughout this report to describe market trends:

Properties that are currently listed for sale on FMLS. Additional properties may be for sale at any given time— such as for-sale by owner homes or off-market listings— but are not included in the count of “active listings” in this report if they are not in the FMLS database.

Pending sales are properties that have accepted an offer from a buyer and is in the due diligence period. The sales transaction has not happened yet. This is a leading indicator because it give us insight into how buyers and sellers are reacting to the most current market conditions.

Days on market (DOM) measures how long it takes from the time a home is listed until the owner signs a contract for the sale of a property. This tends to vary based on the desirability of a given property, market conditions, and season.

New listings are those that have been added to FMLS in a given month. They do not include active listings that were entered in previous months.

Closed sales represent homes that have sold and transactions have been finalized. This indicator tends to lag market trends slightly because properties typically close one to two months after an offer has been accepted and buyers have locked their interest rates.

The sale price is the final amount paid for a home. It is measured as either an average or a median, with the average price tending to be skewed higher by the highest priced homes. It does not reflect seller concessions, such as closing costs that may have been paid.

The sale price to list price ratio (SP/LP) indicates if a home sold at (100%), above (>100%), or below (<100%) the listed asking price. The sale price to original list price ratio (SP/OLP) compares the sale price to the original asking price, as the current asking price may have reflected price changes.
Months of inventory indicates how long it would likely take to sell currently listed homes, if no new inventory were added. It is measured as a ratio of active listings to homes sold. 5 to 6 months of inventory is considered a balanced market. Less than 6 months supply tends to favor sellers, and more tends to favor buyers.
