MARKET INTELLIGENCE
2020 Q3 ATLANTA, GEORGIA

The World Health Organization officially declared coronavirus a pandemic on March 11, 2020. As of September 1, it’s infected over 35 million worldwide and over 7 million in the U.S. This has taken a toll on the U.S. economy and spiked unemployment. Even so, the economy is showing early signs of recovery.
While many unknown factors still cloud predictions on the economic future, the housing market in Atlanta, continues to show signs of healthy growth. Inventory is still low, and demand continues to increase.
Given these extraordinary times, Engel & Völkers Atlanta is taking an exceptionally close look at the Atlanta real estate market to better understand and anticipate market conditions.
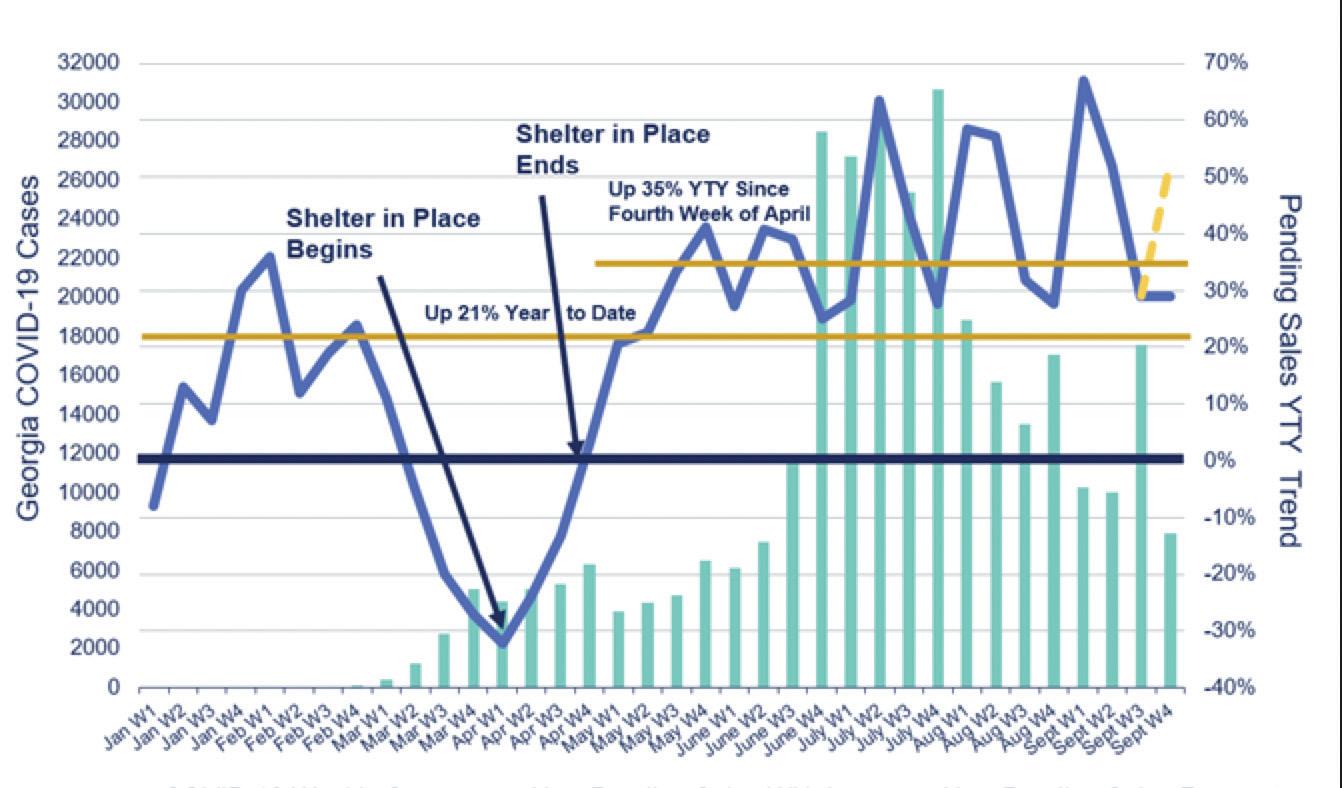
Weekly Covid-19 Cases and Pending Sales YTY %
Change Atlanta
Covid-19 Weekly Cases
New Pending Sales with Lag
New Pending Sales Forecast
*Source: MarketNSight
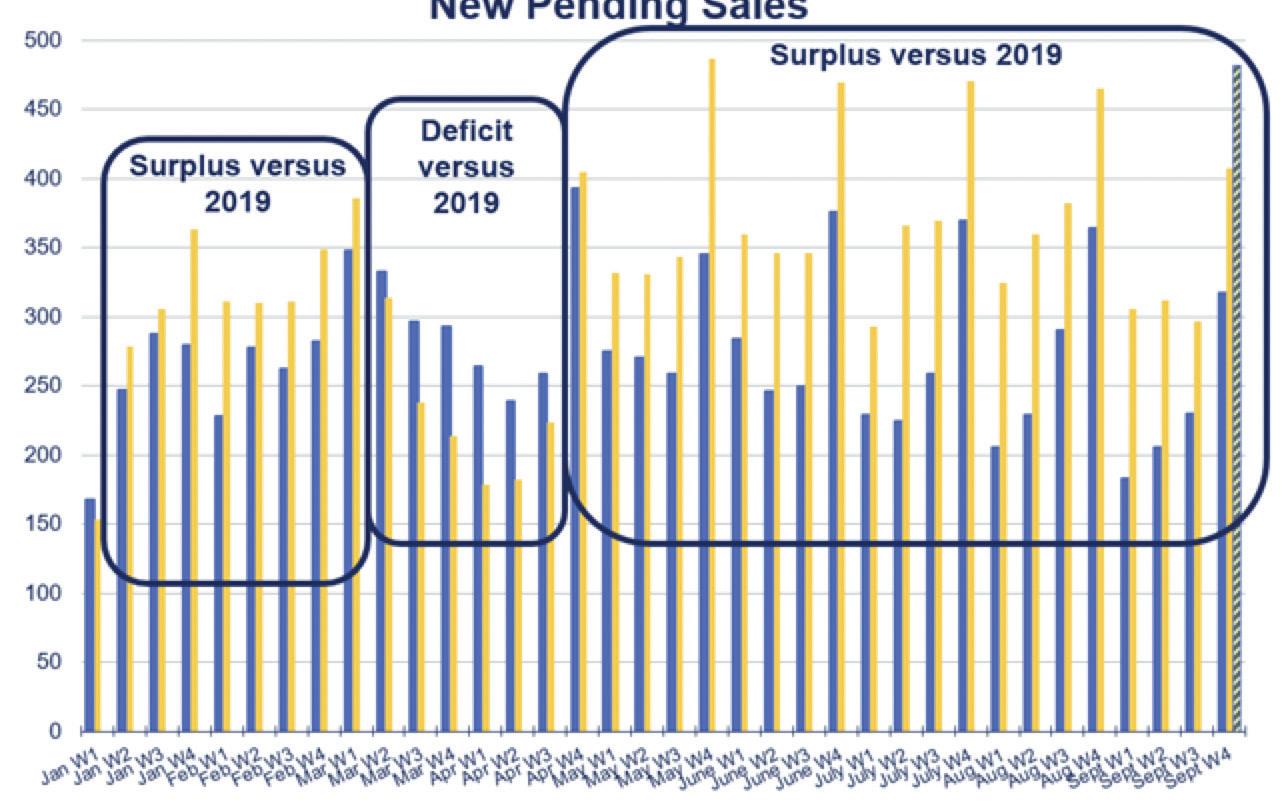
January 1 - September 30 WeeklyAtlanta New Pending Sales
New Pending Sales 2019
New Pending Sales 2020 with Lag
New Pending Sales 2020 Forecast
*Source: MarketNSight
Source: 7/1/2020 – 9/30/2020 provided by FMLS
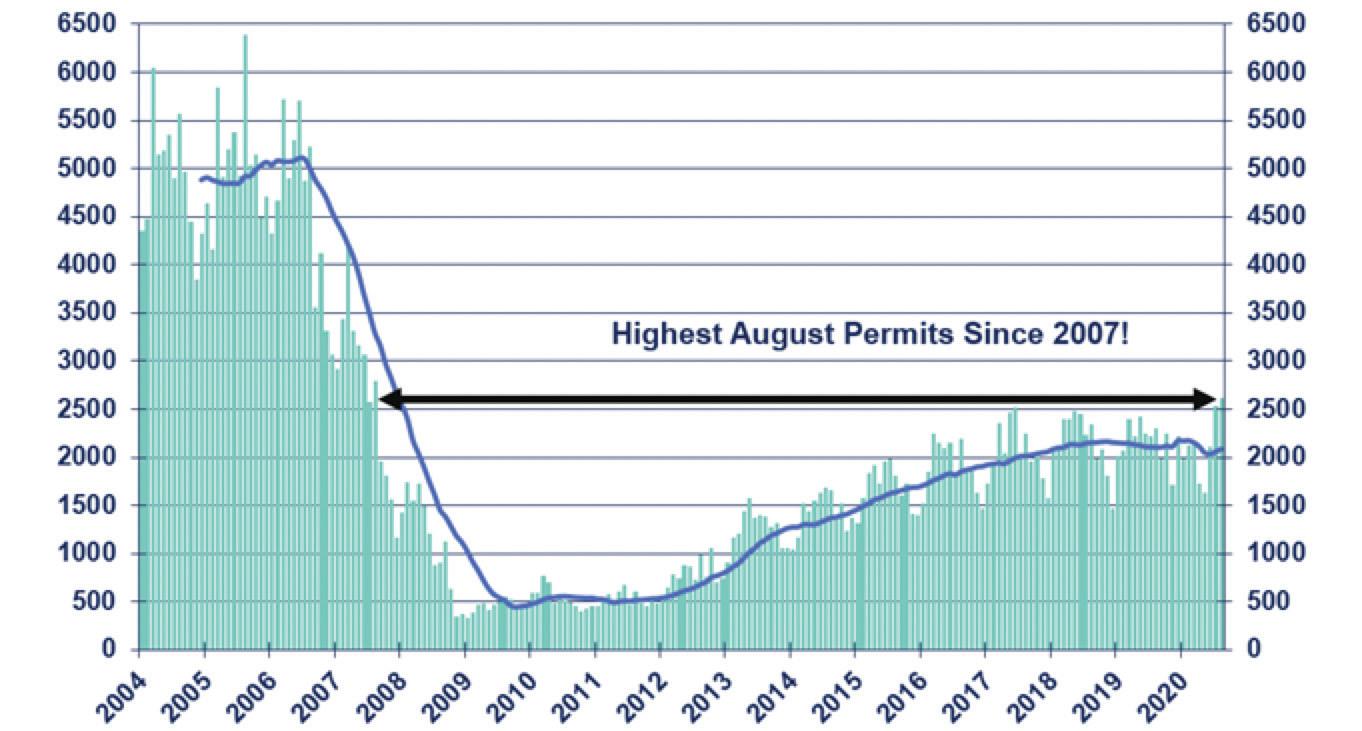
Permit Trend 1/2004 - 8/2020
Atlanta
Permits / Month
12 Month Moving Average
*Source: MarketNSight
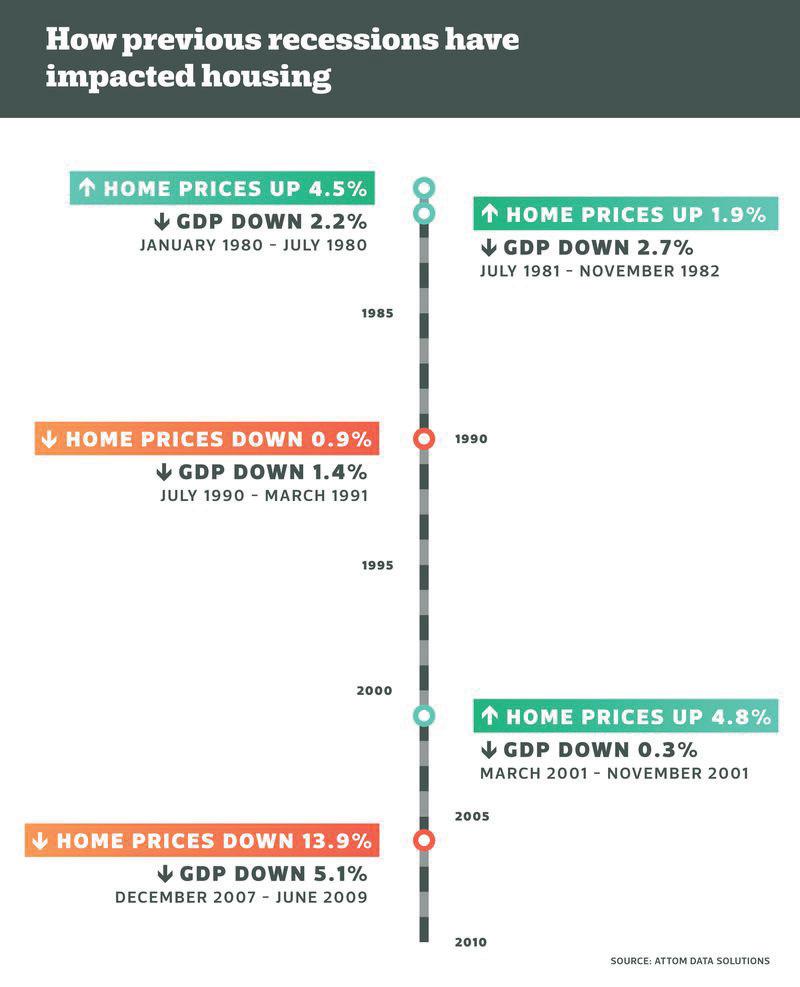
Given the data above, alongside the analysis of industry experts, such as John Hunt of MarketNSight, Robert Dietz, the NAHB Chief Economist, and Georgia State University’s Chief Economist Dr. Rajeev Dhawan, here are some key takeaways:
• It’s obvious that the desire for people to own a home in Atlanta is still very strong and getting stronger.
• Underlying strength of the Atlanta real estate market coupled with ultra-low interest rates means a quick recovery should another shut down occur.
• We are continuing to see evidence that housing is maintaining its traditional role of leading the country out of this recession.
Source: 7/1/2020 – 9/30/2020 provided by FMLS
Source: 7/1/2020 – 9/30/2020 provided by FMLS
As we move through the next few months, it will be important to remember that, as the data shows, there is still a supply and demand issue. Industry expert and NAHB Chief Economist, Robert Dietz, says it best- “The housing sector enters this recession underbuilt rather than overbuilt. That means as the economy rebounds — which it is beginning to — housing is set to help lead the way out.”
We’ll be releasing another detailed report at the end of 2020, make sure you’re signed up to receive it by clicking below.
Source: 7/1/2020 – 9/30/2020 provided by FMLS
As the economy in Georgia continues to come back to life and the city continues to grapple with the effects of the pandemic, we continue to monitor data each day in an effort to keep our clients and company informed on the state of the real estate market. On the following pages of this report you will find a cohesive set of data points which help showcase current market conditions in the condominium, townhome, and single-family home markets of areas and neighborhoods within metro-Atlanta.
Overall, the third quarter of 2020 has shown little change in supply levels for townhomes and condos, while the single-family home supply levels continue to decrease. As expected, overall supply levels remain well below stable market conditions, which translates to a 1.6-month timeline to sell all of the homes on the market. However, supply levels for higher priced homes can range widely from 2-18 months.
Economic conditions in Atlanta, like the explosive job growth and population boom, have helped this amazing city thrive in an expansionary time. However, with the COVID-19 pandemic and economic fallout surrounding it, there are many questions about the Atlanta real estate market. Like many other cities, Atlanta has experienced a sharp rise in unemployment. While many furloughed workers have been and will continue to return to work, there are many jobs that are permanently lost. Given current home inventory levels and sales data, this will have a minimal impact on the Atlanta real estate market.
We hope the information within the following pages will provide clarity and confidence in this time of change and uncertainty. We appreciate you looking through this report and hope you harness and spread the word on the insight provided within.

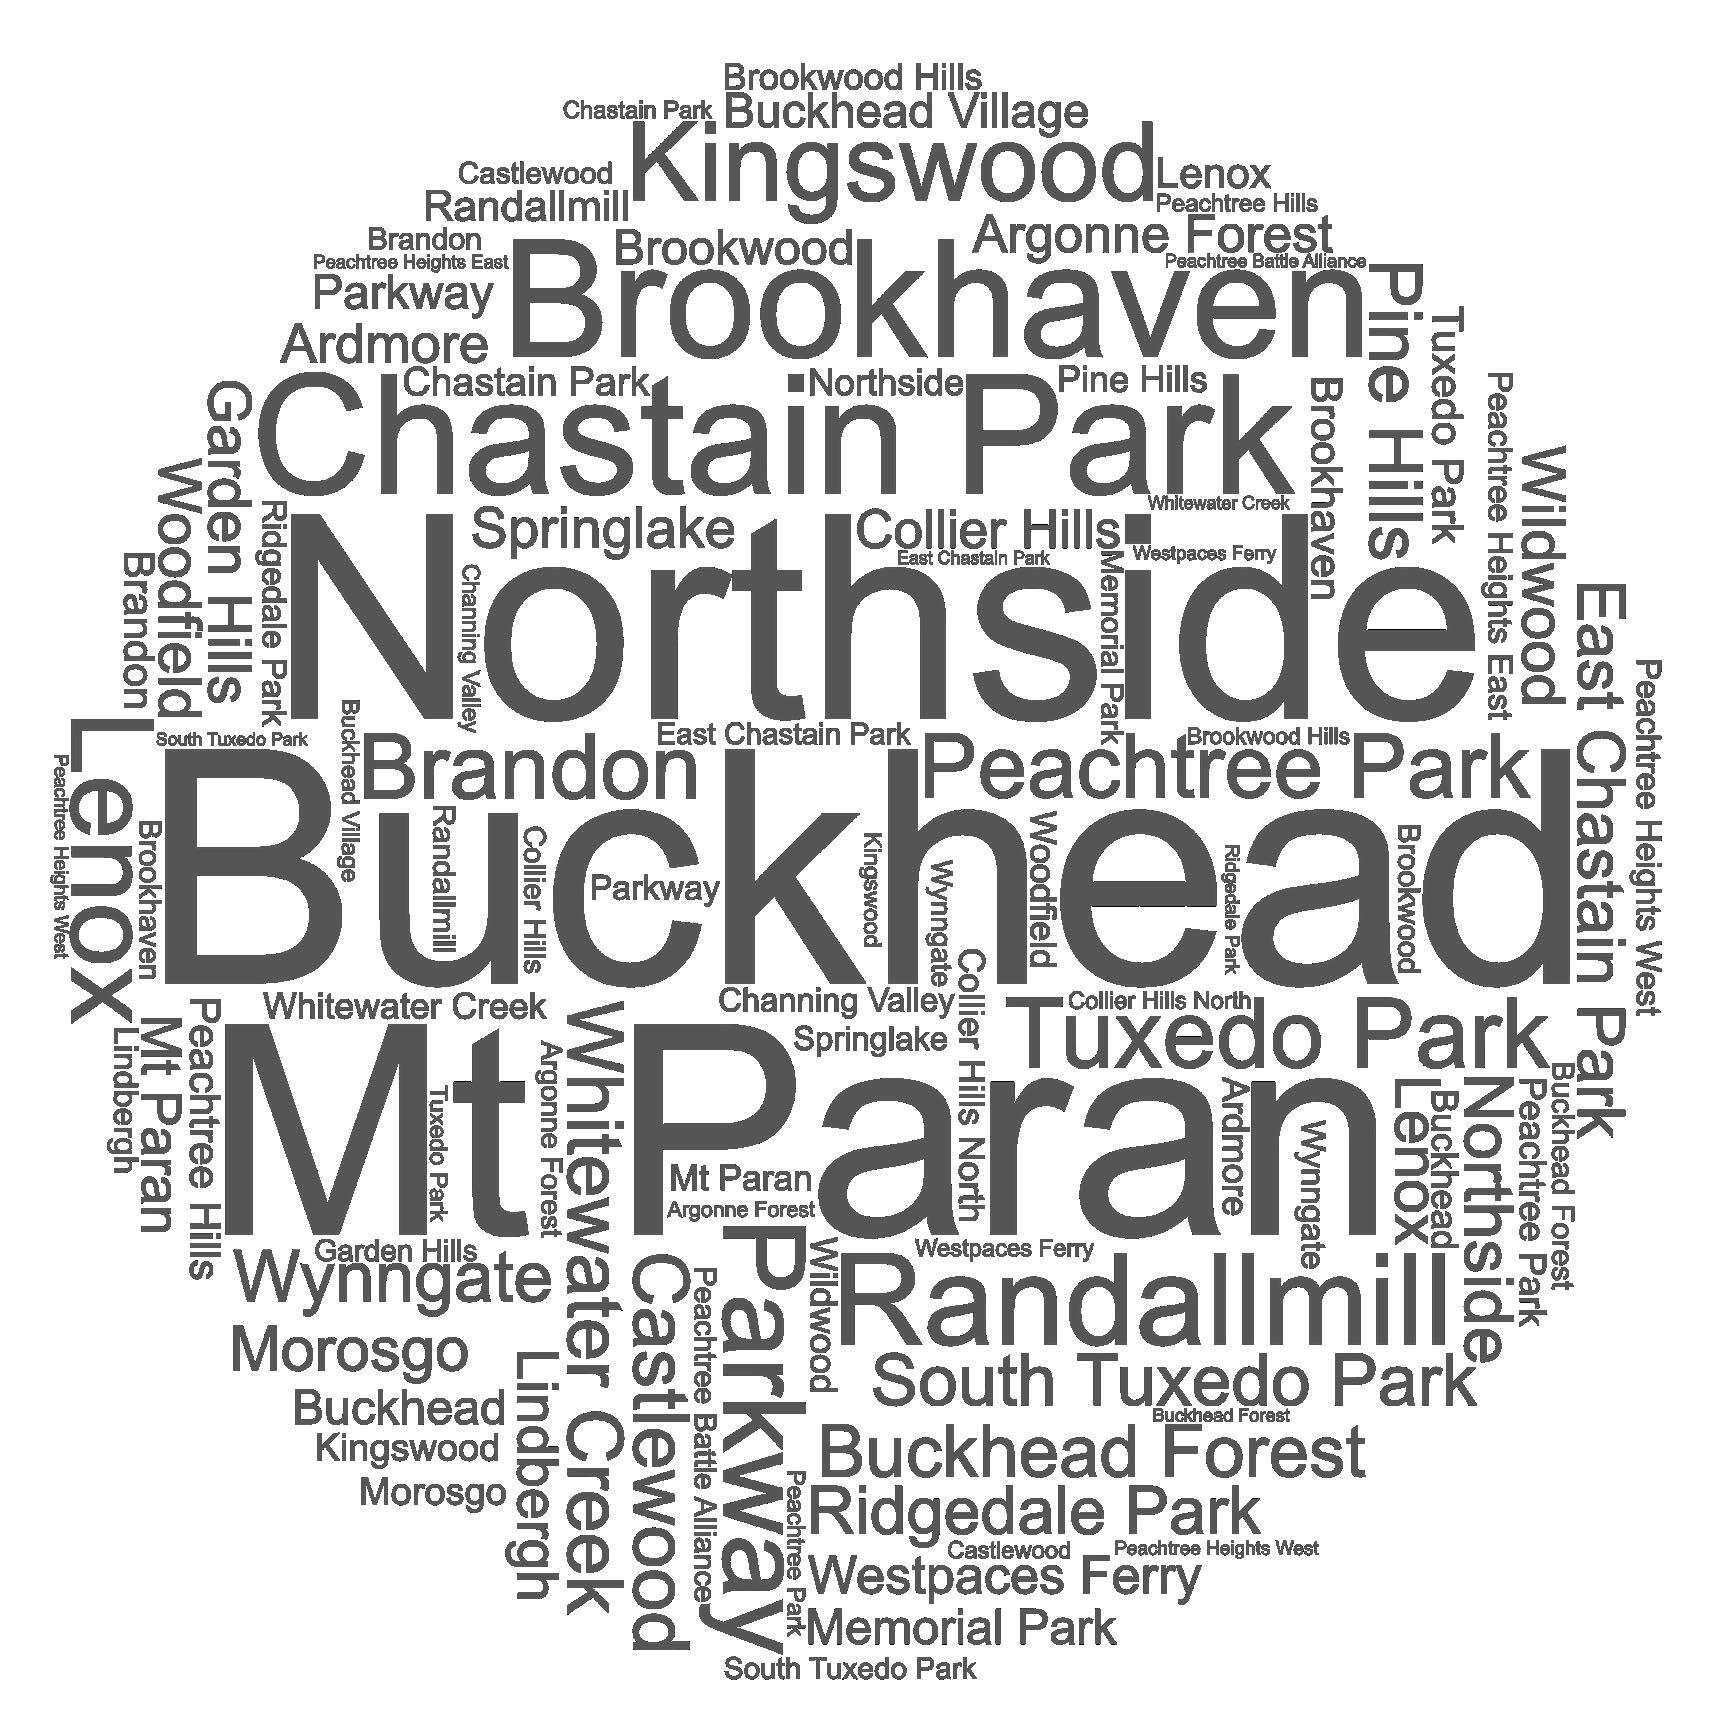
First Multiple Listing Service (FMLS) Area 21 encompasses most of Atlanta’s Buckhead Community. It includes Tuxedo Park, Mt. Paran/Northside, Chastain Park, the portion of Brookhaven that falls within Fulton County, and numerous other neighborhoods. FMLS Area 21 is bound by the Fulton/DeKalb line to the east, I-75 to the west, the City of Atlanta line to the north and I-85 to the south.
The following table shows activity for attached homes (condos and townhomes) in FMLS Area 21 from July, 1 2020 thru September, 30 2020.
Source: FMLS Absorption Analysis Report Trailing 3 Months from 9/30/20
The following table shows activity for detached homes (single family) in FMLS Area 21 from July, 1 2020 thru September, 30 2020.
Source: FMLS Absorption Analysis Report Trailing 3 Months from 9/30/20
The number of active condo listings in FMLS Area 21 increased 26% on a year-over-year basis from 1,175 in Q3 2020 to 1,489 in Q3 2020. The number of new condo listings in FMLS Area 21 increased 38% on a year-over-year basis from 433 in Q3 2019 to 598 in Q3 2020. The number of condo sales in FMLS Area 21 decreased 3% on a year-over-year basis from 277 in Q3 2019 to 269 in Q3 2020. The months of inventory for condos in FMLS Area 21 increased 33% on a year-over-year basis from 4 months in Q3 2019 to 6 months in Q3 2020.
MARKET ACTIVITY DASHBOARD | Q3 2020 vs Q3 2019
NUMBER OF ACTIVE LISTINGS +26.2%
NUMBER OF NEW LISTINGS +38.1%
NUMBER OF CLOSINGS -2.9% MONTHS OF INVENTORY +33.3%
SALE PRICE -1.3%
SALE PRICE -1.9% SALES PRICE TO LIST PRICE RATIO +1.2%
MEDIAN CUMULATIVE DAYS ON MARKET -2.7%
The number of active condo listings in FMLS Area 21 increased 27% on a yearover-year basis from 1,175 in Q3 2020 to 1,489 in Q3 2020.
The number of new condo listings in FMLS Area 21 increased 38% on a yearover-year basis from 433 in Q3 2019 to 598 in Q3 2020.
year
The number of active townhome listings in FMLS Area 21 increased 16% on a year-over-year basis from 303 in Q3 2020 to 350 in Q3 2020. The number of new townhome listings in FMLS Area 21 increased 21% on a year-over-year basis from 117 in Q3 2019 to 142 in Q3 2020. The number of townhome sales in FMLS Area 21 increased 12% on a year-over-year basis from 59 in Q3 2019 to 66 in Q3 2020. The months of inventory for townhomes in FMLS Area 21 decreased 6% on a year-over-year basis from 6 months in Q3 2019 to 5 months in Q3 2020.
MARKET ACTIVITY DASHBOARD | Q3 2020 vs Q3 2019
NUMBER OF ACTIVE LISTINGS +15.5%
NUMBER OF NEW LISTINGS +21.4% NUMBER OF CLOSINGS +11.9% MONTHS OF INVENTORY -6.2% MEDIAN SALE PRICE
AVERAGE SALE PRICE -4.5% SALES PRICE TO LIST PRICE RATIO +0.6%
MEDIAN CUMULATIVE DAYS ON MARKET +19.8%
The number of active townhome listings in FMLS Area 21 increased 16% on a year-over-year basis from 303 in Q3 2020 to 350 in Q3 2020.
The number of new townhome listings in FMLS Area 21 increased 21% on a year-over-year basis from 117 in Q3 2019 to 142 in Q3 2020.
The number of townhome sales in FMLS Area 21 increased 12% on a yearover-year basis from 59 in Q3 2019 to 66 in Q3 2020.
SUMMARY OF SINGLE-FAMILY DETACHED MARKET ACTIVITY
The number of active single-family listings in FMLS Area 21 increased 4% on a year-over-year basis from 1379 in Q3 2019 to 1433 in Q3 2020. The number of new single-family home listings in FMLS Area 21 increased 29% on a year-over-year basis from 424 in Q3 2019 to 548 in Q3 2020. The number of single-family home sales in FMLS Area 21 increased 25% on a year-over-year basis from 261 in Q3 2019 to 327 in Q3 2020. The months of inventory for single-family homes in FMLS Area 21 decreased 16% on a year-over-year basis from 5 months in Q3 2019 to 4 months in Q3 2020.
MARKET ACTIVITY DASHBOARD | Q3 2020 vs Q3 2019
NUMBER OF ACTIVE LISTINGS
NUMBER OF CLOSINGS
SALE PRICE
SALES PRICE TO LIST PRICE RATIO +4.3%
NUMBER OF NEW LISTINGS
MONTHS OF INVENTORY
AVERAGE SALE PRICE
MEDIAN CUMULATIVE DAYS ON MARKET +0.0%
The number of active single-family listings in FMLS Area 21 increased 4% on a year-over-year basis from 1379 in Q3 2019 to 1433 in Q3 2020.
The number of new single-family home listings in FMLS Area 21 increased 29% on a year-over-year basis from 424 in Q3 2019 to 548 in Q3 2020.
The number of single-family home sales in FMLS Area 21 increased 25% on a year-over-year basis from 261 in Q3 2019 to 327 in Q3 2020.


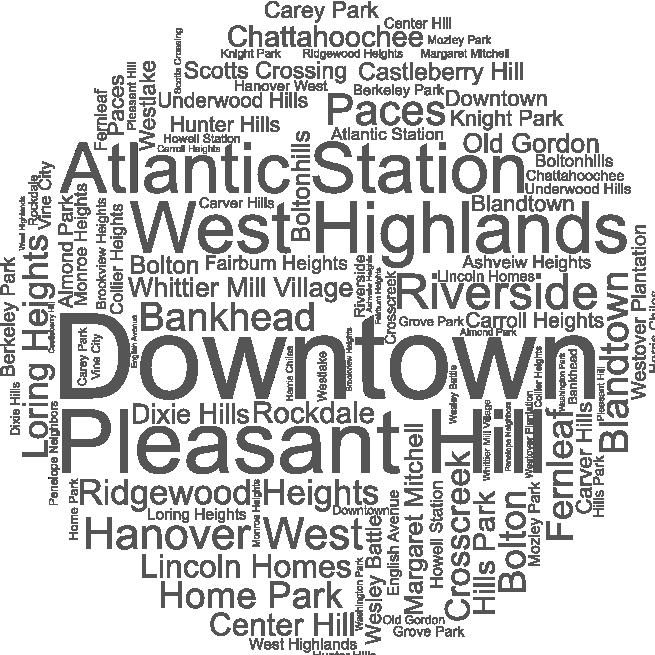
First Multiple Listing Service (FMLS) Area 22 includes Downtown and Atlanta’s westside neighborhoods. It includes Home Park, x Heights, Castleberry Hill, Blandtown, the portion of Buckhead that falls south of I-75 and numerous other neighborhoods. FMLS Area 22 is bound by the connector (I-75/85) to the east, the Chattahoochee River and I-285 to the west, I-75 to the north and I-20 to the south.
The following table shows activity for attached homes (condos and townhomes) in FMLS Area 22 from July, 1 2020 thru September, 30 2020.
Source: FMLS Absorption Analysis Report Trailing 3 Months from 9/30/20
The following table shows activity for detached homes (single family) in FMLS Area 22 from July, 1 2020 thru September, 30 2020.
Source: FMLS Absorption Analysis Report Trailing 3 Months from 9/30/20
The number of active condo listings in FMLS Area 22 increased 4% on a year-over-year basis from 581 in Q3 2019 to 602 in Q3 2020. The number of new condo listings in FMLS Area 22 increased 6% on a year-over-year basis from 234 in Q3 2019 to 247 in Q3 2020. The number of condo sales in FMLS Area 22 increased 12% on a year-over-year basis from 113 in Q3 2019 to 126 in Q3 2020. The months of inventory for condos in FMLS Area 22 decreased 4% on a year-over-year basis from 5.3 months in Q3 2019 to 5 months in Q3 2020.
MARKET ACTIVITY DASHBOARD | Q3 2020 vs Q3 2019
NUMBER OF ACTIVE LISTINGS +3.6%
NUMBER OF NEW LISTINGS +5.6%
NUMBER OF CLOSINGS +11.5% MONTHS OF INVENTORY -3.6%
SALE PRICE +1.1% SALES PRICE TO LIST PRICE RATIO +2.9%
SALE PRICE
MEDIAN CUMULATIVE DAYS ON MARKET -21.0%
The number of active condo listings in FMLS Area 22 increased 4% on a yearover-year basis from 581 in Q3 2019 to 602 in Q3 2020.
The number of new condo listings in FMLS Area 22 increased 6% on a yearover-year basis from 234 in Q3 2019 to 247 in Q3 2020.
The number of active townhome listings in FMLS Area 22 decreased 25% on a year-over-year basis from 275 in Q3 2020 to 207 in Q3 2020. The number of new townhome listings in FMLS Area 22 increased 2% on a year-over-year basis from 115 in Q3 2019 to 117 in Q3 2020. The number of townhome sales in FMLS Area 22 increased 62% on a year-over-year basis from 52 in Q3 2019 to 84 in Q3 2020. The months of inventory for townhomes in FMLS Area 22 decreased 53% on a year-over-year basis from 6 months in Q3 2019 to 3 months in Q3 2020.
MARKET ACTIVITY DASHBOARD | Q3 2020 vs Q3 2019
NUMBER OF ACTIVE LISTINGS
NUMBER OF CLOSINGS
NUMBER OF NEW LISTINGS
PRICE TO LIST PRICE RATIO +2.9% MEDIAN CUMULATIVE DAYS ON MARKET -24.7%
The number of active townhome listings in FMLS Area 22 decreased 25% on a year-over-year basis from 275 in Q3 2020 to 207 in Q3 2020.
The number of new townhome listings in FMLS Area 22 increased 2% on a year-over-year basis from 115 in Q3 2019 to 117 in Q3 2020.
The number of townhome sales in FMLS Area 22 increased 62% on a yearover-year basis from 52 in Q3 2019 to 84 in Q3 2020.
SUMMARY OF SINGLE-FAMILY DETACHED MARKET ACTIVITY
The number of active single-family listings in FMLS Area 22 decreased 4% on a year-over-year basis from 990 in Q3 2019 to 949 in Q3 2020. The number of new single-family home listings in FMLS Area 22 increased 2% on a yearover-year basis from 425 in Q3 2019 to 433 in Q3 2020. The number of single-family home sales in FMLS Area 22 increased 14% on a year-over-year basis from 230 in Q3 2019 to 263 in Q3 2020. The months of inventory for singlefamily homes in FMLS Area 22 decreased 16% on a year-over-year basis from 4 months in Q3 2019 to 3 months in Q3 2020.
MARKET ACTIVITY DASHBOARD | Q3 2020 vs Q3 2019
NUMBER OF ACTIVE LISTINGS
NUMBER OF CLOSINGS
PRICE
SALES PRICE TO LIST PRICE RATIO +4.0%
NUMBER OF NEW LISTINGS
MONTHS OF INVENTORY
AVERAGE SALE PRICE
MEDIAN CUMULATIVE DAYS ON MARKET -15.6%
The number of active single-family listings in FMLS Area 22 decreased 4% on a year-over-year basis from 990 in Q3 2019 to 949 in Q3 2020.
The number of new single-family home listings in FMLS Area 22 increased 2% on a year-over-year basis from 425 in Q3 2019 to 433 in Q3 2020.
The number of single-family home sales in FMLS Area 22 increased 14% on a year-over-year basis from 230 in Q3 2019 to 263 in Q3 2020.


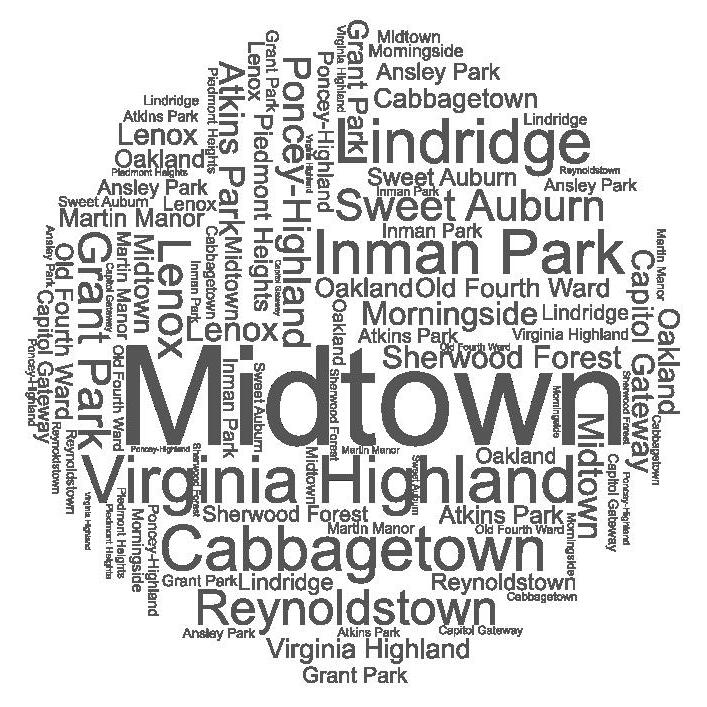
First Multiple Listing Service (FMLS) Area 23 is made up of Midtown and Atlanta’s eastside neighborhoods that fall within Fulton County. It includes Ansley Park, Morningside-Lenox Park, Virginia-Highland, Old Fourth Ward, Inman Park, Cabbagetown and numerous other neighborhoods. FMLS Area 23 is bound by the connector (I-75/85) to the west, the Fulton/DeKalb line to the east, I-85 to the north, and I-20 to the south.
The following table shows activity for attached homes (condos and townhomes) in FMLS Area 23 from July, 1 2020 thru September, 30 2020.
Source: FMLS Absorption Analysis Report Trailing 3 Months from 9/30/20
The following table shows activity for detached homes (single family) in FMLS Area 23 from July, 1 2020 thru September, 30 2020.
Source: FMLS Absorption Analysis Report Trailing 3 Months from 9/30/20
The number of active condo listings in FMLS Area 23 increased 47% on a year-over-year basis from 973 in Q3 2019 to 1433 in Q3 2020. The number of new condo listings in FMLS Area 23 increased 34% on a year-over-year basis from 507 in Q3 2019 to 677 in Q3 2020. The number of condo sales in FMLS Area 23 increased 4% on a year-overyear basis from 343 in Q3 2019 to 355 in Q3 2020. The months of inventory for condos in FMLS Area 23 increased 45% on a year-over-year basis from 3 months in Q3 2019 to 4 months in Q3 2020.
MARKET ACTIVITY DASHBOARD | Q3 2020 vs Q3 2019
NUMBER OF ACTIVE LISTINGS
NUMBER OF NEW LISTINGS
CUMULATIVE DAYS ON MARKET
The number of active condo listings in FMLS Area 23 increased 47% on a yearover-year basis from 973 in Q3 2019 to 1433 in Q3 2020.
The number of new condo listings in FMLS Area 23 increased 34% on a yearover-year basis from 507 in Q3 2019 to 677 in Q3 2020.
The number of active townhome listings in FMLS Area 23 decreased 1% on a year-over-year basis from 268 in Q3 2019 to 265 in Q3 2020. The number of new townhome listings in FMLS Area 23 increased 26% on a year-over-year basis from 104 in Q3 2019 to 131 in Q3 2020. The number of townhome sales in FMLS Area 23 increased 2% on a year-over-year basis from 71 in Q3 2019 to 72 in Q3 2020. The months of inventory for townhomes in FMLS Area 23 decreased 2% on a year-over-year basis from 3.9 months in Q3 2019 to 3.8 months in Q3 2020.
MARKET ACTIVITY DASHBOARD | Q3 2020 vs Q3 2019
NUMBER OF ACTIVE LISTINGS -1.1%
NUMBER OF NEW LISTINGS +26.0%
NUMBER OF CLOSINGS +1.4% MONTHS OF INVENTORY -2.3% MEDIAN SALE PRICE
AVERAGE SALE PRICE +3.8%
SALES PRICE TO LIST PRICE RATIO +0.8%
MEDIAN CUMULATIVE DAYS ON MARKET +26.6%
The number of active townhome listings in FMLS Area 23 decreased 1% on a year-over-year basis from 268 in Q3 2019 to 265 in Q3 2020.
The number of new townhome listings in FMLS Area 23 increased 26% on a year-over-year basis from 104 in Q3 2019 to 131 in Q3 2020.
The number of townhome sales in FMLS Area 23 increased 2% on a yearover-year basis from 71 in Q3 2019 to 72 in Q3 2020
SUMMARY OF SINGLE-FAMILY DETACHED MARKET ACTIVITY
The number of active single-family listings in FMLS Area 23 decreased 88% on a year-over-year basis from 627 in Q3 2019 to 75 in Q3 2020. The number of new single-family home listings in FMLS Area 23 increased 18% on a year-overyear basis from 243 in Q3 2020 to 286 in Q3 2020. The number of single-family home sales in FMLS Area 23 increased 25% on a year-over-year basis from 150 in Q3 2019 to 187 in Q3 2020. The months of inventory for single-family homes in FMLS Area 23 decreased 90% on a year-over-year basis from 4 months in Q3 2019 to .4 months in Q3 2020.
MARKET ACTIVITY DASHBOARD | Q3 2020 vs Q3 2019
NUMBER OF ACTIVE LISTINGS
NUMBER OF CLOSINGS
NUMBER OF NEW LISTINGS
MONTHS OF INVENTORY
PRICE
AVERAGE SALE PRICE +3.9% SALES PRICE TO LIST PRICE RATIO +2.0%
MEDIAN CUMULATIVE DAYS ON MARKET -3.8%
The number of active single-family listings in FMLS Area 23 decreased 88% on a year-over-year basis from 627 in Q3 2019 to 75 in Q3 2020.
The number of new single-family home listings in FMLS Area 23 increased 18% on a year-over-year basis from 243 in Q3 2020 to 286 in Q3 2020.
The number of single-family home sales in FMLS Area 23 increased 25% on a year-over-year basis from 150 in Q3 2019 to 187 in Q3 2020.

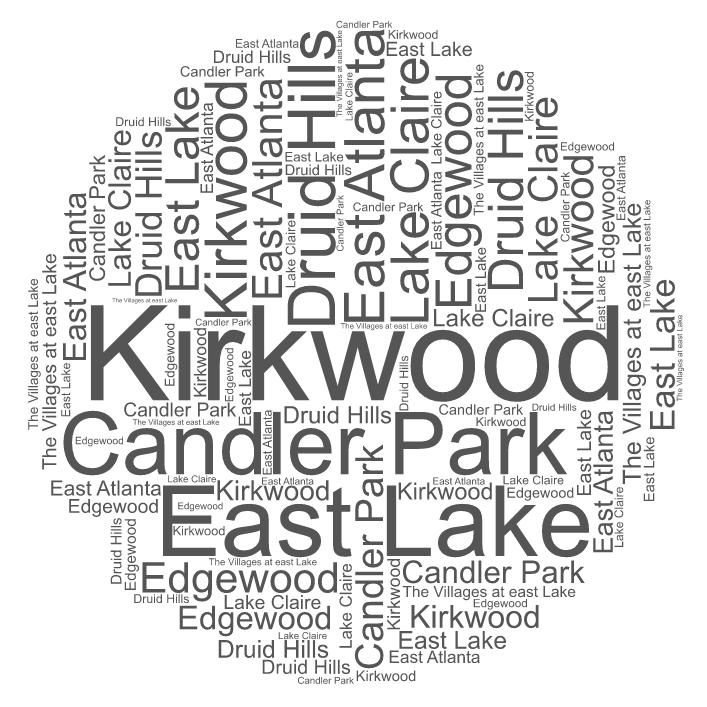
First Multiple Listing Service (FMLS) Area 24 includes Atlanta’s eastside neighborhoods that fall within DeKalb County. It includes Druid Hills, Candler Park, Lake Claire, Edgewood, Kirkwood, East Atlanta and several other neighborhoods. FMLS Area 24 is bound by the Fulton/DeKalb line to the west, and the City of Atlanta bounds to the east, north and south.
The following table shows activity for attached homes (condos and townhomes) in FMLS Area 24 from July, 1 2020 thru September, 30 2020.
Source: FMLS Absorption Analysis Report Trailing 3 Months from 9/30/20
The following table shows activity for detached homes (single family) in FMLS Area 24 from July, 1 2020 thru September, 30 2020.
Source: FMLS Absorption Analysis Report Trailing 3 Months from 9/30/20
The number of active condo listings in FMLS Area 24 decreased 13% on a year-over-year basis from 92 in Q3 2019 to 80 in Q3 2020. The number of new condo listings in FMLS Area 24 increased 10% on a year-over-year basis from 61 in Q3 2019 to 67 in Q3 2020. The number of condo sales in FMLS Area 24 decreased 22% on a year-over-year basis from 42 in Q3 2019 to 33 in Q3 2020. The months of inventory for condos in FMLS Area 24 increased 23% on a year-over-year basis from 2.2 months in Q3 2019 to 2.7 months in Q3 2020.
MARKET ACTIVITY DASHBOARD | Q3 2020 vs Q3 2019
NUMBER OF ACTIVE LISTINGS -13.0%
NUMBER OF NEW LISTINGS
NUMBER OF CLOSINGS
PRICE TO LIST PRICE RATIO
MEDIAN CUMULATIVE DAYS ON MARKET -31.0%
The number of active condo listings in FMLS Area 24 decreased 13% on a year-over-year basis from 92 in Q3 2019 to 80 in Q3 2020.
The number of new condo listings in FMLS Area 24 increased 10% on a yearover-year basis from 61 in Q3 2019 to 67 in Q3 2020.
The number of condo sales in FMLS Area 24 decreased 22% on a year-overyear basis from 42 in Q3 2019 to 33 in Q3 2020.
The number of active townhome listings in FMLS Area 24 decreased 10% on a year-over-year basis from 205 in Q3 2019 to 184 in Q3 2020. The number of new townhome listings in FMLS Area 24 increased 14% on a year-over-year basis from 77 in Q3 2019 to 88 in Q3 2020. The number of townhome sales in FMLS Area 24 decreased 5% on a year-over-year basis from 43 in Q3 2019 to 41 in Q3 2020. The months of inventory for townhomes in FMLS Area 24 decreased 4% on a year-over-year basis from 4.8 months in Q3 2019 to 4.6 months in Q3 2020.
MARKET ACTIVITY DASHBOARD | Q3 2020 vs Q3 2019
NUMBER OF ACTIVE LISTINGS -10.2%
NUMBER OF NEW LISTINGS +14.3%
NUMBER OF CLOSINGS -4.7% MONTHS OF INVENTORY -3.7% MEDIAN SALE PRICE +6.0% AVERAGE SALE PRICE +1.3%
SALES PRICE TO LIST PRICE RATIO -0.7%
MEDIAN CUMULATIVE DAYS ON MARKET +22.3%
The number of active townhome listings in FMLS Area 24 decreased 10% on a year-over-year basis from 205 in Q3 2019 to 184 in Q3 2020.
The number of new townhome listings in FMLS Area 24 increased 14% on a year-over-year basis from 77 in Q3 2019 to 88 in Q3 2020.
The number of townhome sales in FMLS Area 24 decreased 5% on a yearover-year basis from 43 in Q3 2019 to 41 in Q3 2020.
SUMMARY OF SINGLE-FAMILY DETACHED MARKET ACTIVITY
The number of active single-family listings in FMLS Area 24 decreased 42% on a year-over-year basis from 631 in Q3 2019 to 366 in Q3 2020. The number of new single-family home listings in FMLS Area 24 decreased 12% on a year-over-year basis from 297 in Q3 2019 to 263 in Q3 2020. The number of single-family home sales in FMLS Area 24 increased 9% on a year-over-year basis from 191 in Q3 2019 to 207 in Q3 2020. The months of inventory for single-family homes in FMLS Area 24 decreased 46% on a year-over-year basis from 3.3 months in Q3 2019 to 1.8 months in Q3 2020.
ACTIVITY DASHBOARD | Q3 2020 vs Q3 2019
NUMBER OF ACTIVE LISTINGS
NUMBER OF CLOSINGS
NUMBER OF NEW LISTINGS
MONTHS OF INVENTORY -46.3% MEDIAN SALE PRICE
AVERAGE SALE PRICE +14.9% SALES PRICE TO LIST PRICE RATIO +4.5%
MEDIAN CUMULATIVE DAYS ON MARKET -70.0%
The number of active single-family listings in FMLS Area 24 decreased 42% on a year-over-year basis from 631 in Q3 2019 to 366 in Q3 2020.
The number of new single-family home listings in FMLS Area 24 decreased 12% on a year-over-year basis from 297 in Q3 2019 to 263 in Q3 2020.
The number of single-family home sales in FMLS Area 24 increased 9% on a year-over-year basis from 191 in Q3 2019 to 207 in Q3 2020.


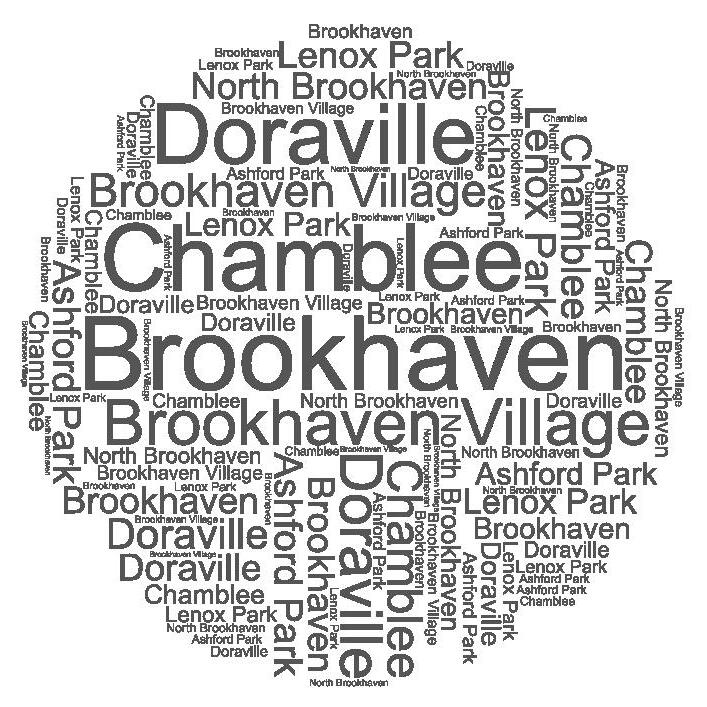
First Multiple Listing Service (FMLS) Area 51 encompasses the DeKalb County municipalities of Brookhaven, Chamblee and Doraville. It includes Ashford Park, North Brookhaven, Keswick Forest and numerous other neighborhoods. FMLS Area 51 is bound by the Fulton/DeKalb line to the west, I-85 to the east and south, and I-285 to the north.
The following table shows activity for attached homes (condos and townhomes) in FMLS Area 51 from July, 1 2020 thru September, 30 2020.
Source: FMLS Absorption Analysis Report Trailing 3 Months from 9/30/20
The following table shows activity for detached homes (single family) in FMLS Area 51 from July, 1 2020 thru September, 30 2020.
Source: FMLS Absorption Analysis Report Trailing 3 Months from 9/30/20
The number of active condo listings in FMLS Area 51 decreased 43% on a year-over-year basis from 164 in Q3 2019 to 94 in Q3 2020. The number of new condo listings in FMLS Area 51 increased 25% on a year-over-year basis from 81 in Q3 2019 to 101 in Q3 2020. The number of condo sales in FMLS Area 51 increased 50% on a year-over-year basis from 40 in Q3 2019 to 60 in Q3 2020. The months of inventory for condos in FMLS Area 51 decreased 62% on a year-over-year basis from 4.1 months in Q3 2019 to 1.6 months in Q3 2020.
MARKET ACTIVITY DASHBOARD | Q3 2020 vs Q3 2019
NUMBER OF ACTIVE LISTINGS
NUMBER OF NEW LISTINGS
PRICE TO LIST PRICE RATIO +2.1%
CUMULATIVE DAYS ON MARKET +25.3%
The number of active condo listings in FMLS Area 51 decreased 43% on a year-over-year basis from 164 in Q3 2019 to 94 in Q3 2020.
The number of new condo listings in FMLS Area 51 increased 25% on a yearover-year basis from 81 in Q3 2019 to 101 in Q3 2020.
number of condo sales in FMLS Area 51 increased 50% on a year-overyear basis from 40 in Q3 2019 to 60 in Q3 2020.
The number of active townhome listings in FMLS Area 51 decreased 24% on a year-over-year basis from 460 in Q3 2019 to 348 in Q3 2020. The number of new townhome listings in FMLS Area 51 decreased 18% on a year-over-year basis from 177 in Q3 2019 to 146 in Q3 2020. The number of townhome sales in FMLS Area 51 increased 48% on a year-over-year basis from 84 in Q3 2019 to 124 in Q3 2020. The months of inventory for townhomes in FMLS Area 51 decreased 49% on a year-over-year basis from 5.7 months in Q3 2019 to 2.9 months in Q3 2020.
MARKET ACTIVITY DASHBOARD | Q3 2020 vs Q3 2019
NUMBER OF ACTIVE LISTINGS -24.3%
NUMBER OF CLOSINGS
NUMBER OF NEW LISTINGS -17.5%
MONTHS OF INVENTORY -48.5%
SALE PRICE
AVERAGE SALE PRICE -1.5% SALES PRICE TO LIST PRICE RATIO +1.3%
MEDIAN CUMULATIVE DAYS ON MARKET -23.7%
The number of active townhome listings in FMLS Area 51 decreased 24% on a year-over-year basis from 460 in Q3 2019 to 348 in Q3 2020.
The number of new townhome listings in FMLS Area 51 decreased 18% on a year-over-year basis from 177 in Q3 2019 to 146 in Q3 2020.
number of townhome sales in FMLS Area 51 increased 48% on a yearover-year basis from 84 in Q3 2019 to 124 in Q3 2020.
SUMMARY OF SINGLE-FAMILY DETACHED MARKET ACTIVITY
The number of active single-family listings in FMLS Area 51 decreased 18% on a year-over-year basis from 705 in Q3 2019 to 578 in Q3 2020. The number of new single-family home listings in FMLS Area 51 increased 18% on a year-over-year basis from 293 in Q3 2019 to 346 in Q3 2020. The number of single-family home sales in FMLS Area 51 increased 8% on a year-over-year basis from 225 in Q3 2019 to 244 in Q3 2020. The months of inventory for single-family homes in FMLS Area 51 decreased 26% on a year-over-year basis from 3.3 months in Q3 2019 to 2.4 months in Q3 2020.
ACTIVITY DASHBOARD | Q3 2020 vs Q3 2019
NUMBER OF ACTIVE LISTINGS
NUMBER OF NEW LISTINGS
MONTHS OF INVENTORY
AVERAGE SALE PRICE
SALES PRICE TO LIST PRICE RATIO +2.5%
MEDIAN CUMULATIVE DAYS ON MARKET -41.8%
The number of active single-family listings in FMLS Area 51 decreased 18% on a year-over-year basis from 705 in Q3 2019 to 578 in Q3 2020.
The number of new single-family home listings in FMLS Area 51 increased 18% on a year-over-year basis from 293 in Q3 2019 to 346 in Q3 2020.
The number of single-family home sales in FMLS Area 51 increased 8% on a year-over-year basis from 225 in Q3 2019 to 244 in Q3 2020.


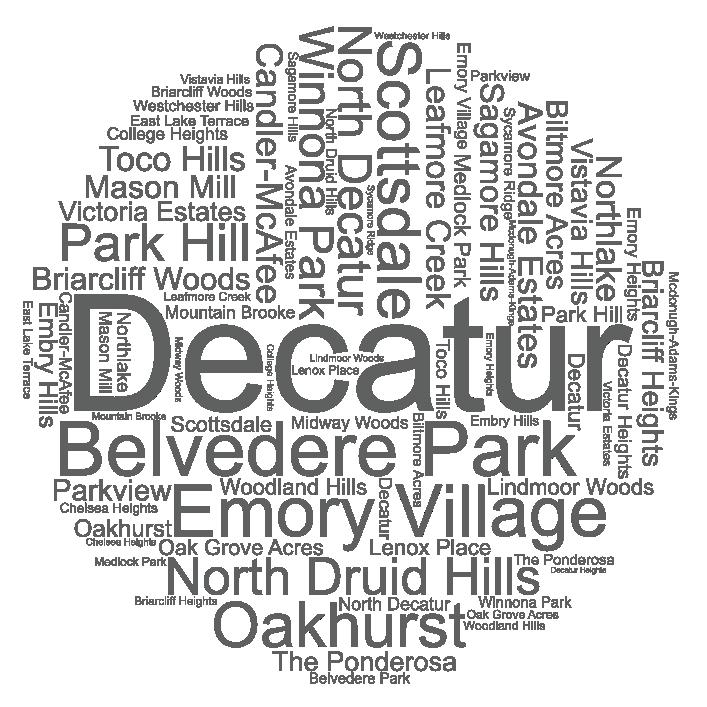
First Multiple Listing Service (FMLS) Area 52 includes the DeKalb County municipalities of Decatur and Avondale Estates, as well as portions of unincorporated DeKalb County. It includes and numerous other neighborhoods. FMLS Area 52 is bound by I-285 to the east, the City of Atlanta line to the west, I-85 to the north, and I-20 to the south.
The following table shows activity for attached homes (condos and townhomes) in FMLS Area 52 from July, 1 2020 thru September, 30 2020.
Source: FMLS Absorption Analysis Report Trailing 3 Months from 9/30/20
The following table shows activity for detached homes (single family) in FMLS Area 52 from July, 1 2020 thru September, 30 2020.
Source: FMLS Absorption Analysis Report Trailing 3 Months from 9/30/20
The number of active condo listings in FMLS Area 52 increased 13% on a year-over-year basis from 243 in Q3 2019 to 274 in Q3 2020. The number of new condo listings in FMLS Area 52 increased 4% on a year-over-year basis from 114 in Q3 2019 to 119 in Q3 2020. The number of condo sales in FMLS Area 52 Increased 30% on a year-over-year basis from 76 in Q3 2019 to 99 in Q3 2020. The months of inventory for condos in FMLS Area 52 decreased 15% on a year-over-year basis from 3.3 months in Q3 2019 to 2.8 months in Q3 2020.
MARKET ACTIVITY DASHBOARD | Q3 2020 vs Q3 2019
NUMBER OF ACTIVE LISTINGS +12.8%
NUMBER OF NEW LISTINGS
PRICE TO LIST PRICE RATIO +1.2% MEDIAN CUMULATIVE DAYS ON MARKET +64.3%
The number of active condo listings in FMLS Area 52 increased 13% on a yearover-year basis from 243 in Q3 2019 to 274 in Q3 2020.
The number of new condo listings in FMLS Area 52 increased 4% on a yearover-year basis from 114 in Q3 2019 to 119 in Q3 2020.
The number of active townhome listings in FMLS Area 52 decreased 22% on a year-over-year basis from 360 in Q3 2019 to 282 in Q3 2020. The number of new townhome listings in FMLS Area 52 decreased 19% on a year-over-year basis from 167 in Q3 2020 to 136 in Q3 2020. The number of townhome sales in FMLS Area 52 increased 22% on a year-over-year basis from 83 in Q3 2019 to 101 in Q3 2020. The months of inventory for townhomes in FMLS Area 52 decreased 36% on a year-over-year basis from 4.4 months in Q3 2019 to 2.8 months in Q3 2020.
MARKET ACTIVITY DASHBOARD | Q3 2020 vs Q3 2019
NUMBER OF ACTIVE LISTINGS
NUMBER OF CLOSINGS
NUMBER OF NEW LISTINGS
SALES PRICE TO LIST PRICE RATIO +0.7% MEDIAN CUMULATIVE DAYS ON MARKET +308.7%
The number of active townhome listings in FMLS Area 52 decreased 22% on a year-over-year basis from 360 in Q3 2019 to 282 in Q3 2020.
The number of new townhome listings in FMLS Area 52 decreased 19% on a year-over-year basis from 167 in Q3 2020 to 136 in Q3 2020.
The number of townhome sales in FMLS Area 52 increased 22% on a yearover-year basis from 83 in Q3 2019 to 101 in Q3 2020.
SUMMARY OF SINGLE-FAMILY DETACHED MARKET ACTIVITY
The number of active single-family listings in FMLS Area 52 decreased 30% on a year-over-year basis from 2262 in Q3 2019 to 1584 in Q3 2020. The number of new single-family home listings in FMLS Area 52 decreased 16% on a year-over-year basis from 974 in Q3 2019 to 818 in Q3 2020. The number of single-family home sales in FMLS Area 52 increased 19% on a year-over-year basis from 548 in Q3 2019 to 653 in Q3 2020. The months of inventory for single-family homes in FMLS Area 52 decreased 42% on a year-over-year basis from 4.2 months in Q3 2019 to 2.4 months in Q3 2020.
ACTIVITY DASHBOARD | Q3 2020 vs Q3 2019
NUMBER OF ACTIVE LISTINGS
PRICE TO LIST PRICE RATIO
MEDIAN CUMULATIVE DAYS ON MARKET -14.1%
The number of active single-family listings in FMLS Area 52 decreased 30% on a year-over-year basis from 2262 in Q3 2019 to 1584 in Q3 2020.
The number of new single-family home listings in FMLS Area 52 decreased 16% on a year-over-year basis from 974 in Q3 2019 to 818 in Q3 2020.
The number of single-family home sales in FMLS Area 52 increased 19% on a year-over-year basis from 548 in Q3 2019 to 653 in Q3 2020.
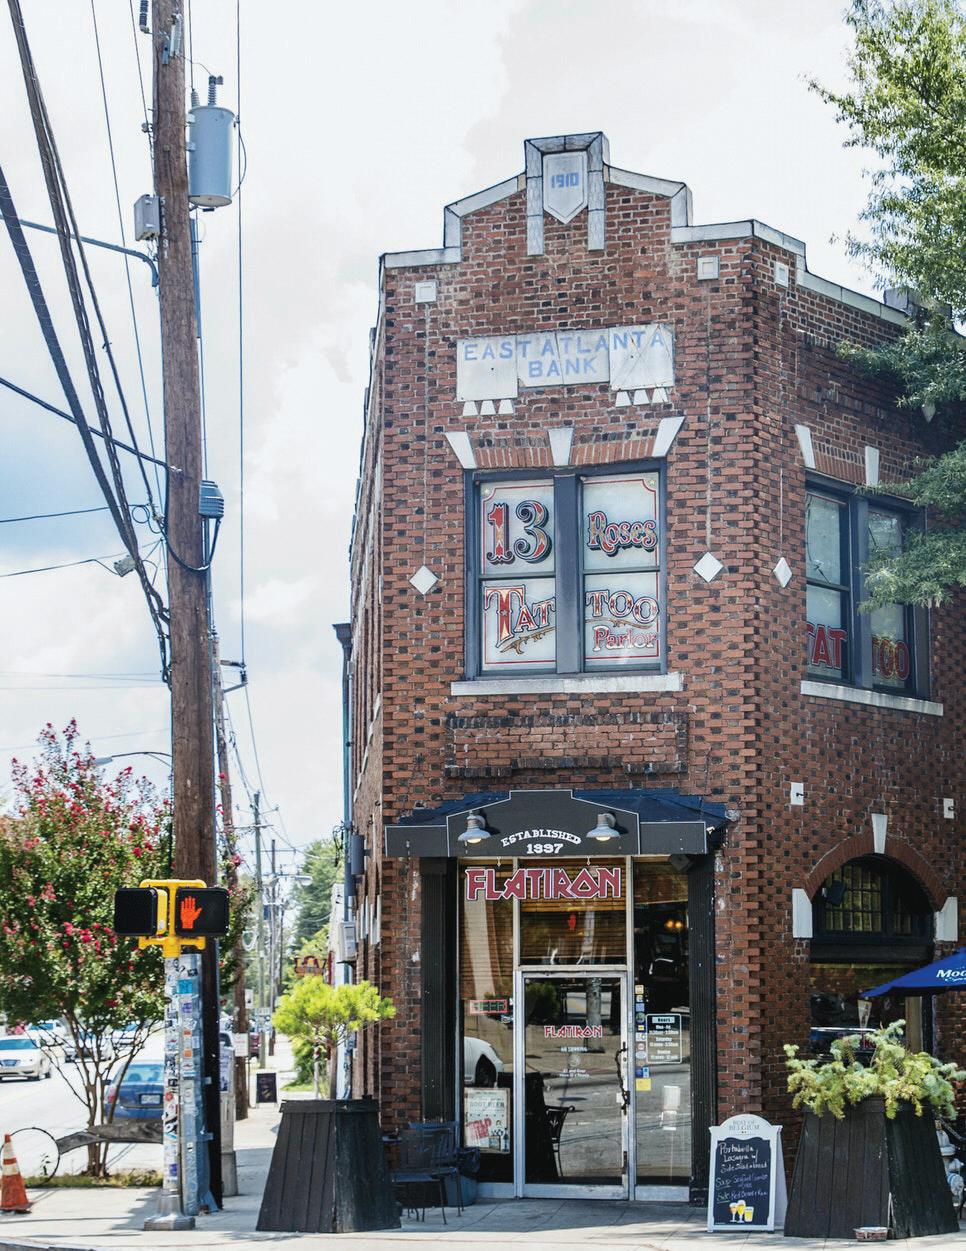

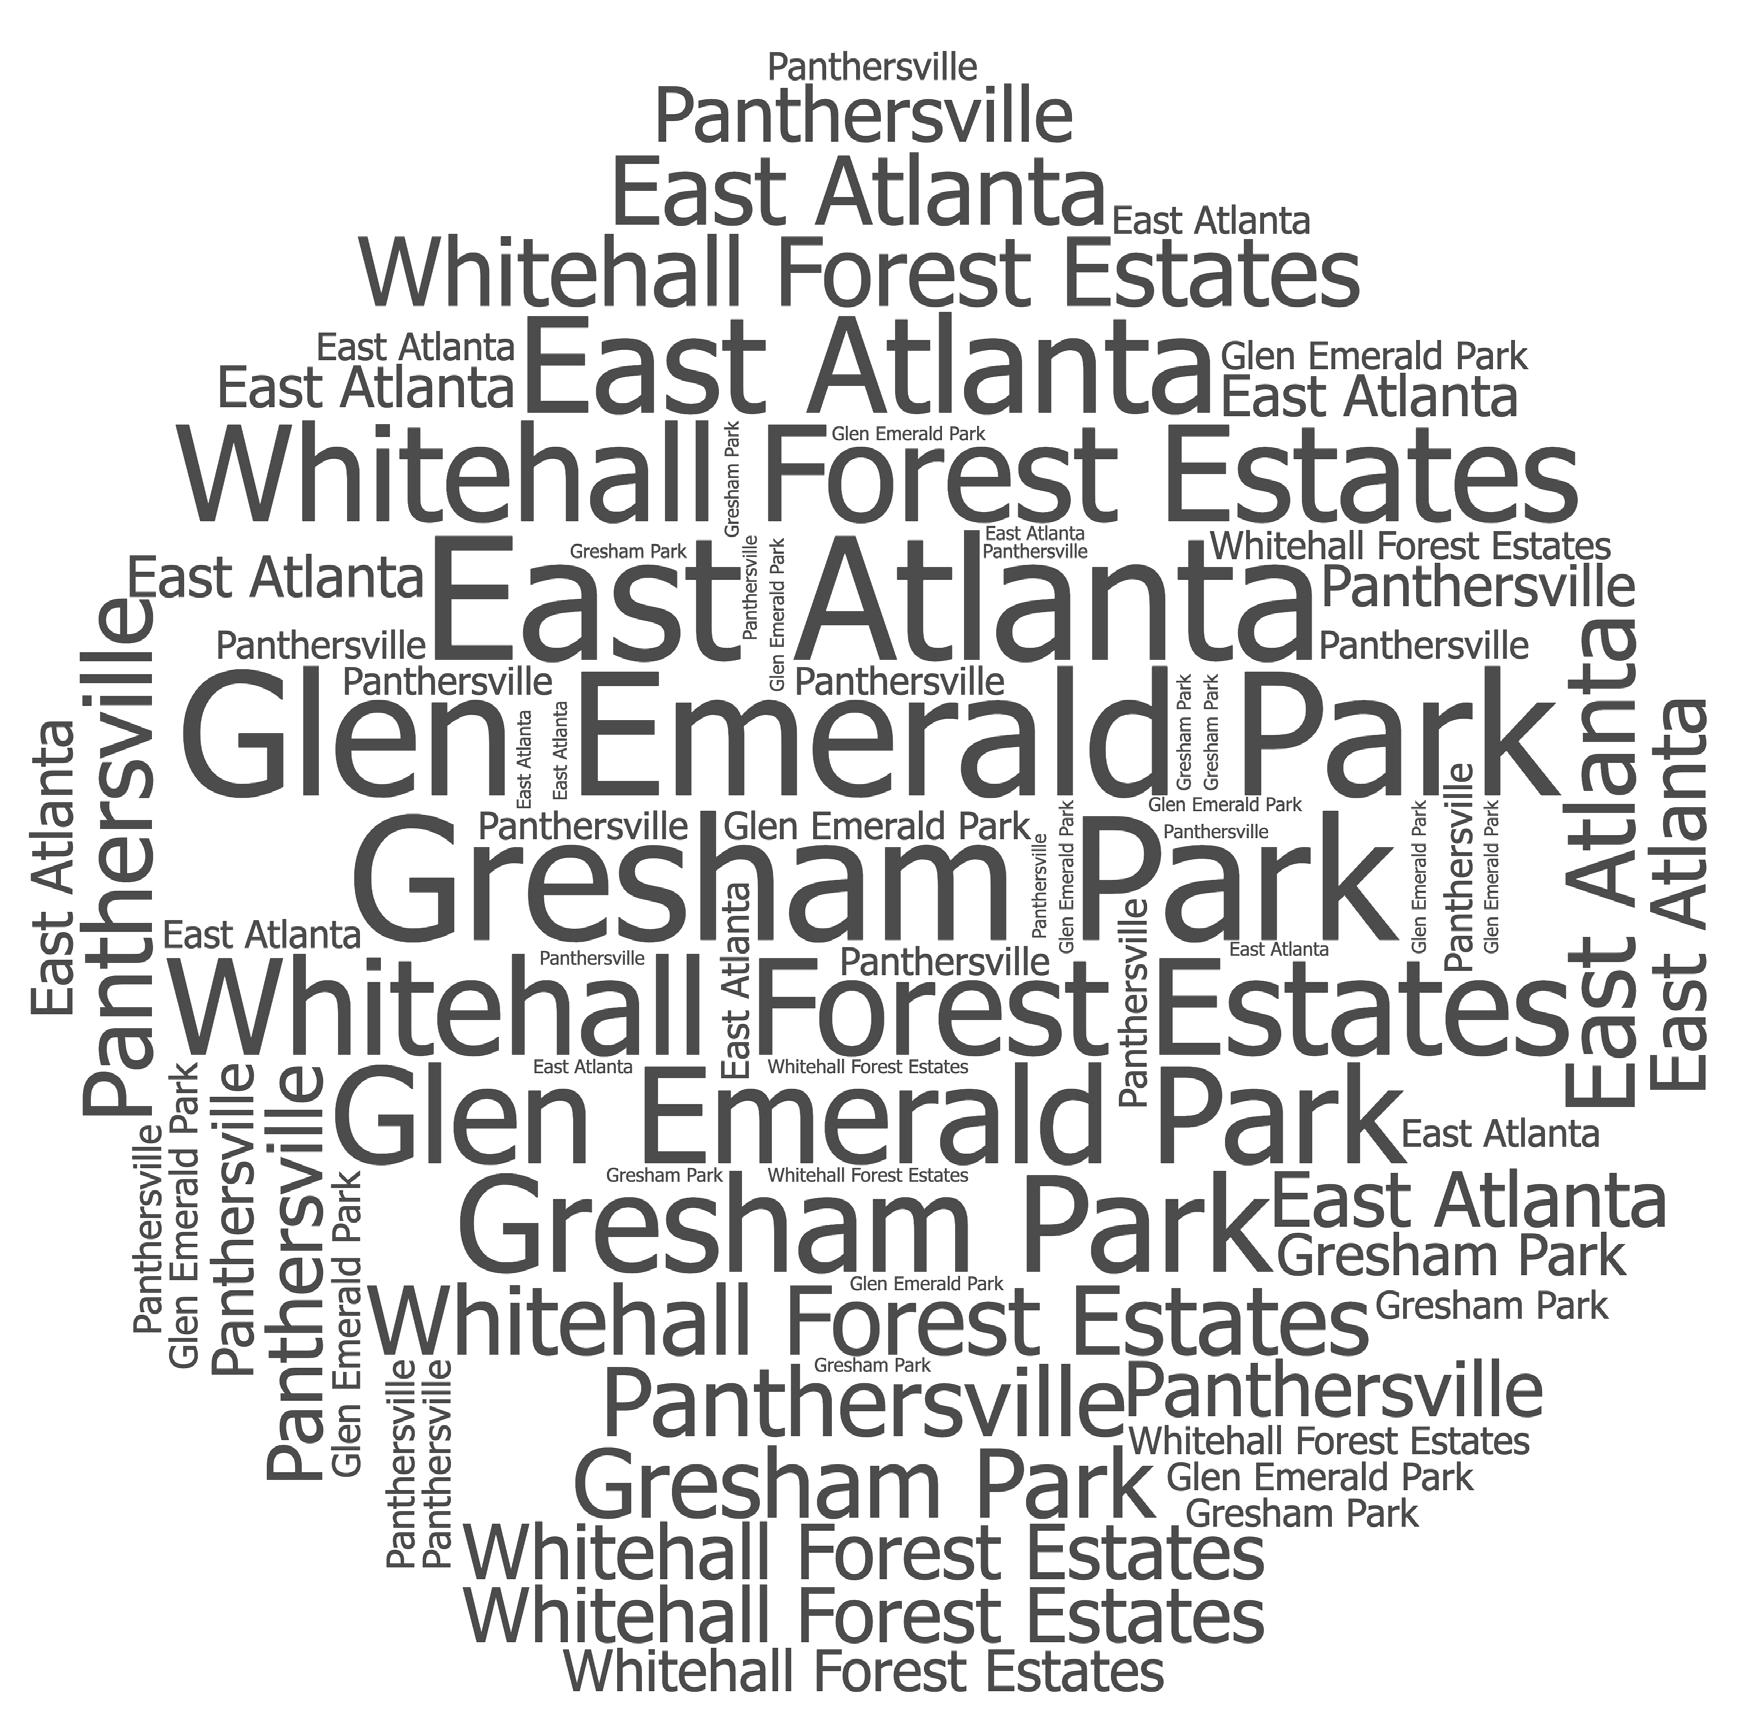
First Multiple Listing Service (FMLS) Area 53 is situated in the East Atlanta region, within the I-285 perimeter. It includes Gresham Park, Whitehall Forest Estates, East Atlanta, and several other neighborhoods. FMLS Area 53 is bordered by the Fulton/Dekalb county line, I-285 and I-20.
The following table shows activity for attached homes (condos and townhomes) in FMLS Area 53 from July, 1 2020 thru September, 30 2020.
Source: FMLS Absorption Analysis Report Trailing 3 Months from 9/30/20
The following table shows activity for detached homes (single family) in FMLS Area 53 from July, 1 2020 thru September, 30 2020.
Source: FMLS Absorption Analysis Report Trailing 3 Months from 9/30/20
The number of active condo listings in FMLS Area 53 decreased 20% on a year-over-year basis from 10 in Q3 2019 to 8 in Q3 2020. The number of new condo listings in FMLS Area 53 increased 20% on a year-over-year basis from 5 in Q3 2019 to 6 in Q3 2020. The number of condo sales in FMLS Area 53 remained the same on a year-over-year basis from 4 in Q3 2019 to 4 in Q3 2020. The months of inventory for condos in FMLS Area 53 decreased 53% on a year-over-year basis from 2.8 months in Q3 2019 to 1.3 months in Q3 2020.
MARKET ACTIVITY DASHBOARD | Q3 2020 vs Q3 2019
NUMBER OF ACTIVE LISTINGS
NUMBER OF NEW LISTINGS
PRICE TO LIST PRICE RATIO
CUMULATIVE DAYS ON MARKET -70.7%
The number of active condo listings in FMLS Area 53 decreased 20% on a year-over-year basis from 10 in Q3 2019 to 8 in Q3 2020.
The number of new condo listings in FMLS Area 53 increased 20% on a yearover-year basis from 5 in Q3 2019 to 6 in Q3 2020.
from 4 in Q3 2019 to 4 in Q3 2020.
The number of active townhome listings in FMLS Area 53 increased 143% on a year-over-year basis from 21 in Q3 2019 to 51 in Q3 2020. The number of new townhome listings in FMLS Area 53 increased 150% on a year-over-year basis from 6 in Q3 2019 to 15 in Q3 2020. The number of townhome sales in FMLS Area 53 increased 14% on a year-over-year basis from 7 in Q3 2019 to 8 in Q3 2020. The months of inventory for townhomes in FMLS Area 53 increased 232% on a year-over-year basis from 3.1 months in Q3 2019 to 10.3 months in Q3 2020.
MARKET ACTIVITY DASHBOARD | Q3 2020 vs Q3 2019
NUMBER OF ACTIVE LISTINGS
number of active townhome listings in FMLS Area 53 increased 143% on a year-over-year basis from 21 in Q3 2019 to 51 in Q3 2020.
number of new
listings in FMLS Area 53 increased 150% on a year-over-year basis from 6 in Q3 2019 to 15 in Q3 2020.
SUMMARY OF SINGLE-FAMILY DETACHED MARKET ACTIVITY
The number of active single-family listings in FMLS Area 53 decreased 41% on a year-over-year basis from 311 in Q3 2019 to 185 in Q3 2020. The number of new single-family home listings in FMLS Area 53 decreased 30% on a year-over-year basis from 140 in Q3 2019 to 98 in Q3 2020. The number of single-family home sales in FMLS Area 53 increased 10% on a year-over-year basis from 78 in Q3 2019 to 86 in Q3 2020. The months of inventory for singlefamily homes in FMLS Area 53 decreased 45% on a year-over-year basis from 4.1 months in Q3 2019 to 2.3 months in Q3 2020.
ACTIVITY DASHBOARD | Q3 2020 vs Q3 2019
NUMBER OF ACTIVE LISTINGS
NUMBER OF CLOSINGS
NUMBER OF NEW LISTINGS
MONTHS OF INVENTORY -44.9% MEDIAN SALE PRICE
AVERAGE SALE PRICE -22.3% SALES PRICE TO LIST PRICE RATIO +2.6%
MEDIAN CUMULATIVE DAYS ON MARKET -33.1%
The number of active single-family listings in FMLS Area 53 decreased 41% on a year-over-year basis from 311 in Q3 2019 to 185 in Q3 2020.
The number of new single-family home listings in FMLS Area 53 decreased 30% on a year-over-year basis from 140 in Q3 2019 to 98 in Q3 2020.
The number of single-family home sales in FMLS Area 53 increased 10% on a year-over-year basis from 78 in Q3 2019 to 86 in Q3 2020.


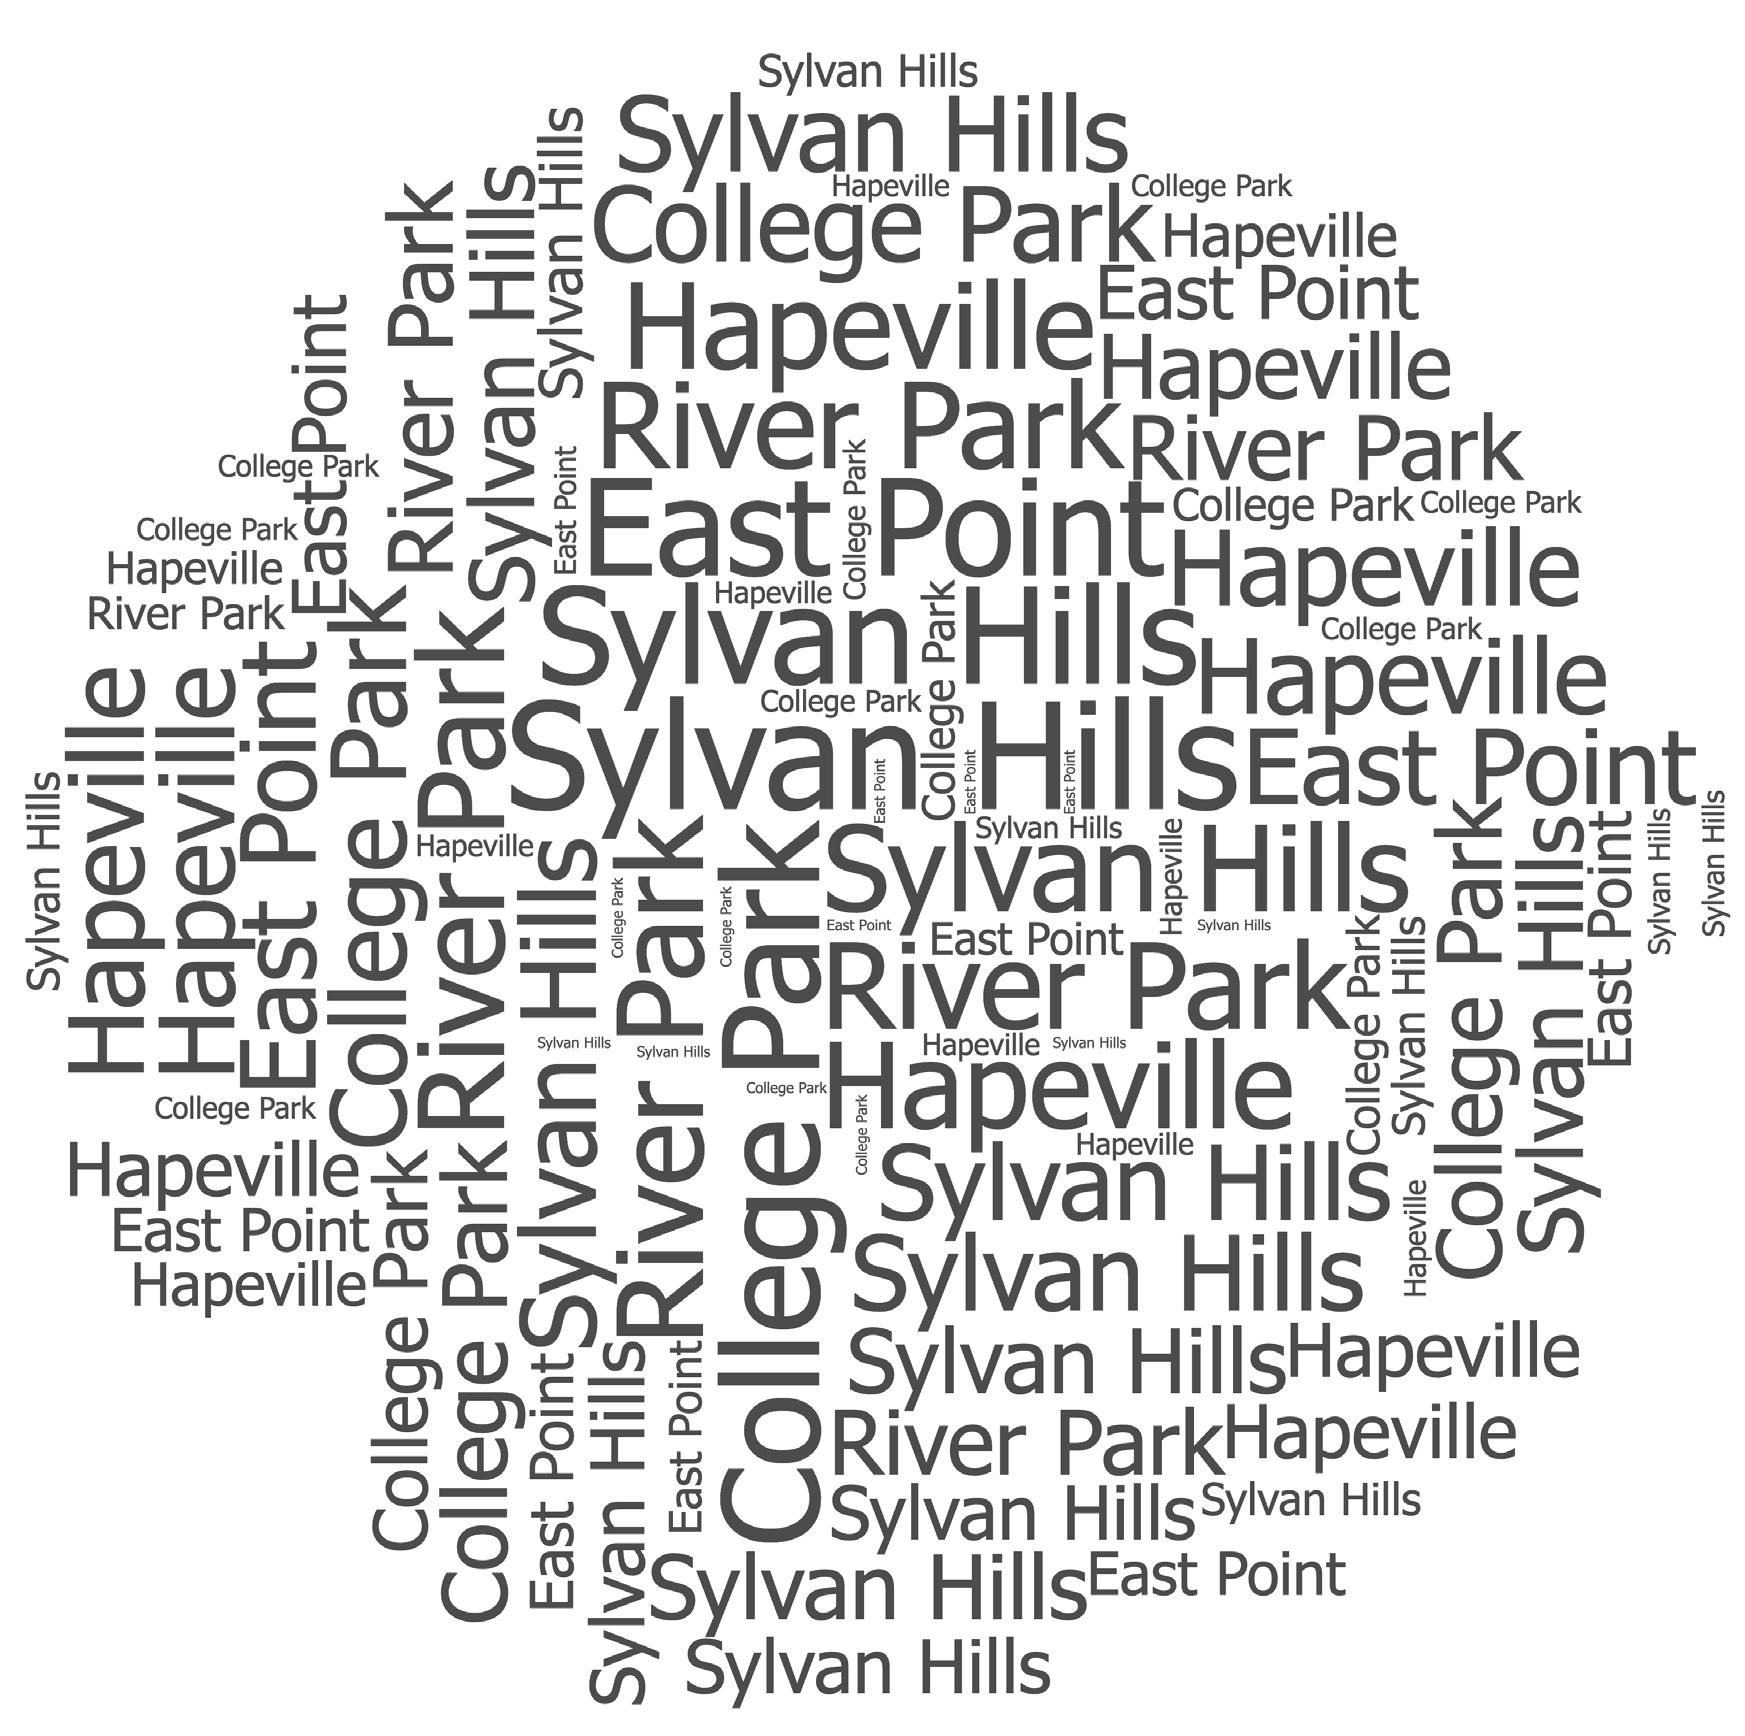
First Multiple Listing Service (FMLS) Area 31 includes the southwestern portion of Atlanta. It includes Sylvan Hills, Cascade Road, East Point, and several other neighborhoods. FMLS Area 31 is in South Fulton County and is bordered by Douglas, Carroll, and Coweta counties.
The following table shows activity for attached homes (condos and townhomes) in FMLS Area 31 from July, 1 2020 thru September, 30 2020.
Source: FMLS Absorption Analysis Report Trailing 3 Months from 9/30/20
The following table shows activity for detached homes (single family) in FMLS Area 31 from July, 1 2020 thru September, 30 2020.
Source: FMLS Absorption Analysis Report Trailing 3 Months from 9/30/20
The number of active condo listings in FMLS Area 31 decreased 37% on a year-over-year basis from 75 in Q3 2019 to 47 in Q3 2020. The number of new condo listings in FMLS Area 31 decreased 63% on a year-over-year basis from 38 in Q3 2019 to 14 in Q3 2020. The number of condo sales in FMLS Area 31 increased 160% on a year-over-year basis from 5 in Q3 2019 to 13 in Q3 2020. The months of inventory for condos in FMLS Area 31 decreased 52% on a year-over-year basis from 9.6 months in Q3 2019 to 4.6months in Q3 2020.
MARKET ACTIVITY DASHBOARD | Q3 2020 vs Q3 2019
NUMBER OF ACTIVE LISTINGS
CUMULATIVE DAYS ON MARKET
The number of active condo listings in FMLS Area 31 decreased 37% on a year-over-year basis from 75 in Q3 2019 to 47 in Q3 2020.
The number of new condo listings in FMLS Area 31 decreased 63% on a year-over-year basis from 38 in Q3 2019 to 14 in Q3 2020.
The number of condo sales in FMLS Area 31 increased 160% on a year-overyear basis from 5 in Q3 2019 to 13 in Q3 2020
The number of active townhome listings in FMLS Area 31 decreased 8% on a year-over-year basis from 134 in Q3 2019 to 123 in Q3 2020. The number of new townhome listings in FMLS Area 31 increased 48% on a year-over-year basis from 57 in Q3 2019 to 84 in Q3 2020. The number of townhome sales in FMLS Area 31 increased 44% on a year-over-year basis from 46 in Q3 2019 to 66 in Q3 2020. The months of inventory for townhomes in FMLS Area 31 decreased 35% on a year-over-year basis from 3.4 months in Q3 2019 to 2.2 months in Q3 2020.
MARKET ACTIVITY DASHBOARD | Q3 2020 vs Q3 2019
NUMBER OF ACTIVE LISTINGS
NUMBER OF CLOSINGS
NUMBER OF NEW LISTINGS
MONTHS OF INVENTORY
SALES PRICE TO LIST PRICE RATIO +2.9% MEDIAN CUMULATIVE DAYS ON MARKET +5.3%
The number of active townhome listings in FMLS Area 31 decreased 8% on a year-over-year basis from 134 in Q3 2019 to 123 in Q3 2020.
The number of new townhome listings in FMLS Area 31 increased 48% on a year-over-year basis from 57 in Q3 2019 to 84 in Q3 2020.
The number of townhome sales in FMLS Area 31 increased 44% on a yearover-year basis from 46 in Q3 2019 to 66 in Q3 2020.
The number of active single-family listings in FMLS Area 31 decreased 33% on a year-over-year basis from 2070 in Q3 2019 to 1385 in Q3 2020. The number of new single-family home listings in FMLS Area 31 decreased 22% on a year-over-year basis from 950 in Q3 2019 to 740 in Q3 2020. The number of single-family home sales in FMLS Area 31 increased 9% on a year-over-year basis from 551 in Q3 2019 to 602 in Q3 2020. The months of inventory for single-family homes in FMLS Area 31 decreased 39% on a year-over-year basis from 3.8 months in Q3 2019 to 2.3 months in Q3 2020.
NUMBER OF ACTIVE LISTINGS
NUMBER OF NEW LISTINGS
AVERAGE SALE PRICE
SALES PRICE TO LIST PRICE RATIO +1.1%
MEDIAN CUMULATIVE DAYS ON MARKET -16.8%
The number of active single-family listings in FMLS Area 31 decreased 33% on a year-over-year basis from 2070 in Q3 2019 to 1385 in Q3 2020.
The number of new single-family home listings in FMLS Area 31 decreased 22% on a year-over-year basis from 950 in Q3 2019 to 740 in Q3 2020.
The number of single-family home sales in FMLS Area 31 increased 9% on a year-over-year basis from 551 in Q3 2019 to 602 in Q3 2020.
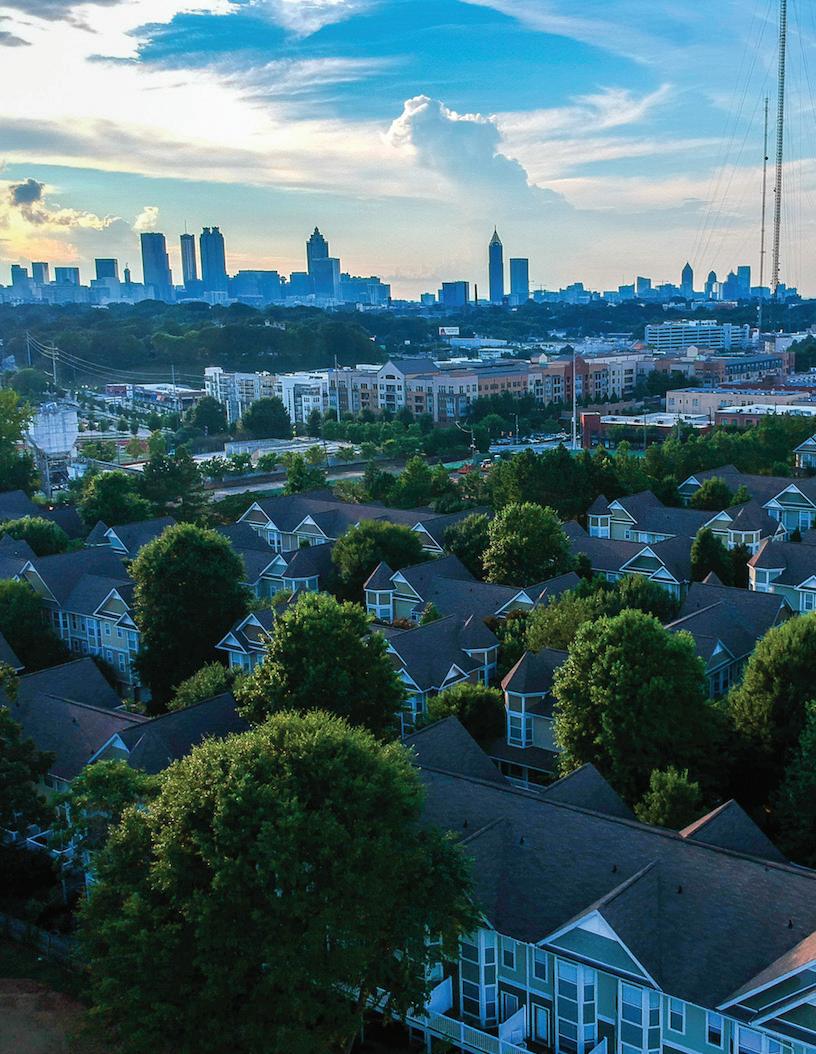

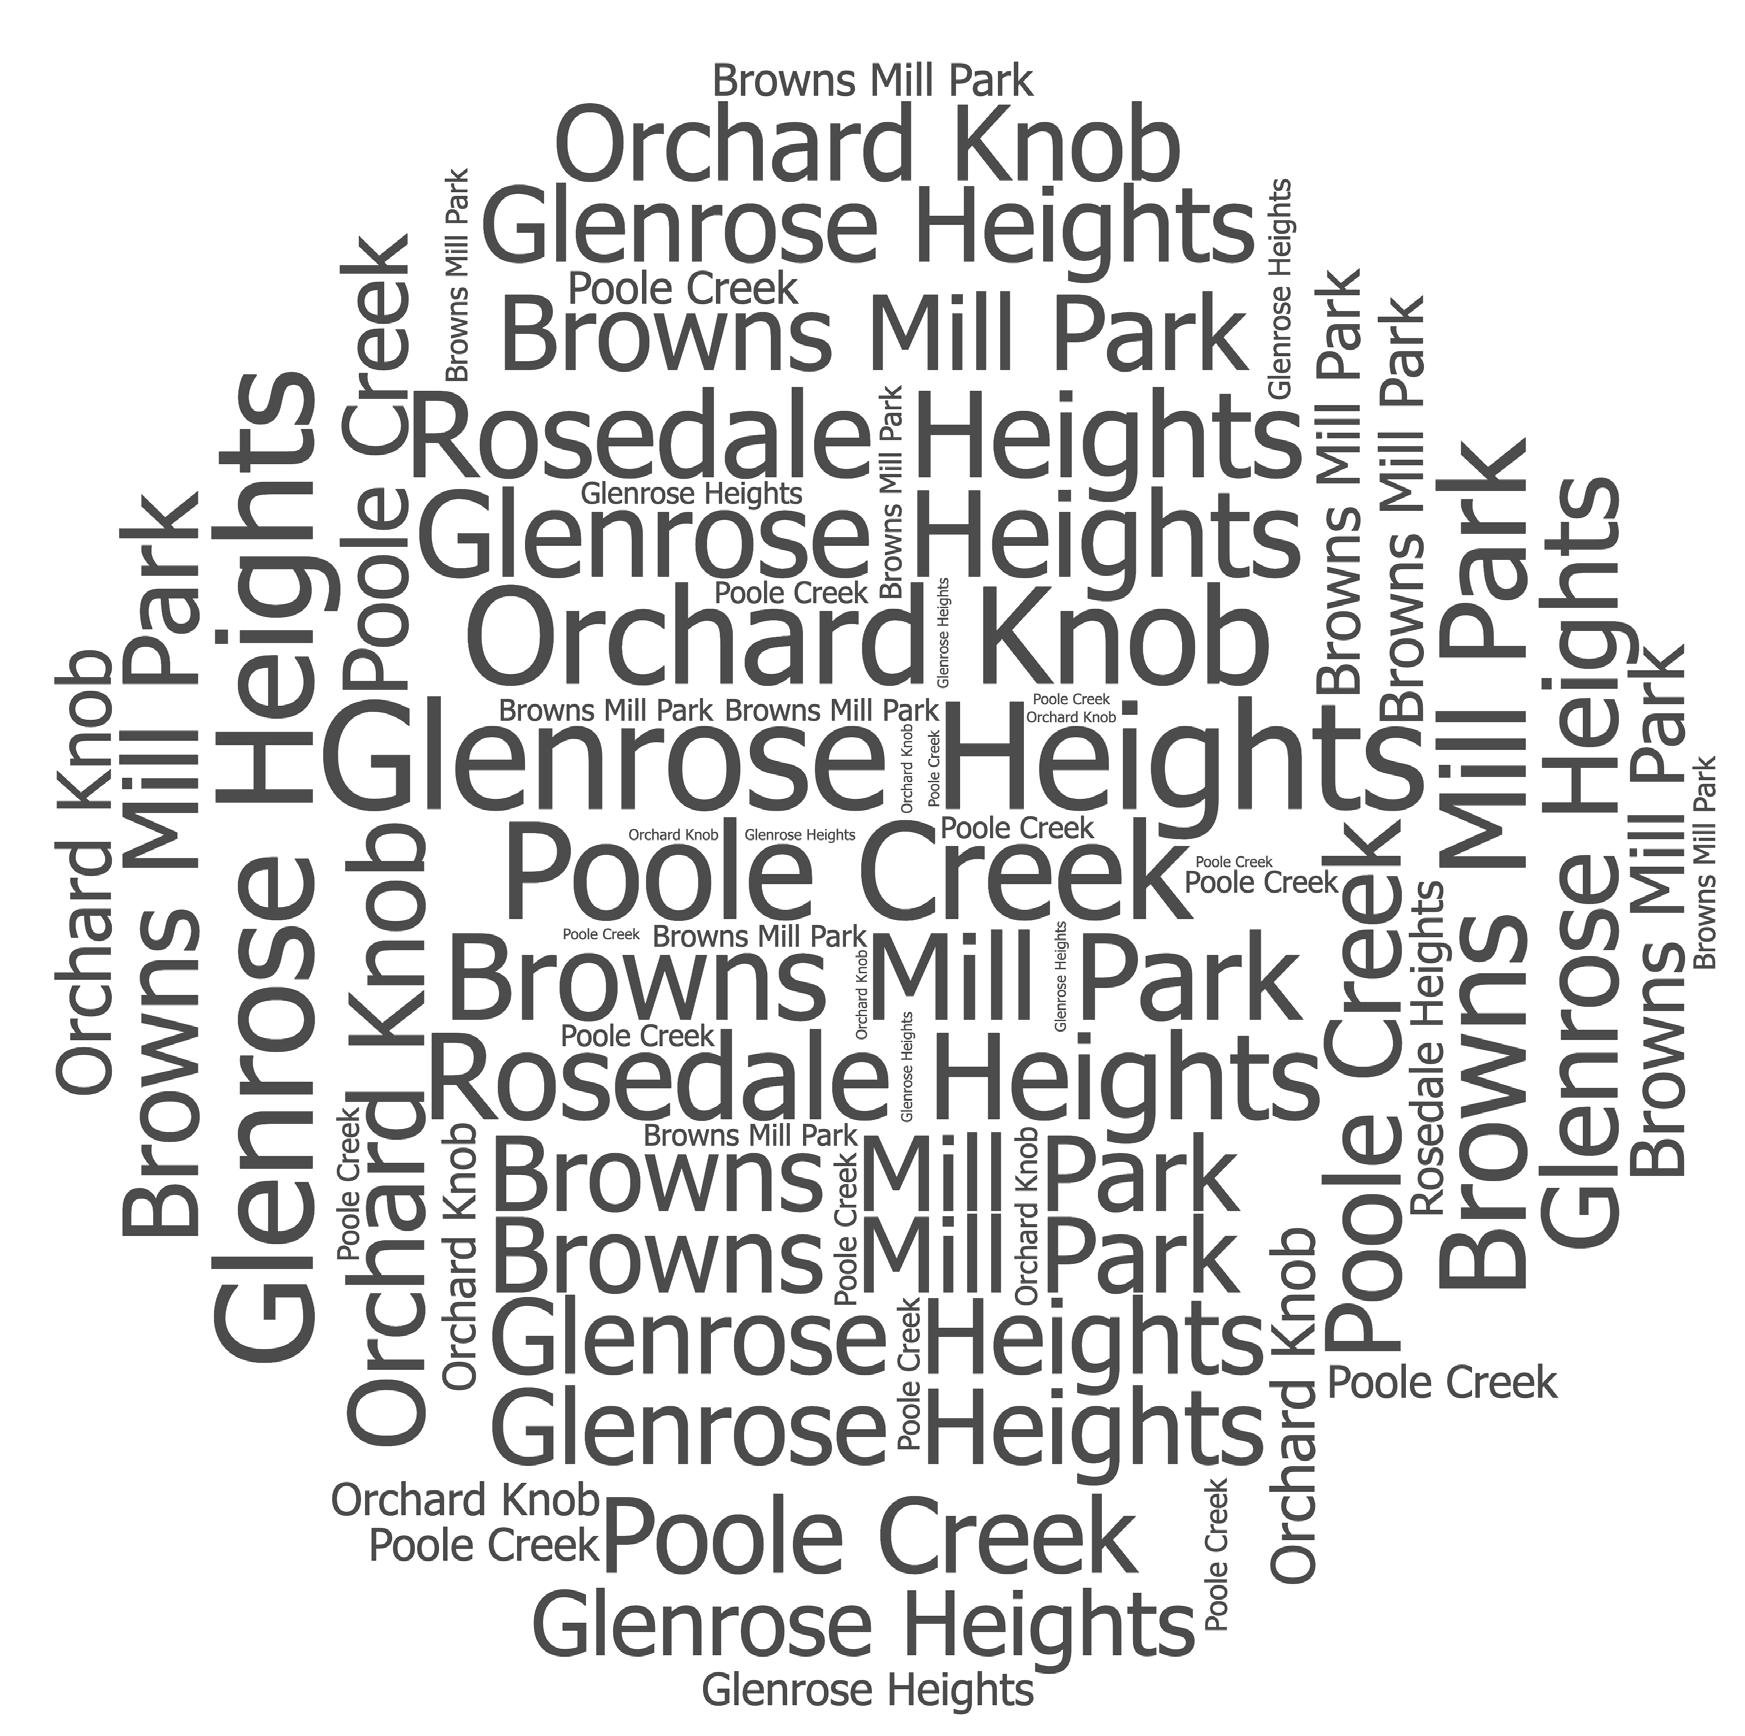
(FMLS)
The following table shows activity for attached homes (condos and townhomes) in FMLS Area 32 from July, 1 2020 thru September, 30 2020.
Source: FMLS Absorption Analysis Report Trailing 3 Months from 9/30/20
The following table shows activity for detached homes (single family) in FMLS Area 32 from July, 1 2020 thru September, 30 2020.
Source: FMLS Absorption Analysis Report Trailing 3 Months from 9/30/20
The number of active condo listings in FMLS Area 32 increased 25% on a year-over-year basis from 76 in Q3 2019 to 95 in Q3 2020. The number of new condo listings in FMLS Area 32 increased 54% on a year-over-year basis from 24 in Q3 2019 to 37 in Q3 2020. The number of condo sales in FMLS Area 32 increased 146% on a year-over-year basis from 11 in Q3 2019 to 27 in Q3 2020. The months of inventory for condos in FMLS Area 32 decreased 55% on a year-over-year basis from 8.6 months in Q3 2019 to 3.9 months in Q3 2020.
MARKET ACTIVITY DASHBOARD | Q3 2020 vs Q3 2019
NUMBER OF ACTIVE LISTINGS
CUMULATIVE DAYS ON MARKET
The number of active townhome listings in FMLS Area 32 decreased 33% on a year-over-year basis from 198 in Q3 2019 to 133 in Q3 2020. The number of new townhome listings in FMLS Area 32 decreased 39% on a year-over-year basis from 65 in Q3 2019 to 40 in Q3 2020. The number of townhome sales in FMLS Area 32 decreased 68% on a year-over-year basis from 144 in Q3 2019 to 46 in Q3 2020. The months of inventory for townhomes in FMLS Area 32 increased 117% on a year-over-year basis from 1.5 months in Q3 2019 to 3.2 months in Q3 2020.
MARKET ACTIVITY DASHBOARD | Q3 2020 vs Q3 2019
NUMBER OF ACTIVE LISTINGS -32.8%
NUMBER OF CLOSINGS
NUMBER OF NEW LISTINGS
MONTHS OF INVENTORY
SALE PRICE
SALES PRICE TO LIST PRICE RATIO +0.8%
MEDIAN CUMULATIVE DAYS ON MARKET -62.5%
The number of active townhome listings in FMLS Area 32 decreased 33% on a year-over-year basis from 198 in Q3 2019 to 133 in Q3 2020.
The number of new townhome listings in FMLS Area 32 decreased 39% on a year-over-year basis from 65 in Q3 2019 to 40 in Q3 2020.
The number of townhome sales in FMLS Area 32 decreased 68% on a year-over-year basis from 144 in Q3 2019 to 46 in Q3 2020.
SUMMARY OF SINGLE-FAMILY DETACHED MARKET ACTIVITY
The number of active single-family listings in FMLS Area 32 decreased 26% on a year-over-year basis from 733 in Q3 2019 to 543 in Q3 2020. The number of new single-family home listings in FMLS Area 32 decreased .3% on a year-over-year basis from 331 in Q3 2019 to 330 in Q3 2020. The number of single-family home sales in FMLS Area 32 increased 16% on a year-over-year basis from 203 in Q3 2019 to 236 in Q3 2020. The months of inventory for single-family homes in FMLS Area 32 decreased 36% on a year-over-year basis from 3.6 months in Q3 2019 to 2.3 months in Q3 2020.
ACTIVITY DASHBOARD | Q3 2020 vs Q3 2019
NUMBER OF ACTIVE LISTINGS
NUMBER OF NEW LISTINGS
PRICE TO LIST PRICE RATIO
MEDIAN CUMULATIVE DAYS ON MARKET -3.2%
The number of active single-family listings in FMLS Area 32 decreased 26% on a year-over-year basis from 733 in Q3 2019 to 543 in Q3 2020.
The number of new single-family home listings in FMLS Area 32 decreased .3% on a year-over-year basis from 331 in Q3 2019 to 330 in Q3 2020.
The number of single-family home sales in FMLS Area 32 increased 16% on a year-over-year basis from 203 in Q3 2019 to 236 in Q3 2020.
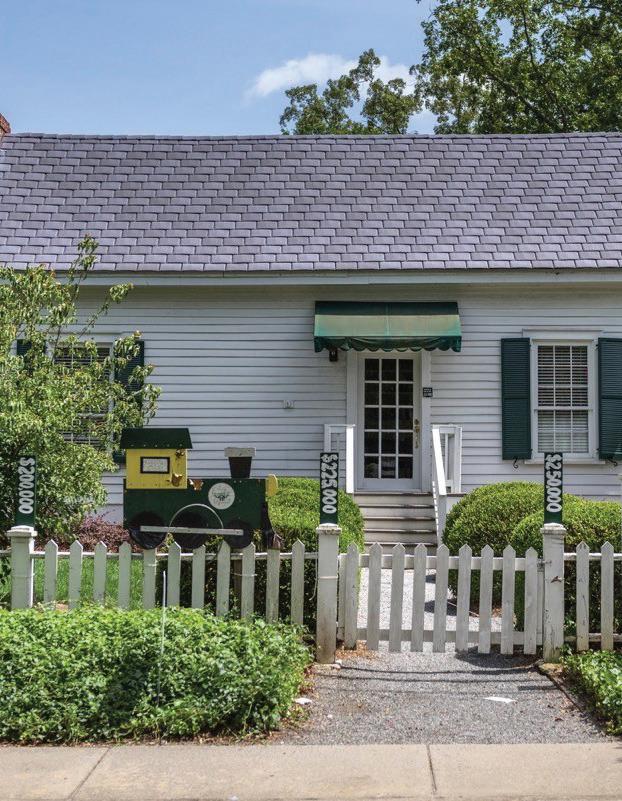

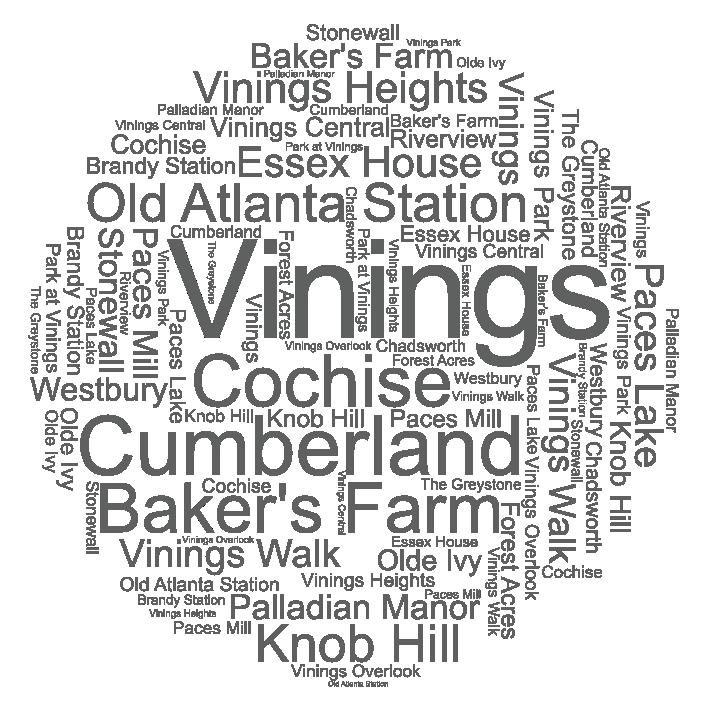
First Multiple Listing Service (FMLS) Area 71 includes the easternmost portion of Cobb County that falls within I-285. It includes Cumberland, Vinings and several other neighborhoods. FMLS Area 71 is bound by I-285 to the west, the Chattahoochee River to the east, north and south.
The following table shows activity for attached homes (condos and townhomes) in FMLS Area 71 from July, 1 2020 thru September, 30 2020.
Source: FMLS Absorption Analysis Report Trailing 3 Months from 9/30/20
The following table shows activity for detached homes (single family) in FMLS Area 71 from July, 1 2020 thru September, 30 2020.
Source: FMLS Absorption Analysis Report Trailing 3 Months from 9/30/20
The number of active condo listings in FMLS Area 71 increased 15% on a year-over-year basis from 109 in Q3 2019 to 125 in Q3 2020. The number of new condo listings in FMLS Area 71 increased 36% on a year-over-year basis from 50 in Q3 2019 to 68 in Q3 2020. The number of condo sales in FMLS Area 71 increased 26% on a year-over-year basis from 31 in Q3 2019 to 39 in Q3 2020. The months of inventory for condos in FMLS Area 71 decreased 17% on a year-over-year basis from 4.1 months in Q3 2019 to 3.4 months in Q3 2020.
MARKET ACTIVITY DASHBOARD | Q3 2020 vs Q3 2019
NUMBER OF ACTIVE LISTINGS +14.7%
NUMBER OF NEW LISTINGS +36.0% NUMBER OF CLOSINGS +25.8% MONTHS OF INVENTORY -16.5%
SALE PRICE
PRICE TO LIST PRICE RATIO +1.0% MEDIAN CUMULATIVE DAYS ON MARKET -9.0%
The number of active townhome listings in FMLS Area 71 decreased 13% on a year-over-year basis from 165 in Q3 2019 to 144 in Q3 2020. The number of new townhome listings in FMLS Area 71 increased 1% on a year-over-year basis from 87 in Q3 2019 to 88 in Q3 2020. The number of townhome sales in FMLS Area 71 increased 20% on a year-over-year basis from 50 in Q3 2019 to 60 in Q3 2020. The months of inventory for townhomes in FMLS Area 71 decreased 24% on a year-over-year basis from 3.3 months in Q3 2019 to 2.5 months in Q3 2020.
MARKET ACTIVITY DASHBOARD | Q3 2020 vs Q3 2019
NUMBER OF ACTIVE LISTINGS -12.7%
NUMBER OF NEW LISTINGS +1.1%
NUMBER OF CLOSINGS
MONTHS OF INVENTORY -24.1% MEDIAN SALE PRICE -5.4% AVERAGE SALE PRICE -11.3%
SALES PRICE TO LIST PRICE RATIO +0.8%
MEDIAN CUMULATIVE DAYS ON MARKET -47.1%
The number of active townhome listings in FMLS Area 71 decreased 13% on a year-over-year basis from 165 in Q3 2019 to 144 in Q3 2020.
The number of new townhome listings in FMLS Area 71 increased 1% on a year-over-year basis from 87 in Q3 2019 to 88 in Q3 2020.
The number of townhome sales in FMLS Area 71 increased 20% on a yearover-year basis from 50 in Q3 2019 to 60 in Q3 2020.
SUMMARY OF SINGLE-FAMILY DETACHED MARKET ACTIVITY
The number of active single-family listings in FMLS Area 71 decreased 45% on a year-over-year basis from 267 in Q3 2019 to 146 in Q3 2020. The number of new single-family home listings in FMLS Area 71 decreased 30% on a year-over-year basis from 126 in Q3 2019 to 88 in Q3 2020. The number of single-family home sales in FMLS Area 71 decreased 20% on a year-over-year basis from 77 in Q3 2019 to 62 in Q3 2020. The months of inventory for single-family homes in FMLS Area 71 decreased 29% on a year-over-year basis from 3.5 months in Q3 2019 to 2.5 months in Q3 2020.
MARKET ACTIVITY DASHBOARD | Q3 2020 vs Q3 2019
NUMBER OF ACTIVE LISTINGS
NUMBER OF CLOSINGS
NUMBER OF NEW LISTINGS
MONTHS OF INVENTORY
AVERAGE SALE PRICE
SALES PRICE TO LIST PRICE RATIO +6.5%
MEDIAN CUMULATIVE DAYS ON MARKET -33.8%
The number of active single-family listings in FMLS Area 71 decreased 45% on a year-over-year basis from 267 in Q3 2019 to 146 in Q3 2020.
The number of new single-family home listings in FMLS Area 71 decreased 30% on a year-over-year basis from 126 in Q3 2019 to 88 in Q3 2020.
The number of single-family home sales in FMLS Area 71 decreased 20% on a year-over-year basis from 77 in Q3 2019 to 62 in Q3 2020.
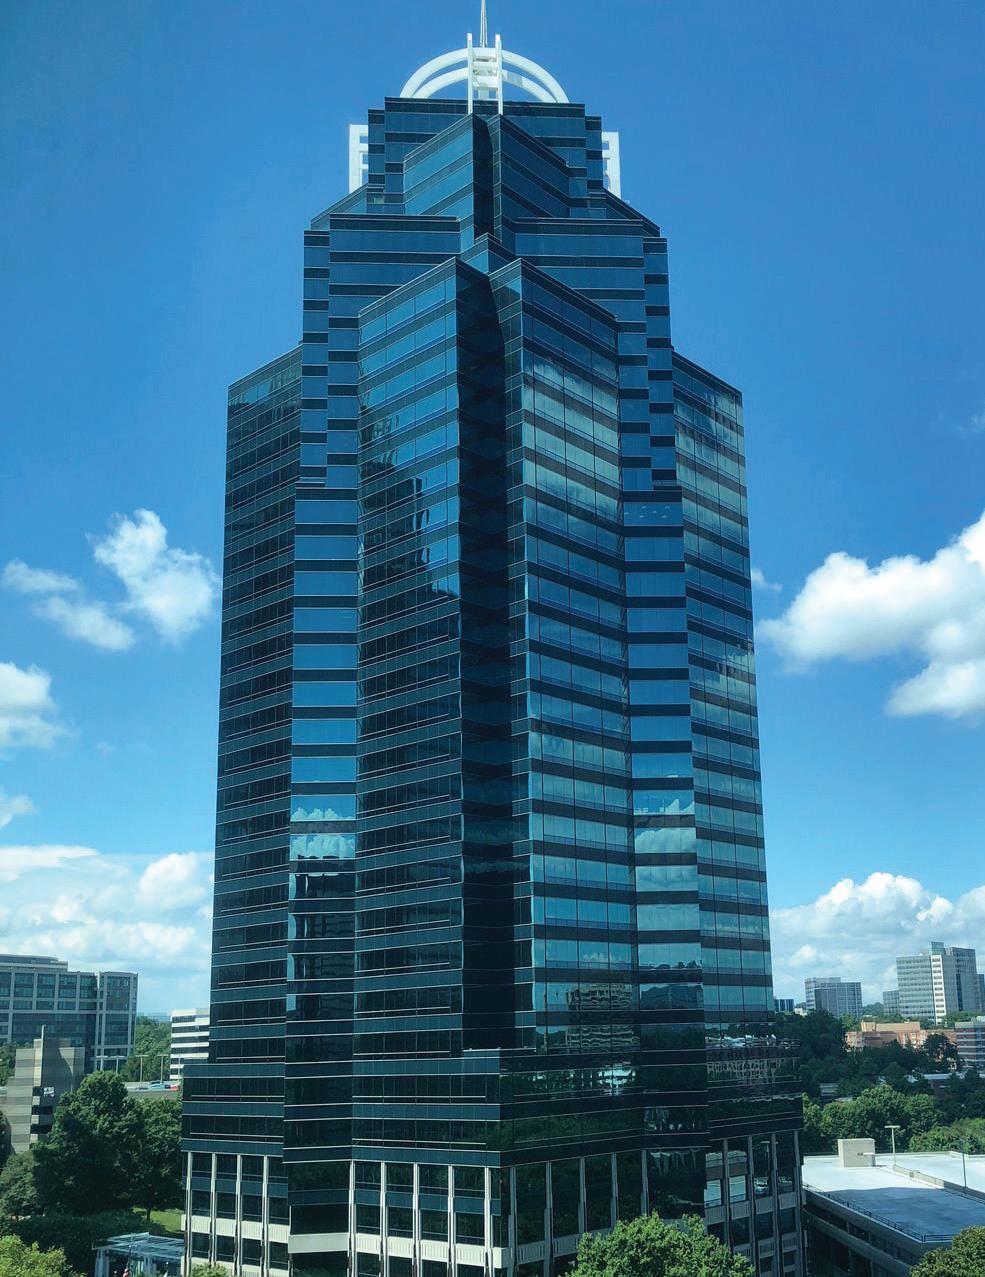

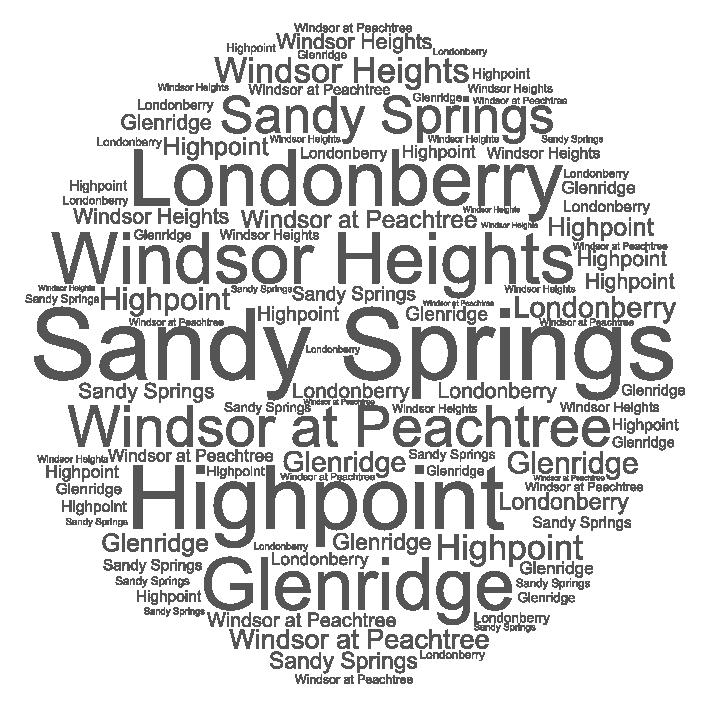
First Multiple Listing Service (FMLS) Area 132 includes the southernmost portion of Sandy Springs. It includes Windsor Heights, Londonberry and several other neighborhoods. FMLS Area 132 is bound by the Fulton/DeKalb line to the east, and the Chattahoochee River to the west, I-285 to the north and the City of Atlanta line to the south.
The following table shows activity for attached homes (condos and townhomes) in FMLS Area 132 from July, 1 2020 thru September, 30 2020.
Source: FMLS Absorption Analysis Report Trailing 3 Months from 9/30/20
The following table shows activity for detached homes (single family) in FMLS Area 132 from July, 1 2020 thru September, 30 2020.
Source: FMLS Absorption Analysis Report Trailing 3 Months from 9/30/20
The number of active condo listings in FMLS Area 132 decreased 11% on a year-over-year basis from 63 in Q3 2019 to 56 in Q3 2020. The number of new condo listings in FMLS Area 132 increased 14% on a year-over-year basis from 35 in Q3 2019 to 40 in Q3 2020. The number of condo sales in FMLS Area 132 increased 29% on a year-over-year basis from 21 in Q3 2019 to 27 in Q3 2020. The months of inventory for condos in FMLS Area 132 decreased 32% on a year-over-year basis from 3.1 months in Q3 2019 to 2.1 months in Q3 2020.
MARKET ACTIVITY DASHBOARD | Q3 2020 vs Q3 2019
NUMBER OF ACTIVE LISTINGS
NUMBER OF NEW LISTINGS
CUMULATIVE DAYS ON MARKET
The number of active condo listings in FMLS Area 132 decreased 11% on a year-over-year basis from 63 in Q3 2019 to 56 in Q3 2020.
The number of new condo listings in FMLS Area 132 increased 14% on a year-over-year basis from 35 in Q3 2019 to 40 in Q3 2020.
The number of condo sales in FMLS Area 132 increased 29% on a year-overyear basis from 21 in Q3 2019 to 27 in Q3 2020.
The number of active townhome listings in FMLS Area 132 decreased 17% on a year-over-year basis from 116 in Q3 2019 to 96 in Q3 2020. The number of new townhome listings in FMLS Area 132 increased 15% on a year-over-year basis from 41 in Q3 2019 to 47 in Q3 2020. The number of townhome sales in FMLS Area 132 increased 26% on a year-over-year basis from 27 in Q3 2019 to 34 in Q3 2020. The months of inventory for townhomes in FMLS Area 132 decreased 30% on a year-over-year basis from 4.5 months in Q3 2019 to 3.2 months in Q3 2020.
MARKET ACTIVITY DASHBOARD | Q3 2020 vs Q3 2019
NUMBER OF ACTIVE LISTINGS -17.7%
NUMBER OF CLOSINGS
NUMBER OF NEW LISTINGS
MONTHS OF INVENTORY -29.7%
SALE PRICE
AVERAGE SALE PRICE -11.7% SALES PRICE TO LIST PRICE RATIO -0.5%
MEDIAN CUMULATIVE DAYS ON MARKET -22.1%
The number of active townhome listings in FMLS Area 132 decreased 17% on a year-over-year basis from 116 in Q3 2019 to 96 in Q3 2020.
The number of new townhome listings in FMLS Area 132 increased 15% on a year-over-year basis from 41 in Q3 2019 to 47 in Q3 2020.
The number of townhome sales in FMLS Area 132 increased 26% on a year-over-year basis from 27 in Q3 2019 to 34 in Q3 2020.
SUMMARY OF SINGLE-FAMILY DETACHED MARKET ACTIVITY
The number of active single-family listings in FMLS Area 132 decreased 20% on a year-over-year basis from 537 in Q3 2019 to 428 in Q3 2020. The number of new single-family home listings in FMLS Area 132 increased 22% on a year-over-year basis from 124 in Q3 2019 to 151 in Q3 2020. The number of single-family home sales in FMLS Area 132 increased 14% on a year-over-year basis from 71 in Q3 2019 to 81 in Q3 2020. The months of inventory for single-family homes in FMLS Area 132 decreased 35% on a year-over-year basis from 8.2 months in Q3 2019 to 5.3 months in Q3 2020.
ACTIVITY DASHBOARD | Q3 2020 vs Q3 2019
NUMBER OF ACTIVE LISTINGS
PRICE TO LIST PRICE RATIO
MEDIAN CUMULATIVE DAYS ON MARKET +24.4%
The number of active single-family listings in FMLS Area 132 decreased 20% on a year-over-year basis from 537 in Q3 2019 to 428 in Q3 2020.
The number of new single-family home listings in FMLS Area 132 increased 22% on a year-over-year basis from 124 in Q3 2019 to 151 in Q3 2020.
The number of single-family home sales in FMLS Area 132 increased 14% on a year-over-year basis from 71 in Q3 2019 to 81 in Q3 2020.

The following table shows activity for attached homes (condos and townhomes) in FMLS Areas 131 from July, 1 2020 thru September, 30 2020.
Source: FMLS Absorption Analysis Report Trailing 3 Months from 9/30/20
The following table shows activity for detached homes (single family) in FMLS Areas 131 from July, 1 2020 thru September, 30 2020.
Source: FMLS Absorption Analysis Report Trailing 3 Months from 9/30/20
The number of active condo listings in FMLS Area 131 increased 2% on a year-over-year basis from 259 in Q3 2019 to 265 in Q3 2020. The number of new condo listings in FMLS Area 131 decreased 9.2% on a year-over-year basis from 152 in Q3 2019 to 138 in Q3 2020. The number of condo sales in FMLS Area 131 decreased 3% on a year-over-year basis from 104 in Q3 2019 to 101 in Q3 2020. The months of inventory for condos in FMLS Area 131 remained the same on a year-over-year basis from 2.7 months in Q3 2019 to 2.7 months in Q3 2020.
MARKET ACTIVITY DASHBOARD | Q3 2020 vs Q3 2019
NUMBER OF ACTIVE LISTINGS
+2.3%
NUMBER OF NEW LISTINGS -9.2%
NUMBER OF CLOSINGS -2.9% MONTHS OF INVENTORY +0.2% MEDIAN SALE PRICE
SALE PRICE +12.1%
SALES PRICE TO LIST PRICE RATIO +0.7%
MEDIAN CUMULATIVE DAYS ON MARKET +40.4%
The number of active condo listings in FMLS Area 131 increased 2% on a yearover-year basis from 259 in Q3 2019 to 265 in Q3 2020.
The number of new condo listings in FMLS Area 131 decreased 9.2% on a year-over-year basis from 152 in Q3 2019 to 138 in Q3 2020. The
The number of active townhome listings in FMLS Area 131 decreased 23% on a year-over-year basis from 248 in Q3 2019 to 192 in Q3 2020. The number of new townhome listings in FMLS Area 131 decreased 3% on a year-over-year basis from 121 in Q3 2019 to 117 in Q3 2020. The number of townhome sales in FMLS Area 131 decreased 14% on a year-over-year basis from 85 in Q3 2019 to 73 in Q3 2020. The months of inventory for townhomes in FMLS Area 131 decreased 13% on a year-over-year basis from 3.1 months in Q3 2019 to 2.7 months in Q3 2020.
NUMBER OF ACTIVE LISTINGS -22.6%
NUMBER OF NEW LISTINGS -3.3%
NUMBER OF CLOSINGS -14.1% MONTHS OF INVENTORY -12.6% MEDIAN SALE PRICE -3.0% AVERAGE SALE PRICE -1.4%
SALES PRICE TO LIST PRICE RATIO
+0.8%
MEDIAN CUMULATIVE DAYS ON MARKET +8.3%
The number of active townhome listings in FMLS Area 131 decreased 23% on a year-over-year basis from 248 in Q3 2019 to 192 in Q3 2020.
The number of new townhome listings in FMLS Area 131 decreased 3% on a year-over-year basis from 121 in Q3 2019 to 117 in Q3 2020. The
SUMMARY OF SINGLE-FAMILY DETACHED MARKET ACTIVITY
The number of active single-family listings in FMLS Area 131 decreased 26% on a year-over-year basis from 571 in Q3 2019 to 422 in Q3 2020. The number of new single-family home listings in FMLS Area 131 increased 4% on a year-over-year basis from 164 in Q3 2019 to 171 in Q3 2020. The number of single-family home sales in FMLS Area 131 increased 15% on a year-over-year basis from 107 in Q3 2019 to 123 in Q3 2020. The months of inventory for single-family homes in FMLS Area 131 decreased 39% on a year-over-year basis from 5.8 months in Q3 2019 to 3.5 months in Q3 2020.
MARKET ACTIVITY DASHBOARD | Q3 2020 vs Q3 2019
NUMBER OF ACTIVE LISTINGS
NUMBER OF NEW LISTINGS
NUMBER OF CLOSINGS +15.0% MONTHS OF INVENTORY -39.0%
MEDIAN SALE PRICE -3.3%
SALES PRICE TO LIST PRICE RATIO +1.8%
AVERAGE SALE PRICE +6.0%
MEDIAN CUMULATIVE DAYS ON MARKET -56.0%
The number of active single-family listings in FMLS Area 131 decreased 26% on a year-over-year basis from 571 in Q3 2019 to 422 in Q3 2020.
The number of new single-family home listings in FMLS Area 131 increased 4% on a year-over-year basis from 164 in Q3 2019 to 171 in Q3 2020.
The number of single-family home sales in FMLS Area 131 increased 15% on a year-over-year basis from 107 in Q3 2019 to 123 in Q3 2020.

The following table shows activity for attached homes (condos and townhomes) in FMLS Areas 121 from July, 1 2020 thru September, 30 2020.
Source: FMLS Absorption Analysis Report Trailing 3 Months from 9/30/20
The following table shows activity for detached homes (single family) in FMLS Areas 121 from July, 1 2020 thru September, 30 2020.
Source: FMLS Absorption Analysis Report Trailing 3 Months from 9/30/20
The number of active condo listings in FMLS Area 121 increased 27% on a year-over-year basis from 132 in Q3 2019 to 168 in Q3 2020. The number of new condo listings in FMLS Area 121 increased 30% on a year-over-year basis from 66 in Q3 2019 to 86 in Q3 2020. The number of condo sales in FMLS Area 121 increased 16% on a year-overyear basis from 45 in Q3 2019 to 52 in Q3 2020. The months of inventory for condos in FMLS Area 121 increased 5.7% on a year-over-year basis from 3.1 months in Q3 2019 to 3.3 months in Q3 2020.
MARKET ACTIVITY DASHBOARD | Q3 2020 vs Q3 2019
NUMBER OF ACTIVE LISTINGS +27.3%
NUMBER OF CLOSINGS
NUMBER OF NEW LISTINGS
MONTHS OF INVENTORY
SALE PRICE
AVERAGE SALE PRICE -4.1% SALES PRICE TO LIST PRICE RATIO +0.1%
MEDIAN CUMULATIVE DAYS ON MARKET -17.8%
The number of active condo listings in FMLS Area 121 increased 27% on a year-over-year basis from 132 in Q3 2019 to 168 in Q3 2020. The number of new condo listings in FMLS Area 121 increased 30% on a year-over-year basis from 66 in Q3 2019 to 86 in Q3 2020. The
The number of active townhome listings in FMLS Area 121 decreased 34% on a year-over-year basis from 151 in Q3 2019 to 99 in Q3 2020. The number of new townhome listings in FMLS Area 121 increased 80% on a year-over-year basis from 45 in Q3 2019 to 81 in Q3 2020. The number of townhome sales in FMLS Area 121 increased 3% on a year-over-year basis from 36 in Q3 2019 to 37 in Q3 2020. The months of inventory for townhomes in FMLS Area 121 decreased 33% on a year-over-year basis from 4.2 months in Q3 2019 to 2.8 months in Q3 2020.
MARKET ACTIVITY DASHBOARD | Q3 2020 vs Q3 2019
NUMBER OF ACTIVE LISTINGS -34.4%
NUMBER OF NEW LISTINGS +80.0%
NUMBER OF CLOSINGS
MONTHS OF INVENTORY -33.3% MEDIAN SALE PRICE
AVERAGE SALE PRICE +2.7%
SALES PRICE TO LIST PRICE RATIO +0.8%
MEDIAN CUMULATIVE DAYS ON MARKET -22.2%
The number of active townhome listings in FMLS Area 121 decreased 34% on a year-over-year basis from 151 in Q3 2019 to 99 in Q3 2020.
The number of new townhome listings in FMLS Area 121 increased 80% on a year-over-year basis from 45 in Q3 2019 to 81 in Q3 2020.
The number of townhome sales in FMLS Area 121 increased 3% on a yearover-year basis from 36 in Q3 2019 to 37 in Q3 2020.
SUMMARY OF SINGLE-FAMILY DETACHED MARKET ACTIVITY
The number of active single-family listings in FMLS Area 121 decreased 24% on a year-over-year basis from 588 in Q3 2019 to 447 in Q3 2020. The number of new single-family home listings in FMLS Area 121 decreased 10.3% on a year-over-year basis from 223 in Q3 2019 to 200 in Q3 2020. The number of single-family home sales in FMLS Area 121 increased 13% on a year-over-year basis from 154 in Q3 2019 to 174 in Q3 2020. The months of inventory for single-family homes in FMLS Area 121 decreased 34% on a year-over-year basis from 3.9 months in Q3 2019 to 2.6 months in Q3 2020.
NUMBER OF ACTIVE LISTINGS
NUMBER OF NEW LISTINGS -10.3%
NUMBER OF CLOSINGS +13.0% MONTHS OF INVENTORY -34.2% MEDIAN SALE PRICE +9.8% AVERAGE SALE PRICE +11.5% SALES PRICE TO LIST PRICE RATIO +2.2%
MEDIAN CUMULATIVE DAYS ON MARKET -29.4%
The number of active single-family listings in FMLS Area 121 decreased 24% on a year-over-year basis from 588 in Q3 2019 to 447 in Q3 2020.
The number of new single-family home listings in FMLS Area 121 decreased 10.3% on a year-over-year basis from 223 in Q3 2019 to 200 in Q3 2020.
The number of single-family home sales in FMLS Area 121 increased 13% on a year-over-year basis from 154 in Q3 2019 to 174 in Q3 2020.


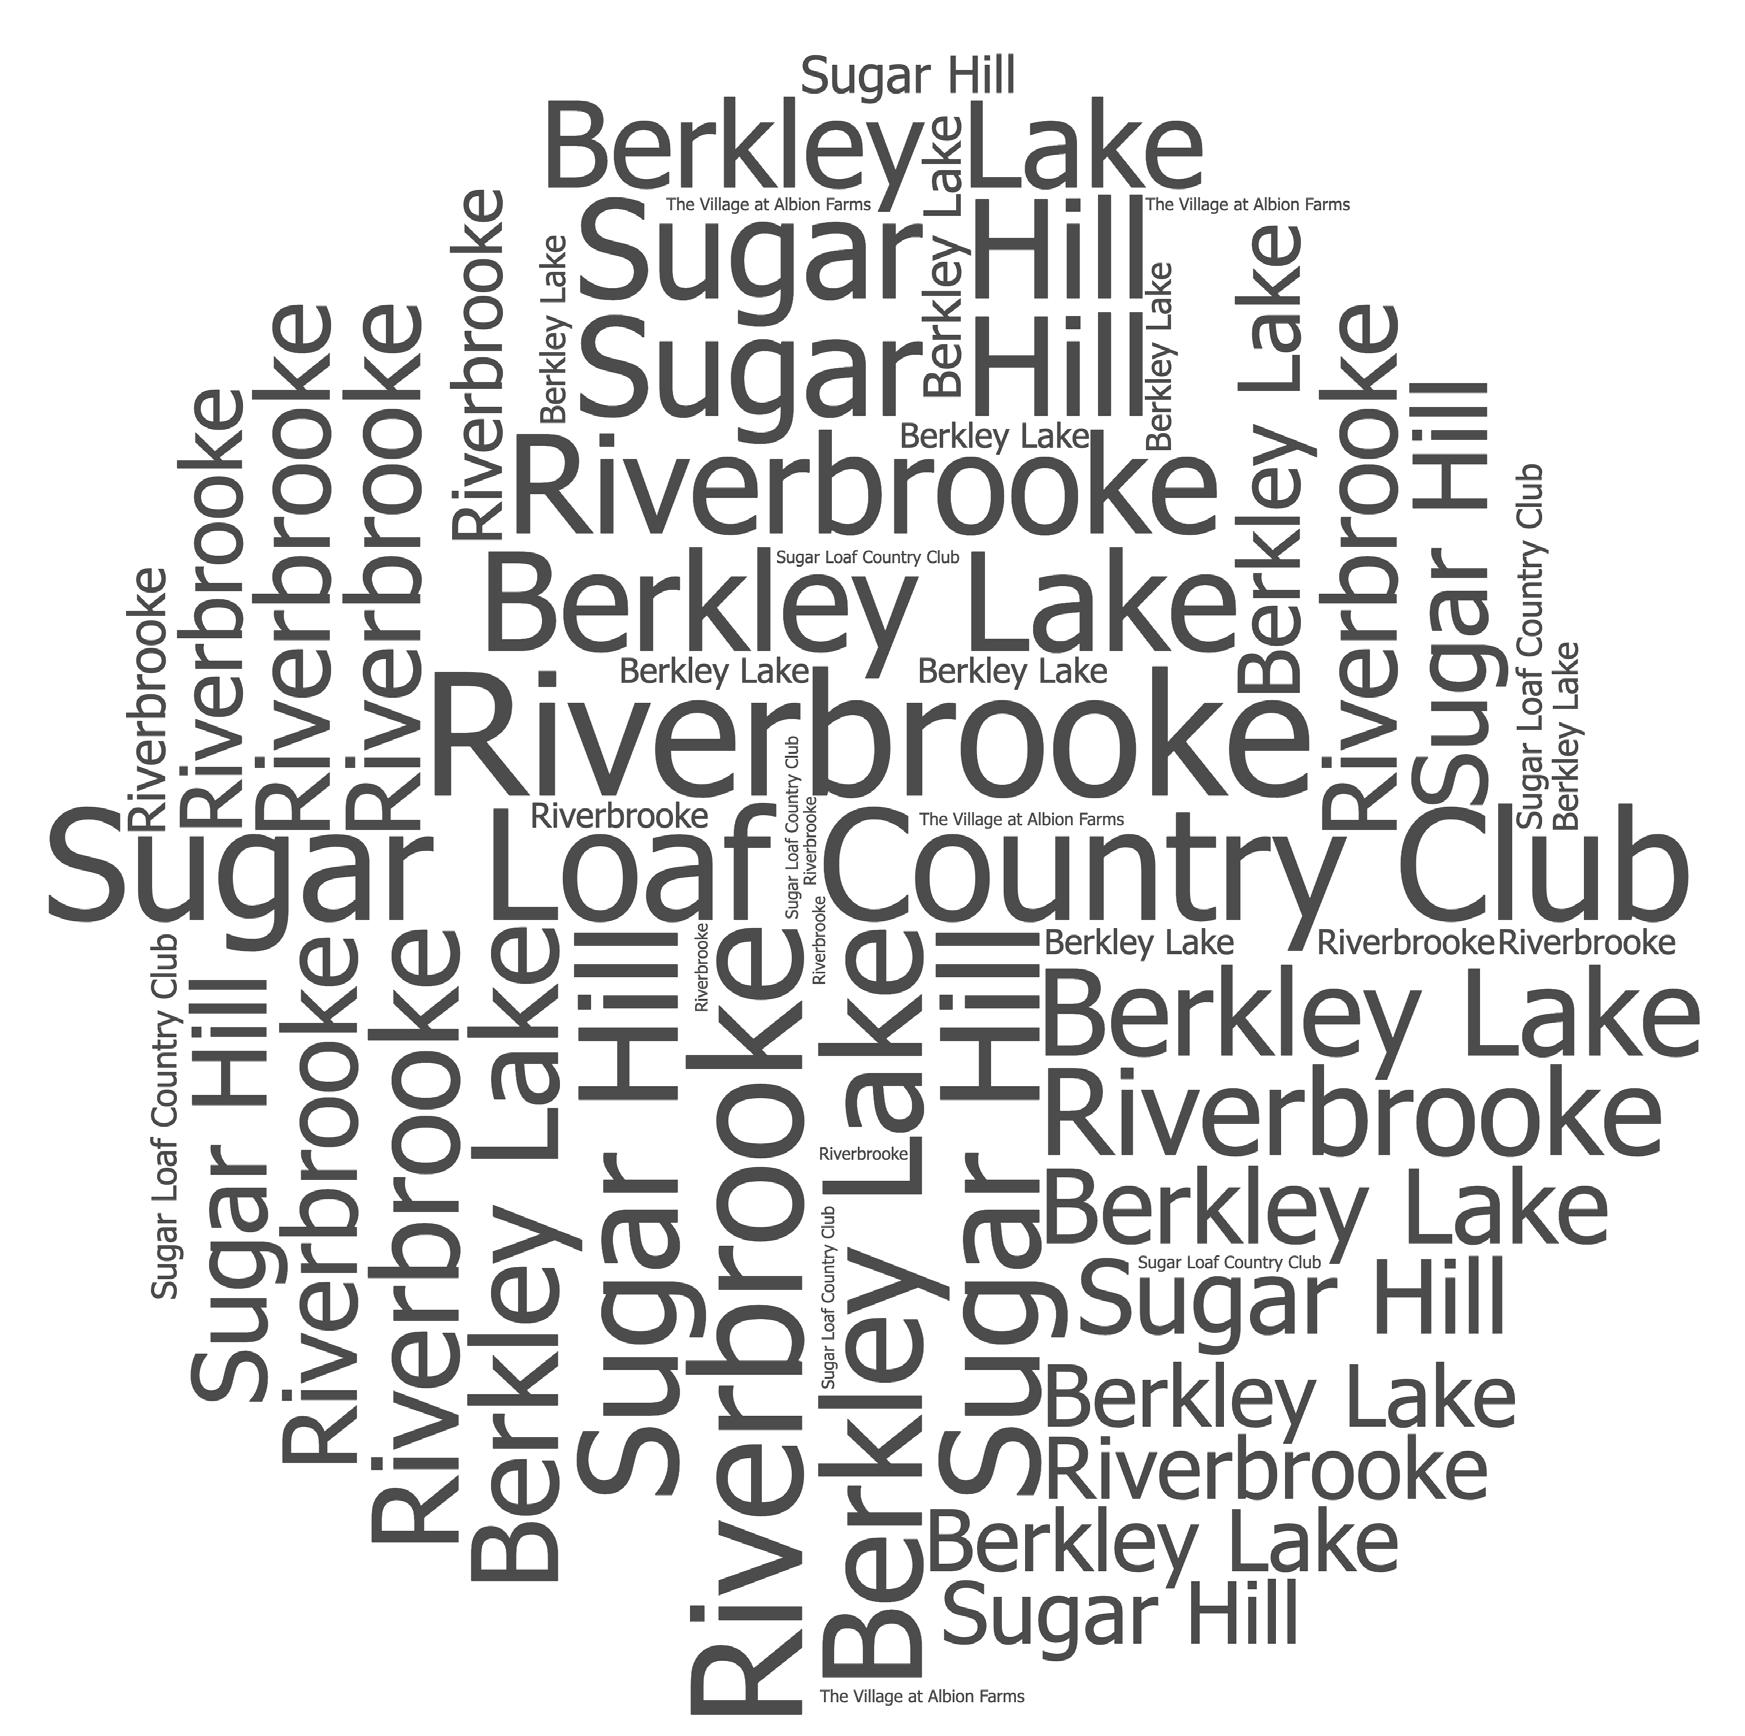
First Multiple Listing Service (FMLS) Area 61-62 encompasses Norcross, Duluth, Buford, and Suwanee. It includes Riverbrooke, The Village at Albion Farms, Berkley Lake, and several other neighborhoods. FMLS Areas 61 and 62 are defined as the borders of Norcross, Duluth, Buford, and Suwanee
The following table shows activity for attached homes (condos and townhomes) in FMLS Areas 61-62 from July, 1 2020 thru September, 30 2020.
Source: FMLS Absorption Analysis Report Trailing 3 Months from 9/30/20
The following table shows activity for detached homes (single family) in FMLS Areas 61-62 from July, 1 2020 thru September, 30 2020.
Source: FMLS Absorption Analysis Report Trailing 3 Months from 9/30/20
The number of active condo listings in FMLS Area 61-62 increased 7% on a year-over-year basis from 86 in Q3 2019 to 92 in Q3 2020. The number of new condo listings in FMLS Area 61-62 decreased 6% on a year-over-year basis from 53 in Q3 2019 to 50 in Q3 2020. The number of condo sales in FMLS Area 61-62 increased 48% on a year-overyear basis from 31 in Q3 2019 to 46 in Q3 2020. The months of inventory for condos in FMLS Area 61-62 decreased 28% on a year-over-year basis from 2.8 months in Q3 2019 to 2 months in Q3 2020.
MARKET ACTIVITY DASHBOARD | Q3 2020 vs Q3 2019
NUMBER OF ACTIVE LISTINGS +7.0%
NUMBER OF CLOSINGS
NUMBER OF NEW LISTINGS
MONTHS OF INVENTORY
SALES PRICE TO LIST PRICE RATIO +1.7%
MEDIAN CUMULATIVE DAYS ON MARKET +4.0%
The number of active condo listings in FMLS Area 61-62 increased 7% on a year-over-year basis from 86 in Q3 2019 to 92 in Q3 2020.
The number of new condo listings in FMLS Area 61-62 decreased 6% on a year-over-year basis from 53 in Q3 2019 to 50 in Q3 2020.
The number of active townhome listings in FMLS Area 61-62 decreased 12% on a year-over-year basis from 561 in Q3 2019 to 496 in Q3 2020. The number of new townhome listings in FMLS Area 61-62 increased 9% on a year-overyear basis from 298 in Q3 2019 to 326 in Q3 2020. The number of townhome sales in FMLS Area 61-62 increased 9% on a year-over-year basis from 218 in Q3 2019 to 238 in Q3 2020. The months of inventory for townhomes in FMLS Area 61-62 decreased 20% on a year-over-year basis from 2.6 months in Q3 2019 to 2.1 months in Q3 2020.
MARKET ACTIVITY DASHBOARD | Q3 2020 vs Q3 2019
NUMBER OF ACTIVE LISTINGS
NUMBER OF CLOSINGS
SALE PRICE
SALES PRICE TO LIST PRICE RATIO +0.6%
NUMBER OF NEW LISTINGS
MONTHS OF INVENTORY
AVERAGE SALE PRICE
MEDIAN CUMULATIVE DAYS ON MARKET +22.6%
The number of active townhome listings in FMLS Area 61-62 decreased 12% on a year-over-year basis from 561 in Q3 2019 to 496 in Q3 2020.
The number of new townhome listings in FMLS Area 61-62 increased 9% on a year-over-year basis from 298 in Q3 2019 to 326 in Q3 2020.
SUMMARY OF SINGLE-FAMILY DETACHED MARKET ACTIVITY
The number of active single-family listings in FMLS Area 61-62 decreased 32% on a year-over-year basis from 3305 in Q3 2019 to 2380 in Q3 2020. The number of new single-family home listings in FMLS Area 61-62 decreased 1% on a year-over-year basis from 1426 in Q3 2019 to 1409 in Q3 2020. The number of single-family home sales in FMLS Area 61-62 increased 15% on a year-over-year basis from 1094 in Q3 2019 to 1260 in Q3 2020. The months of inventory for single-family homes in FMLS Area 61-62 decreased 41% on a year-over-year basis from 3.2 months in Q3 2019 to 1.9 months in Q3 2020.
ACTIVITY DASHBOARD | Q3 2020 vs Q3 2019
NUMBER OF ACTIVE LISTINGS
NUMBER OF NEW LISTINGS
MONTHS OF INVENTORY -41.0%
AVERAGE SALE PRICE +2.6% SALES PRICE TO LIST PRICE RATIO +1.5%
MEDIAN CUMULATIVE DAYS ON MARKET -44.3%
The number of active single-family listings in FMLS Area 61-62 decreased 32% on a year-over-year basis from 3305 in Q3 2019 to 2380 in Q3 2020.
The number of new single-family home listings in FMLS Area 61-62 decreased 1% on a year-over-year basis from 1426 in Q3 2019 to 1409 in Q3 2020.
The number of single-family home sales in FMLS Area 61-62 increased 15% on a year-over-year basis from 1094 in Q3 2019 to 1260 in Q3 2020.
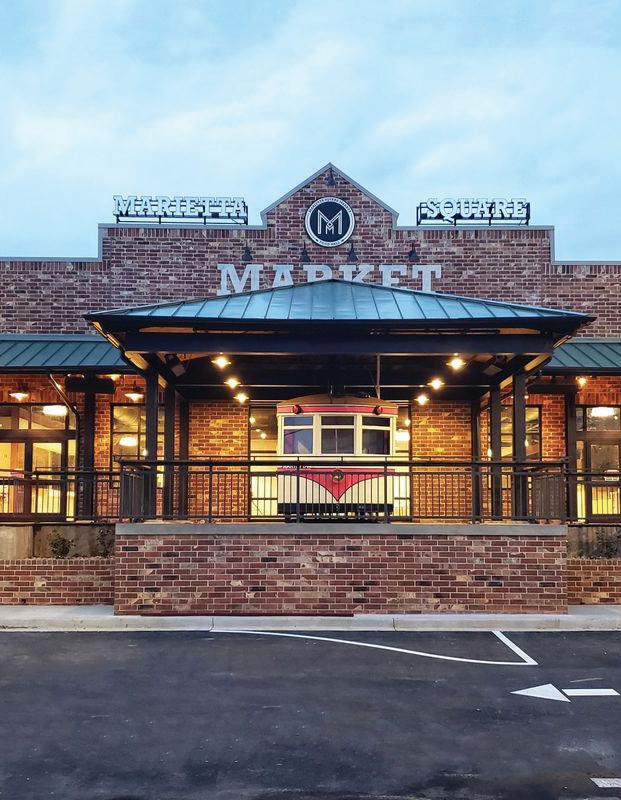

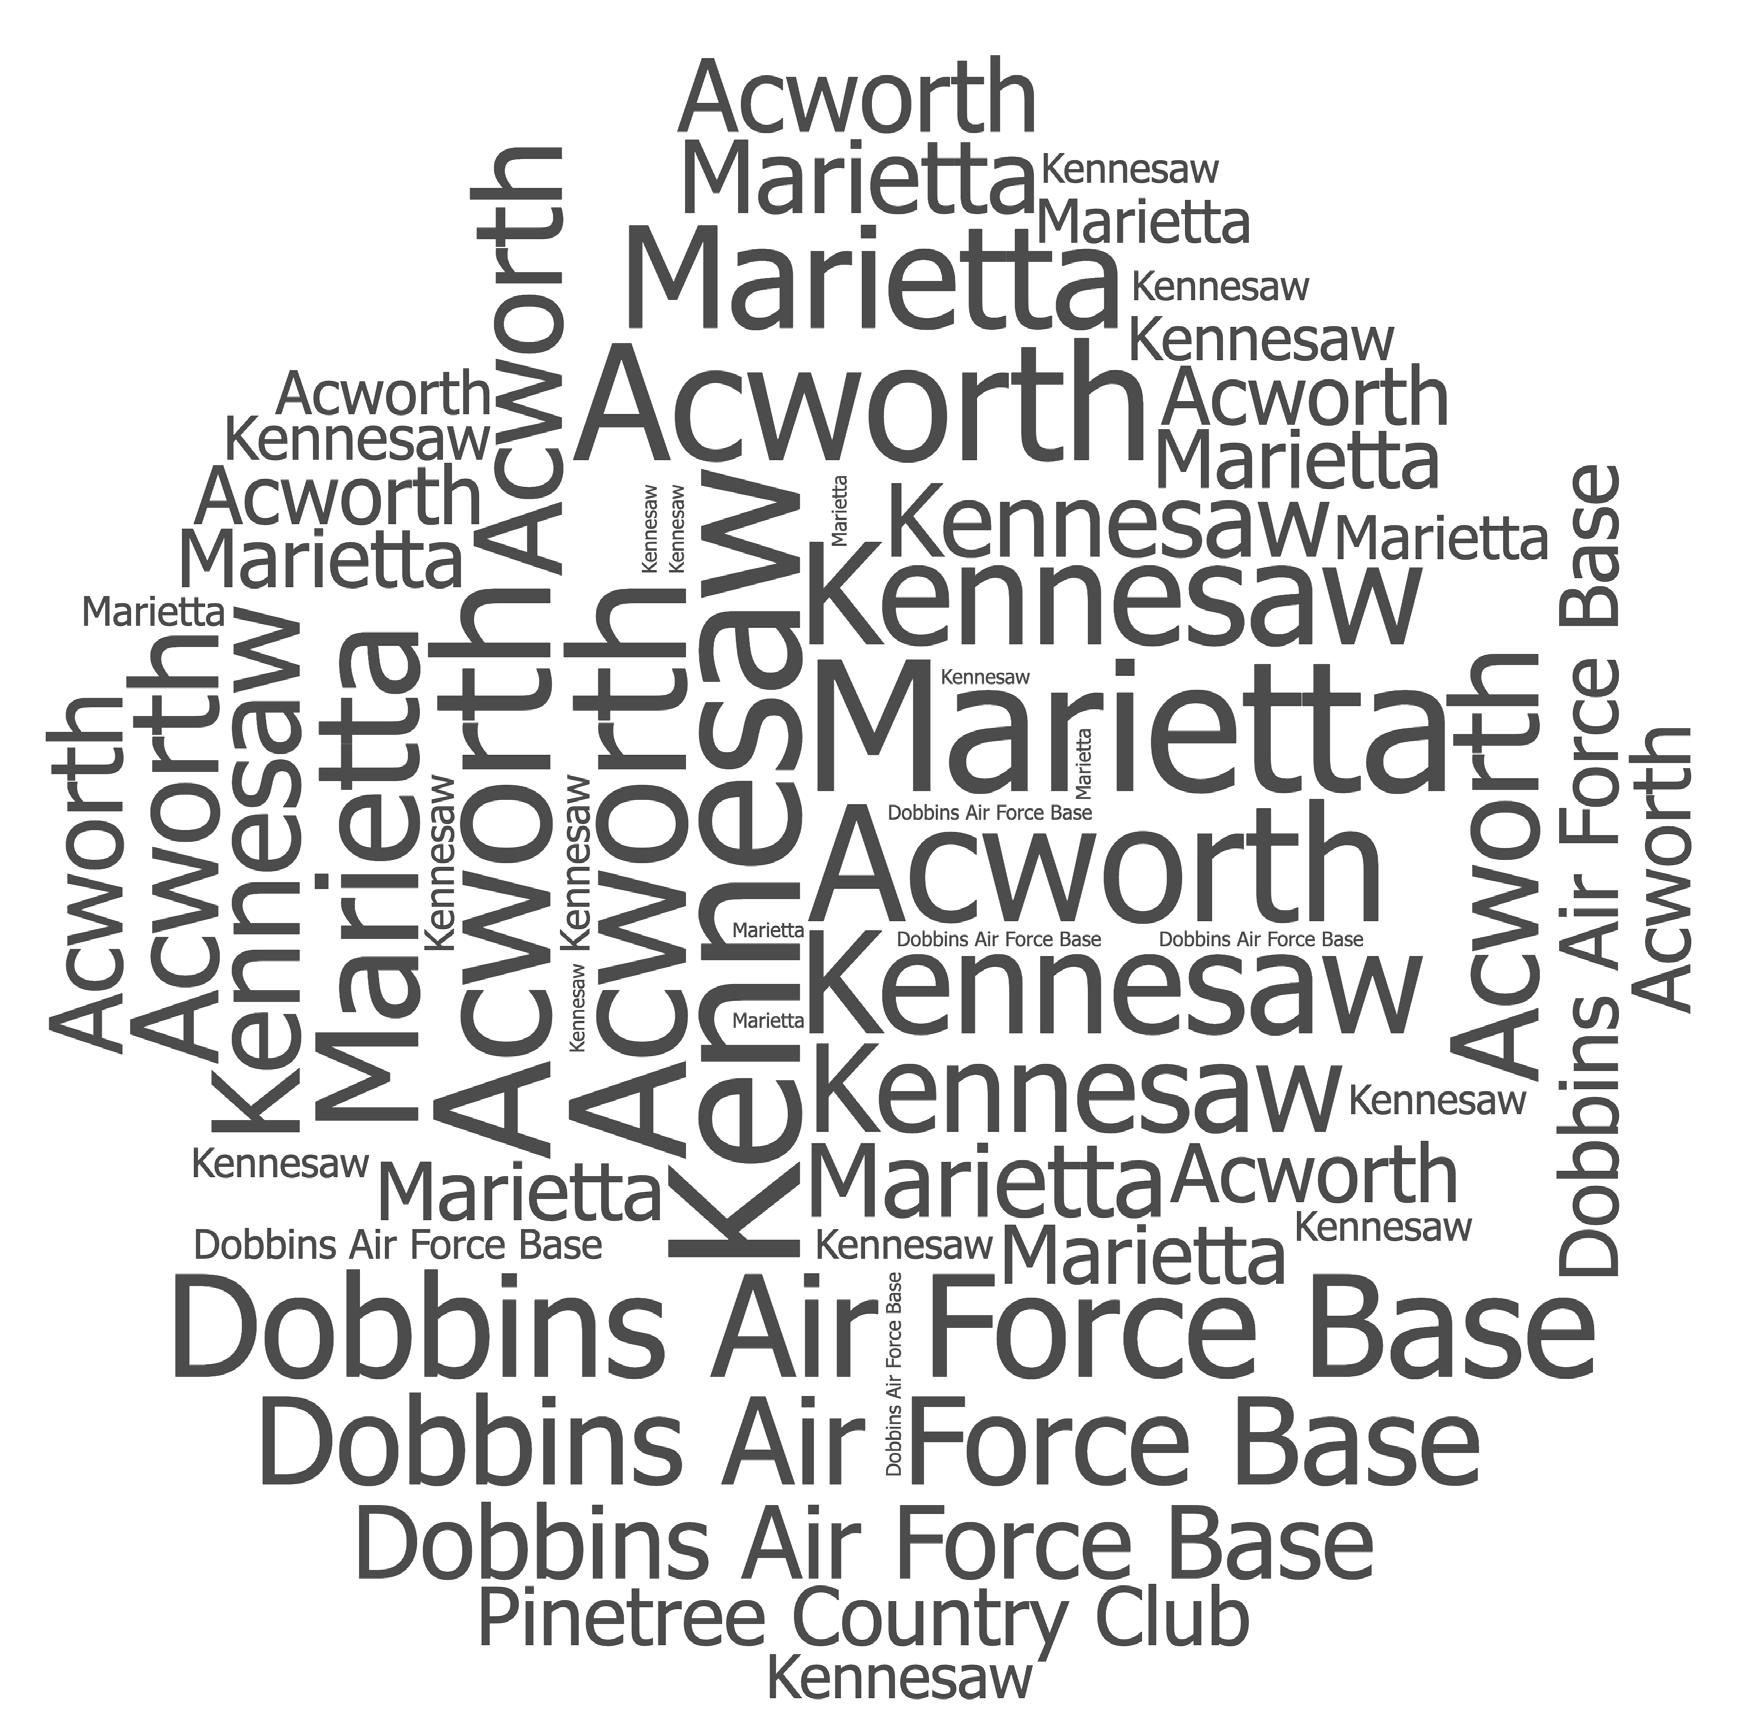
First Multiple Listing Service (FMLS) Area 72-75 includes the eastern region of Cobb County, the areas surrounding Marietta, Kennesaw, and Acworth. It includes Dobbins Air Force Base, Peach Arbor, Cumberland Ridge, and many other neighborhoods. FMLS Areas 72-75 are bound within Cobb county and to the west of I-75.
The following table shows activity for attached homes (condos and townhomes) in FMLS Areas 72-75 from July, 1 2020 thru September, 30 2020.
Source: FMLS Absorption Analysis Report Trailing 3 Months from 9/30/20
The following table shows activity for detached homes (single family) in FMLS Areas 72-75 from July, 1 2020 thru September, 30 2020.
Source: FMLS Absorption Analysis Report Trailing 3 Months from 9/30/20
The number of active condo listings in FMLS Area 72-75 decreased 39% on a year-over-year basis from 213 in Q3 2019 to 131 in Q3 2020. The number of new condo listings in FMLS Area 72-75 decreased 6.4% on a year-over-year basis from 171 in Q3 2019 to 160 in Q3 2020. The number of condo sales in FMLS Area 72-75 increased 1% on a year-over-year basis from 140 in Q3 2019 to 141 in Q3 2020. The months of inventory for condos in FMLS Area 72-75 decreased 35% on a year-over-year basis from 1.5 months in Q3 2019 to 1 month in Q3 2020.
MARKET ACTIVITY DASHBOARD | Q3 2020 vs Q3 2019
NUMBER OF ACTIVE LISTINGS
NUMBER OF CLOSINGS
NUMBER OF NEW LISTINGS
MONTHS OF INVENTORY
PRICE TO LIST PRICE RATIO
MEDIAN CUMULATIVE DAYS ON MARKET -46.8%
The number of active condo listings in FMLS Area 72-75 decreased 39% on a year-over-year basis from 213 in Q3 2019 to 131 in Q3 2020.
The number of new condo listings in FMLS Area 72-75 decreased 6.4% on a year-over-year basis from 171 in Q3 2019 to 160 in Q3 2020.
number of condo sales in FMLS Area 72-75 increased 1% on a yearover-year basis from 140 in Q3 2019 to 141 in Q3 2020
The number of active townhome listings in FMLS Area 72-75 decreased 21% on a year-over-year basis from 821 in Q3 2019 to 646 in Q3 2020. The number of new townhome listings in FMLS Area 72-75 increased 6% on a year-overyear basis from 432 in Q3 2019 to 458 in Q3 2020. The number of townhome sales in FMLS Area 72-75 increased 5% on a year-over-year basis from 382 in Q3 2019 to 401 in Q3 2020. The months of inventory for townhomes in FMLS Area 72-75 decreased 25% on a year-over-year basis from 2.2 months in Q3 2019 to 1.6 months in Q3 2020.
ACTIVITY DASHBOARD | Q3 2020 vs Q3 2019
NUMBER OF ACTIVE LISTINGS
NUMBER OF CLOSINGS
MEDIAN SALE PRICE
SALES PRICE TO LIST PRICE RATIO +1.0%
NUMBER OF NEW LISTINGS
MONTHS OF INVENTORY
AVERAGE SALE PRICE +12.9%
MEDIAN CUMULATIVE DAYS ON MARKET -36.8%
The number of active single-family listings in FMLS Area 72-75 decreased 31% on a year-over-year basis from 4540 in Q3 2019 to 3134 in Q3 2020. The number of new single-family home listings in FMLS Area 72-75 decreased 5.5% on a year-over-year basis from 2332 in Q3 2019 to 2204 in Q3 2020. The number of single-family home sales in FMLS Area 72-75 increased 9% on a year-over-year basis from 1876 in Q3 2019 to 2040 in Q3 2020. The months of inventory for single-family homes in FMLS Area 72-75 decreased 38% on a year-over-year basis from 2.5 months in Q3 2019 to 1.5 months in Q3 2020.
NUMBER OF ACTIVE LISTINGS
NUMBER OF NEW LISTINGS
AVERAGE SALE PRICE +13.4% SALES PRICE TO LIST PRICE RATIO +1.4% MEDIAN CUMULATIVE DAYS ON MARKET -40.0%
The number of active single-family listings in FMLS Area 72-75 decreased 31% on a year-over-year basis from 4540 in Q3 2019 to 3134 in Q3 2020.
The number of new single-family home listings in FMLS Area 72-75 decreased 5.5% on a year-over-year basis from 2332 in Q3 2019 to 2204 in Q3 2020.
The number of single-family home sales in FMLS Area 72-75 increased 9% on a year-over-year basis from 1876 in Q3 2019 to 2040 in Q3 2020.

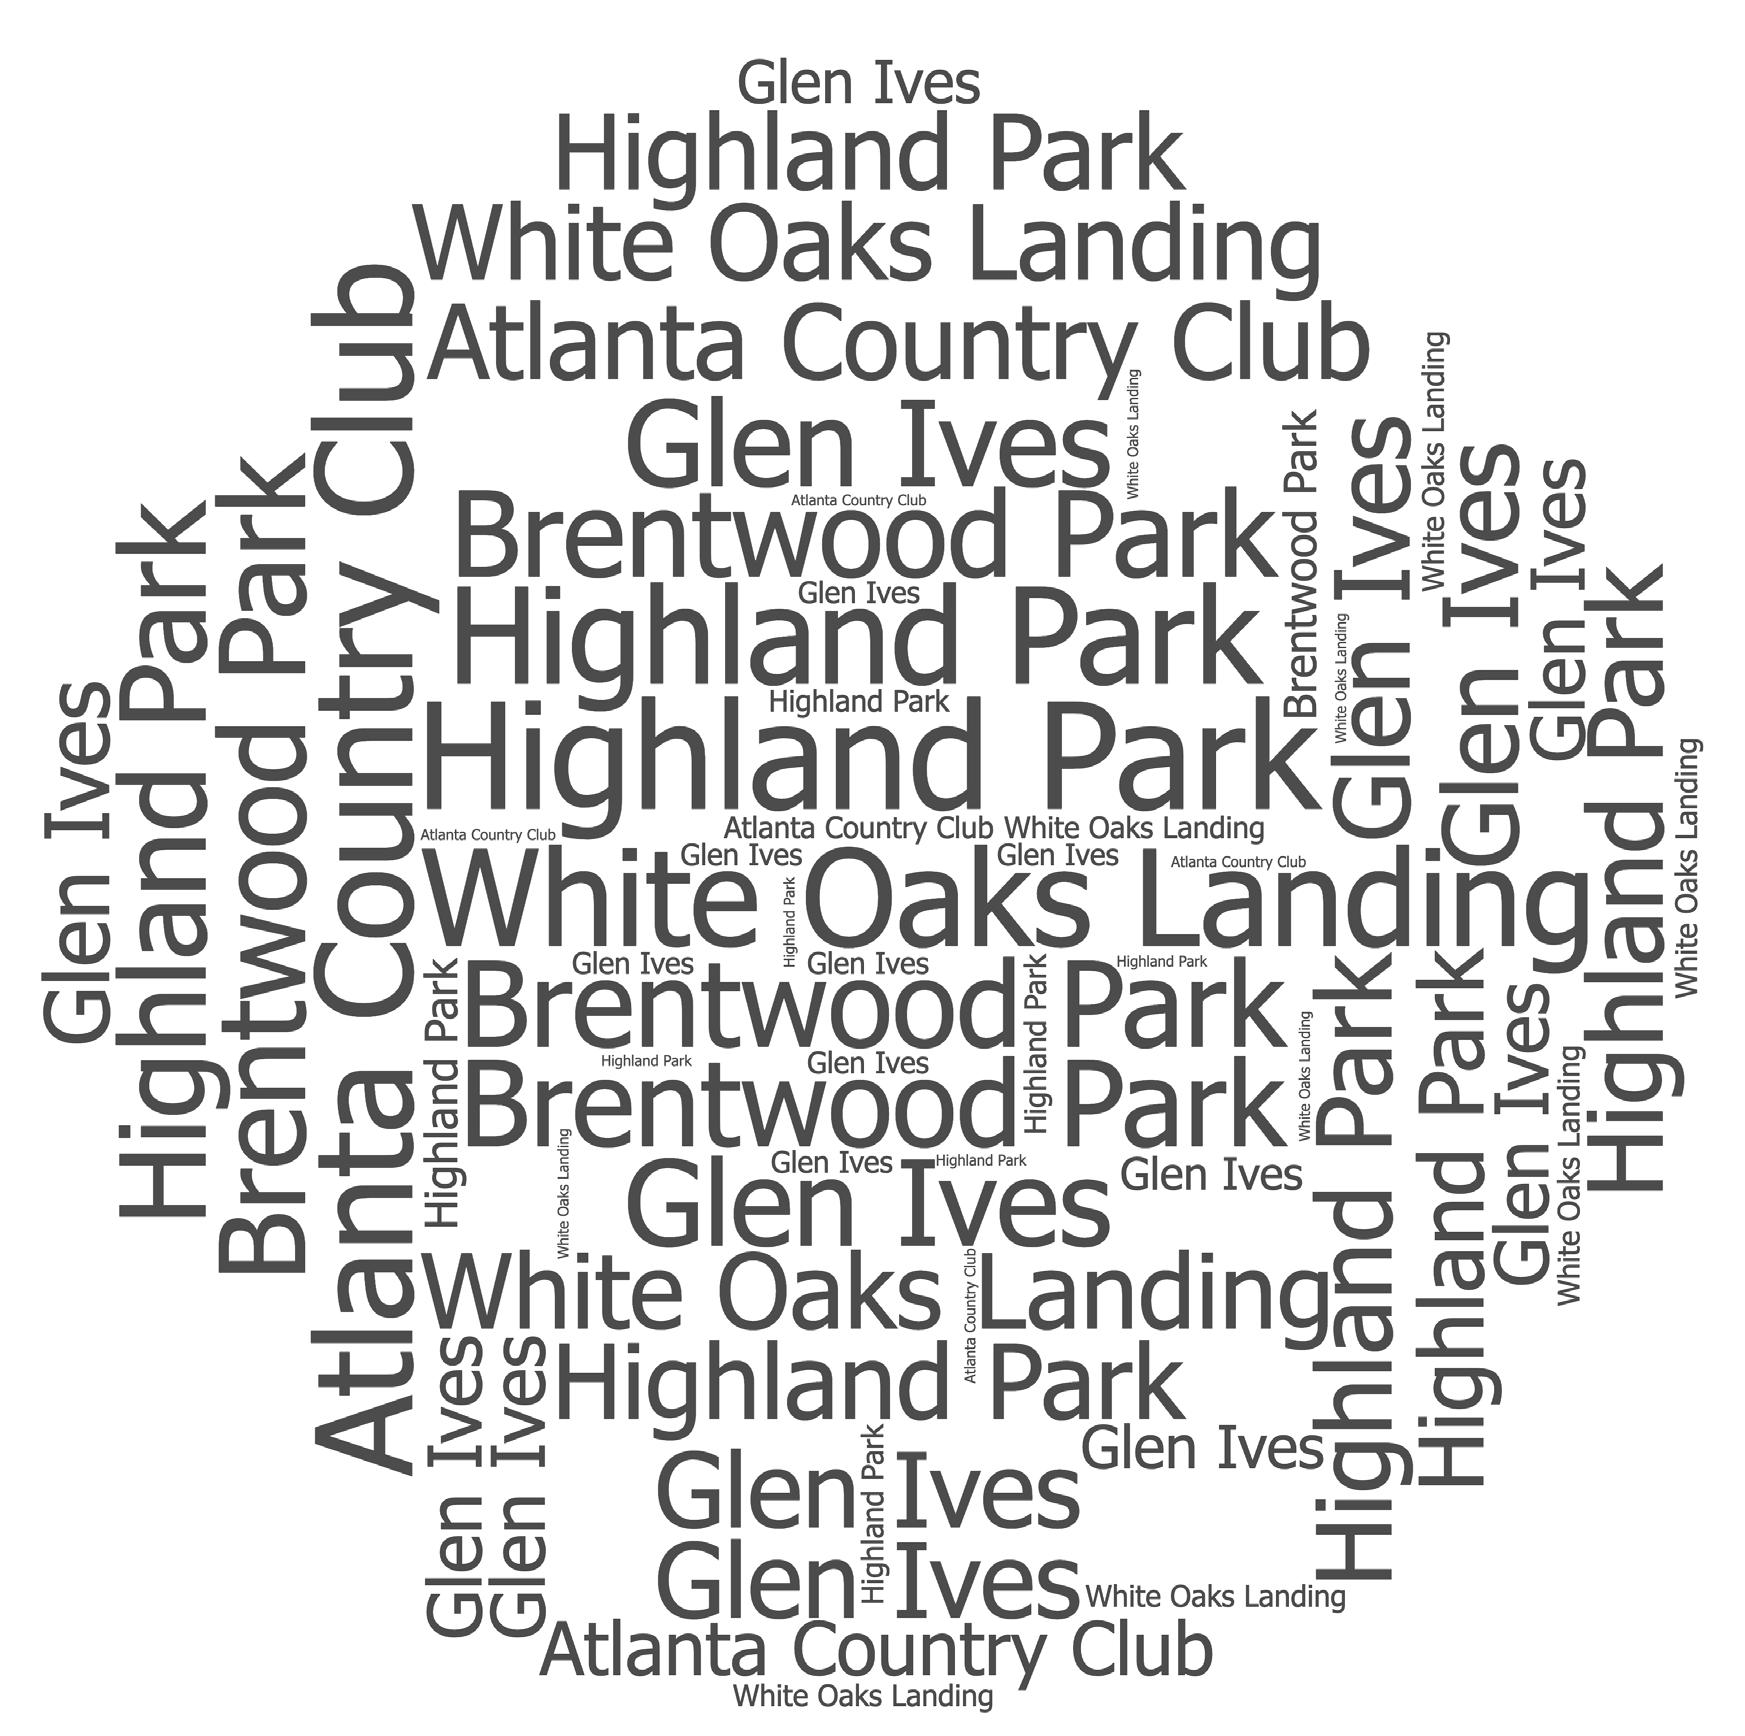
The following table shows activity for attached homes (condos and townhomes) in FMLS Areas 81-83 from July, 1 2020 thru September, 30 2020.
Source: FMLS Absorption Analysis Report Trailing 3 Months from 9/30/20
The following table shows activity for detached homes (single family) in FMLS Areas 81-83 from July, 1 2020 thru September, 30 2020.
Source: FMLS Absorption Analysis Report Trailing 3 Months from 9/30/20
The number of active condo listings in FMLS Area 81-83 decreased 10% on a year-over-year basis from 192 in Q3 2019 to 172 in Q3 2020. The number of new condo listings in FMLS Area 81-83 increased 10% on a year-over-year basis from 94 in Q3 2019 to 103 in Q3 2020. The number of condo sales in FMLS Area 81-83 increased 12% on a year-over-year basis from 84 in Q3 2019 to 94 in Q3 2020. The months of inventory for condos in FMLS Area 81-83 decreased 21% on a year-over-year basis from 2.3 months in Q3 2019 to 1.8 months in Q3 2020.
MARKET ACTIVITY DASHBOARD | Q3 2020 vs Q3 2019
NUMBER OF ACTIVE LISTINGS
NUMBER OF NEW LISTINGS
PRICE TO LIST PRICE RATIO
MEDIAN CUMULATIVE DAYS ON MARKET -7.8%
The number of active condo listings in FMLS Area 81-83 decreased 10% on a year-over-year basis from 192 in Q3 2019 to 172 in Q3 2020.
The number of new condo listings in FMLS Area 81-83 increased 10% on a year-over-year basis from 94 in Q3 2019 to 103 in Q3 2020.
The number of condo sales in FMLS Area 81-83 increased 12% on a yearover-year basis from 84 in Q3 2019 to 94 in Q3 2020.
The number of active townhome listings in FMLS Area 81-83 decreased 10% on a year-over-year basis from 190 in Q3 2019 to 171 in Q3 2020. The number of new townhome listings in FMLS Area 81-83 increased 21% on a yearover-year basis from 92 in Q3 2019 to 111 in Q3 2020. The number of townhome sales in FMLS Area 81-83 increased 36% on a year-over-year basis from 62 in Q3 2019 to 84 in Q3 2020. The months of inventory for townhomes in FMLS Area 81-83 decreased 36% on a year-over-year basis from 3.2 months in Q3 2019 to 2.1 months in Q3 2020.
MARKET ACTIVITY DASHBOARD | Q3 2020 vs Q3 2019
NUMBER OF ACTIVE LISTINGS
CUMULATIVE DAYS ON MARKET +8.9%
The number of active townhome listings in FMLS Area 81-83 decreased 10% on a year-over-year basis from 190 in Q3 2019 to 171 in Q3 2020.
The number of new townhome listings in FMLS Area 81-83 increased 21% on a year-over-year basis from 92 in Q3 2019 to 111 in Q3 2020.
The number of townhome sales in FMLS Area 81-83 increased 36% on a year-over-year basis from 62 in Q3 2019 to 84 in Q3 2020.
The number of active single-family listings in FMLS Area 81-83 decreased 27% on a year-over-year basis from 2656 in Q3 2019 to 1939 in Q3 2020. The number of new single-family home listings in FMLS Area 81-83 increased 5% on a year-over-year basis from 1078 in Q3 2020 to 1128 in Q3 2020. The number of single-family home sales in FMLS Area 81-83 increased 11% on a year-over-year basis from 859 in Q3 2019 to 955 in Q3 2020. The months of inventory for single-family homes in FMLS Area 81-83 decreased 36% on a year-over-year basis from 3.2 months in Q3 2019 to 2 months in Q3 2020.
NUMBER OF ACTIVE LISTINGS
NUMBER OF CLOSINGS
NUMBER OF NEW LISTINGS
MONTHS OF INVENTORY -35.6% MEDIAN SALE PRICE -16.5% AVERAGE SALE PRICE +12.2%
SALES PRICE TO LIST PRICE RATIO +0.8%
MEDIAN CUMULATIVE DAYS ON MARKET -36.8%
The number of active single-family listings in FMLS Area 81-83 decreased 27% on a year-over-year basis from 2656 in Q3 2019 to 1939 in Q3 2020.
The number of new single-family home listings in FMLS Area 81-83 increased 5% on a year-over-year basis from 1078 in Q3 2020 to 1128 in Q3 2020.
The number of single-family home sales in FMLS Area 81-83 increased 11% on a year-over-year basis from 859 in Q3 2019 to 955 in Q3 2020.


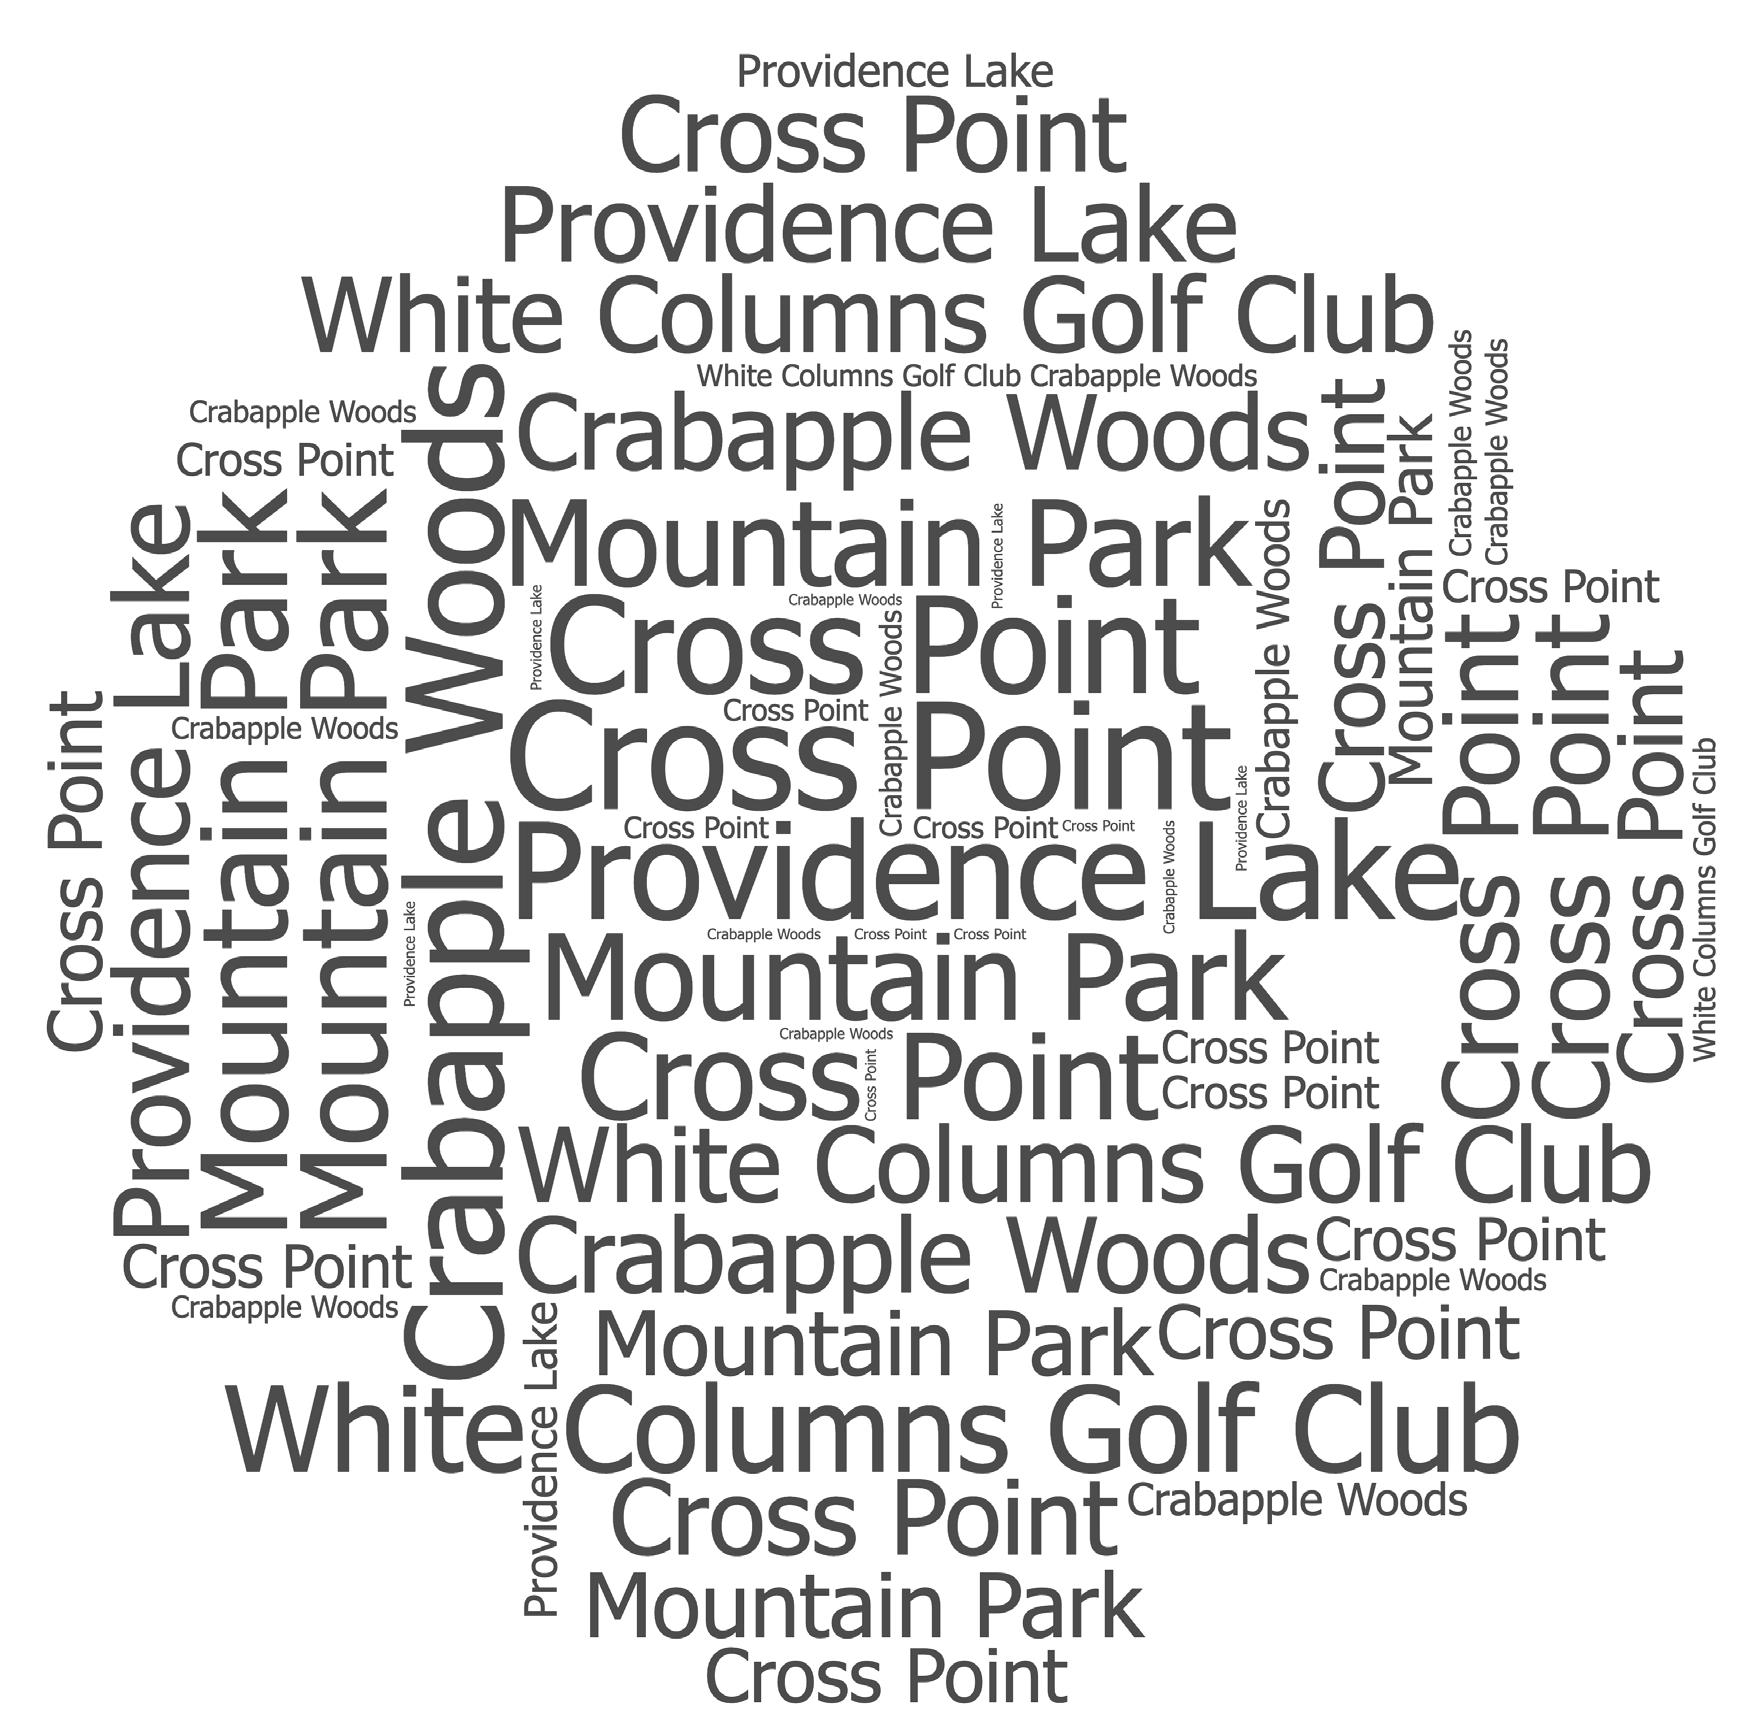
The following table shows activity for attached homes (condos and townhomes) in FMLS Area 13 from July, 1 2020 thru September, 30 2020.
Source: FMLS Absorption Analysis Report Trailing 3 Months from 9/30/20
The following table shows activity for detached homes (single family) in FMLS Area 13 from July, 1 2020 thru September, 30 2020.
Source: FMLS Absorption Analysis Report Trailing 3 Months from 9/30/20
The number of active townhome listings in FMLS Area 13 decreased 9% on a year-over-year basis from 539 in Q3 2019 to 493 in Q3 2020. The number of new townhome listings in FMLS Area 13 increased 13% on a year-over-year basis from 224 in Q3 2019 to 252 in Q3 2020. The number of townhome sales in FMLS Area 13 increased 3% on a year-over-year basis from 177 in Q3 2019 to 182 in Q3 2020. The months of inventory for townhomes in FMLS Area 13 decreased 10% on a year-over-year basis from 3.1 months in Q3 2019 to 2.8 months in Q3 2020.
MARKET ACTIVITY DASHBOARD | Q3 2020 vs Q3 2019
NUMBER OF ACTIVE LISTINGS -8.5%
NUMBER OF NEW LISTINGS +12.5%
NUMBER OF CLOSINGS
MONTHS OF INVENTORY -9.5% MEDIAN SALE PRICE
AVERAGE SALE PRICE +1.4% SALES PRICE TO LIST PRICE RATIO +0.3%
MEDIAN CUMULATIVE DAYS ON MARKET -6.3%
The number of active townhome listings in FMLS Area 13 decreased 9% on a year-over-year basis from 539 in Q3 2019 to 493 in Q3 2020.
The number of new townhome listings in FMLS Area 13 increased 13% on a year-over-year basis from 224 in Q3 2019 to 252 in Q3 2020.
The number of townhome sales in FMLS Area 13 increased 3% on a yearover-year basis from 177 in Q3 2019 to 182 in Q3 2020.
The number of active single-family listings in FMLS Area 13 decreased 30% on a year-over-year basis from 2115 in Q3 2019 to 1487 in Q3 2020. The number of new single-family home listings in FMLS Area 13 increased 1% on a year-over-year basis from 758 in Q3 2019 to 762 in Q3 2020. The number of single-family home sales in FMLS Area 13 increased 23% on a year-over-year basis from 520 in Q3 2019 to 639 in Q3 2020. The months of inventory for single-family homes in FMLS Area 13 decreased 44% on a year-over-year basis from 4.2 months in Q3 2019 to 2.4 months in Q3 2020.
NUMBER OF ACTIVE LISTINGS
AVERAGE SALE PRICE
SALES PRICE TO LIST PRICE RATIO +2.5% MEDIAN CUMULATIVE DAYS ON MARKET -38.9%
The number of active single-family listings in FMLS Area 13 decreased 30% on a year-over-year basis from 2115 in Q3 2019 to 1487 in Q3 2020.
The number of new single-family home listings in FMLS Area 13 increased 1% on a year-over-year basis from 758 in Q3 2019 to 762 in Q3 2020.
The number of single-family home sales in FMLS Area 13 increased 23% on a year-over-year basis from 520 in Q3 2019 to 639 in Q3 2020.


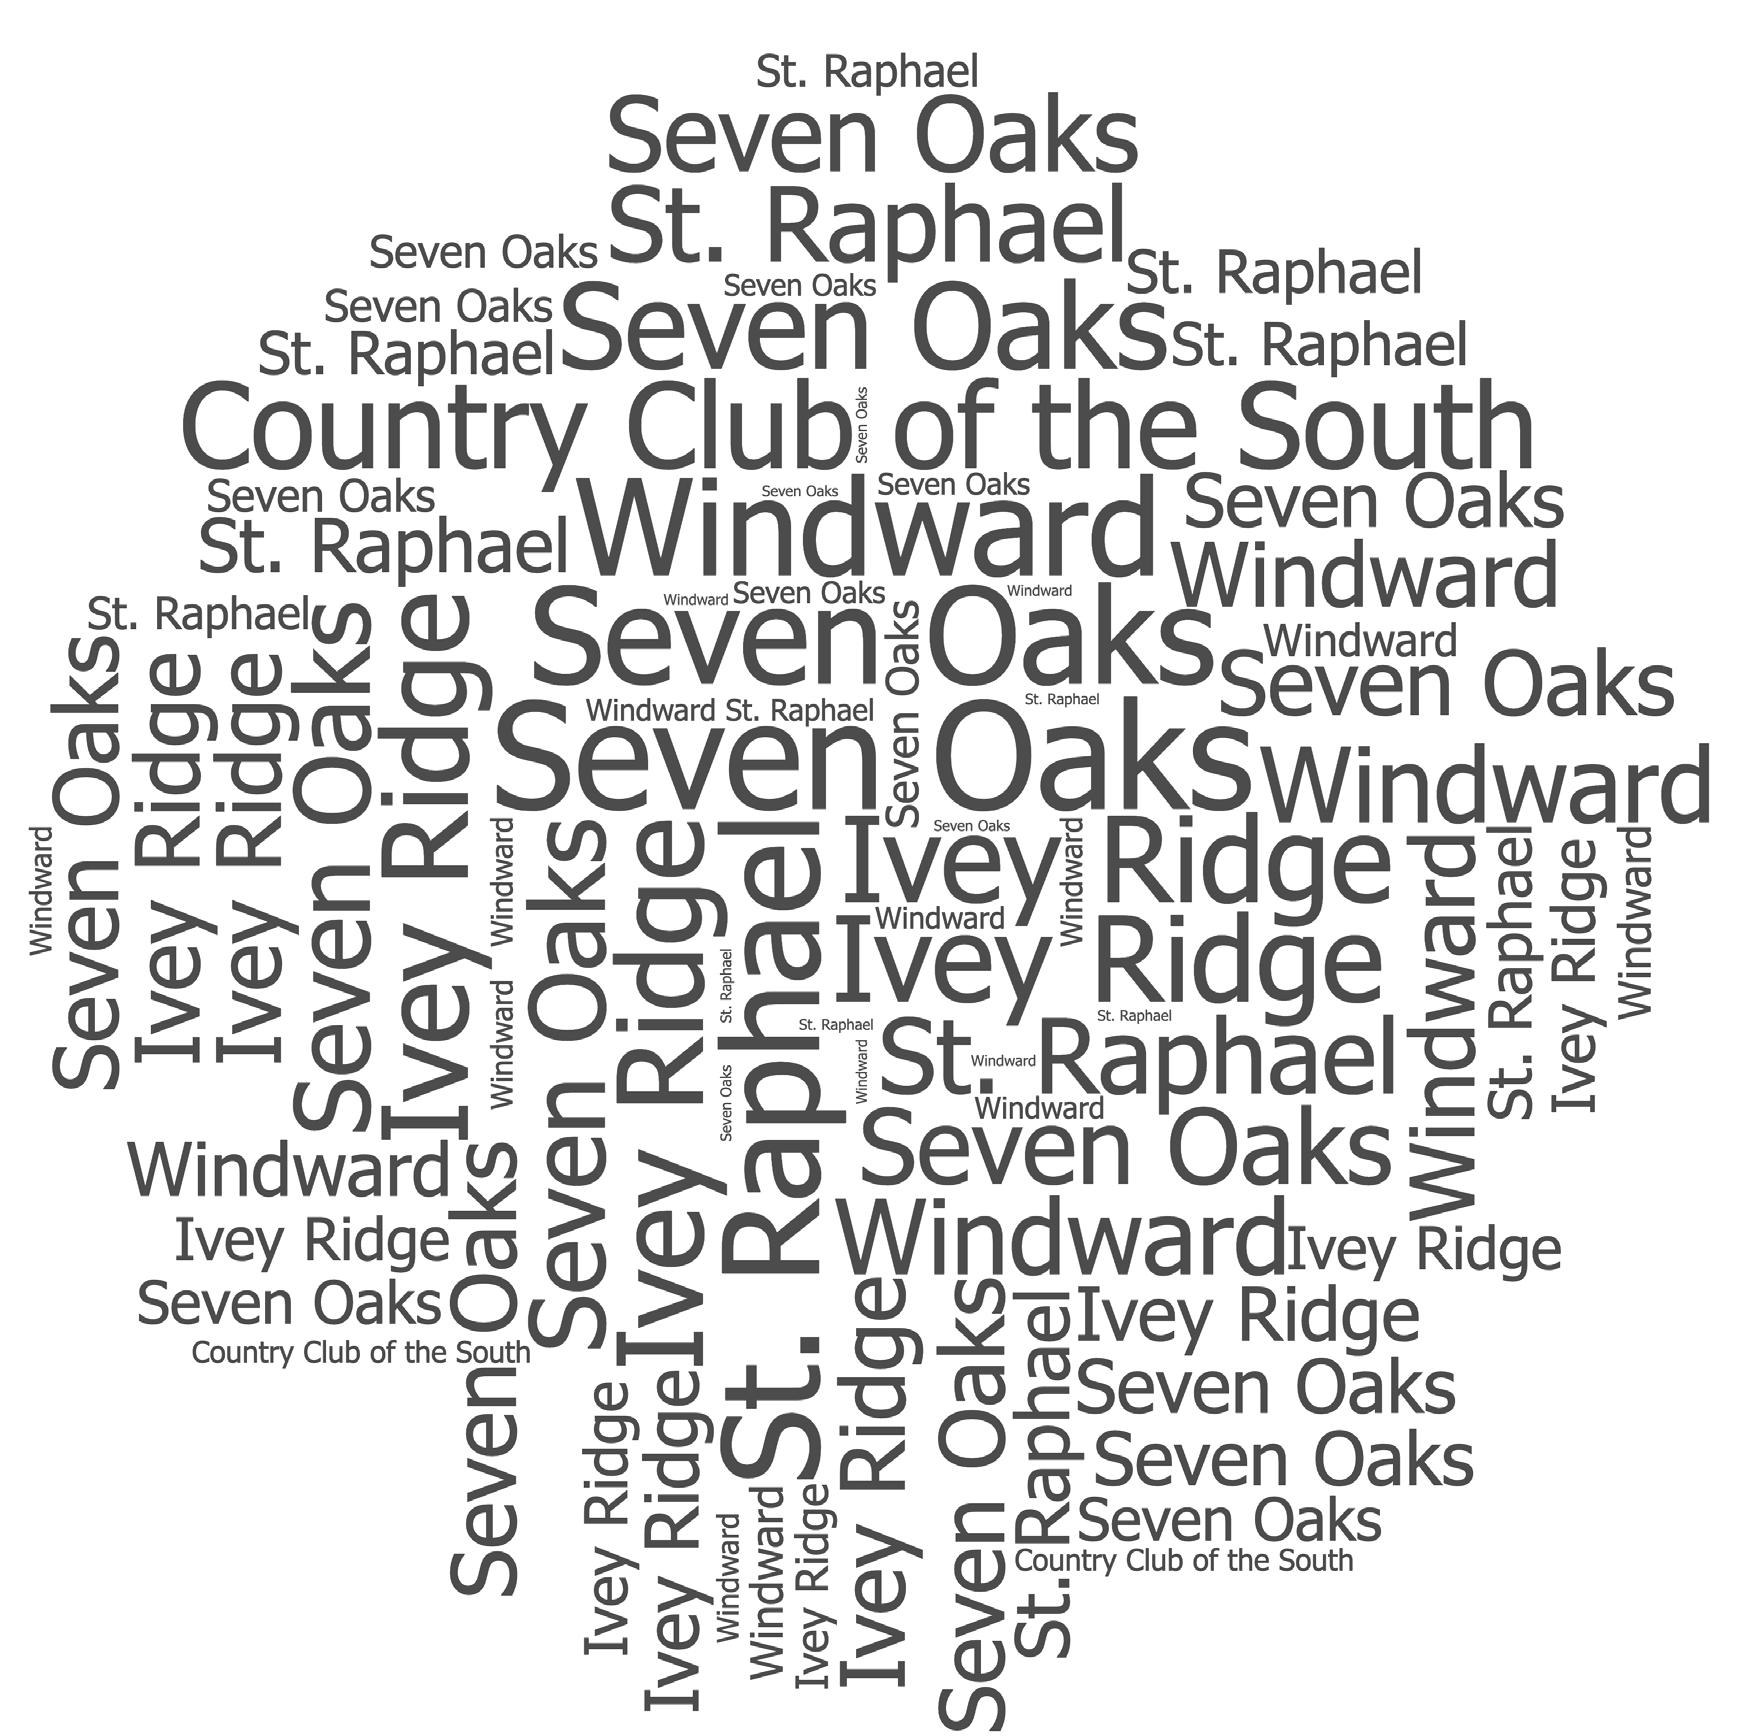
The following table shows activity for attached homes (condos and townhomes) in FMLS Area 14 from July, 1 2020 thru September, 30 2020.
Source: FMLS Absorption Analysis Report Trailing 3 Months from 9/30/20
The following table shows activity for detached homes (single family) in FMLS Area 14 from July, 1 2020 thru September, 30 2020.
Source: FMLS Absorption Analysis Report Trailing 3 Months from 9/30/20
The number of active townhome listings in FMLS Area 14 decreased 39% on a year-over-year basis from 267 in Q3 2019 to 162 in Q3 2020. The number of new townhome listings in FMLS Area 14 decreased 13% on a year-over-year basis from 112 in Q3 2019 to 97 in Q3 2020. The number of townhome sales in FMLS Area 13 decreased 20% on a year-over-year basis from 89 in Q3 2019 to 71 in Q3 2020. The months of inventory for townhomes in FMLS Area 14 decreased 24% on a year-over-year basis from 3.1 months in Q3 2019 to 2.4 months in Q3 2020.
MARKET ACTIVITY DASHBOARD | Q3 2020 vs Q3 2019
NUMBER OF ACTIVE LISTINGS -39.3%
NUMBER OF CLOSINGS
NUMBER OF NEW LISTINGS -13.4%
MONTHS OF INVENTORY -23.5%
SALE PRICE
SALE PRICE +2.5% SALES PRICE TO LIST PRICE RATIO +2.0%
MEDIAN CUMULATIVE DAYS ON MARKET -36.4%
The number of active townhome listings in FMLS Area 14 decreased 39% on a year-over-year basis from 267 in Q3 2019 to 162 in Q3 2020.
The number of new townhome listings in FMLS Area 14 decreased 13% on a year-over-year basis from 112 in Q3 2019 to 97 in Q3 2020.
The number of townhome sales in FMLS Area 13 decreased 20% on a year-over-year basis from 89 in Q3 2019 to 71 in Q3 2020.
The number of active single-family listings in FMLS Area 14 decreased 46% on a year-over-year basis from 2120 in Q3 2020 to 1139 in Q3 2020. The number of new single-family home listings in FMLS Area 14 decreased 14% on a year-over-year basis from 788 in Q3 2019 to 680 in Q3 2020. The number of single-family home sales in FMLS Area 14 increased 17% on a year-over-year basis from 577 in Q3 2019 to 675 in Q3 2020. The months of inventory for single-family homes in FMLS Area 14 decreased 56% on a year-over-year basis from 3.8 months in Q3 2019 to 1.7 months in Q3 2020.
NUMBER OF ACTIVE LISTINGS
PRICE TO LIST PRICE RATIO
MEDIAN CUMULATIVE DAYS ON MARKET -24.7%
The number of active single-family listings in FMLS Area 14 decreased 46% on a year-over-year basis from 2120 in Q3 2020 to 1139 in Q3 2020.
The number of new single-family home listings in FMLS Area 14 decreased 14% on a year-over-year basis from 788 in Q3 2019 to 680 in Q3 2020.
The number of single-family home sales in FMLS Area 14 increased 17% on a year-over-year basis from 577 in Q3 2019 to 675 in Q3 2020.


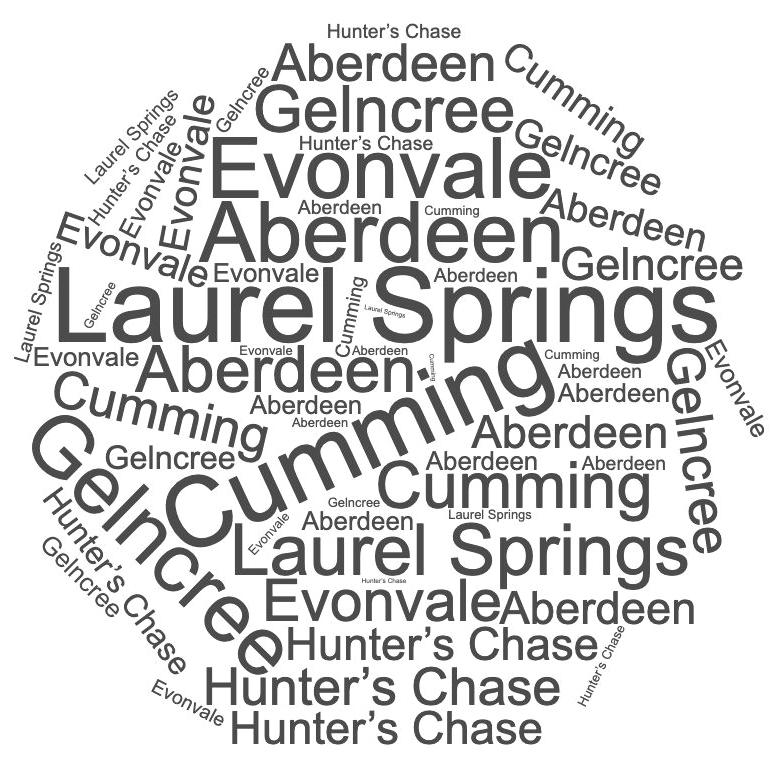
First Multiple Listing Service (FMLS) Area 221 and 222 encompasses most of Forsyth County’s area surrounding the city of Cumming. It includes Laurel Springs, Evonvale, Gelncree, Aberdeen, and numerous other neighborhoods. FMLS Area 221 and 222 are bound by the Forsyth county lines on south and west sides, and the city of Cumming lines on the north and east.
The following table shows activity for attached homes (condos and townhomes) in FMLS Area 13 from July, 1 2020 thru September, 30 2020.
Source: FMLS Absorption Analysis Report Trailing 3 Months from 9/30/20
The following table shows activity for detached homes (single family) in FMLS Area 13 from July, 1 2020 thru September, 30 2020.
Source: FMLS Absorption Analysis Report Trailing 3 Months from 9/30/20
The number of active condo listings in FMLS Area 221-222 decreased 26% on a year-over-year basis from 65 in Q3 2019 to 48 in Q3 2020. The number of new condo listings in FMLS Area 221-222 decreased 13% on a year-over-year basis from 32 in Q3 2019 to 28 in Q3 2020. The number of condo sales in FMLS Area 221-222 decreased 9% on a year-over-year basis from 32 in Q3 2019 to 29 in Q3 2020. The months of inventory for condos in FMLS Area 221-222 decreased 16% on a year-over-year basis from 2 months in Q3 2019 to 1.7 months in Q3 2020.
MARKET ACTIVITY DASHBOARD | Q3 2020 vs Q3 2019
NUMBER OF ACTIVE LISTINGS -26.2%
NUMBER OF NEW LISTINGS -12.5%
NUMBER OF CLOSINGS -9.4% MONTHS OF INVENTORY -15.7% MEDIAN SALE PRICE
AVERAGE SALE PRICE +1.7% SALES PRICE TO LIST PRICE RATIO +0.3%
MEDIAN CUMULATIVE DAYS ON MARKET -58.4%
The number of active townhome listings in FMLS Area 221-222 decreased 24% on a year-over-year basis from 207 in Q3 2019 to 158 in Q3 2020. The number of new townhome listings in FMLS Area 221-222 decreased 7% on a year-over-year basis from 94 in Q3 2019 to 87 in Q3 2020. The number of townhome sales in FMLS Area 221222 increased 6% on a year-over-year basis from 82 in Q3 2019 to 87 in Q3 2020. The months of inventory for townhomes in FMLS Area 221-222 decreased 28% on a year-over-year basis from 2.6 months in Q3 2019 to 1.8 months in Q3 2020.
MARKET ACTIVITY DASHBOARD | Q3 2020 vs Q3 2019
NUMBER OF ACTIVE LISTINGS
NUMBER OF CLOSINGS
NUMBER OF NEW LISTINGS
MONTHS OF INVENTORY
SALES PRICE TO LIST PRICE RATIO
MEDIAN CUMULATIVE DAYS ON MARKET -34.0%
The number of active townhome listings in FMLS Area 221-222 decreased 24% on a year-over-year basis from 207 in Q3 2019 to 158 in Q3 2020.
The number of new townhome listings in FMLS Area 221-222 decreased 7% on a year-over-year basis from 94 in Q3 2019 to 87 in Q3 2020.
number of townhome sales in FMLS Area 221-222 increased 6% on a year-over-year basis from 82 in Q3 2019 to 87 in Q3 2020.
SUMMARY OF SINGLE-FAMILY DETACHED MARKET ACTIVITY
The number of active single-family listings in FMLS Area 221-222 decreased 51% on a year-over-year basis from 65 in Q3 2019 to 48 in Q3 2020. The number of new single-family home listings in FMLS Area 221-222 decreased 8% on a year-over-year basis from 32 in Q3 2019 to 28 in Q3 2020. The number of single-family home sales in FMLS Area 221-222 increased 20% on a year-over-year basis from 32 in Q3 2019 to 29 in Q3 2020. The months of inventory for single-family homes in FMLS Area 221-222 decreased 16% on a year-over-year basis from 2 months in Q3 2019 to 1.7 months in Q3 2020.
ACTIVITY DASHBOARD | Q3 2020 vs Q3 2019
NUMBER OF ACTIVE LISTINGS
PRICE TO LIST PRICE RATIO
MEDIAN CUMULATIVE DAYS ON MARKET -47.6%
The number of active single-family listings in FMLS Area 221-222 decreased 51% on a year-over-year basis from 65 in Q3 2019 to 48 in Q3 2020.
The number of new single-family home listings in FMLS Area 221-222 decreased 8% on a year-over-year basis from 32 in Q3 2019 to 28 in Q3 2020.
The number of single-family home sales in FMLS Area 221-222 increased 20% on a year-over-year basis from 32 in Q3 2019 to 29 in Q3 2020.
Source:

Source: 7/1/2020 – 9/30/2020 provided by FMLS
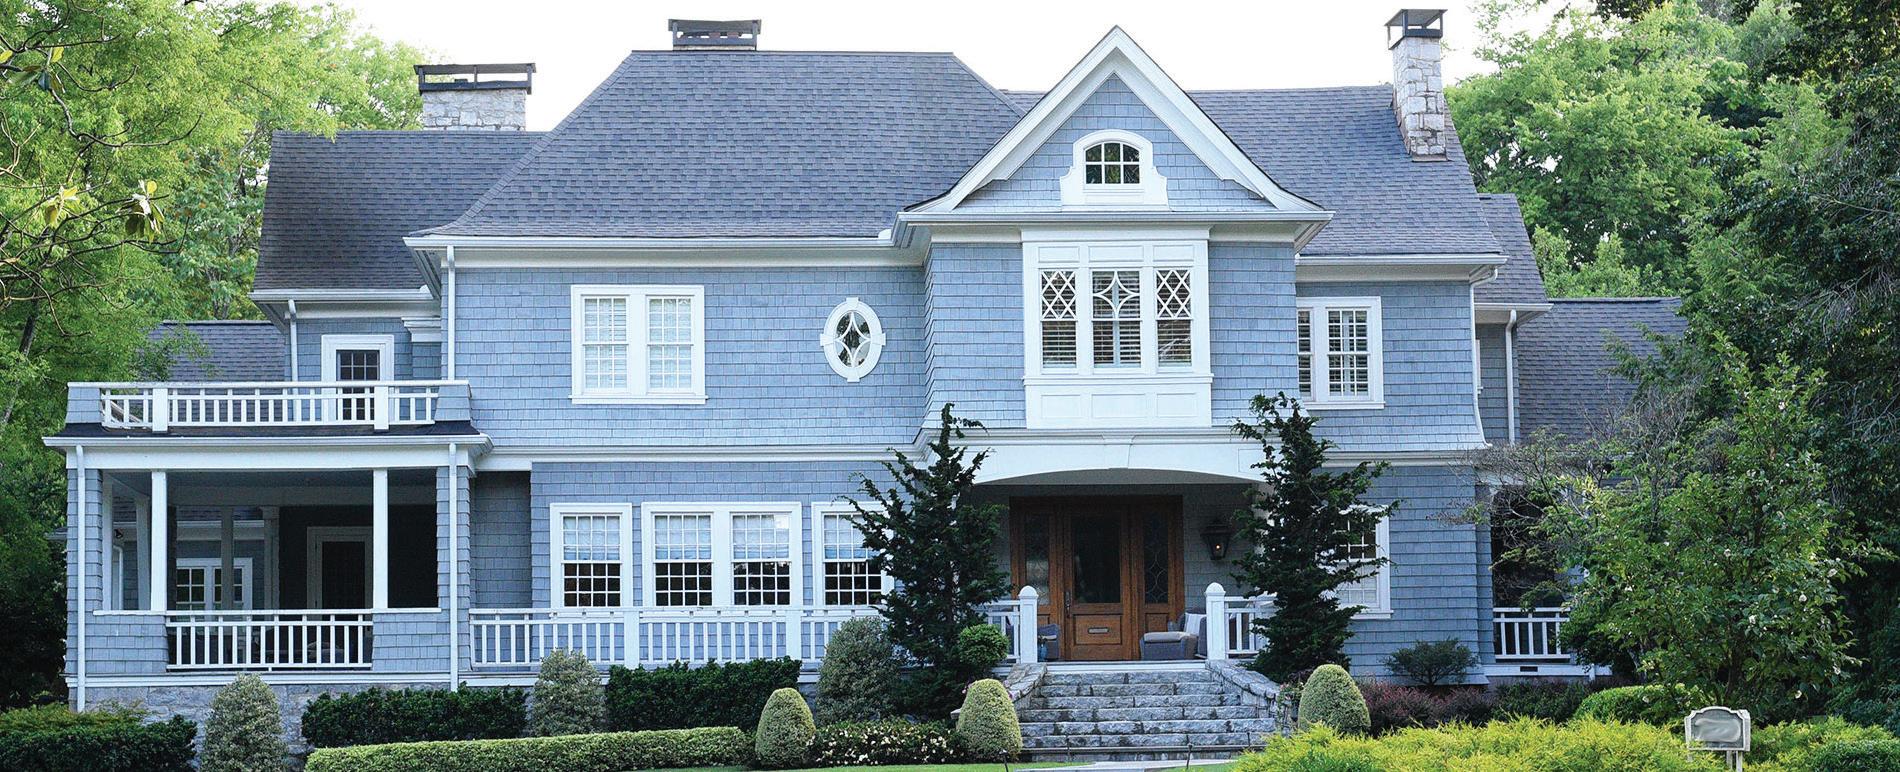
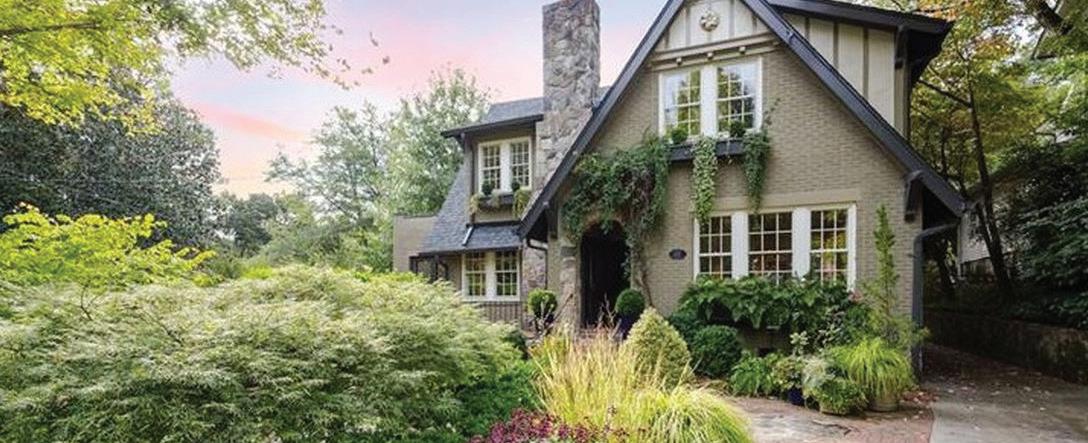
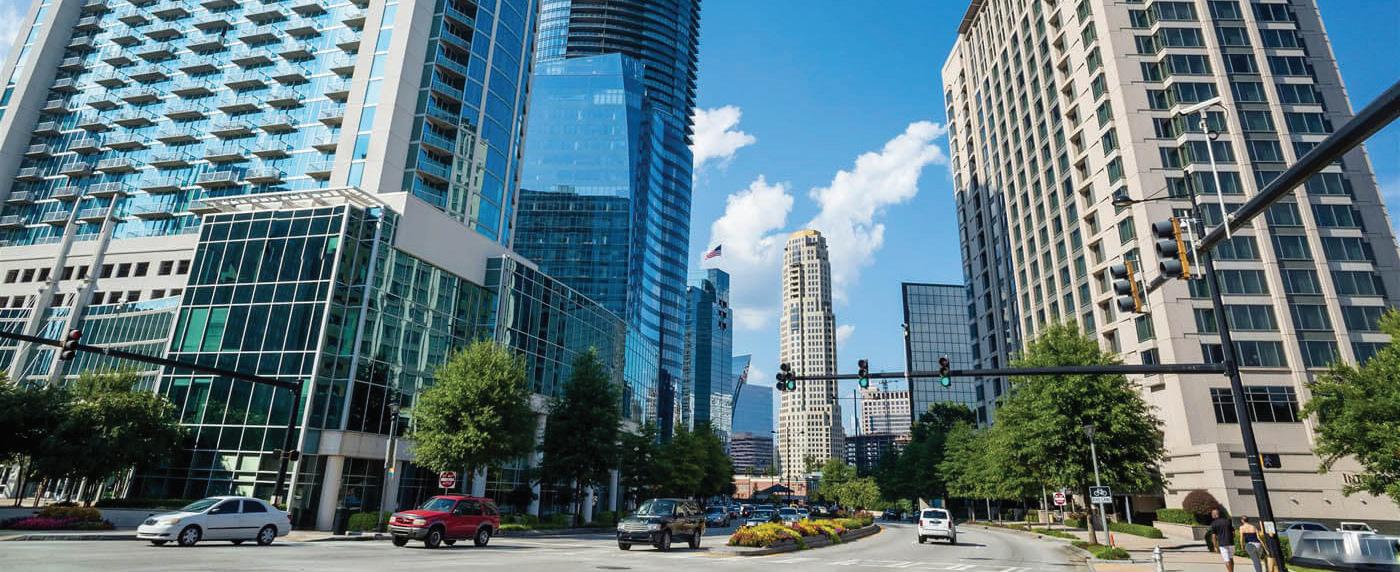

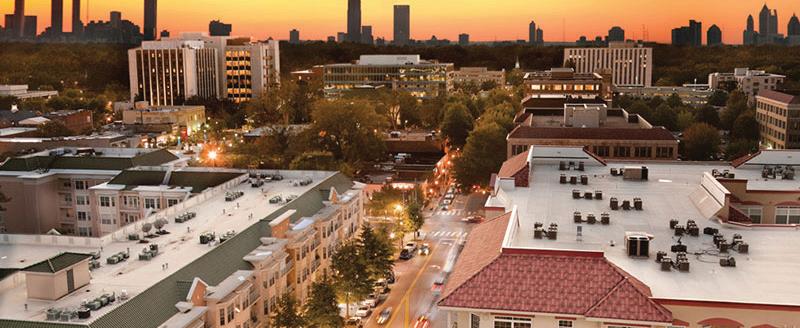

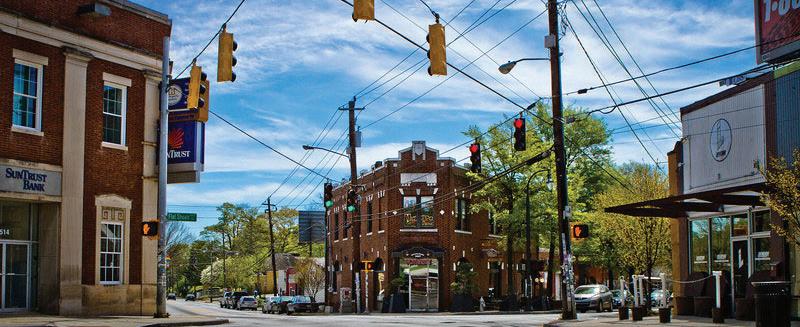
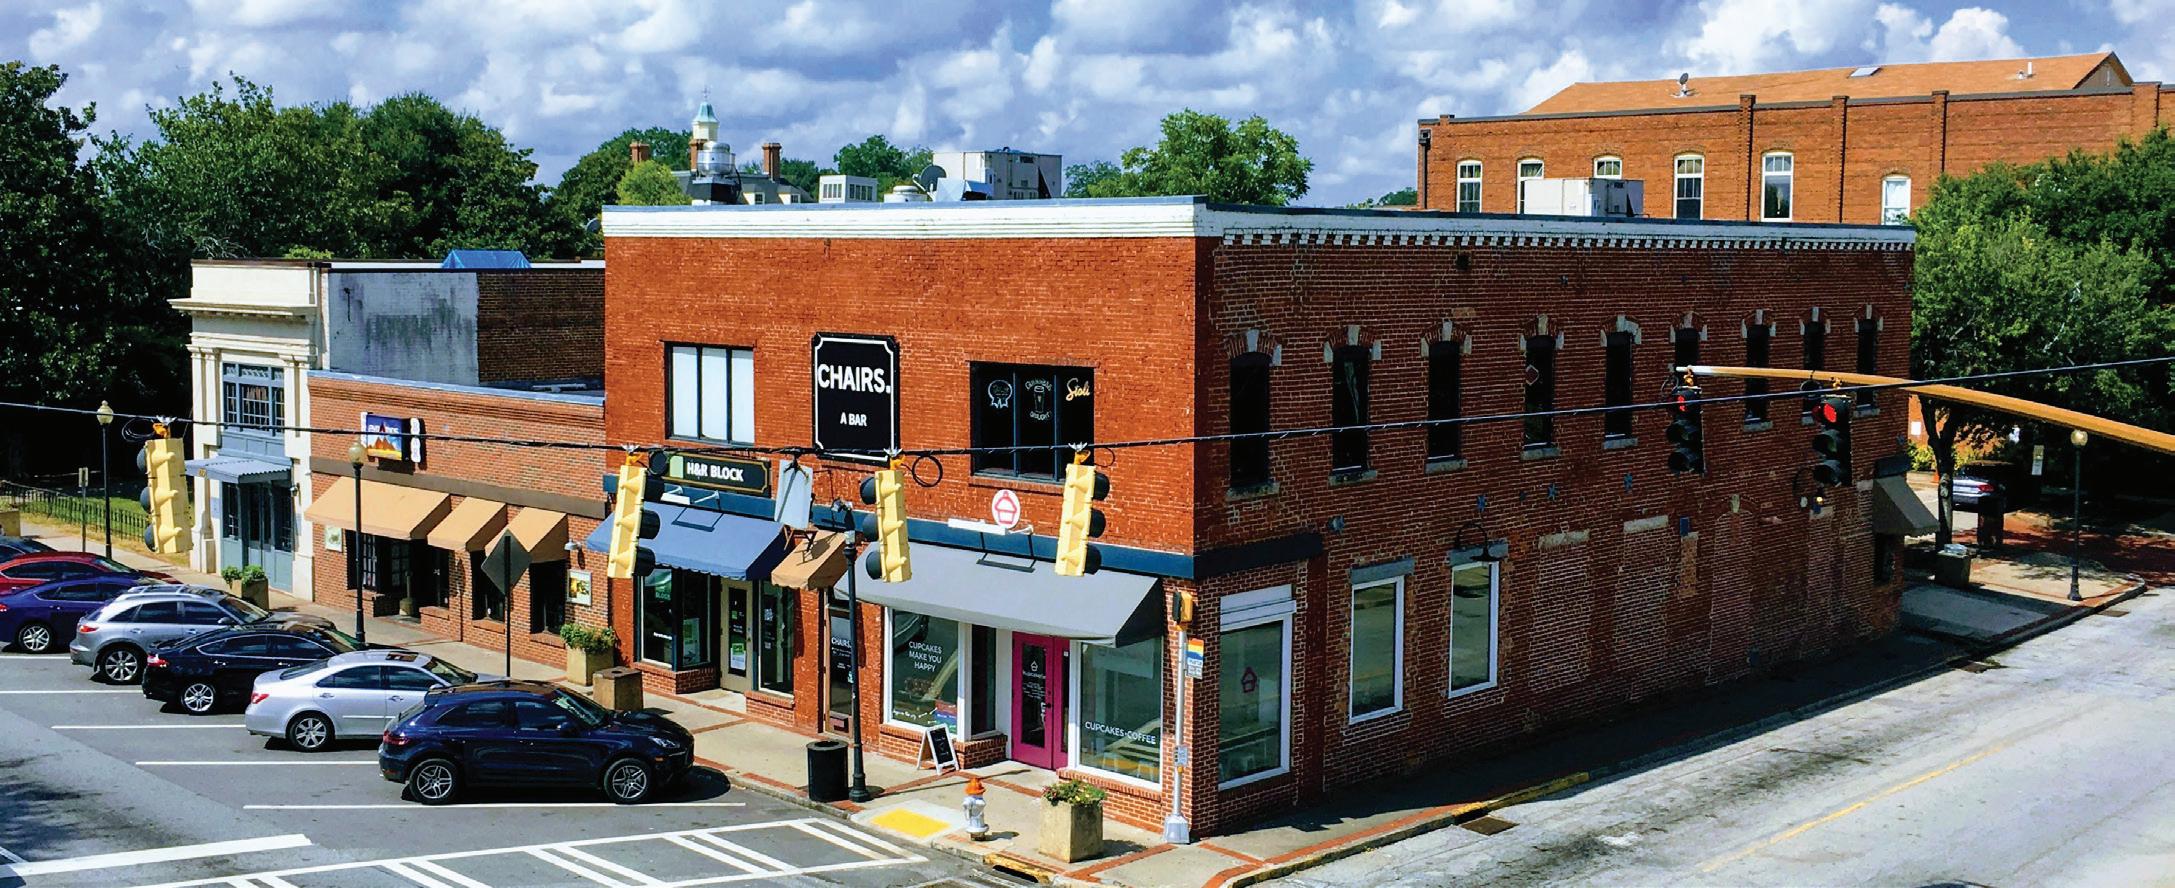





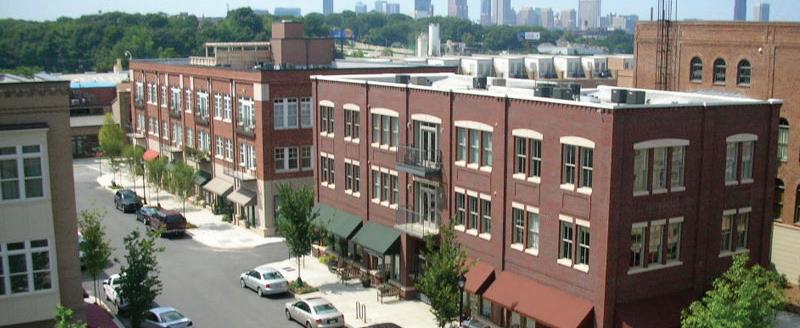

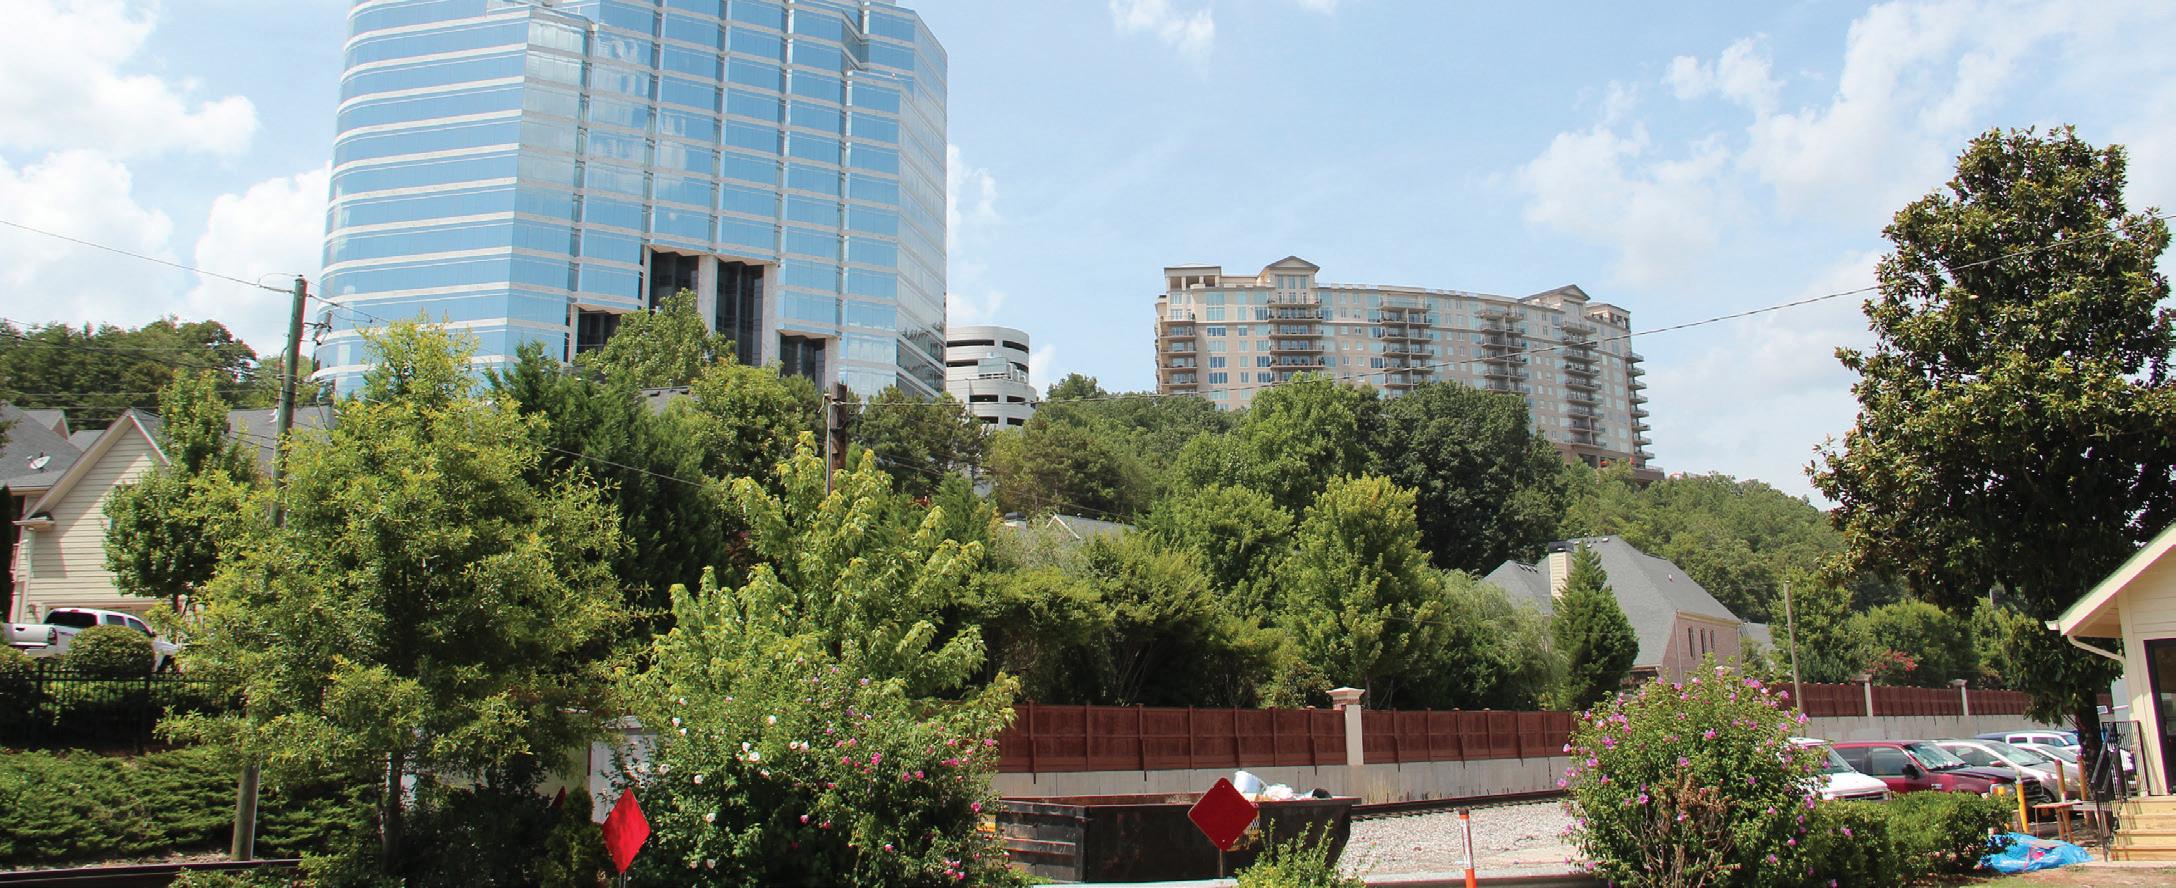
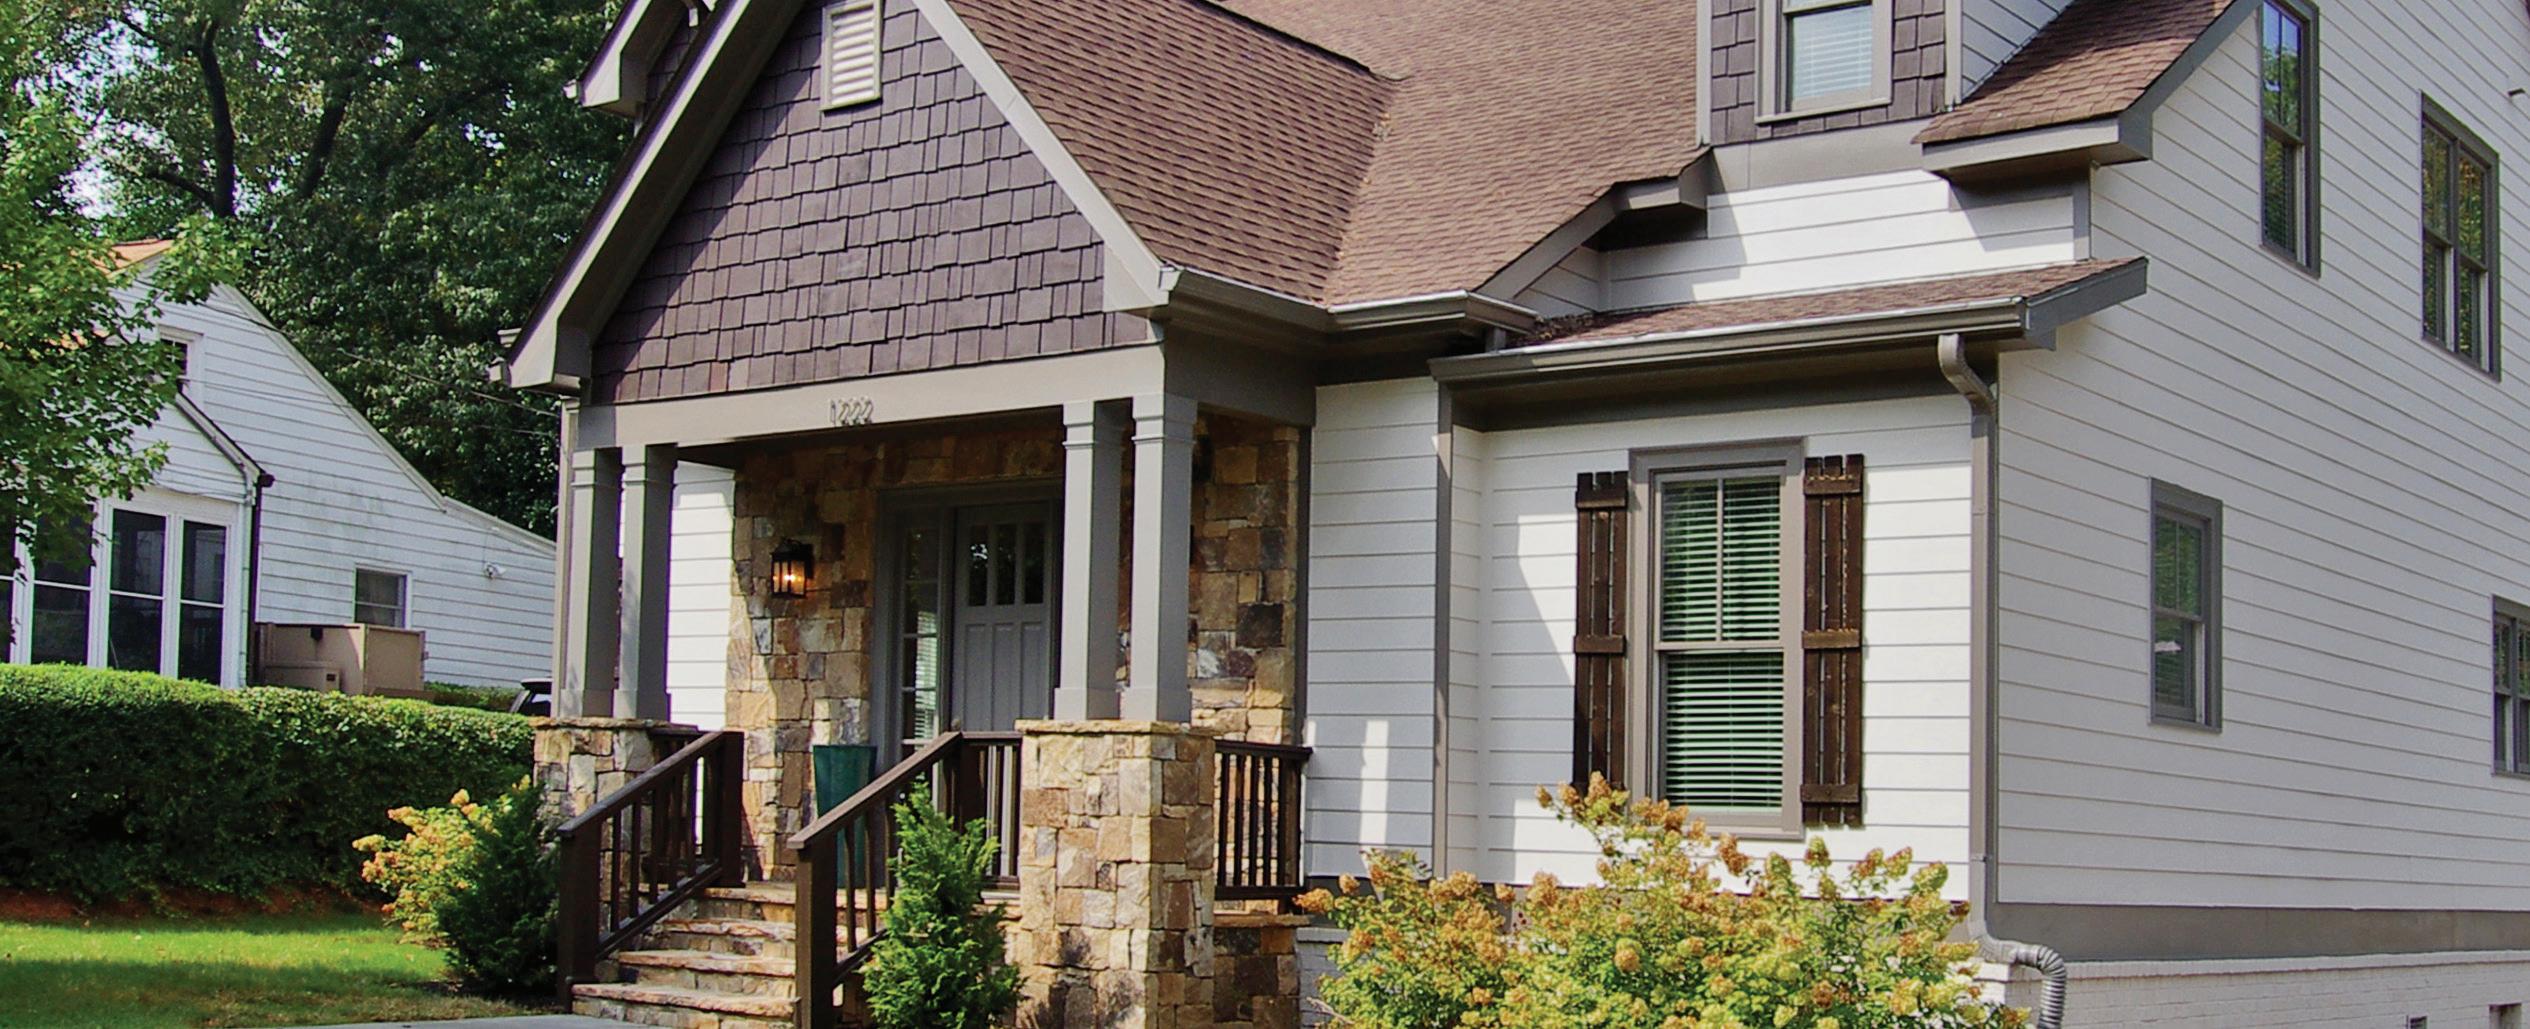
OUTSIDE THE PERIMETER
Source: 7/1/2020 – 9/30/2020 provided by FMLS


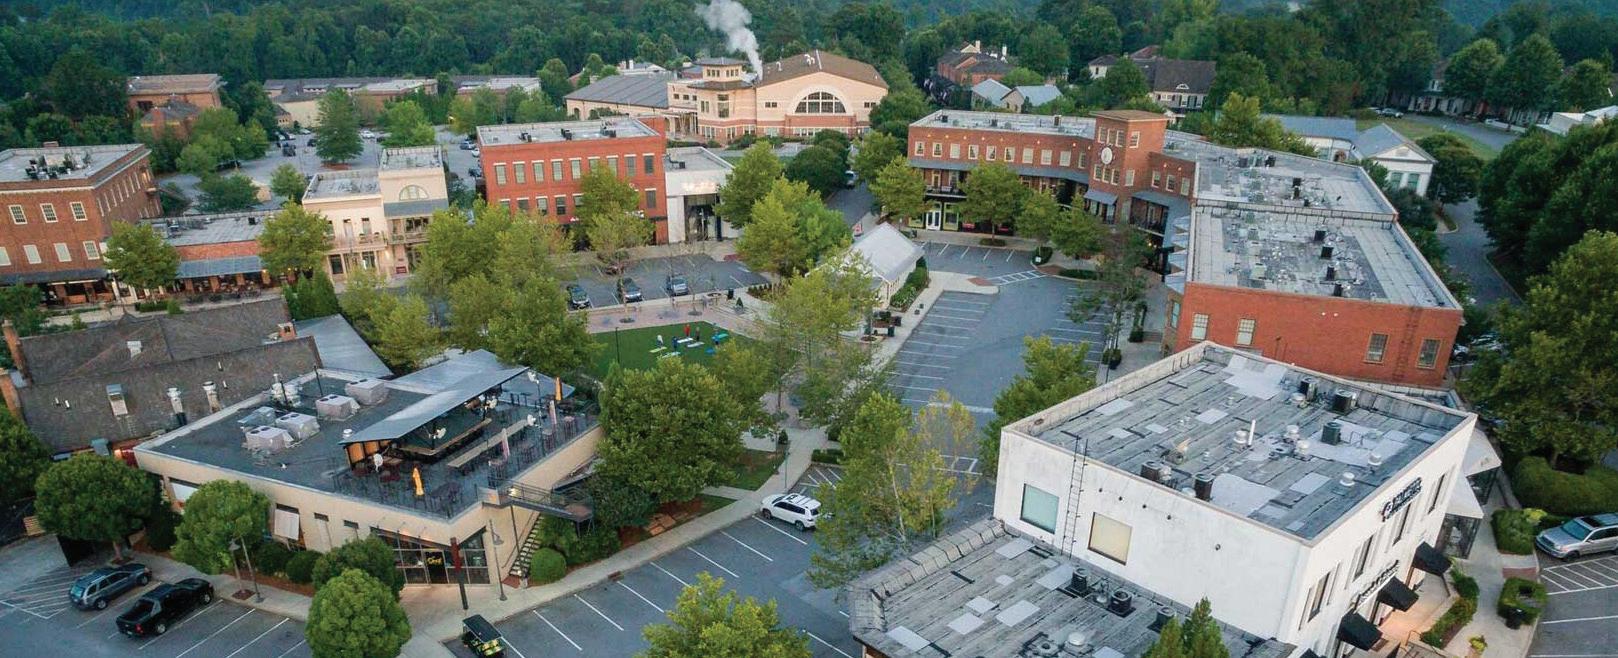

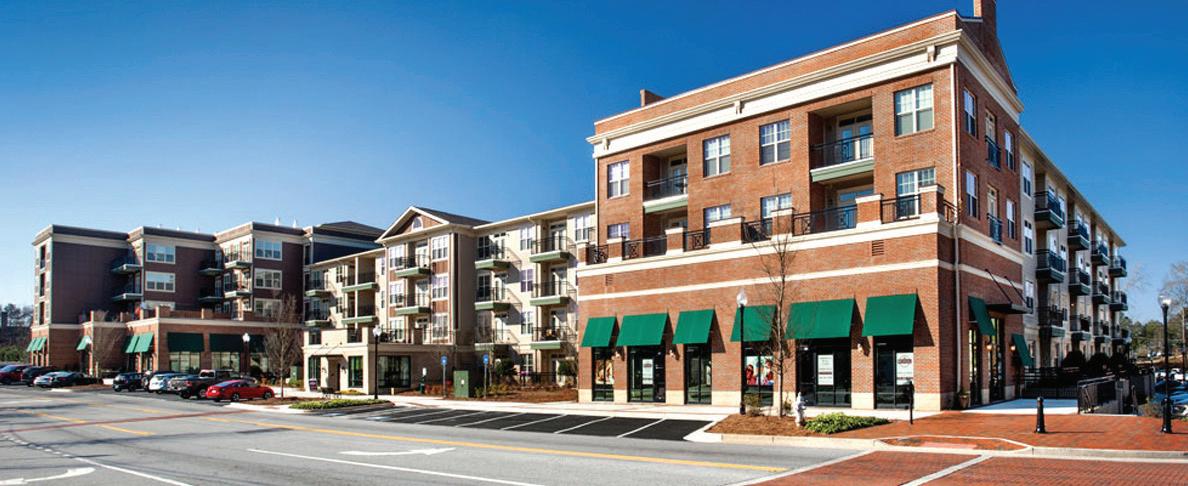

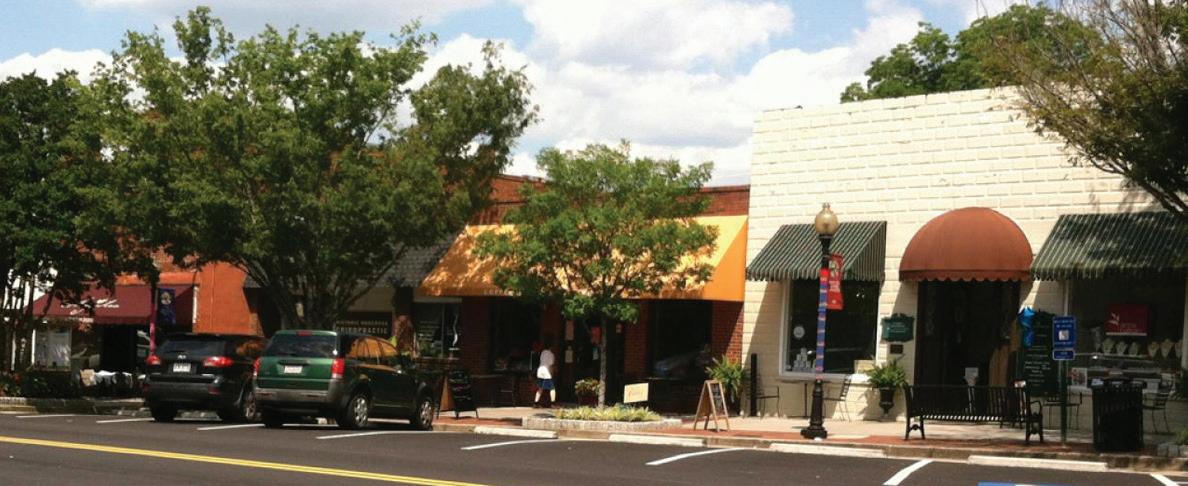


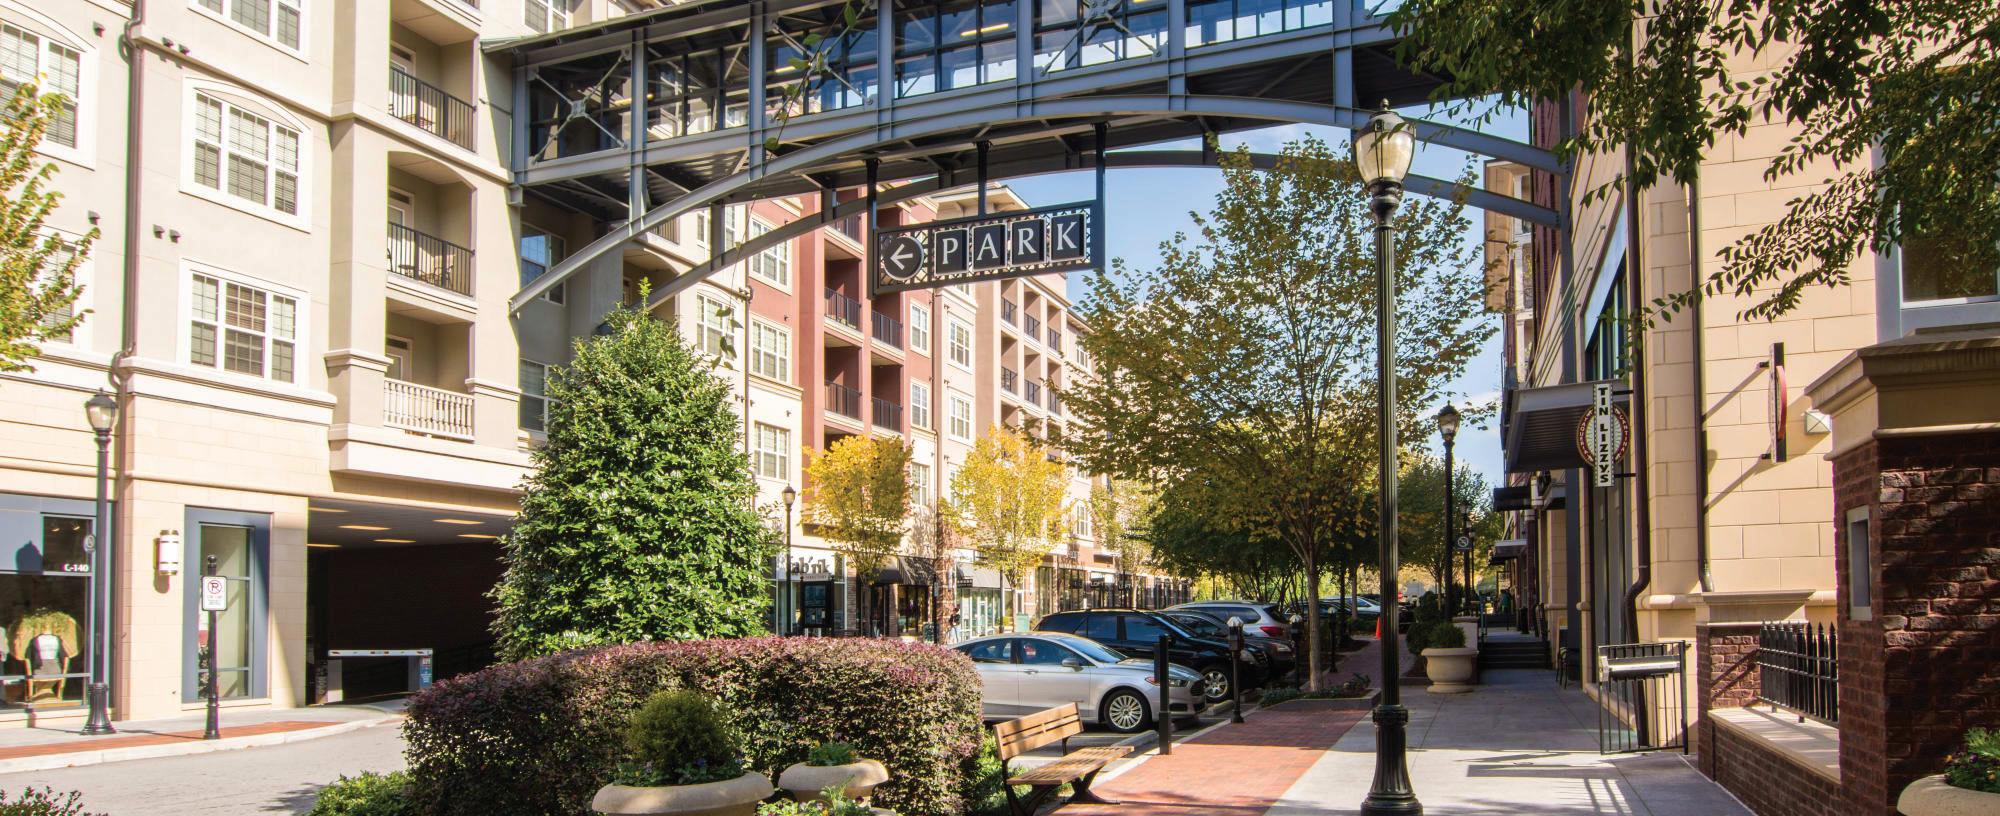


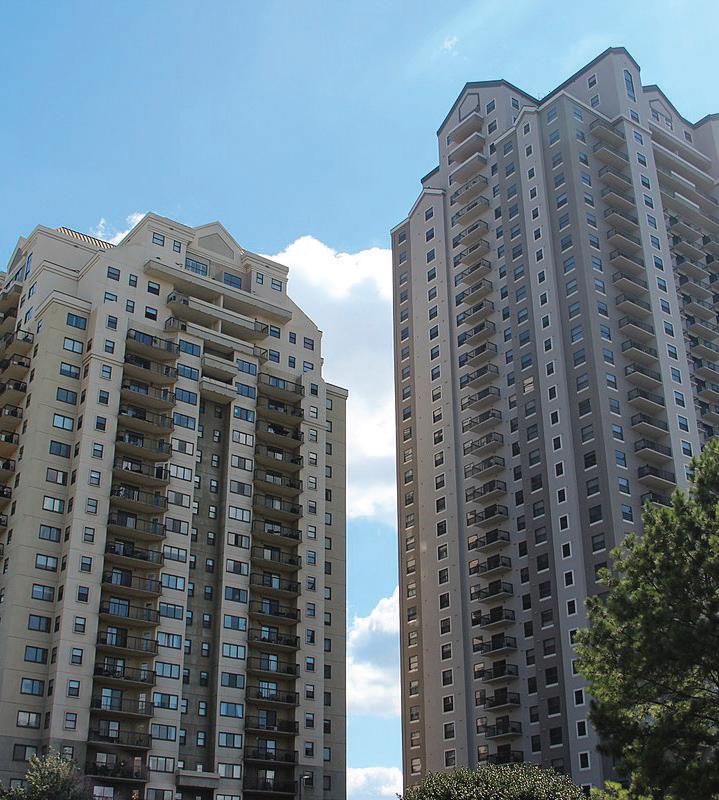
Source: 7/1/2020 – 9/30/2020 provided by

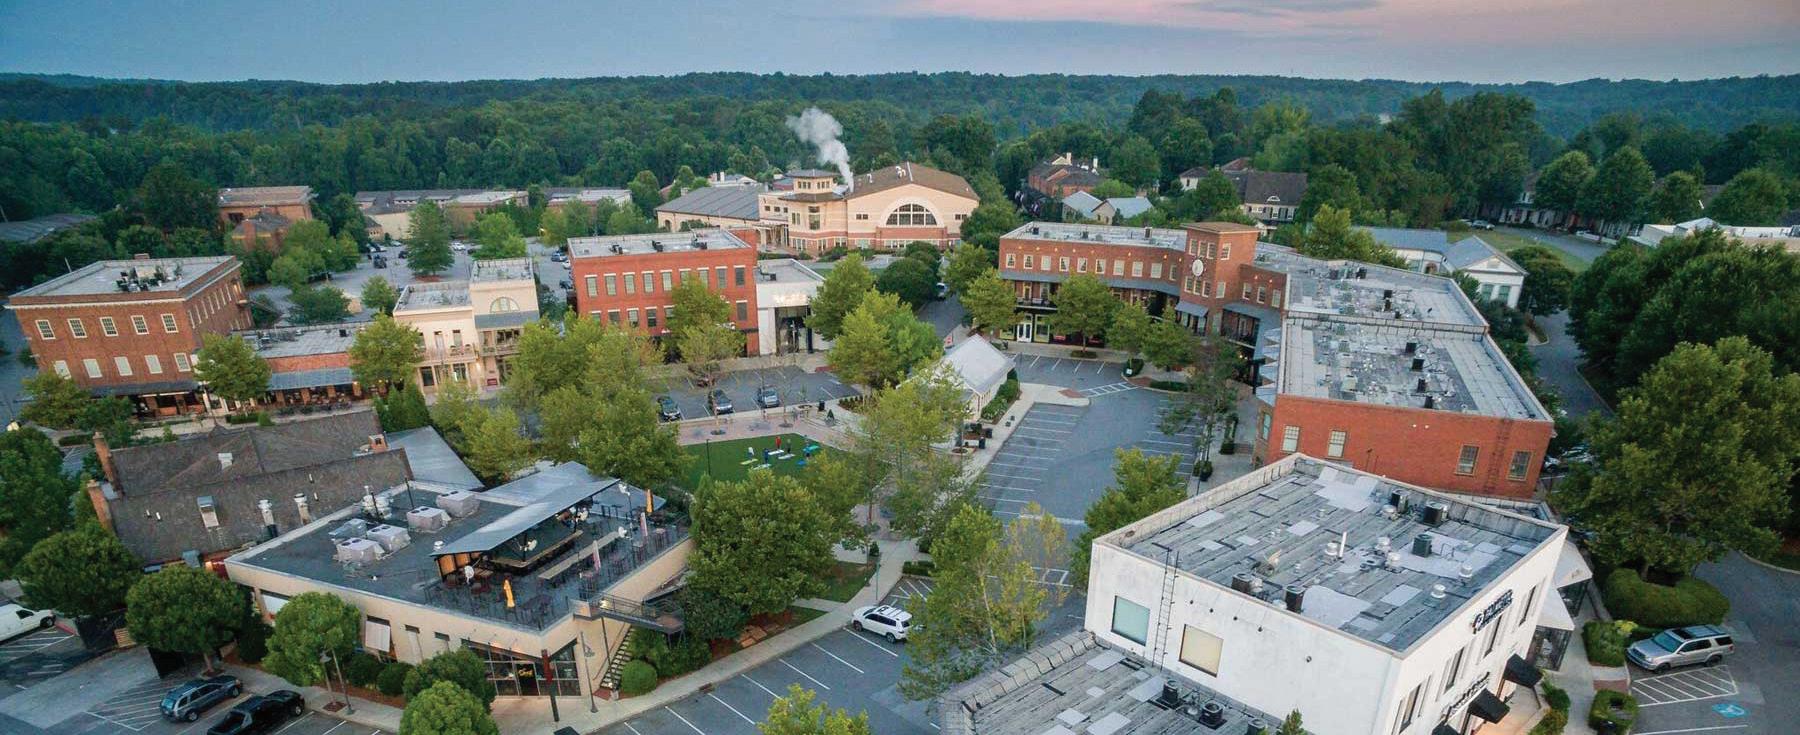
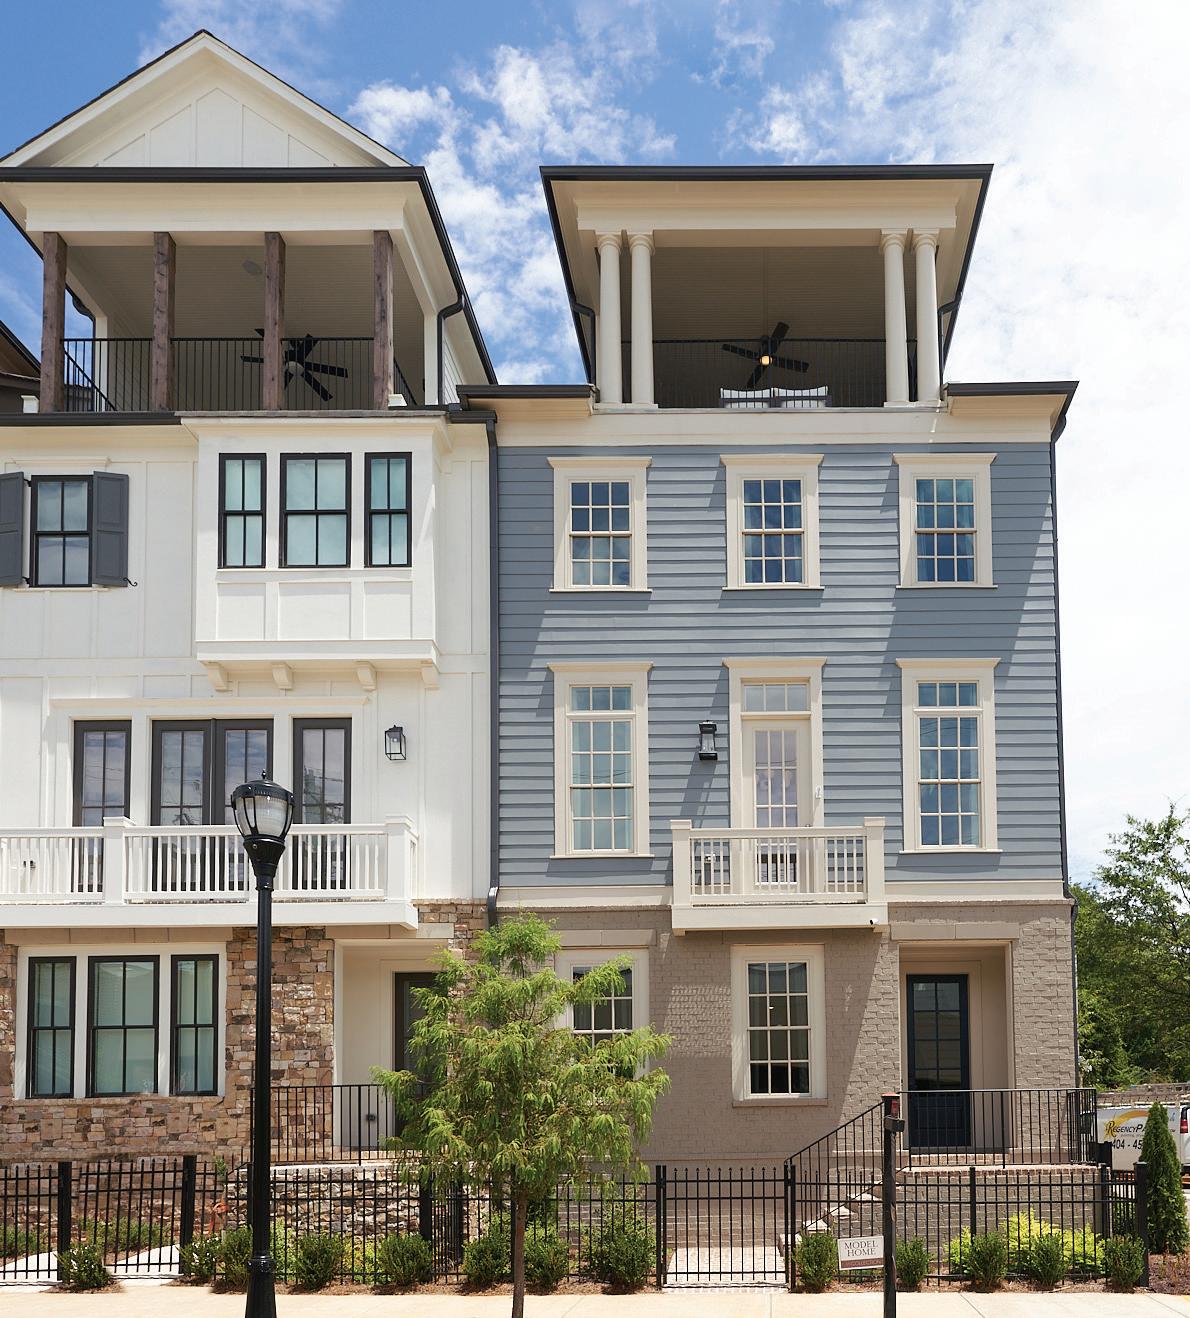
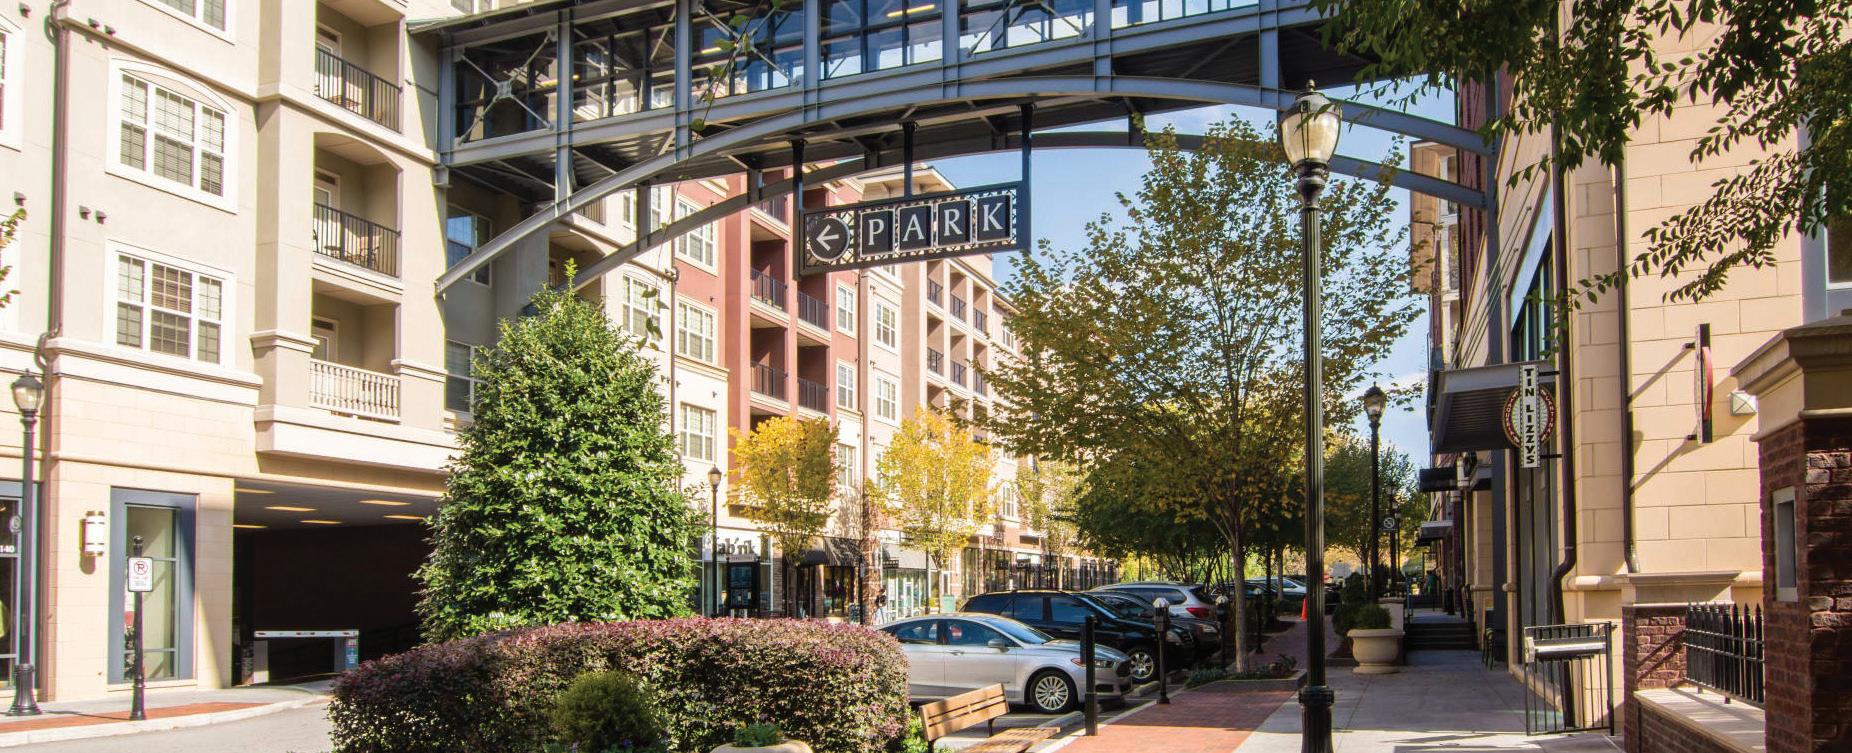

Source: 7/1/2020 – 9/30/2020 provided
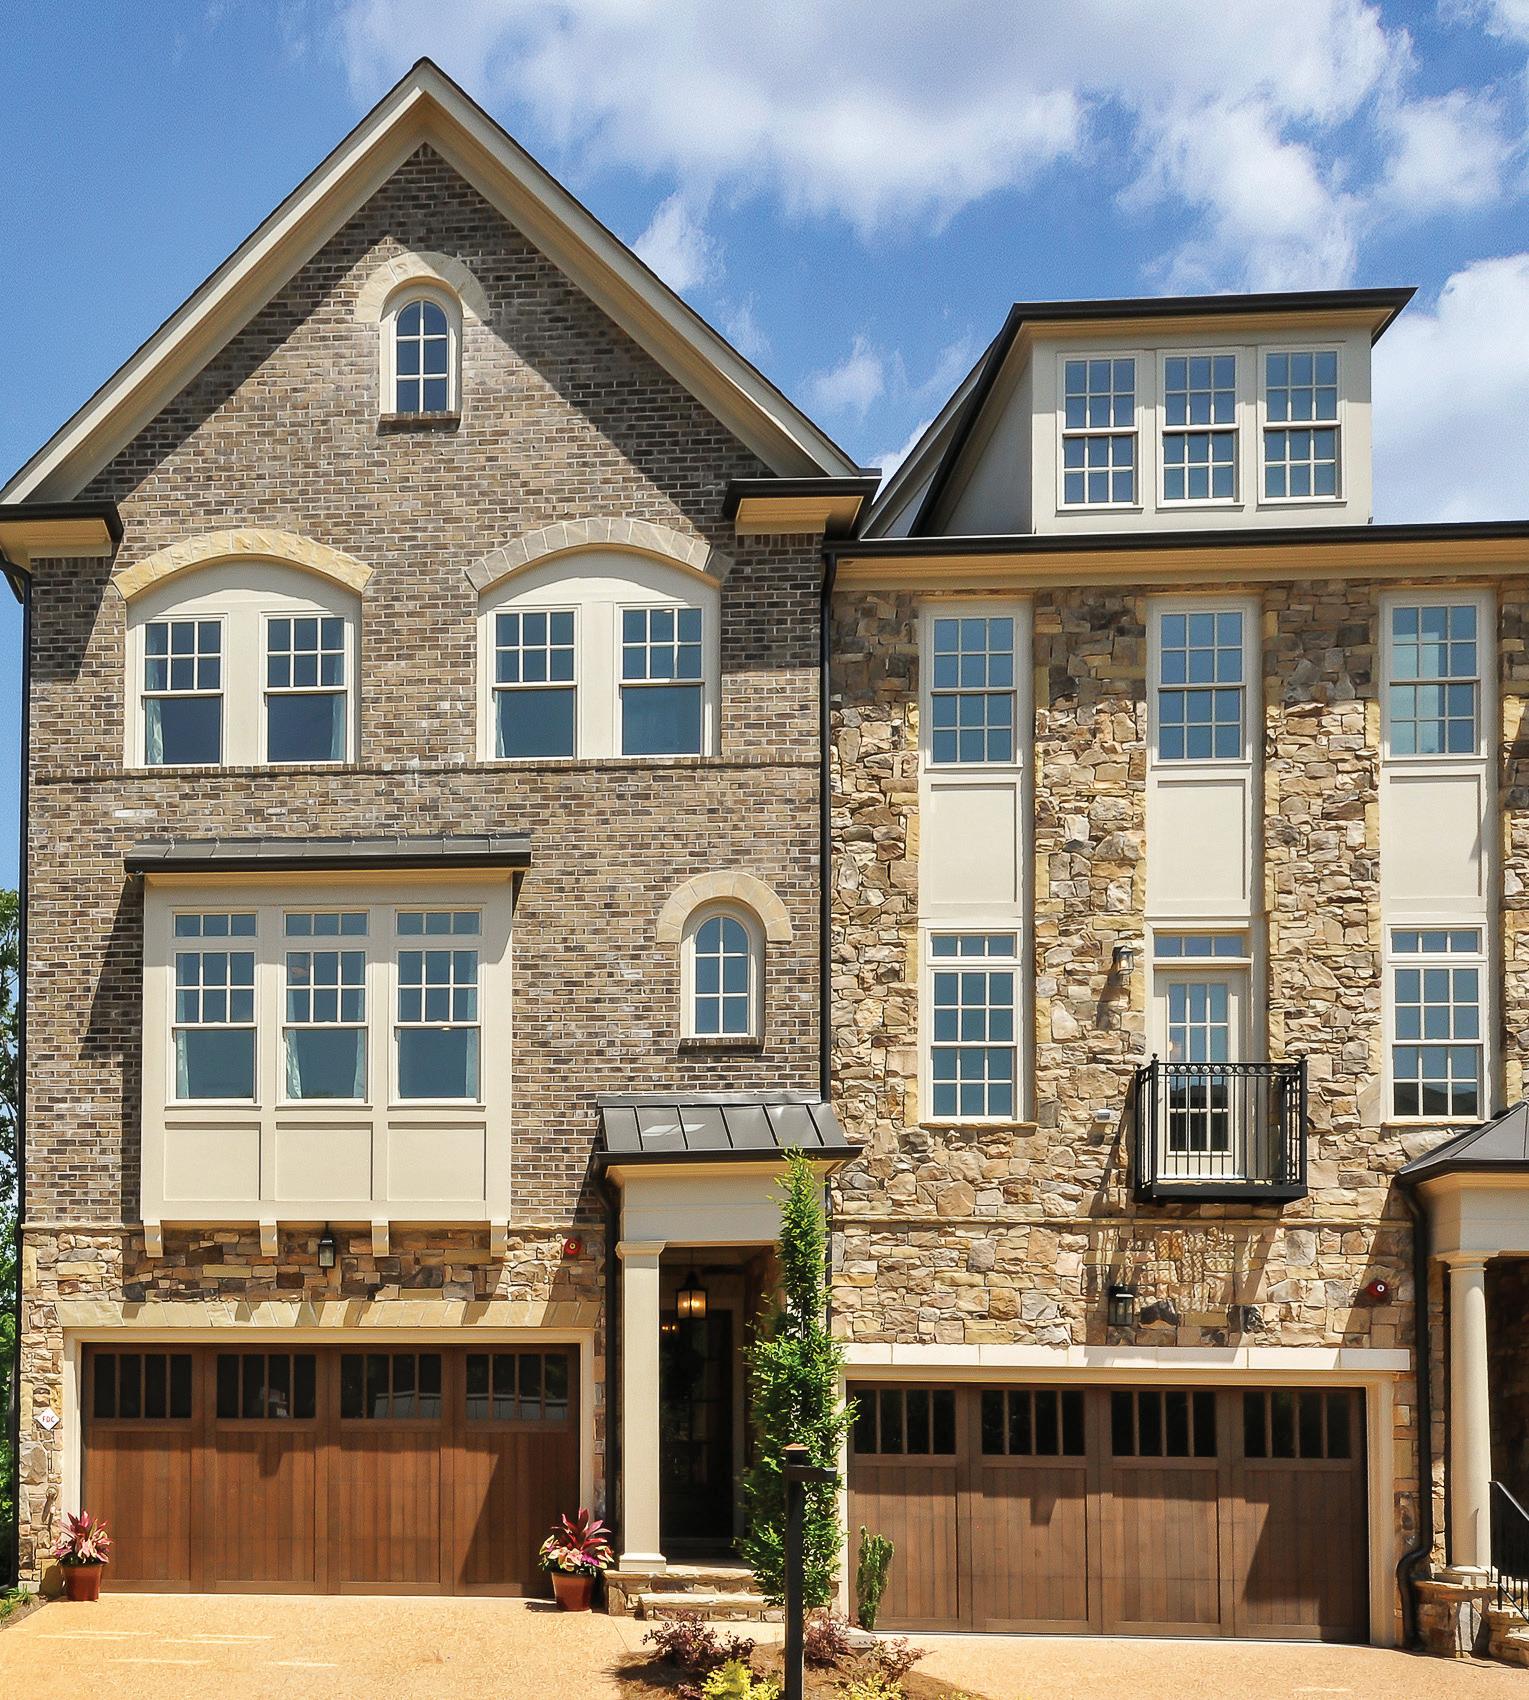
Source: 7/1/2020 – 9/30/2020 provided by FMLS