The data found within the ERA Shields Real Estate Stat Pack is based on information from the Pikes Peak REALTOR® Services Corporation (RSC) or its PPMLS. This content is deemed reliable; however RSC, PPMLS and ERA Shields Real Estate do not guarantee its accuracy. Data maintained by RSC does not reflect all real estate activity in the market. Additional sources include the Colorado Springs Business Alliance, El Paso County Assessor, El Paso County.
QUICK FACTS (SQLY = Same Quarter Last Year)
RESIDENTIAL REVIEW
El Paso County
Data through 1st Quarter 2026
Welcome to the ERA Shields Stat Pack. The intent for providing information to you is to educate you on the current local real estate market so you can better make decisions for you and your family. Real estate markets vary from city to city as well as neighborhood to neighborhood. When the national media reports how the real estate market is doing, it is reporting on national numbers and it is likely very different from how your neighborhood is performing. You will find factual data within this document from which you may draw your own
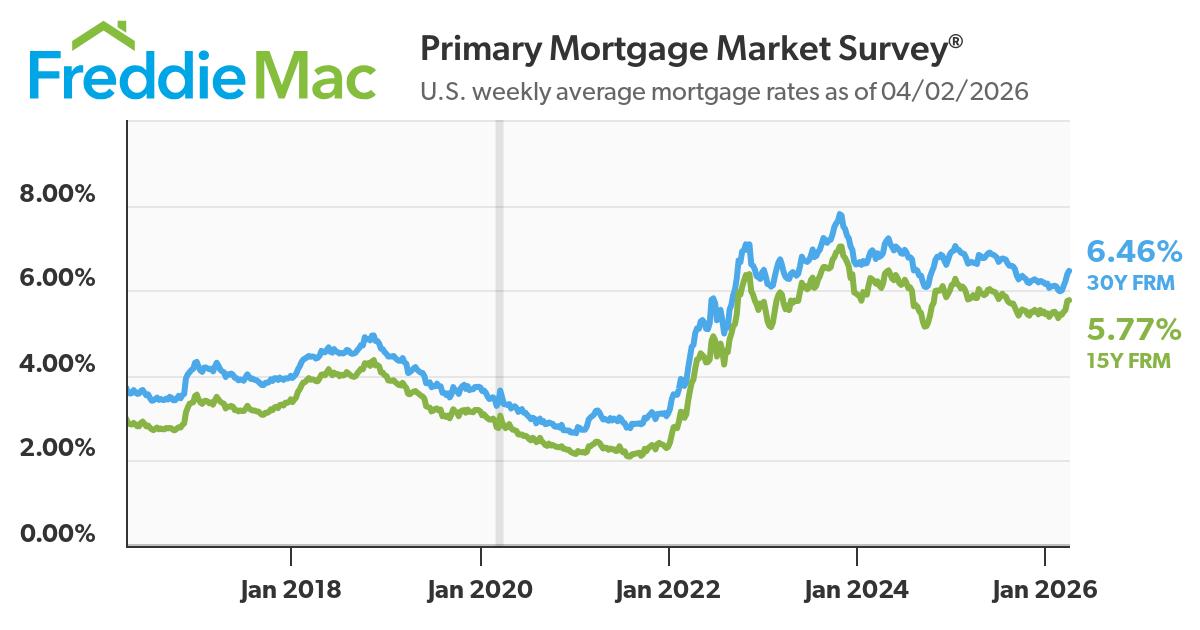
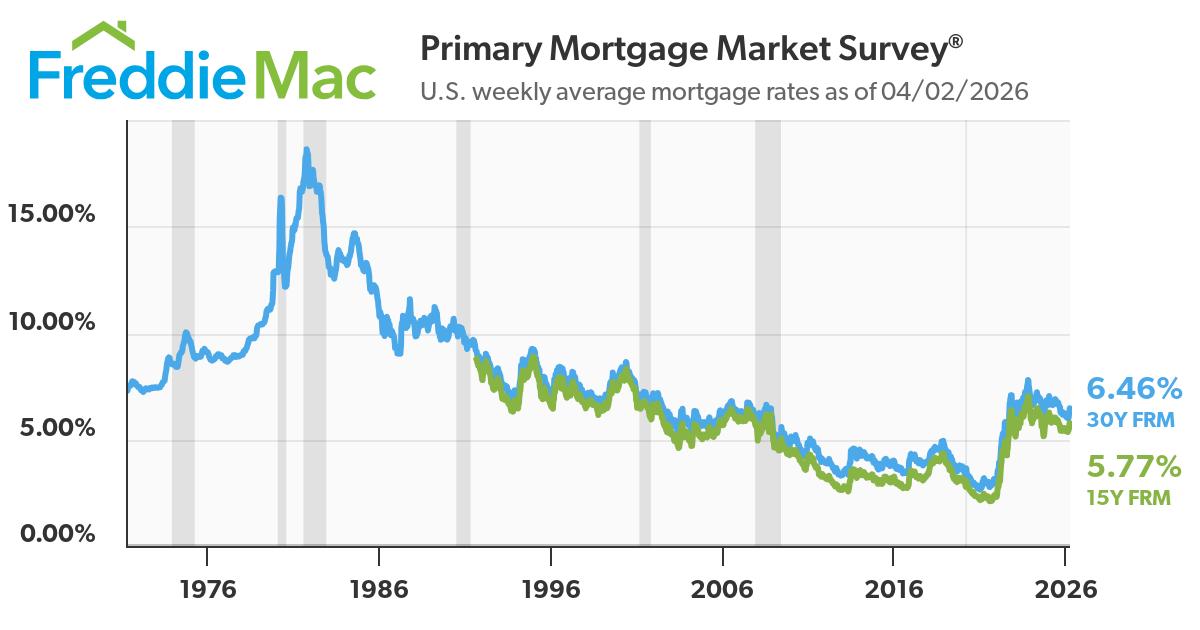
Mortgage rates were volatile-from a low below 6% and ending the Quarter at nearly 6.5%
Average active listings for the quarter were 2,208, compared to 1,818 from the SQLY (up 17%)
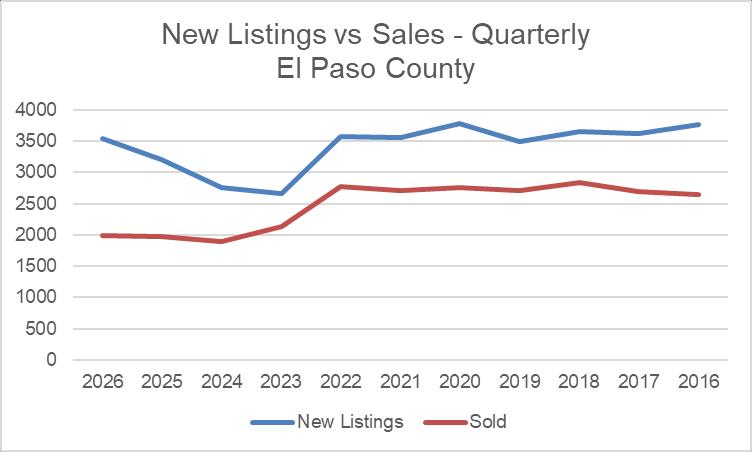
Total new listings for the quarter were 3,540, compared to 3,206 from the SQLY (up 10%)
Sales for the quarter were 1,994 units, compared to 1,977 from the SQLY (flat)
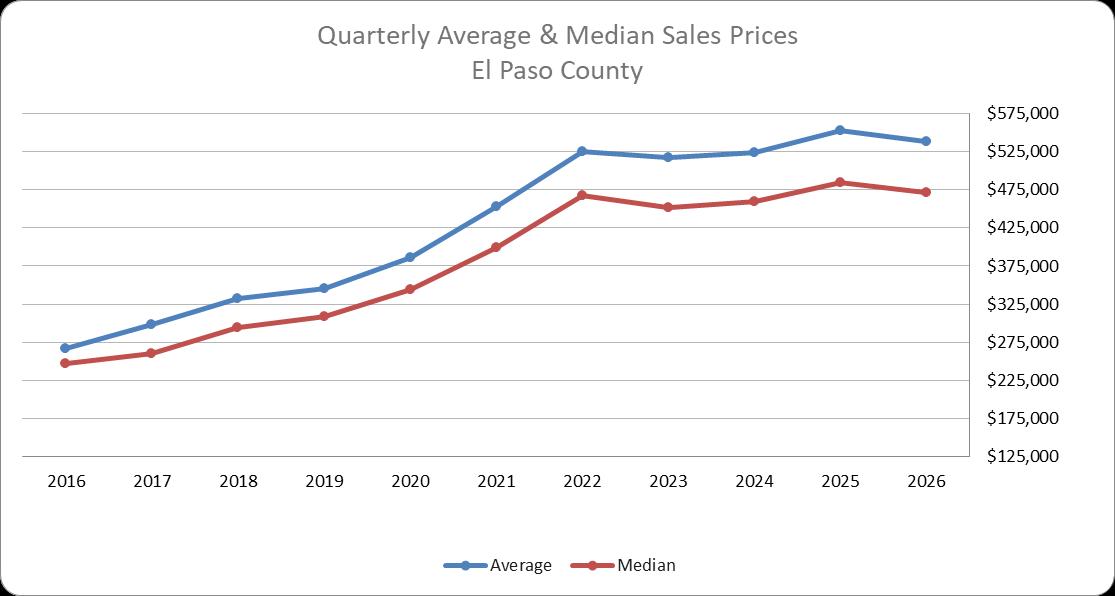
Average sales price for the Quarter was $538,133 down from $552,813 during the SQLY (down 2%)
Average median sales price for the Quarter was $471,000 down from $484,000 (down 2%)
Average days on market for sold homes was 74 for the quarter, up from 65 days from the SQLY
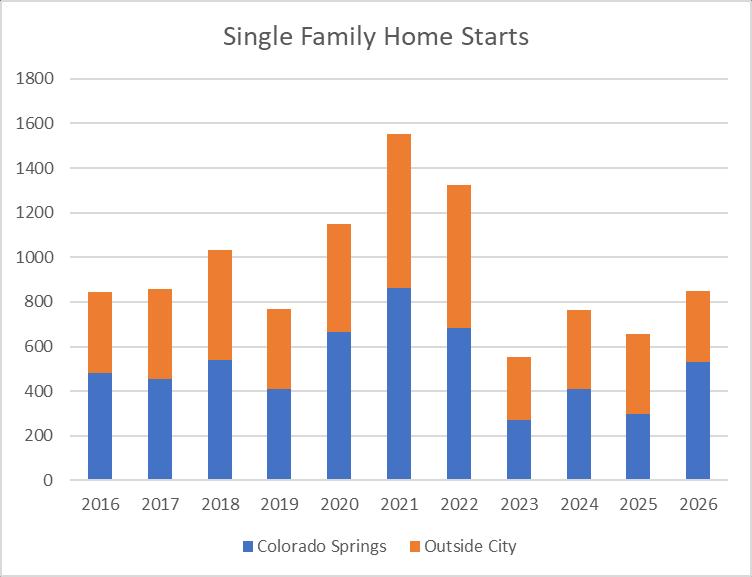
Single family permits YTD were 851 compared to 655 from the SQLY (up 29%)
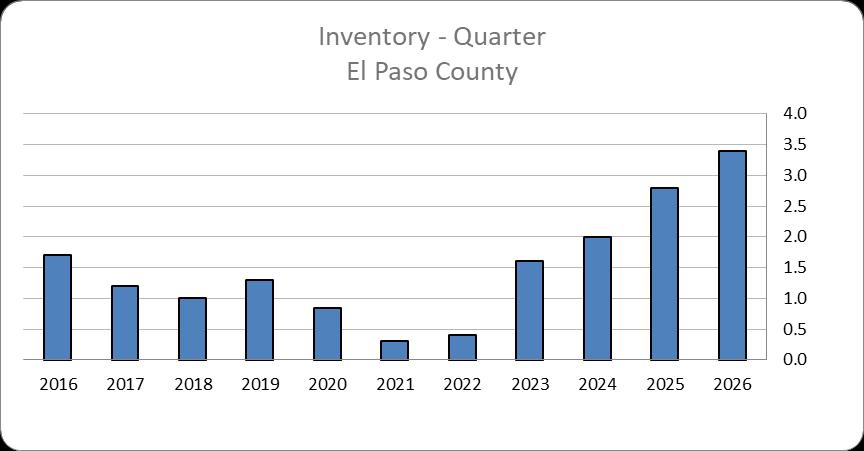
This graph compares the number of homes on the market (Active) to the number of homes Sold. It shows how many months it would take to sell through the current listing inventory. Most economists consider 56 months to be a balanced market.
PRICING TOOLS
SINGLE FAMILY/PATIO
- EL PASO
Comparing data for the past 10 years
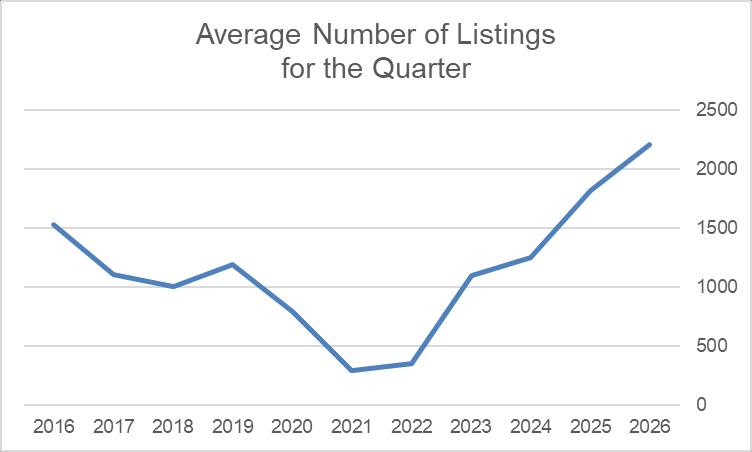
This graph shows the average number of active listings on the market for the same period over the past 10 years.
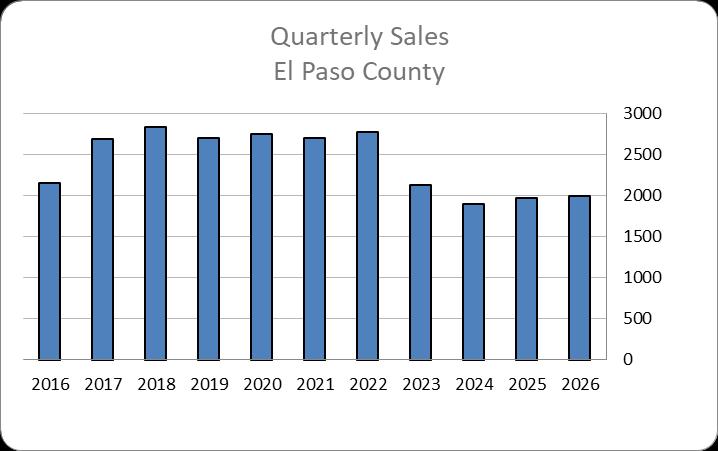
The blue line shows the number of new listings for the same 3-month period over the past 10 years. The red line is the total number of sales for that period.
www.ERAShields.com
www.ERAShields.com/pages/MarketConditions
QUARTERLY DATA
Comparing data for the past 10 years
The Average & Median Sales Prices for the same period over the past 10 years. This graph illustrates the current health of the local real estate market.
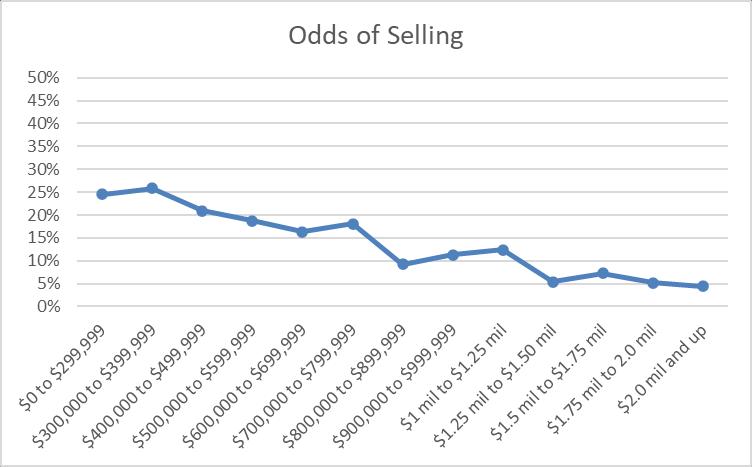
The price range a home is within dictates the odds of selling in the next 30 days. Generally the lower the price, the more likely it will sell.
MORTGAGE RATES
Mortgage rates during the 3rd quarter of 2025 came down nearly 1/2 a point. This should be great news to buyers as it increased their buying power. However, it seems there is much uncertainty in the economy that is causing buyers to hold off buying a home now.
The historical average rate of a 30-year fixed rate mortgage is 7.71%
This chart shows mortgage rates back to 1971. It should also be known that the Federal Reserve began buying Mortgage Backed Securities in 2008 to artificially lower mortgage rates to help the economy recover from the financial crisis. The Fed stopped this practice in early 2022 and rates immediately increased.
www.ERAShields.com
HOUSING STARTS
This chart shows the total number of single family housing starts for the quarter in Colorado Springs and all other reporting jurisdictions for Pikes Peak Regional Building Department.
SUMMARY
Colorado Springs Residential Market Update – Q1 2026
The first quarter of 2026 delivered a mix of stability and volatility for the Colorado Springs housing market. Mortgage rates were especially turbulent due to the ongoing conflict in Iran, with rate spikes creating moments of hesitation among buyers. Even so, the supply side continued to loosen. The average number of active listings rose to 2,208, up 7%, while the number of new listings despite holding historically low mortgage rates climbed 10% as the market slowly normalizes.
Buyer activity held steady. Sales were essentially flat, coming in just under 2,000 units for the quarter. Home prices edged down about 2%, reflecting modest but continued value growth for buyers. Inventory is now approaching 3.5 months, offering buyers more choice than they've had in several years.
Market strength remains concentrated up to the $800,000 range, where demand and showing activity are still solid. Above that threshold, conditions soften and buyers enjoy more negotiating leverage. The odds of going under contract within 30 days has settled below 25%, a clear sign that the market has eased from the frenzy of recent years. Overall, Q1 reflects a market finding its balance still healthy, but no longer moving at a breakneck pace.