ISTANBUL
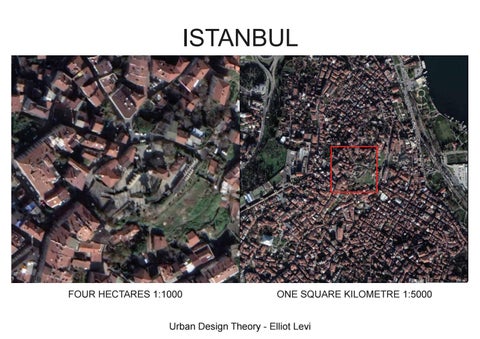
FOUR HECTARES 1:1000
ONE SQUARE KILOMETRE 1:5000
Urban Design Theory - Elliot Levi
THE SITE The site has been chosen because there’s a mixture of street patterns and block sizes. It also includes many different functions and buildings: residential structures of all sizes, religious institutions, greenspaces, a cemetery, and commercial areas. Additionally, it’s in a wedge between a freeway to the west and another large road and the Golden Horn River (both of which offer public transport connections to the larger city) to the east. Finally, it’s in an older part of the city that includes new and old buildings, vacant lots, and varied topography that appears to have affected how the urban fabric developed.
ACCESS & MIX - ONE KILOMETRE SQUARE
GREENSPACE
COMMERCIAL AREA
At this scale it’s clear that city-scale transport
RELIGIOUS STRUCTURE
PUBLIC TRANSPORT
MAJOR ROAD
networks do not dissect or disrupt the internal connectivity of the site to a great extent. The primary bus routes run along the freeway, which runs along the edge of the Golden Horn River
GOLDEN HORN RIVER
N
rather than through the urban fabric. While it does cut the area off from the large park and ferry terminal to the east, there appear to be regular crossings. However, some parts of the site are
INTERFACE CATCHMENT 2,565 M
more than 500m from a stop and the frequency and reliability of services is impossible to determine.
FERRY TERMINAL
The street network itself is extremely dense with a mixture of very small, regular blocks (roughly
CEMETERY
30mx30m) and larger, irregular blocks (that nonetheless rarely exceed 200m in perimeter).
INTERFACE CATCHMENT
The interface catchments for different areas have
2,205 M
been calculated within a 200mx200m area (see above); in all areas it is above 2,000m, but where
ACCESS & MIX - FOUR HECTARES
C
the blocks are the smallest and most regular it is
FIG. 2
considerably higher. D
LIVE ROUTE VISIT ABANDONED
A
That the largest commercial area is located here where the street network is most dense and both greenspace and public transport are relatively close - is unlikely to be a coincidence. The next largest - to the north - is also situated in a similar area, while the central one is at a convergence of streets around a mosque. Indeed, most commercial areas across the entire square kilometre appear to be close to or surrounding mosques, churches, or synagogues, an anchoring principle not seen in Chicago (see forthcoming comparison).
INTERFACE CATCHMENT
INTERFACE CATCHMENT
2,087 M
3,371 M
C. MOSQUE COMPLEX: SEMI-PUBLIC BUT FENCED OFF.
SEMI-PUBLIC & POORLY MAINTAINED
B
A.
B.
ACCESS & MIX - FOUR HECTARES Here the street network is less regular, reflecting
it that are not evident from street view. In terms of
the hilly topography and perhaps indicating that
street-level functions it’s predominantly residential,
the area is older (it’s adjacent to the old city walls).
though scattered shops are within walking
Alternatively, it may have been a less formal
distance of most dwellings; importantly, there
extension of the grid to the south east with the
appear to be trucks selling produce travelling
mosque acting as an attractor. The fact that the
around the area to supplement the relatively
study area is connected to the grid and commer-
meagre commercial offering - something that’s
cial area to the south-east only by a small, poorly
almost impossible to map properly but which
maintained road suggests either that it was
considerably boosts the level of amenity enjoyed
unplanned or that the topography presented
by residents.
considerable challenges. However, while there’s only one road, there appear to be a number of
Finally, the area contains a significant number of
pedestrian-only routes up the hill indicated by
vacant lots, some of which are empty or run down
staircases (see image #2).
and others of which are used for parking, stops for the above mentioned trucks, or as places for
The area itself is relatively porous and quite
children to play. Again, this is difficult to map but
possibly contains pedestrian routes through
does affect the access and mix of the area.
D.
FIG. 1
BUILDING DENSITY & MIX - FOUR HECTARES
CHICAGO COMPARISON (WITH ARCHANA RAMESH) *BOTH MAPS: ONE KILOMETRE SQUARE
1 STOREY 2 STOREYS 3 STOREYS 4 STOREYS 5 STOREYS 6+ STOREYS ABANDONED/VACANT GREEN SPACE MOSQUE COMPLEX
1. B
PARKS
STOREYS 1+
SEMI-PUBLIC & POORLY MAINTAINED
3+
5+
8+
URBAN WASTELANDS
A
ELEVATED RAIL
B
N
FIG. 4
FIG. 3 A.
HIGH STREET
MULTI-SCALE ANALYSIS The entire kilometre square is of relatively fine but
Overall, both the four hectare and one kilometre square
To conclude, then, density is high across both scales. At
highly-irregular grain up to about six storeys. Both within
study areas are likely to have a high density of buildings
1:1000 there’s a mix of building types and functions, but
and outside of the four hectare area the primary building
and residents. Residents are generally within walking
at 1:5000 it’s clear that groups of smaller blocks create a
type is an apartment complex of ~ five storeys; however,
distance of shops and services due to the fine grain of
more diverse mixture. Access on foot is relatively high
the block structure - the spatial unit that appears to exert
the street network, but at the city scale some areas may
everywhere - though again higher in areas with smaller
the most influence over the DMA - varies depending on
be poorly serviced and disconnected. This is especially
blocks - but at a city scale where other modes of
the area analysed. A comparison between fig. 3 (the four
clear if the small number of cars relative to dwellings is
transport are necessary access may not be excellent;
hectare area) and fig. 4 (the smallest block structure)
taken into account, as the primary city-scale transport
what city-scale infrastructure does exist does not disrupt
reveals differences in the grain size and amount of open
infrastructure appears to be large roads to the east and
the integrity of the urban fabric to a great extent.
space behind each structure. At street level around the
west (with the exception of the ferry terminal).
blocks in fig. 4 there are more people, more shops, and more street space used for domestic activities such as drying clothes. Areas with this block pattern have the highest interface catchment and largest commercial areas (see fig. 1).
If streets and vacant lots are taken as public open spaces - and indeed many people are sitting or playing in such areas - then most residents enjoy decent access to a range of them. However, looking at the one kilometre square area it’s clear that there are few
Thus, while at 1:1000 the dominant spatial unit is the
easily-accessible, well-maintained greenspaces within
block and the particularities of its structure, at 1:5000
the urban fabric itself; rather, they are to the edges
the dominant spatial unit is a grouping of blocks of
where only some people are within easy
similar structure.
walking distance.
CHICAGO - A COMPARISON Though the Chicago study area has a comparable diversity of building sizes and a similar catchment ratio, the block structure/street network, arrangement of commercial areas and greenspace, and the transport infrastructure are fundamentally different. Blocks are larger and more regular, with many characterised by considerably lower total building coverage but larger individual building footprints than in Istanbul. Thus, density of both people and buildings is probably notably lower in Chicago than Istanbul.
PERMEABILITY & CATCHMENT RATIO: 2,360M AVERAGE PERIMETER OF A BLOCK: 572M
The functional mix is less distributed in Chicago, and though there is a diversity of building sizes, the actual grain size seems to be larger along the high streets than elsewhere, the opposite of Istanbul. Streets in Chicago are much larger and fewer in number than in Istanbul, though the total amount of public open space they represent is probably comparable. Chicago appears to have less green space than Istanbul (at least in the study area), though it is more evenly distributed. Finally, while across the Istanbul site city-scale transport infrastructure does not dissect the core urban fabric, in Chicago the elevated rail cuts right through and creates ‘urban wastelands’ beneath it (even along much of a street), a clear conflict between access at different scales.