
TOTAL COST OF RISK
INTRODUCTION
WORKERS’ COMPENSATION 1 4 2 5 3 6
PROPERTY FIRE
COMMERCIAL AUTO
GENERAL LIABILITY PREMISES
GENERAL LIABILITY PRODUCT
Understanding the total cost of risk and the financial impact of loss on business operations
The total cost of risk (TCOR) for a business is the complete financial impact associated with the risks a business faces, including both direct and indirect costs. It’s more than just insurance premiums – it captures all expenses related to managing, preventing and responding to risks.
Direct costs are the immediate, out-of-pocket expenses associated with a loss or claim, typically covered or recognized by insurance based on the policy terms of coverage.
• Insurance premiums: payments for general liability, property, workers’ compensation, auto, umbrella and specialty insurance policies
• Retained losses: deductibles or selfinsured losses the company pays outof-pocket
• Uninsured or excluded losses: claims outside of current insurance coverage
• Claim settlements: payments made to third parties for lawsuits, damages or liabilities
• Legal and investigative costs: attorneys’ fees, expert witnesses and costs of claims investigations

DIRECT COSTS
• Insurance premiums
• Retained losses
• Uninsured or excluded losses
• Claim settlements
• Legal and investigative costs
INDIRECT AND RISK CONTROL COSTS
• Lost productivity
• Operational disruption
• Reputation damage
• Employee morale and retention
• Safety program costs
• Regulatory fines or penalties
• Prevention investments to reduce risk

Indirect costs are often harder to quantify but can be much larger than direct costs.
• Lost productivity: downtime due to accidents, incidents or investigations
• Operational disruption: delays in production, supply chain interruptions or equipment replacement
• Reputation damage: loss of customer trust, loss of contracts, reduced sales or negative publicity
• Loss of customers: Disruptions can weaken customer confidence and loyalty, leading to long-term customer loss.
• Employee morale and retention: reduced engagement or increased turnover after incidents and posttraumatic stress
• Risk transfer costs: insurance brokerage fees or risk-sharing agreements
• Risk financing: reserves set aside for potential losses
• Administrative costs: internal risk management staff salaries and benefits, consulting and audit fees
• Fines and penalties/regulatory compliance costs: costs of noncompliance, including OSHA or environmental penalties; reporting, inspections and recordkeeping
Risk control costs are prevention investments to reduce risk before losses occur:
• Safety programs, procedures, audits: training, personal protection equipment, audits, inspections, compliance measures
• Fire protection: sprinklers, alarms, suppression systems, inspections
• Security measures: guards, surveillance cameras, access control
TCOR FORMULA
• Fleet management: driver training, telematics, dash cams
• Product management: product quality assurance and recalls
• Risk planning: business continuity planning and disaster recovery
Direct costs + Indirect costs + Risk control costs = Total cost of risk
Example: A business pays $200,000 in insurance premiums annually, has a $10,000 deductible, suffers an estimated $300,000 in indirect costs due to downtime and reputational loss, and spends $25,000 on risk control programs.
TCOR: $200,000 + $10,000 + $300,000 + $25,000 = $535,000
The indirect costs often outweigh the direct costs, which is why a complete understanding of TCOR is critical for strategic risk management.
Download the revenue calculator to estimate how much revenue is needed to pay for a loss.
CREATING A BUSINESS CONTINUITY PLAN
Having a business continuity plan (BCP) ensures that a business can maintain essential operations and recover quickly in the face of disruptions, whether from natural disasters, cyberattacks, equipment failures or other unexpected events. Without a plan, even minor incidents can escalate into significant financial losses, operational downtime, reputational damage and potential regulatory non-compliance. By identifying critical processes, assigning responsibilities and establishing recovery procedures, a business can minimize the impact of disruptions on employees, customers and stakeholders. Additionally, having a BCP shows that the company is prepared and reliable, reassuring clients, investors and insurers that the company is prepared to handle crises effectively, ultimately safeguarding long-term stability and profitability.
How to create a business continuity plan
PARTNERING WITH EMPLOYERS TO REDUCE YOUR TOTAL COST OF RISK
Through the Encova 360° Impact service model, we work with our customers to lower their total cost of risk. Our safety services and resources are designed to reduce loss exposures and strengthen each policyholder’s safety program and practices.
By partnering with businesses, our Safety and Loss Control team helps create safer environments for their employees and customers, protect assets and reduce potential damage or loss. This proactive approach helps prevent claims, and fewer claims can lead to lower overall cost of risk.
Click on an icon below for more information on the total cost of risk with hypothetical scenarios for different lines of coverage.
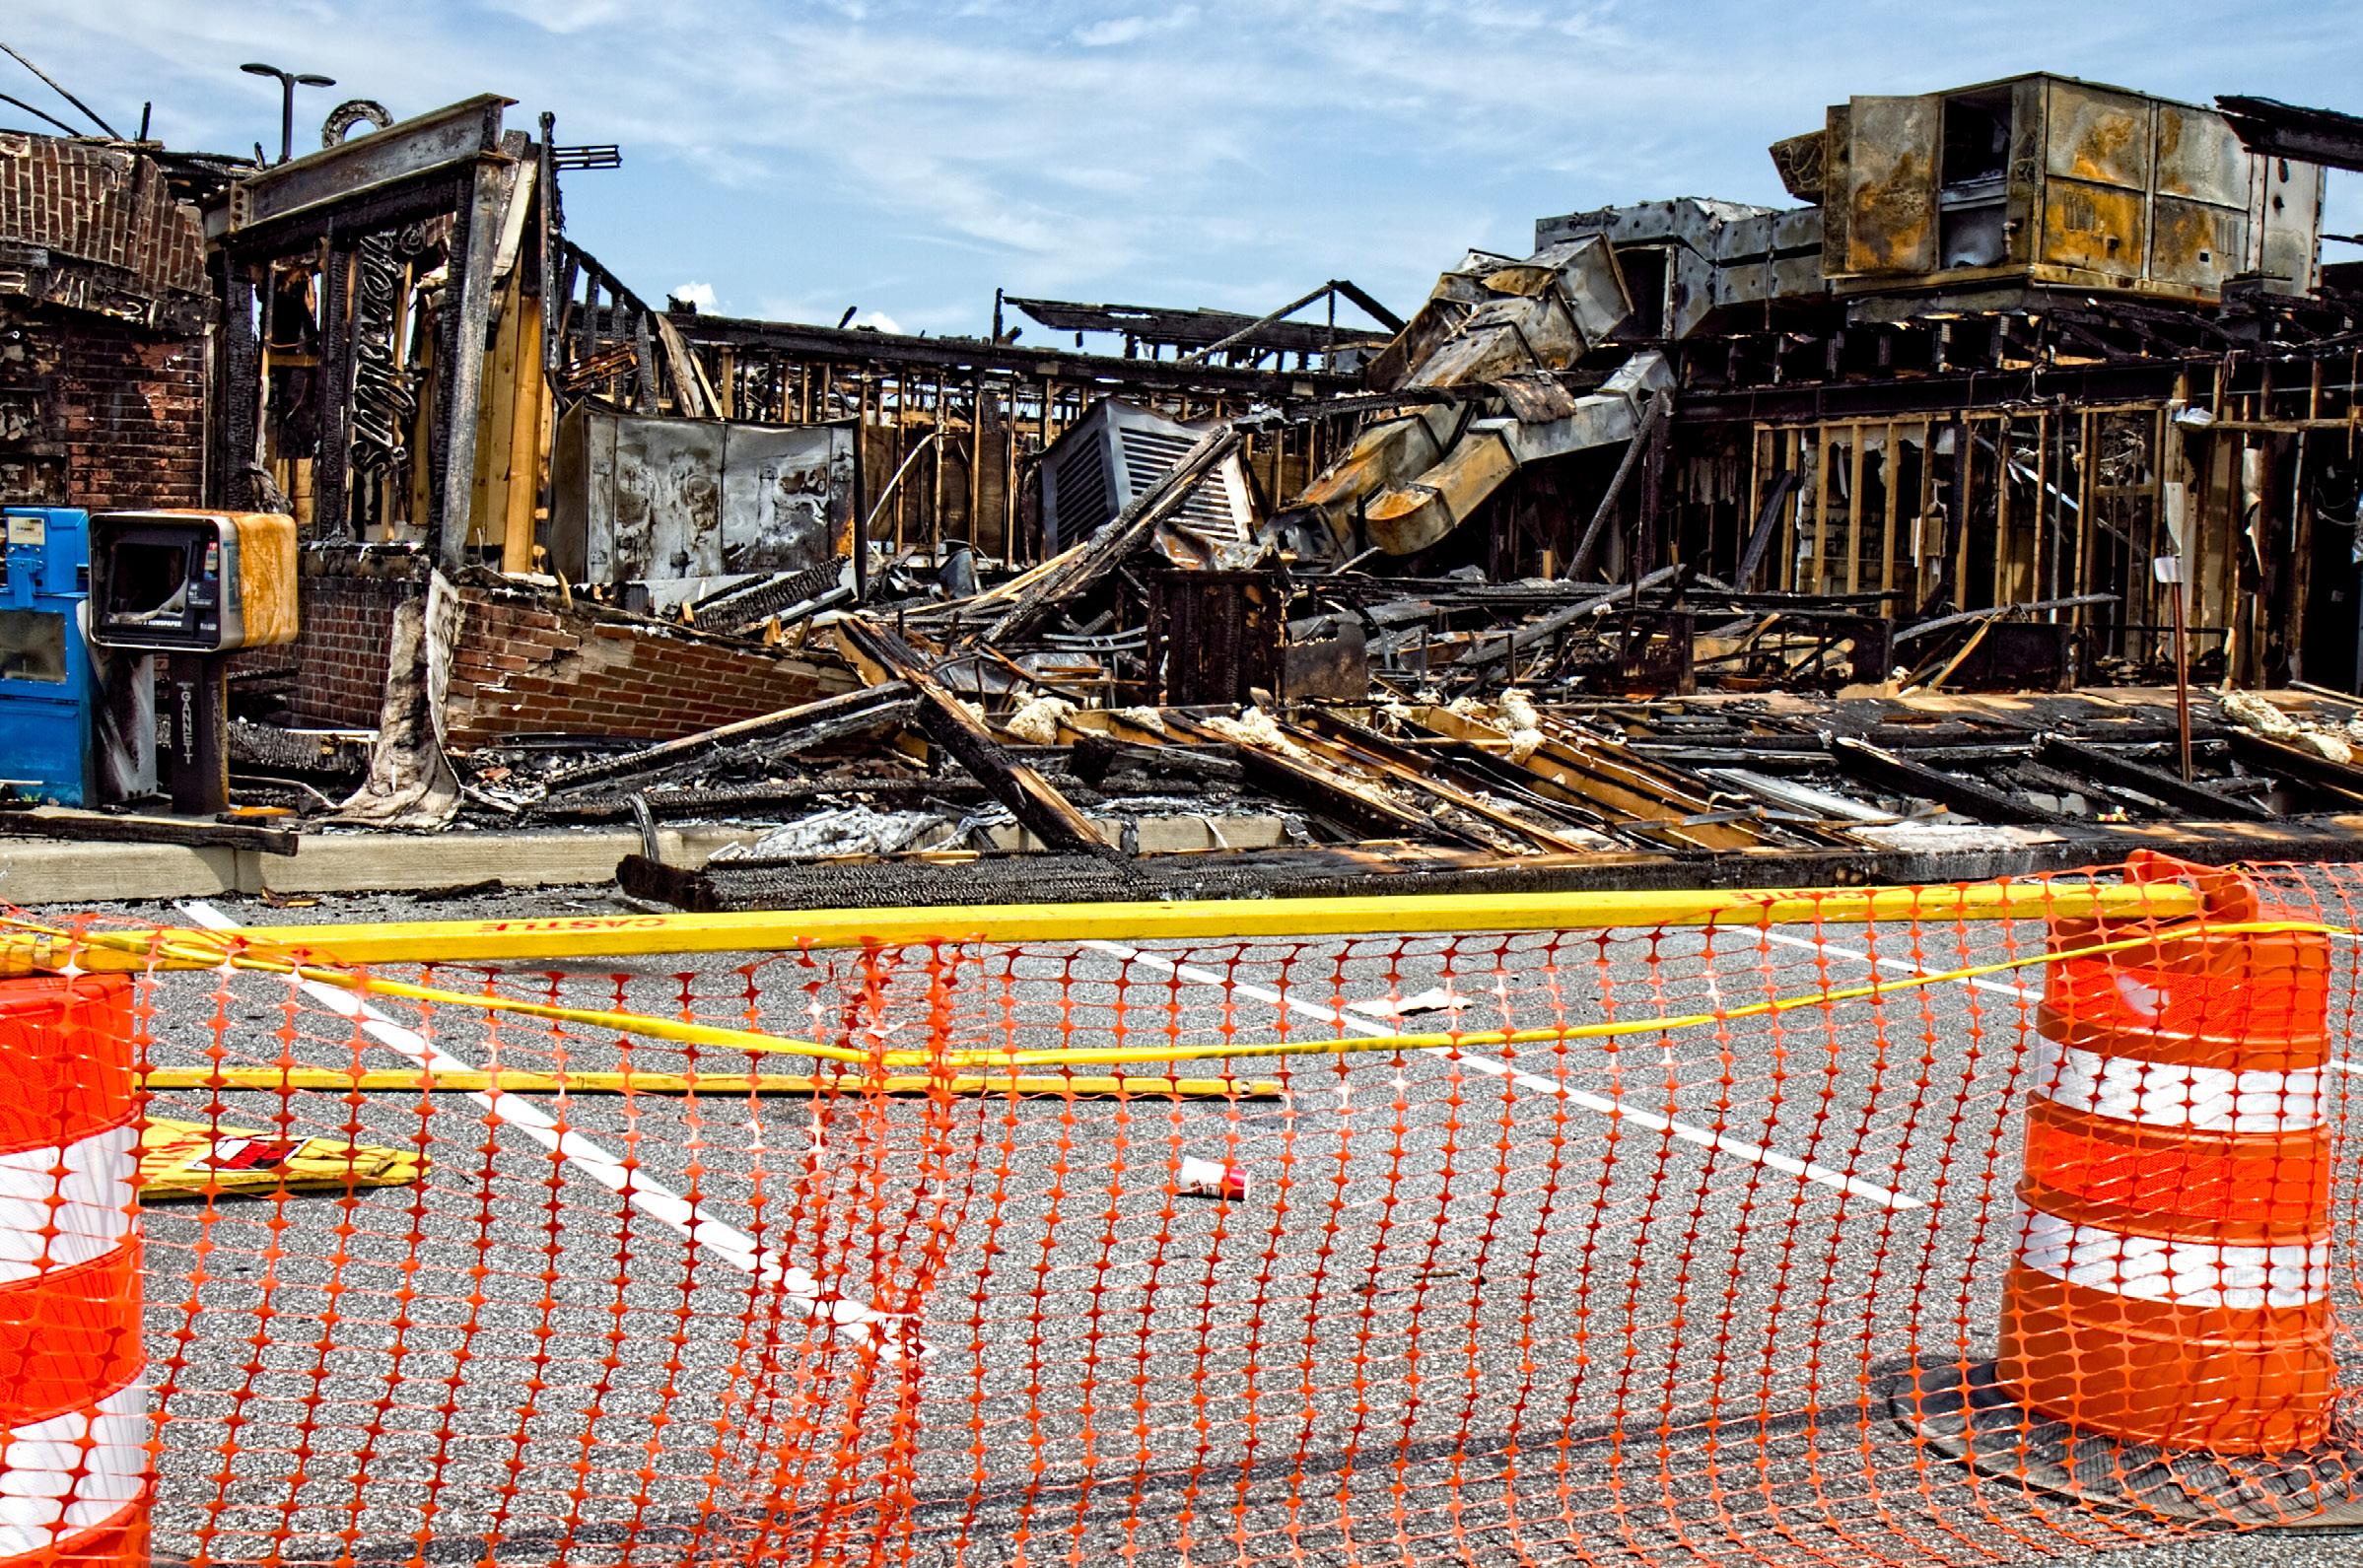
Understanding the financial impact of property fire damage on business operations
When a fire destroys a business’s property, the damage goes far beyond the physical structure. Years of effort, dedication and investment are also impacted. Beyond the brick and mortar of the building, the loss extends throughout the operations, relationships and reputation that have been carefully built over time. The fire not only consumes physical assets but also disrupts the long-term vision and stability the business has worked to establish.
In addition to the physical damage, there are several key components that contribute to the total financial impact of a fire on a business. These elements extend far beyond the immediate costs of repairs, affecting various aspects of operations and future growth:
DIRECT COSTS (IMMEDIATE AND MEASURABLE)
• Insurance premiums: annual payments for property insurance coverage
• Insurance deductibles: the portion of the claim the business must pay out of pocket before insurance coverage applies; this varies depending on the insurance policy terms
• Property damage: repairing or replacing the damaged buildings, equipment, inventory and other assets affected by fire
• Business interruption: immediate loss of income due to halted operations; this loss of revenue is often one of the largest costs and many businesses never fully recover
INDIRECT COSTS (HIDDEN AND LONG-TERM)
• Administrative time: Claims often last for months due to inspections, expert reports and forensic reviews. While initial payments may be quick, full resolution typically requires prolonged follow-up.
• Reputation damage: Loss of customer trust, damage to brand image, loss of contracts or diminished market share can have long-term financial implications.
• Extra expenses: additional costs incurred to minimize business interruption, such as renting temporary facilities, expedited repairs, overtime pay for employees or other expenses necessary to keep the business operational
• Legal and liability costs: legal expenses, settlements or judgments if the fire causes harm to individuals or neighboring properties
• Employee loss: shutdown causes workers to seek other employment
• Loss of customers: reduced customer loyalty and confidence due to operational disruption
• Insurance premium increases: Future premiums may increase due to perceived higher risk after a loss.
RISK CONTROL COSTS (PREVENTION INVESTMENTS FOR MINIMIZING RECURRENCE)
• Safety measures and operational changes: To reduce the likelihood of future claims, a business may need to strengthen risk management practices, invest in enhanced fire protection systems, perform regular maintenance and inspections, implement emergency response planning and provide employee training or compliance programs, all of which can result in ongoing expenses.
Example: A mid-sized non-sprinklered furniture manufacturer experiences a fire in its production area due to an electrical fault. The fire damages machinery, raw materials and part of the building structure.
DIRECT COSTS
• Insurance premium: annual property insurance coverage ($18,000)
• Insurance deductibles: out-of-pocket costs before insurance coverage applies ($10,000+)
• Property damage*: replace machinery, repair the facility and restore production areas ($2,000,000+)
Estimated direct costs: $3,500,000+
• Inventory loss*: finished goods and raw materials destroyed ($500,000+)
• Business interruption*: lost revenue during a three-month shutdown while repairs and replacements are made ($1,000,000+)
*Potentially transferable via insurance based on policy coverage
INDIRECT COSTS
• Claim administration: inspections, expert reports and forensic reviews ($100,000+)
• Reputational damage/customer loss: customers cancel contracts and move to competitors, resulting in long-term revenue loss during coverage period (potentially catastrophic and only partially transferable) ($1,000,000+)
• Employee impact: temporary layoffs, higher turnover and new training costs when rehiring (only partially transferable) ($300,000+)
• Operational disruption: supply chain interruptions and lost vendor relationships increase future costs (potentially catastrophic and only partially transferable) ($1,000,000+)
• Regulatory and legal costs: fire inspection penalties and compliance ($100,000+)
• Insurance premium increases: potentially higher property insurance costs ($25,000+)
Estimated indirect costs: $2,525,000+ (potentially catastrophic and some costs partially transferable)
RISK CONTROL COSTS
• Fire protection and building safety upgrades: new fire suppression systems and improved electrical system upgrades ($500,000+)
• Employee safety and training programs: fire extinguisher and evacuation training, hot work permit training and oversight and machine operator fire prevention training ($20,000+)
Estimated risk control costs: $520,000+
TOTAL COST OF RISK
Direct costs with insurance: $28,000+
Indirect costs: $2,525,000+
Risk control costs: $520,000+
Overall estimated impact: $3,073,000+
Direct costs without insurance: $3,500,000+
Indirect costs: $2,525,000+
Risk control costs: $520,000+
Overall estimated impact: $6,545,000+
While insurance may cover much of the direct property damage and business interruption, the indirect costs such as supply chain interruptions, lost vendors and customers, brand damage, employee turnover and compliance issues can jeopardize long-term survival. Many businesses never fully recover from major losses even if the physical property is restored.
At Encova, providing consultative service to reduce risk and eliminate hazards is the core of what we do for our property policyholders. Contact your safety and loss control consultant for a facility evaluation including identifying potential fire hazards, evaluating fire protection, detection and suppression systems, and reviewing fire prevention measures.
Download the following Encova resources:
The big 3: property protection – fire sprinklers
Reducing your property risk with thermal imaging
Fire prevention and protection safety checklist
Fire protection impairment plan
Hot work program
COMMERCIAL AUTO
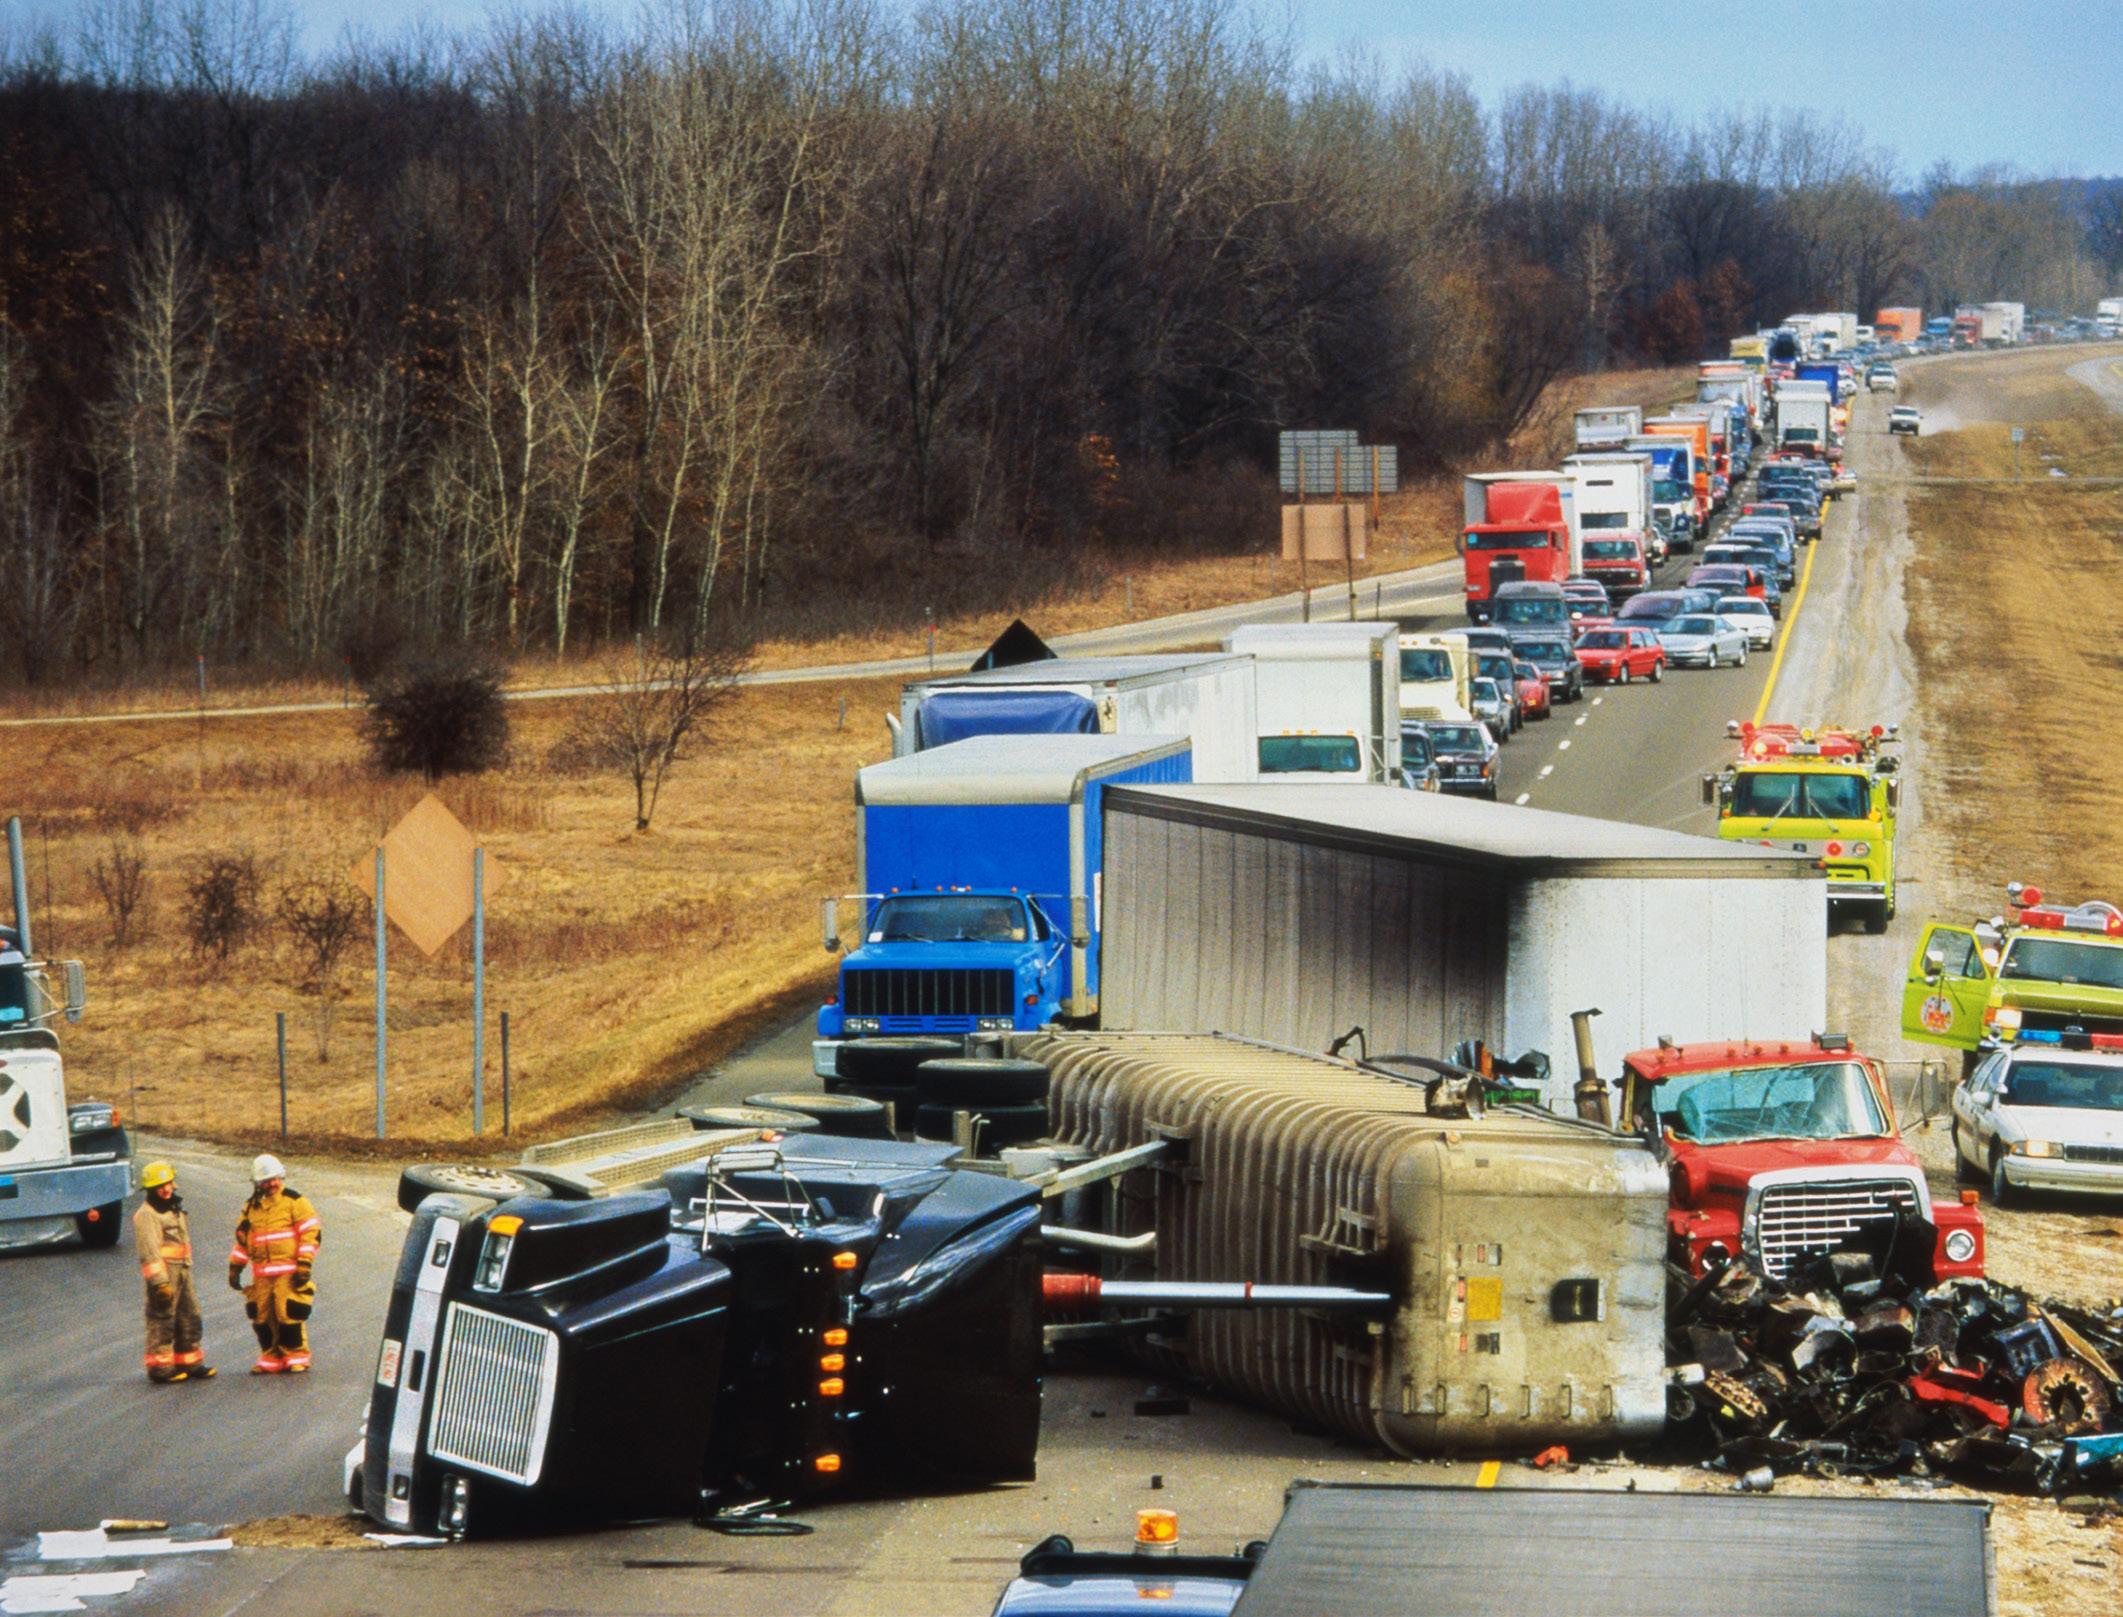
Understanding the financial impact of commercial auto on business operations
The total cost of risk for a business faced with a commercial auto claim goes far beyond the direct cost of repairing or replacing a vehicle. It includes all of the direct, indirect and risk control costs associated with the motor vehicle incident.
While insurance may cover direct expenses such as vehicle repairs, medical claims or legal settlements, the indirect impact of a commercial auto liability loss can be far more damaging. Rising insurance premiums, reputational harm, strained client relationships, driver turnover and operational disruptions can erode profitability and stability over time. Even after the immediate claim is settled, many businesses face lasting financial and operational challenges that make full recovery difficult.
The Network of Employers for Traffic Safety (NETS) reported that employers in the U.S. experienced more than $72 billion in direct crash-related expenses. These costs range from legal settlements tied to accidents involving company vehicles to increased insurance premiums that follow drivers and their employers even after relatively minor collisions.
Financial risk of employer vehicle operations
DIRECT COSTS (IMMEDIATE AND MEASURABLE)
• Insurance premiums: annual payments for commercial auto insurance coverage
• Insurance deductibles: the portion of the claim the business must pay out of pocket before insurance coverage applies; this varies depending on the insurance policy terms
INDIRECT COSTS (HIDDEN AND LONG-TERM)
• Property damage: repair or replacement of company vehicles and any third-party property damage
• Bodily injury liability: medical expenses, settlements or legal judgments
• Administrative time: Litigation can require significant time commitments, including legal consultations, depositions, mediations and potentially multi-week trials. The entire process may extend up to two years, demanding ongoing involvement from the business. Additionally, managers, human resources personnel and safety teams must dedicate time to investigate the incident and manage related claims.
• Business disruption: Out-of-service vehicles disrupt operations, delaying deliveries or services.
• Replacement/temporary rentals: costs for securing substitute transportation
• Employee wages and benefits: paying injured employees during recovery or while unable to work
• Reputational impact: A serious crash can damage customer trust or brand reputation, especially when company vehicles display logos and fleet branding that become associated with the incident.
DIRECT COSTS
• Insurance premiums
• Insurance deductibles
• Property damage
• Bodily injury liability
INDIRECT AND RISK CONTROL COSTS
• Claims administration time
• Business disruption
• Replacement/temporary rentals
• Employee wages and benefits
• Administrative time
• Reputational impact
• Legal exposure
• Opportunity costs
• Insurance premium increases
• Safety measures and operational changes
• Regulatory fines and penalties: financial consequences imposed by authorities (e.g., DOT, EPA, FMCSA, OSHA) for non-compliance or violations that occur because of or in connection with a loss event
• Legal exposure: defense costs for lawsuits not fully covered by insurance
• Opportunity costs: lost contracts or business opportunities due to reduced operational capacity
• Insurance premium increases: Future premiums may increase due to perceived higher risk after a loss.
RISK CONTROL COSTS (PREVENTION INVESTMENTS FOR MINIMIZING RECURRENCE)
• Safety measures and operational changes: To reduce the likelihood of future auto liability claims, a business may need to strengthen fleet risk management procedures, adopt additional vehicle safety technologies, implement ongoing driver training, and enforce stricter compliance programs. These preventive actions have associated ongoing costs but are critical to lowering accident frequency and liability exposure.
Example: A mid-sized distribution company operates a fleet of delivery trucks. One of their drivers rear-ends another vehicle during a morning route, causing injuries to the other driver and damage to both vehicles.
DIRECT COSTS
• Insurance premium: annual commercial auto insurance coverage ($112,500)
• Insurance deductible: out-of-pocket amount before insurance coverage applies ($5,000)
• Vehicle repair/replacement*: repair the company’s delivery truck ($30,000+)
Estimated direct costs: $692,500+
• Third-party damages*: repairs to the other vehicle ($45,000+)
• Medical expenses and settlement*: injuries sustained by the other driver ($500,000+)
*Potentially transferable via insurance based on policy coverage
INDIRECT COSTS (NON-INSURED OR NON-TRANSFERABLE COSTS)
• Claims administration time: time commitments from management, including claim reporting, legal meetings, depositions, mediations and potentially multi-week trials ($10,000+)
• Lost productivity: deliveries delayed while replacement vehicle or driver is sourced and route rescheduled, creating lost business ($15,000+)
• Reputation impact: a major customer questions the company’s reliability; shifts part of their business to a competitor ($300,000+)
Estimated indirect costs: $370,000+
• Employee morale and retention: driver turnover rises after stricter safety policies are enforced, additional hiring/training expenses ($25,000+)
• Increased insurance premiums: annual premium rises as insurer expectation of loss increases ($20,000+)
RISK CONTROL COSTS
• Driver hiring, screening and testing: background checks, motor vehicle record reviews and drug/alcohol testing annually for 50 drivers ($20,000+)
• Driver safety training: defensive driving courses, fleet safety training and refresher programs for 50 drivers ($20,000+ annually)
• Telematics and monitoring technology: telematics system monitoring and dash cameras for 50-vehicle fleet ($30,000+ annually)
• Vehicle maintenance and inspection programs: preventive maintenance and inspections to reduce mechanical failures for 50-vehicle fleet ($150,000+ annually)
• Policy development and administrative costs: program and procedure development ($10,000+ annually)
Estimated risk control costs: $230,000+
TOTAL COST OF RISK
Direct costs with insurance: $117,500+
Indirect costs: $370,000+
Risk control costs: $230,000+
Overall estimated impact: $717,500+
Direct costs without insurance: $575,000+
Indirect costs: $370,000+
Risk control costs: $230,000+
Overall estimated impact: $1,175,000+
A fleet safety program to include the incorporation of telematics and dash cams is key to reducing the potential and managing employee vehicle collisions.
Learn more about Encova’s discount partnership program with Azuga telematics.
Investing in fleet safety can reduce your crash rate by 50% or more. Encova can help you create or improve your company’s program to contribute to a safer workplace.
GENERAL LIABILITY PREMISES
Understanding the financial impact of general liability (premises) on your business
Businesses maintain varying levels of general liability (GL) coverage, depending on the nature of their operations. Establishments that frequently welcome members of the public assume greater responsibility for customer safety and, consequently, face higher liability exposure. When an injured customer is elderly, the potential for serious injury, extended medical care and increased settlement costs can significantly escalate a GL claim.
Liability lawsuits are seeing larger verdicts, with more lawyers getting involved and new strategies changing how cases are handled. One of the biggest trends is the sharp increase in both the number and size of massive jury awards; “nuclear verdicts” over $10 million, and the even larger “thermonuclear” verdicts that exceed $100 million.
At Encova, our safety and loss control consultants evaluate the premises to identify potential liability hazards and/or exposures including conditions of sidewalks, parking lots and entryways; floor conditions; and emergency egress, among others. We offer recommendations to improve controls and reduce hazards and exposures.
Premises liability exposures affect businesses of every size and industry, arising from routine interactions with customers, vendors, employees and the public. Even a single incident, such as a slip-and-fall, property damage or injury, can lead to costly claims, legal action and reputational harm. Managing these risks is essential to protect a company’s financial stability and long-term success.
The total cost of risk from a GL claim includes not only direct financial costs, but also indirect expenses and ongoing risk control measures.
DIRECT COSTS (IMMEDIATE AND MEASURABLE)
• Insurance premiums: annual payments for general liability insurance coverage
• Insurance deductible: the portion of the claim the business must pay out of pocket before insurance coverage applies; this varies depending on the insurance policy terms
• Medical reimbursements: costs associated with hospital bills, follow-up care, physical therapy, etc.
• Claim settlement/payout: the amount paid to settle or defend the claim, either through a settlement or a court judgment; this could include compensatory damages for injury or property damage
• Legal fees: According to Sedgwick data, 64% of GL claims will at some point be litigated, having legal representation within two weeks of claim assignment. There are costs associated with hiring lawyers to defend the business in the lawsuit, including using marketing tactics like billboards and social media ads, as attorney outreach is expanding.
DIRECT COSTS
• Insurance premiums
• Insurance deductibles
• Claim settlement/payout
• Legal fees
INDIRECT AND RISK CONTROL COSTS
• Claim administration time
• Reputational damage
• Operational disruptions
• Employee morale
• Regulatory scrutiny
• Loss of business opportunities
• Delay in contracts or business deals
• Increased insurance costs
• Safety measures and changes in operational procedures

INDIRECT COSTS (SECONDARY BUSINESS IMPACTS)
• Claim administration time: Litigation can demand extensive time commitments, including legal meetings, depositions, mediations and potentially multi-week trials. The full process may last up to two years, requiring ongoing involvement from the business.
• Reputation damage: GL claims, especially high-profile ones, can harm the business’s reputation, potentially leading to loss of customers, clients or business partners.
• Operational disruptions: Time and resources spent addressing the claim could distract focus from day-to-day business operations. Employees may need to be diverted from their normal roles to handle the claim. Productivity could be lost while investigating or attending court depositions.
• Employee morale: Morale can decrease if workers feel unsafe.
• Loss of business opportunities: If the business is focused on managing the claim, it may miss out on new opportunities or fail to expand its market share.
INDIRECT COSTS (SECONDARY BUSINESS IMPACTS)
• Delay in contracts or business deals: A claim could result in delays in securing contracts, particularly if clients or partners perceive increased risk in dealing with the company.
• Regulatory fines and penalties: financial consequences imposed by authorities (e.g., civil courts, alcohol beverage control, state and local health departments, fire marshal) for non-compliance or violations that occur because of or in connection with a loss event
• Increased insurance costs over time: Following a claim, GL insurance premiums are likely to rise, and umbrella coverage adjustments occur due to the increased risk profile of the business. This increase can persist for several years, impacting the business’s financial health.
RISK CONTROL COSTS (PREVENTION INVESTMENTS FOR MINIMIZING RECURRENCE)
• Safety measures and changes in operational procedures: To mitigate future claims, a business may have to improve internal risk management procedures, invest in additional safety measures and coordinate employee training or compliance programs, contributing to ongoing costs.
Example: One night, a customer was assaulted in the parking lot of a large retail store after shopping. The attack resulted in permanent, life-threatening injuries and caused significant mental distress. The incident occurred in an area that was poorly lit and lacked surveillance cameras to record the event.
DIRECT COSTS
• Insurance premium: annual general liability insurance coverage ($1,000)
• Medical expenses*: emergency room visit, hospital stay, orthopedic care, physical therapy, mobility aids, medications and follow-up ($250,000+)
• Legal fees*: more complex case, higher claim exposure ($150,000+)
Estimated direct costs: $1,151,000+
• Settlement or judgment payout*: injury claim or permanent disability; higher compensation for pain, suffering or lost quality of life due to the preventable nature of the claim and the long-term impact to the party ($750,000+)
*Potentially transferable via insurance based on policy coverage
INDIRECT COSTS (NON-INSURED OR NON-TRANSFERABLE COSTS)
• Claim administration costs: time commitments from management, including legal meetings, depositions, mediations and potentially multi-week trials ($20,000+)
• Business disruption: store response to area with crime scene roped off; short-term loss of sales ($20,000+)
Estimated indirect costs: $440,000+
RISK CONTROL COSTS
• Physical security improvements: enhanced lighting in parking lot and installation of cameras throughout parking lot ($100,000+)
• Long term management of security monitoring: vendor cost to monitor parking lot ($150,000+)
• Reputation impact: local news stories, negative online reviews and customers sharing concerns with store management on social media reduces customer shopping ($200,000+)
• Employee training: general training for all employees on security improvements ($150 per employee x 100 employees = $15,000+)
• Insurance considerations: verify GL coverage limits and consider umbrella policy for high customer traffic
Estimated risk control costs: $265,000+
TOTAL COST OF RISK
Direct costs with insurance: $1,000+
Indirect costs: $440,000+
Risk control costs: $265,000+
Overall estimated impact: $706,000+
Direct costs without insurance: $1,150,000+
Indirect costs: $440,000+
Risk control costs: $265,000+
Overall estimated impact: $1,855,000+
Click on each title below to download the following Encova resources to address various hazards and implement safety measures to reduce GL claims:
General liability insurance business assessment checklist
On-site surveillance for premises exposures
GENERAL LIABILITY PRODUCT
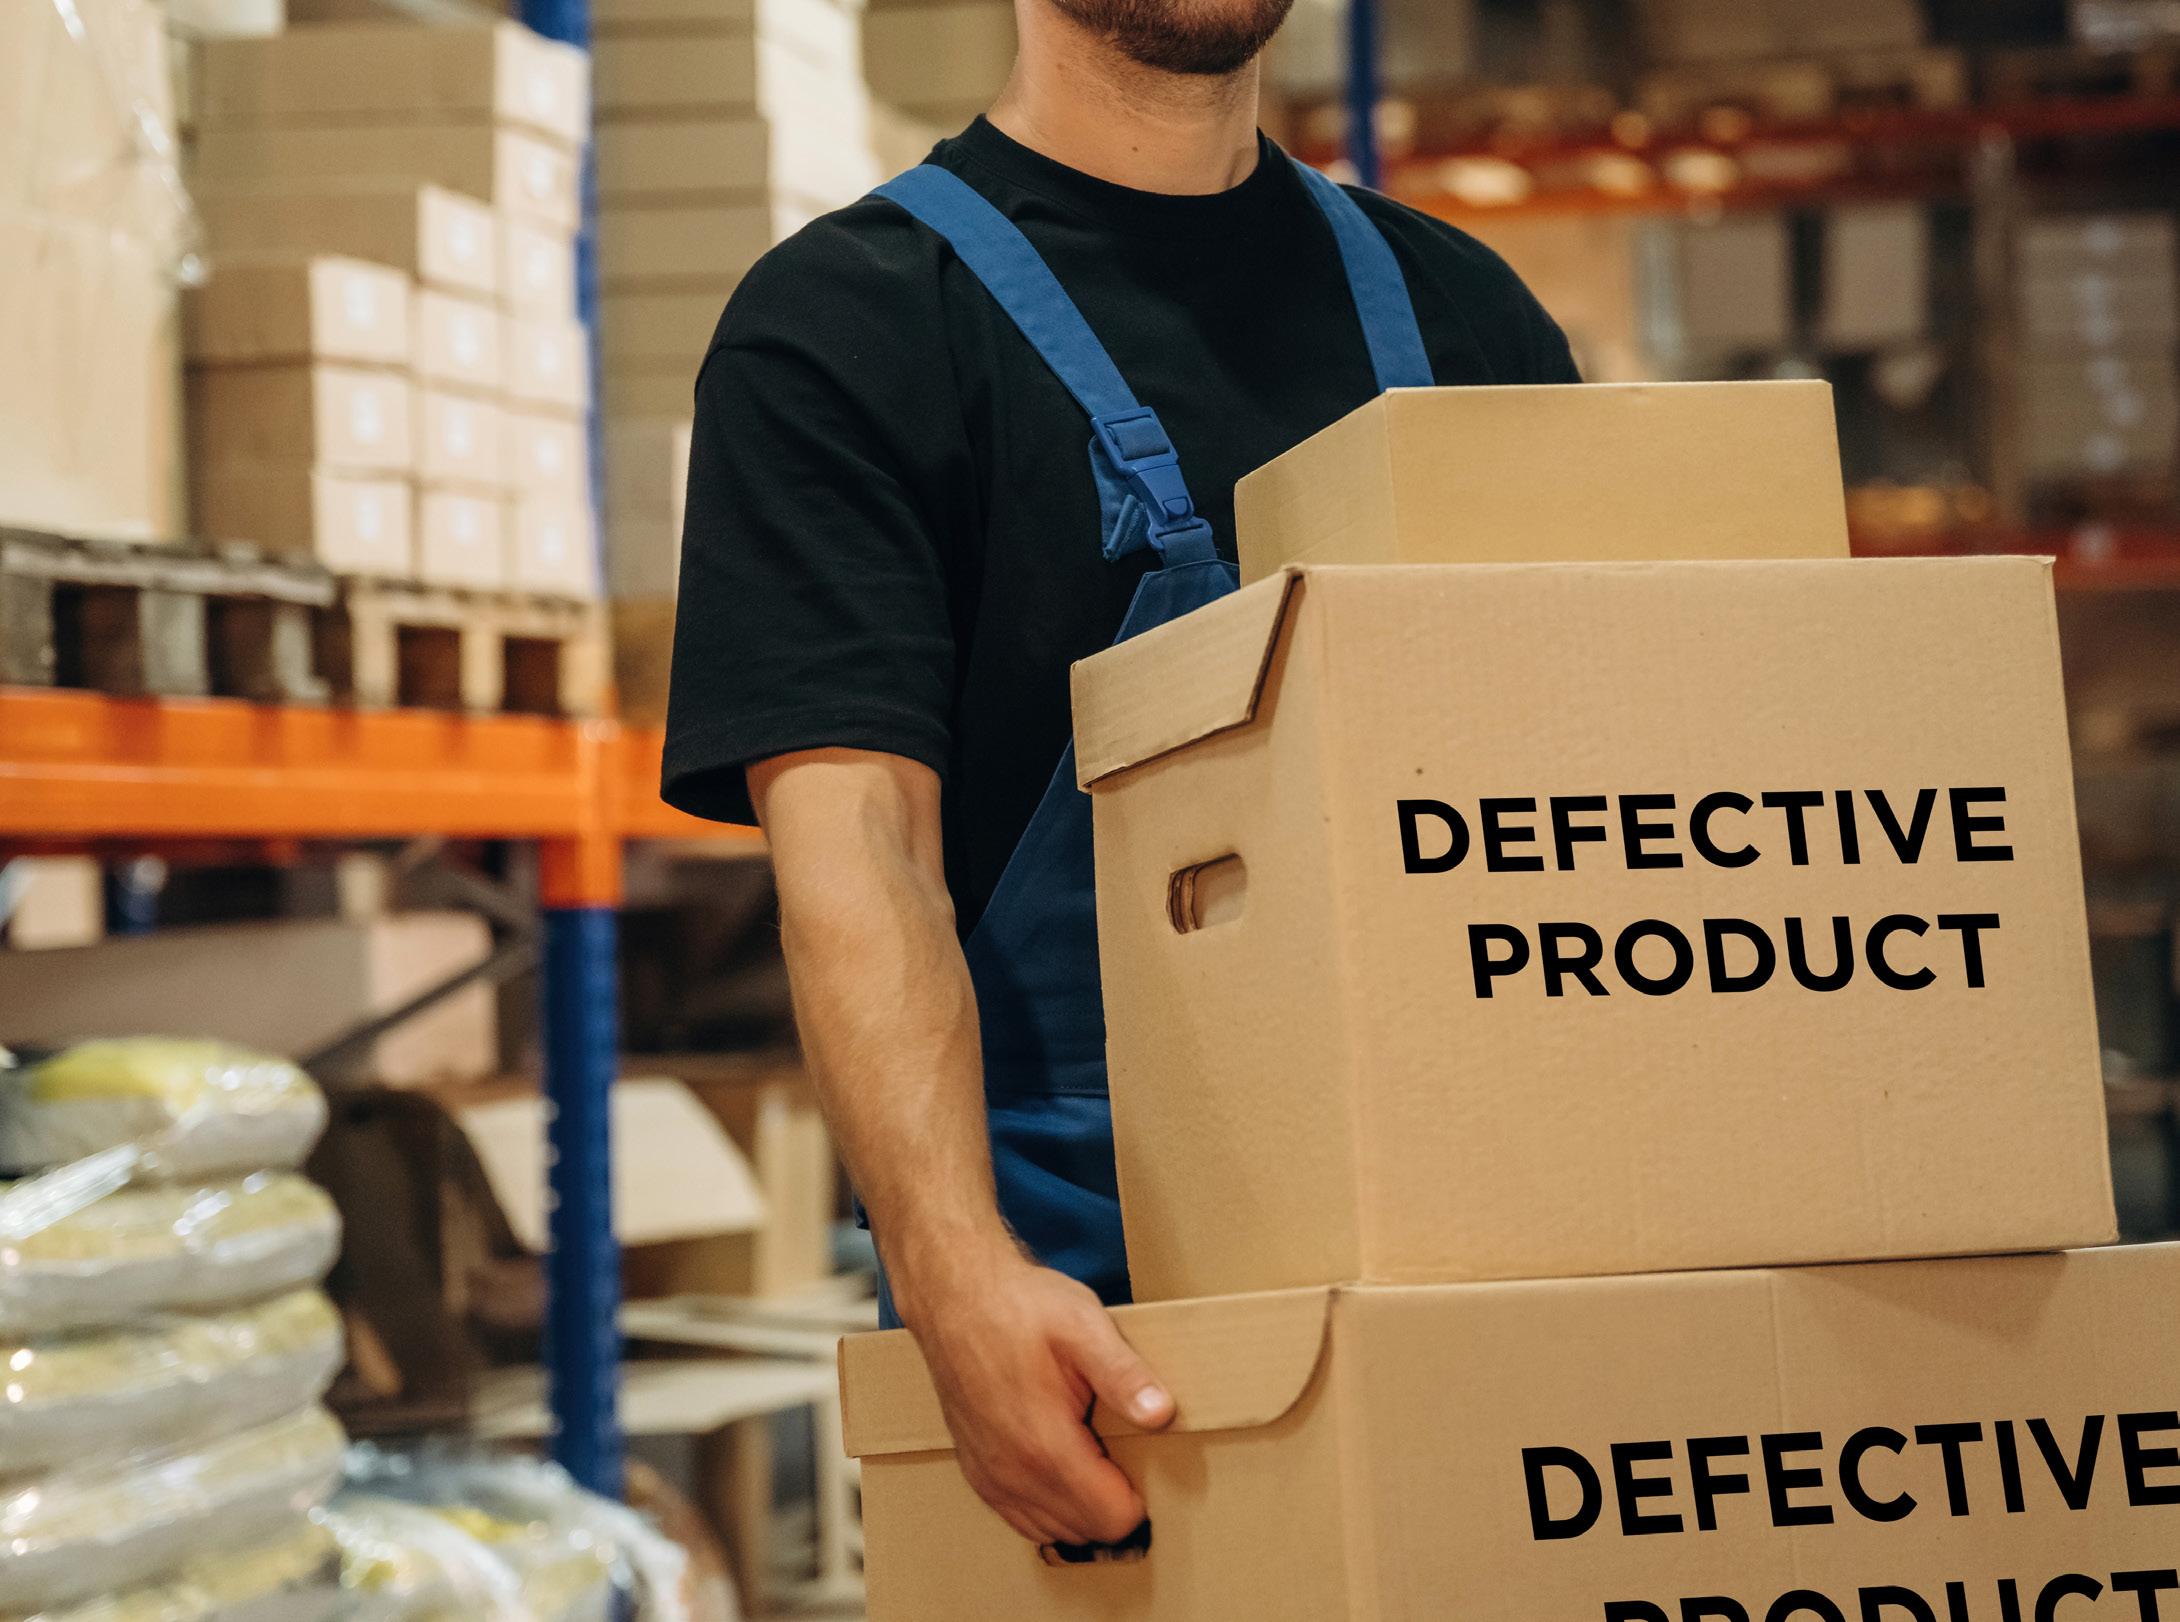
Understanding the financial impact of general liability (product) on business operations
While insurance may cover direct costs such as legal defense, settlements or product recall expenses, the indirect costs of product liability can be extremely high. Loss of consumer trust, damaged brand reputation, regulatory scrutiny, strained vendor relationships and declining sales can jeopardize a company’s long-term survival. Even when the immediate claim is resolved, many businesses struggle to fully recover from the lasting financial and reputational impacts of a defective product.
At Encova, we evaluate the potential for product liability claims by reviewing a business’s operations and products to identify product liability exposures. We offer recommendations to improve controls and reduce hazards and exposures.
Product liability is an often overlooked risk exposure and applies across most industries. Exposures are present any time a company manufactures a product or directly imports a proprietary part or product. Additionally, risks exist when an original equipment manufacturer’s product is significantly altered, changed, installed or serviced/repaired, or if damaged in storage or shipping.
The total cost of risk for a business facing a product liability claim includes both direct and indirect costs as well as risk control costs.
DIRECT COSTS (IMMEDIATE AND MEASURABLE)
• Insurance premiums: annual payments for product liability insurance coverage
• Insurance deductibles: the portion of the claim the business must pay out of pocket before insurance coverage applies; this varies depending on the insurance policy terms
• Legal costs: expenses associated with defending against the claim, including attorney fees, court costs and expert witness fees
• Settlement or judgment costs: the amount paid to the claimant, whether through a settlement or court-ordered judgment
INDIRECT COSTS (SECONDARY BUSINESS IMPACTS)
• Claim administration time: Litigation can demand extensive time commitments, including legal meetings, depositions, mediations and, occasionally, multiweek trials. The full process may last up to two years, requiring ongoing involvement from the business.
• Reputational damage: Loss of customer trust or harm to brand reputation can result in reduced sales and diminished market share. Notable product liability cases in the United States that have led to significant lawsuits include the Ford Pinto fuel tank ruptures, Takata airbags, Johnson & Johnson talcum powder, Roundup weed killer, hot coffee from McDonald’s and Blue Bell ice cream, among others.
• Operational disruption: Business operations may be interrupted while the company deals with the claim, which can lead to decreased productivity.
INDIRECT AND RISK CONTROL COSTS
INDIRECT COSTS (SECONDARY BUSINESS IMPACTS)
• Increased regulatory scrutiny: The company may face increased inspections or compliance costs, especially if the claim involves safety violations.
• Loss of customers: A product liability claim can lead to customer attrition, especially if the business faces public scrutiny.
• Insurance premium increases: After a product liability claim, a company’s future insurance premiums may rise significantly, leading to higher costs for coverage.
• Loss of competitive advantage: If the claim damages the company’s reputation or customer base, it could hinder its ability to compete in the market for an extended period.
RISK CONTROL COSTS (PREVENTION INVESTMENTS FOR MINIMIZING RECURRENCE)
• Safety measures and operational changes: costs to improve internal risk management procedures, product testing and safety measures to avoid future claims; changes include adding or updating contracts to clarify and distinguish duties and obligations of each party involved
Example: A manufacturer sells countertop blenders to retailers nationwide. One batch of blenders has a defect in the blade assembly due to a manufacturing error. A customer uses the faulty blender at home and, during normal operation, the blade assembly detaches, shattering the glass jar. The customer suffers an injury, causing permanent vision impairment and deep cuts to their hand that require stitches and leave a permanent scar.
DIRECT COSTS
• Insurance premium: annual product liability insurance coverage ($75,000)
• Medical reimbursement: hospital visit, stitches, follow-up care ($150,000+)
• Property damage reimbursement*: damaged kitchen countertops and cleanup ($2,500+)
• Legal defense fees*: lawyers, expert witnesses, court filings ($50,000)
• Settlement or judgment payout*: injury claim, pain and suffering damages ($500,000+)
• Product recall expenses*: retrieving defective units, shipping, disposal ($200,000+)
Note: If not included or purchased, the insured pays directly out of pocket.
Estimated direct costs: $977,500+
*Potentially transferable via insurance based on policy coverage
INDIRECT COSTS
• Claims administration time: time commitments from management, including legal meetings, depositions, mediations and potentially multiweek trials ($15,000+)
• Lost production time: halt in operations to investigate and correct defects ($125,000+)
• Increased insurance premiums: potentially higher product liability coverage costs ($25,000+)
• Negative publicity/public relations damage control: press releases and crisis management consultants ($20,000+)
Estimated indirect costs: $1,225,000+
• Retailer/distributor losses: refunds or chargebacks from retailers ($30,000+)
• Customer service costs: hotline staffing and complaint handling ($10,000+)
• Brand reputation damage and reduced sales: difficult to quantify; reputational recovery can take years, limiting the ability to attract new customers and increasing the risk of customers switching brands ($500,000+)
• Strained business relationships: loss of contracts with major retailers or distributors ($500,000+)
RISK CONTROL COSTS
• Future compliance and redesign costs: new product testing, redesigning blade assembly, updating safety and warning labels on product ($100,000+)
• Employee training: training and turnover costs ($150,000+)
Estimated risk control costs: $250,000+
TOTAL COST OF RISK
Direct costs with insurance: $75,000+
Indirect costs: $1,225,000+
Risk control costs: $250,000+
Overall estimated impact: $1,550,000+
Direct costs without insurance: $902,500+
Indirect costs: $1,225,000+
Risk control costs: $250,000+
Overall estimated impact: $2,377,500+
WORKERS’ COMPENSATION
Understanding the financial impact of workers’ compensation claims on your business
While insurance covers medical bills and wage replacement for a workers’ compensation claim, the indirect costs can be extremely high. Lost productivity, overtime for replacements, training new staff and disruptions to operations all take a toll on your bottom line. A returnto-work program helps limit these expenses by getting injured employees back to work sooner while maintaining productivity, reducing overtime and supporting morale, ultimately lowering the total cost of a claim.
The Encova 360° Impact workers’ compensation approach focuses on partnering with employers to reduce their total cost of risk. Our safety and loss control consultants focus on accident prevention through a consultative loss control approach, and our safety services are designed to reduce exposure to loss and strengthen a policyholder’s approach to safety.
We offer a wide variety of resources to assist businesses with their loss prevention efforts, including safety posters, handouts, customizable safety programs, written policies and procedures, inspection checklists, training presentations, and online training videos. To request resources, contact safety360@encova.com or your Encova safety and loss control consultant.
The total cost of risk for a business facing a workers’ compensation claim extends far beyond the direct medical and indemnity payments. Indirect costs accumulate quickly; lost productivity, overtime for replacement workers, hiring and training expenses, and lower employee morale all drive up the financial impact of a claim. Risk control costs also become necessary, such as investing in safety training, ergonomic improvements or updating equipment to reduce recurrence. Businesses face potential increased premiums, reputational challenges in retaining and recruiting employees, and disruptions that accompany workplace injuries.
DIRECT COSTS (IMMEDIATE AND MEASURABLE)
• Insurance premiums: annual payments for workers’ compensation insurance policy
• Insurance deductible: the portion of the claim the business must pay out of pocket before insurance coverage applies if the policy is not written on a guaranteed cost plan
• Medical expenses: hospital visits, surgery, rehabilitation, prescriptions, etc., escalated by severity of injuries
• Indemnity/wage replacement payments: lost wages for injured employees and expenses related to potential permanent impairment; without a return-to-work program, indemnity costs increase the overall cost of the claim
• Claim administration/legal defense: potential case management and attorney fees
DIRECT COSTS
• Insurance premiums
• Insurance deductible
• Medical expenses
• Indemnity/wage replacement payments
• Claim administration/legal defense
INDIRECT AND RISK CONTROL COSTS
• Lost productivity
• Overtime/temporary workers
• Hiring and training replacement staff
• Supervisor/management time
• Reputation/employer brand
• Regulatory fines and penalties
• Increased insurance costs over time
INDIRECT COSTS (SECONDARY BUSINESS IMPACTS)
• Lost productivity: Other employees must cover shifts or production slows.
• Overtime/temporary workers: filling the gap left by an injured employee
• Hiring and training replacement staff: recruiting costs, onboarding and training
• Supervisor/management time: investigating the incident, completing paperwork and coordinating with insurers
• Reputation/employer brand: negative perception among job seekers if the workplace is seen as unsafe (loss of qualified candidates)
• Regulatory fines and penalties: financial consequences imposed by authorities (e.g., OSHA, DOT, DOL, state workers’ compensation agencies) for non-compliance or violations that occur because of or in connection to a loss event
• Increased insurance costs over time: Insurance premiums may increase as the business’s risk profile changes. These higher costs can persist for several years and affect the company’s financial stability. When calculating the National Council on Compensation Insurance’s (NCCI) experience modification factor (EMR), claims that include indemnity benefits are not discounted. However, if a claim is medical-only, a 70% discount is applied in the EMR calculation.
RISK CONTROL COSTS (PREVENTION INVESTMENTS FOR MINIMIZING RECURRENCE)
• Safety measures and operational changes: To mitigate future claims, a business may have to improve internal risk management procedures, invest in additional safety measures and coordinate employee training or compliance programs, contributing to ongoing costs.
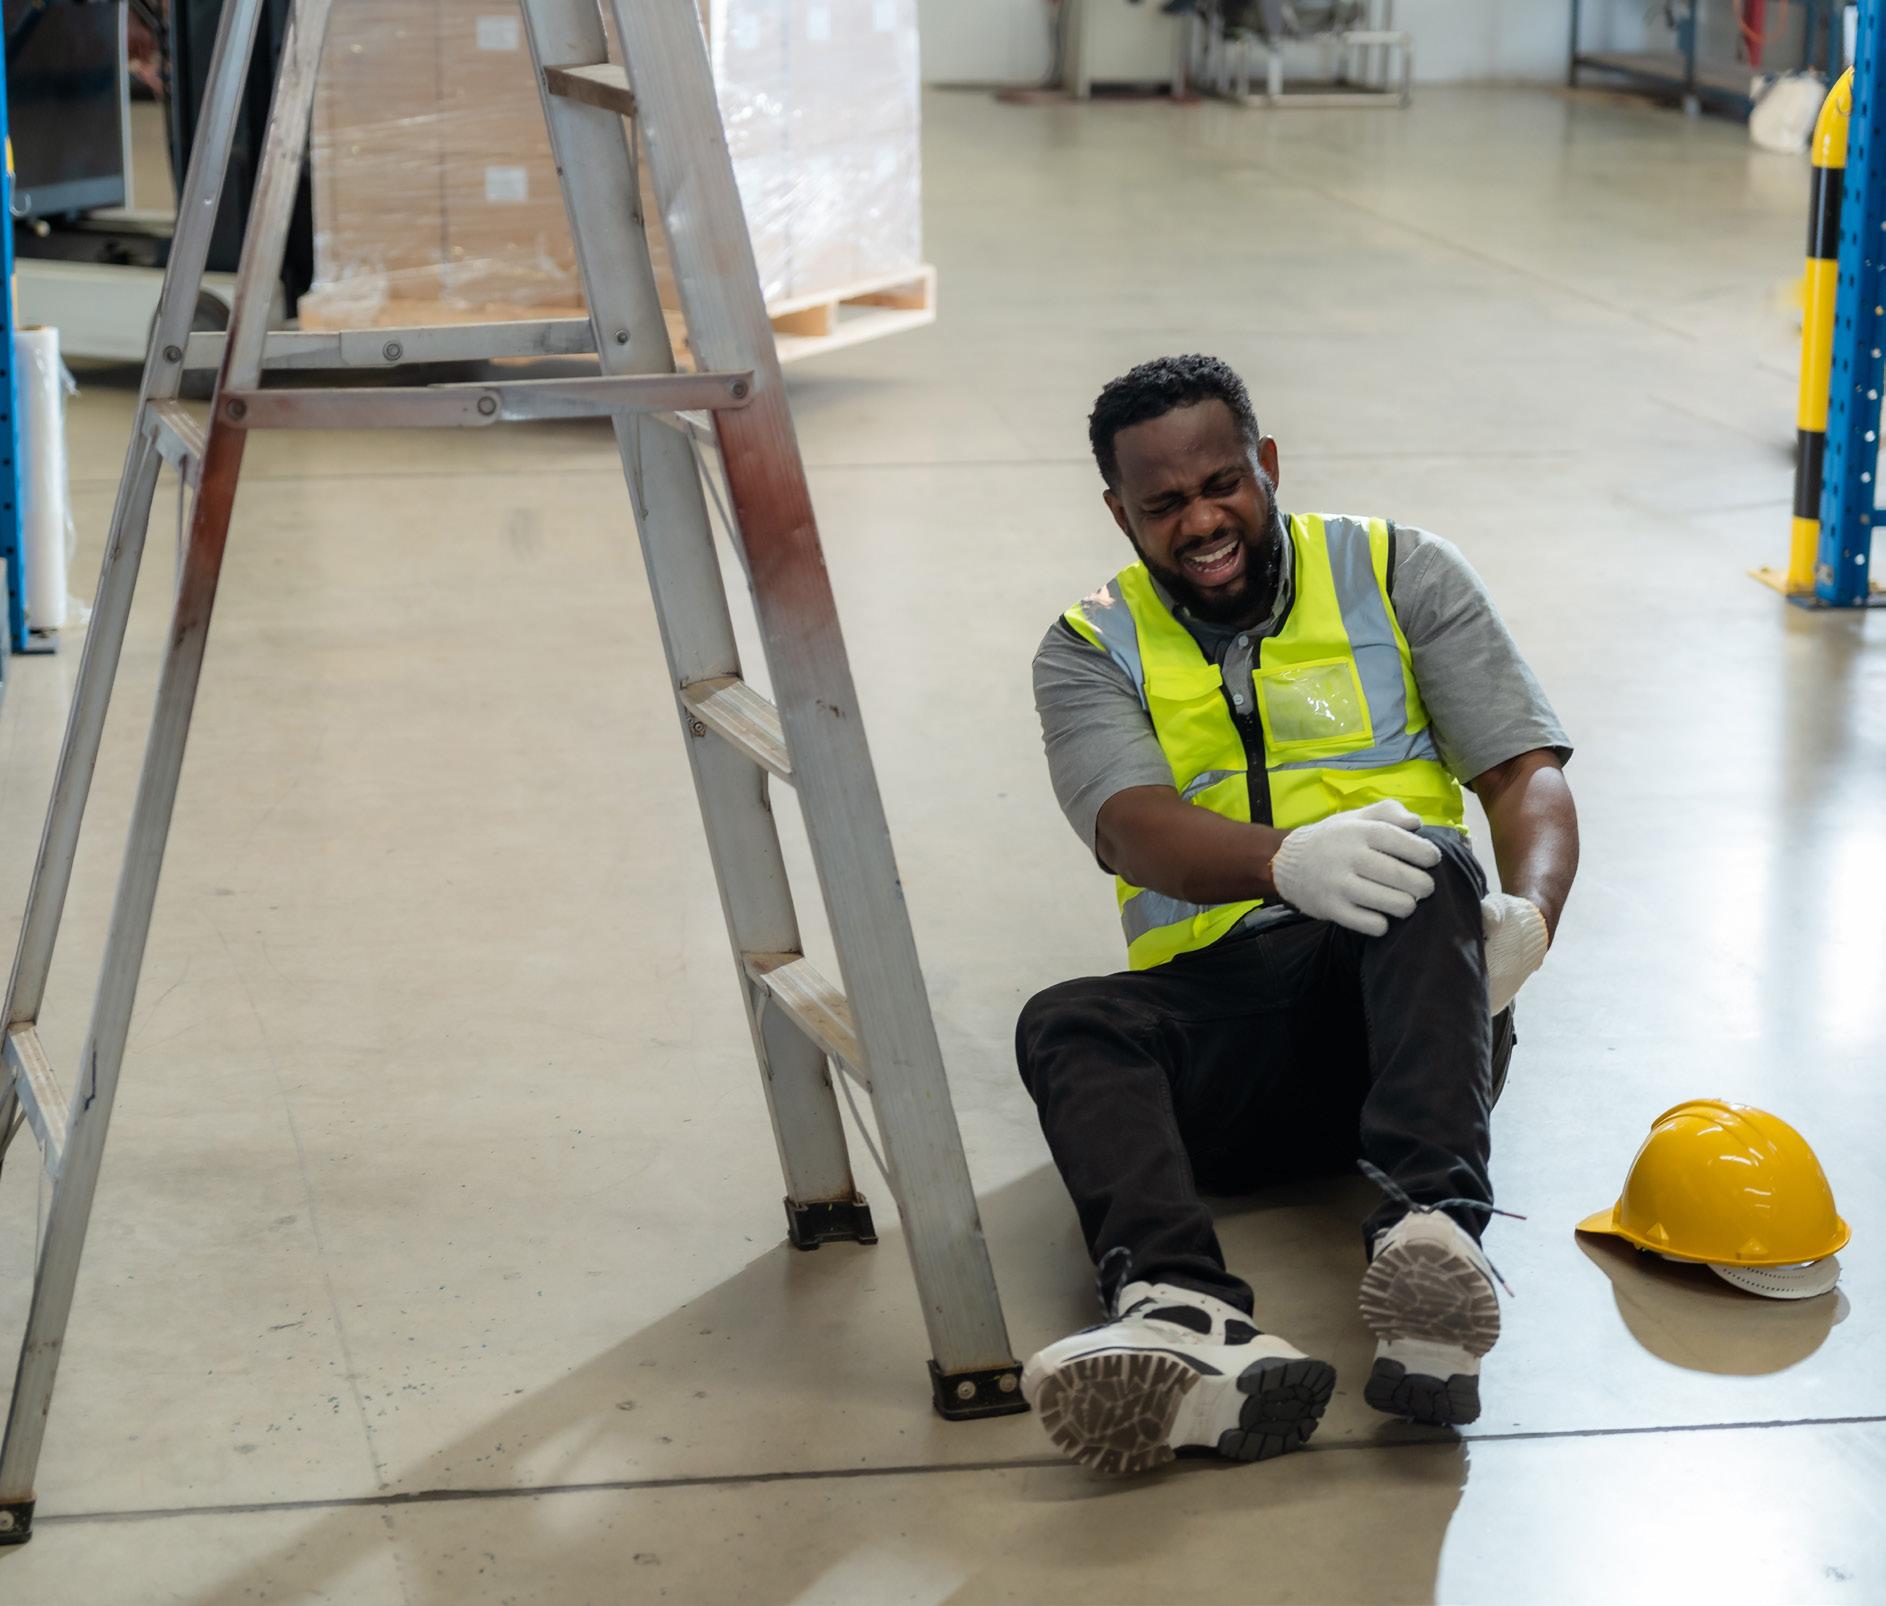
Example: A warehouse worker is lifting heavy boxes from a conveyor belt to a pallet and experiences a sudden onset of pain in their lower back. After seeking medical attention, the injury is diagnosed as a low back strain and the employee takes several months of wage replacement benefits.
DIRECT COSTS
• Insurance premium: annual workers’ compensation insurance coverage ($60,000+)
• Medical expenses*: physician/hospital visits, diagnostic imaging (x-ray/MRI), lumbar procedures due to herniated disc, physical therapy, pain management and prescriptions ($75,000+)
Estimated direct costs: $177,800+
• Indemnity/wage replacement payments:* 16 weeks of temporary total disability ($800/week) plus permanent impairment, totaling $20,000 ($32,800)
• Claim administration/legal defense:* legal expenses ($10,000+)
*Potentially transferable via insurance based on policy coverage
INDIRECT COSTS (NON-INSURED OR NON-TRANSFERABLE COSTS)
• Overtime/temporary workers: coverage by other staff or temporary workers ($20,000+)
• Hiring and training replacement staff: possibility of employee turnover, training temporary staff or redistributing tasks ($5,000+)
Estimated indirect costs: $52,000+
• Supervisor/management time: investigating the incident, completing paperwork and coordinating with insurers ($2,000+)
• Increased insurance costs over time: increased experience modification factor and higher frequency and severity of liftingrelated strain injuries ($25,000+)
RISK CONTROL COSTS
• Ergonomic equipment improvements: conveyor belt redesigned to reduce unnecessary lifting and integrated adjustable pallet leveling ($25,000+)
Estimated indirect costs: $25,000+
TOTAL COST OF RISK
Direct costs with insurance: $60,000+
Indirect costs: $52,000+
Risk control costs: $25,000+
Overall estimated impact: $137,000+
• Manual handling/lift training: employee downtime to participate in training program for all warehouse staff ($5,000+)
Direct costs without insurance: $117,800+
Indirect costs: $52,000+
Risk control costs: $25,000+
Overall estimated impact: $194,800+
Click on each title below to download the following Encova resources:
Workplace injuries have many hidden costs and safety and loss control strategy
Bringing injured workers full circle
Return to work – claim gone right, claim gone wrong
Roadmap to safety success
Disclaimer: The cost figures and examples shown are for educational purposes only and are based on a hypothetical business scenario. Actual total cost of risk (TCOR) results vary based on your organization’s operations, claims and insurance program. These illustrations are intended to demonstrate how proactive risk management can influence overall cost outcomes and should not be interpreted as a guarantee of future performance or pricing.