This presentation and the information contained herein (the “Presentation”) has been prepared by Formation Metals Inc (“Formation” or the “Company”) for the use of prospective investors for the purpose of evaluating a potential investment in securities of Formation.
This Presentation provides general background information about the activities of Formation. Information disclosed in this Presentation is current as of March 18, 2025, except as otherwise provided herein and Formation does not undertake or agree to update this Presentation after the date hereof All information is derived solely from management of Formation and otherwise publicly available third-party information that has not been independently verified by the Company Further, it does not purport to be complete nor is it intended to be relied upon as advice (legal, financial, tax or otherwise) to current or potential investors. Each prospective investor should contact his, her or its own legal adviser, independent financial adviser or tax adviser for legal, financial or tax advice.
No representation or warranty, express or implied, is made or given by or on behalf of Formation or any of its affiliates, directors, officers or employees as to the accuracy, completeness or fairness of the information or opinions contained in this Presentation and no responsibility or liability is accepted by any person for such information or opinions No person has been authorized to give any information or make any representations other than those contained in this Presentation and, if given and/or made, such information or representations must not be relied upon as having been so authorized.
This presentation includes certain “forward-looking information” and “forward-looking statements” (collectively “forward-looking statements”) within the meaning of applicable Canadian and United States securities legislation including the United States Private Securities Litigation Reform Act of 1995. This information and these statements, referred to herein as “forward looking statements”, are made as of the date of this Presentation or as of the date of the effective date of information described in this presentation, as applicable Forward-looking statements are statements that relate to future, not past, events In this context, forward-looking statements often address expected future business and financial performance, and often contain words such as "anticipate", "believe", "plan", "estimate", "expect", and "intend", statements that an action or event "may", "might", "could", "should", or "will" be taken or occur, or other similar expressions. By their nature, forward-looking statements involve known and unknown risks, uncertainties and other factors which may cause our actual results, performance or achievements, or other future events, to be materially different from any future results, performance or achievements expressed or implied by such forward-looking statements. Such factors include, among others, the following risks: the need for additional financing; operational risks associated with mineral exploration; fluctuations in commodity prices; title matters; and the additional risks identified on the Company’s website or other reports and filings with the TSX Venture Exchange and applicable Canadian securities regulators Forward-looking statements are made based on management's beliefs, estimates and opinions on the date that statements are made and the Company undertakes no obligation to update forward-looking statements if these beliefs, estimates and opinions or other circumstances should change, except as required by applicable securities laws Investors are cautioned against attributing undue certainty to forward-looking state.
This presentation contains certain information pertaining to historical results. The historical results contained in this presentation have not been verified as current mineral resources and are not contained in a National Instrument 43-101 technical report and therefore should not be relied upon for assessing the merits of any projects A qualified person has not done sufficient work to classify the historical estimate as current mineral resources or mineral reserves, and Usha is not treating the historical estimate as current mineral resources or mineral reserves Accordingly, these historical estimates are presented only for the purposes of assisting in describing the extent of mineralization and to outline the exploration potential These estimates should not be relied upon. No assurances can be made that exploration targets will be developed into resources or reserves. The exploration targets are conceptual in nature and relies on projections of mineralization that are beyond the standard CIM classification of mineral resources and should not be relied on as mineral resource estimates The Company’s future exploration work will include verification of the data The potential quantity and grade of any exploration target in this presentation is conceptual in nature, there has been insufficient exploration to define a mineral resource and it is uncertain if further exploration will result in the exploration target being delineated as a mineral resource. Mineralization hosted on adjacent and/or nearby and/or geologically similar properties is not necessarily indicative of mineralization hosted on the Company’s property In general, Formation believes that there is potential to expand these historical results/estimates to a significant drill discovery through an initial round of exploration drilling and by closer-spaced infill drilling to standards suitable for formal resource estimation.
Although the Company has attempted to identify important factors that could cause actual results to differ materially from those contained in forward-looking information, there may be other factors that cause results not to be as anticipated, estimated or intended. There can be no assurance that such information will prove to be accurate, as actual results and future events could differ materially from those anticipated in such information. Accordingly, readers should not place undue reliance on forward looking information Formation and its directors, officers and employees disclaim any obligation to update any forward-looking statements, whether as a result of new information, future events or results or otherwise, except as required by applicable law Accordingly, current and potential investors should not place undue reliance on forward-looking statements due to the inherent uncertainty therein. All forward-looking information is expressly qualified in its entirety by this cautionary statement.
This Presentation does not constitute an offer to sell or the solicitation of an offer to buy securities in any jurisdiction in which such offer, solicitation or sale would be unlawful. The technical content of this presentation has been reviewed and approved by Deepak Varshney, P.Geo., who is a Qualified Person as defined by National Instrument 43-101. Mr. Varshney has not verified the historical data disclosed, including sampling, analytical and test data underlying the information or opinions contained in the written disclosure
Flagship Asset: N2 Project – 877,000 Global Ounces
18.2 Mt @ 1.48 g/t Au (810,000 ounces of Gold)*
243 Kt @ 7.82 g/t Au (67,000 ounces of Gold)*
*Based on the Historic 1993 NI 43-101 Non-Compliant Resource
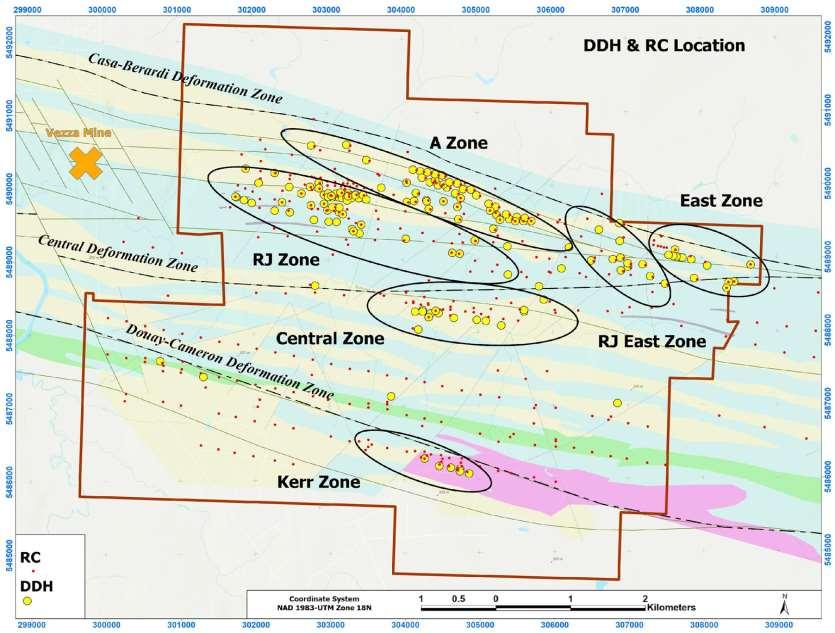
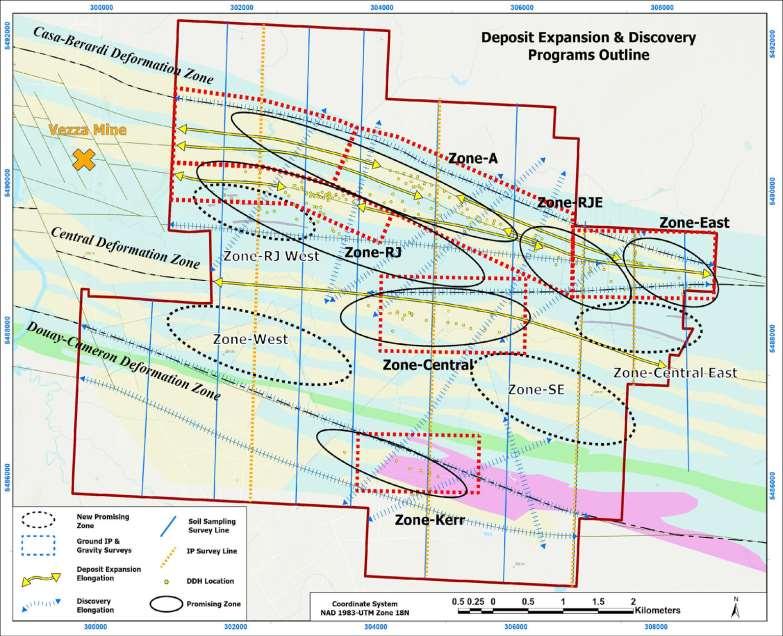
The N2 deposit consists of 6 mineralized zones, each of which has significant room for expansion and are open along strike and at depth.
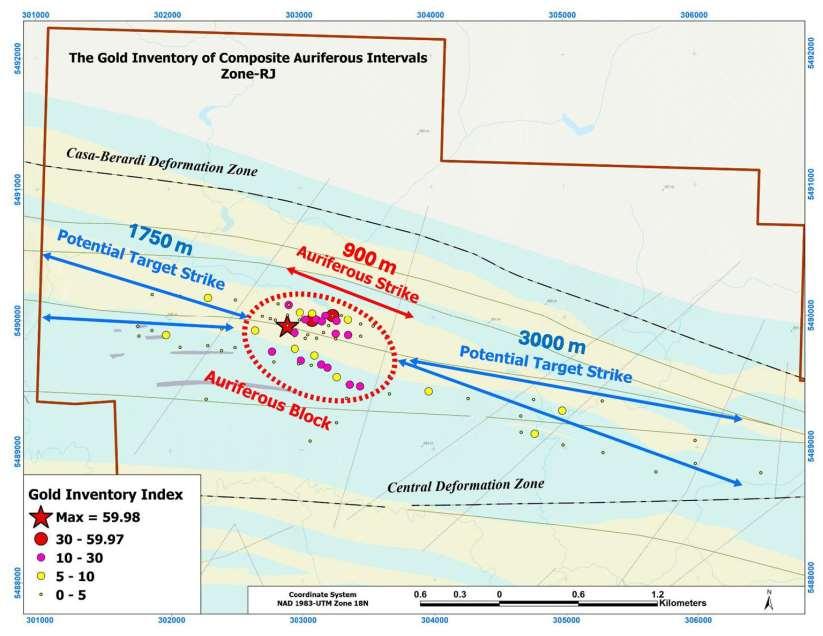
The “RJ” Zone hosts intercepts as high as 51.26 g/t Au over 0.8 metres, 48.44 g/t Au over 0.5 metres, and 24.48 g/t Au over 0.9 metres. 900 metres of strike has been drilled, with over 4.75 km of strike remaining to be tested.
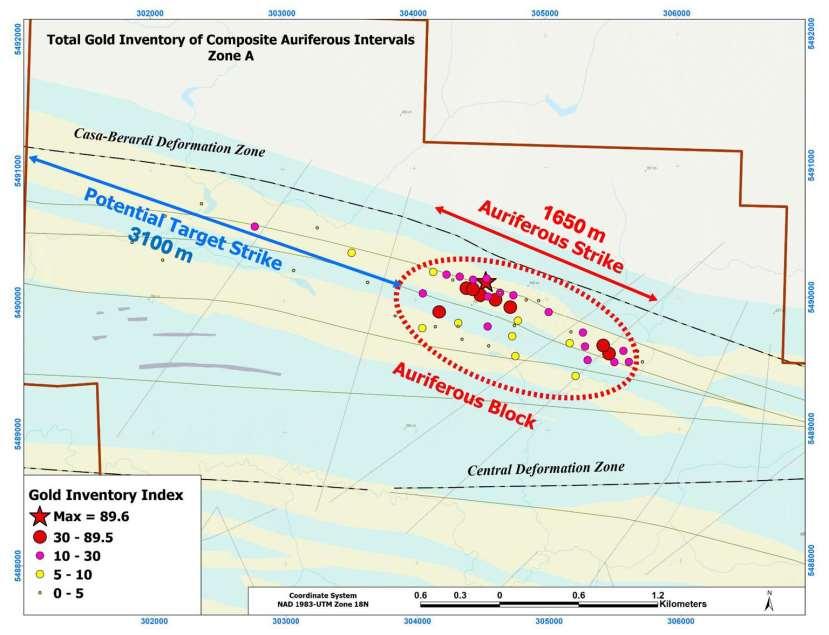
The “A’ zone, which comprises the largest historical resource, 522,900 oz @ 1.52 g/t Au, has had ~15 km drilled over 1.65 km of strike with 3.1+ km remaining to be tested; open at depth.
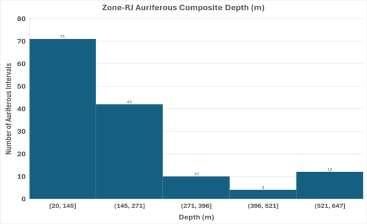
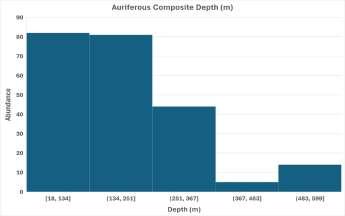
84% of drillholes intercepted auriferous intervals, with 11 intercepting >30 g*m Au up to a metal factor of 94 over a 56.6 metre composite starting at 18 metres depth.
~45 million shares outstanding
~67% ownership by insiders, management, and strategic shareholders
~$2M working capital
The management team and largest shareholders are from the Varshney Family Office, known for their successful ventures in the Mining and Real Estate industries.
Over the past three decades, they have successfully founded and funded projects >$100M.
Rerating Opportunity

~$14M market cap in a tightly structured company that trades at a significant discount to peers. Sitka Gold Corp., $161M MC, and Mayfair Gold Corp., $191M MC, are developing similar gold deposits with lower grades.
The Abitibi Greenstone Belt is the world’s largest mineralrich geological belt, hosting many major gold and base metal deposits.
>100 mines have produced in excess of 200 million oz of gold ore since the late 1800s.
45,011,474 $14.3M
P.Geo., CEO & Director
26,504,000 71,515,474 RESERVED
Over 15 years of experience in the capital markets and mineral exploration and development sector. Has been instrumental in raising over $40 million in the last three years. Holds a Bachelor of Science in Geosciences from Simon Fraser University.
Adrian Smith
P.Geo.,
Advisor
Corporate advisor and resources
executive with experience in precious and base metals in North America. Degree in Geology. Former Underground Mine Geologist, was involved in successfully identifying, modeling, and producing ore in addition to known reserves.
markets and mineral exploration and development sector. Has been instrumental in raising over $40 million in the last three years. Holds a Bachelor of Science in Geosciences from Simon Fraser University.
Why the Abitibi Greenstone Belt?
World’s largest mineral-rich greenstone belt.
Over 200 Moz of gold produced. Host to hundreds of deposits and active mining operations.

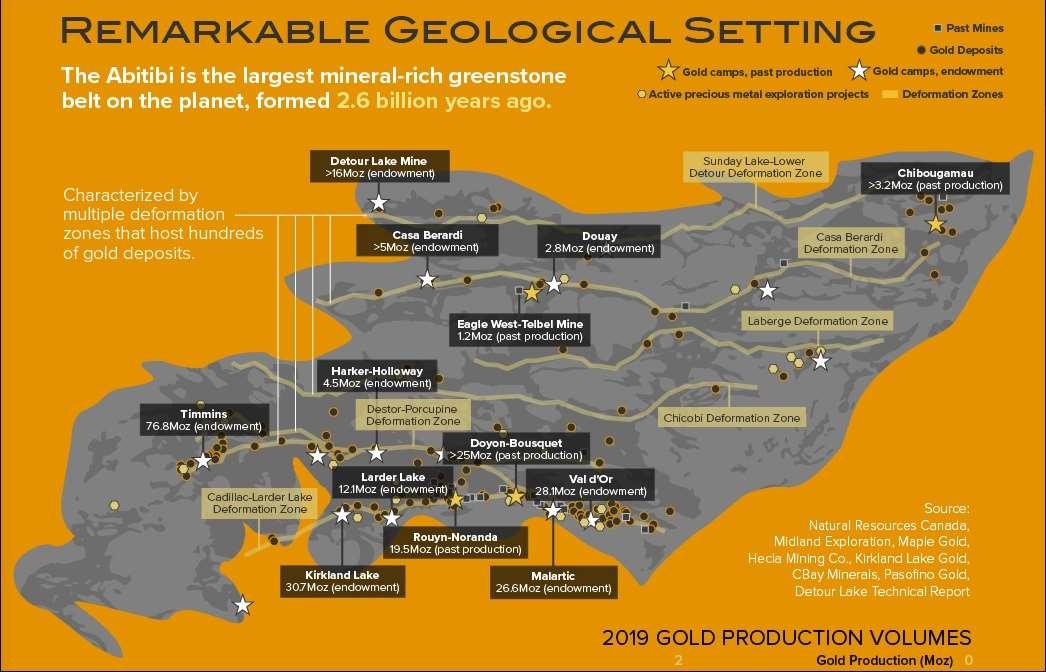
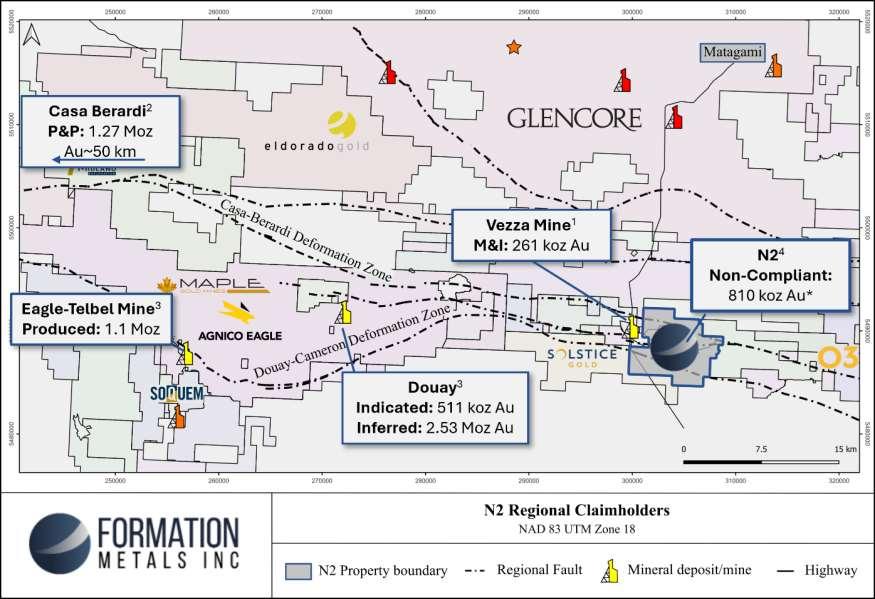
A major gold-bearing structural corridor in Québec. Home to world-class deposits like Casa Berardi, Estrades, and Vezza. A proven source of high-grade gold production.
• ~4,400 hectares, 87 claims under 100% from Wallbridge Mining Company
• Mesothermal gold system located within the Casa Berardi Deformation Zone
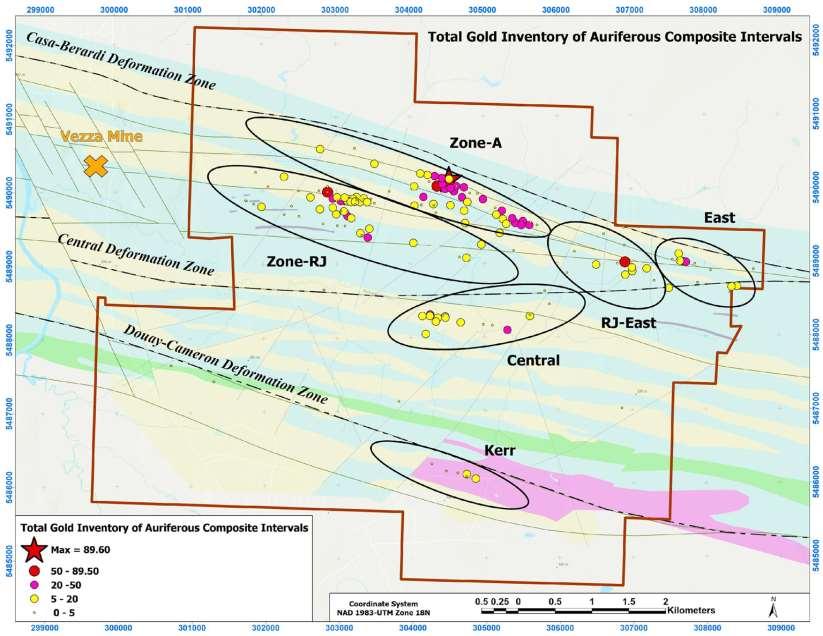
• 1.5 km east of the Vezza gold mine; ~120 km east of the Casa Berardi gold mine (P&P 1.3 Moz Au)
• 236 diamond drill holes; 55,517 metres
• 2 historical (1994) resources totalling ~877,000 oz Au across 6 zones open along strike and at depth
• Mineralization starts at surface
Main Resource: 810,000 oz
Mt @ 1.48 g/t Au
Secondary Resource: 61,000 oz
Kt @ 7.82 g/t Au


Drilling History:
236 diamond drill holes; 55,517 metres. Deepest hole reached 682 metres; average depth 244m.
70% of diamond drill holes intercepted >0.5 gpt gold.

Metallurgical Testing:
Preliminary tests recovered 91.7% gold through flotation concentrate.

Geophysical Work
Multiple Surveys (IP, magnetics, VTEM) refined exploration targets
1981: Gold mineralization discovered by Minnova Inc.
1983: Cyprus Canada Ltd. identifies five key gold zones
1991: Historic resource estimate of 243 Kt @ 7.82
g/t Au (~67,000 oz) (non-NI 43-101) for RJ Zone by Cypress
1993: Historic resource estimate of 18.2 Mt @ 1.48
g/t Au (~810,000 oz) (non-NI 43-101) for A,
Central, RJE and South Zones by Cypress
2007-2009: Agnico-Eagle discovers new hanging
wall zones at RJ
• Mesothermal gold system located within the Casa Berardi Deformation Zone (CBDZ)
• 2 domains separated by the CBDZ; deposit is steeply dipping (near-vertical)
• Six known zones of gold mineralization; two principal zones of gold mineralization are the RJ and A zones, both of which are within the potential capture radius of the Vezza headframe. All six of the zones remain open for expansion, either at depth or along strike
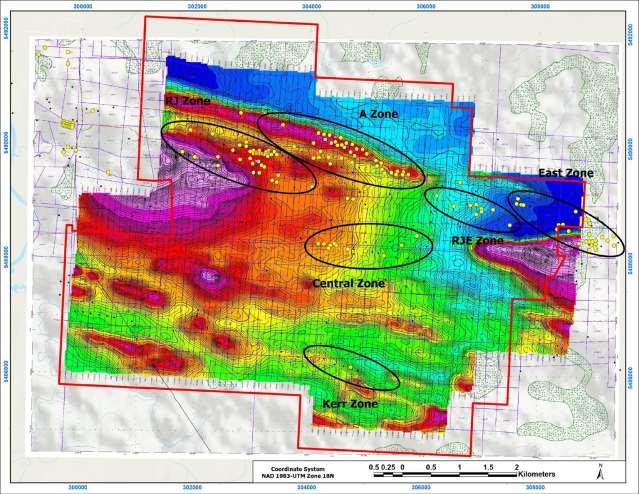
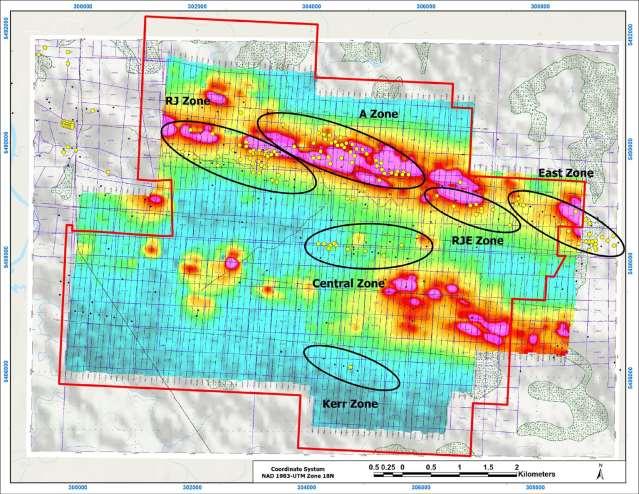
Five key mineralized zones, offering significant exploration potential
• A Zone: 55 drillholes, 14,693 m, 84% intercepted Au up to 1.8 g/t over 32 m with a metal factor of 94; 1.65 km strike drilled, 3.1 km+ strike open
• RJ Zone: 82 drillholes, 20,875 m, 76% intercepted Au up to 48 g/t over 0.5 m / 16.5 g/t over 3.6 m; metal factor 60; 900 m strike drilled, 4.75 km+ strike open
• Central Zone: 29 drillholes, 6,090 m, 62% intercepted Au gold; 1.1 km strike drilled, 5 km+ strike open
• RJE Zone: 17 drillholes, 3,816 m, 76% intercepted Au up to 51.26 g/t over 0.8 m; 300 m strike drilled, 1.7 km+ strike open
• East Zone: 14 drillholes, 2,474 m, 93% intercepted Au up to 11.3 g/t over 0.6 m; 300 m
drilled, 1.95 km+ strike open Zone Tonnage
High-grade bonanza style mineralization / Bulk tonnage
• 82 drillholes, 20,875 metres, 76% intercepted Au
• Best metal factor: 60, 4.6 metre composite; 9 ddh >20 g*m
• Top intercepts: 51.26 g/t Au over 0.8 metres, 48.4 g/t over 0.5 m; 16.5 g/t over 3.6 m; 0.95 g/t over 18.3 m
• 900 m strike drilled; 4.75 km+ strike open
• Two styles of mineralization
• Excellent continuity
• Targeted drilling to define high-grade shoots and test down-plunge extensions
Bulk tonnage deposit
• 55 drillholes, 14,693 metres, 84% intercepted Au
• Best metal factor: 94, 56.6 metre composite starting at 18 metres depth up to 2.08 g/t; 19 ddh >20 g*m, 11 >30 g*m
• Top intercepts: 13.4 g/t over 1.13 m; 8.8 g/t over 1.8 m; 1.8 g/t over 32 m, 2.0 g/t over 15.0 m
• 1.65 km strike drilled, 3.1 km+ strike open
• Large continuous mineralization over significant widths with excellent continuity
• Prime target for resource expansion and classification; high success rate in drilling suggests potential for a substantial gold deposit
• Data compilation (completed)
• 2D/3D modelling (on-going)
• Comprehensive geophysics (April-May)
• Comprehensive soil sampling program (AprilMay)
• Drill permitting
• Resource expansion program (June-July)
• 5,000 metres “A” Zone
• 5,000 metres “RJ” Zone
• Discovery program (June-July)
• 2,000 metres “RJE” Zone – 76% Au rate
• 2,000 metres “Central” Zone – 62% Au rate
• 2,000 metres “East” Zone – 93% Au rate
The opportunity:
• The N2 deposit remains open along strike and depth representing significant opportunities for resource expansion.
• FOMO is currently Trading at an EV/oz of contained gold of US$6.2/oz, relative to peers trading at US$15.8/oz, representing a 155% valuation disconnect.
*As of market close January 22, 2025.
** Formation Metals N2 deposit is based on historical resource
***in-situ value based on US$25/oz Au in the ground
Advanced gold deposit with a global historic resource of 877,000 ounces and six mineralized zones, each open for expansion along strike and at depth including the “A” zone, of which only ~35% of strike has been drilled, and the “RJ” zone, host to bonanza intercepts as high as 51 gpt Au over 0.8 metres


~$2M working capital provides ample runway to execute programs at each of the Company’s projects

~$14M market cap in a tightly structured company that trades at a significant discount to peers. Sitka Gold Corp., $161M MC, and Mayfair Gold Corp., $191M MC, are developing similar gold deposits with lower grades


Collectively, management has over 100 years of experience in the capital markets and the exploration sector and have successfully founded and funded projects >$100M.
~45M shares outstanding, with ~67% of which are held by insiders, management, and strategic shareholders