1 ]
INTRODUCTION
In 2015, the annual mean global atmospheric carbon dioxide (CO2) level surpassed 400 parts per million (ppm; Figure 1.1), and we know very well that this rise is caused by human activities (Figure 1.2). It was the first time in 3 million years that such a level had been reached. Crossing this level has caused widespread concern among climate scientists, and not least among those called paleoclimatologists, who work on natural climate variability in prehistoric times, before humans.
Over the last few decades, researchers have been repeatedly raising the alarm that emissions of CO2, along with those of other greenhouse gases, are getting dangerously out of control and that urgent remedial action is needed. With the crossing of the 400 ppm threshold, this sense of urgency reached a climax: at the Conference of Parties 21 meeting in Paris—also known as COP21 or the 2015 Paris Climate Conference—broad international political agreement was reached to limit global warming to a maximum of 2°C, and if at all possible 1.5°C, by the end of this century. If one calculates this through, this implies a commitment for society to operate on zero net carbon emissions well before 2050, along with development and large-scale application of methods for CO2 removal from the climate system. (Scientists focus on carbon (C) emissions when they discuss emissions because it helps in calculating CO2 changes produced by the processing of specific volumes/masses of fossil fuel hydrocarbons.) Clearly, the challenge is enormous, especially given that even implementing all the pledges made since COP21 would still allow warming to reach about 3°C by 2100. But, regardless, the agreement was ground breaking. It was a
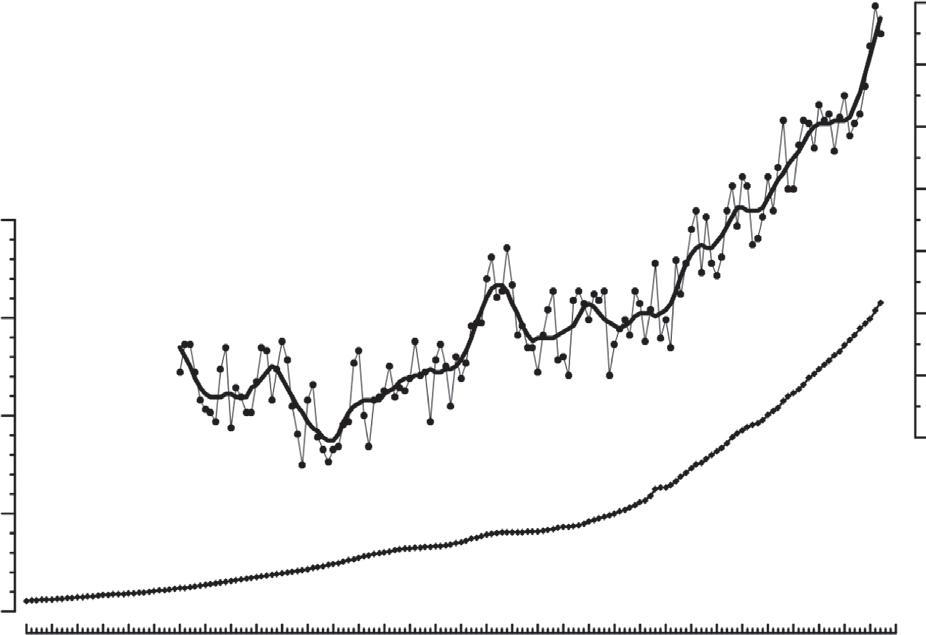
Figure 1.1. Historical changes in key climate factors. Bottom: Annual mean global CO2 levels.i Top: Global average surface temperature.ii In the temperature graph, the thick line shows the long-term change by smoothing out shortterm variability. The temperature developments over time are extremely similar between six independent assessments, some of which include data from 1850 onward.iii
i. https://www.co2.earth/historical-co2-datasets
ii. https://data.giss.nasa.gov/gistemp/graphs/
iii. http://berkeleyearth.org/global-temperatures-2017/
marker of hope, optimism, and international motivation to tackle climate change.
Moreover, there are concerns about the stated COP21 targets. First, the proposed 2°C or 1.5°C limits to avoid “dangerous” climate impacts may sound good, but there is no specific scientific basis for picking these particular numbers.1 Second, the implied “end of this century” deadline is an arbitrary moment in time. It’s not as if the ongoing climate changes will stop at that time, even if we managed to stop all emissions. Instead, change will continue, as well-known slow processes in the climate system adjust to the initial disturbances observed in recent history (Figure 1.1). These slow processes include ocean warming (first the surface, then also
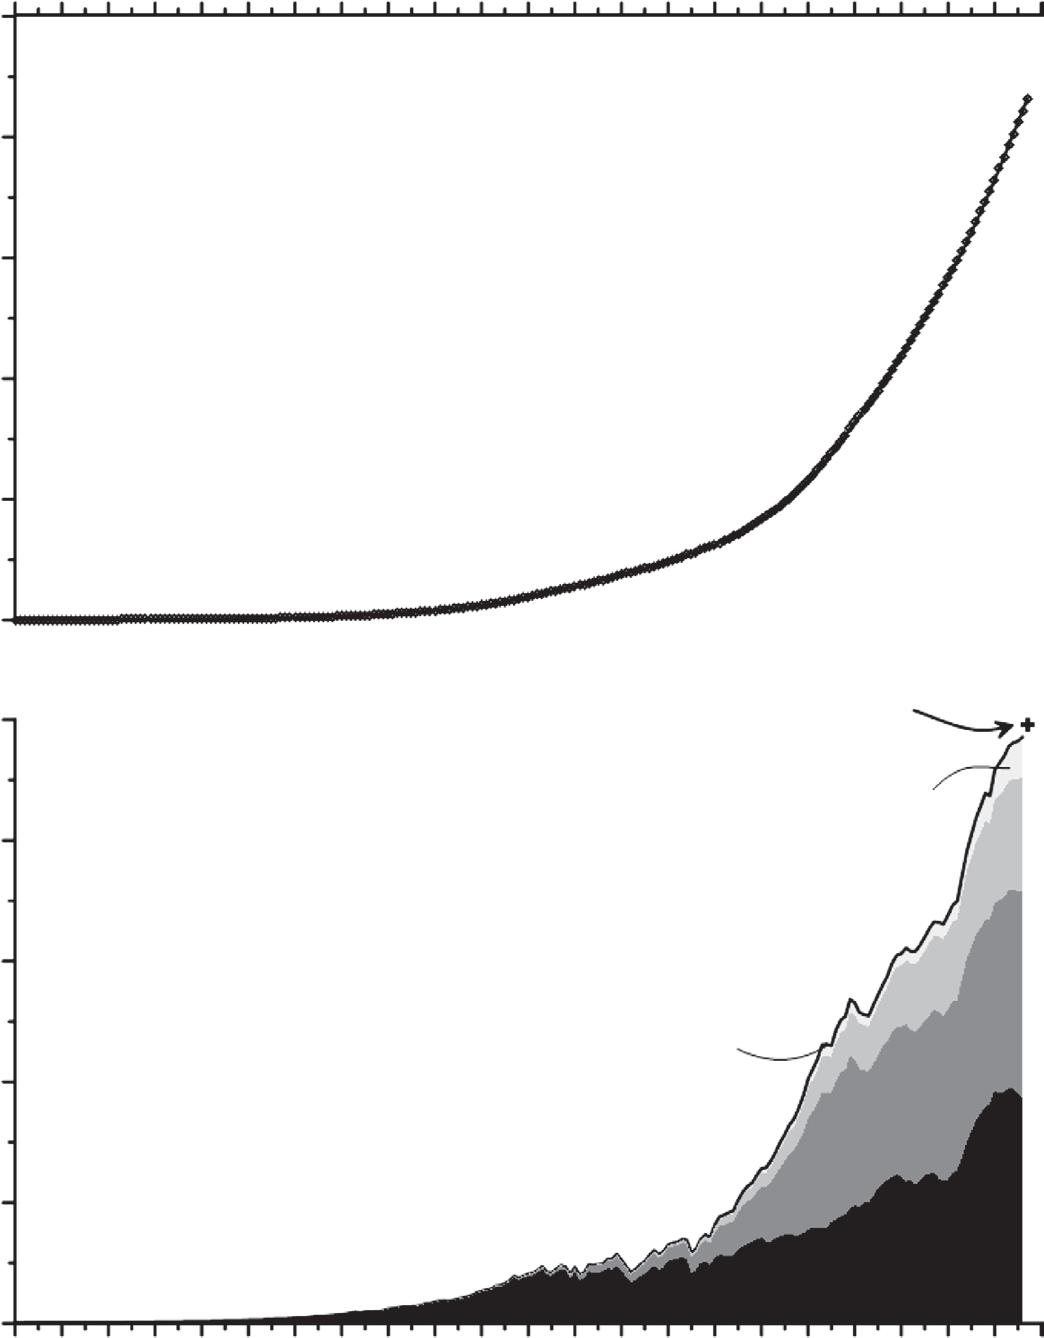
Figure 1.2. Carbon emissions due to human actions. Bottom: Annual carbon emissions from the dominant anthropogenic processes. iv,v Top: Cumulative carbon emissions; i.e., the sum total of all preceding years. GtC stands for gigatons of carbon, where a gigaton is one billion (one thousand million) metric tons. The breakdown for 2017 had not yet been released, but the overall total could be estimated from observations. To relate carbon emissions to CO2, use 1 GtC = 3.67 Gt of CO2, and note that accumulation of 2.12 GtC in the atmosphere gives a CO2 rise of 1 ppm. Thus, the top panel shows that we have by now
Figure 1.2. Continued
emitted some 430 GtC, or just under 2 times the amount of carbon that we’d calculate from the about 120 ppm rise in atmospheric CO2 levels (Figure 1). The rest has been mostly absorbed into the oceans (section 4.1).
iv. BP statistical review of world energy, June 2017. https://www.bp.com/content/dam/bp/ en/corporate/pdf/energy- economics/statistical-review-2017/bp-statistical-review- of-worldenergy-2017-full-report.pdf
v. Hansen, J., Kharecha, P., Sato, M., Masson-Delmotte, V., Ackerman, F., Beerling, D., Hearty, P.J., Hoegh-Guldberg, O., Hsu, S.-L., Parmesan, C., Rockstrom, J., Rohling, E.J., Sachs, J., Smith, P., Steffen, K., Van Susteren, L., von Schuckmann, K., and Zachos, J.C., Assessing “dangerous climate change”: Required reduction of carbon emissions to protect young people, future generations and nature. PLoS ONE, 8, e81648, doi:10.1371/journal.pone.0081648, 2013.
the deep ocean), which takes much more time than warming over land, as well as global continental ice-volume reduction and vegetation changes.
Like a heavy freight train that has slowly gained momentum, these slow processes will continue to unravel over timescales of centuries to millennia, causing total global warming to keep increasing over many centuries. For example, slowly increasing temperatures of the oceans—which cover about 70% of Earth’s surface—cause the global average temperature to creep up, while gradual reduction of ice volume slowly but surely makes the planet less reflective to incoming sunlight and thus causes further warming. Vegetation changes also affect the planet’s reflectivity, as well as impacting natural carbon exchanges with the atmosphere. And so on. What we see here is that the climate system is a complex beast, which includes the atmosphere, ocean, and biosphere, and all the interactions between them. Over still longer timescales, the climate system even has important interactions with ocean sediments, sedimentary rocks, and volcanic processes.
Because of the slow processes, any climate response measured by the year 2100 will be roughly doubled over subsequent centuries, even if there would be no further emissions.2 To keep longer-term warming below 2°C, we would therefore need to limit warming to a maximum of 1°C by 2100. Incidentally, we have crossed the 1°C value in 2015 already (relative to the pre-industrial value; Figure 1.1), and ongoing greenhouse gas emissions along with global reductions in particulate air pollution are likely to push
us through the 2°C threshold within a few decades.3 It appears that if we really want to achieve the agreed COP21 targets, carbon removal from the climate system will be essential. This might be done by means of natural processes, artificial (human-made) processes, or both.
This scenario illustrates how much of the climate debate can be summarized in one straightforward question: What governs natural climate cycles and what can nature do in the future, versus what is the human impact on climate and what can we do in the future?
This book explores the question from a perspective of research on past climates, or paleoclimate research. Paleoclimate research is essential for an understanding of what nature can do. In specific terms, we need paleoclimate research to see the longer-term consequences of CO2 levels of 400 ppm or more, given that one has to go back as much as 3 million years to find a previous period with such high CO2 levels. In addition, this research sheds light on the scale of today’s issues relative to changes that occurred before humans were around—in other words, it reveals the context of natural cycles that human impacts are superimposed upon. And finally, paleoclimate studies help us understand to what extent nature can or cannot help us with carbon removal, by revealing her various processes to do so and their timescales of operation. Thus, paleoclimate studies provide critical information about the size of the challenges facing us.
I have been working in paleoclimatology for about 30 years, and mine is a story that most of my colleagues will recognize. As soon as we mention that we work on climate change from a perspective of changes before humans entered the scene, we are subjected to a barrage of questions. More often than not, these interrogations seem targeted toward getting affirmation on three closely related issues. These are (1) that humans cannot possibly be changing the global climate; (2) that all that’s happening today is just part of a natural cycle; and (3) that even if we did have some influence, nature has gone through larger climate cycles and therefore will somehow “fix” the problem.
To me, these issues seem based on an assumption or hope that things will somehow sort themselves out. But it is hard to get specific answers about the basis for this assumption. There seems to be a lot of confusion in people’s minds about what processes are at play, how strong and fast they
are, how they work together, and how the human influence may scale relative to those processes.
The first source of confusion seems to be that the world is such a big place that people cannot imagine that humans could even pretend to influence it on a global scale. But this clearly is a mistake. With some reflection, most will recognize that we have a record of affecting several fundamental issues on a global scale. And for some of these, the realization that this was the case has led to successful action to reverse the damage. A good example concerns stratospheric ozone levels, which were being reduced due to release of refrigerants and gases used to pressurize sprays, increasing our exposure to ultraviolet rays and thus the risk of skin cancer. Once this was realized, remedial action was agreed upon on a global scale, and now the situation is improving. Another example is commercial whaling. Once it was realized that soon there would be not a whale left in the global ocean, broad international action was taken, and now whale numbers are slowly recovering. And then there is the case of lead pollution from additives in petrol and paint. Once that was recognized as a problem, alternatives were developed and lead pollution now is strongly reduced. If you think about it, then you will find more good examples, many with proof that collective international action can and will drive improvements. Why would climate be different?
A second cause of confusion seems to be that most people cannot see our human influence within the proper context of natural changes. They know almost intuitively that nature has—before humans—gone through much larger extremes than what we’re talking about for modern climate change, from ice ages to the warm and lush climates of the time of the dinosaurs. But taking the next step, developing a feel for the importance of our human influence in the context of these large natural changes, requires some study and some math.
Unfortunately, a lot of the key points to read up on are widely dispersed in the literature, although many good summaries can be found with some effort. Also—importantly—most people feel insufficiently qualified, or simply do not have the ambition, to do the math. A lot of this is because a myth seems to have developed that one needs sophisticated climate models, and to get everything exactly right, before an informed opinion can be reached. That is simply not true as long as the objective is to just get
a sound feel for our impact (it is true when targeting specific forecasts). The topic may be complex in detail, but the big lines are quite straightforward. Most of the sums needed for a decent impression are no more complicated than those needed to balance a household budget.
From experience at parties, meetings, flights, train rides, and interviews, I have learned that most people are quite comfortable with simple sums that illustrate the main thrust of the argument, along with the simplest of graphs and diagrams that I would usually draw on paper napkins and tablecloths (and once on a quality textile napkin). I have long considered setting these arguments out in a text that is accessible to all who are up for a little challenge. It would bring a range of aspects together in one coherent flow, with examples, and steer clear of details. This book is the result.
The general, overview-like approach that I take in this book conflicts a bit with my scientific background. Details, caveats, and uncertainties are essential fodder for students and specialists in the field. In consequence, we have grown used to sprinkling them throughout all of our communications. But in general life, they only cloud the message. Most of us sufficiently grasp the concept of powered flight that we can enjoy a plane voyage without understanding the avionics and aerodynamics involved, and we are happy to leave those to the pilots and engineers. In a similar way, everyone can reach a reasonable and well-informed personal opinion about the state of the climate from a straightforward presentation of the big lines.
The big lines refer to the context of real-life observations that directly illustrate the overall case and its broad implications. This is the level I seek here, avoiding the confusion of models and their different philosophies and assumptions, even though those are absolutely essential for technical arguments. As a result, this book leans heavily on observations from geological history, which most people can intuitively relate to. It underrepresents the depth of process understanding that has come from climate modelling because that level of detail is not needed here. This is purely a pragmatic choice—as they say: “horses for courses.”
The book aims to lead the reader through the entire journey: from first principles, through key processes and long-term observational context, to implications. There are many texts that cover one or more of these aspects,
but not many span the entire journey in a concise manner without too many caveats and details. And still the climate debate rages on—and the old arguments about natural variability keep cropping up.
So here’s my attempt to take you through the entire journey in straightforward terms, with minimal complications. I add diagrams that—similar to my arguments—deliberately focus only on the main points, keeping them in line with the diagrams I often draw on napkins to support my arguments. I support the text and diagrams with citations to the more scientific, complete information published elsewhere.
My aim is to empower you, the reader, for making your own informed decisions about whether we need to push for action on greenhouse gas emissions. I hope this book will provide the necessary background information, in simple terms and with examples, to convince you about that.
To me personally, it’s clear that we have arrived at a critical time for taking action toward transforming society—to break our carbon addiction. Future generations may still come to see us as polluting dinosaurs, but I hope it will be as the last lot of them, who finally realized what was coming and took action to avoid it. Let’s see if you agree with me at the end of the book or not. At least the arguments will be transparently laid out for all to see.
The key issue we’ll be addressing is the well-established rise of global temperatures by roughly 1°C since the start of the industrial revolution, more than 150 years ago, with most of the warming concentrated in the last six decades (Figure 1.1). Several independent monitorings of the global temperature change are in close agreement (see4 and note 3 of Figure 1.1), all showing almost year upon year of record-breaking heat in the last four years.5 The year 2016 comprehensively outclassed all previous years, with 2017 and 2015 hot on its heels (Figure 1.1). There is no denying that there is a strong warming trend, even though it may at times proceed in stops and starts because of fluctuations in the distribution of heat between atmosphere and ocean. Comparing this strong trend with CO2 changes over the same time interval (Figure 1.1), it is easy to jump to conclusions. But let’s avoid doing so: our purpose here is to develop an unbiased personal opinion. So we’ll look at the fundamental workings of the climate system and deduce what may be happening, why this may be the
case, what we might consider to do about it, and whether nature possesses any mechanisms that could help us with the solution.
Given that paleoclimate reconstructions are not something everyone encounters every day, I start with a chapter about the main techniques used in the discipline.
Next, we approach the issue of climate change from first principles, looking at Earth’s energy balance (how much energy comes in versus how much goes out), which ultimately decides the surface temperature of the planet.
This is followed by a look at the main drivers of change in Earth’s energy balance, from a natural perspective. We will see that greenhouse gases such as CO2 and methane (CH4) are unavoidably dominant in that discussion.
Then follows a discussion of why climate changes have occurred before human activity, how large these changes were, how fast the changes took place, and how the system recovered. This helps us understand how fast natural processes might “fix” any greenhouse gas and climate issues.
Next, we look at what we know about human influences. How do we know that today’s greenhouse gas increases are caused by us, as opposed to being part of a natural cycle? How much will they affect climate? How fast is the human influence relative to natural cycles? Can nature cope with the human impact? In short, given an improved understanding of natural cycles, the question targeted is: Does it seem likely that we’re just in a natural cycle, and that nature can somehow come to the rescue and reverse the problem?
At the end of every chapter will be a short section that recaps the key issues, as a basis for progression into the next chapter.
PAST CLIMATES
How We Get Our Data
On the work floor, research on past climates is known as paleoclimatology, and research on past oceans as paleoceanography. But they are very tightly related, and we shall discuss both combined under the one term of paleoclimatology. Within paleoclimatology, interests are spread over three fundamental fields.
The first field is concerned with dating ancient evidence and is referred to as chronological studies. These studies are essential because all records of past climate change need to be dated as accurately as possible to ensure that we know when the studied climate changes occurred, how fast they were, and whether changes seen in various components of the climate system happened at the same time or at different times.
The second field concerns observational studies, where the observations can be of different types. Some are direct measurements; for example, sunspot counts or temperature records. Some are historical, written accounts of anecdotal evidence, such as reports on the frequency of frozen rivers, floods, or droughts. Such records are very local and often subjective, so they are usually no good as primary evidence. But they can offer great support and validation to reconstructions from other tools.
Besides direct and anecdotal data, we encounter the dominant type of evidence used in the discipline. These are the so-called proxy data, or proxies. Proxies are indirect measures that approximate (hence the name proxy) changes in important climate-system variables, such as
temperature, CO2 concentrations, nutrient concentrations, and so on. This chapter outlines some of the most important proxies.
The third field in paleoclimatology concerns modeling. It employs numerical models for climate system simulation and simpler classes of socalled box-models. Numerical climate models range from Earth System models that are relatively crude and can therefore be set to run simulations of many thousands of years, to very complex and refined coupled models that are computationally very greedy and thus give simulations of great detail but only over short intervals of time. Box-models are much simpler and faster to run, and they are most used in modeling of the carbon cycle or other geochemical properties.
The different fields within paleoclimatology are complementary, and there is a lot of interaction: modeling results get grounded to real data, and interpretations of observations get checked with models for physical consistency. Often there are several such cycles involved from the first discovery of something to the presentation of more conclusive reconstructions. That way, the discipline gradually edges forward in its understanding. Through the last 50 to 60 years, the discipline has successfully identified the mechanisms behind the big lines of change in past climates. Work continues on improvements and refinements in detail.
The work is conducted according to an established tradition of formulation of initial hypotheses, followed by their critical testing and checking. The initial hypotheses are thus rejected or accepted. Then follow formulations of new hypotheses if the initial ones were rejected or the initial hypotheses get refined and updated. Then the cycle starts again. This is the normal process by which science advances in a careful, controlled, and self-critical manner.
In this book, I will not discuss modeling results very much. This should not be taken as an indication that modeling is not important. That conclusion would be a grave mistake. Modeling is essential for understanding how the system works, as models are physically and chemically consistent in a much more rigorous manner than interpretations of individual observational records. But models can also be very confusing to the nonspecialist because of the great variety of models that exists, all with different potentials and limitations. So I have chosen to make my case by using simple numbers only and referring to pertinent past (proxy)
observations that are well established. In reality, many of the concepts and interpretations that I will discuss have arisen from—and have been refined by—model-based research working alongside observation-based research. The way I choose to approach things is simply to keep it transparent and flowing easily. Any further reading will immediately need to delve into modeling studies. Also, my emphasis on observational evidence (data and proxy data) addresses the often-voiced remark of show me the data.
In this chapter, I give an overview of the main methods by which we obtain data about past oceans and climate. The listing is not exhaustive, as there are many more important methods, but the main approaches are presented. I bypass historical measurements and written (anecdotal) evidence of climate change. After all, it is pretty obvious to all how a long time-series of temperature measurements by the admiralty, or by a meteorological service, might have been obtained and how it could be used to say something about historical climate states. Instead, I focus on proxy records for longer timescales because they shape our understanding of past climates in prehistoric times.
The most natural subdivision of proxy records for past climate change is by location (a) from ice; (b) from land; and (c) from the sea. I add a special section for reconstructions of sea level and global ice volume, for two reasons. First because ice volume is such a critical measure of the climate state, and second because I like it so much. It’s what I work on every day.
2.1. DATA FROM ICE
The world’s large continental ice sheets in Greenland and West and East Antarctica have existed long enough to give relatively undisturbed records that span very long periods of time. Cores drilled from the Greenland ice sheet have given high-quality, continuous climate records that extend back in time from the present day to almost 125 thousand years ago. For West Antarctica, such records go back a bit less than that. For East Antarctica, the records reach back to about 800 thousand or even 1 million years ago (Figure 2.1).
It had been known for a very long time from holes dug in snow and ice that there is a distinct layering, which results from seasonal cycles of
snow accumulation. The weight of newly accumulating snow presses older layers into a much more compacted form, first called firn, and then ice. As pressure mounts deeper and deeper in the ice sheet, the annual layers are compressed thinner and thinner, until in the bottom portions the layers are too thin to be identified.
Where the layering can be recognized and counted in cores drilled through the entire thickness (several kilometers) of ice sheets, they give very accurate age scales to ice cores; a bit like counting tree-rings, but then counting downward from young to old. In the bottom portions of ice cores, where the annual layering cannot be recognized any longer, a different approach is needed. This is where ice modeling comes in. In the upper portions, ice models are tuned for the particular setting to the layering, and then they are applied further down to extend the age scale over the part where the layering is no longer recognizable. Dating of the lower portions as a result has larger uncertainties than dating in the interval where there is layering. There are many supporting techniques to this approach, such as the use of ash fragments captured in the ice from dated volcanic events, and the use of records of specific elemental isotopes that are formed by interaction of galactic rays with Earth’s upper atmosphere. More information about these technical methods is best obtained from the appropriate specialist literature.6
In firn and snow, there are air pockets that still exchange with the atmosphere. But upon compression to ice, the air pockets become isolated and can no longer exchange with the atmosphere. Within the ice, therefore, there are bubbles that contain preserved ancient atmosphere, like miniature time-capsules. These bubbles can be analyzed to give detailed data of past atmospheric composition changes, including past CO2 and CH 4 levels (Figure 2.1).7,8,9,10
Meanwhile, the ice itself can also be analyzed, and three of its properties have special importance. The first two are known as the oxygen isotope ratio and hydrogen isotope ratio of the frozen water molecules. Isotopes of any element are distinct in that they have the same number of protons in their core, but different numbers of neutrons. Molecules (such as H2O) made of different isotopes therefore have slightly different masses. Despite the tiny differences in mass, molecules with somewhat lighter isotopes are a bit more reactive than those with somewhat heavier